MR Imaging Artifacts Produced Dental Materials · Each specimen was analyzed for composition using...
4
J. Stephen Fache 1 Colin Price 2 E. Bruce Hawbolt 3 David K. B. Li 1 Received December 11, 1985; accepted after revision April 8, 1987. , Department of Radiology, Vancouver General Hospital, 855 w. 12th Ave., Vancouver, BC, Can- ada V5Z 1M9. Address reprint requests to J. S. Fache. 2 Department of Oral Medicine, University of Brit- ish Columbia, Vancouver, BC, Canada. 3 Department of Metallurgical Engineering, Uni- versity of British Columbia, Vancouver, BC, Can- ada. AJNR 8:837-840, September/October 1987 0195-6108/87/0805-0837 © American Society of Neuroradiology 837 MR Imaging Artifacts Produced by Dental Materials This report evaluates a variety of dental materials with respect to MR imaging artifacts and their mechanisms of production. A O.1S-T superconducting system and an MR phantom were used in assessing imaging artifacts. Several in-vivo studies were also carried out. The dental materials were analyzed for composition and magnetic perme- abilicy and the results were compared with the artifacts produced by each material. It was found that the higher the magnetic permeability the greater the artifact produced. Magnetic permeability of a material is generally not predictable on the basis of its composition, however. The increasing use of MR imaging as a clinical imaging method has necessitated the study of artifacts that may appear on these images. A wide variety of metallic materials is used in dentistry. Some can potentially cause distortion of images. New et al. [1] showed that dental amalgam and gold produced no discernible artifacts but that various stainless steel alloys caused major imaging artifacts. Berquist [2] examined the effects of various orthopediC devices. The purpose of this paper is to report an evaluation of a range of metallic dental materials with respect to their capacity to produce MR artifacts and to provide some explanation of the mechanisms of artifact production. Materials and Methods A wide variety of dental materials used in restorative, orthodontic, endodontic, and maxillofacial dental practice was assembled. The configuration of the specimens was repre- sentative of that used in patients. The specimens studied are listed in Table 1. A Picker MR system with a 0.15-T superconducting magnet, using 2DFT data reconstruc- tion technique, and single 10-mm thick slices was employed. Pulse sequences used were spin echo (SE), echo delay (TE) = 40 msec, repetition time (TR) = 200 msec and inversion recovery TE = 40 msec, TR = 600 msec, inversion time (TI) = 400 msec. Specimens were initially screened in a phantom using sonography transmission gel as the signal-producing medium. Any specimen found to produce distortion in this phantom was mounted in a high-resolution Picker MR phantom using manganese chloride solution as the signal-producing medium. Specimens that produced no distortion in the sonography transmission gel phantom were not subjected to further analysis or imaging. Three of the specimens (1 , 17, and 20) produced no distortion in the manganese chloride solution phantom although they appeared to have done so in the sonography gel phantom. In retrospect, the apparent distortion caused in the sonography gel was due to the marked "spillover" of distortion caused by an adjacent specimen. A scan through the phantom, without a specimen mounted, is shown in Figure 1. Specimens were mounted immediately adjacent to the line-pairs portion of this phantom. After testing with the specimen within the plane of section, the specimen was moved in 1-cm increments out of the plane of section to a maximum displacement of 10 cm . Distortion was graded on a scale from 0 to 3+. Each specimen was analyzed for composition using ZAP, a standard less x-ray microanal- ysis program (EG&G ORTEC, Oak Ridge, TN).
Transcript of MR Imaging Artifacts Produced Dental Materials · Each specimen was analyzed for composition using...
J. Stephen Fache1
Colin Price2
E. Bruce Hawbolt3
David K. B. Li1
Received December 11, 1985; accepted after revision April 8, 1987.
, Department of Radiology, Vancouver General Hospital, 855 w. 12th Ave., Vancouver, BC, Canada V5Z 1 M9. Address reprint requests to J. S. Fache.
2 Department of Oral Medicine, University of British Columbia, Vancouver, BC, Canada.
3 Department of Metallurgical Engineering, University of British Columbia, Vancouver, BC, Canada.
AJNR 8:837-840, September/October 1987 0195-6108/87/0805-0837 © American Society of Neuroradiology
837
MR Imaging Artifacts Produced by Dental Materials
This report evaluates a variety of dental materials with respect to MR imaging artifacts and their mechanisms of production. A O.1S-T superconducting system and an MR phantom were used in assessing imaging artifacts. Several in-vivo studies were also carried out. The dental materials were analyzed for composition and magnetic permeabilicy and the results were compared with the artifacts produced by each material.
It was found that the higher the magnetic permeability the greater the artifact produced. Magnetic permeability of a material is generally not predictable on the basis of its composition, however.
The increasing use of MR imaging as a clinical imaging method has necessitated the study of artifacts that may appear on these images. A wide variety of metallic materials is used in dentistry. Some can potentially cause distortion of images.
New et al. [1] showed that dental amalgam and gold produced no discernible artifacts but that various stainless steel alloys caused major imaging artifacts. Berquist [2] examined the effects of various orthopediC devices. The purpose of this paper is to report an evaluation of a range of metallic dental materials with respect to their capacity to produce MR artifacts and to provide some explanation of the mechanisms of artifact production.
Materials and Methods
A wide variety of dental materials used in restorative, orthodontic, endodontic, and maxillofacial dental practice was assembled. The configuration of the specimens was representative of that used in patients. The specimens studied are listed in Table 1.
A Picker MR system with a 0.15-T superconducting magnet, using 2DFT data reconstruction technique, and single 10-mm thick slices was employed. Pulse sequences used were spin echo (SE), echo delay (TE) = 40 msec, repetition time (TR) = 200 msec and inversion recovery TE = 40 msec, TR = 600 msec, inversion time (TI) = 400 msec.
Specimens were initially screened in a phantom using sonography transmission gel as the signal-producing medium. Any specimen found to produce distortion in this phantom was mounted in a high-resolution Picker MR phantom using manganese chloride solution as the signal-producing medium.
Specimens that produced no distortion in the sonography transmission gel phantom were not subjected to further analysis or imaging. Three of the specimens (1 , 17, and 20) produced no distortion in the manganese chloride solution phantom although they appeared to have done so in the sonography gel phantom. In retrospect, the apparent distortion caused in the sonography gel was due to the marked "spillover" of distortion caused by an adjacent specimen.
A scan through the phantom, without a specimen mounted, is shown in Figure 1. Specimens were mounted immediately adjacent to the line-pairs portion of this phantom. After testing with the specimen within the plane of section, the specimen was moved in 1-cm increments out of the plane of section to a maximum displacement of 10 cm. Distortion was graded on a scale from 0 to 3+.
Each specimen was analyzed for composition using ZAP, a standard less x-ray microanalysis program (EG&G ORTEC, Oak Ridge, TN).

838
TABLE 1: Materials Tested
Specimen No.
1 2 3 4 5 6 7 8 9
10 11 12 13 14 15 16 17 18 19
20 21
FACHE ET AL.
Description of Item
Stainless steel crown, 0.05 g Gold', 0.75 g Silver amalgam', 0.38 g Talladium', 0.25 g
AJNR:8, September/October 1987
Ultratec', 0.30 g } base metal alloys used in porcelain/metal com-Biobond' , 0.35 g binations Stainless steel para post, 1 mm x 20 mm pin TMS pin (gold-plated rod), 1 mm x 15 mm pin Stainless steel obturation screw, 1 mm x 13 mm Titanium screw' , 4 mm x 1.5 mm Root canal file tip, 0.3 mm x 21 mm Vitallium', 6 mm x 12 mm x 1 mm casting Rectangular arch wire, 36-mm length of wire Twistflex arch wire, 35-mm length of wire Electrode', 1 mm x 32 mm Vitinol arch wire', 36-mm length of wire Ligature wire, 40-mm length of wire Bracket, 14 x 10 x 1 mm casting used in orthodontic devices Hook and tube attachment, 4-mm length of 5-mm diameter tubing
used as an attachment point for orthodontic devices Band, 14-mm band, 4 mm wide, 0.5 mm thick Stainless steel magnetic keeper, 0.5 g, used as part of a denture
retaining system
• Produced no distortion in phantom using sonography transmission gel , and was not subjected to further imaging analysis.
A B
Fig. 1.-MR scan of phantom, no specimen Fig. 2.-MR scans of specimens 19 (A) and 21 (8) in phantom (centimeter scale on left side of mounted (centimeter scale on left side of image). image).
Each specimen 's response to a bar magnet was used to obtain a qualitative (0 to 3+) assessment of magnetic permeability. Quantitative assessment of magnetic permeability poses significant technical difficulties and is beyond the scope of this study.
Results
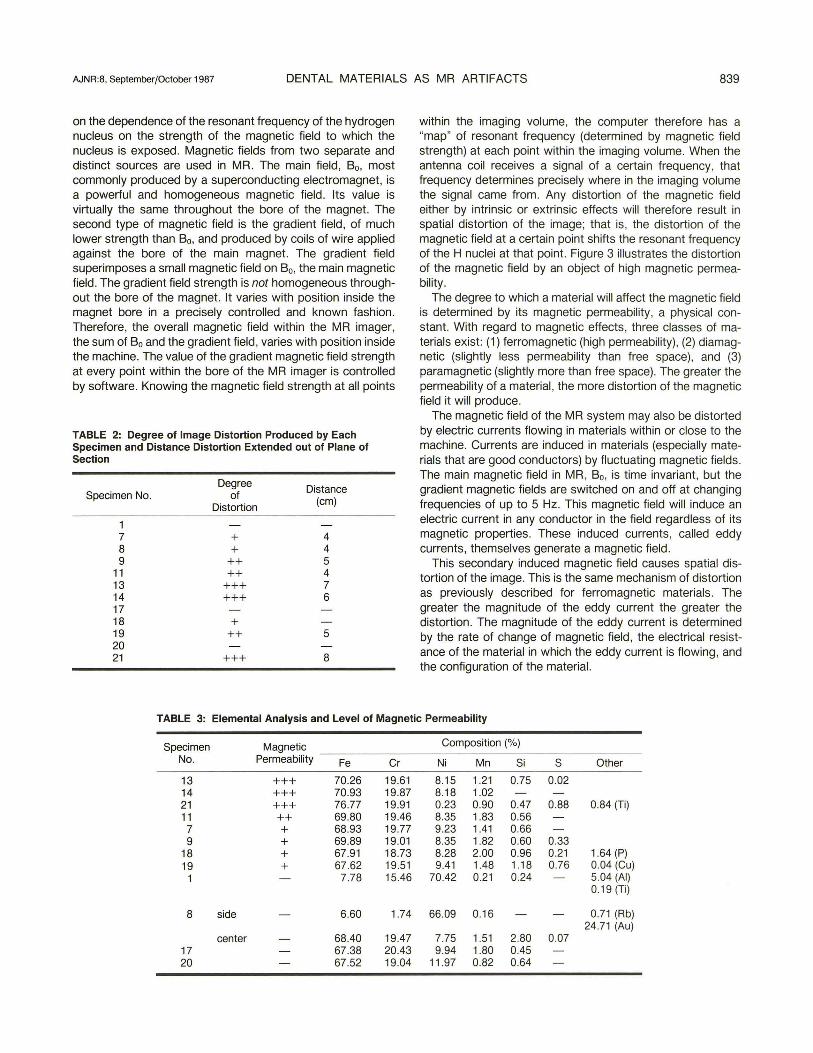
The degree of distortion and the distance out of the plane of section that distortion could be perceived are shown in Table 2. Examples of two of the specimens (19 and 21) scanned with the specimens in the plane of section are shown in Figure 2. Elemental analysis and level of magnetic permeability are shown in Table 3.
The data in Tables 2 and 3 show excellent correlation
between the degree of image distortion and the degree of magnetic permeability. Table 3 shows that specimens with sufficiently high nickel content (above approximately 10%) have very low magnetic permeability. This is consistent with the findings of New et al. [1]. The converse does not hold , however: specimens with low nickel content do not consistently show high magnetic permeability. Specimens 9, 11, 13, and 14, for example, are nearly identical in composition but vary widely in magnetic permeability.
Discussion
To better understand the possible mechanism of artifact production, some MR principles will be reviewed. MR is based
AJNR:8. September/October 1987 DENTAL MATERIALS AS MR ARTIFACTS 839
on the dependence of the resonant frequency of the hydrogen nucleus on the strength of the magnetic field to which the nucleus is exposed. Magnetic fields from two separate and distinct sources are used in MR. The main field, Bo, most commonly produced by a superconducting electromagnet, is a powerful and homogeneous magnetic field. Its value is virtually the same throughout the bore of the magnet. The second type of magnetic field is the gradient field, of much lower strength than Bo, and produced by coils of wire applied against the bore of the main magnet. The gradient field superimposes a small magnetic field on Bo, the main magnetic field . The gradient field strength is not homogeneous throughout the bore of the magnet. It varies with position inside the magnet bore in a precisely controlled and known fashion. Therefore, the overall magnetic field within the MR imager, the sum of Bo and the gradient field , varies with position inside the machine. The value of the gradient magnetic field strength at every point within the bore of the MR imager is controlled by software. Knowing the magnetic field strength at all points
TABLE 2: Degree of Image Distortion Produced by Each Specimen and Distance Distortion Extended out of Plane of Section
Degree Distance
Specimen No. of (cm)
Distortion
1 7 + 4 8 + 4 9 ++ 5
11 ++ 4 13 +++ 7 14 +++ 6 17 18 + 19 ++ 5 20 21 +++ 8
within the imaging volume, the computer therefore has a "map" of resonant frequency (determined by magnetic field strength) at each point within the imaging volume. When the antenna coil receives a signal of a certain frequency , that frequency determines precisely where in the imaging volume the signal came from. Any distortion of the magnetic field either by intrinsic or extrinsic effects will therefore result in spatial distortion of the image; that is, the distortion of the magnetic field at a certain point shifts the resonant frequency of the H nuclei at that point. Figure 3 illustrates the distortion of the magnetic field by an object of high magnetic permeability.
The degree to which a material will affect the magnetic field is determined by its magnetic permeability, a physical constant. With regard to magnetic effects, three classes of materials exist: (1) ferromagnetic (high permeability) , (2) diamagnetic (slightly less permeability than free space), and (3) paramagnetic (slightly more than free space). The greater the permeability of a material, the more distortion of the magnetic field it will produce.
The magnetic field of the MR system may also be distorted by electric currents flowing in materials within or close to the machine. Currents are induced in materials (especially materials that are good conductors) by fluctuating magnetic fields . The main magnetic field in MR, Bo, is time invariant, but the gradient magnetic fields are switched on and off at changing frequencies of up to 5 Hz. This magnetic field will induce an electric current in any conductor in the field regardless of its magnetic properties . These induced currents, called eddy currents, themselves generate a magnetic field .
This secondary induced magnetic field causes spatial distortion of the image. This is the same mechanism of distortion as previously described for ferromagnetic materials. The greater the magnitude of the eddy current the greater the distortion. The magnitude of the eddy current is determined by the rate of change of magnetic field, the electrical resistance of the material in which the eddy current is flowing, and the configuration of the material.
TABLE 3: Elemental Analysis and Level of Magnetic Permeability
Specimen Magnetic Composition (%)
No. Permeability Fe Cr Ni Mn Si S Other
13 +++ 70.26 19.61 8.15 1.21 0.75 0.02 14 +++ 70.93 19.87 8.18 1.02 21 +++ 76.77 19.91 0.23 0.90 0.47 0.88 0.84 (Ti) 11 ++ 69.80 19.46 8.35 1.83 0.56
7 + 68.93 19.77 9.23 1.41 0.66 9 + 69.89 19.01 8.35 1.82 0.60 0.33
18 + 67.91 18.73 8.28 2.00 0.96 0.21 1.64 (P) 19 + 67.62 19.51 9.41 1.48 1.18 0.76 0.04 (Cu)
1 7 .78 15.46 70.42 0.21 0.24 5.04 (AI) 0.19 (Ti)
8 side 6.60 1.74 66 .09 0.16 0.71 (Rb) 24 .71 (Au)
center 68.40 19.47 7.75 1.51 2.80 0.07 17 67 .38 20.43 9.94 1.80 0.45 20 67.52 19.04 11 .97 0.82 0.64

840 FACHE ET AL. AJNR:8, September/October 1987
Our results show a strong positive correlation between the magnetic permeability and the degree of image distortion. Although materials with sufficiently high nickel content (> 10%) show low magnetic permeability, those with lower nickel content show no correlation between composition and magnetic permeability . This lack of correlation is explained by the graph of magnetic permeability versus tensile strength for stainless steel alloys (Fig . 4). As tensile strength increases, so does magnetic permeability. The tensile strength depends on the crystalline structure of the metal. The magnetic permeability also depends on this crystalline structure. The tensile strength may be changed by "working" the material. The extent to which the metal has been formed, bent, twisted, or cut has a major effect on its crystalline structure and therefore on its magnetic permeability. In short, the past mechanical history of stainless steel alloys determines their effect on the images.
The effect of eddy currents on the image is not elucidated by this investigation. We speculated that dental gold might produce distortion because it would support large eddy currents caused by its high electrical conductivity. However, a piece of dental gold studied in vitro, and extensive gold restorations in the mouth of a volunteer imaged in our MR scanner revealed no distortion (gold is paramagnetic). However, no systematic investigation of the effects of electrical conductivity , sample configuration, or magnitude of changing magnetic field on image distortion was carried out.
• .001 T
• .002 T
• .003 T
• . 004 T
• .005 T
A • . 006 T
• . 001 T
• . 002 T
• .003 T
• . 004 T ----:tr)::. ~ _____ -- •..... .. '.1 _ ... ___ .... ~
0 0 : :::; ;.: . -
-------------- ---------------1 • • .005 T
• .006 T B
Fig. 3.-Distortion of magnetic lines of force by high-magnetic-permeability object (centimeter scale on left side of image).
V)
-0 2 V) ....
10
5
Q) o .5 o o N
.£ ....0 .1 o Q)
E ID .05
Cl...
u V)
c .... C
.01
.005 '-------:....-----------Tensile Strength (PS I x 1000)
Fig. 4.-Graph of tensile strength versus magnetic permeability. (Adapted from Post CB, Eberley WS. Stability of austenite in stainless steel. Copyright by Trans Am Soc Metals 1947.)
Conclusion
Dental materials cause MR artifacts varying from none to severe and far-ranging . Effects were limited to those materials having high magnetic permeability; that is, ferromagnetic materials. Predicting the effects of dental material on MR in individual patients is not possible, as magnetic permeability in many materials is a function of their mechanical history . The possible influence of eddy-current induction on the production of artifacts has not been explored in this study . However, since significant artifact production was limited to ferromagnetic materials , it is unlikely this mechanism is of importance. It may be that eddy-current influence on artifact production would have been demonstrated with pulse sequences other than those used in our study.
REFERENCES
1. New PFJ, Rosen BR, Brady T J, et al. Potential hazards and artifacts of ferromagnetic and nonferromagnetic surgical and dental materials and devices in nuclear magnetic resonance imaging. Radiology 1983;147: 139- 148
2. Berquist TH . Magnetic resonance imaging: preliminary experience in orthopedic radiology . Mag Res Imaging 1984;2:41-52


![INDEX [midlandhort.co.nz] · Abutilon White CR 2L 70 6.60 4.95 Agapanthus Orientalis 2L 20 6.60 4.95 Acaccia Melanoxylon CR 1.5L 6.60 4.95 Agapanthus Peter Pan 1.5L 6.60 4.95 Acacia](https://static.fdocuments.in/doc/165x107/5e498d6cd9bc84245a7aa0ad/index-abutilon-white-cr-2l-70-660-495-agapanthus-orientalis-2l-20-660-495.jpg)