Mr. George A. Allen - United States Environmental ...yosemite.epa.gov/sab/sabproduct.nsf... ·...
190
1UNITED STATES ENVIRONMENTAL PROTECTION AGENCY WASHINGTON D.C. 20460 OFFICE OF THE ADMINISTRATOR SCIENCE ADVISORY BOARD December 9, 2011 EPA-CASAC-12-002 The Honorable Lisa P. Jackson Administrator U.S. Environmental Protection Agency 1200 Pennsylvania Avenue, N.W. Washington, D.C. 20460 Subject: CASAC Review of the EPA’s Integrated Science Assessment for Lead (First External Review Draft – May 2011) Dear Administrator Jackson: The Clean Air Scientific Advisory Committee (CASAC) Lead Review Panel met on July 20 - 21, 2011, and September 15, 2011, to peer review the EPA’s Integrated Science Assessment for Lead (First External Review Draft – May 2011) , hereafter referred to as, ISA. The chartered CASAC approved this report during a public teleconference on November 28, 2011. The CASAC’s consensus responses to the agency’s charge questions and the individual review comments from the CASAC Lead Review Panel are enclosed. The CASAC’s key points are highlighted below. The CASAC commends the EPA for a well-written, comprehensive and well- organized document. However, the CASAC has specific comments and recommendations for improving the document. General Comments A summary chapter, such as Chapter 2, is very useful for readers, and should be located early in the ISA. The ISA should consistently contain summaries of the state of science as it stood prior to this
Transcript of Mr. George A. Allen - United States Environmental ...yosemite.epa.gov/sab/sabproduct.nsf... ·...

1UNITED STATES ENVIRONMENTAL PROTECTION AGENCYWASHINGTON D.C. 20460
OFFICE OF THE ADMINISTRATOR
SCIENCE ADVISORY BOARD
December 9, 2011
EPA-CASAC-12-002
The Honorable Lisa P. JacksonAdministratorU.S. Environmental Protection Agency1200 Pennsylvania Avenue, N.W.Washington, D.C. 20460
Subject: CASAC Review of the EPA’s Integrated Science Assessment for Lead (First External Review Draft – May 2011)
Dear Administrator Jackson:
The Clean Air Scientific Advisory Committee (CASAC) Lead Review Panel met on July 20 - 21, 2011, and September 15, 2011, to peer review the EPA’s Integrated Science Assessment for Lead (First External Review Draft – May 2011), hereafter referred to as, ISA. The chartered CASAC approved this report during a public teleconference on November 28, 2011. The CASAC’s consensus responses to the agency’s charge questions and the individual review comments from the CASAC Lead Review Panel are enclosed. The CASAC’s key points are highlighted below.
The CASAC commends the EPA for a well-written, comprehensive and well-organized document. However, the CASAC has specific comments and recommendations for improving the document.
General Comments
A summary chapter, such as Chapter 2, is very useful for readers, and should be located early in the ISA. The ISA should consistently contain summaries of the state of science as it stood prior to this review, critical evaluation of the literature since the last review, and conclusions regarding what has been learned since the last review. The framework for causal determination should be applied consistently and transparently. The document would benefit from discussion of the public health significance of observed lead (Pb) effects as well as a discussion of the distinction between public health consequences and clinically significant effects. In several places, terms need to be defined and applied consistently.
Study Selection
The criteria used to consider studies for review and analysis are reasonable. Studies of people who have blood lead (Pb) concentrations within one order of magnitude of the general U.S. population are appropriate given the focus on risks associated with environmental Pb exposure. With respect to

epidemiological studies, it appears that these criteria are consistently and appropriately applied. However, the ISA highlights many toxicological studies for which the Pb dose is far in excess of what might be relevant to environmental exposure to humans. The Health and Environmental Research Online (HERO) system is very useful and functions well as a means to retrieve studies that were cited in the document.
Integrative Health and Ecological Effects Overview
Overall, this chapter summarizes a substantial body of knowledge and the effort to integrate the ecological effects literature and human health effects literature is commendable. However, this important “overview” chapter should undergo substantial revision to address several shortcomings. With respect to human health endpoints, a rigorous weight-of-the-evidence assessment is needed that transparently applies the criteria for the strength of evidence for causation, set forth in section 1.6 and Table 1-2. This weight-of-the-evidence assessment should be applied to specific health endpoints, in addition to broadly assessing impacts on whole organ systems (e.g., “neurological effects”, “cardiovascular effects”, “renal effects” and other effects identified in Table 2-1). Further, the analysis in this chapter would benefit from a more careful interpretation of the use and validity of an adult’s contemporaneous blood Pb as a biomarker of Pb exposure. Key tables that summarize the effects of low level Pb exposure in children and adults, such as Table 2-2, 2-3, and 2-8, require substantial revision to reflect different levels of the strength of evidence for causal inference for specific health endpoints. Discussion of these tables also should reflect the components of past and current Pb exposure that influence the utility of blood Pb as a biomarker.
Ambient Lead
The chapter on ambient Pb provides a clearly written, detailed and comprehensive summary that focuses primarily and appropriately on new studies since the last NAAQS review. In some sections, the presentation of recent results is not adequately prefaced by a clear summary of the state of the scientific understanding prior to the current review cycle. Thus, it is difficult to infer how or if the new results add to, modify, or conflict with the previous state of the science in ways that are relevant to a potential revision to the Pb National Ambient Air Quality Standard (NAAQS).
During the previous (2008) Pb NAAQS review, the CASAC strongly recommended that the agency specify or develop a sampler for Pb compliance monitoring that is better than the currently deployed high-volume total suspended particulate (TSP) sampler. CASAC strongly reiterates this recommendation. The ISA should address the state of science with regard to monitoring technology and fixed site monitor siting criteria for representation of population exposures. Errors in existing measurements and implications for comparison of Pb in different particulate matter (PM) size fractions should be discussed.
These errors raise doubts about the accuracy of the reported comparisons of Pb in the different particle size fractions. The EPA should screen the particle size data for very low concentrations that may have poor precision and re-check the calculations. Several aspects of the reported Pb emissions inventory data need further review and interpretation. For example, the decision to exclude published information on several Pb emissions sources should be reconsidered, specifically regarding (1) the relative importance of resuspended Pb from soils near historical sources (including roadways) and (2) emissions from aviation gasoline combustion from airports versus from elevated flight paths. Further, the discussion of Pb emissions inventory data should document changes in emission inventory assumptions from the 2006
2

Air Quality Criteria Document (AQCD), as well as the temporal trends, precision and accuracy, and relevance to human exposure of the emissions inventory data. More information should be provided on the relationship between Pb in air (in various particle size ranges) and Pb in other environmental media. Transboundary transport and policy-relevant background should be discussed further.
Exposure, Toxicokinetics and Biomarkers
The selections of topics and material emphasized in the chapter on Pb exposure, toxicokinetics, and biomarkers are appropriate, but the document should provide additional comparison of the relative contributions of Pb in air versus contemporaneous exposures from other media. The state of science around exposure measurements and modeling, including multipathway exposure, should be discussed. Descriptions and scientific assessments of available exposure models are needed, as well as a description of empirical data available for evaluating the modeling efforts. The chapter should more clearly explain that a series of scenarios are developed to represent a range of plausible exposure conditions at a community level and that, collectively, the results provide perspective on how the distribution of blood Pb concentrations may vary among communities that share similar exposure profiles. This analysis will help to explain the relevance of various empirical data sets to the overall evaluation.
The kinetics and biomarkers sections are well written. Additional discussion is recommended regarding: biokinetic modeling assumptions and model validation by comparison to empirical biomarker data; and the definition, application, and limitations of biomarkers. A summary of precision, accuracy and variability in bone Pb measurements similar to that in the previous AQCD would be helpful. Sharper definitions of and distinctions between the terms “absorption,” “bioavailability,” and “bioaccessibility” are needed. Distinctions between biomarkers for Pb exposure, body burden, internal dose and risk should be discussed. The validation and application of these biomarkers also should be considered.
The inclusion of additional studies from which to estimate air Pb to blood Pb slope factors is a useful addition from the previous NAAQS, which relied on just one or two studies. More clarity is needed, however, regarding how the range of empirical data compares with environmental concentrations. The CASAC is unaware of any additional studies that could be added to the list.
Integrated Health Effects of Lead Exposure
In general, the discussion of the potential modes of action underlying the health effects of Pb exposure is thorough and inclusive of the current scientific literature. No known modes of action have been omitted. However, in some cases, studies are not presented in sufficient detail to support the presumed mechanism of action for reported effects and in some cases, the mode of action information might be considered misleading or over-interpreted.
The discussion of specific health endpoints in this chapter is sufficiently broad in scope and inclusion of additional health endpoints is not required. However, integration of associations within and across endpoints should be increased, especially with regard to mechanisms. The ISA offers a satisfactory discussion of the causal relationship between low blood Pb levels and decrements in IQ and adverse neurocognitive development in children. With respect to other endpoints in children and adults, a more rigorous and transparent weight-of-the-evidence analysis is recommended to establish the extent of any causal relationship. This analysis should devote more attention to the limitations of the existing studies
3

with respect to consistency, reproducibility, bias, control for potential confounders, and shortcomings in statistical methodology.
This chapter provides a comprehensive review of the human epidemiologic and toxicological evidence of the health effects of Pb and this approach provides useful support for integration across the two disciplines. Such integration is encouraged and should be expanded if possible. A number of specific modifications to the chapter and several ways to improve the application of causal determination criteria are recommended, as detailed in the consensus response (Enclosure A).
The issue of non-linearity of the dose-response for IQ was a critical issue in the previous NAAQS review. The additional evidence since 2006 is appropriately cited and provides further support for the non-linearity of the dose-response curve. These findings also are supported by an animal literature that dates back to the 1970s-80s, which should be discussed.
Susceptible Populations and Lifestages
For Pb, issues related to susceptibility across the life course are critical for public health protection. While the chapter covers relevant studies, the conceptual framework for interpreting them needs to be modified to more sharply address factors that may lead to increased risk and to increased exposure or dose. The ISA lays out an ambiguous set of terms and a conceptual model that does not adequately support interpretation of the literature. The CASAC had similar concerns with regard to the first draft ISA for ozone and voiced them in its letter to Administrator Jackson, dated August 10, 2011. Those comments are applicable to the lead ISA as well, and we recommend revisions that parallel those made in Chapter 8 of the second draft ISA for ozone.
As revisions are made, the CASAC also notes that there are many sections with only a few citations. The EPA should be very clear on the strength of evidence in the literature and cautious in inferring causality if the knowledge base is weak. The ISA would be strengthened by more discussion of nutritional aspects that serve to increase susceptibility, differences in effects by gender, gene-environmental interactions, and epigenetic implications. There are other factors that could be better described, such as age of housing stock, and percentage of homes with Pb-free windows and that have grass cover or bare soil in yards and playgrounds. Although early development is a vulnerable time period, research shows that Pb exposures during later periods in life also are associated with significant adverse effects.
Ecological Effects of Lead
The chapter on the ecological effects of Pb is well written, effectively organized, and adequately addresses “new” published data (post-2006). However, the chapter does not address pre-2006 information, making it difficult to understand the context and contribution of more recent data to the body of knowledge on Pb toxicity and how they may or may not inform a decision to revise the secondary NAAQS for Pb. There may be substantial additional toxicity data available from non-published sources, such as data generated for the European Registration, Evaluation, Authorisation and Restriction of Chemicals (REACH) regulations. The EPA should explore how the quality of the data was assessed and if acceptable, determine how easily these data could be incorporated into the ISA framework.
The importance of bioavailability and bioaccessibility in assessing the toxicity of Pb to environmental receptors should be stressed throughout the chapter. The aquatic and terrestrial Biotic Ligand Models
4

(BLMs) should be considered when evaluating possible environmental effects. Marine and freshwater toxicity data should be treated separately due to differences in Pb speciation and bioavailability and possible differences in the sensitivity of freshwater and marine organisms. The terms “bioconcentration factor” (BCF) and “bioaccumulation factor” (BAF) should be carefully defined and consistently applied. BCF and BAF are inappropriate measures to assess the hazard of Pb, and thus a better assessment of the utility (or lack thereof) of these values is needed. Causal conclusions are only weakly supported by limited exposure data and thus should be reevaluated. Additionally, since bioaccumulation is not a true “effect” and due to the occurrence of biodilution during trophic transfer, a causal determination for the bioaccumulation of Pb as it affects ecosystem services is not warranted at this time.
The CASAC appreciates the opportunity to provide advice on this issue and looks forward to receiving the agency’s response.
Sincerely,
/Signed/ /Signed/
Dr. H. Christopher Frey, Chair Dr. Jonathan M. Samet, Chair CASAC Lead Review Panel Clean Air Scientific Advisory Committee
Enclosures
5

NOTICE
This report has been written as part of the activities of the EPA's Clean Air Scientific Advisory Committee (CASAC), a federal advisory committee independently chartered to provide extramural scientific information and advice to the Administrator and other officials of the EPA. The CASAC provides balanced, expert assessment of scientific matters related to issues and problems facing the agency. This report has not been reviewed for approval by the agency and, hence, the contents of this report do not necessarily represent the views and policies of the EPA, nor of other agencies within the Executive Branch of the federal government. In addition, any mention of trade names or commercial products does not constitute a recommendation for use. The CASAC reports are posted on the EPA website at: http://www.epa.gov/casac.
i

U.S. Environmental Protection AgencyClean Air Scientific Advisory Committee
CASAC Lead Review Panel
CHAIRDr. H. Christopher Frey, Professor, Department of Civil, Construction and Environmental Engineering, College of Engineering, North Carolina State University, Raleigh, NC
MEMBERSMr. George A. Allen, Senior Scientist, Northeast States for Coordinated Air Use Management (NESCAUM), Boston, MA
Dr. Herbert Allen, Professor Emeritus, Department of Civil and Environmental Engineering, University of Delaware, Newark, DE
Dr. Richard Canfield*, Senior Research Associate, Division of Nutritional Sciences, Cornell University, Ithaca, NY
Dr. Deborah Cory-Slechta, Professor, Department of Environmental Medicine, School of Medicine and Dentistry, University of Rochester, Rochester, NY
Dr. Cliff Davidson, Professor, Civil and Environmental Engineering, Syracuse University, Syracuse, NY
Dr. Philip E. Goodrum, Senior Consultant, Cardno ENTRIX, Syracuse, NY
Dr. Sean Hays, President, Summit Toxicology, Allenspark, CO
Dr. Philip Hopke, Bayard D. Clarkson Distinguished Professor, Department of Chemical and Biomolecular Engineering, Clarkson University, Potsdam, NY
Dr. Chris Johnson, Professor, Department of Civil and Environmental Engineering , Syracuse University, Syracuse, NY
Dr. Susan Korrick, Assistant Professor of Medicine , Department of Medicine, Brigham and Women's Hospital, Channing Laboratory, Harvard Medical School, Boston, MA
Dr. Michael Kosnett, Associate Clinical Professor, Division of Clinical Pharmacology and Toxicology, Department of Medicine, University of Colorado Health Sciences Center, Denver, CO
ii

Dr. Roman Lanno, Associate Professor and Associate Chair, Department of Evolution, Ecology, and Organismal Biology, Ohio State University, Columbus, OH
Mr. Richard L. Poirot, Environmental Analyst, Air Pollution Control Division, Department of Environmental Conservation, Vermont Agency of Natural Resources, Waterbury, VT
Dr. Joel G. Pounds, Laboratory Fellow, Cell Biology & Biochemistry, Biological Sciences Division, Pacific Northwest National Laboratory, Richland, WA
Dr. Michael Rabinowitz, Geochemist, Marine Biological Laboratory, Newport, RI
Dr. William Stubblefield, Senior Research Professor, Department of Molecular and Environmental Toxicology, Oregon State University, Corvallis, OR
Dr. Ian von Lindern, President, TerraGraphics Environmental Engineering, Inc., Moscow, ID
Dr. Gail Wasserman, Professor of Clinical Psychology in Child Psychiatry, Division of Child and Adolescent Psychiatry, College of Physicians and Surgeons, Columbia University, New York, NY
Dr. Michael Weitzman, Professor, Pediatrics; Psychiatry, New York University School of Medicine, New York, NY
SCIENCE ADVISORY BOARD STAFFMr. Aaron Yeow, Designated Federal Officer, U.S. Environmental Protection Agency, Science Advisory Board (1400R), 1200 Pennsylvania Avenue, NW, Washington, DC, Phone: 202-564-2050, Fax: 202-565-2098, ([email protected])
*Did not participate in the review.
iii

U.S. Environmental Protection AgencyClean Air Scientific Advisory Committee (CASAC)
CHAIRDr. Jonathan M. Samet, Professor and Flora L. Thornton Chair, Department of Preventive Medicine, Keck School of Medicine, University of Southern California, Los Angeles, CA
MEMBERSMr. George A. Allen, Senior Scientist, Northeast States for Coordinated Air Use Management (NESCAUM), Boston, MA
Dr. Ana Diez-Roux, Professor of Epidemiology, School of Public Health, University of Michigan, Ann Arbor, MI
Dr. H. Christopher Frey, Professor, Department of Civil, Construction and Environmental Engineering, College of Engineering, North Carolina State University, Raleigh, NC
Dr. Armistead (Ted) Russell, Professor, Department of Civil and Environmental Engineering, Georgia Institute of Technology, Atlanta, GA
Dr. Helen Suh, Program Area Director, Environmental Health, Public Health Division, National Opinion Research Corporation (NORC) at the University of Chicago, West Newton, MA
Dr. Kathleen Weathers, Senior Scientist, Cary Institute of Ecosystem Studies, Millbrook, NY
SCIENCE ADVISORY BOARD STAFFDr. Holly Stallworth, Designated Federal Officer, U.S. Environmental Protection Agency, Science Advisory Board (1400R), 1200 Pennsylvania Avenue, NW, Washington, DC, Phone: 202-564-2073, Fax: 202-565-2098, ([email protected])
Mr. Aaron Yeow, Designated Federal Officer, U.S. Environmental Protection Agency, Science Advisory Board (1400R), 1200 Pennsylvania Avenue, NW, Washington, DC, Phone: 202-564-2050, Fax: 202-565-2098, ([email protected])
iv

v

Enclosure A
Consensus Responses to Charge Questions on EPA’s Integrated Science Assessment for Lead (First External Review Draft – May 2011)
1. The legislative history of Pb NAAQS reviews and the framework for causal determination and judging the overall weight of evidence is presented in Chapter 1. Selection criteria used to identify studies for inclusion in the ISA are also described in Chapter 1. Please comment on the consistency and appropriateness of the application of these criteria and the appropriateness of the decision to consider studies within approximately one order of magnitude of current exposure levels (e.g. was the determination of “informative” occupational studies and their subsequent inclusion in the document appropriate and consistently applied across endpoints?) Please comment on the application of the Health and Environmental Research Online (HERO) system to support a more transparent assessment process.
The discussion in Chapter 1 of the criteria used to consider studies for review and analysis in the ISA is reasonable. Studies of people who have blood lead (Pb) concentrations within one order of magnitude of the general U.S. population equates to cohorts with blood Pb concentrations approximately less than 40 µg/dL. This is appropriate for a document intended to focus on risks associated with environmental rather than occupational Pb exposure. With respect to human epidemiology studies, these criteria have been consistently and appropriately applied. However, the ISA highlights many toxicological studies in animals or in vitro systems in which the dose of Pb was far in excess of what might be relevant to low level environmental exposure to humans. The document should make clear that toxicological studies involving animals or in vitro systems are generally in one of three categories: exposures comparable to environmental exposures to humans and therefore of clear relevance, exposures far in excess of these exposures but relevant for various reasons that can be explained, and exposures far in excess of these exposures and not as relevant to establishing an ambient air quality standard. The Health and Environmental Research Online (HERO) system functions well as a means to retrieve studies that were cited in the document.
2. Chapter 2 presents the integrative summary and conclusions from the Pb ISA with a discussion of evidence presented in detail in subsequent chapters. Is this a useful and effective summary presentation? Is the framework for causal determination appropriately applied? Please comment on approaches that may improve the communication of key ISA findings to varied audiences. The health and ecological effects of Pb are mediated through multiple interconnected modes of action and there is substantial overlap between the ecological and health endpoints considered in the causal determinations. Since the mechanism of Pb toxicity is likely conserved from invertebrates to vertebrates to humans in some organ systems, the scientific evidence was integrated across the disciplines of health and ecology. Please comment on this approach e.g., is this a useful and effective integration of the scientific evidence?
Chapter 2 summarizes a huge body of knowledge, including a summary of the ecological effects literature and the human health effects literature. The chapter attempts to summarize which health and ecological effects are 1) caused by Pb; 2) likely causal; 3) suggestive of causal associations; or 4) inadequate to infer a causal relationship. However, in this chapter (and elsewhere), the document fails to consistently or adequately apply this causal framework, despite its critical importance to the ISA.
1

Specifically, the causal analysis is not applied systematically or in a transparent way. In assessing studies related to a particular human health outcome, a critical analysis of the strength of evidence is often not done in the more detailed chapters upon which this summary is based (e.g., Chapters 5 and 7). Limitations of the data concerning selected endpoints are inadequately characterized. As a consequence, the summaries in this chapter fail to capture important distinctions in the strength of evidence for a particular level of causal association. A critical analysis should review the number of studies available on a topic; the strengths and limitations of study design, data, and analyses; and the distinction between short-term and chronic Pb exposure effects. Such a review is necessary for a defensible causality determination. For example, the epidemiologic literature supporting a Pb-childhood IQ association is much more robust and consistent than studies of Pb and childhood attention deficit hyperactivity disorder (ADHD) or adult essential tremor (ET). Distinguishing among neurologic outcomes for which the literature supports a likely causal association from those less robustly associated with Pb needs to be part of any conclusion about Pb’s causal relationship with neurological health. Instead, the text addresses the weight of evidence for causation for “neurological effects” as a broad category; a similar approach is used for other health endpoints, e.g., “cardiovascular effects” or “reproductive effects”. Additionally, since bioaccumulation is not a true “effect”, and due to the occurrence of biodilution during trophic transfer, a causal determination for the bioaccumulation of Pb as it affects ecosystem services is not warranted (Chapter 7).
Per the above discussion, key tables such as 2-2 and 2-3 need major revision to reflect differences in the strength of evidence supporting a potential relationship of Pb with each specific outcome. Currently, these tables incorrectly imply equal levels of the strength of evidence for causality across outcomes. As above, e.g., the epidemiologic evidence associating low-level Pb exposure with childhood ADHD, adult ET, or even adult neurocognitive function is weaker than that associating low-level Pb exposure with reduction of childhood IQ. In many of the epidemiologic studies of the impact of Pb on adverse health effects in adults, the contemporaneous blood Pb concentration of study cohort members likely differed substantially from blood Pb concentrations earlier in life when average population blood Pb levels were higher. Thus, key tables (e.g., 2-2, 2-3, 2-8) that summarize the impact of current low level Pb exposure also need revision to recognize the role of likely higher past blood Pb concentrations (and cumulative Pb exposure) in determining the risk of current adult disease.
Several panel members also have specific concerns about the ISA’s analysis of a causal relationship of low level Pb exposure to specific health endpoints. These concerns are described in individual committee members’ detailed comments.
Recognizing that some practitioners and policymakers may focus on Chapter 2, rather than on the more substantive work on which it is based (e.g., Chapter 5), it is recommended that key features in Chapter 5 be presented, albeit summarily in Chapter 2. For example, Pb has been shown to impact growth in humans (as described in Chapter 5) but this important outcome is missing from Chapter 2. More care is needed to be certain that the content of this chapter is consistent with the remainder of the document that is summarized. For example, Chapter 5 discusses the likelihood that contemporaneous child blood Pb may be the most relevant to neurodevelopmental outcomes whereas, in Chapter 2, the text indicates that there is uncertainty regarding the most susceptible Pb exposure period in childhood. Such apparent contradictions within the document need to be reconciled.
2

In addition to a more critical assessment of the literature, an appraisal of the public health significance of observed Pb effects should be included in this chapter. Public health significance (i.e., for populations) should be distinguished from clinical significance (i.e., for individuals). The ISA should make clear that: (1) individual risks may vary from the point estimates of effect observed in population-based epidemiologic studies and (2) depending on the outcome, small effect sizes may have important impacts on health at the population level (see Bellinger D.C. Interpretation of small effect sizes in occupational and environmental neurotoxicology: individual versus population risk. Neurotoxicology 2007;28:245-251).
There is a lack of consistency in the amount of detail across all sections of the chapter, and in the citations of later chapters. Some sections have no citations to later chapters, while others, e.g., 2.8.4.1, include too many citations, making it difficult to read. Throughout Chapter 2 enough citations should be included to enable the reader to find the information in the later chapters, but not so many citations as to make the chapter difficult to read.
In Section 2.6.10, page 2-40, a cited study (Mahmoudi et al., 2007) involves laboratory observations of aquatic organisms exposed to sediments contaminated with varying amounts of Pb. The conclusions that are drawn cannot be extrapolated to the real-world environment, which includes many complexities absent from the lab experiments. This lack of generalizability should be pointed out in the chapter.
In general, where in vitro and in vivo study results are described, the exposure media need to be explicitly defined and, as much as possible, standardized exposure units should be used to facilitate comparison and interpretation of findings across studies and systems. For example, in Table 2-6, the discussion of endocrine disruption at 20 ppm Pb does not list the environmental medium in which Pb was measured. Furthermore, the CASAC suggests that equivalent mg/liter be included rather than merely listing the concentration in ppm.
There is only one sentence in the entire chapter mentioning the correlation between Pb in paint and Pb in blood, an important topic needing further development.
At the end of Section 2.1.2, the document states that there is a strong correlation between airborne Pb and zinc concentrations, and moderate correlations between concentrations of airborne Pb and bromine, copper, and potassium. Since 49% of total Pb emissions are from piston engine aircraft, which probably do not emit large amounts of copper, potassium, and zinc, the correlations are surprising and suggest that there may be data issues.
During the July 2011 meeting, the agency proposed combining part of Chapter 1 with Chapter 2, and the CASAC finds that change to be acceptable.
3. Chapter 3 provides a wide range of information to inform the exposure and health sections of the ISA. To what extent are the atmospheric science and air quality analyses presented in Chapter 3 clearly conveyed and appropriately characterized? Is the information provided regarding Pb source characteristics, fate and transport of Pb in the environment, Pb monitoring, and spatial and temporal patterns of Pb concentrations in air and non-air media accurate, complete, and relevant to the review of the Pb NAAQS? Does the ISA adequately characterize the available evidence on the relationship between ambient air Pb concentrations and concentrations of Pb in other environmental media?
3

Chapter 3 provides a clearly written, detailed and comprehensive summary focused primarily on new studies available since the last NAAQS review. In some sections, the presentation of recent results is not adequately prefaced by a clear summary of the state of the scientific understanding prior to the current review cycle, so it is difficult to see how or if the new results add to, modify, or conflict with the previous state of the science in ways which would result in revisions to the NAAQS.
For the most part, the information presented on these topics appears to be accurate, complete, and relevant. There was a detailed and informative discussion of the various existing, and in some cases developing, analytical methods employed for total Pb or Pb species. However, the summary of methods for collecting Pb in different particle sizes is much more limited. The substantial sampling biases with wind speed and direction for particles larger than 10 microns associated with the current high-volume total suspended particulates (TSP) sampler are noted, but no information is provided on currently available or developing methods that might reduce these sampling biases. There is also no information provided here or drawn from other chapters on what the ideal or acceptable particle size characteristics of a Pb Federal Reference Method (FRM) sampler should be. It is unclear whether the ratio of blood Pb to air Pb is likely to be the same for air Pb in particles greater 15 microns as for air Pb in particles less than 1 micron.
The accuracy of some of the particle size Pb comparisons summarized in section 3.5.3.1 and presented in more detail in Table 3A-13 of the Appendix needs further evaluation. There appears to be an implausibly-high frequency of sites with more Pb in smaller size ranges than in collocated samples with larger particle cut sizes. The EPA should screen the data for very low concentrations that may have poor precision and re-check the calculations. If these possibly incorrect particle size ratios persist, the CASAC recommends providing additional details on the filter blank, extraction and analytical methods employed, or other factors that may explain these results.
Several aspects of the reported Pb emissions inventory data require further evaluation, including revisiting the decision to exclude published information on the relative importance of resuspended Pb from soils near historical sources (including roadways), emissions from aviation gasoline combustion from airports vs. from elevated flight paths, and changes in emission inventory assumptions from the 2006 Air Quality Criteria Document (AQCD) to the current ISA – especially for aviation gasoline use.
Relatively little information is provided on the relationship between Pb in air (in various particle size ranges) and Pb in other environmental media. While a high proportion of the Pb content in soils, sediments and surface waters can be associated with historical emissions of Pb to the ambient air, there is very limited information available on the changes in these environmental concentrations that would be expected to result from changes in current air Pb concentrations.
It is unclear whether the ratio of Pb in surface waters to air Pb is likely to be the same for air Pb in particles greater than 15 microns as for air Pb in particles less than 1 micron.
4. Chapter 4 describes the multimedia nature of Pb exposure, toxicokinetics of Pb in humans, biomarkers of Pb exposure and body burden, as well as models of the relationship between Pb biomarkers and environmental Pb measurements.
4a. How well do the choice and emphasis of topics provide a useful context for the evaluation of human health effects of Pb in the ISA? Is the current organization of the chapter clear and logical? Are there
4
ways that information on exposure and toxicokinetics can be more clearly integrated throughout the chapter? Does the ISA adequately describe and balance air-related and non-air related pathways of Pb exposure?
The selection of topics and material emphasized in Chapter 4 are appropriate. The opening section provides a summary of the sources and exposure pathways, both directly and indirectly related to Pb in air. Important points that should be emphasized early in the discussion are that Pb is a multiple-media contaminant, and that blood and bone Pb levels are the biomarkers generally used to integrate exposure for risk assessment and management purposes. It should be pointed out that the relative significance of the source media has varied historically, site-specifically, and by the behavioral and socioeconomic status (SES) of the affected populations.
A historical perspective is needed to set the context. The air Pb discussion does an adequate job of describing the large decreases in exposure noted with the lead-in-gasoline phase down. It is also important to note that the air Pb reductions are associated with changes in point source emissions over the same time frame, particularly with respect to smelting, mineral processing and secondary recycling. The ambient air Pb decreases in the vicinity of these sources were significantly greater than those achieved in urban areas through the phase down.
It should be noted that these emission reductions resulted in significant decreases in Pb concentrations in other media. The document would benefit from a quantitative description of these historical decreases, as well. An introductory paragraph describing the range and central tendencies of media concentration for each of the three previous criteria documents could be provided for each media. It would also be important to note and provide comparative data regarding exposure reduction from Pb in non-air exposure media achieved in the same time frame. These include paint, solder, drinking water, food, and consumer items. This information would help provide perspective regarding the significance of uncertainties in the exposure assessment used in the current evaluation, particularly the extent to which blood Pb concentration can be related to average air Pb emissions.
This discussion should be followed with best estimates of contemporaneous concentrations in these media today, i.e. the new information. There seems to be little new data, at least in the peer-reviewed literature, and the document should indicate that the adequacy of the databases and studies available to characterize contemporaneous Pb exposure is extremely limited, relative to the new Pb NAAQS.
The document provides little contrast of the relative contribution of air Pb to contemporaneous exposures from other media. The lack of contemporaneous monitoring and surveillance data, suggests that such comparisons will, necessarily, be achieved by modeling. As such, the chapter would benefit from a description, and a scientific assessment, of the exposure models available and applied to undertake such analyses, and the empirical data available to inform or verify the modeling efforts. Specifically, it would be informative to include a brief description of the default assumptions regarding modeling assumptions that apply to the Integrated Exposure Uptake Biokinetic (IEUBK) model:
Multiple source analysis for estimating indoor dust Pb concentration (% contributions from various sources)
Contribution of soil Pb to indoor dust Pb (MSD) Contribution of outdoor airborne Pb to outdoor soil (indicate this is not part of the model) Contribution of outdoor airborne Pb to indoor dust Pb
5

Final breakdown of % contribution to average daily intake by exposure pathway
The chapter should more directly discuss the extent to which empirical data are (or are not) available to tailor these assumptions to evaluate specific scenarios.
There is a potential for confusion regarding the intended utility of the mechanistic models for evaluating risks at the national scale. The chapter should more clearly emphasize that a series of scenarios be developed to represent a range of plausible exposure conditions at a community level and that, collectively, this provides a perspective on how the distribution of blood Pb concentrations may vary among communities that share similar exposure profiles. This strategy contrasts with developing a single model run, for example, that represents all children in the United States. With this introduction, it will be easier to explain the relevance of various empirical data sets for the overall evaluation. For example, the air Pb to blood Pb relationships reported in the literature generally reflect studies in various communities. Rather than attempting to consolidate the results into a single summary statistic, the range of slope factors needs to be characterized and presented. Similarly, this explains why the summary statistics of blood Pb distributions reported by the National Health and Nutrition Examination Survey (NHANES) are not used to adjust or otherwise update the default geometric standard deviation (GSD) term in the IEUBK model.
The EPA’s Technical Review Workgroup has periodically updated estimates of average daily Pb uptake from food as data from the Food and Drug Administration’s (FDA’s) Total Diet Study become available. This time course of changes over time by age group would be informative to include in the chapter and the overall assessment.
4b. Biological markers of Pb exposure and body burden are discussed in Section 4.3. How well does this section reflect the current state of knowledge of Pb biomarkers and their interpretation as it relates to exposure and dose? Is the focus on blood Pb and bone Pb appropriate, given that the epidemiologic literature largely assesses exposure through these two biomarkers? Is there sufficient and accurate discussion of the relationship between blood Pb and bone Pb? Are relationships between blood Pb and Pb in soft tissues and urine Pb adequately described?
The biomarkers section is well written. The CASAC panel comments generally relate to topics that should be added or receive additional or clarifying discussions. Although there is little ‘new’ information on Pb biomarkers, the discussion of Pb biomarkers and the interplay between Pb in blood and bone, and the impact of a short duration or discontinuous exposure on the various dose metrics (concurrent, maximum, integrated, etc.) is helpful.
In general, figures showing the Pb in blood and bone profiles generated using the Leggett model were useful. The figures could be more useful to a broader audience if the discussion was extended to include the modeling assumptions, and to describe how the model predictions are validated by or compared to empirical biomarker data. In particular, it would be useful to help the reader understand the apparent differences in rate of blood Pb decline depicted in Figures 4-6, 4-8, and 4-10 vs. empirical data which sometimes show a slower rate of blood Pb decline. It could be helpful to match, or at least compare and contrast Pb exposure histories in the Leggett model simulations vs. data from comparable empirical studies. The narrative should note that other models, such as that of O’Flaherty et al. (1998), would often predict a slower decline in blood Pb concentration following cessation of exposure than several of the Leggett model simulations depicted in section 4.3. On page 4-48, line 9, the document states:
6

“Based on this hypothetical simulation, a blood Pb concentration measured 1 year following cessation of a period of increased Pb uptake would show little or no appreciable change from prior to the exposure event whereas, the body burden would remain elevated.” The discussion in this paragraph should be expanded to reflect the fact that in many exposure scenarios, the decline in blood Pb following cessation of exposure would proceed at a slower rate, requiring far longer than one year for blood Pb concentration to return to pre-exposure levels.
Many paragraphs in the biomarker section reviewing new literature would be improved by evaluative, judgmental conclusions in paragraphs, i.e. why is a reviewed paper important, what does it add to existing knowledge, etc.
Although it is not necessary to repeat detailed information on precision, accuracy, and variability in bone Pb reviewed in the 2006 AQCD, summarizing data here would be useful, particularly as these technologies can have relatively poor reproducibility especially in populations with lower bone Pb content or low bone density. (For example, Hoppin et al., Environ Health Perspect 2000;108:239-42; Hoppin et al., Environ Health Perspect 1995;103:78-83). An important consequence (not mentioned here) of expressing bone Pb measures relative to bone mineral content is that lower bone mineral density is associated with greater measurement uncertainty in bone Pb. This density dependent uncertainty can have important implications for studies in older women for whom low bone mineral density is more common than in other populations including men and younger adults.
The working definitions of absorption and bioavailability do not make the terms very distinct. Absorption refers to the fraction of Pb absorbed from respiratory or gastrointestinal tract while bioavailability refers to the amount of Pb ingested or inhaled that enters systemic circulation. Is it the units (fraction vs. amount) or the specificity of absorption into ‘systemic circulation’ that distinguishes the two terms? This ambiguity is furthered by the apparent interchangeable (or incorrect by these definitions) use of the absorption and bioavailability. Most of these inconsistent uses probably result from carry-over usage from the original paper. These definitions should be revisited and the entire ISA document be reviewed for use consistent with the clarified definitions.
The section on the definition, application, and limitations of biomarkers should be expanded (and carried into section 4.7.3). The section introduction would be well served by defining the distinction between, validation and application of, biomarkers for Pb exposure, body burden, internal dose, and risk. The ISA recognizes that the Pb biomarkers are not equally valid when applied to different exposure scenarios but does not consistently apply this principle in assessing the epidemiologic literature. E.g., blood Pb in older adults reflects not only current but likely past exposure and this is not clear in the ISA. Similarly, where bone Pb appears to be a stronger predictor of outcome than blood Pb (see blood pressure literature), acknowledgement that this difference in biomarker sensitivity may reflect differences in chronic vs. short-term Pb exposure effects is not consistently done.
Pb biomarkers are not equally valid when applied to different exposure scenarios, so it is important, when using and interpreting biomarkers, to clearly describe the exposure scenarios and their limitations. The Chapter 4 text contains cogent, but scattered discussions (including figures) illustrating this point. Because blood and bone Pb levels are used for risk assessment and management, this discussion is important enough to bring up to section 4.0 or at least 4.3 and the summary.
7

The sections on kinetics and Pb biomarkers should recognize that adolescents are poorly defined by all existing physiologically based pharmacokinetic (PBPK) and biokinetic models. Individuals undergo rapid changes in sexual development, growth, food and water intake, bone growth and turnover, behavior, etc. during adolescence. There is a paucity of experimental measurements of Pb biomarkers during this time developmental window. The individual biological and kinetic parameters for adolescents are largely interpolated rather than based on solid experimental and toxicological measurements. These deficiencies limit the validity of model predictions in this age group.
The relationship between air Pb and blood Pb is not completely described. The literature review is good, but not complete and generalizations (conclusions) are not clearly made and on a firm basis. Respiratory tract deposition and clearance are reported in the context of a specific study, but the ISA does not give a sense of the breadth of the issue or the scientific context for this information. Perhaps a table abstracted from Chapter 3 that summarizes relationships between PM size, Pb content, blood Pb, etc. would be helpful.
4c. Section 4.5.1 discusses empirical models of air Pb-blood Pb relationships from new and old studies. This was an important policy issue in the last Pb NAAQS review. Does this section accurately reflect what is known about air Pb-blood Pb relationships? Are there particular studies that should receive less or greater emphasis?
The inclusion of additional studies from which to estimate air Pb to blood Pb slope factors is a positive advancement from the previous NAAQS, which relied on just one or two studies. The CASAC is unaware of any additional studies that could be added to the list. The ISA should critically discuss and evaluate the finding in several studies that the slope between air Pb and blood Pb changes (typically increases) at low air Pb values. The narrative should consider offering a science-based judgment regarding which relationship(s) are optimal for quantitative risk assessment.
Useful summary information is presented regarding the empirical data available to estimate the blood Pb to air Pb slopes. Table 4-11 should include additional information: 1) parameters of the models; 2) air Pb intervals used to calculate each slope; 3) description of the study conditions such as ambient urban, adjacent to smelter, and phase-out of Pb; and 4) type of air sampling and PM cut points.
The text that references the table should highlight the subset of studies that are particularly useful for the NAAQS evaluation and explain why they are useful. This approach would adhere to the goal of critically evaluating the literature and selecting key studies, rather than simply compiling study results.
An error was identified in the presentation of the Brunekreef (1984) study – the lower bound on the air Pb interval should be changed from 0.15 to 0.50 µg/m3.
The EPA appropriately emphasizes that the slope factors vary, in part, due to the form of the equation. For example, the log-log equations yield higher slope factors at lower air Pb concentrations. Given this observation, it is even more important that readers can easily see how the range of empirical data may compare with alternative NAAQS standards. A figure can be generated that presents results from each study on one chart (as a separate series), showing how the calculated slopes vary as a function of discrete intervals of air Pb concentrations. This will help the reviewer understand which slopes are valid in the air concentration of interest (e.g., 0.1 – 2 µg/m3).
8

Figures should also be generated to illustrate the potential change (reduction) in blood Pb concentrations in relationship to scenarios of reducing the current NAAQS. Examples can be found in individual comments from Dr. Goodrum.
5. Chapter 5 presents assessments of the health effects of Pb, with evidence organized by health effect category, endpoint and scientific discipline.
5a. To what extent are the discussion and integration of the potential modes of action underlying the health effects of Pb exposure presented accurately and in sufficient detail? Are there additional modes of action that should be included in order to characterize fully the underlying mechanisms of Pb?
In general, discussions of the potential modes of action underlying the health effects of Pb exposure are thorough and inclusive of the current scientific literature. The document has done a very good job of attempting to, in some respects, prioritize the mechanisms in an integrative fashion so as to explain their potential relationships to observed health effects. The inclusion of prior data from past Pb reviews in this particular section is appropriate as it is important to the full presentation of known mechanisms. No known modes of action have been left out.
The CASAC notes, however, that in some cases, studies are not presented in sufficient detail to conclude that the presumed mechanism of action is the basis for reported effects. In the case of studies of antioxidant treatments, for example, experimental designs are not adequately outlined. Thus, it could be possible that providing an antioxidant contiguously with Pb exposure in an animal model results in a decrease in Pb uptake from the gastrointestinal (GI) tract or enhanced excretion or some other toxicokinetic change that therefore results in a lower “effective” dose of Pb and lower risk for the health effect. Such a scenario would not be consistent with an “antioxidant” mechanism but rather a toxicokinetic amelioration of Pb effect.
Some information with respect to the mode of action might be considered misleading or overly-interpreted. For example, Table 5-2 presents all endpoints and modes of action and the lowest level at which the MOA is observed, suggesting that cancer, e.g., is an equally potent endpoint for Pb as is neurological effects, which does not seem consistent with the collective evidence.
5b. Does the ISA adequately describe the evidence with regard to the range of exposure concentrations (and/or blood or bone levels) associated with the identified endpoints? What are the views of the panel regarding the clarity and effectiveness of figures and tables in conveying information about the consistency of evidence for a given health endpoint, lifestage of exposure, or biomarker of exposure (e.g., blood versus bone Pb levels)?
The extent to which the ISA satisfactorily characterizes the magnitude of Pb exposure that bears a causal relationship to various human health endpoints varies according to the health endpoint.
The ISA offers a satisfactory discussion of recent findings that address and support a conclusion that Pb exposure associated with blood Pb concentrations less than 5 µg/dL is causally associated with decrements in IQ and adverse neurocognitive development in children. With respect to other endpoints in children, such as attention deficit hyperactivity disorder (ADHD), a more rigorous and transparent “weight of the evidence” analysis is recommended to establish the extent of any causal relationship. This
9

analysis should devote more attention to the limitations of the existing studies with respect to consistency, reproducibility, bias, control for confounders, and shortcomings in statistical methodology.
With respect to health endpoints in adults, there is uncertainty regarding the extent to which blood Pb concentrations ≤ 5 µg/dL bear a causal relationship to any health endpoints, particularly because the adult populations in which such associations were noted sustained considerably higher blood Pb concentrations in the past. In several of the study cohorts finding a relationship between Pb exposure and blood pressure elevation or hypertension, bone Pb concentration was usually a stronger predictor than blood Pb concentration, consistent with the importance of the subject’s cumulative Pb exposure, rather than their current low level exposure, for any causal relationship. The subjects in these cohorts may have been experienced unique developmental effects of Pb at exposure levels higher than indicated by contemporary adult blood Pb values. In addition to the ubiquitous concern regarding the influence of higher blood Pb concentrations experienced earlier in life, other limitations apply to causal assessments made for other health endpoints in adults. In the case of renal effects, causal inferences are limited by the potential for reverse causation, inconsistency in the epidemiological observations, and the absence of a demonstrable nephrotoxic mode of action at a blood Pb concentrations ≤ 5 µg/dL. For immune effects in both adults and children, the discussion should devote greater attention to the paucity of and the biostatistical shortcomings of the epidemiological studies that have reported effects of Pb at low dose. For every health endpoint, animal models that establish an adverse effect of Pb where the blood Pb concentration in utero or postnatal never exceeded 5 µg/dL are virtually nonexistent, and statements to the contrary in the narrative merit careful review and reappraisal. A detailed “weight of the evidence” analysis, including critical appraisal of the strengths and limitations of the supporting studies, is recommended in order to establish the strength of evidence for a causal relationship at specific levels of adult Pb exposure.
The many tables in Chapter 5 that summarize the design and outcomes of epidemiological and toxicological studies could be expanded to include a column that allows the inclusion of short comments on a study’s notable strengths and weaknesses. In certain tables and figures, the practice of relying on extrapolation to characterize a dose-response relationship at a low blood Pb concentration (e.g., renal effects at a blood Pb concentration of 1 µg/dL in Figure 5-43) should be used sparingly, if at all, particularly when none of the studies included significant numbers of subjects with such a low blood Pb concentration, or when the validity of such extrapolation may be subject to considerable uncertainty. It would be helpful for summary figures such as Figure 5-29 to include study citations, and to distinguish among the endpoints with respect to the strength of the evidence. In like manner, summary tables such as Tables 2-2 and 2-3 should be substantially revised to distinguish among specific health endpoints for which a causal effect of Pb at a particular dose is established, versus those for which a causal relationship (in the terminology of Table 1-2) may be only “likely” or “suggestive”.
Several sections of the narrative would benefit from an expanded discussion of the significance of the observed effect sizes. Some guidance to the reader in appraising the public health significance of observed Pb effects should be included here. Public health significance (i.e., for populations) should be distinguished from clinical significance (i.e., for individuals). The ISA should make clear that: (1) individual risks may vary from the point estimates of effect observed in population-based epidemiologic studies and (2) depending on the outcome, small effect sizes may have important impacts on health at the population level (see Bellinger DC, Interpretation of small effect sizes in occupational and environmental neurotoxicology: individual versus population risk. Neurotoxicology 2007; 28:245-251 and Kraemer HC, Epidemiological methods: about time. Int J Environ Res Public Health 2010;
10

7:29-45).
5c. Should discussion of specific endpoints be expanded to provide a more comprehensive assessment of health effects associated with current Pb exposures in the U.S. population overall or in susceptible groups?
The discussion of specific health endpoints in chapter 5 is sufficiently broad in scope, and inclusion of additional health endpoints is not required. Rather than any expansion of the proposed endpoints, integration of associations within and across endpoints might be enhanced, especially with respect to mechanisms. Many neurodevelopmental outcomes are not independent, but rather bear expectable associations to each other; disturbances in one system might have downstream consequences for functioning in another system. Explicating these connections would be useful. The review presents evidence for differences in behavioral outcomes in different age groups upon exposure (so that symptoms of disruptive behavior are found in children, while symptoms of depression are found in adults); since these reflect quite different features of psychopathology, some discussion of those differences, and the implications of detection differential associations should be explicated.
5d. What are the views of the panel on the integration of epidemiologic and toxicological evidence, in particular, on the balance of emphasis placed on each discipline and the accuracy with which the evidence is presented? Considering the Pb exposure concentrations and durations in toxicological studies and the potential for confounding in epidemiological studies, please comment on the conclusions drawn about the coherence of the evidence and biological plausibility.
Chapter 5 provides a comprehensive review of the human epidemiologic and toxicological evidence on the health effects of Pb. The chapter is organized by health effects with results from human and related toxicological (both in vitro and in vivo) studies presented in tandem for each outcome. Overall, the approach works for integration across the two disciplines. However, the CASAC recommends a number of modifications to the chapter and identifies several ways to improve the application of causal determination criteria to the chapter’s conclusions:
1) An introductory section should be included that reviews homologies between animal and human assessments.
2) Where possible, to improve organization of the toxicological data presentation, specific outcome measures within a given health effect should be organized into broad conceptual groups (e.g., learning, attention, hearing) to maximize comparability between measures from human and animal studies. For example, studies of learning in animals (the Morris water maze, among others) should be described in parallel to findings from learning and memory tests in humans. Studies of animal attention or impulse control can be described in parallel to tests of the analogous behaviors in humans, e.g., studies of ADHD or CPT.
3) For each health measure, there should be a critical discussion of the strengths and limitations of the available literature. Those studies with more robust designs and methods should be explicitly acknowledged and contribute greater weight to inferences and conclusions. In addition, a column of study limitations (and strengths) should be added to the tables summarizing findings from the literature reviewed. The summarized information should also note negative findings (e.g. the notable absence of a predictive effect of blood Pb in studies that reveal a predictive effect of
11

bone Pb). The chapter would benefit from a more rigorous presentation of a weight of the evidence analysis for each health measure.
4) As an extension of item #3, the application of the causal determination criteria often lacks transparency, and would benefit by a more specific and structured approach. For example, within a given category of health outcome such as “neurological effects”, the analysis should better differentiate the weight of evidence as it applies to divergent outcomes (e.g., childhood IQ, ADHD, adult ET) for which the strength of findings for low-level Pb associations is highly variable.
5) Animal studies with exposures most relevant to human health effects should be emphasized. This means focusing on doses relevant to low level human exposure, critical consideration of exposure route (e.g., oral, intravenous, and intraperitoneal) and Pb form (Pb acetate, Pb chromate, etc.), and the relevance of temporal patterns of exposure to health effects with long latencies. For example, direct injection of Pb into the hippocampus may not be informative for human neurobehavioral effects, exposing animals to Pb-chromate has limited utility in assessing Pb’s potential carcinogenicity, and short-term exposure and outcome measures are unlikely to be applicable to Pb-associated hypertension or renal disease in human populations.
6) As an extension of item #5, the Chapter includes toxicological data that, in a number of cases, involve Pb exposures substantially higher (e.g., an order of magnitude or greater) than would be characteristic of U.S. non-occupationally exposed populations and thus findings from these studies are of uncertain relevance to an assessment of low-level Pb effects in people. In many of the epidemiologic studies of adults’ adverse health effects, the contemporaneous blood Pb concentration of participants likely differed substantially from blood Pb concentrations earlier in life when average population blood Pb levels were higher. Tables (e.g., 2-2, 2-3, 2-8) that summarize the impact of current low level Pb exposure need revision to reflect likely higher past blood Pb concentrations (and cumulative exposure) in determining the risk of current adult disease.
7) Similarly, providing some context relating in vitro exposure levels to low-level human exposures would be helpful. In general, in describing in vitro and in vivo study results exposure media need to be explicitly defined and, as much as possible, standardized exposure units should be used to facilitate comparison and interpretation of findings across studies and systems.
8) In seeking coherence between plausible modes of action and many of the chronic human health outcomes discerned in epidemiological studies, such as hypertension, renal insufficiency, and possible neurodegenerative changes in adults, the narrative should highlight evidence for modes of action that are consistent with the insidious and latent development of these endpoints. Such modes of action may include, but not be limited to, epigenetic impacts on gene expression, remodeling of tissue structure or responsiveness (e.g. in brain, kidney or vascular endothelium), and genotoxic and nongenotoxic effects of chronic oxidative stress.
9) Effect modification should be consistently addressed (including potential sexual dimorphisms in Pb toxicokinetics or effects), particularly as, dependent on the context, it can result in Pb effects at lower levels than occur in the absence of the modifier. The magnitude of the interaction should be explicitly described as part of assessing its biological relevance.
12

10) If studies are restricted to males (e.g., the Normative Aging Study (NAS) and a large proportion of animal models), potential limited generalizability to females should be acknowledged.
11) For a number of health measures the conclusions regarding health effects of low-level Pb exposures are not well justified by careful consideration of the literature reviewed, e.g., lack of robust justification of conclusions was particularly notable for the review of immunologic effects of Pb. Failure to temper conclusions with study design limitations was particularly problematic for the review of the renal effects of Pb.
13

12) Examples of specific issues that undermine the robustness of some conclusions include:
(a) a failure to accurately assign Pb exposures, including assigning a lower level Pb exposure than comprehensive consideration of the experimental design or the population's characteristics justified;
(b) a failure to acknowledge limitations to findings that were, e.g., only evident in a subset of the study population (e.g., subsetting by phenotype or hormone use status) or only evident in conjunction with other risk factors (e.g., low-level Pb effects only seen in conjunction with relatively high level manganese exposure);
(c) a failure to temper the strength of observed associations in studies for which control for potential confounding was not well addressed (as was often the case for occupational cohort studies);
(d) a failure to explain limitations regarding the implications of observed associations in epidemiologic studies where direct biomarkers of exposure were not used (e.g., in a number of occupational studies);
(e) particularly in studies of chronic disease risk in adults (e.g., cardiovascular disease), the chapter does not consistently or carefully acknowledge the likely importance of historical (and relatively high) long-term, chronic Pb exposure in determining both current blood Pb levels and serving as a surrogate for past levels in estimates of associations of current levels with health outcomes.
13) The review of the literature regarding Pb and childhood IQ was, with few exceptions, robust and appropriate conclusions were drawn.
14) There were a number of areas of inconsistencies between Chapter 5 and conclusions described in Chapter 2 that need to be reconciled.
15) The term “neurological” should be consistently changed to the term “neurodevelopmental” throughout the document.
(Please see attached individual comments from the panel members regarding specific examples of the above issues, including, extensive detailed comments from Dr. Michael Kosnett).
5e. The 2006 AQCD described a nonlinear dose-response relationship between blood Pb levels and cognitive function in children. The ISA presents evidence from epidemiologic and toxicological studies to further evaluate potential explanations for the nonlinear shape (e.g., differential proportions of susceptible populations in different segments of the blood Pb level distribution, differential activation of mechanisms). Please comment on the extent to which the expanded discussion is informative and consistent with the available evidence.
The issue of non-linearity of the dose-response for IQ was clearly a critical issue in the previous NAAQS deliberations. Additional evidence supportive of the dose-response observed in the Lanphear et al., 2005 meta-analysis has been reported since 2006, as appropriately cited here, providing further support for the non-linearity of the dose-response curve defining the association between blood Pb and IQ, specifically the greater slope at blood Pb levels less than 10 ug/dl than above 10 ug/dl. These findings are supported, as indicated, by an animal literature that has similarly reported evidence for non-linearity of Pb effects that dates back even to the 1970s-80s.
14

The CASAC notes that not all human studies will provide evidence for this non-linearity for reasons such as lack of sufficient power and /or use of less sensitive outcome measures. In addition, animal studies are not likely to fully duplicate the parameters of the IQ slopes seen in studies of children. Animal studies commonly employ behavioral measures that are not analogous to the often broad skills reflected in IQ scores, but rather make use of more pinpointed behavioral measures that likely map onto one or another subcomponent of IQ. Further, animal studies focus on individual molecular actions that are components of integrated physiological responses underlying behavioral functions.
6. Chapter 6 is a discussion of potential susceptibility factors. Are the characteristics included within the broad susceptibility categories appropriate and consistent with the definitions used? Are there any key susceptibility factors that were not included and need to be added? Is it appropriate to include material on susceptibility factors related to Pb exposure and dose, or should the chapter focus solely on susceptibility factors as they influence Pb-induced health effects? Susceptibility to Pb associated effects is also discussed in sections of the ISA other than Chapter 6. Does the ISA adequately cover and appropriately distinguish lifestage-dependent differences (e.g. differences between children and adults) as they relate to the modes of action of Pb, potential exposures to Pb, toxicokinetics and Pb biomarkers, health effects of Pb and susceptibility to Pb induced effects?
For lead, issues related to susceptibility across the life course are critical for public health protection. While the chapter covers relevant studies, the conceptual framework for interpreting them needs to be modified to more sharply address factors that may lead to increased risk and to increased exposure or dose. The ISA lays out an ambiguous set of terms and a conceptual model that does not adequately support interpretation of the literature. The CASAC had similar concerns with regard to the first draft ISA for ozone and voiced them in its letter to Administrator Jackson dated August 10, 2011. Those comments are applicable to the lead ISA as well, and we recommend revisions that parallel those made in Chapter 8 of the second draft ISA for ozone.
The title is perhaps inaccurate—while the chapter discusses variations in blood Pb levels by age, this is NOT a major focus of the chapter, which discusses genetics, nutrition, soil exposure and other variables. There also are quite a few places where literature is discussed in what seems the wrong section, that is, much discussion of factors that are risks for Pb exposure/absorption are discussed in the section on susceptibility to Pb effects. This editing problem should be relatively easy to address.In many places in this chapter, there are sections with only a few citations, in some cases discussing only a single article (i.e., the article on Pb’s association with ADHD being stronger among those exposed to secondhand smoke). The CASAC recommends that the EPA be very clear on the strength of evidence in the literature and cautious in inferring causality in this chapter based upon the limited number of studies available.
Throughout the chapter specific topics that are mentioned are discussed in more detail elsewhere in the report. The CASAC concludes that it would be very useful to point the reader to the relevant section, or better still, to the exact page, and for the electronic version, to provide relevant hyperlinks. Given the size and comprehensiveness of this review, such linking would greatly facilitate the use of the entire document.
15

The CASAC finds that this chapter would be strengthened with more discussion of nutritional aspects that serve to increase susceptibility, and more discussion is warranted for differences in effects by gender (or the need for more research in this area), more discussion of gene-environmental interactions (with the provision of the magnitude of associations/effects) and epigenetic implications.
Insufficient emphasis is given to the findings that even older children and adolescents are vulnerable to neurocognitive effects as is clear from findings showing the sometimes even stronger associations of concurrent blood Pb levels with IQ scores. It also was noted that there are other factors that could be better described, such as age of housing stock, percentage of homes with Pb-free windows, having grass cover or bare soil in yards and playgrounds.
7. Chapter 7 is a discussion of the ecological effects of Pb. Effects on terrestrial and aquatic ecosystems are first considered separately. They are then integrated by classes of endpoints (bioaccumulation, growth, mortality, hematological effects, development and reproduction, neurobehavior, community and ecosystem effects). Does the panel consider this approach appropriate? Is it appropriate to derive a causal determination for bioaccumulation as it affects ecosystem services? Has the ISA adequately characterized the available information on the relationship between Pb exposure and effects on individual organisms and ecosystems, as well the range of exposure concentrations for the specific endpoints? Are there subject areas that should be added, expanded upon, shortened or removed? If the ISA was expanded to consider dose-response in terrestrial systems, should we limit data to field soils? If the ISA were expanded to consider dose-response in aquatic systems, how might we most efficiently present toxicity data that varies greatly by organism, and environmental parameters that influence bioavailability (pH, dissolved organic carbon etc.)?
Chapter 7 is well written, effectively organized, and does an adequate job of addressing “new” published data (post-2006). However, the chapter did not address pre-2006 information, so it is difficult to understand the context and contribution of more recent data to the body of knowledge on Pb toxicity and how they may or may not inform a decision to revise the secondary NAAQS for Pb. This is particularly important given that the extant regulatory values (e.g., Ambient Water Quality Criteria and the terrestrial ecological soil screening level values) that are relied upon are somewhat dated, 1985 and 2003, respectively. The document would be greatly improved by providing a short summary of the status of relevant knowledge at the time of the 2006 AQCD at the beginning of each section, followed by the present review of the literature for the topic. Sections could then be summarized with short statements indicating which significant new findings would be relevant to revising the secondary NAAQS and why other studies were not.
The separation of terrestrial and aquatic ecosystem data is appropriate and the subsequent organization by endpoints and levels of biological complexity is good. Marine and freshwater toxicity data should be segregated in the chapter due to differences in Pb speciation and bioavailability and the possibility of differences in the sensitivity of freshwater and marine organisms.
Is it appropriate to derive a causal determination for bioaccumulation as it affects ecosystem services?
This is a difficult question since the process of bioaccumulation, i.e., the uptake and accumulation of environmental pollutants by organisms, may or may not have any effects on ecosystem services. The process of bioaccumulation itself should not necessarily be thought of as an adverse or toxic effect. Bioaccumulation of Pb in select tissues is a normal metabolic process by which an organism is able to
16

sequester and ultimately detoxify or eliminate Pb, e.g. metal-rich granule formation in mollusks and earthworms. Only when the rate of bioaccumulation exceeds the capacity of the organism to detoxify or excrete Pb are toxic effects evident. It may very well be possible to derive a “causal” relationship between exposure and the presence of metals in tissues. However, due to the non-linear relationship between exposure concentration and tissue concentration with metals, developing a quantitative relationship would be difficult.
Similar concerns exist when evaluating possible food chain related effects. Available data suggest that little tissue bound Pb is bioaccessible when consumed by predators, thus leading to “biodilution” of Pb concentrations as one moves up food webs. If sufficient substantive evidence exists that trophic transfer results in toxicity, then a causal assessment may be appropriate. Most of the available data suggest that biodilution is the predominant fate of Pb during trophic transfer, but some studies suggest moderate effects. As a regulating ecosystem service, bioaccumulation may provide a mechanism for decreasing bioaccessible Pb, but this would likely be minor compared to other fate processes. Overall, a causal determination for the bioaccumulation of Pb as it affects ecosystem services is not warranted at this time.
Has the ISA adequately characterized the available information on the relationship between Pb exposure and effects on individual organisms and ecosystems, as well the range of exposure concentrations for the specific endpoints?
The ISA has done an excellent job of synthesizing and discussing the relationship between Pb exposure and effects on individual organisms and ecosystems with the new information available since 2006. Since the document relies on data that existed prior to 2006 and does not provide a summary of the extant data it is somewhat difficult to assess how adequately the document characterizes all of the available information. Summarization of all of the available data would be helpful; however, presentation of all of the available data would make the document unwieldy. Presentation of the available data in the form of a species sensitivity distribution (SSD) that identifies new versus old data would be helpful to the reader. Also, the ISA relies solely on published toxicity data available in the open literature. Additional unpublished, toxicity information may be available from the Pb industry given all of their efforts over the past 5+ years in developing data for compliance with the European Union Registration, Evaluation, Authorisation and Restriction of Chemicals (REACH) regulations. This data may be very useful pending review and acceptance by the EPA and should be expressed as a separate SSD, if used, to facilitate comparison with existing data.
Are there subject areas that should be added, expanded upon, shortened or removed?
The ISA does a good job of covering most post-2006 published data relating to Pb effects on aquatic and terrestrial organisms. It is interesting, however, that a number of endpoints such as physiological stress, hematological effects, and neurobehavioral effects are considered in this document. Traditionally the EPA has limited their interpretation of environmental effects to those effects that can be directly related to population and community level concerns. This approach has limited endpoints considered for criteria and standards to those associated with organism survival, growth, and reproduction. Alternative biochemical or physiological level endpoints are considered only when they can be linked directly to population or community level concerns. Therefore, since no direct linkages can be made between an observation of a biochemical, behavioral, or physiological endpoint and a population or community
17

level concern, it may be appropriate to eliminate discussion of these types of endpoints from the ISA. If these endpoints are judged not to be germane to this effort, they should be moved to an appendix.
In addition to the issue of endpoint application, there is also the issue of relevance to organisms, populations, and ultimately, application in the revision of the secondary NAAQS. As an example, consider Pb-induced hypometabolism under conditions of environmental hypoxia in crayfish (Morris et al., 2005). Pb may not be the sole causal agent in this study since it is combined with reduced oxygen levels. Glycogen levels in the freshwater snail B. glabrata were significantly decreased at near environmentally relevant concentrations of Pb (50 μg/L) (Ansaldo et al., 2006). Glycogen levels in organisms decrease with exposure to any number of environmental stressors. In both these studies and others related to sub-organismal endpoints, the direct relevance of Pb exposure to organism survival, growth, or reproduction needs to be established.
The ISA treats terrestrial and aquatic ecosystems separately and for clarity of understanding and this is a good separation. However, one casualty of this approach is that the linkage between the two media is lost. Pb loadings to aquatic ecosystems, especially freshwater systems, are primarily derived from the runoff of terrestrial systems. It would be useful to include a discussion of the linkages of watershed processes between terrestrial and aquatic systems.
If the ISA was expanded to consider dose-response in terrestrial systems, should we limit data to field soils?
Data selection should be limited to field soils. Artificial soil is not a soil, but is a standardized test substrate, and data generated using artificial soil have no relevance to any application in real soils. Artificial soil is used as a reference condition in standardized laboratory bioassays with soils and as a standardized test matrix for conducting “proof of concept”-type bioassays with soil invertebrates. In the development of the ecological soil screening levels, the EPA did not consider data generated using artificial soil as acceptable. For plants, hydroponic test systems may be convenient, but not for examining the effects of Pb in soil since the matrix (actually lack of a soil matrix) itself has a tremendous effect on plant physiology and hence Pb uptake and metabolism. Also, given the clear effect of “aging” and soil physical/chemical characteristics on the biological cycling of Pb in terrestrial ecosystems, it would be best to limit dose-response data to studies utilizing field soils.
If the ISA were expanded to consider dose-response in aquatic systems, how might we most efficiently present toxicity data that varies greatly by organism, and environmental parameters that influence bioavailability (pH, dissolved organic carbon etc.)?
The best approach for presenting wide differences in sensitivity among organisms is through a species sensitivity distribution (SSD) approach. Physical and chemical parameters that influence Pb bioavailability are best discussed in terms of a description of the biotic ligand model (BLM). The BLM approach would allow standardization of exposure in the SSD to the concentration of free Pb ion and important ligands. Application of the BLM to natural waters is best described by presenting the results of calculations using a series of natural waters or waters that exhibit a range of composition and chemical/physical parameters found across the United States. By presenting the data in this fashion the reader can easily ascertain the relative importance of each of the parameters on assessing Pb toxicity. This applies to both the aquatic environment as well as to the terrestrial environment.
18

Bioavailability and bioaccessibility are extremely important in assessing the toxicity of Pb to environmental receptors. Total concentrations of Pb in soil and water are inappropriate expressions of exposure and better effects relationships are found with respect to the soil pore water concentrations and free Pb ion in water. Aquatic and terrestrial BLMs are the state-of-the-science and must be considered when evaluating possible environmental effects.
The terms bioconcentration factor (BCF) and bioaccumulation factor (BAF) are used somewhat inconsistently, this should be revised to reflect proper use. The CASAC notes that BCF and BAF are inappropriate measures to assess the hazard of Pb. The CASAC recommends providing a better assessment of the utility (or lack thereof) of BCF values, rather than simply reporting the data from the literature.
19

Enclosure B
Compendium of Individual Comments by CASAC Lead Review Panel Members on EPA’s Integrated Science Assessment for Lead
(First External Review Draft – May 2011)
Mr. George A. Allen..................................................................................................................B-2Dr. Herbert E. Allen..................................................................................................................B-5Dr. Deborah Cory-Slechta......................................................................................................B-10Dr. Cliff Davidson....................................................................................................................B-15Dr. Philip Goodrum.................................................................................................................B-21Dr. Sean Hays...........................................................................................................................B-25Dr. Philip Hopke......................................................................................................................B-27Dr. Chris E. Johnson...............................................................................................................B-29Dr. Susan Korrick....................................................................................................................B-35Dr. Michael Kosnett.................................................................................................................B-44Dr. Roman Lanno....................................................................................................................B-54Mr. Richard Poirot..................................................................................................................B-63Dr. Joel Pounds........................................................................................................................B-70Dr. Michael Rabinowitz..........................................................................................................B-75Dr. William Stubblefield.........................................................................................................B-80Dr. Ian von Lindern.................................................................................................................B-82Dr. Gail Wasserman................................................................................................................B-89Dr. Michael Weitzman............................................................................................................B-92
1

Mr. George A. Allen
General Comment: The Health and Environmental Research Online (HERO) system is a wonderful resource for panel members. While there have been a few problems with access, those were resolved. I encourage continued use of this approach for future National Ambient Air Quality Standard (NAAQS) review documents.
Comments on Chapter 3 - Ambient Lead: Source to Concentration
Charge Question 3: To what extent are the atmospheric science and air quality analyses presented in Chapter 3 clearly conveyed and appropriately characterized? Is the information provided regarding Pb source characteristics, fate and transport of Pb in the environment, Pb monitoring, and spatial and temporal patterns of Pb concentrations in air and non-air media accurate, complete, and relevant to the review of the Pb NAAQS? Does the ISA adequately characterize the available evidence on the relationship between ambient air Pb concentrations and concentrations of Pb in other environmental media?
Overall, the document is well written, comprehensive, and reflects a very detailed review by EPA staff of all aspects the state of the science. As with the ozone Integrated Science Assessment (ISA), it may be too comprehensive in some areas, and could benefit from editing to reduce the overall length and improve the focus of the chapter.
The discussion of lead (Pb) source characteristics and the fate and transport of Pb in the environment are relevant and adequate. The section on the sampling aspect of Pb monitoring is brief, while the review of analysis methods is detailed. The substantial limitations of the present Hi-Vol FRM sampler for Pb are noted, but the document doesn’t suggest anything better other than PM10, which can underestimate Pb in some near-source scenarios (but not GA airports). There is no clear discussion of the exposure/health implications of changing the FRM sampler to PM10; in that sense this chapter needs to be linked to later chapters on exposures.
There is a substantial history of CASAC recommendations to not use the Hi-Vol sampler as the FRM sampler. The CASAC letter of July 18, 2008 states on pages 7 and 8:
“In several rounds of previous comments, the CASAC Panel recommended that a revised (and substantially-lowered) Lead NAAQS should be accompanied by a transition of the sampling indicator from total suspended particulates (TSP) to a low-volume ambient air monitor for lead in particulate matter (PM) less than 10 micrometers in diameter (PM10) in ambient air. In the CASAC’s advice dated January 22, 2008 (EPA-CASAC-08-007), the CASAC noted that the CASAC Panel "unanimously supported the selection of an [PM10] indicator that can be more robustly measured and thus would be more representative of actual population exposures," adding that "a more accurate and precise Pb-PM10 indicator would provide a more stable determination of compliance with the new lower Lead NAAQS." With regard to concerns over a potential loss of ultra-coarse lead particles by PM10 samplers, the CASAC Panel further noted that "it would be well within EPA’s range of discretionary options to accept a slight loss of ultra-coarse lead at some monitoring sites by selecting an appropriately conservative level for the revised Lead NAAQS." In a subsequent teleconference consultation by the CASAC Ambient Air
2

Monitoring and Methods (AAMM) Subcommittee held on March 25, 2008, a majority of the subcommittee members also supported a transition from TSP to low-volume PM10 sampling for lead (see EPA-CASAC-08-010 dated April 14, 2008). "
Since then, the topic has been discussed in the CASAC AAMMS letter of Nov. 30, 2010 on review of the Pb FRM, and also during the May 5, 2011 consultation on the Draft IRP.
Despite these CASAC communications to EPA, the agency has not yet taken meaningful action to address these concerns. While this discussion doesn’t directly fit into the framework of the ISA, this is the only part of the current NAAQS review process that could address this issue in an exposure/health-outcome context and still allow sufficient time for ORD to evaluate potential replacements to the Hi-Vol sampler other than the existing PM10 low-volume FRM sampler (by the time the review of the PAD starts, it is too late to start any such evaluation for inclusion in any revision to the NAAQS). The uncertainty of air-related Pb exposures is much much larger than the modest (~20-30% on average but wildly variable) change in ambient Pb measurements between the Hi-Vol and Pb-PM10. A very recent review article on Pb concentrations and size distributions was just published in Atmospheric Environment by Cho et al., 45 (2011) 5005-5015, DOI 10.1016/j.atmosenv.2011.05.009 . The overall impression from this paper is that there are few robust studies of Pb size distribution that would be relevant to NAAQS exposure issues. The agency could evaluate the existing PM10 inlet aspiration efficiency as a function of wind speed as an expeditious approach to a “larger than PM10" Pb sampler for this round of the NAAQS review.
Another area of general concern is that there is no meaningful discussion of Pb in wildfire and residential space heating woodsmoke. There is Pb in woodsmoke (WS), and especially for valley towns where WS concentrations can be high for much of the winter, this could be the primary air exposure pathway for “new” Pb. Page 3-102, line 28 notes that fine mode Pb is fairly soluble and thus would be expected to be present in wood just as Hg and sulfur are, especially in the eastern US.
The document notes that relevant data for spatial and temporal characterization of Pb in air and non-air media are very limited. It is likely to remain limited given current resource constraints. Similarly, there are limited data to adequately characterize the relationship between ambient air Pb concentrations and concentrations of Pb in other environmental media; the document’s discussion of this topic is adequate given these constraints.
Specific comments follow (page, line[s]).
3-2, 14-16: The 2008 NEI reports GA aircraft as 49% of all Pb emissions, but the % that is relevant to human exposure is likely much much less, since most of those emissions are at altitude and are in the fine mode; thus deposition is widely dispersed, and a significant amount may deposit as wet Pb. Thus the impact on “new” ground level air Pb is likely to be much less than the emission inventory suggests. The way it is stated here may be confusing in this context. I fully support the phase-out of Pb in AvGas on general principle, but I am not convinced that AvGas Pb is a significant exposure in the context of the current Pb NAAQS.
3-4, 8 and 15-16: it may be worth noting that this smelter (Herculaneum MO, the largest single point source of Pb in this country) is closing by the end of 2013 -- sooner than the binding 2016 date. This event would present a rare opportunity to study the changes in both soil and vegetation Pb over time
3

before and after the smelter closes. EPA should consider funding an extra-mural multi-media study (STAR?) that starts sampling a year before the smelter shuts down, and insures that near-field soil sampling areas are isolated from potential site cleanup efforts. (Note: a new Pb ore processing facility is planned for that site using cleaner technologies.)
3-5, 5: same issue as pg 3-2, above.
3-7, 3: The median Pb value should be reported here, since the data are highly log-normal. The 0.3 ug/m3 value shown here is an outlier in this study; this should be noted. There is also substantial uncertainty in the data quality for this sample; given the lack of runtime data, this sample would be voided in AQS. For the very first sample day to be much higher than all subsequent samples makes the sample further suspect. The second highest sample for the study is from site A for the same day.
3.2.2.5 [Roadway sources]: While Pb wheel weights are currently a major source, it should be noted here that several [at least 7] states have already banned their use, and EPA is planning a NPRM in 2012 to ban them. Once banned, their use will drop rapidly. Pb in tires is approximately 15 ppm w/w, and the mass of tire mass from road wear is very large. More quantitative information on Pb in tires and tire wear emission rates would be helpful to better understand their contribution to NR Pb.
3-14, 6: The discussion abruptly switches from Pb-PM to PM concentrations. Is it intended to be “Pb-PM” on this line?
3-17, 10-13: Pb in WS, and 3-22, 26-29: these cites seem to contradict each other re: Pb in wildfire WS. See general comments above.
3-53, 22-26: It should be noted that the dichotomous sampler is a preferred way to measure Pb-coarse in areas where the fine to coarse Pb ratio is greater than 1. There is a commercial dichot sampler currently approved as an FEM for PM-coarse.
3-56, 10: says 9 elements from Improve, but there are up to 24 reported. Some may be of use in this analysis.
3-60, 19-22: Can the single particle mass spec method measure large Pb without substantial losses in the sample train?
3-69, 8-14: should tires as a source of near-road (NR) Pb be noted here? As Pb wheel weights are phased out, tire wear may become [one of] the largest NR Pb sources of “new” Pb. Tires are approximately 15 ppm w/w Pb. Has an inventory estimate ever been made of tire wear as a near-road Pb source?3-69, 29-32: 8 ng/m3 Pb isn’t much of an industrial source value; this needs clarification. Was the SEAS Pb measurement validated in any way? The other 2 sites from that study are 1 and 2 ng/m3 Pb, levels that are so low as to be unlikely in urban areas.
3-104, 3: “lower rate of error” -- a different term [precision?] should be used here.
3-104, 28-31: it is unclear what dataset is being summarized on line 31.
4

Dr. Herbert E. Allen
Comments on Chapter 2 - Integrative Health and Ecological Effects Overview
The authors have prepared a very well-written overview of the health and ecological effects of Pb. There are several items that should be modified and there is some recent literature that could be incorporated. The items in this review are presented in the order they appear within the chapter.
It would be very helpful for each of the discussions to refer to the exact location in the following chapters in which the relevant information is presented.
2-7 line 8. The correlations of Pb with Zn, Br, Cu, and K should be further investigated. Page 2-2 line 28 indicates that ~49% of total atmospheric Pb emissions come from piston engine aircraft. With such a high percentage of the emissions arising from a single source, for the correlations of Zn, Br, Cu, and K indicated in page 2-5 line 8, the emissions of these elements from piston engine aircraft would necessarily need to be high relative to other sources. Certainly, this is likely for Br (in the absence of a significant sea salt input). However, is it also reasonable for the other elements? Emission factor data and very simple modeling should be used to resolve this rather than just providing a speculation. Also, in line 7 “metals” should be replaced by “elements” as Br is not a metal.
2-7 lines 23-25. Even in areas not near smelters the smelters in operation prior to modern control technologies were responsible for a large amount of the emissions of metals to the atmosphere. How important are historic mining and smelting as the origins of Pb in soil and sediment?
2-10 Section 2.5.1. Neurological Effects is very well presented. It does an excellent job of integrating the information.
2-30 lines 14-16. Aging of lead and other metals in soil is an important phenomenon that greatly affects bioavailability. The fundamental physicochemical processes involved in sorption must be understood and formulated into appropriate kinetic models of sorption that incorporate chemical speciation.
2-34 lines 17-19. The LC50 is a poor measure to compare to environmental concentrations. Most LC50 values are for acute, not chronic, exposures. Consequently, if the environmental concentration were to reach the LC50 value it is unlikely that there would be a sustainable population. A lower toxicity, such as LC5 or LC10, is more reasonable to compare to environmental concentrations.2-34 lines 29-30. This 50-fold range in the LC50 value for larval fathead minnows for differing pH and concentrations of DOC and CaSO4 clearly demonstrates the importance of the chemistry of the exposure medium to the effect. The importance of these factors that modify toxicity and are accounted for by the Biotic Ligand Model (Di Toro et al., 2001).
2-35 lines 13-14. Many of these Pb concentrations exceed its solubility. Such data have historically confounded the literature and have necessitated additional studies of toxicity.
2-38 lines 2-9. Do the adverse effects of Pb on reproduction in invertebrates and vertebrates occur at environmental concentrations of Pb?
5
2-40 lines 1-4. The sediments used in this study were oxidized by the sample treatment process. This would have eliminated acid volatile sulfide from the sample and modified the bioavailability of the added Pb. Thus, the sediments cannot be considered to be in their natural state and caution should be applied to the interpretation of this and to other studies in which the sediment chemistry has likewise been modified. Of course, there is always a great difficulty in relating laboratory results to those in the field. However, in this instance one of the major factors known to affect the results has been modified. The results appear to be valid, but the extrapolation from laboratory to field may not be.
2-40 line 31. Sulfide should be added to pH and organic matter as an important environmental variable that affects Pb bioavailability and toxicity.
2-41 lines 4-16. The EPA Equilibrium Partitioning Sediment Benchmarks (Hansen et al., 2005) should be mentioned. These provide a means to evaluate which sediments will not exhibit toxicity.
2-43 lines 13-16. I do not understand the sentence “The level at which Pb elicits a specific effect is more difficult to establish in terrestrial and aquatic systems due to the influence of environmental variables on Pb bioavailability and toxicity and substantial species differences in Pb susceptibility.” What is implied in the phrase “more difficult to establish in terrestrial and aquatic systems”? Is this a comparison to human health? These and other environmental variables affect the bioavailability for humans.
References
Di Toro, D.M., H.E. Allen, H.L. Bergman, J.S. Meyer, P.R. Paquin, and R.C. Santore. 2001. Biotic Ligand Model of the Acute Toxicity of Metals. 1. Technical Basis. Environ. Toxicol. Chem. 20: 2383-2396.
Hansen, D.J., D.M. Di Toro, W.J. Berry, W. S. Boothman, R. M. Burgess, G.T. Ankley, D.R. Mount, J.A. McGrath, H.E. Bell, and C.S. Zarba. 2005. Procedures for the Derivation of Equilibrium Partitioning Sediment Benchmarks (ESBs) for the Protection of Benthic Organisms: Metal Mixtures (Cadmium, Copper, Lead, Nickel, Silver, and Zinc). Office of Research and Development. Washington, DC. EPA/600/R-02/011
Comments on Chapter 7 - Ecological Effects of Lead
The authors have prepared a very well-written and comprehensive review of recent literature on the ecological effects of lead.
The HERO database and excess ability greatly facilitated the review. This excellent system is a pleasure to work with.
There are several items that should be modified and there is some recent literature that could be incorporated.
My greatest concern regards the lack of clarity regarding which reports lead to modification of the 2006 assessment. It would greatly improve the reader’s understanding of the basis for the assessments if the sections first presented a short summary of the status of relevant knowledge at the time of the 2006 assessment. This could then be followed by the present review of the literature for the topic. Finally, a
6

short statement indicating what significant new findings had been included and the reasons that other studies were not included. In this regard it is most important that the review not be simply a recitation of the author’s claims within the cited paper. The review should be critical and should point out alternative conclusions to those presented by the authors when appropriate. I will illustrate that by a discussion of the paper of Ettler et al. discussed in the next paragraph.
7-9 line 28 through 7-10 line 4. Great care should be exercised in the use of selective extraction data such as the results of Ettler et al. (2005) cited in the ISA. The assignment of specific geochemical associations to the results of these extractions has been demonstrated not to be valid by a number of researchers (e.g., Tipping et al., 1985; Rapin et al., 1986; Kheboian and Baur, 1987; Martin et al., 1987; and Qing et al., 1994). Not only are metals released from the indicated geochemical phases indicated, but they are also released from other phases. Although Ettler et al. (2005) assumed the extracted fractions were related to bioavailability, no bioavailability was actually determined. The lack of any toxicity or metal uptake data in their paper does not provide the necessary level of assurance that the results of these extraction procedures can be used to infer relative bioavailability. Indeed, there is not even a citation to any published study in which such a relationship has been demonstrated. I believe that the lack of measurement of any biological effect, or even of citation that this methodology can be related to biological effect, should be noted in the review. This assessment is directly contrary to that of the authors.
7-11 line 28 through 7-12 line 3. What this and other studies actually show is that relating effects to total concentrations of metal in soil (mg/kg) is inappropriate. The better effects relationships that were found with respect to the soil pore water concentrations are because the pore water represents the equilibrium partitioning and thus bioavailability.
7-35 lines 20-21. New exposure-response data are presented in several papers (Chen et al., 2010; and Kopittke et al. 2011).
7-36 line 31. ISO is the International Standards Organization. It is not a European methodology.
7-65 lines 14-18. Here and in a number of other places, BCF and BAF factors have been used. However, BCF is a poor factor to use in the hazard assessment of metals. Bioaccumulation factors are used as an important aspect in the hazard assessment for hydrophobic organic compounds (e.g. PCBs and DDT). For such compounds the BCF for a biological species is approximately constant and the concentration in the organism is proportional to the concentration in the environment (Chapman et al., 1996). Thus, high BCF values indicate highly bioaccumulated materials that warrant consideration for regulation as a consequence of the biological effects that these materials may cause in the organism or to the food chain. However, this is not the case for metals (with the possible exception of mercury). The BCF for an organism is not a constant, but is highly dependent on exposure conditions, including the concentration of the metal in the environment. A very extensive study of the relationship of bioaccumulation to exposure concentration of metals, including lead, has been published by McGeer et al., 2003). They found that in almost all cases the BCF decreased with increased exposure concentration. Thus, if one considers a high BCF as a predictor of hazard, increasing the environmental concentration of the metal would then lead to a lower anticipated hazard. Clearly, this is not the case. The error lies in consideration of BCF values for metals as anything more than the ratio of two values, the concentration in the organism and the concentration in the environment. As this ratio is not a constant, it not only lacks any predictive or assessment value.
7

Problems with the BCF can be further seen in the present document. Consider the data for BCF for aquatic plants. In the 2006 report the range of BCF values was from 840 to 20,000. The new data in Table 7-3 has a range 0.01 to 1500. The maximum value for the new data is less than a factor of 2 greater than the minimum value in the older report. The total range of BCF values is now 0.01 to 20,000. This is a range of 2,000,000. Furthermore, the range of BCF values for duckweed (Lemna sp.) is now 0.01 to 3,560. This is a range of 356,000 which clearly is too great to be of any use in assessments. Furthermore, if the maximum and minimum values are considered, very different conclusions can be drawn regarding the potential hazard of lead. The low BCF value of 0.01 indicates that there is no hazard of Pb. The high BCF value of 3,560 is above a commonly used assessment criterion of 1,000 and suggests that Pb is a hazard. Clearly, BCF is an inappropriate measure to assess the hazard of Pb. The document needs to provide a better assessment of the utility (or lack thereof) of BCF values rather than simply reporting the data from the literature.
That organisms can have high concentrations of metals is true and important. The consequences of these high metal concentrations can be discussed without use of BCF and BAF.
References
Chapman, P.M., Allen, H.E., Godtfredsen, K., and Z’Graggen, M.N.. Evaluation of Bioaccumulation Factors in Regulating Metals. Environmental Science and Technology 30: 448A-452A (1996).
Chen, Z., Zhu, L. and Wilkinson, K.J.. 2010. Validation of the biotic ligand model in metal mixtures: Bioaccumulation of lead and copper. Environ. Sci. Technol. 44: 3580-3586.Ettler, V., Vanek, A., Mihaljevic, M., & Bezdicka, P. (2005). Contrasting lead speciation in forest and tilled soils heavily polluted by lead metallurgy. Chemosphere, 58(10), 1449-1459.Kheboian, C. and C.F. Bauer. 1987. Accuracy of selective extraction procedures for metal speciation in model aquatic sediments. Anal. Chem. 59: 1417-1423.
Kopittke, P.M., Kinraide, T.B., Wang, P., F. Blamey, P.C., Reichman, S.M. and Menzies, N.W. 2011. Alleviation of Cu and Pb Rhizotoxicities in Cowpea (Vigna unguiculata) as Related to Ion Activities at Root-Cell Plasma Membrane Surface. Environ. Sci. Technol. 45: 4966–4973.Martin, J.M., P. Nirel and A.J. Thomas. 1987. Sequential Extraction Techniques: Promises and Problems. Marine Chemistry 22:313-341.
McGeer, J.C., Brix, K.V., Skeafe, J.M., Deforest, D.K., Brigham, S.I., Adams, W.J., and Green, A. 2003. Inverse Relationship Between Bioconcentration Factor and Exposure Concentration for Metals: Implications for Hazard Assessment of Metals in the Aquatic Environment. Environ. Toxicol. Chem. 22: 1017-1037.
Qiang, T., Xiao-Quan, S., Jin, Q. and Zhe-Ming, N. 1994. Trace metal redistribution during extraction of model soils by acetic acid/sodium acetate. Anal. Chem. 66: 3562-3568.
Rapin, F., Tessier, A., Campbell, P.G.C. and Carignan, R. 1986. Potential artifacts in the determination of metal partitioning in sediments by a sequential extraction procedure. Environ. Sci. Technol. 20: 836-840.
8

Tipping, E., Hetherington, N.B., Hilton, J., Thompson, D.W., Bowles, E. and Hamilton-Taylor, J. 1985. Artifacts in the use of selective chemical extraction to determine distributions of metals between oxides of manganese and iron. Anal. Chem. 57: 1944-1946.
9
Dr. Deborah Cory-Slechta
Comments on Chapter 5 - Integrated Health Effects of Lead Exposure
Charge Question 5a
1. Several places in the text refer, especially in describing in vitro studies, of the use of ‘levels as low as’ or ‘to as little as’ and then cite concentrations that are not considered low. Certainly 1 uM is not a low concentration. And in some cases (e.g., p. 5-6), a level of 5 uM is listed as low. It would be useful to provide some context about the relationship of in vitro exposure levels to human exposures and blood Pb levels.
2. In cases of interaction effects, i.e., effect modification, it is not always possible to rule out the fact that the interaction was due to altered lead toxicokinetics. For example, numerous studies are cited in which anti-oxidants are stated to reverse effects of Pb. The description of these studies is generally not sufficient to fully understand the methodological details. But it was not always clear that some anti-oxidant, for example, co-administered with lead did not reverse its effects per se, but instead, altered its toxicokinetics. This would significantly alter the presumed (and often stated) interpretation of anti-oxidant mechanisms.
3. Comments related to mechanistic studies that suggest therapeutic approaches are debatable and do not belong in the scope of this document.
Charge Question 5e
1. Additional evidence has accumulated since 2006 supporting the non-linearity of the dose response curve defining the association between blood Pb and IQ, specifically the greater slope at blood Pb <10 ug/dl than above 10 ug/dl. These are supported by a substantial animal literature that has reported non-linear effects of Pb over the years. It is important to note that not all human studies will provide evidence for this non-linearity for reasons such as lack of sufficient power and/or insensitivity of outcome measures. In addition, animal studies are not likely to exactly duplicate the parameters of the slopes in children given that other physiological processes will be invoked as well.
Charge Questions 5b and 5c
1. The implications to changes in auditory brainstem evoked responses, observed in both the human and animal studies, are under-appreciated in the document. While they are indicative of alterations in auditory acuity, changes in the latencies between peaks have also been related to changes in brain myelination and in synaptic maturation.
2. A significant number of studies, both human and animal have examined the specific components of attention that are disrupted by Pb exposure and this topic does not appear to have been sufficiently covered in the Toxicology section or in the human studies.
3. In regard to the neurocognitive outcomes, the Toxicology section seems somewhat disorganized and not consistent with behavioral domains. Why is the morris water maze study cited not included under learning? Changes in schedule-controlled behavior are also consistent with learning impairments as lead alters the prototypical patterns of responding. Response inhibition should be considered under the domain of attention.
10

Charge Question 5d
1. While this Section does a fairly good job of integration, it is also somewhat superficial. More specific examples of direct correspondence between human and animal studies would be highly supportive. For example, there are very parallel studies of specific domains of neurocognitive dysfuntion (e.g., learning, reversal learning, planning, executive function) in humans (e.g., Canfield et al. , 2004) and in animal studies. Deficits in glucocorticoid negative feedback (i.e., HPA axis dysfunction) are found in low level exposures in both humans (Gump studies) and animal studies (Rossi-George studies). Studies of attention have looked at sustained attention in humans and animals, etc. There are direct correspondences in auditory brainstem evoked responses in human and animal studies. Since these are such direct correspondences, they carry particular weights.
Other General Comments on Chapter 5
1. In some human studies, the population described as controls have blood lead levels in the range that are now considered to be associated with effects, even in some adult studies. This should be pointed out and the effects of the study qualified accordingly.
2. There are many examples of studies of gene-Pb exposure interactions throughout Chapter 5 describing the health effects of Pb. None of these describe the magnitude of the effect of this interactions. Are these actually biologically relevant or of such small magnitude as to not be pertinent? Here too context is important. All such interaction outcomes where cited should include information on the extent/magnitude of the effect.
3. It would be far preferable and facilitate comparisons if all blood lead measures used the same units, preferably ug/dl; this may mean converting the units used in some of the cited studies.
4. The importance of effect modification is included in some places in the document, but it would be useful to address it in the summary of health effects as well, particularly as, dependent upon the context, it can result in effects of lead at even lower levels of exposure than when lead occurred in the absence of that modifier. Gender is also an important effect modifier and it is particularly astounding, given the size of the lead literature, how little we know about gender differences, but they are, when examined, far reaching.
Specific Comments
1. p. 5-44, lines 16-36. One interpretation that has to be considered with respect to studies of life stages of vulnerability is that the early effects of lead exposure on intellectual function cause early academic retardation that by itself, above and beyond subsequent lead exposure, would itself lead to later academic problems. Clearly, children who do not learn the basics early in school will have increasing problems later on because of that.
2. P. 5-51. It would be helpful and easier for the reader to have the same y axis values on all 4 plots in Figure 5-3 as it allows direct comparison of the magnitude of effects across conditions.
3. P. 5-52 and 5-53, Specific Indices of Cognitive Function. It is surprising that no mention is included here of the Canfield et al., 2004 study.
4. P. 5-61 lines 27-29. Albeit limited, the brain does generate stem cells as well, which this statement ignores.
11
5. P. 5-62, lines 32-35. This statement is a gross over-generalization as it is already clear that different environmental toxicants/insults differ in their impacts on males vs. females.
6. P. 5-68, lines 1-19. The point of the paragraph is not really clear.7. P. 5-73, lines 1-16. It is important to continue to point out that questions regarding differences in
sensitivity of different developmental periods of exposure in human studies will always be complicated by the problem that the measures at different stages differ in their sensitivity.
8. The section beginning on Toxicological studies is confusingly organized. For example, why are studies of morris water maze on p. 5-75 lines 1-2 and 5-76 lines 1-21separated out; these are essentially studies of learning as are studies subsequently described on p. 5-77 lines 12-28 and subsequently.
9. The statement on p. 5-77 lines 1-2 stating that deficits in working memory are thought to underlie the associations between blood Pb levels and ADHD in humans is highly simplistic and not reflective of the literature in general on ADHD.
10. P. 5-79 Figure 5-13; it is important to point out that offspring stress was actually PS followed by OS, not OS alone.
11. P. 5-83; the word water appears to be a mistake in the title for Table 5-812. P. 5-84; there was a prior study by Brockel and Cory-Slechta in 1998 where postweaning Pb
exposures associated with blood Pbs of 9 ug/dl were likewise not affected in a sustained attention task.
13. P. 5-85, lines 27-32. This summary seems highly overstated and over-generalized based on what is a very small literature.
14. P. 5-94, Figure 5-17. The magnitude of effect in this study was very small and this figure provides an artificial amplification that is misleading.
15. P. 5-98 and 5-99. It is not clear why Canfield et al. 2004 is not included in this section.16. P. 5-108, lines 24-26; Toxicological Studies of Neurobehavioral Outcomes. What references
support statements such as cerebellum as a target of Pb?17. P. 5-11-, lines 15-16; again, this is an over-generalization.18. P. 5-112, line 18, please note psychological stress is not necessarily a negative factor. Indeed, a
growing literature documents the ability of early stress to promote resiliency.19. P. 5-113, lines 3-5; the original reference is not White et al., but Cory-Slechta, 2004.20. P. 5-114 and p. 5-119, lines 3-13. The changes that occur in auditory brainstem evoked response,
found in both human and animal studies, seem to be suggested only as related to hearing deficits. In fact, however, alterations in interpeak latencies are clearly indicative of myelination status as well as impairments in synapse formation. This is never mentioned.
21. P. 5-117. The use of the phrase gestational Pb exposure in a rodent model is likely over-stated; it is impossible to turn off exposure to the offspring specifically at PND10 given the kinetics of Pb.
22. P. 5-123, line 21. The use of the adjective ‘old’ in referring to 12-14 week old rats is a mis-statement; that adjective is used for animals that are significantly older, e.g., 18 mos of age.
23. P. 5-125, line 28. It should be noted that no dementia has ever been established in these models, however.
24. P. 5-135, lines 2-4. The notion that strategies involving glial transmission or D-serine supplementation might be used for Pb exposure is premature and also not realistic for low level Pb exposure, particularly given that it is likely to have multiple other effects. It is not clear that this statement belongs in the document.
25. P. 5-138, lines 11-12 suffer from the same issue described in #24 above.
12

26. P. 5-143, comparisons of magnitude of lead effects across sociodemographic groups may well be confounded by floor effects, i.e., it would be difficult to pick up as great an effect in low SES communities, where average IQ score, for example, may already be quite low.
27. P. 5-147, lines 21-23. This seems like an overstatement of the animal literature and is very likely to depend upon the outcome measures that are used; postweaning rats are very sensitive to lead and in fact effect in that model have been reported at blood Pbs of 9 ug/dl, the lowest levels examined to date. Unless some specific references can be provided demonstrating actual comparisons across more than one endpoint, this statement should be qualified.
28. P. 5-178, lines 1-8. What is the magnitude of the change caused by the polymorphisms?29. P. 5-189, line 11, no year for the reference30. P. 5-228, lines 21-31. Since the actual exposures protocols are not explicitly described, it is not
evident that the antioxidants worked not by reversing oxidative stress, but by toxicokinetic mechanisms, decreasing lead uptake for example, which would lead to quite a different interpretation of the results. This issue applies to other sections describing reversal of Pb effects by e.g., antioxidants, chelators, etc.
31. P. 5-229, lines 1-16. This paragraph again underscores the importance of breaking out gender in both toxicological and epidemiological studies.
32. P. 5-229, lines 24-26. It isn’t clear how this interpretation relates to this study, since lead is not ‘metabolized’.
33. P. 5-231, Figure 5-46. It would be very helpful if additional tics could be added to the x axis.34. P. 5-232, Section 5.5.4 Effects of Exposure to Lead Mixtures. An important study by Mejia et al.
1997 is relevant and should be cited here as it appears to show that lead content in brain tissue can be increased by co-exposure to arsenic.
35. P. 5-233, line 33, the year is missing for the reference.36. P. 5-267, line 9, reference is missing the year.37. P. 5-272, line 19, seems to be inconsistent with p. 5-271.38. P. 5-287, lines 21-23, what is the magnitude of the effect of the polymorphism?39. P. 5-317, line 12, missing the reference.40. P. 5-360, line 9 and line 29, missing reference.
Charge Question 6
1. In relation to genetic background, there are many examples of studies of gene-Pb exposure interactions throughout Chapter 5 describing the health effects of Pb. None of these describe the magnitude of the effect of this interactions. Are these actually biologically relevant or of such small magnitude as to not be pertinent? Here too context is important. All such interaction outcomes where cited should include information on the extent/magnitude of the effect.
2. It is important not to oversell earliest development as the most sensitive period of exposure. While there are toxicokinetic factors that increase exposure, there are also multiple examples in the human studies of current blood lead associated with IQ reductions and in some cases these occur even when earlier exposure blood leads are not significant. This has also led to reconsideration of the impacts of effects in adolescence. In addition, in the animal literature, there are many examples of effects of lead even when exposures do not occur until after weaning. Indeed, for long-term potentiation, a physiological substrate of learning and memory, this was among the most sensitive periods for this effect. It is also important to continue to point out that questions regarding differences in sensitivity of different developmental periods of
13

exposure in human studies will always be complicated by the problem that the measures at different stages differ in their sensitivity.
3. The potential for gender differences in lead effects deserves far more emphasis. It is now found routinely in the animal studies and unfortunately, despite years of literature and human studies that frequently statistically control for gender, where examined, there are reported differences in the human studies as well. One could also consider the fact that blood lead levels of females are typically lower than those of males across the distribution. If one considers the greater slope of IQ reductions at the lower blood lead levels, the lower blood leads should be represented to a greater extent by female subjects than males, and could suggest their greater sensitivity than males, although this has never been examined in the human studies.
14

Dr. Cliff Davidson
Comments on Chapter 1 – Introduction
The selection criteria for inclusion of studies seem reasonable. The decision to focus on exposures within one order of magnitude of current exposures also seems reasonable. There are some specific comments regarding Chapter 1, as follows.
1. Figure 1-1 states that studies not addressing exposure and/or effects of air pollutants under review are excluded. But the text states (on page 1-9, lines 18-23) the following:
“All relevant epidemiologic, animal toxicological, and ecological and welfare effects studies published since the last review were considered, including those related to exposure-response relationships, mode(s) of action (MOA), and susceptible populations. Additionally, air quality and emissions data, studies on atmospheric chemistry, environmental fate and transport, as well as issues related to Pb toxicokinetics and exposure were considered for inclusion in the document.”
Thus it appears that studies addressing emissions, atmospheric chemistry, and fate and transport, in addition to exposure and effects, were included in the document.
2. Typo on page 1-13, lines 3-5 (“informs” should be “inform”):
3. Also on page 1-13, the text states:
“These MOAs, as they pertain to Pb exposures of short or longer duration, informs our understanding of indirect effects that Pb may exert more broadly on ecosystem structure, function and services.”
What are “MOAs”? This abbreviation is not in the list at the front of Chapter 1.
4. Page 1-16, lines 22-28 deal with causality for direct human exposure in controlled chambers. This is irrelevant for Pb, since there are no human chamber studies for this pollutant, so this paragraph may be considered unnecessary. The paragraph is as follows:
“Causality determinations are based on the evaluation and synthesis of evidence from across scientific disciplines; the type of evidence that is most important for such determinations will vary by assessment. The most direct evidence of a causal relationship between pollutant exposures and human health effects comes from controlled human exposure studies. This type of study experimentally evaluates the health effects of administered exposures in human volunteers under highly-controlled laboratory conditions. Controlled human exposure studies are not done for Pb, and thus, are unavailable for consideration.”
5. Section 1.6.2 begins by defining “causality” and “association” on page 1-17. It might be better to move these definitions earlier – for example, section 1.6 starts on page 1-15 and starts using the terms well before they are defined.
15

6. The following sentence on page 20, lines 22-24, is grammatically incorrect:
“Confidence that unmeasured confounders are not producing the findings is increased when multiple studies are conducted in various settings using different subjects or exposures; each of which might eliminate another source of confounding from consideration.”
Comments on Chapter 2 - Integrative Health and Ecological Effects Overview
This chapter appears to be a useful summary of the rest of the document. The key challenge in communicating the ISA results to varied audiences is that there is a lot of information included in the ISA, and it will take some effort for readers to track down what they are looking for. Is it possible to develop an alphabetical index by topic areas? The framework for causal determination seems reasonable, and it appears to have been applied in a reasonable way. The integration of findings in the literature across health and ecological studies also appears to be reasonable. There are some specific comments with regard to Chapter 2, as follows.
1. On page 2-3, lines 8-9, the text states:
“Global atmospheric Pb deposition peaked in the 1970s, followed by a more recent decline.”
What is the purpose of “more recent” in this sentence? Shouldn’t this be simply “followed by a decline”?
2. On page 2-4, lines 1-2, the text states:
“The FRM is based on flame AAS. ICPMS is under consideration as a new FRM for Pb-TSP.”
Perhaps the reasons for the delay in obtaining acceptance of ICP-MS could be mentioned.
3. On page 2-4, line 11. Typo: “network” appears twice.
4. On page 2-4, lines 16-17: The following sentence seems obvious – not sure why it is needed:
“Non-source oriented monitors were those monitors not considered to be source oriented.”
5. On page 2-10, lines 11-14, the text states:
“Both epidemiologic studies (in children) and toxicological studies, demonstrated neurocognitive deficits in association with blood Pb levels at and below 10 μg/dL, and evidence from both disciplines supported a nonlinear exposure-response relationship, with greater effects estimated for lower blood Pb levels.”
Why are there greater effects estimated for lower blood levels? This is confusing.
16

6. Some sections of Chapter 2 summarizing important results do not refer to the sections of later chapters where the details are found. But some sections of Chapter 2 do refer to the later chapters, such as this part of Section 2.8.4.1 on page 2-50:
“2.8.4.1. Children Children may be more highly exposed to Pb compared to adults without occupational exposure to Pb, through their behaviors (e.g., hand-to-mouth contact). Blood Pb levels are highest among the youngest children and decrease with increasing age of the child (Table 6-1). Biokinetic factors that vary by age, including bone turnover and absorption, also affect blood Pb levels. Childhood, as a susceptibility factor related to Pb exposure and dose, is discussed in more detail in sectin 6.1.1.1. The kinetics of Pb, and how absorption, distribution, and elimination may vary depending on lifestage, is discussed in Section 4.2. 7
It is recognized that Pb can cross the placenta to affect the developing nervous system of the fetus (Sections 4.2.2.4, 5.3.2.1) and there is evidence of increased susceptibility to the neurocognitive effects of Pb exposure during several lifestages throughout childhood and into adolescence (for more detail, see Section 5.3.2.1). Further, Pb exposure is associated with effects on the renal (Section 5.5.2.3), immune (Section 5.6) and heme synthesis and RBC function (Section 5.7) of children. A limited number of studies of immune parameters, transferring saturation, and iron-deficiency anemia that stratified children by age report stronger associations among the youngest children. Childhood, as a susceptibility factor related to Pb-induced health effects, is discussed in more detail in Section 6.2.1.1.”
Note that there is a typo on the seventh line above (“sectin”).
These referrals to later chapters are helpful, but listing so many sections such as in the paragraph above for all of Chapter 2 may be too time-consuming, and makes it difficult to read. In any case, there is currently an inconsistency in that some sections of Chapter 2 do not include any referrals to later chapters, while others do. Perhaps referring to major sections in later chapters would be a good compromise to apply throughout Chapter 2 (e.g., refer to sections 3.1 and 3.1.2, etc., but not 3.1.2.3).
7. On page 2-46, bottom of the page, the text states:
“The Schnaas (2004) had a particularly strong experimental design in that is the only longitudinal study in which blood Pb concentration was monitored repeatedly in individual children from age 6 months to 10 years.”
It appears that a word or words are missing. Perhaps the intended sentence begins “The Schnaas (2004) study had a particularly strong experimental design….”
8. On page 2-49, the text states:
“This body of with the addition of more recent studies is presented Figure 2-2.”
Again, a word or words are missing.
17

9. On page 2-50, the text states:
“Menke et al. (2006), reporting a non-linear relationships”
Note that “relationships” should be “relationship”.
Comments on Chapter 3 - Ambient Lead: Source to Concentration
The information on atmospheric sciences and air quality in this chapter appear to be a good summary. They are, in general, clearly conveyed. The information on sources, fate and transport, monitoring, and spatial and temporal patterns seem relevant and thoroughly researched. The discussion of relationships between air Pb and concentrations in other environmental media also appear to be reasonable. There are some specific comments on Chapter 3, as follows.
1. On page 3-7, the text states:
“Gidney et al. (2010) point out that, where tetraethyl Pb is used as an additive in piston engine aircraft fuel, the fuel also contains ethylene dibromide to act as a Pb “scavenging agent.” When ethylene dibromide reacts with Pb, it forms Pb bromide and Pb oxybromides, which are more volatile.”
It is not clear why the scavenging agent is used. If ethylene dibromide reacts to form more volatile species, then there will be more Pb emitted (in gaseous form). How is that helpful?
2. On page 3-9, the text states:
“Tan et al. (2006) compared several emissions sources in Shanghai, China. They estimated emission values for on-road exhaust from use of Pb-free gasoline (238 ± 5 mg/kg), vehicle exhaust from leaded on-road gasoline (7,804 ± 160 mg/kg), coal combustion (1,788 ± 37 mg/kg), metallurgic dust (6,140 ± 130 mg/kg), soil (11.7 ± 0.3 mg/kg), and cement (103 ± 2 mg/kg). Pb-free automobile gasoline has been in use in Shanghai since 1997. The isotope ratios for each of these emission sources were determined. Based on the 4.4 × 10⁷ tons of coal combusted annually in Shanghai, an average coal Pb concentration of 13.6 ± 6.6 mg/kg, and an emission factor of 0.5, approximately 300 tons Pb was being emitted annually in association with fine PM. They concluded that a major priority should be to reduce Pb emissions from coal combustion now that the contribution from vehicle exhaust emissions has decreased.”
Why did the authors conclude that Pb reduction from coal should be a major emphasis, considering that Pb from leaded gasoline is four times greater? Should the last sentence state “now that the contribution from vehicle exhaust is expected to decrease in the future”?
3. On page 3-11, the text states:
“The 2006 Pb AQCD (U.S. EPA, 2006) cited an estimate by Harris and Davidson (2005) that more than 90% of airborne Pb emissions in the South Coast Basin of California were from soil resuspension. Since publication of the 2006 Pb AQCD (U.S. EPA, 2006), further analysis of the Harris and Davidson (2005) paper has revealed that the contributions of Pb from piston engine
18

aircraft were underestimated compared with the 2002 NEI. Assumptions of spatial uniformity incurred by the “continuously stirred reactor” mass balance model and for mixing layer height used by Harris and Davidson (2005) were also not valid because Pb concentrations are spatially heterogeneous at the urban scale; see Section 3.5. Therefore, the estimate of 90% of airborne Pb from resuspension is not employed in the current assessment.”
The paper by Harris and Davidson is being discredited here, but why? The reasons do not appear to be based on sound science. If the NEI estimates of 2002 are used, the mass balance changes very little. Furthermore, many mass balances in the literature use the “continuously stirred reactor” model, and it is acknowledged in the paper as merely an estimate. There was very good agreement between the estimates cited from measurements and estimates cited from emissions data. So why exclude this value of 90% by discrediting the paper? It is the only estimate available, and this is a high ranking peer reviewed journal. I suggest the following revised paragraph which says the same thing without discrediting the paper:
“The 2006 Pb AQCD (U.S. EPA, 2006) cited an estimate by Harris and Davidson (2005) that more than 90% of airborne Pb emissions in the South Coast Basin of California were from soil resuspension. This value was obtained by constructing mass balances rather than direct measurements of lead alongside roads, and hence is merely an estimate. Currently, measured data are not available with sufficient spatial resolution to discern the specific contribution of soil Pb resuspension to air Pb concentration, but resuspended soil Pb cannot be eliminated as a potential major source of airborne Pb.”
4. On page 3-42, the text states:
“Additional research highlighted the importance of taking forest cycling and litter throughput account in estimating input by deposition.”
The word “into” is missing after “throughput”.5. On page 3-52, the text discusses the rationale for choosing the TSP sampler over the PM10 sampler, and states:
“The rationale for this decision included recognition of exposure due to Pb-TSP that would not be captured by PM10 sampling, the paucity of information documenting the relationship between Pb-PM10 and Pb-TSP at the broad range of Pb sources in the U.S., and uncertainty regarding the effectiveness of a Pb-PM10-based NAAQS in controlling ultracoarse Pb-PM near sources where Pb concentrations are highest (73 FR 66991).”
It is not clear why a measurement method with such a high variability is preferred – we won’t know how much of the Pb is associated with particle diameters greater than 5 micrometers, or even what the true concentration of particles with diameters above 5 micrometers is. I feel this is a weak justification that could be strengthened.
6. On page 3-64, the text reads:
“Non-source oriented monitors were those monitors in the system not designated to be source oriented”
19

I don’t see why this sentence is needed – the definition appears obvious.
7. On page 3-76, the text reads:
“For both Pb-PM10 (Figure 3-21) and Pb-PM2.5, (Figure 3-22) monthly average concentrations are considerably higher in the fall than in other seasons, with lowest the three highest monthly average concentrations observed in September, October, and November, and the average September concentration more than double the average December concentration.”
It appears that the word “lowest” in the third line should be deleted.
8. On page 3-84, the text states:
“The strongest association was with Zn (median R = 0.51).”
As part of the ISA, was there any attempt to look at the literature for other chemical species, e.g., Zn, in an effort to understand the Pb data?
9. On page 3-103, the text states:
“In contrast, Pb associated with coarse PM is usually insoluble, and removed by dry deposition.”
It should be noted in the text that dry deposition may not be an “ultimate sink” because particles which dry deposit are often subsequently resuspended and redeposited many times before reaching a site where further transport is unlikely. The same is, of course, true for any deposition mechanism, but it is especially true for dry deposition onto dry ambient surfaces.
20

Dr. Philip Goodrum
Section 4.5.1 was fairly well organized, and it was particularly useful to begin with reiterating the analysis and findings of Brunekreef et al (1984) based a meta-analysis of multiple studies. It is not obvious upon first reading how the slope term was calculated from the parameters of the log-log regression. Several short examples should be added:
1. Brunekreef et al (1984) - the equations presented in the title of Figure 4-19 should be carried over to the main text and example calculations should be provided. There are errors in lines 9 and 11 on page 4-79 – the slopes presented for both data groups are based on an increase in air Pb concentration from 0.50 to 1.5 µg/m3, rather than 0.15 to 1.5 µg/m3. Text and tables throughout the section should be closely reviewed for similar typographical errors.
2. Table 4-11: I’d suggest re-orienting the table to landscape view, and expanding the “Model Description” from 1 column into 3, with the following headers: Model (e.g., log-log), Parameters (provide BOTH slope and intercept terms), Description (the remaining information)
3. Table 4-11: Slope calculations – references to footnotes suggest that either the slope was calculated by integration, or more likely some interval of air lead concentrations was used. It is not clear how the slopes were calculated, nor can the values presented be readily identified from the cited literature. In the text or table footnotes, provide a few additional example calculations to demonstrate how the slopes were determined.
It is unclear if the increase in blood lead concentration that is referred to in discussion of the slopes is actually predictive of a change in the geometric mean (GM) or arithmetic mean. Given the reliance on log-transformed variables in the regressions and based on a cursory review of the primary literature, it appears more supportable to interpret these deltas as changes in the GM. A short discussion of the difference between arithmetic mean and GM for lognormal distributions should be added and, if there are differences in interpretation – either provide both the AM and GM, or describe how the conversion to GM was conducted.
The descriptions of the key new studies is helpful and the summary provides sufficient detail to understand the advantages and limitations of the new data. Clearly there are many uncertainties associated with any single study, but collectively the estimates provide a useful basis for understanding the extent to which air lead (PbA) may contribute to exposure. With this concept in mind, EPA may want to consider recasting the section in a broader context that presents the historic and new data in a way that informs a key objective of the ISA – to evaluate the scientific developments and determine if changes to the NAAQS may be warranted. To accomplish this, it would be helpful to present a series of graphics that illustrate how a range of plausible blood-air slopes (consistent with the available literature) can be used to understand how alternative (lower) standards may change the blood lead distribution (both the GM and 95th percentile). Figures 1 to 3 below provide such examples, illustrating the potential changes in the GM and 95th percentiles (assuming lognormal distributions with GSD =1.6) if the standard were reduced from 0.15 µg/m3 to 0.10, 0.05, or 0.015 µg/m3. For example, if the standard were reduced to 0.10 µg/m3 (Figure 1), blood-air slopes in the range of 3 to 9 would be expected to shift the distribution down by less than 1 ug/dL for both the GM and 95th percentile. Similarly, if the standard were reduced by an order of magnitude to 0.015 µg/m3 and the slope is expected to be no greater than 7,
21

the GM would be reduced by ≤1 ug/dL and the corresponding 95th percentile would be reduced by ≤2 ug/dL. Presenting these calculations first would frame the discussion of the supporting data as falling within a range that would be expected to yield changes in blood leads within a quantifiable interval.
The CASAC committee discussed the challenge of isolating the relative contribution of air lead to blood lead when lead exposure is a multi-media phenomenon, and the mass contribution of lead in outdoor air contributes in some way to the reservoir of lead in nearly every exposure medium. A few points can be emphasized in the document:
At the relatively low blood lead concentrations under consideration, it is likely that lead in diet contributes a substantially higher fraction of the average daily lead intake than lead in air (even after accounting for fate and transport processes that suggest air Pb contributes some fraction to soil and dust Pb). Present the FDA dietary exposure estimates and show how changes in lead in diet correspond to changes in population parameters of the blood lead distribution. Also present the assumptions in the IEUBK and ALM models regarding relative contributions of diet, water, air, soil, and dust as well as the air-to-dust partitioning assumptions.
The graphical summary of the regression models used to define the blood-air slopes should be accompanied by a more in-depth overview of the information provided: 1) overall variance explained by the models used to derive the slope (e.g., what is the importance of a low coefficient of determination?); 2) range of blood lead concentrations in the empirical study – particulary if it is representative of individuals with relatively high blood lead concentrations; 3) consistency of slope from each new study with comparable studies presented previously (i.e., is the new study within the same range?); 4) relevance of the new slope estimates the key decision points regarding the standard. As noted in the graphics below, these decision points include: a) the change in the GM and 95th percentile blood lead concentrations that are considered significant at the population level; and b) the plausible range of slope factors that could trigger an exceedance of the thresholds established in (a).
While historically, much attention is given to predicted (and measured) blood lead concentrations in the fetus and developing child, older age groups also warrant concern because the association between average air Pb concentrations and health outcomes may be stronger for older age groups, and available studies / empirical data on older age groups can be more directly included in the assessment. Currently, the assessment is restricted by the tools that are publically available. Specifically, the IEUBK and ALM models restrict the assessment to data on children and adults of child-bearing age. A concerted effort to finalize the All Ages Model would break down this barrier and allow for a more comprehensive evaluation of lifetime exposures to be conducted.
22

Fig 1. Change from PbA = 0.15 to 0.10 ug/m3
0.0
0.5
1.0
1.5
2.0
2.5
3.0
0 1 2 3 4 5 6 7 8 9
Slope (change in PbB per 1 ug/m3 change in PbA)
PbB
(ug/
dL)
delta GM PbB delta 95th %ile
GSD = 1.6
Fig 2. Change from PbA = 0.15 to 0.05 ug/m3
0.0
0.5
1.0
1.5
2.0
2.5
3.0
0 1 2 3 4 5 6 7 8 9
Slope (change in PbB per 1 ug/m3 change in PbA)
PbB
(ug/
dL)
delta GM PbB delta 95th %ile
GSD = 1.6
23

Fig 3. Change from PbA = 0.15 to 0.015 ug/m3
0.0
0.5
1.0
1.5
2.0
2.5
3.0
0 1 2 3 4 5 6 7 8 9
Slope (change in PbB per 1 ug/m3 change in PbA)
PbB
(ug/
dL)
delta GM PbB delta 95th %ile
GSD = 1.6
24

Dr. Sean Hays
Comments on Chapter 4 - Exposure, Toxicokinetics, and Biomarkers
Charge Question 4a:
I found chapter 4 to be the chapter that adhered to the ‘what’s new information since previous AQCD’ format better than any of the other chapters. I found this useful. One piece of information that I would like to see is how lead exposures from air compare to lead exposures from other sources. Ideally this would be handled through pie charts or tables and would help the reader to understand the relative contribution that lead in air has on total lead exposure or PbB. And this would ideally be done for a range of PbB and/or exposure scenarios (child living in urban environment, child living near smelter, etc.). This exercise will help the reviewer better assess whether changes in the NAAQS for lead would meaningfully impact PbB among the US population and/or among specific population sub-groups.
Charge Question 4b Biological Markers:
I first could not appreciate how a discussion of lead biomarkers was ‘new information’. However, I can appreciate how a discussion of lead biomarkers and the interplay between lead in blood and bone, and the impact a short duration exposure has on the various dose metrics (concurrent, maximum, integrated, etc.) could be helpful, especially for epidemiologists who don’t appreciate toxicokinetics as much as the PK modelers. I very much liked the figures in section 4.3 showing the lead in blood and bone profiles.
Charge Question 4c – Empirical Modeling:
I found the review of the PbA – PbB relationships to be very helpful. The previous NAAQS relied on empirical models, but only one or two. This more expanded review and discussion is very helpful. It would be best to compare the various slope factors by creating a figure (linear, log or log-linear) that shows the slopes of the various relationships. Each curve should only be shown for the range of air lead concentrations for which the relationship is valid (i.e., the range (or some percentile range) of air concentrations that were included in the underlying study). This will help the reviewer understand which slopes are valid in the air concentration of interest (e.g., 0.1 – 2 ug/m3). Furthermore, there needs to be more transparency with regard to the characteristics of the study for each slope factor, specifically the type of population exposures (ambient urban, phasing out of lead, living near a smelter, etc.) and the sampling type and PM cut-points.
Comments on Chapter 5 - Integrated Health Effects of Lead Exposure
Charge Question 5a & e Modes of Action and Dose-Response:
Modes of ActionChapter 5 did not adhere to the ‘what’s new since last NAAQS’ model. The review of the modes of action is quite thorough. The summary of the mode of action information is quite misleading. In particular, Table 5-2 is misleading. In Table 5-2 all endpoints and modes of action have similar potencies (e.g., ‘lowest level at which MOA observed’). As far as I’m concerned, cancer is not as equally potent for lead as is neurological effects. This issue needs to be fixed.
25

Dose-ResponseI appreciate the dose-response section and the discussion of additional lines of evidence that might support the non-linear dose-response observed in the Lanphear et al. 2005 meta-analysis. The issue of non-linearity in the dose-response for IQ was an important issue in the previous NAAQS deliberations. Having this expanded discussion on supporting evidence is helpful.
26

Dr. Philip Hopke
Comments on Chapter 3 - Ambient Lead: Source to Concentration
Chapter 3 provides a wide range of information to inform the exposure and health sections of the ISA. To what extent are the atmospheric science and air quality analyses presented in chapter 3 clearly conveyed and appropriately characterized? Is the information provided regarding Pb source characteristics, fate and transport of Pb in the environment, Pb monitoring, and spatial and temporal patterns of Pb concentrations in air and non-air media accurate, complete, and relevant to the review of the Pb NAAQS? Does the ISA adequately characterize the available evidence on the relationship between ambient air Pb concentrations and concentrations of Pb in other environmental media?
The chapter provides considerable information but harkens back to the encyclopedic nature of Criteria Documents. It may be overly detailed and certainly does not provide a concise overview of the critical information needed for informing risk assessments and the ultimate policy assessment. It would seem that with the use of some additional appendices, the information could be better summarized and presented in a manner that makes it easier to read and more useful for its ultimate purpose.
There is some discussion of long-range transport of submicron Pb-bearing particles, but there were no analyses of the available data from high elevation rural sites in the Western US to observe if there was any significant Pb transport along with the Asian dust that has been observed. Liu et al. (Liu, W., P. K. Hopke, and R. A. VanCuren, Origins of fine aerosol mass in the western United States using positive matrix factorization, J. Geophys. Res., 108(D23), 4716, doi:10.1029/2003JD003678, 2003) suggested no enrichment in lead at Lassen Volcano or Crater Lake National Parks, but it would be good to discuss the evidence for little or not transported background lead from trans-Pacific sources.
Similarly, the ISA points out a paper describing transport of Saharan dust to Israel where it is suggested that the enrichment in Pb observed in Israel is the result of transport through regions in which leaded fuels are still used. Since we see significant impacts of Saharan dust in the eastern US, it would be useful to analyze the dust episodes (June to August) at CSN and eastern IMPROVE sites to preclude Pb impacts from transported Saharan dust.
The number of PM10/TSP and PM2.5/TSP and even PM2.5/PM10 ratios raise some serious questions about the sampling and analysis methods. The number of PM2.5/PM10 ratios greater than 1 raises a serious question regarding the application of XRF to coarse particle samples. There are no particle-size or loading corrections applied to the PM10 data and it is quite possible that the mass of collected material is attenuating the Pb L X-rays resulting in an underestimation of the Pb in PM10. These data raise continuing questions of basing the determination of speciation data for coarse particles on a difference method and the need for an effective coarse particle speciation sampler.
The TSP data suggests that if we want to continue to look at TSP as an indicator, we need to find an inlet that is not directionally or wind speed sensitive. There is a commercially available unit, but I am unaware of any published characterization of its properties.
In the section in which the relationships with other measured pollutants are explored, the primary tool is Spearman rank correlation. I do not think that such an analysis really tells us much regarding the
27

relationships. This approach will likely be much more subject to meteorological influence. The fact that the concentrations are in the same order, but are not really linearly related as would be shown using a Pearson correlation coefficient provides a false impression of the degree of covariance between Pb and the other pollutants. Given the wide and successful use of factor analysis methods to explore the correlative structure of such data, it is not clear what this section is supposed to tell us since it really is not helpful in source attribution or atmospheric chemistry. Thus, either there should be a change to Pearson coefficients (if there is anything there) or eliminate the section altogether as irrelevant. The current section provides no useful information relevant to setting a NAAQS or understanding the pattern of measured concentrations
Comments on Chapter 4 - Exposure, Toxicokinetics, and Biomarkers
Chapter 4 describes the multimedia nature of Pb exposure, toxicokinetics of Pb in humans, biomarkers of Pb exposure and body burden, as well as models of the relationship between Pb biomarkers and environmental Pb measurements.a. How well do the choice and emphasis of topics provide a useful context for the evaluation of human health effects of Pb in the ISA? Is the current organization of the chapter clear and logical? Are there ways that information on exposure and toxicokinetics can be more clearly integrated throughout the chapter? Does the ISA adequately describe and balance air-related and non-air related pathways of Pb exposure?
This chapter seems to be in reasonably good shape as best I can tell. Given the multiple pathway exposure for lead, it would seem appropriate to have a discussion of exposure models like TRIM. Will there not be an effort to assess the nature of the exposure pathways particularly in areas near major Pb sources? It would seem logical to make TRIM runs to suggest the relative influence of the various exposure pathways as part of the policy assessment and thus, exposure modeling should be discussed. It is said that Pb exposure is hard to assess because of the multiple pathways, but was that not why tools like TRIM were developed? Is this not an appropriate place to try it out?
Specific issues
Several years ago there were considerable problems with lead in toys coming from China, but there seems to be no reference to these problems in Table 4.6. Given that this incident led to substantial action by the CPSC, it should be noted here.
28

Dr. Chris E. Johnson
Comments on Chapter 3 - Ambient Lead: Source to Concentration
Chapter 3 of the ISA document is generally well written. The treatment of Pb sources, characterization of emitted Pb, and fate and transport were informative, relevant, and sufficient. The other sections were more uneven, often relying heavily on very few studies, or presenting data that were confusing or off-target. Further details may be found in my responses to the specific charge questions, and some other review comments that follow.
Specific Charge Questions:
Question: To what extent are the atmospheric science and air quality analyses presented in Chapter 3 clearly conveyed and appropriately characterized? Others on the CASAC are better prepared to answer this question that I am. For my part, as a non-expert in the atmospheric sciences area, I found the information to be generally clearly conveyed and understandable. I do have some concerns about some of the data analyses presented in section 3.5, however. The major concerns are presented here, and a minor concern in the “Additional Review Comments” below.
The data for Pb concentration in air is cobbled together from four networks, which were set up for different purposes. None of them appear to be particularly well suited to the assessment of the level of attainment of the current NAAQS for Pb. Nor does there appear to be an obvious way to use the data from these networks to model, with high confidence, attainment of the NAAQS. This is a serious concern, and needs to be addressed, if not now, by the time of the next NAAQS review.
Section 3.5.3.1 includes a statistical analysis of the AQS data to understand the particle-size distribution of lead-bearing particulate matter. The data appear to be fraught with problems. For example, in several cases, the content of PM2.5 is greater than the total suspended particle content, which is clearly impossible. Similarly, some of the data indicate that the PM2.5 content is greater than the PM10 content, which is also impossible. The document tries to draw some conclusions from these data, but I wonder if this analysis is really productive. Given the concerns that exist in the scientific community about the performance of the high-volume samplers (that are the basis of the Pb-TSP measurement), and the impossible particle-size ratios that come from the data, it might be best to scrap this analysis entirely and use the literature observations (section 3.5.3.2).
Question: Is the information provided regarding Pb source characteristics, fate and transport of Pb in the environment, Pb monitoring, and spatial and temporal patterns of Pb concentrations in air and non-air media accurate, complete, and relevant to the review of the Pb NAAQS?
Chapter 3 of the ISA generally does a good job in the areas of source characterization and the fate and transport of Pb. The material in these sections was, I thought, generally accurate, complete and relevant.
29

The discussion of Pb monitoring suffered some weaknesses related to the ad hoc nature of the monitoring network from which nation-wide data were gathered. This issue was discussed in the previous charge question.
The presentation of Pb monitoring and the spatial and temporal patterns of Pb in air and non-air media was somewhat lacking in the areas of soil, rain, and natural waters.
Soil. The section on soil (3.6.1) focused entirely on urban/suburban soils, smelter-impacted soils, and soils affected by Pb shot. There are good, long-term studies of spatial and temporal variation in trace metals in forest soils as well which could and should be discussed here. One is the Kaste (2006) work, already cited in the chapter. Another is the work of Evans et al. (Evans, G.C., S.A. Norton, I.J. Fernandez, J.S. Kahl, and D. Hanson. 2005. Changes in concentrations of major elements and trace metals in northeastern US-Canadian sub-alpine forest floors. Water Air Soil Pollut. 163:245–267).
Rain. The only recent information cited in section 3.6.3 are from studies in Canada and Europe. Are there truly no recent data on the spatial and/or temporal changes in precipitation Pb concentrations from monitoring in the United States?
Natural Waters. The section on natural waters is exclusively about one study in Ontario, Canada. Is no one in the United States monitoring Pb concentrations in streams and rivers? Is no one looking at lakes?
Question: Does the ISA adequately characterize the available evidence on the relationship between ambient air Pb concentrations and concentrations of Pb in other environmental media?
The ISA does not adequately address the relationship between ambient air Pb and concentrations in other media. Having said that, one must admit that with the possible exception of precipitation, such relationships are nearly impossible to develop. This issue, perhaps more than any other, confounds efforts to develop a secondary, welfare-based standard for Pb. One exception to this criticism is the discussion in section 3.6.1 on the relationship between Pb-TSP and soil Pb in a study near El Paso, TX.
Additional Review Comments:
3-25, lines 12-31: One factor that should be discussed in this paragraph about wet deposition is the pH of the rain. Large reductions in sulfur emissions have resulted in steadily increasing precipitation pH, especially in the Midwest and Northeast, which experienced chronic acid rain for decades. Presumably, increasing pH in water vapor will reduce Pb solubility and therefore affect wet deposition.
3-28, lines 7-9: This sentence contains and incomplete thought – “…concentrations in surface waters are highest near sources of pollution before substantial Pb by flushing, evaporation and sedimentation.”
3-39, line 33 to 3-40, line 1: “This was likely due to the presence of organic-bound colloids smaller than 0,45 um rather than true Pb dissolution.” Is this a hypothesis, or is there evidence for these “dissolved” colloids?
3-34, line 24: Some words are missing from this sentence.
30

3-37, lines 29-30: “The generally high dissolved Pb stores and high stream water DOC concentrations.” is an incomplete sentence.
3-38, lines 27-28: “…anthropogenic acidification of upland waters is likely to continue due to nitrogen leaching from the surrounding catchment…” This is highly debatable, especially in areas of the United States which are demonstrating recovery of surface water pH and alkalinity after decades of elevated acid rain.
3-73, lines 24-27: Do the data really support the generalizations made here about seasonal patterns? Looking at Figure 3-19, it looks to me like the seasonal pattern isSpring > Fall> Summer > WinterHave appropriate statistical tests been carried out to “prove” this pattern?
3-88, Table 3-9: Is this table complete? Some lines have no Min, Med, or Max (see for example Chicago 2008 and 1987).
3-90, Figure 3-27: The figure legend should indicate what the numbers in the map itself represent. I would guess that they are the number of samples collected in each neighborhood zone?
Comments on Chapter 7 - Ecological Effects of Lead
In reviewing Chapter 7 of the Draft Integrated Science Assessment for Lead, and reflecting on the charge questions, I focused most my attention on the areas of terrestrial systems and ecosystems-level issues. Chapter 7 of the ISA document is extremely well written, especially the sections on terrestrial systems. Summaries of relevant studies are deftly written and informative, without being overly long.
This chapter of the ISA pretty religiously restricted itself to literature published since the 2006 Air Quality Criteria Document (AQCD), and there is a lot to cover. There is almost no mention of data published before 2005, aside from comments that the recent literature confirms and expands on conclusions made in the 2006 AQCD. Presumably, this means that the authors found no reasons to re-interpret the older literature. For the most part I would agree, with exceptions noted later in these remarks.
It was sobering to see how much of the literature discussed in Chapter 7 was not done in the United States. Even European studies seem to be getting rarer. The review was heavily dependent on work done in south Asia (i.e. India) and southeastern Asia (i.e. China). This probably reflects growing concerns in those areas about metal pollution, and (generally) declining concerns in North America.
Specific Charge Questions:
Question: Effects on terrestrial and aquatic ecosystems are first considered separately. They are then integrated by classes of endpoints (bioaccumulation, growth, mortality, hematological effects, development and reproduction, neurobehavior, community and ecosystem effects). Does the panel consider this approach appropriate?
31

There is no perfect way to organize an integrated assessment of effects in complex systems. This seems to me to be a reasonable way to construct the assessment.
Question: Is it appropriate to derive a causal determination for bioaccumulation as it affects ecosystem services?
This is a tricky issue because bioaccumulation is at once an “effect” and a regulating ecosystem service. The mussels that accumulate Pb, for example, provide a valuable service to coastal and estuarine ecosystems, perhaps to their own detriment and the detriment of their predators. Counter-intuitively, the value of this service actually increases with increased Pb loading. This goes against the spirit of the risk assessment being attempted here, and I would suggest that it is not appropriate.
Question: Has the ISA adequately characterized the available information on the relationship between Pb exposure and effects on individual organisms and ecosystems, as well the range of exposure concentrations for the specific endpoints?
This is an impossible question to answer. The literature on terrestrial effects is not deep, and I was very pleasantly surprised at the ability of the authors to uncover relevant studies in the global scientific literature. It is certainly possible that they missed some valuable studies, but I am not aware of them.
Question: Are there subject areas that should be added, expanded upon, shortened or removed?
The ISA treats terrestrial and aquatic ecosystems separately. This editorial decision is expedient for a number of reasons, and I would not suggest changing it. However, one casualty of this approach is that the linkage between the two is lost. Loadings to aquatic ecosystems, especially freshwater systems, are primarily derived from the runoff of terrestrial systems. There is no discussion in Chapter 7 of the ISA of watershed processes as they influence aquatic systems. This is, in my view, a key omission.
Question: If the ISA was expanded to consider dose-response in terrestrial systems, should we limit data to field soils?
Given the clear effect of “aging” on the biological cycling of Pb in terrestrial ecosystems, it would probably be best to limit such an analysis to field soils. However, if the literature is not deep enough to come to any conclusions based on field soils alone, it may be necessary to use results from artificial soils (i.e., growth media).
Question: If the ISA were expanded to consider dose-response in aquatic systems, how might we most efficiently present toxicity data that varies greatly by organism, and environmental parameters that influence bioavailability (pH, dissolved organic carbon etc.)?
The effects sub-sections of the aquatic ecosystems section of Chapter 7 are already organized by major organism type (plants, invertebrates, vertebrates). The vertebrates sections are further divided into fish, mammals, etc. If the decision is made to include dose-response studies, emphasis should be placed on studies showing effects at the lowest levels, with some statistical tools (e.g., histograms, box plots) used to characterize overall variability.
32

Additional Review Comments:
7-9, lines 22-23: “…Pb adsorption to sandy loam clay was a function of both (1) Fe and Mn oxide interactions…” This is ambiguous. Interactions between what and what?
7-10, lines 3-4: This final sentence stands in stark contrast to pre-2005 literature on Pb in forest soils, which demonstrated that in virtually all studies the exchangeable Pb was a very small fraction of total soil Pb.
7-10, lines 23-25: What is the “humified bottom layer”? Also, the contrast set up by “whereas” isn’t really a logical contrast, from a soils perspective. This should be clarified.
7-11, lines 7-8: “…with aging defined primarily as leaching following initial influx, but also as binding and complexation.” This is not a sufficient or satisfactory definition of “aging.” Leaching is a physical process, binding and complexation are chemical processes. Pb in soils subjected to these processes is not “aged” but rather is undergoing physic-chemical transformation to new fractionation.
7-14, lines 11-12: It would be useful to know how Klaminder et al. (2005) measured “direct adsorption” from the atmosphere.
7-14, lines 16-21: “…correlated with Pb in the litter layer, where Pb comes from atmospheric deposition…” Pb in litter may be derived from geological sources, and returned to the soil through recycling. Also, in most forests, the litter layer and the fermented layer below are active rooting zones, possible sources of Pb uptake.
7-15, lines16-22: If spruce is not a reliable species for metal dendrochronology (discussed on pp. 7-14 and 7-15), then can these results be trusted?
7-16, lines 20-22: The final sentence of this section is important and should be emphasized earlier, and in summary sections of the chapter. Cycling of Pb in forest vegetation is very minimal in a wide range of ecosystem types.
7-21, lines 27-29: Based on the Coeurdassier et al. (2007) study, it would appear that snails increase Pb bioavailability.
7-25, Table 7-2: Is it possible to assess, semi-quantitatively at least, the confidence level for a hypothesis that the bioaccumulation factor for terrestrial species is less than 1?
7-29, lines 7-10: The lack of a response in soils spiked with smelter ash indicates that the added Pb must be in a soluble form to affect growth.
7-34, lines 7-8: “…mean nestling mortality was 2.5 and 1.7 higher…” This doesn’t make sense. First, should this be “2.5 and 1.7 times higher…”? Second, why are there two numbers for only one contrast (after vs. before)? Please clarify.
33
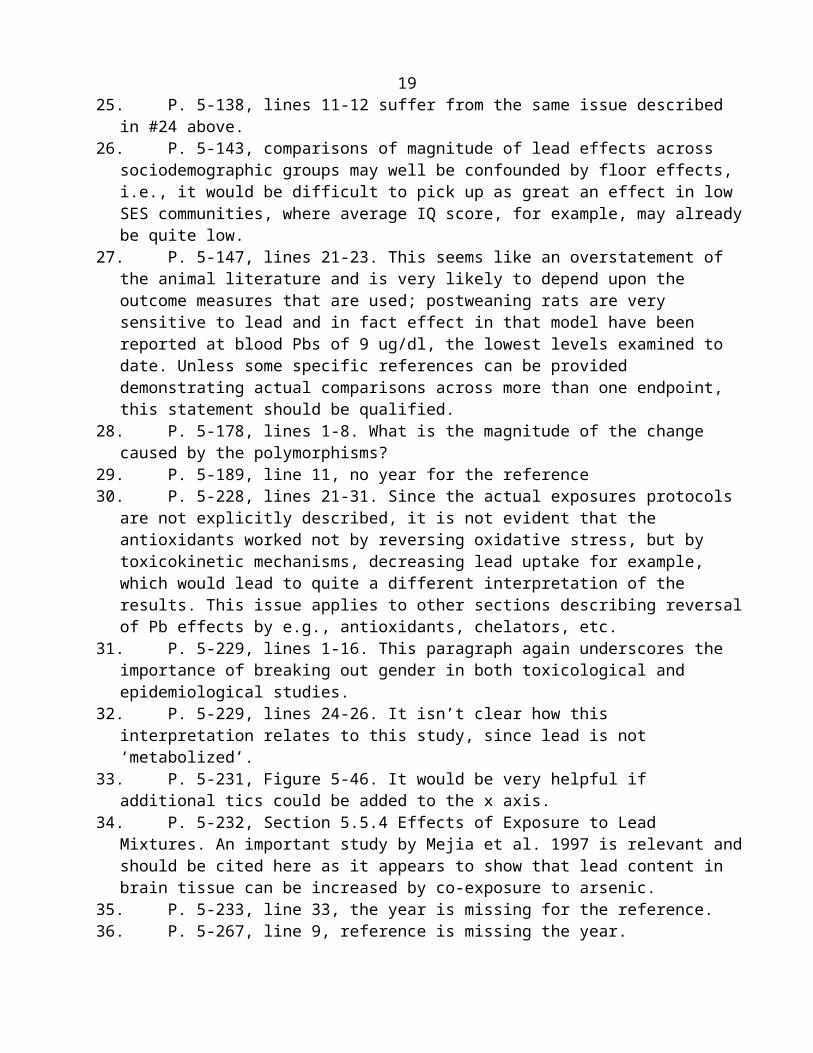
7-36, lines 8-14: No effect with spiked soils, but an effect with soil leachate. Once again, the importance of soluble Pb.
7-39, lines 4-8: Soil microbial activity declined for two weeks, then recovered. Is this adaptive behavior, or a change in community structure?
7-40, lines 16-18: “…exposure…can alter the structure of soil decomposer communities, which could in turn decrease decomposition rates.” I do not see the evidence for making the connection between structure and function here.
7-41 to 7-42, section 7.2.7.: The section on critical loads is disappointing. After the second paragraph, it does not deal with critical loads. The message seems to be that we lack too much critical information to compute critical loads adequately. This section needs to review the major components of critical loads estimation and discuss where we have good information, and where we lack good information.
7-43, lines 2-4: Given the many studies highlighted in this ISA, should the Pb Eco-SSLs be updated?
7-45, lines 1-3: Afforestation of agricultural land normally leads to organic matter accumulation over time. Thus, “old fields” would appear to be low vulnerability ecosystems.
7-48, lines 10-12: The evidence in this ISA would seem to be quite clear that Pb is attenuated in terrestrial food webs. I think that the document could be much more forceful than “…no consistent evidence of trophic magnification was found.”
7-61, lines 11-13: Units must be wrong here. 145 ug Pb/mg would be 14.5% Pb!
7-61, line 29: “…exposed to water concentrations of up to 100 umol Pb…” Presumably this is umol per liter.7-65, lines 14-18, Table 7-3: The BCFs in the previous AQCD were much, much higher than (most) of the BCFs in Table 7-3. What explains the sudden drop in reported bioaccumulation? A re-assessment of the pre-2005 studies would seem to be in order.
7-98, line 26: There is no context for “study sites 2 and 3.”
7-101, lines 31-33, Section 7.3.7.: As with the terrestrial section, the half-hearted attempt to look at critical loads is highly disappointing. Even if no studies have been published, it would be useful for EPA to know the state of the science. What information do we have and what do we lack for the construction of critical loads models for aquatic systems?
7-110, lines 1-7: The aquatic effects section of Chapter 7 has waffled on the issue of Pb transfer up the food chain. The data presented in this ISA for aquatic fauna seem to indicate that Pb is transferred up the food chain pretty well.
Section 7.4: On the whole I would agree with the causality determinations presented in this section of the ISA. The one exception is section 7.4.1. (“…there is a causal relationship between Pb exposures and bioaccumulation of Pb that affects ecosystem services associated with terrestrial and aquatic biota.”) First, I don’t think that the case has been made for a causal relationship between Pb exposures and
34

bioaccumulation in terrestrial systems. Second, I would not agree that there is evidence that any such bioaccumulation has had a substantial impact on ecosystem services.
35

Dr. Susan Korrick
Charge Question 2:
Is this a useful and effective summary presentation?
Generally, yes.
Is the framework for causal determination appropriately applied?
Causal determination framework seems reasonable.
Comment on approaches that may improve the communication of key ISA findings to varied audiences. Comment on the approach used (integrating scientific evidence across disciplines of health and ecology); e.g., is this a useful and effective integration of scientific evidence?
Application of mechanistic studies (from in vitro and animal experimentation) to ecologic outcomes optimizes the use of available data which is commendable. As a number of biological processes relevant to Pb toxicity are well conserved across human systems, ecologic systems, and experimental animal models, integrating across disciplines makes sense as it can address at least some data gaps and uncertainties that would be present if only one discipline was assessed in isolation.
Page-specific comments:
Page 2-11, lines 17-21: The logic behind an apparent differential relationship of blood vs. cumulative (bone?) Pb measures and neurocognitive outcomes in adults is unclear to me in the following text: “Studies of adults without occupational Pb exposure have not provided consistent evidence for associations between blood Pb and…neurological effects…[as] cognitive reserve may compensate for the effects of Pb…Compensatory mechanisms may become less effective with increasing age, explaining the consistent associations between measures of cumulative Pb exposure and neurocognitive deficits.” It seems as if bone Pb is being equated with older age; although age and bone Pb are correlated, both blood and bone Pb measures can be obtained in both young and elderly adults. This statement needs substantial clarification.
Page 2-13, Fig 2-1: What’s the blood Pb at which decreased neurite outgrowth is seen in rodents?
Page 2-15, lines 3-4: “…concentration-response relationships of blood Pb with BP or mortality….information is inconclusive (Section 2.8.2)” Does this refer to uncertainty about the shape of the dose-response (e.g., linear vs. non-linear) or uncertainty about the general association? It seems to imply the latter but I believe intends the former. This needs clarification.
Page 2-16, lines 6-7: Prospective studies are key evidence against reverse causality as an explanation for observed Pb-renal function associations. Creatinine can be ‘normal’ even in the context of declining renal function; observing consistent Pb effects on renal function across a range of creatinine values is therefore not the most robust way to rule out reverse causality.
36

Page 2-26, table 2-3: Delayed puberty is a health outcome in children, not adults. Why does decreased hematocrit occur at 30 mcg/dL vs. decreased hemoglobin at 10 mcg/dL? If hemoglobin is decreased, so is hematocrit and vice versa.
Page 2-42, table 2-5: Childhood growth is covered in the human health review in Chapter 5 (e.g., page 5-344) and should be included in this table as an important and basic health measure.
Charge Question 4b:
How well does Section 4.3 reflect the current state of knowledge of Pb biomarkers and their interpretation as it relates to exposure and dose?
The section reflects current knowledge. However, see page-specific comments for areas that could be expanded or clarified.
Is the focus on blood Pb and bone Pb appropriate, given that the epidemiologic literature largely assesses exposure through these two biomarkers?
This focus is appropriate.
Is there sufficient and accurate discussion of the relationship between blood Pb and bone Pb? Are relationships between blood Pb and Pb in soft tissues and urine Pb adequately described?
Section 4.3 relies heavily on the ICRP Pb biokinetics model to demonstrate relationships among biomarkers of Pb exposure under different exposure scenarios and at different ages. This is useful for demonstrating the theoretical kinetic differences between, and relationships among, bone and blood/soft tissue compartments. However, an explicit discussion of the context in which these models are useful, and their limitations, would be helpful. As an extension of this point, a better explanation of model assumptions is needed. E.g., does Pb decrease to 0 at the end of the exposure period? What are the assumptions that result in no net increase in blood Pb after a 3-year constant Pb exposure despite a net increase in bone Pb? Based on observational epidemiology data, once relatively long-term Pb exposure ends, blood Pb increases above the baseline as bone and blood reach a new equilibrium. In addition to better explaining the utility and assumptions behind these theoretical descriptors, more empiric information about the relationship among markers (e.g., estimated correlations, prediction models, half-lives, etc.) from epidemiologic studies of non-occupationally exposed populations, including children and adult men and women would be useful. E.g., see: Nie et al., J Occup Environ Med 2009;51:848-57; Korrick et al., Am J Epidemiol 2002;156:335-43 ; Kim et al., Am J Epidemiol 1997;146:586-91. Lastly, although reviewed in the previous AQCD, a summary of the limitations of Pb biomarkers, such as the reproducibility of bone Pb and sources of measurement error for bone Pb, would be useful to the subsequent interpretation of literature using such biomarkers (see page-specific comment 4-35, lines 11-12 below).
Page-specific comments:
Page 4-35, lines 3-4: The patella may be preferred over the calcaneous as a trabecular bone site but the tibia has advantages over both in terms of likely measurement error and is the most commonly used bone Pb measurement site in the literature.
37
Page 4-35, lines 5-9: The mix of technologies described for measuring bone Pb seem to include both non-invasive in vivo measures like XRF but also ex-vivo chemical measures. Making this distinction explicit would be helpful since the use of non-invasive in vivo measures is applicable to most epidemiologic (human health) studies. Page 4-35, lines 11-12: Although it is not necessary to repeat detailed information on precision, accuracy, and variability in bone Pb reviewed in the 2006 Pb AQCD, summarizing the data here would be useful especially as this technology can have relatively poor reproducibility especially in populations with lower bone Pb content or low bone density (For example, Hoppin et al., Environ Health Perspect 2000;108:239-42; Hoppin et al., Environ Health Perspect 1995;103:78-83).
Page 4-35, lines 20-23: An important consequence (not mentioned here) of expressing bone Pb measures relative to bone mineral content is that lower bone mineral density is associated with greater measurement uncertainty in bone Pb. This can have important implications for studies in older women for whom low bone mineral density is more common than in other populations including men and younger adults.
Page 4-50, lines 10-11: I think it’s important to acknowledge that the NAS is an all male cohort; the relationship of bone Pb with blood Pb can be very different in women, especially across an age range that includes menopause.
Page 4-50, lines 32-33: If applicable, the increased calcium demands of lactation (relative to pregnancy) may explain the significantly greater %change in blood Pb observed post pregnancy vs. in the 2nd/3rd trimesters. Page 4-54, lines 4-5: I do not understand the logic behind the simulation showing slower brain Pb accumulation in children. Perhaps this is because I do not have toxicokinetic expertise. To make the document accessible to a wider audience, this should be clarified.
Charge Question 5d:
What are the views of the panel on the integration of epidemiologic and toxicologic evidence, in particular, on the balance of emphasis placed on each discipline? And on the accuracy with which the evidence is presented? Considering the Pb exposure concentrations and durations in toxicological studies and the potential for confounding in epidemiologic studies, please comment on the conclusions drawn about the coherence of the evidence and biological plausibility.
General comments:
Chapter 5 provides a comprehensive review of the human epidemiologic and toxicologic evidence of lead’s health effects with the addition of studies published since the last AQCD (January 2006 forward). The Chapter is organized by health outcome with human and related toxicologic studies for a given outcome presented in tandem. The approach generally works well and, depending on the health outcome, there is more or less emphasis on epidemiologic vs. toxicologic evidence. However, the Chapter was inconsistent in its approach to causal inference and would benefit from a clear and explicit plan for weight of evidence assessment and then consistent application of the plan to each health outcome. For some sections of the review, the encyclopedic nature of the research summaries fails to
38

provide the reader with any perspective or prioritization of data vis-à-vis its quality. For example, some studies have more robust designs than others but this distinction is not always made clear. Similarly, numbers of epidemiologic studies on a topic are often enumerated but without commenting on their relative value. Oftentimes there is an appearance of multiple studies on a topic when, in fact, studies represent slight variants on analyses in the same population such as NHANES or the Normative Aging Study (NAS). In these cases, most information on a particular topic may actually be coming from a relatively limited set of study populations. This is generally not discussed or acknowledged but should be.
The juxtaposition of epidemiologic and toxicologic data on a given health outcome is useful but often the two data streams are not well integrated. For example, section 5.3 reviews Neurological Effects. The epidemiologic review focuses on enumerating effect estimates associating biomarkers of Pb exposure with specific neurologic outcomes ranging from childhood IQ and behavior to neurodegenerative disease in the elderly. But for studies relating to childhood cognition and behavior, e.g., the toxicologic evidence does not review complementary (where relevant) effect estimates in animal models. Instead, the emphasis is on the interaction between Pb exposure and stress in animal models. This provides a reasonable basis for discussion about mechanisms whereby Pb might affect neuropsychological functions but means there is minimal direct overlap with the epidemiologic review. Although Figure 5-29 provides some dose-response comparisons between animal and human data, toxicologic studies described in the text, tables, and other figures are often not directly analogous to the human studies described.
Admittedly, the lack of animal data that more directly parallels human data is, at least in part, a consequence of differences in study design (and necessary differences in outcomes) between the epidemiologic and toxicologic literature. Given these differences, providing additional synthesis (beyond Figure 5-29) of the two information streams would be helpful. E.g., a table listing neurobehavioral outcomes studied in humans and, where applicable, their animal analogue with an indication of the general pattern of Pb associations observed in the two disciplines would be useful.
Also, the integration between the two disciplines would benefit from summary statements discussing: (1) exposure dose (level and chronicity) comparability between animal and human studies; (2) the dose-response relationship in animal models (e.g., is there a threshold?). This is discussed in the “Neurological Effects” section as its own topic (p. 5-139 to 146) but not integrated into the description of specific studies; (3) animal exposure route (oral, iv, ip, etc.) and its implications for relevance of toxicological studies to human exposures; (4) choice of Pb form for animal dosing (Pb acetate, Pb chromate, Pb nitrate, or Pb chloride, e.g.). This is important in a number of ways to interpretation of findings (as happens in carcinogenicity studies where Pb chromate was used and findings attributable to Cr but not Pb could be discerned); and (5) specific outcomes that are roughly comparable between animal models and human studies. Otherwise, there is minimal discussion of issues of exposure comparability between human and animal studies and how this may, or may not, impact the integration of information from the two fields. Although the animal studies often have discrete dosing regimens that make it difficult to assess thresholds, where possible, noting threshold for effects, where relevant, would be helpful to integrating the two data sources and applying results for risk assessment.
In addition to generally higher exposures (higher blood Pb levels) in animal models compared with contemporary U.S. population levels, there are also differences in the route of exposure which may be particularly important to consideration of population Pb exposure from air pollution which likely
39

involves multiple pathways. Acknowledgement of this issue is lacking. Similarly, discussion of studies with exposure routes unrelated to human circumstances (studies in which Pb is injected directly into the hippocampus of an animal – e.g., page 5-76, Jett et al., 1997 or Pb is administered via intraperitoneal (IP) bolus, page 5-110, lines 4-5) should be done with caveats regarding generalizeability to humans. In mechanistic study reviews, acknowledgement of potential differences between in vitro and in vivo mechanisms would be useful. E.g., the Cardiovascular Effects section seems to assume that in vitro mechanistic studies are applicable to the in vivo setting but, where in vivo and in vitro study findings are in conflict, does not acknowledge that the difference in study type can result in apparently conflicting results (e.g., page 5-182, lines 12-20).
The Chapter (and its conclusions) would benefit from more consistent attention to potential thresholds for effect. E.g., for outcomes with mixed findings in the literature, careful consideration of sources of variability across epidemiologic studies is often not reviewed. In some cases, this variability may, at least in part, relate to Pb dose, e.g., adverse Pb effects are evident at higher rather than lower Pb levels. Depending on the outcome, this issue is, at best, incompletely considered in the Chapter.
Also, introducing each health outcome with a brief (1-2 sentence) summary of the state-of-the-art conclusions as of the 2006 AQCD would be helpful. Then the new literature would build on this. This approach is applied in some sections but not all in the Chapter.
Additional issues for Neurological Effects: (1) emphasis on stress/Pb interactions in animal toxicologic literature raises issue of how stress of animal handling (for purposes of neurocognitive/neurobehavioral assessments) may be impacting demonstrated Pb associations in animal models. Although handling stress is mentioned, its role as a modifier of experimental systems is not. (2) how to interpret findings for areas with primarily animal data and ~no human data (e.g., vision effects?) where animal models generally have relatively high exposure (e.g., blood Pb 25 mcg/dL). (3) how to interpret findings with supportive mechanistic toxicologic data but inconclusive or null human studies (e.g., Pb related neuronal plaque formation in prenatally exposed animals vs. AD in aging humans). (4) how to identify meaningful susceptibility factors (sex perhaps more consistent in animal models, genotypes inconsistent findings for ALAD & VDR, e.g.).
Issues for Cardiovascular Effects: the data for non-BP-related CVD outcomes is limited and largely based on either NHANES or NAS (men only). Some acknowledgement of the limited variation in study populations would be useful.
Issues for Immune System Effects: This section lacked clarity regarding a weight of evidence approach to inference. For a number of immune parameters, conclusions regarding Pb’s potential impact are often primarily based on toxicologic data (animal and in vitro studies) and heavily exposed occupational populations. Some of the occupational studies are limited by lack of adjustment for confounding (including failure to account for co-occurring occupational exposures) and lack of a biomarker of Pb exposure to assess effects. For many immune parameters, there are relatively limited data (and often inconsistent or subgroup-dependent findings) in Pb-exposed general population samples for this topic. As a consequence, concluding that there is coherence among epidemiologic and toxicologic data seems over-stated for a number of immune measures reviewed. Given this context, the potential ‘causal’ relationship of low-level Pb exposure with most indices of immune function in the general population is difficult to address with certainty. However, the section does not adequately account for these data limitations and uncertainties in its summary statements.
40

Page-specific comments:
Throughout: There are a number of tables/figures in which the footnotes appear to be mis-labeled.
Page 5-44, lines 2-5: in describing the relation of Pb with neuroimaging, references are summarized as showing “…associations of childhood blood Pb levels with decreased neuronal density and neuronal loss measured in adulthood, as assessed by magnetic resonance imaging techniques…”. One of the referenced studies is a case-control assessment of 9-13-year-olds, another is a case report in a young boy and thus these do not address adult outcomes. Furthermore, two of the referenced studies used functional MRI to measure regional neuronal activity and lateralization of activity which is not the same as either neuronal density or loss but is an important phenomenon in understanding Pb effects on neuroanatomical functional correlates. The summary text does not appear to accurately describe what it references.
Page 5-48-49, figure 5-2, table 5-3: What do Baghurst exposure measures mean (21.7 (25-50%))? In table 5-3, 25-50% is given as 17. 4 (vs. 50-75% is 21.7)? Are there no exposure measures available (‘NR’) for Dietrich 1993 and Ris 2004? It seems footnotes a and b are reversed?
Page 5-51, figure 5-3: the original manuscript being referenced is inconsistent on this point but it seems the Mn threshold should be in units of mcg/L so the cut point would be 1.4 mcg/dL rather than 14 mcg/dL; similarly, the blood Pb concentrations are log transformed (it would be helpful to say so in the figure).
Page 5-77, lines 1-2: the statement that ‘Deficits in working memory are thought to underlie associations between blood Pb levels and ADHD in humans’ is an unfamiliar concept to this reader. Unless there is a reference to support this statement, it should be deleted.
Page 5-76, lines 19-20: it is unclear what ‘new study’ is being referred to as the apparent reference is from 1997.
Throughout the “Neurologic Effects” section, table and figure footnotes have errors in them and some of the figure graphic symbols are incorrect (e.g. wrong color coding for exposure periods).
Also, it is common throughout this section for associations to be described without indicating the direction of effect, direction needs to be consistently indicated, e.g.:
Page 5-77, line 8: “…early life Pb…contributes to response inhibition…” – does this mean that it contributes to impaired response inhibition?
Page 5-101, lines 2-3: “They found positive associations, suggesting that blood Pb…may have an independent effect on behavior.” Because higher scores on behavioral indices typically indicate worse behavior, making this explicit would be useful, e.g., by adding, “may have an independent adverse effect on behavior”.
41

Page 5-105, lines 8-9: “…DRD4.7 also has been associated with sustained attention, response inhibition, and quicker response time…” Shouldn’t this be “…DRD4.7 also has been associated with better sustained attention, better response inhibition, and quicker response time”?
Page 5-109: lines 33+: How does rodent performance on the rotarod (endurance, balance & coordination measure) relate to human neurobehavior?
Page 5-122, line 2: PD should be ET?
Page 5-147, lines 22-31: This is a recurring theme mentioned in the Neurological Effects section that for animals in utero/early postnatal period is the most sensitive for Pb-related neurologic effects but that stronger effect estimates are generally observed for concurrent blood Pb in epidemiologic studies of children. Can this observation be related to mechanistic issues and dose-response relationships?
Page 5-167, Figure 5-33: where’s the “arrow line”?
Page 5-177, lines 10-11: discussion of heart rate variability (HRV) is important but out of place in this section otherwise entirely devoted to BP and hypertension. Should be placed in the following paragraph (page 5-178).
Page 5-191, lines 1-2: Weisskopf (2009) null blood Pb relationship with mortality “could have been affected if the majority of the hypothesized non-linear effect was contained…in the…(reference) blood Pb tertile” Is this referring to an hypothesized ‘superlinear’ dose-response between Pb and mortality? Needs to be clearer.
Page 5-197, line 9: 5th-9th percentile should be 5th -95th
Page 5-248, table 5-23: Blood Pb levels presented for occupational exposures are not clearly labeled. E.g., Mishra et al (2010), presumably “132 (103)” refer to the mean (SD) but this is not specified anywhere. Similarly, for Yucesoy et al. (1997b), e.g., “59.4, 58.4” presumably refers to the 2 different Pb exposed workers assessed but, again, that’s not clear in the table. And it looks as if Fischbein et al. (1993) firearms instructors blood Pb’s are mislabeled – should ≥15 be ≥25? Of note, levels in Mishra et al (2010) are clearly out of range for current non-occupationally exposed populations.
Page 5-274, lines 21+: This section seems too speculative re. the implications of biomarker findings on “immune-based disease”; more careful qualification is needed as per the subsequent discussion on page 5-275, lines 4-7.
Page 5-296: Results for Change et al. 2006, reported in the Table 5-27, is OR for ‘fertility’ or ‘infertility’?
Page 5-298, lines 3-4: More information about potential sources, if any, of differences across infertility studies would be useful here. E.g., it appears dose may play a role; that is, there is a more consistent association of Pb with infertility at higher Pb doses. Some discussion of this issue would be relevant here. Some Pb-associated health effects may have dose-response thresholds and this is important to consider throughout Chapter 5.
42

Pages 5-298 to 5-299, Table 5-28: Essentially all of the epidemiologic studies discussed here are cross-sectional. Some discussion of how this may impact the integration of epidemiologic findings with animal model findings (in which primarily prenatal/early postnatal exposures are assessed) is important to better integrating findings across these two disciplines.
Page 5-312: Some inconsistencies regarding relations of Pb with hormone levels in epidemiologic literature may relate to dose and cohorts studied (e.g., low dose vs. occupationally exposed). This distinction is relevant to the discussion of mixed outcomes in the literature but is not mentioned (lines 11-12).
Page 5-318 (birth defects): This is an example of incomplete consideration of exposure in comparing and integrating results among studies. E.g., the two studies cited from the 2006 AQCD demonstrating possible associations between parental Pb exposure and neural tube defects assessed exposure via drinking water or occupation, respectively. Neither had a biomarker of exposure and, in both cases, uncontrolled confounding may have played a role in any observed associations (e.g., other risk factors may have varied by household location and or by occupation). It’s not clear from the discussion that the lack of an evident association of Pb with neural tube defects in more recent literature (in which direct biomarkers of exposure were used) is at odds with the earlier studies given their design limitations.
Page 5-321: The same issue applies here as was mentioned previously -- inconsistency among findings across studies of Pb and preterm birth may, in part, be related to thresholds for effect. Consideration of this issue would be helpful to conclusions; e.g., adverse associations may be more consistent among more exposed populations.
Page 5-324, Table 5-36: Zentner et al (2006) reference is confusing. The results presented in the table are based on blood Pb as the outcome, not birth weight and length which are used to predict blood Pb. This should be made clear. Page 5-326, line 9: “Inverse relationship” doesn’t make sense based on description of findings associating increasing Pb exposure with heavier weight; term should be “positive relationship”.
Page 5-327, lines 20-21: In this study of rats, the 5-month exposure was before pregnancy, not during gestation. The current wording is very confusing. (This same study is discussed again on page 5-336).
Page 5-328, line 15: Seems to be missing punctuation? Needs a period between retina and Pb-exposure?
Page 5-328, line 26: Needs a comma between birth defects and spontaneous abortion.
Page 5-330, lines 9-13: Including ecologic literature is of interest but seems out-of-place as this may be the only instance in Chapter 5 where such literature is referenced. Is this because there is no relevant ecologic literature for other sections of the Chapter?
Pages 5-331-332: Both studies cited as providing evidence of associations of occupational Pb exposure with decrements in liver function and markers of oxidative stress (Patil et al., 2007 & Kahn et al., 2008) did not account for the possibility that other occupational exposures may have been important to observed associations. It is probably no coincidence that elevated liver enzymes were seen among spray painters but not other Pb exposed occupations despite the other occupational groups having higher Pb
43

levels (Patil et al., 2007). Painters are likely exposured to known hepatotoxins (e.g., solvents). There is no discussion/mention of the possibility of uncontrolled confounding by other occupational exposures in this section. This makes it difficult, if not impossible, to accurately interpret the reported findings.
Page 5-336: It is somewhat confusing that toxicologic data re. gestational Pb exposure’s possible hepatoxicities is presented both here and as an example of “developmental effects of Pb” a few pages before. The distinction seems somewhat arbitrary. E.g., prenatal Pb exposure’s neurotoxcity is not mentioned under “developmental effects”. How is “developmental effects” defined for this document (as compared to organ or organ-system specific effects)?
Page 5-348, line 8: Another example of the possibility that uncontrolled confounding by other exposures (association of Pb with TSH among contaminated fish eaters with organochlorine and mercury exposure) may affect reported associations. Again, would be useful to include such limitations in the review.
Page 5-348, line 22: Presumably meant to say ‘osteoporosis-related fractures” not falls?
Page 5-349, Cancer: Throughout this section, there is inconsistent acknowledgement of limitations of study design. E.g., occupational cohort studies lacking biomarkers of exposure and lacking adjustment for potential confounding by other occupational exposures should be clearly identified as having substantial limitations that impact inferences.
Page 5-361 to 5-362 (Chromosomal Aberrations): This is another example of the above issue. Here the relevance of toxicologic studies using PbCrO4 is unclear since Cr may have similar effects to those being assessed. It’s unclear whether these studies contribute meaningfully to this review. At a minimum, a more explicit discussion of the limitations of such studies to understanding Pb effects is needed as the studies are reviewed (Cr concerns are mentioned under Mechanisms of Action section, page 5-365 and in the Summary, pages 5-368 to 5-369). PbCrO4 is used in other studies in the Cancer section.
Page 5-367 (Epigenetics): Some discussion of the predictive/mechanistic relevance of global measures of DNA methylation in blood vis-à-vis cancer risk would be useful here. This is a relatively new area, DNA methylation in blood may not reflect levels in other tissues, e.g., so its relevance to non-hematologic malignancy risk may be limited.
44

Dr. Michael Kosnett
The following are my comments on the draft Integrated Science Assessment for Lead (May 2011) prepared following the CASAC Lead Review Panel meeting of July 2011.
The discussion in Chapter 1 of the criteria used to consider studies for review and analysis in the ISA is reasonable. Studies of subjects who have blood lead concentrations within one order of magnitude of the general US population equates to cohorts with blood lead concentrations approximately less than 40 µg/dL. This is appropriate for a document intended to focus on risks associated with environmental rather than occupational lead exposure. With respect to human epidemiology, it appears that these criteria has been consistently and appropriately applied. However, as discussed further below, the ISA included many toxicological studies that employed lead dosages far higher than those relevant to low level human exposure to lead from environmental sources. The HERO system functioned well as a means to retrieve studies that were cited in the document.
In chapter 2, a summary statement on lead biomarkers appearing on page 2-8, line 22 read, “Blood lead in adults is typically more an index of recent exposures than body burden.” In my opinion, as a general finding, this statement is incorrect and should be revised. For example, in many of the important cohort studies of middle-aged to elderly adults used to assess the impact of lead exposure on cardiovascular and cognitive function (e.g. the Normative Aging Study [NAS], or the Baltimore Memory Study [BMS]) the mean and median blood lead concentration was approximately 5 µg/dL. This was 3 to 4 fold higher than the median or mean blood lead concentration of the overall US population, and more than 4 fold higher than the median or mean blood lead concentration of teenagers. Teenagers have the highest intake per body weight of food and beverages, the predominant source of contemporaneous lead exposure to the general population. It is clear that the blood lead concentration of the adults participating in the NAS and BMS, as well as most adults greater than 60 years of age, largely reflects higher skeletal lead stores accumulated earlier in life, as opposed to their current external lead intake.
The application of the causal determination criteria in Chapter 2 and Chapter 5 often lacks transparency, and would benefit by a more specific and structured approach. It is problematic that the narrative takes the approach of opining on the weight of evidence for causation for broad categories such as “neurological effects” or “cardiovascular effects” or “reproductive effects and birth outcomes”, rather than evaluating more specific health outcomes within each category. For example, although the causation assessments in Section 2.5.1 and Section 5.3.8 conclude that “there is a causal relationship between Pb exposures and neurological effects”, the analysis in these subsections does little to differentiate the weight of the evidence as it applies to such widely divergent neurological effects as cognitive function in children, essential tremor in adults, cognitive function in adults, and ADHD in children. The summary Tables 2-2 and 2-3, which imply that there is evidence for a causal impact for lead on cognitive function in both children and adults at a blood lead of 5 µg/dL, belie the fact that while there is ample evidence to establish cognitive impacts in children, the evidence for a similar impact on adults is nowhere near as compelling. It is puzzling how Table 2-3 singles out the NHANES III study by Krieg et al (1990) to support the conclusion that a blood lead of 5 µg/dL has a “causal” impact on diminished cognitive function in adults, when in fact this study reported no significant impact of blood lead on cognitive tests in adults age 20 to 59 or ≥ 60 years of age. Moreover, Section 5.3.2.4 “Epidemiological studies of cognitive function in adults” concluded, “In summary, among adults without occupational exposures to Pb, there is weak evidence for an association between blood lead
45

levels and cognitive function” (emphasis added). Indeed, the relatively few studies that have found an association between low blood lead concentrations and aspects of cognitive function in adults, such as Muldoon et al, 2006, Payton et al, 1998, and Wright et al, 2003, (surprisingly not discussed in Section 5.3.2.4) were conducted in elderly populations who sustained prolonged periods of much higher blood lead concentrations (e.g. 10 to 25 µg/dL) earlier in life.
With respect to other “neurological effects”, such as essential tremor in adults and ADHD, the ISA would also benefit from a more rigorous presentation of a weight of the evidence analysis that Tables 2-2 and 2-3 imply yields a “causal relationship” at a blood lead concentration of ≤ 5 µg/dL. While intriguing, the epidemiological evidence that supports the relationship between lead exposure and essential tremor is limited to two cross-sectional studies conducted in middle aged to elderly adults. By virtue of their age, these subjects sustained decades of much higher blood lead concentrations earlier in life. Moreover, the pathogenesis of essential tremor is poorly understood, and there is no experimental animal or in vitro data that provide a model of lead induced essential tremor at low dose, or that establish a particular mode of action. With respect to the implicit finding of a “causal” relationship between blood lead concentration less than 5 µg/dL and ADHD, the narrative would benefit from a critical evaluation of limitation in the epidemiological studies that should temper the certainty of this conclusion, including a) the lack of control for parental ADHD in all the studies; b) the cross-sectional nature of the studies; c) the sole reliance on blood lead in late childhood and the lack of information on blood lead level as toddlers; and d) incomplete ascertainment in some studies of covariates such as prenatal tobacco exposure. The analysis might also address the implications for lead causation of ADHD of the observation that a marked rise in ADHD incidence has occurred during a period of dramatic decline in population lead exposure.
Section 5.4 of the ISA reviews recent epidemiological studies that demonstrate an association between lead exposure and blood pressure and/or hypertension, as well as cardiovascular mortality. This topic is exceedingly important, because hypertension and related cardiovascular diseases are pre-eminent causes of morbidity and mortality in the United States. While the evidence presented in the prior 2006 lead air criteria document (AQD) and the current draft ISA convincingly establish that environmental lead exposure is a cause of hypertension and cardiovascular morbidity and mortality, there is considerable uncertainty regarding the dose of lead at which these endpoints emerge. Knowledge of this dose, including evidence of any potential threshold, would be of paramount importance in the establishment of a NAAQS based on these endpoints. The statement in Section 5.4.1 “Both human and animal studies provide consistent evidence for an association of increased BP and arterial hypertension with chronic exposure to Pb resulting in adult blood Pb levels below 5 μg/dL” is not supported by the available data. All of the epidemiological studies cited in the past AQCD and the current ISA that demonstrate an association between blood lead and blood pressure, hypertension, or cardiovascular morbidity or mortality have been conducted in populations that likely experienced blood lead concentrations > 5 µg/dL for a significant proportion of their lifetimes. The epidemiological studies have been mainly conducted in middle aged to elderly adults who, notwithstanding their current low blood levels, lived a substantial proportion of their lives prior to 1980, when background blood lead concentration was typically in the range of 10 to 25 µg/dL. As noted in the narrative, in several of these cohorts (such as those examined in the Normative Aging Study), the association of lead to blood pressure or hypertension is more strongly predicted by bone lead than by blood lead, consistent with the influence of cumulative lead exposure accrued in part during these earlier decades. In addition to receiving a substantial contribution to cumulative lead exposure in early life, these cohorts were subject to what may have been unique developmental impacts of blood lead concentrations > 10 µg/dL on their cardiovascular system.
46

At the present time, there appear to be no human or animal1 studies that demonstrate the effect of lead on blood pressure, hypertension, or cardiovascular disease in subjects whose blood lead concentration never exceeded 5 µg/dL. The ISA would benefit from a revision that reflects this unresolved and important issue.
A somewhat similar problem has occurred with respect to the ISA’s assessment of renal effects in Section 5.4 and Section 2.5.3. The draft ISA’s assessment is that blood lead concentrations as low as 2 µg/dL are associated, on a causal basis, with renal insufficiency demonstrated by a low calculated GFR (glomerular filtration rate). In my opinion, a conclusion of causal assessment at that blood lead concentration is not supported by the scientific literature for several reasons. First, many of the studies that associated blood lead concentrations of this magnitude with diminished GFR were conducted in cohorts in which most of the members lived a substantial proportion of their lives with much higher blood lead concentrations (in the range of 10 to 25 µg/dL). Second, the epidemiological evidence that associates blood lead and GFR is subject to reverse causation. Since lead undergoes substantial renal excretion, elevations in blood lead concentration can be a consequence of decreased GFR, rather than a cause of reduced GFR. The explanation against reverse causation offered in the ISA that “…the association between blood Pb and serum creatinine occurred over the entire serum creatinine range, including the normal range where reverse causality would not be expected” has no apparent experimental support and is unpersuasive. On the contrary, steady state serum creatinine is inversely proportional to GFR, and in any person, decrements in GFR are associated with increases in serum creatinine even when the serum creatinine remains in the normal range. Third, the epidemiological data has not yielded consistent findings, and in some cohorts with low level environmental lead exposure, blood lead concentration was associated with biomarkers consistent with improved renal function (e.g. lower serum creatinine, de Burure et al, 2006). It is conceivable, but unknown, whether this represents lead induced hyperfiltration. Fourth, the toxicological literature reviewed in the ISA offers no evidence, in either human or animal studies, of a demonstrable nephrotoxic lesion or mechanism induced by a blood lead concentration of 2 µg/dL. On the contrary, early biomarkers of tubular damage have not consistently emerged in occupational cohorts or animal studies until blood lead concentrations are generally higher by an order of magnitude.
In general, the numerous tables in Chapter 5 that offer details (“characteristics and quantitative data”) of selected epidemiological studies pertaining to broad health endpoints should include a column that comments on the strengths and limitations of each study in terms of causal assessment. The summarized information should also note negative findings (e.g. the notable absence of a predictive effect of blood lead in studies that reveal a predictive effect of bone lead). For ease of reference, abbreviations should be explained in the caption to each table.
Section 5.2 of the document offers an extensive discussion of various modes of action of lead observed in toxicological studies (mainly conducted in cellular preparations or whole animal experiments) across a wide range of exposure concentrations. Table 5.2 seeks to relate the “dose” of lead (in vitro or ex vivo) associated with various modes of action to human health effects. The table suggests that of all the modes
1 Regarding animal studies, the statement on page 5-165, “An array of studies have provided evidence that extended exposure to low levels of Pb (<5 μg/dL) can result in delayed onset of hypertension in experimental animals that persists long after the cessation of Pb exposure” is not supported by data presented in the ISA. Section 5.4.2.2, and Figure 5-167 refer to two animal studies, Chang et al, 2005 and Tsao et al 2000, that the document implies show an effect of lead on increased blood pressure at blood lead concentrations < 5 µg/dL. However, neither of these studies reaches such conclusions nor do they present data that establishes such a finding.
47
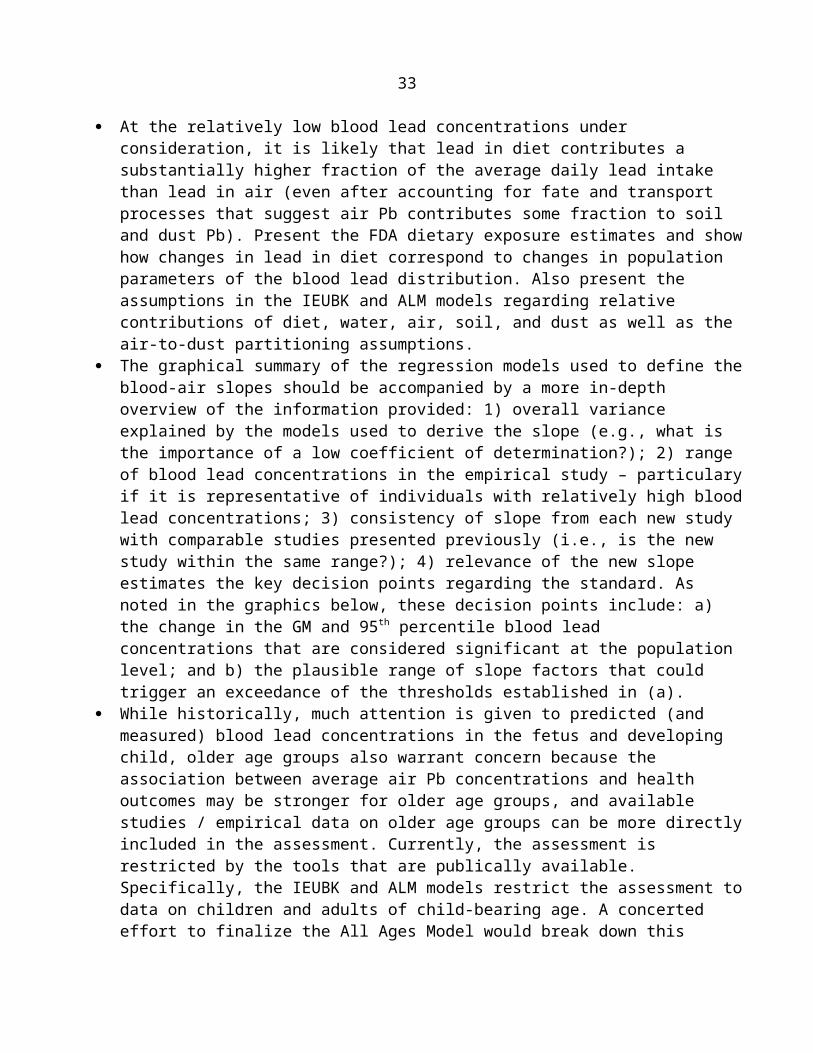
of action listed, only altered ion status might be expected to be relevant to human health effects observed at blood lead concentrations in the range of current environmental interest (i.e. 1 to 10 µg/dL). A whole blood lead concentration of 1 to 10 µg/dL corresponds to a plasma blood lead concentration of approximately 0.01 to 0.1 µg/dL, or 0.1 to 1 µg/L2, which is approximately 0.5 to 5 nM (nanomolar). Since it is lead in plasma that is available for uptake into cells of key target organs such as the brain, kidney, gonads, and vascular endothelium, the narrative might consider emphasizing only those modes of action for which there is evidence of action at cellular concentrations of 5 nM or less. Lead’s interaction with protein kinase C and calmodulin mediated processes, demonstrable in the subnanomlar range in vitro, are particularly relevant in this regard. By contrast, studies of the effect of lead on cells in culture where the culture medium contained lead at micromolar concentrations are of doubtful relevance and could be omitted from the ISA.
The narrative should highlight and emphasize toxicological findings from animal studies in which the animal’s exposure and/or blood lead concentration approximates that which occurs to humans with low level environmental lead exposure. For example, in the United States, the median lead concentration of the human diet is approximately 3 ppb, the median blood lead concentration is approximately 1.6 µg/dL, and daily intake of lead is on the order of 10 micrograms (or 0.00014 mg/kg/day; see Table 4-1). However, the document extensively discusses experiments in which laboratory animals were fed diets containing on the order of 100 to 2000 ppm lead, received lead doses on in the range of 1 to 10 mg/kg/day or higher, or had blood lead concentrations on the order of 15 to 150 µg/dL (or higher), without considering the relevance of these relatively high values to the potential health impact of much lower environmental lead exposure to humans.
From a temporal standpoint, it appears that some of the key health impacts associated with environmental lead exposure in humans, such as hypertension and cardiovascular disease, renal insufficiency, and adverse neurological outcomes (such as cognitive dysfunction or possible neurodegeneration in adults) are the consequence of longterm cumulative exposure. For example, days to weeks of exposure to lead resulting in blood lead concentrations in the range of 10 to 25 µg/dL do not appear to induce contemporaneous elevations in blood pressure or hypertension in humans that is observable in that time frame. Instead, evidence suggests that the risk emerges after years of such exposure. Lead exposure in childhood has not been associated with elevated blood pressure or hypertension in childhood (cf Chen et al, 2006; Gump et al 2005; Factor-Litvak et al, 1996), although it has been associated with the latent development of increased blood pressure in early adulthood (Gerr et al, 2002). Accordingly, the likely modes of action underlying the development of lead-induced hypertension are not those associated with acute or subacute pharmacological action, but rather those compatible with slow, insidious onset and/or long latency. Therefore, in seeking coherence between many of the chronic human health outcomes discerned in epidemiological studies and plausible mode(s) of action supported by toxicological studies, the narrative should focus on slow or latent processes, such as, but not limited to, epigenetic impacts on gene expression, or remodeling of tissue structure or responsiveness (e.g. in brain, kidney or vascular endothelium).
In view of the foregoing, the document could be shortened by omitting the frequent discussion of toxicological studies that have examined lead doses and/or modes of action that are not relevant to the actions of lead plausibly associated with insidious or latent low-dose human health effects. Those toxicological studies that by virtue of dose and temporal pattern are relevant to these human endpoints 2 As noted in Section 4.2.2.1, ≤ 1% of lead in blood is present in the plasma in individuals with low level environmental exposure; the value of 6% implied in line 7 of 5.2.3.3 should be corrected.
48

should be summarized in tables that identify key aspects of dose and study design, and that comment on strengths and limitations. Figures such as Figure 5-29 which omit the study citation and other key data are relatively unhelpful. Toxicological studies that exposed animals or cells to massive doses of lead not relevant to low level human exposure should be omitted from the document, or confined to subsections that clearly note their questionable utility with respect to NAAQS development.
Additional comments on the ISA’s discussion of specific health endpoints:
Neurocognitive function. The ISA’s discussion of recent studies that demonstrate an effect of in utero and childhood low level lead exposure on cognitive function are of particular interest, because this endpoint formed the basis of the last revision of the NAAQS for lead. The comprehensive review of recent studies provided in the narrative and the tables supports and extends the observations and conclusions reached in the 2006 assessment. A few relatively minor points warrant comment:
a) In section 5.3.2.1, the discussion of the study by Kim et al (2009) highlights its importance as a study that demonstrated an impact of lead on full scale IQ in a population with blood lead < 5 µg/dL, (thus representing a cohort with the lowest blood lead for which FSIQ was the primary endpoint). However, the narrative, including the caption to Figure 5-3, should provide a clearer indication that the value of this study is tempered by the finding that a statistically significant impact of lead on FSIQ was confined to subjects with relatively high blood manganese (>14 µg/dL). In like manner it appears misleading for the findings of this study to be referred to, without citation and qualification, in Section 5.3.8 Summary and Causal Determination, which states (page 5-147, line 13), “In the cumulative body of evidence, negative associations between blood Pb level and IQ are best substantiated at mean blood Pb levels in the range of 5-10 μg/dL; however, an association was observed in a recent study with a mean blood Pb level of 1.73 μg/dL. [emphasis added]
b) Section 5.3.2.1 addresses the important and challenging issue of age-based susceptibility to lead-associated neurodevelopmental deficits by noting that while adverse impacts of lead on the entire range of development (in utero, early childhood, and late childhood) have been observed in epidemiological studies, “…concurrent blood Pb level appears to be the best predictor of neurodevelopmental effects in children…. Thus, the course of cognitive development may be modified in children, depending on concurrent blood Pb levels or positive caregiving environment” (page 5-73, lines 12-16, emphasis added). It is unclear how this important conclusion is mirrored in Chapter 2, which states, “Collectively, the epidemiological evidence has not identified one unique time window of exposure that poses the greatest risk to cognitive function in children (Figure 2-3)” (Section 2.8.3, line 28). Figure 2-3, which is the same as Figure 5-10 3, provides data abstracted from Table 2 of Bellinger et al (1990) in support of the primary importance of concurrent blood lead, and the improvement in IQ that may ensue with declining blood lead in childhood. However, it would appear that data from Table 3 of Bellinger et al (1990), rather than Table 2, is more suited to this point. Renal effects. Table 5-43 depicts “the change in kidney metric [e.g. biomarkers of renal function such as serum creatinine or estimated GFR] per µg/dL blood Pb, at 1 µg/dL.” This is misleading, because in virtually all of these studies, most of the subjects had blood lead concentrations considerably higher than 1 µg/dL, and the validity of extrapolation of the study findings to a blood lead concentration of 1 µg/dL is not established.
3 The beginning of the caption to Figure 5-10 omits the superscript “a” that is found in the caption of Figure 2-3.
49
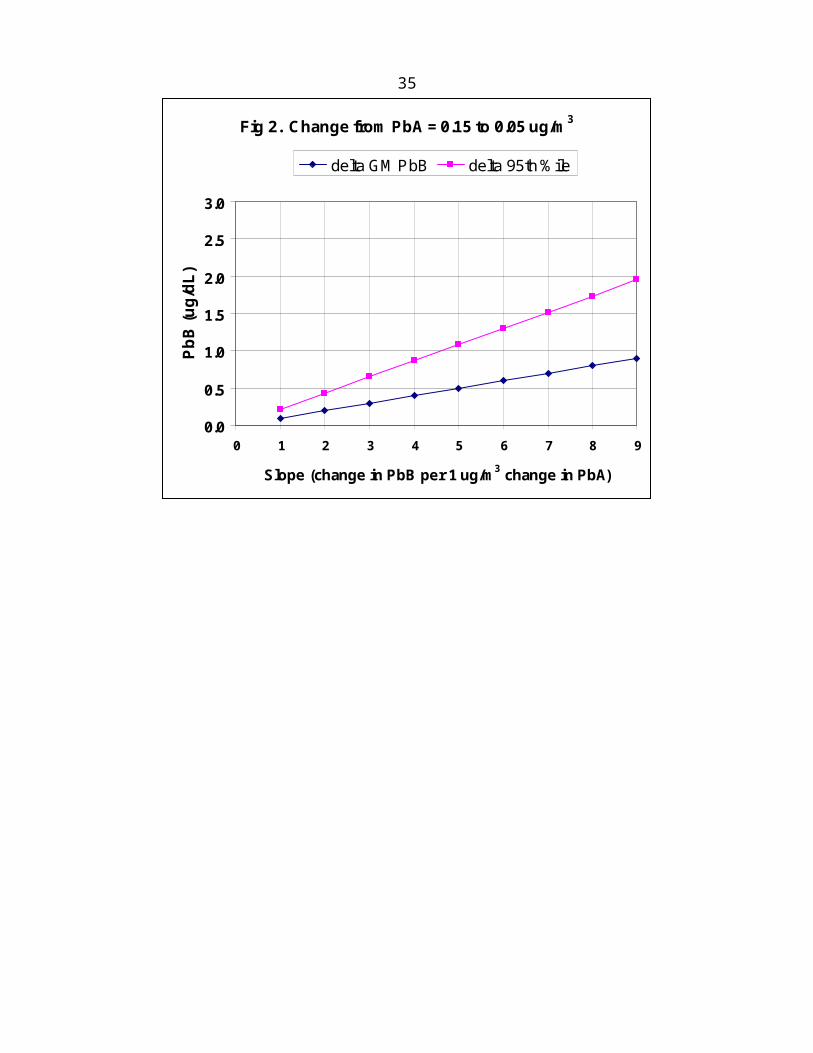
On page 5-129, the prospective study of renal function in patients with chronic renal insufficiency reported by Yu et al (2004) is described as a “hallmark” study illustrating the impact of low blood lead concentration (< 5 µg/dL) on renal function. Given the multiple limitations of this study, such an endorsement seems unwarranted. The study’s limitations include, in part: a) sparse information regarding subject recruitment; b) the unacknowledged likelihood, based on the range of blood lead concentration and EDTA provoked urine lead excretion, that many study subjects had substantially higher blood lead concentrations prior to enrollment; c) lack of blinding during the follow-up period, an important consideration in a condition such as chronic renal insufficiency in which medical treatment and medical and dietary compliance strongly influence change in renal function; d) statistical analysis using a Cox proportional hazards model that adjusted the hazard ratio for renal function deterioration only on baseline covariates, rather than an alternative survival analysis that adjusted for changes in key covariates, such as blood pressure or protein intake, during the extensive period of follow-up; e) failure to report possible interactions between lead biomarkers and other covariates in the proportional hazards analysis. Similar unacknowledged major limitations exist for the chelation studies conducted by these same investigators that are discussed on pages 5-223 to 5-224, including the crucial finding that change in renal function in the chelated subjects was not related to any lead biomarker. The statement in the draft ISA suggesting that if these observations are replicated, “chelation could yield important public health benefits” appears to be premature. In any case, it would be highly inadvisable to retain even this qualified endorsement of an unproven therapy in the ISA document, whose principal purpose is to review the association between lead exposure and health effects.
Immune system effects. In certain sections of the ISA, there was a troubling mischaracterization of the blood lead concentrations associated with immunotoxic effects in animal models. A striking example occurred on page 5-250, line 3-4, where the narrative stated:“One of the most salient findings collectively was that DTH [delayed type hypersensitivity] was suppressed in animals with blood Pb levels ranging from <2 to 5 μg/dL (Bunn, Ladics, et al., 2001; Bunn, Parsons, et al., 2001a, 2001b; Miller et al., 1998; Muller et al., 1977)”. However, in every one of these citations, the suppression observed in delayed type hypersensitivity followed in utero or postnatal lead exposure associated with blood lead concentrations greatly in excess of 5 µg/dL. Specifically, in “Bunn, Ladics et al, 2001”, and “Bunn, Parsons et al, 2001a” changes in DTH were observed only in young female (but not male) rats whose in utero lead exposure resulted in a postnatal day 1 blood lead concentration of 35 (thirty-five) µg/dL. In “Bunn, Parsons et al, 2001a”, the effects occurred only in young female rats whose postnatal day 1 blood lead concentration averaged 51 µg/dL. In “Miller et al, 1998” in utero lead exposure associated with postnatal changes in DTH in the offspring appeared in pregnant dams who had a blood lead concentration of 71 µg/dL. Decrements in DTH were not detected in the offspring of pregnant dams with blood lead concentrations of 39 µg/dL. In Muller et al, 1977, which studied DTH in adult rats, the lowest blood lead concentration studied was 20 µg/dL. Accordingly, the narrative was misleading in implying that lead exposure associated with a blood lead concentration of “<2 to 5 µg/dL” was sufficient to suppress delayed type hypersensitivity in animal models.4 Not every article cited in support of conclusive statements such as that on page 5-250 line 3-4 could be reviewed at the time these comments were prepared, and the extent of similar
4 In some of the studies described in this paragraph, the blood lead concentration in the rats may have declined to less than 5 µg/dL at the time DTH was tested, even though they were much higher in utero or early in life. It would be disingenuous to imply that these studies demonstrate an effect of lead exposure associated with a blood lead concentration of < 5 µg/dL. In the context of the ISA, which seeks to examine the health impact of low level environmental lead exposure, an epidemiological or animal study should be identified as demonstrating an effect of lead exposure associated with a blood lead concentration less than 5 µg/dL if and only if the subjects’ blood lead concentration never exceeded 5 µg/dL.
50
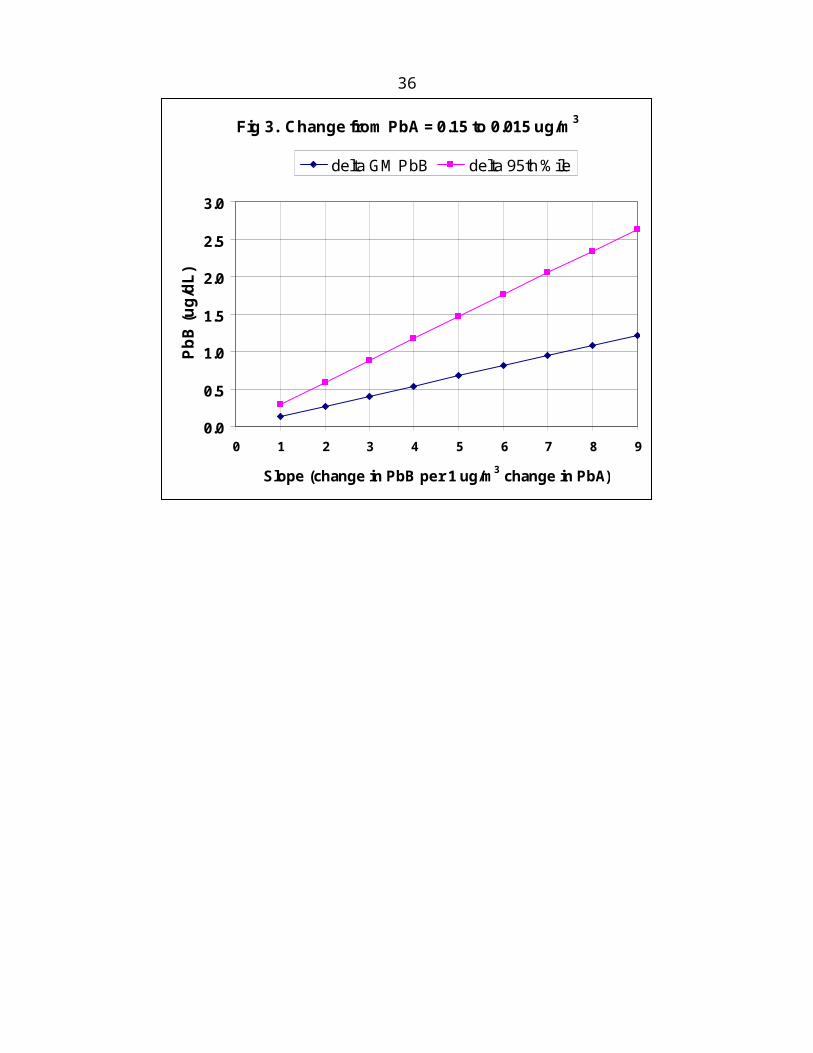
mischaracterizations elsewhere in the ISA has not been comprehensively investigated. However, a careful re-checking of the literature cited in support of conclusive statements pertaining to low-level lead exposure throughout the ISA may be prudent at this point in the revision process.
The manner in which the draft ISA has summarized findings of the 2006 Pb AQCD often merits revision. For example, in the first sentence of section 5.6.4.1 “Host Resistance” (page 5-258), the narrative states, “The capacity of Pb to reduce host resistance to bacteria has been known for almost 40 years and was supported by several toxicological studies described in the 2006 Pb AQCD (U.S. EPA, 2006).” This sentence implies that the 2006 document concluded that impaired human resistance to bacteria was well known to be caused by lead exposure and found support from toxicological studies in animals. However, a reading of the 2006 document reveals conclusions that are quite to the contrary. Specifically, page 6-196 of the 2006 Pb AQCD stated, “Associations between Pb exposure and host resistance have not been rigorously examined in humans. Two analyses of illness surveys in children (Rabinowitz et al., 1990) and Pb workers (Ewers et al., 1982) have been reported….Collectively, these studies do not provide convincing evidence for a strong association between Pb exposure and altered disease resistance in humans.”
Latter in that same paragraph, (page 5-258, Line 7), the narrative states, “Gupta et al. (2002) demonstrated that elevated Pb exposure 6 of mice (>125 mg/kg Pb, 13.0 μg/dL blood Pb) reduced host resistance to viral infections as indicated by an increased viral titre and increased mortality.” This represents both a numerical error and a mischaracterization. In Gupta et al (2002) lead exposure of 125 mg/kg for 28 days, yielding a blood lead concentration of 130 (one hundred thirty) µg/dL, was not associated with increased mortality, which was observed only at a lead dose of 250 mg/kg x 28 days and a blood lead concentration of 210 µg/dL. Aside from the draft ISA’s mistaken description of the study findings, the question remains of the utility of even mentioning this study at all, given that it employed massive doses of lead irrelevant to low level environmental lead exposure.
Overall, sections of the ISA in Chapter 2 and Chapter 5 devoted to “immune system effects” appear to overstate the significance and conclusiveness of the evidence that suggests a causal link to low level environmental lead exposure. For example, on page 5-242, the narrative states that the 2006 ACQD found “strong evidence that the immune system was one of the more sensitive systems affected by Pb exposure.” In section 5.6.7 “Summary and Causal Determination”, the narrative states, “The collective body of evidence integrated across epidemiologic and toxicological studies consistently demonstrates that the immune system is a major target of Pb.” On the contrary, the toxicological and epidemiological evidence linking low level environmental lead exposure with immune system effects is sparse, often inconsistent, and subject to considerable uncertainty arising from weak study design and inadequate statistical analysis. Sections 5.6 and 2.5.4 in particular would benefit from a substantive revision that critically acknowledges the tentative nature of the findings and discusses the many uncertainties pertaining to their validity and clinical and public health significance.
In tables and the narrative, Section 5.6 highlights epidemiological studies by Karamaus et al (2005) and Sarasua et al (2002) as “demonstrating” immune system effects of lead at blood lead concentrations less than 10 µg/dL. With what appears to be an implicit reliance on the reports of Karamaus et al and Sarasua et al, the narrative states, “…epidemiological evidence in children consistently links elevated blood lead levels (as low as 2.2 to 3.4 µg/dL) with decreases in T cell abundance” [page 5-274, line 16-17). In fact, in its analysis of the effect of lead on T cell subsets, (confined to a supplemental file “Additional File 1”), Karamaus et al (2005) reported no statistically significant effect of lead exposure
51

by ANOVA or linear regression. In an analysis highly susceptible to Type I error from multiple comparisons, two t-test contrasts found that the number of CD3+ T cells and B cells in children with blood lead between 2.2 to 2.8 were lower than that in children with blood lead < 2.2 µg/dL. (Note: for this analysis, the number of cells was log transformed and then analyzed in quartiles, instead of as continuous data). Effects were not seen at blood lead concentrations in two higher quartiles 2.8 to 3.4, and > 3.4 µg/dL, and no plausible basis for an apparent U-shaped dose response was offered. A similarly inexplicable U shaped dose response was also found for log transformed IgE levels by blood lead quartiles. In a separate analysis, the impact of blood lead on IgE revealed an interaction with levels of the organochlorine DDE, such that no impact of lead was found in the subjects with serum levels of DDE above the median. In what constitutes a major inconsistency, there was no effect of lead whatsoever when IgE associated with basophils was the dependent variable. Page 5-254, line 31 refers to a “strength” of Karamaus et al that arose from its control of potential confounders. On the contrary, the study failed to adjust for socioeconomic status, rural versus urban residence, housing condition, or ethnicity, key covariates associated with pediatric immunological status that could readily confound any effect of lead. In like manner, the study by Sarasua et al (2000), highlighted in the ISA as demonstrating an effect of low level lead exposure on immunological parameters, did not adjust for these same potential confounders. In that study, an association between lead and the percentage of T or B cells emerged only in the subset of children age 6 to 35 months, and not in the older children, an unexplained interaction with age. With respect to the impact of lead on immunological markers in this age subset, the authors of Sarasua et al noted that the statistically significant findings were principally due to data obtained in children with blood lead concentrations over 15 µg/dL.
On page 5-255, the narrative highlights the study by Pizent et al (2008) as offering evidence of an association between lead exposure and total IgE at blood lead concentrations less than 10 µg/dL in adults. However, the discussion in the ISA failed to point out that this association only emerged after an undisclosed number of female subjects not taking hormone replacement therapy or oral contraceptives were excluded from the analysis. The authors did not disclose the final statistical model or display a graph of the results. The methodology of subject recruitment was not disclosed, and there was no adjustment for key potential confounders such as socioeconomic status, residential factors, or occupation. In discussing the findings of Songdej et al (2010) another study focusing on adults, the narrative cites changes in inflammatory markers among subjects with low blood lead concentrations, without noting that the subjects experienced much higher blood lead concentrations earlier in life. In the study of young adults by Kim et al (2007), associations between low blood lead concentration and certain cytokines were limited to subjects with specific phenotypes, and were not adjusted for the key potential confounders of socioeconomic status or residential history.
Finally, it should be noted that even if it could be demonstrated that low levels of environmental lead exposure (i.e. at blood lead concentrations less than 10 µg/dL) caused perturbations in certain immunological parameters such as T or B cell prevalence, cytokine level, or immunoglobulin concentration, the clinical or public health significance of changes of the magnitude observed is uncertain at this point in time. Sweeping and unreferenced statements in the narrative, such as “Suppression of Th1 function by Pb places individuals at greater risk of certain infectious diseases and cancer” (page 5-275, line 8 to 9) are speculative, and should be deleted. From the standpoint of clinical or public health significance, a significant impact of low-level environmental lead exposure on the immune system has not yet been established. It is perhaps noteworthy that several recent clinical and
52
public health oriented reviews of the human health effects of low level lead exposure do not discuss any immunological effects of lead (CDC, 2005; CDC 2010; Kosnett et al, 2007; Henretig, 2011)5.
Comment on lead biomarkers and lead biokinetics: Section 4.3. Several modeling simulations based on the Leggett lead model feature prominently in section 4.3, e.g. Figure 4-6, Figure 4-8, and Figure 4-10. These figures depict a rapid decline in blood lead concentration in both children and adults following cessation of one or more years of elevated lead exposure. In Figure 4-6, after a year of elevated blood lead exposure associated with an increase in blood lead from approximately 3 µg/dL to 21 µg/dL, a young child’s blood lead concentration declined with a half-time of approximately 3 months. In Figure 4-6, a similar half-time for lead in blood appeared to apply to a young child after a 3 year period of elevated lead exposure during which the blood lead level increased from 1 to 9 µg/dL. In Figure 4-10, a simulation of adult blood lead dose-response, blood lead abruptly increased from approximately 2 to 9 µg/dL, where it remained for 20 years. Then, following cessation of exposure, the blood lead abruptly declined to 2 µg/dL within one year; a pattern consistent with a blood lead half-time of approximately 6 months. The narrative describing Figure 4-10, (page 4-48, Line 9 to 11) states, “Based on this hypothetical simulation, a blood Pb concentration measured 1 year following cessation of a period of increased Pb uptake would show little or no appreciable change from prior to the exposure event whereas, the body burden would remain elevated.” These simulations based on the Leggett model appear to be variance with empirical data revealing a slower pattern of decline in blood lead concentration in children and adults following prolonged periods of elevated lead exposure. Accordingly, the discussion in Section 4.3 of the change in blood lead following diminution or cessation of lead exposure merits reappraisal and revision.
First, features of the Leggett model that may serve to predict a relatively rapid decline in blood lead should be critically evaluated. It should be noted that the Leggett model is a compartmental model in which lead in bone moves over time from an exchangeable to a nonexchangeable subcompartment; lead in the nonexchangeable bone subcompartment can be returned to the plasma only by bone resorption (O’Flaherty 1998; EPA 20016). This is in contrast to the O’Flaherty physiologically based kinetic model, which allows for diffusion of lead in all bone compartments to plasma in an age-dependent rate. Section 4.3 of the ISA should review how the O’Flaherty model, in comparison to the Leggett model, might predict a slower decline in blood lead concentration following cessation of extended periods of elevated lead exposure.
Second, Section 4.3 should review and integrate the findings of empiric studies that have observed a decline in blood lead concentrations following cessation of exposure that is slower than that suggested by the simulations presented in the ISA using the Leggett model. Specifically, Manton et al (2000)7 published data that demonstrated blood lead half-times between 20 to 38 months in young children
5 CDC. Centers for Disease Control and Prevention. Preventing lead poisoning in young children. A statement by the Centers for Disease Control and Prevention. Atlanta: CDC, 2005CDC. Centers for Disease Control and Prevention. Guidelines for the identification and management of lead exposure in pregnant and lactating women. Atlanta: CDC, 2010Henretig F, “Lead”, chapter 94, in Goldfrank’s Toxicologic Emergencies, 9th ed, Nelson L et al (eds); New York: McGraw Hill; 2011Kosnett MJ, Wedeen RP, Rothenberg SJ, Hipkins KL, Materna BL, Schwartz BS, Hu H, Woolf A. Recommendations for medical management of adult lead exposure. Environ Health Perspect 115:463-471; 20076 EPA. Adult Lead Risk Assessment Committee of the Technical Review Workgroup for Lead. Review of Adult Lead Models. Evaluation of Models for Assessing Human Health Risks Associated with Lead Exposures at Non-Residential Areas of Superfund and Other Hazardous Waste Sites. Final Draft: August 2001
53

exposed to lead dust from residential home remodeling. In the case of adults with occupational lead exposure, Hodgkins et al (1991) presented data that demonstrated an impact of past air lead levels on contemporaneous blood lead concentration more than 5 years after large reductions in air lead exposure had been achieved. Schutz et al (1987) presented data on former lead workers indicating that the decline in blood lead following cessation of exposure followed a two compartment model – a fast compartment with a half-time of 1 to 2 months, and a slow compartment with a median half-time of 5 years. Hryhorczuk et al (1985) observed that for workers with chronic lead intoxication and normal renal function, the median blood lead elimination half-time was 619 days.
7 Manton WI, Angle CR, Stanek KL et al. Acquisition and retention of lead by young children. Environmental Research. Section A. 82:60-80; 2000Other articles cited in this paragraph:Hodgkins DG, Hinkamp DL, Robins TG et al. Influence of high past lead-in-air exposures on the lead-in-blood levels of lead-acid battery workers with continuing exposure. J Occup Med 33:797-803; 1991Schutz A, Skerfving S, Ranstam J et al. Kinetics of lead in blood at the end of occupational exposure. Scand J Work Environ Health 13:221-231; 1987Hryhorczuk DO, Rabinowitz MB, Hessl SM et al. Elimination kinetics of blood lead in workers with chronic lead intoxication. Am J Ind Med 8:33-42; 1985
54

Dr. Roman Lanno
Comments on Chapter 2 - Integrative Health and Ecological Effects Overview
Chapter 2 presents the integrative summary and conclusions from the Pb ISA with a discussion of evidence presented in detail in subsequent chapters.
Is this a useful and effective summary presentation?
The structure and presentation of Chapter 2 is logical and provides a good summary of the approach and the rationale behind causal determinations for human health and welfare. Leaving out many specific references is fine here since this summary is intended for a broader audience and a completely scientific format may prove distracting for many readers. Figure 2-1 provides particularly good synopsis of spectrum of scientific evidence for human health effects of Pb. The tables within sections summarizing data for causal determinations are good, as is the final summary table, 2-8.
Is the framework for causal determination appropriately applied?
Please comment on approaches that may improve the communication of key ISA findings to varied audiences. The health and ecological effects of Pb are mediated through multiple interconnected modes of action and there is substantial overlap between the ecological and health endpoints considered in the causal determinations. Since the mechanism of Pb toxicity is likely conserved from invertebrates to vertebrates to humans in some organ systems, the scientific evidence was integrated across the disciplines of health and ecology. Please comment on this approach e.g., is this a useful and effective integration of the scientific evidence?
The discussion of commonalities in modes of toxic action across varied taxa is an important step in highlighting the connection between human and ecological receptors and is a bold step for the EPA to attempt. Overall, the argument for various general modes of toxic action is strengthened by presenting similar findings from many taxonomic groups and this is captured very well in section 2.7.1, Modes of Action Relevant to Downstream Health and Ecological Effects.
One way of increasing the readability of this section (and the entire ISA document) would be the standardization of units used in expressing concentrations for measured parameters and especially for Pb dose. Blood Pb levels are consistently expressed as ug/dL and there is some useful discussion about expressing blood Pb levels using ug/L if we were to consider even lower blood Pb levels in assessments. However, Pb doses are expressed in a number of ways which make interpretation for the reader very difficult, especially if they are not scientists. For example, consider Table 2-6 which deals strictly with human data. Blood Pb levels are clearly expressed in ug/dL, but Pb dose is presented in pM, nM, uM, and ppm. Although it may be difficult to standardize M expressions due to the many orders of magnitude difference, ppm is not a very meaningful expression of dose. This should at least be converted to SI units, mg/L, but more usefully, expressed as a molar value, so as to facilitate comparison with other Pb dose measurements in the table.
Following up on Table 2-6, I checked Krieg (2007) and it was not very clearly stated what the Pb dose was, so where did the 20 ppm come from? (HERO was great for making these comparisons very
55
quickly, very slick!) In Wiebe and Barr (1988), the dose was 20 ppm in drinking water, not air, so this should at least be expressed in mg/L. In Huel et al. (2008), Pb and As were measured in hair samples of women as exposure dose and correlated with Ca pump activity in RBCs from umbilical cord blood. In Kern et al. (2000), in vitro tests were conducted examining the conformation of calmodulin in the presence of Ca and Pb and dose was expressed as pM of free metal ion, Pb2+ or Ca2+. In order to make the interpretation of dose easier, it would be good to include additional information regarding the medium in which Pb dose was measured (e.g., hair, in vitro test solution, drinking water). This would reduce confusion in the interpretation of Pb dose. Additionally, it would be important to include the form of Pb that was measured as dose (e.g., total Pb, modeled Pb2+), so as to incorporate the concept of bioavailability into the measurement of dose. This may be less applicable in human health exposures, but is very important when examining ecological data. To summarize, effective comparisons of exposure dose can be mediated by:
1) Expressing exposure dose consistently in SI units (e.g., ug/L, mg/kg, etc.), preferably as molar concentrations, where possible. Dose as ppm is not acceptable. Dose expressed on a molar basis makes sense since it is not the mass of Pb at the site of toxic action that causes effects, rather the number of moles of Pb.
2) Observed effects could be discussed in the order of “policy relevance”, discussing the context of the exposure. For example, in soil ecological exposures, tests conducted in natural soils, with measured Pb concentrations, using organism reproduction as an endpoint would have the highest relevance for assessing the effects of Pb on welfare. Experiments conducted with nematodes, using Pb added to agar or solutions, with unmeasured Pb concentrations, and endpoints of behavior and non-specific developmental anomalies would have little policy relevance.
With respect to the ecological effects section of Chapter 2, a summary of the various endpoints used to assess Pb toxicity are presented, but unlike the human health section, very few measures of dose are presented. As discussed above, the comparison of modes of toxic action among taxa is a good idea, but at least some measures of dose should be provided for ecological exposures. Even though ecological exposure measures may not translate directly into human exposure values, for those readers that would like to try and make a comparison, the values would be available. Summary tables of responses and doses (as in Table 2-6) would provide a good summary and make interpretation of the ecological data somewhat clearer.
Additional comments related to specific sections of Chapter 2 are provided below.
Page 2-13 – Figure 2-1 is great! Wonderful summary – a similar figure for ecological effects would be striking.
Page 2-19, line 13 – change “Pb levels in as low” to “Pb levels as low”
Page 2-22, lines 9-10 – What is meant by “target”? Is this a site of toxic action or simply a site for the absorption of Pb from the GIT, or both?
Page 2-24, line 21 – closing bracket needs to be added
Page 2-26, Table 2-3 – This could be a very powerful table if another column was added that provided an exposure dose level, especially if exposure dose could be expressed in terms of air Pb levels
56

Page 2-28, line 3 – What is meant by “dissolved Pb”? Is that Pb2+ or operationally-defined as Pb in a solution passed through a 0.45 um filter?
Page 2-28, line 31 – The rate of Pb accumulation in earthworms is also affected by the feeding biology of the different species
Page 2-29, lines 34-36 – It is completely expected that responses will differ when organisms are exposed to Pb in different soils due to the effects of soil type on Pb bioavailability, so unless, the soil is the same identical soil in terms of physical/chemical characteristics, the phrase “the same medium, e.g., soil” is not correct. This should be reworded.
Page 2-30, line 12 – change “physiochemical” to “physicochemical”. Physiochemical refers to physiological and chemical while physicochemical refers to physical and chemical.
Page 2-35, lines 5-6 – The reason evidence for Pb effects on growth is strongest in plants is that growth is the primary endpoint measured in plant tests, while reproduction is the primary endpoint measured in tests with soil invertebrates. Growth is rarely measured in soil invert tests, so perhaps this could be captured somewhere in these sentences.
Page 2-40, lines 13-15 – These concentrations of Pb are not very different. Is there another reason for differences in numbers of resident aquatic plants?
Page 2-40, line 27 – change “though” to “through”
Page 2-47, line 7 – insert “fuel” after “fossil”
Page 2-49, line 6 – Insert “evidence” after “body of” and “in” after “presented”
Page 2-55, line 5 – Change “sectin” to “section”
Page 2-56, line 13 – insert “to” after “continue”
Page 2-57, line 5 – insert “of” after “modifiers”; line 16 – remove “i”
Page 2-58, line 27 – Write out Fluorine in full at beginning of sentence; line 28 – insert “study” after “toxicological”
Page 2-59, line 23 – What is meant by this sentence? How does Pb bioaccumulation by aquatic organisms change the aquatic environment? Either provide specifics or remove.
Comments on Chapter 7 - Ecological Effects of Lead
Chapter 7 is a discussion of the ecological effects of Pb. Effects on terrestrial and aquatic ecosystems are first considered separately. They are then integrated by classes of endpoints (bioaccumulation, growth, mortality, hematological effects, development and reproduction, neurobehavior, community and ecosystem effects).
57

Does the panel consider this approach appropriate?
This approach is complete but involves some redundancy as some data sets can be used in more than one topic area. Overall, the reiteration is useful and this structure is easy to follow.
Is it appropriate to derive a causal determination for bioaccumulation as it affects ecosystem services?
This is a grey area question. Of itself, the bioaccumulation of Pb is not a toxic effect, but the normal adaptation of an organism to maintain homeostasis when challenged by a stressor. The magnitude of the stressor determines whether there is an effect (see schematic of bioavailability below). At low levels of Pb exposure, the rate of uptake of Pb is such that organisms that can bioaccumulate Pb will do so in a manner that partitions or detoxifies Pb within the normal range of physiological functions. This can be termed benign bioaccumulation. Once the rate of uptake of Pb exceeds the capacity of the organism to detoxify Pb, toxic effects become evident within the exposed organism, so at this point, bioaccumulation is no longer benign, but toxic. However, the effect is the mode of toxic action mediated through the interaction with some biological molecule in the organism, not the phenomenon of bioaccumulation. In terms of ecosystem services, there will be a level of bioaccumulation at a lower trophic level (benign or toxic) that will be ingested by a higher trophic level. If this level of Pb bioaccumulation in the lower trophic level results in a toxic effect in the higher trophic level, then a causal determination is warranted for bioaccumulation. If there is enough substantive evidence that trophic transfer results in toxicity, then a causal assessment is appropriate. Most of the available data suggests that biodilution is the predominant fate of Pb during trophic transfer, but some studies suggest some effects, so a causal determination is probably warranted.
Has the ISA adequately characterized the available information on the relationship between Pb exposure and effects on individual organisms and ecosystems, as well the range of exposure concentrations for the specific endpoints? I guess this depends upon one’s perspective. Since this document focuses on new data since 2006, the range of exposure concentrations presented in text and tables covers that time period. In the context of all available information, the newer data may not be adequately characterized. The newer data should be adequately characterized by providing some information on the relevance of this data to existing data. This could be accomplished by providing all-inclusive tables or figures (e.g., species sensitivity distribution) with all the other relevant data from previous ISAs that could be used to make a decision regarding a secondary NAAQS for Pb. For example, data on chronic toxicity from the current ISA could be plotted on an existing SSD for Pb from previous ISA documents using different color symbols so it is immediately evident where the new data lie, similar to the presentation for human data in Figures 2-2 and 2-3.
Are there subject areas that should be added, expanded upon, shortened or removed?
Page 7-8: A summary of background Pb levels in soils, similar to what is presented on page 7-50 for the Aquatic Ecosystem Effects section, would be useful in the interpretation of the relative Pb levels used in soil toxicity tests. A reasonable presentation of background Pb levels in US soils is available in the US EPA EcoSSL guidance document for Pb (US EPA 2005).
58

Another useful addition would be background schematics on the concept of bioavailability to ecological receptors and one for specifics of the biotic ligand model (BLM). The bioavailability schematic can be found in the US EPA Framework for Metals Risk Assessment (2007) and is similar to the schematic below. The BLM schematic can be found in any number of papers that describe the model. Both these diagrams can form a focus when discussing the bioaccessibility, bioavailability, bioaccumulation, and toxicity of metals in aquatic, sediment, and soil media. They would also provide a graphic illustration of the concepts central to any discussion of metal toxicity to ecological receptors.
One point of clarification that would be useful is distinguishing between bioconcentration and bioaccumulation and ensuring that these terms are used in the proper context throughout the document in the discussion of Pb bioavailability to ecological receptors. Bioconcentration and bioconcentration factor (BCF) refer to uptake of a compound strictly from water and are usually constructs of laboratory exposures. Bioaccumulation and bioaccumulation factor (BAF) refer to the summative uptake of a compound from all possible media (e.g., water and/or air + diet), so if organisms are being fed in the lab during tests or for almost all field exposures, bioaccumulation is the proper term to use.
The concept of bioavailability should be incorporated into the discussion of Pb exposure by clearly defining the chemical measure of exposure. Measurements of exposure can be total Pb (a vigorous acid digest of the medium), dissolved (total Pb in solution passed through a 0.45 um filter), solvent extracted (total Pb in a weak acid or weak salt extract of a sediment or soil), solid-phase extract (total Pb in diffusion gradient thin films (DGTs) or cation-exchange resin that diffuse through a membrane and hydrogel layer), free ion can be measured directly (maybe not for Pb), or based upon models such as WHAM, the Pb2+ concentration can be estimated from total dissolved Pb and other water chemistry parameters such as pH, DOC, carbonates, etc. Various combinations of these techniques can be used to estimate free Pb ion in water, sediment pore water, and soil solution.
59

In order to have any idea of how all the modifying factors of Pb bioavailability alter bioaccumulation and toxicity in various environmental media, Pb concentrations must be measured in some way. Data from any studies only expressing exposure as nominal concentrations is excluded from EcoSSL or Water Quality Criterion development data sets. There appear to be a number of references in the ISA where this is the case, so care must be taken in describing the relevance of these studies if they are to be included in the ISA.
If the ISA was expanded to consider dose-response in terrestrial systems, should we limit data to field soils?
Absolutely, artificial soil (AS) is not a soil, but a standardized test substrate, and data generated using AS has no relevance to any application in real soils. Artificial soil is used as a reference condition (not necessarily a good one) in standardized laboratory bioassays with soils and as a standardized test matrix for conducting “proof of concept”-type bioassays with soil invertebrates. In the development of EcoSSLs, the US EPA did not consider data generated using AS as acceptable for the development of EcoSSLs. For plants, hydroponic tests may serve a purpose, but not really for examining the effects of Pb in soil since the matrix itself has a tremendous effect on plant physiology.
If the ISA were expanded to consider dose-response in aquatic systems, how might we most efficiently present toxicity data that varies greatly by organism, and environmental parameters that influence bioavailability (pH, dissolved organic carbon etc.)?
Probably the best way to present dose-response data for aquatic systems would be to standardize dose to the free Pb ion using an aquatic metal speciation model such as WHAM. The next step would be to standardize further with a biotic ligand and effect to create a Pb BLM, but I’m not familiar with how far this has been developed.
Another approach may be to “bin” values in a more qualitative way and construct species sensitivity distributions (SSDs) for a certain range of conditions. By selecting the most important water quality parameters that modify Pb bioavailability (e.g., hardness, DOC) within the range of these parameters normally found in US waters, toxicity data could be examined under conditions of high (e.g., low pH, hardness, DOC), moderate (e.g., intermediate pH, hardness, DOC), and low (e.g., high pH, hardness, DOC) bioavailability. This would be similar to using a water hardness regression to determine site-specific guidelines for Pb and also to the approach used for the development of Ecological Soil Screening Levels for soil.
Additional comments on Chapter 7
Page 7-10, line 8-9 – “Pb had been removed by resident plant species” – does removed imply that the plants took up Pb and the plants were harvested, to completely remove the Pb? Otherwise, Pb will simply be recycled into the system via plant residues.
Page 7-14, lines 11-12 – “direct adsorption from the atmosphere” – does this mean that the Pb was then absorbed by the tree or was it measured as surficial, adsorbed Pb?
Line 16 – “incidental processing” should be defined here
60

Page 7-17, line 23 – these are low levels of Pb in soil and represent background concentrations in many soils. Data from experiments with low levels of Pb in soils must be interpreted carefully and raises the question of how to consider data from organisms exposed to low levels of Pb.
Page 7-19, lines 24-27 – If no evidence for a regulatory mechanism for Pb was observed, (i.e., no saturation of uptake mechanisms?) why would snails have to grow additional soft tissue to retain additional Pb? Please clarify.
Page 7-20, line 5 – What were the correlation coefficients?
Page 7-21, lines 24-26 – Worms increasing soil pH via mucous secretions seems highly unlikely and soil pH is very stable? If soil pH were increasing then why would Pb bioavailability increase? The needs rewording or removal.
Page 7-24, line 12 – What are Rumex K-1 plants?
Page 7-25, lines 10-12 – These statements require references
Page 7-27, lines 4-6 – Exactly what is stated here? Is it being implied that photosystem II effects of Pb would be expected in all plants? That would only be if Pb is translocated to or absorbed by leaves and shoots. If Pb doesn’t get to the chlorophyll (e.g., by physiological exclusion mechanisms) then toxicity would not be observed. I think this sentence needs to be reworded.
Page 7-29, line 28 – What is the relevance of hydroponically grown plants to the toxicity of metals in soils. This is a huge extrapolation and no hydroponics data was used in the development of EcoSSLs.
Page 7-30, lines 10-28 – Are these tests conducted in agar? If so, they have little relevance to soil toxicology. Are these developmental and behavioural effects specific to Pb?
Page 7-31, lines 9-14 – Is an increase in cellulase activity actually a negative effect on the worms? Seems to me that would enhance digestion of plant material.
Page 7-31, lines 22-26 – Topical application to snails – this is not a standard methodology applied to soil organisms. Was the 500-2,000 ug Pb applied to the snails the mass of Pb applied or the concentration of the topical solution and how was dose ensured? Was the LD50 and internalized dose or was it still surficial?
Page 7-35, lines 6-8 – I don’t see the relevance of in vitro oocyte exposure to NAAQS development.
Page 7-36, 1st paragraph – What type of soil was used?
Page 7-36, 3rd paragraph – Were these LC50s incipient lethal levels or just 28-day exposures? Since there were no differences in Pb content between species, it’s possible that an ILL had been reached.
Page 7-36, 4th paragraph, line 34 – P. kimi populations would be extirpated in Artificial Soil? The relevance here is not clear.
61

Page 7-37, 1st paragraph – Nominal concentrations in an undefined soil type is not information that can be used.
Page 7-40, 2nd paragraph – This interpretation is unclear. If species composition of microbial communities changed, the authors cannot state that decomposition rates may decrease unless they measured decomposition. This is due to functional redundancy of microbial communities in soil.
Page 7-47, line 22 – change “layer” to “horizon”
Page 7-52, line 2 – change “qualities” to “quantities”
Page 7-63, line 3 – I think Lemna are free-floating and not rooted macrophytes
Page 7-66, line 36 – What does “significant amounts of metal” mean? Statistically significant relative to controls or reference organisms?Page 7-67, line 21 – Should this be “exoskeleton > mid-gut gland > muscle > hemolymph”?
Page 7-68, lines 9-11 – Are these values actually different? They don’t seem to be unless the precision of the measurements is really high?
Page 7-68, last paragraph and Table 7-4 – BCF and BAF appear to be used interchangeably and their use should be consistent.
Throughout the text, the statements “accumulated significant amounts of metal”, “significantly increased”, or “detected at elevated levels” are used, but the relevance of these statements is often missing. Were Pb levels higher than in controls or reference organisms, higher than in organisms exposed to different concentrations, etc.? These need to be clarified.
Page 7-73, line 27 – remove “internally”
Page 7-87, line 24 – change “aspirate” to “aspartate”
In terms of quality assurance/quality control (QA/QC) of the experimental design and data measurements, what determines whether data from recent studies is used in the assessment or development of a NAAQS for Pb? As I’ve noted in many cases for soil toxicity tests, many of these studies would be excluded from EcoSSL development since they do not meet QA/QC criteria for soil toxicity data and have no relevance to assessing the toxicity of Pb in soil. How are data used where Pb exposures are very high by an exposure pathway that has low relevance to environmental exposures (e.g., in vitro exposures)?
Page 7-92, line 26 – Should this be “epidermal absorption” to gain an internal dose?
Page 7-92, line 32 – Xenopus laevis is the African Clawed Frog (not a toad)
Page 7-94, line 23 – This is a low EC20 but it is also unbounded? What is the preferred method for expressing this type of data?
62

Page 7-95, lines 9-13 – This is a comparison of toxicity in between freshwater and marine bivalves
Page 7-95, lines 34-35 – How many molts actually occur in 10 days and is this a realistic parameter?
Page 7-104, section on Species SensitivityBioaccumulation may not be a toxic effect if it’s in the realm of normal homeostasis of an organism, so differences in Pb bioaccumulation by different species does not necessarily have anything to do with sensitivity to Pb.
Page 7-105, lines 10-11 – Aren’t exoskeleton and hardened exterior tissue the same thing?
Page 7-110, line 5 – replace “bioconcentrated” with “bioaccumulated”
Page 7-110, line 7 and page 7-61, line 16 – The term “biodilution” is used to describe two different processes. Page 7-61 is “growth dilution” in relation to bioaccumulation studies
Page 7-114, line 8 – It’s unclear to me which routes of entry actually occur in plants. Stomata are on the undersides of leaves and aerial Pb can enter the leaf through the stomatal openings. What about Pb that is deposited on the upper surface of the leaf? Does this enter the leaf as well or does it only remain adsorbed to the surface?
Page 7-116, lines 17-18 – Limited information is available on growth effects on in invertebrates since growth is not a measured endpoint in most standardized invertebrate tests since it’s too variable and often organisms lose weight during tests due to substrate effects.
Page 7-117, line 27 – Heat shock proteins are a non-specific stress response and it’s not clear to me how they are relevant to Pb exposure.
63

Mr. Richard Poirot
Comments on Chapter 3 - Ambient Lead: Source to Concentration
Charge Question: Chapter 3 provides a wide range of information to inform the exposure and health sections of the ISA. To what extent are the atmospheric science and air quality analyses presented in Chapter 3 clearly conveyed and appropriately characterized? Is the information provided regarding Pb source characteristics, fate and transport of Pb in the environment, Pb monitoring, and spatial and temporal patterns of Pb concentrations in air and non-air media accurate, complete, and relevant to the review of the Pb NAAQS? Does the ISA adequately characterize the available evidence on the relationship between ambient air Pb concentrations and concentrations of Pb in other environmental media?
Chapter 3 generally provides an adequate review of the most recently available information on atmospheric emission sources, transport, ambient air concentrations, size distributions, spatial and temporal patterns, deposition and fate of lead in the environment. Many of the studies cited focus on Pb in a single environmental media, and there is relatively little information indicating how concentrations of Pb in soils (or wet or dry deposition, surface waters, sediments, indoor surfaces, etc.) would be expected to change in relation to future changes in air emissions and ambient air concentrations. I think this is primarily a limitation in the available literature, rather than a shortcoming of the ISA.
The authors stick closely to the assignment of focusing on “the latest scientific information” (1/06-3/11) available since the 2008 Pb NAAQS review, and this makes at times for uneven “recent literature review” discussions that seem to provide a paragraph summarizing the details of each new paper, without demonstrating how or why the new information advances or re-directs the state of scientific understanding in ways that would support or challenge the current NAAQS. I’m not a fan of the “only what’s new” approach and think that at a minimum, there should be a clearly-stated summary of the existing conceptual (model) understanding at the start of each new section. If this summarizes the last ISA (or in this case CD), it won’t work very well if the previous ISA or CD was itself just a summary of what was new 5 years earlier. One possible approach would be to have introductory sections summarizing the “existing conceptual understanding”, with a following section (or appendix) documenting the “new literature” that simply summarizes the relevant new publications, and a concluding section that indicates specifically how the existing conceptual understanding has been modified (if at all). Another approach might be to have a standing “state of the scientific understanding” document (more like the original CDs) that is periodically modified where and if the new information warrants changes. A “track changes” view would be a good way for reviewers to see what’s both new and important.
The Chapter 3 appendix provides interesting and useful information reflecting on spatial patterns and particle size distributions from the (limited) available ambient measurement data. As indicated in specific comments below, Table 3A-13 reveals uncomfortably high incidences of illogical particle size results where there was apparently more Pb measured in PM10 than TSP (1/5 of sites), in PM2.5 than in TSP (1/5 of sites) and in PM2.5 than in PM10 (2/5 of sites). Collectively, these illogical results suggest either widespread prevalence of poor quality Pb measurements, or errors in processing the data used for this comparison. Additional information is needed on the different sampling methods, filter media and blank characteristics, analytical and sample extraction methods, accuracy and precision characteristics,
64

and the screening/processing methods for the measurement data employed in these Pb size comparison studies. This is especially important given the wide range of acceptable FEM analytical methods for Pb and continuing concerns over the highly variable cut size characteristics of the current hi-vol TSP FRM.
While the chapter provides a detailed and informative discussion of the various existing, and in some cases developing, analytical methods employed for total Pb or Pb species, the discussion of methods for collecting Pb in different particle sizes is much more limited. The substantial sampling biases with wind speed and direction for particles larger than 10 microns associated with the current high volume TSP sampler are noted, but no information is provided on currently available or developing methods that might reduce or eliminate these sampling biases. Nor is any information provided in Chapter 3, or drawn from other chapters, on what the ideal particle size characteristics of a Pb FRM sampler should be.
During the course of the previous (2008) Pb NAAQS review, the CASAC Pb NAAQS Review Panel and AAMMS subcommittee strongly encouraged the Agency to develop and/or evaluate alternatives to the antiquated, imprecise hi-vol TSP samplers. The need for such alternatives is also clearly recognized in the “ambient air monitoring” section (6) of the March, 2011 Integrated Review Plan for the National Ambient Air Quality Standards for Lead, but the topic is not discussed in the current ISA. Developing and evaluating such alternative samplers should be a high priority during the current Pb NAAQS review, and should not be postponed (again) until the end of the review cycle.
Specific Comments
p. 3-2, lines 15-16 (and p. 3-1, line 22): Some additional explanation seems warranted to account for how Pb emissions from piston aircraft engines increased from < 10% of total in 2006 AQCD (based on 2002 NEI) to 49% of total in 2008. Did everything else decrease a lot (I doubt it), or was there a difference in inventory methodologies? In Figure 3-2, it looks like 2002 piston aircraft emissions were about 33% of total (not < 10%).
p. 3-3, Figure 3-2: Is there an explanation for the increase in miscellaneous Pb emissions from 2005 to 2008?
p. 3-4, line 2 and elsewhere: Piston aircraft emissions are referred to here as “direct point source emissions”. Are individual planes (or airports) considered to be “point sources”? What fraction of the 590 tons of aircraft Pb is emitted at/near airports, vs. along the flight paths?
p. 3-4, lines 14, 15: The “upper 0.1% of stationary emissions came from 33 counties” doesn’t sound right. I think there are about 3,100 counties (or equivalent jurisdictions) in the US, so 33 counties would be about 1% of counties (emitting only the upper 0.1% of stationary source Pb emissions?).
p. 3-10, Subheading under “Roadway-Related Sources”: I think you probably mean “Contemporary” (not “Contemporaneous”).
p. 3-11, lines 15-27: This is not especially helpful – re-suspended soil lead contributes somewhere between 90% of total and “can’t be ruled out”.
p. 3-14, line 2: So what happens to the 25% of Pb in fuel which is not emitted in auto exhaust?
65

p. 3-15 to 3-18: The discussion on Pb source apportionment is rambling and not especially helpful, switching focus from the chemical composition of Pb-containing compounds from sources to receptor model attribution of total Pb to sources, to composition of Pb-containing particles in the atmosphere. Many of the summarized studies – from Beijing, Shanghai, Mexico City, etc. may not be very relevant to current US sources. Conversely, no information is presented showing any source attribution to, or expected or measured chemical composition of Pb emitted from piston engine aviation fuel use.
p. 3-18, line 7: You might refer to “Pb-Zn-Cl-containing” particles to make it clear that 73% of PM2.5 particles were not composed entirely of these 3 elements.
p. 3-22, line 16: It’s not clear why Pb in re-suspended road dust should exhibit a bimodal distribution. Can some explanation be provided to indicate the different sources expected to be contributing to this bimodal size distribution?
p. 3-26, lines 1, 2: The Pb dry deposition flux in new measurements was considerably greater in industrialized urban areas than it was in the 2006 Pb CD? What does this mean? Is this based on just 1 study in Tokyo Bay, and are you sure the units are right (see below)?
p. 3-26, line 11: Is it possible you mean 12-17 mg/m2/yr (rather than µg/m2/yr)? Otherwise it seems inconsistent with the (30x higher) 0.49 mg/m2/yr bulk wet deposition at an a rural forested central Ontario site, and with the dry deposition flux ranges of 0.04 to 4 mg/m2/yr and 2 to 3 mg/m2/yr attributed on p. 3-22 (lines 4 and 11) to the 2006 Pb CD. A range 12-15 µg/m2/yr wouldn’t be “more than 10 times the upper bound” (of 4 mg/m2/yr or 4000 µg/m2/yr) from the 2006 CD.
p. 3-27, line 6: Not clear what is 0.002 to 0.3% of what?
p. 3-28, line 1: “under” what?
p. 3-28, line2: You could change “substantial” to something like “important” or “relatively large”, since the size of the resuspension contribution would be at least as large (and likely larger) in the vicinity of current major sources.
p. 3-28, line 28: Delete either “is” or “originates”.
p. 3-31, line 1: Is this “TSP” in water? If so, please define. If it’s in the air, more explanation is needed.
pp. 3-33 to 3-40: This lengthy review of Pb in runoff and associated transport and deposition mechanisms is detailed and occasionally interesting, but it’s not clear how this “new” information (mostly pertaining to transport of historically deposited Pb, is relevant to the review of an ambient air Pb NAAQS. Possibly here or elsewhere you could include some discussion of the relatively extensive sampling an analysis of flood-deposited Pb-containing sediments in post-Katrina New Orleans. This (flood water transport) mechanism could be a potentially important transport pathway for re-distribution and re-emission of historically deposited Pb to the ambient air. See for example: Plumlee et al. (2006) USGS environmental characterization of flood sediments left in the New Orleans area after Hurricanes Katrina and Rita, 2005—Progress Report: U.S. Geological Survey Open-File Report 2006-1023, 74 p. http://pubs.usgs.gov/of/2006/1023/pdf/OFR-2006-1023.pdf .
66

p. 3-37, lines 29-30: Part of this sentence (“The generally high…DOC concentrations”) must be missing.
p. 3-42, line 33: Add “into” before “account”.
p. 3-56, line 1: The objective of IMPROVE isn’t “to protect visibility” per se, but rather “to monitor visibility and the pollutants which impair it”.
p. 3-56, line 10: There are more than 9 XRF elements; more like 24 for IMPROVE.
p. 3-66 or elsewhere: Other than the Figure 3-13, there doesn’t seem to be a clear presentation of the names, locations, monthly and 3-month maxima and variability of sites exceeding 2007-09 Pb design values. Could a table providing that information be provided here or in the appendix?
p. 3-68 or elsewhere in this section: It might be informative to present some summary spatial and temporal patterns of PM2.5 Pb from IMPROVE sites, to convey general background patterns and to show how low these rural, fine particle concentrations are – relative to standards. Also these could be more directly compared to the occasionally much higher urban CSN PM2.5 Pb data – hopefully using something other than the dreaded “county plots”, which I just don’t find very informative. The figure below shows an example of recent 5-year averages from the two PM2.5 networks, for which the Pb data from collocated sites appear to be quite comparable. You could also show temporal trends for nearly 10 years from CSN and 20 years from some IMPROVE sites.
Figure 1. Five-Year Average PM2.5 Pb from Rural IMPROVE and Urban CSN sites: 2004-08
67

p. 3-68 & 3-69: I don’t like the approach here of describing information in the chapter which is only displayed in the appendices. At least provide an example or illustration of what you’re describing here in the chapter.
p. 3-76, line 2: Delete “lowest”. Also, you might indicate if the observed seasonal differences are statistically significant or if similar seasonal patterns were apparent in other time periods.
p. 3-77, line 18 and elsewhere: It isn’t clear (to me) why you are using a ρ (rho) correlation metric, rather than the more familiar r or r2. Sometimes ρ is used to denote the population correlation, rather than the sample correlation, but ρ is also often used to connote the Spearman’s rank-order (non-parametric) correlation. If you are intentionally using a non-parametric method, you might indicate this, explain why, and include an illustration that Pb data (in all size ranges) are not normally distributed.
p. 3-78: It might be helpful to include some mention of the analytical (and extraction) methods generally employed for quantifying Pb in the different size fractions which are compared here, as those differences may help explain some of the (occasionally illogical) differences in concentrations. See below.
p. 3-78, lines 12, 13: An average PM2.5 Pb/ PM10 Pb ratio > 1 warrants additional discussion. Looking at Table 3A-13 on p. 3-166 & 167 of the Chapter 3 Appendix, it is disconcerting to note that:
PM10 Pb > TSP Pb at nearly 20% (5/27) of collocated TSP and PM10 Pb sites, PM2.5 Pb > TSP Pb at nearly 20% (8/45) of collocated TSP and PM2.5 Pb sites, and PM2.5 Pb > PM10 Pb at nearly 40% (19/49) of collocated PM10 and PM2.5 Pb sites.
These high incidences of illogical results raise concerns about the quality of all Pb measurements, and call for further analysis and explanation. In addition, I note that many of the collocated Pb data sets utilized in Table 3.8.2 in the Appendix appear to be identical to those employed in a similar analysis conducted for the previous Pb NAAQS review, reported in a 4/22/08 memo from Mark Schmidt and Kevin Cavender (http://www.epa.gov/ttn/naaqs/standards/pb/data/20080428_scalingfactors.pdf ). The correlation metric in that previous analysis was different (r2 vs. the current ρ) although I would expect the r2 to generally be more stringent (a lower number), but at a number of sites the former r2 was higher than the current ρ. There was also an “average ratio” (of PM10 Pb to TSP Pb) reported for each site in the Schmidt & Cavender memo, which is different for than the “average ratio” reported in the current Table 3.8.2 for many of those sites and data periods of record which were presumably the same in both analyses. Some explanation for these differences seems warranted.There is a fairly substantial database of Pb (and other XRF elements) from a Canadian dichotomous sampler network, where analytical methods were consistent for fine and coarse fractions, and where relevance to current/recent US concentrations and size distributions would be high.
p. 3-80, lines 24, 25: Was Pb highly correlated with As in both the coarse and ultrafine fractions in the Hays et al. study?p. 3-80, line 32: Do you mean Pb in PM0.1 was 15 times higher in the tunnel than by the roadside?
pp. 3-80 – 3-81: The Figure 3-23 results summarized from Sabin et al. (2006) raise questions about (a) What were the particle cut size characteristics of the samplers used in that study? and (b) How well would the current TSP sampler capture the different particle sizes observed in that study?
68

pp. 3-80 – 3-82: This is an interesting discussion. Possibly some of the results you cite from other countries might not be directly relevant to US if Pb sources and historical trends are different.
pp. 3-83 – 3-84: Is there an explanation for the large reduction in the number of sites with collocated Pb and other pollutants in 2009, compared to 2007-2008?
P 3-86, Figure 3-26: It might convey information more clearly if the co-pollutants were sorted by highest to lowest median or average correlations with Pb, rather than alphabetically.
p. 3-87, lines 6-7: Is the more rapid Pb accumulation in soils from Pb salts than from sewage sludge or fly ash due to higher Pb concentrations in the salts, or from better retention in soils or from both concentration and retention?
p. 3-88, line 14: Explain the meaning of “TSP” in soil samples.
p. 3-88 – 3-95: In discussing Pb concentrations in soils or sediments, it would be helpful to indicate or at least generally summarize the depth of the soil and sediment samples for which you report concentrations.
p. 3-92, lines 16, 17: I don’t agree that “these results suggest that soil Pb concentration tends to be spatially heterogeneous in the absence of a source”. In the absence of any Pb sources, there would be no Pb. In the absence of strong anthropogenic Pb emission sources contributing to Pb deposition, the soil Pb concentrations would be determined by natural soil Pb content, which would not tend to exhibit especially high spatial variability.
p. 3-92, line 29: Although Pb air monitoring was not formally conducted as part of the WACAP study, fine particle Pb was measured at IMPROVE sites at about ¾ of the national parks included in the WACAP study.
p. 3-93, line 18: You could insert “average” after “highest”, as it appears from Table 3-10 that the highest peak Pb concentration was observed in Baltimore.
p. 3-95, Figure 3-29: There is no “background” displayed in this figure, as indicated in the caption.
p. 3-98, lines 4, 20 and elsewhere: Could you use consistent units to describe Pb concentrations in rain, snow, surface waters, etc. – rather than switching from µg/l to pg/g to ng/l?
p. 3-98, line 22: the reference (collated in 2008) works electronically, but not in hard copy. You could change this to (Lee et al., 2008).
p. 3-99, lines 28-30: Some additional explanation of 206Pb/207Pb ratios would be helpful. Otherwise its hard to see that a ratio of 1.16 is “far from” 1.19. In general, this entire paragraph, extending onto p. 3-100, is not very informative and could be clarified.
p. 3-102, lines 17-21: This summary of Pb speciation, including the statement that Pb speciation was “fairly well characterized” in the 2006 CD, is not especially informative. What are the predominant Pb compounds that we expect to find in the current ambient air in the vicinity of various Pb sources? Does
69

20% of Pb emitted from piston aviation engines persist as gaseous organic compounds (unmeasured by PM samplers) or is this just 20% of Pb bromide and dibromide compounds (and are they in gas or particle phase)?
p. 3-102, line24: This may be true, but I don’t recall mention in the chapter that “global” Pb deposition peaked in the 1970s, and think that might be a difficult thing to document with confidence.
p. 3-103, line 24: Delete “that”.
p. 3-134, line3: The text indicates that “the comparison tables include the Pearson correlation coefficient (r)” but the table legends indicate ρ (rho), which is presumably the Spearman rank-ordered correlation. So which is it, and if it’s Pearson r, why is this different than the metric used to correlate Pb in different size fractions?
p. 3-134, lines 11-18: Can you indicate how means were calculated where (sometimes high) fractions of the samples were below MDL?
p. 3-140, Table 3A-7 and elsewhere in Appendix: It’s difficult to understand the 3 separate values (rows) showing “correlations” between each pair of sites without flipping back several pages in the text. Perhaps you could provide a clearer legend, an explanatory note at bottom of each table, or add a column repeating ρ, P90 and COD for each row. Possibly also rename these “Comparisons…” rather than “Correlations…” in the table captions, since it’s not just correlations that are presented.
p. 3-165: The table above indicates that monitors A, B and C are all “source-oriented”, while the figure caption refers to source and non-source-oriented monitors.
70

Dr. Joel Pounds
General Comments
Chapter 4, like other parts of the ISA is well written. Information is provided within the chapters in a logical fashion. The detailed table of contents provides a useful roadmap for the reader to follow the flow of information and to look for location of specific information.
Chapter 4’s focus on blood and bone Pb is appropriate given the wealth of experimental and epideomolgical reports and the state of experimental and conceptual linkage between the two biomarkers. The Leggett model simulations nicely illuminate the complex relationship between blood and bone lead levels. The discussion describing the relationship between blood Pb and soft tissues is adequately presented. The absence of new data or insights limits the
Chapter 4, as other chapters, often needs more evaluative, judgmental conclusions in paragraphs reviewing data. In Chapter 4, the results of published literature are generally summarized in a single paragraph. The summary is judged complete and accurate. Missing from these paragraphs however, is the evaluation. Why were these papers included? What is the new information that extends knowledge beyond the last document? Does the paper confirm previous findings? Does this paper identify new knowledge or data gaps? What are the limitations of the new information? To include, where appropriate, this critical evaluations is important to creating a compelling ISA document.
The following comments identify topics that should be added or receive additional or clarifying discussions
Page 21. Section 4.2.1. Absorption. This section defines the terms “absorption”, “bioavailability”, and “bioaccessibility”. The working definitions of absorption and bioavailability do not make these terms very distinct. Absorption “refers to the fraction of Pb absorbed from respiratory or gastrointestinal tract” while bioavailability” refers to the amount of lead ingested or inhaled that enters systemic circulation”. Is it the units (fraction vs. amount or the specificity of absorption into “systemic circulation” that distinguishes the two terms? This ambiguity is furthered by the apparent interchangeable use (or incorrect by these definitions) of the absorption and bioavailability in Chapter 4 and elsewhere in the ISA. I suspect that most of these inconsistent uses result from carry-over usage from the original literature cited. I also don’t understand why the ISA is not using well accepted jargon of uptake and intake. Some of the inconsistent uses are identified below in my “editorial suggestions” I recommend that these definitions be revisited and that the entire ISA document be reviewed for use consistent with the clarified definitions.
Sections 4.3 and 4.7.3. The definition, application, and limitations of biomarkers. Like other clinical biomarkers, Pb biomarkers (blood and bone) are applied to both individuals and to populations for a variety of purposes. Blood and bone Pb levels are used as biomarkers for (a) Pb exposure, (b) body burden, (c) diagnosis of toxicity, (d) internal dose, and (e) risk for a plethora of adverse outcomes. The individuals and populations include broad age range, gender, genotype, and diverse exposure scenarios. Moreover, blood Pb in particular, is also used to benchmark animal studies to human studies. The approach and requirements for experimental validation of blood and bone Pb biomarkers for these applications is different according to the specific application. Thus, blood or bone Pb measurements are
71

not equally valid for all applications listed above and limitations are associated with each biomarker and application.
The ISA clearly recognizes that the Pb biomarkers are not equally valid when applied to different exposure scenarios. The Chapter 4 text contains cogent, but scattered discussions of the limitations of blood Pb with complex temporal exposures. The model simulations provided in Figures 4.4-12 provide very nice conceptual illustration of this point. Nonetheless, it is very easy (and common) to use and interpret Pb biomarkers in a facile manner without clearly communicating the ‘biomarker for what’ and limitations of the application. Because blood and bone Pb levels are used for risk assessment and management, this discussion is important enough to bring up to section 4.0 or at least 4.3 and the Chapter 4 Summary, 4.7.3.
The ISA and Chapter 4 would be well served by defining the conceptual and practical distinction between applications of Pb biomarkers for exposure, body burden, internal dose, diagnosis and risk. In addition, I believe that a scientific paper that discusses the topics above would be a very useful contribution to the lead field. I encourage EPA staff to consider authoring such a paper.
Sections 4.2 and 4.3 (Kinetics and lead biomarkers) should recognize that adolescents are poorly in existing mechanistic and empirical models. Individuals undergo rapid changes in sexual dimorphism, body growth, food and water intake, bone growth and turnover, diet, behavior, etc. during adolescence. Although there are some case-control studies suggesting that manifestations of early Pb exposure are observed, there is a paucity of experiment measurements of Pb biomarkers during this time. The lack of good data results in a deficiency of biokinetic models. Moreover, the individual biological and kinetic parameters are largely interpolated rather than based on solid experimental and toxicological measurements. These deficiencies limit the validity and use of model predictions to link exposure history with blood and bone Pb levels.
4.b. Relationship between Air Pb and PbB is not completely described. Literature review is good, but not complete and generalizations (conclusions) are not clearly made. Respiratory tract deposition and clearance are reported in the context of a specific study, but the ISA does not give a sense of the breath of the issue or the scientific context for this information. Perhaps a table abstracted from Chapter 3 that summarizes relationships between PM size, Pb content, PbB, etc would be helpful. Section needs take-home conclusion.
Page 34. 4.3. Biomarkers. This section nicely introduces the topic but could be improved by slightly more extended rationale for selection of the Leggett model over the other available biokinetic models.
4.2.2.3. Soft tissues. (Comment). While the statement that soft tissue Pb “exists predominately bound to protein” may be true and may be logical, the state of Pb in tissues is more conjecture than experimentally derived conclusion. Pb is no doubt, in equilibrium with proteins and complexed with many other ligands including glutathione, amino acids and small organic acids. Pb bound to extracted proteins supports the conclusion that this binding occurs in vivo but does not well describe the fraction of total Pb bound in intact cell/tissues as the experimental data reflect binding in diluted proteins in buffer without the pH and ion gradients and compartmentalization of ions, proteins and other compting ligands.
72
Question 5. I agree with Drs. Cory-Slechta and Kosnett that it is very important to evaluate the experimental design of in vitro studies to judge their relevance to elucidate mode of action. This difficult evaluation is deceptively simple. Arithmetic conversion of Pb M in cell culture media to blood or plasma Pb concentrations is simple, straight forward, and unambiguous; 1 µM Pb cell culture medium is arithmetically equivalent to ~21 µg /dL whole blood. Similar calculations can compare medium Pb to plasma Pb. Unfortunately, this simple comparison is inadequate for several reasons. The critical question is wether the in vitro and in vivo experiments have comparable Pb levels in the cells, tissues, and biological processes. First, for the purposes of these extrapolations, medium and blood Pb levels are akin to exposure rather than dose. We know from autopsy studies, animal studies, and biokinetic model simulations that blood Pb poorly correlates with tissue lead concentrations. Thus the simple extrapolation of medium Pb concentration to blood Pb is not appropriate. Rather to evaluate the relevance of an in vitro study, one should consider (a) comparison of the Pb level in the in vitro model (cells) to the Pb level of the comparable cells in vivo, (b) the specificity/sensitivity of the in vitro outcome vs. non-specific outcomes in vitro. That is, do the in vitro studies show effects that appear distinct from non-specific, overt stress response? And (c) are the cellular / molecular processes targeted in vitro consistent or plausible with toxicologic modes of action to produce the related toxicity in vivo.
Table 5.2. Related health effects… I suggest it is not appropriate to use the cell culture medium Pb concentration as “dose” as this value is much more equivalent to an exposure. The exposure duration, composition of the culture media, cell type, etc. modify the actual cellular dose given the identical exposure level.
Editorial Suggestions.
xxiv Abbreviations. Pb++ redundant with Pb2+ (search and replace Pb++ with Pb2+)P 4-1, L6. It was reported in The 2006P 4-1, L7. 2006) that 2006) reported thatP4.1, L10. It was also observed that Pb PbP4-3, L3. Could you list a couple susceptibility factors that influence exposure? P4.3, L8-10. Sentence beginning “it is plausible” is not clearP4-4, L4. Delete ‘shown to be’P4.8, L1. Studies have demonstrated studies demonstratedP4-9, L4. This indicates This result indicatesP4-9, L23. Delete ‘found to be’P4-9, L24. Change ‘It was’ Sill surface was…P4-10, L20. in Pb in water Pb” P4-10, L24. To what does “This” refer? P4-11, L15. this would this substitution wouldP4-11, L16. To what does “this” refer? P4-11, L22. Delete “potentially”P4-11, L35. It was found that blood Pb level was Blood Pb levels wereP4-12, L11 & 13. Does “Pb(II)” in line 13 meant to convey information distinct from line 11? P4-13, L10. “enriched the Pb content…” of what? P4-13, L19. median Pb median fertilizer Pb…P4-13, L22. this remains this source remains… P4-13, L26. Delete ‘found to be’P4-13, L28. was observed to have had
73

P4-14, L6-7. were demonstrated to have high had highP4-15, L6. delete3 ‘have’P4-15, L9. maximum Pb maximum sediment (?) Pb P4-15, L19-20. There has also been evidence There is also evidenceP4-19. 4.2.1. Clarify definitions for absorption and bioavailability. (see comment above)P4-20, L3. activity median particle diameter aerodynamic…?P4-20, L14. Delete “heavy”P4-20, L25-28. Ultrafine-sized is defined as <100 nm (L25) while L28 mentioned nano-size ranges. Are
these size categories different or are the different words used to describe the identical sample size range.
P4-20, L32. This indicated this result indicatedP4-21, L10, L10-11. Is “bioavailability” used here as defined on page 19? That is, the fraction absorbed
into systemic circulation. P4-23, L12-26. Is the use of the terms bioaccessible and bioavailability in this paragraph consistent with
the definitions on page 19? P4-23, L16. based measurements based on measurementsP4-25, L11. Comparisons of outcomes in in vitro Comparisons of outcomes in different in vitro…P4-25, L19. Soil has been reported to be… soil was reported…P4-25, L20. Pb dust maybe Pb dust reaching the gastrointestinal tract maybe…P4-25, L33. expectations would be that… expectations are that…P4-25, L34. this has… This validation has…P4-26, L29. capacity has been estimated… capacity was estimatedP4-28, Figure 4-4. This figure doesn’t clearly show the pseudo-linear relationships in the blood Pb and
intake range described in Lines 4-5. P4-30, L11. about 80 to 20 (… about 80 to 20 percent…P4-31, L18. liver, and brain) exists liver, and brain) presumably exists [although it is plausible that
tissue Pb is “predominately bound to protein” this conclusion is not supported by direct experimental observations.] See comment above.
P4-33, L9. Concentration has been shown to be… concentration was…P4-33, L12. This contributes… This relationships contributes…P4-34, L4. Pb have shown that… Pb showed that…P4-35, L20. This may… This unit may…P4-35, L31. It has not… ICP-MS has not…P4-36, L14. Although, this would be… Although, this interpretation would be…P4-36, L18-19. I believe this sentence has been misplaced. “Both analyses reported”… (which
analyses?). “little difference… large difference” not sure which data differences is referring to. P4-36, L28. studies have found… studies found…P4-36, L35. This is illustrated… This concept is illustrated… P4-39, L17-24. Urinary Pb concentration reflects, mainly, the exposure history… As correctly discussed
elsewhere in Chapter 4, urine Pb reflects filterable plasma Pb. Plasma Pb reflects input from all sources i.e. intake, RBC, soft tissues, bone. The relative input to plasma from these sources along with renal function determine urine Pb. Concurrent Plasma Pb, not historyxxx
P4-41, L17. This may allow… This difference may allow…P4-41, L20. was able to discern differences… discerned differences…P4-42, L4. Delete ‘possibly’P4-42, L8. at low levels… at low blood Pb levels…P4-43, L19. Slow bone volume compartments Slow bone turnover compartments…
74
P4-43, L20. movement into… movement back into…P4-44, L21. this comes… this conclusion comes…P4-45, L2. This is expected This result is expected… P4-48, L11. This illustrates… This (what?) illustrates… P4-48, L14-24. Good paragraph. P4-49, L1. Pb has been shown to be correlated… Pb is correlated…P4-50, L3. This has been observed… This divergence was observed…P4-50, L20-21. Increased blood Pb… This sentence is unclear. Increased blood Pb is characterized as
patter of lower blood Pb…? P4-11, L11. This is in contrast… This reduction is in contrast…P4-51, L18. category, women… category, pregnant women???P4-51, L22. remobilization mobilization P4-54, L4. This is reflected… This (what??) is reflected…P4-58, L3. data have shown a… data showed a…P4-63, L23. among various study populations… among selected study populations…P4-65 and P73. I did not recognize any L-XRF studies in these tables. If this observation is correct,
suggest edit table title to read, “…bone Pb measurement by K-XRF…”P4-78, Figure 4-18 legend. 50% PbP4-79, L8. This corresponds… This (what?) corresponds… P4-82, L3. These include… These factors include… P4-85, L6. This corresponds to… This slope corresponds to…P4-86, L6-8. The Pb concentrations were corrected by… It is not clear how these concentrations were
corrected if authors did not report respirator protection factors. P4-86, L14-15. This corresponds… This (what?) corresponds…P4-90, L1. analyzed data on blood Pb and soil Pb concentration... analyzed blood Pb and soil Pb
concentration data…P4-93, L2. They include… Biokinetic models include… P4-95, L1 and L2. compartments… compartment(s)P4-95, L14. deeper bone regions… deeper kinetic bone regions…P4-95, L18. rapid turnover… rapid formation and turnover…P4-96, 4.7.3. Lead Biomarkers Lead Biomarkers for Pb Exposure and body burden
75

Dr. Michael Rabinowitz
What follows are comments prompted by the text of the documents, arranged by page, and responses to the general and specific charge questions. Which topics to add or subtract, emphasize, shorten, or re-enforce as key concepts, are addressed.
Specific Charge Question 2.
Is this a useful and effective summary?
Yes. It frames the right questions and presents adequate answers.
Is the framework for causal determination appropriately applied?
Yes, but I'd like to see nested models to help show the extent to which Pb is an independent risk factor in the epidemiological modeling, where so much variance is shared. For more, see p 1-19.
Approaches that may improve the communications of key findings?
Among my comments arranged by page are several minor editorial changes to help clarify some points, such as Table 3-1, or Figure 4, for example.
Also, efforts should be made to show the extent or strength of the confounding, in the context of the effect size for lead and for the whole model's predictive power (r-sqr).
Also, see comments at the end about host factors being important, but environmental Pb is a far biggest predictor of PbB. Looking at these host factors helps us identify sub-populations at risk, whose protection drives our calculations, and may offer ideas about mitigation. Still, the more that can be done to lower environmental Pb levels, the less important these other concerns become.
Is combining the health and the ecological effects of lead a useful and effective integration of the scientific evidence?
I strongly concur that combining health and ecological effects of lead yields a more useful and effective integration of the scientific evidence. We are obligated to protect both realms, and MOAs can be clarified. My only real concern is direct conversion of doses and concentrations among species. Because humans and animals occupy different environments and have different eating habits, our sensitivities to environmental lead may be more or less than some other animals. We have seen marine animals take up more lead if they live in the sediments versus animals that live in the water column. Furthermore, the fraction of the whole body burden that is in blood most likely varies among animals. Fish, birds, bovine, and human hemoglobin likely bind Pb with somewhat different strengths, which would profoundly affect their biokinetc distributions. That could be very useful. We have cases of Pb poisoned, nectar feeding birds and, and in another setting, meadow grazed horses, each being a sentinel species, their particular sensitivities proving useful for eventual human protection.
76

Comments Arranged by Page:
Page xxii, Acronyms and Abbreviations - These 17 pages demonstrate the wide range of disciples tapped by the authors of this document: Biology, psychology, medicine, chemistry, physics, geology and mathematics, but add MOA, mode of action, from page 1-9, line 20.
Page 1-1, line 2 - remove second comma. This is a long but not compound sentence. consider......evidence, and it communicates....
Page 1-14 - clear exposition of organization
Page 1-19, line 20 - "detect and control". Also, efforts should be made to show the extent or strength of the confounding, in the context of the effect size for lead and for the whole model's predictive power (r-sqr). The presentation, and the researchers they cite and the journal reviewers they must satisfy seem content to show that Pb has a non-zero coefficient in multiple regression models, for example, of children's mental performance. But, because of the extent of the confounding, this is different than showing that Pb is an independent risk factor. Pb and these other risk factors share considerable variances, particularly in some of the higher risk populations, where Pb exposure and other risk factors often coexist. The relative size of this non-zero coefficient, the size of the Pb effect, should be shown in terms of the model r-sqr, or goodness of fit. How good is that model's fit with and without a Pb term in a series of nested models? Does the r-sqr increase significantly when a Pb term is offered? How much do the confounders' strength shift towards the Pb term, with which it shares variance, when Pb term is introduced? This would help a reader see how much is caused by Pb compared to other risk factors, preventable and otherwise.
My concern is that at increasing low lead levels, where the lead effects is small, blood lead can still be measured relative accurately (often to 2 significant figures) but other, stronger variables, such as maternal education or richness of the child's home environment can be more difficult to measure, subject to reporting errors, and are often entered as broadly categorical variables, while lead is a continuous variable. For these reasons some may be a bit skeptical that at these low levels, effects that have been attributed to lead are fully caused by lead.
Page 1-20, line 1 - Might you want to say anything here about how sample sizes often limit how much stratification can be done.
Page 2-6, line 22 - perhaps.....related to the re-suspension of the Pb
Page 2-6, line 28 - I would like to see the reference of the change in ratios and sources. Does this mean the sources changed their isotopic composition or the relative importance of various sources has changed? Fuel additive Pb isotopes varied among markets and over time. Was a change in food Pb IC seen? The document does not really need reference to isotopes at this point, unless further clarification proves useful.
Page 2-6, line 36 - how about “after ingestion occurs"
77
Page 2-7, line 2 - in vivo is a function of the co-presence or absence of food, host factors such as anemia, iron and calcium status, in vitro particle size and reagents
Page 2-8, line 2 - lactation, fever (more likely), fractures, menopause
Page 2-8, line 16 - indicating higher recent exposures...
Page 2-9, line 17 -...burden, but not practical. Actually urinary output after chelation challenge has been a useful measure of labile body pools of Pb.
Also, on the topic of urinary Pb, the IC of urine tracks plasma Pb on a hourly basis. Urine reflects the filterable fraction of PbB, which equilibrates with the larger pool of RBC-bound Pb over an hourly time scale.
Page 2-11, line 27 - Some proto- porphyrins themselves are behavioral neurotoxins (recall King George III's porphyria ) and the amount of Pb needed to induce ALAD elevations are typically above 15 ug/dL in humans, anemic or not.
Page 2-15, line 15 - but what about the fact that PbB has fallen >10 fold, from > 20 to < 2 ug/dL, but BP has not. It seems like an insensitive relationship. I appreciate the historical significance. The BP-PbB relationship was a selling point for the removal of Pb fuel additives in the 1970's because the target population was middle aged to older males (congressmen worried about their blood pressure).
Page 2-16, line 17 - I liked this
Page 2-18, line 32 - for humans, the values are much higher, so these rats seem much more sensitive to PbPage 2-20, lines 15-16 - The trends here are a bit confusing to me. PbB levels have dropped, and age of puberty have dropped, If inverse, the PbB goes up, then delays goes down.
Page 2-20, line 25 - Were these in occupational settings?
Page 2-24, line 30 - true, and maybe 1000 times lower than in circa 1980.
Page 2-25, line 2 – No, this type of axis scaling axis will not change the shape of curve. Also, ppm is not ug/L (that's ppb). This type of error is troubling.
Page 2-46, line 29 and whole section - Just a summary reminder that the slope will be steeper for children.
The contribution of air Pb to soil and hence to humans is real, but much less efficient than direct inhalation.
Page 2-51, line 8 - In other words, decline attributed to Pb could be accounted for by the extent to which the confounders are harder to separate from a Pb effect at lower Pb levels.
Page 2-51, line 15 - Is this difference statistically significant? The ranges certainly overlap.
78

Page 3-4 - A question: all of the sources except aircraft emit Pb close to ground level where we live, while aircraft emissions are largely high in the troposphere, aside from take-offs. Does this matter or is this factored in somehow? So, is Figure 3-5 based on sales of fuels or where it was emitted?
Page 3-7, line 11 - 2 gr / gal for an automobile fuel would have been mid-range, high-lead high-test back in the day.
Page 3-7, line 19 - ....which are make the Pb combustion products (Pb halides) more volatile. (but they are not more volatile than TEL)
Page 3-8 - If we compare line 32, China's 122 kt/yr with US values of about 1 kt/yr from pages 3-3 and 3-4, and knowing that China is upwind of the US, and knowing China's increasing reliance on coal, rapidly building new coal burning power plants at the rate of about one per month. Therefore, I wonder how much of our air Pb values are under our national control. We could have zero domestic emissions, but measurable airborne Pb.
Page 3-9, Section 3.2.2.4 - I'm not sure the first example is that useful. The European example is better.
Page 3-11, line 14 - Can you make a stronger statement? Not major, maybe minor, or maybe currently on-road usage of gasoline contributes at most X %
Page 3-12, line 31 - maybe say: The potential for widespread dust lead pollution following demolition or sand-blasting depends on the actual site practices, such as hazardous material collection and disposal.
Page 3-13, Figure 3-6 and text - It may be noteworthy to compare current emissions' from aircraft 600 or Mainland China's 120,000 tons/yr with this old data. Page 3-16 - In Table 3-1, maybe add the Pb ore cerrusite. Pb carbonate PbCO3, which is the most toxic, occasionally becoming newsworthy, as in the Esperance episode. It is a rare ore, absent from most major deposits, but predominant in a few mining areas. Page 3-16 - Is lawn mower exhaust a concern?
Page 3-86 - Figure 3-26, why is this important?
Page 4-12, line 26 - Dietary Pb from contaminated soil - tea strikes me as an untypical example, since we do not eat tea. The Pb must be trans-located to the lead from the soil and then infused to the beverage. To grow tea, the soils must be fairly acidic pH 4.5 to 6, which aids metal solubility, and Al rich. There is a vast literature on plant uptake of lead from soil, even prior to 1980, for a wide variety of edible crops and indicators of air pollution. For example, the response of rice crops to Pb amended paddy soils has been well documented. See: Hseu ZY, Su, SW, Lai HY, Guo HY, Chen TC, Chen ZS; Remediation techniques and heavy metal uptake by different rice varieties in metal-contaminated soils of Taiwan. Soil Science and Plant Nutrition 56; p31-52 Feb 2010.
Page 4-13, line 15 - What is sub-proportionally?
79

Page 4-15, line 16 - Can this be expressed up to 25% as much as drinking water... or % of the total, or ug/day. % of water as a source is not that easily understood by me.
Page 4-16, line 11 - Maybe should be Pb-Zn mining (Tar Creek?)
Page 4-17, line 11 - Do we need this example of Nigerian sawdust? Are the values that high? Do we have similar situation anywhere in US?
Page 4-18, Table 4-6 - Why did Mainland Chinese toys and jewelry and venetian blinds not make the list?
Page 4-21 - Organic Pb - In 2nd para the combustion products of Pb+4 (TEL) are Pb+2 so Arthur's work on this topic does not go into this section about organic (Pb+4). Also, the change in PbB for each ug/cu M would yield 1000. it is closer to 3 ( see 4-80). You may want to give the volume of distribution for TEL. For Pb+2, it is about 10L for adult human.
Page 4-24, Figure 4-2 - May I suggest showing only Pb compounds, drop groups 2, 5 and 8. Also, I am surprised phosphate ( pyromorphite ) is so high since the solubility constant is many orders of magnitude lower than anything else shown, even galena.
Page 4-26, line 13 - felt need for summary such as- no chemical form of Pb is safe, i.e. un-absorbable.
Page 4-26, line 18 - in this context, say only ...Pb in whole blood exchanges with both these compartments via the blood plasma.
Page 4-41, line 9 - maybe say ...Each tooth in the mouth has a somewhat different anatomy and period of growth. Further complicating the matter, teeth are composed of enamel, dentine and pulp. Teeth are not like blood, which is a uniform liquid, making dental sampling and interpretation more complex. The ease of collection and the concentration difference (ppm in teeth vs. ppb in blood) at times overrides these concerns.
Page 4-41, line 26 - Some prenatal Pb is still found in the dentine found under the crown rather than down the root
Page 4-42, line 10 - I do concur in that hair is really not well suited as a biomarker for Pb, but hair plays a small role in the body's loss of Pb. Some human kinetic work has been done see7- my article with George Wetherill and Joel Kopple (1976) Delayed appearance of tracer lead in facial hair. Arch Environ Hth 31: 220 - 3.
4 end - A lot has been written about individual factors that modify uptake and susceptibility to environmental Pb ( genetics, gender, nutrition, age...). However, the major predictor of PbB is how much Pb is, I need to emphasize, how much Pb is in the environment, not any of the many host factors.
Other remarks:
In an effort to explore the relationship between exposures and outcomes, a variety of models have been tried. My sense is it that the natural variations in Pb and IQ are much greater than the differences among
80

the predictions of the various models. I am satisfied with the empirical models. Any uncertainty caused by model selection is smaller than the variation in the data.
81

Dr. William Stubblefield
Comments on Chapter 7 - Ecological Effects of Lead
Chapter 7 is a discussion of the ecological effects of Pb. Effects on terrestrial and aquatic ecosystems are first considered separately. They are then integrated by classes of endpoints (bioaccumulation, growth, mortality, hematological effects, development and reproduction, neurobehavior, community and ecosystem effects).
Does the panel consider this approach appropriate?
Chapter 7 provides an excellent synthesis of the available toxicity data for lead. The chapter is well-written and well-organized and does an adequate job of addressing “new” published data (post-2006). The separation of terrestrial and aquatic ecosystem data is appropriate and the subsequent organization by endpoints and levels of biological complexity is good. Some questions may be raised regarding the inclusion of some data and endpoints; however, this will be discussed in greater detail below.
Is it appropriate to derive a causal determination for bioaccumulation as it affects ecosystem services?
This question is a bit difficult to address as posed. The process of bioaccumulation, i.e., the uptake and accumulation of environmental pollutants, may or may not have any effects on ecosystem services. Therefore, bioaccumulation should not necessarily be thought of as an adverse or toxic effect. Bioaccumulation as a result of environmental exposure can result in adverse effects to the exposed organism or to consumers of the organism but only if concentrations of the contaminant are sufficient to elicit a toxic response at a given “site of action.” In many cases bioaccumulation of metals, such as lead, in select tissues is a normal metabolic process by which an organism is able to sequester and ultimately eliminate metals, e.g. metal granule formation in mollusks. It may very well be possible to derive a “causal” relationship between exposure and the presence of metals in tissues. However, due to the non—linear relationship between exposure concentration and tissue concentration with metals, developing a quantitative relationship would be doubtful. Similar concerns exist when evaluating possible food chain related effects. Available data suggest that little tissue bound lead is bio-accessible when consumed by predators, thus leading to “biodilution” of lead concentrations as one moves up the food chain.
Has the ISA adequately characterized the available information on the relationship between Pb exposure and effects on individual organisms and ecosystems, as well the range of exposure concentrations for the specific endpoints?
The ISA has done an excellent job of synthesizing and discussing the relationship between lead exposure and effects on individual organisms and ecosystems since 2006. Since the document relies on data that existed prior to 2006 and does not provide a summary of the extant data it is somewhat difficult to assess how adequately the document characterizes all of the available information. Summarization of all of the available data would be helpful; however, presentation of all of the available data would make the document unwieldy. Presentation of the available data in the form of a species sensitivity distribution (SSD) that identifies new versus old data would be helpful to the reader. Also, the ISA relies solely on published toxicity data available in the open literature. Additional unpublished toxicity information may be available from the lead industry given all of their efforts over the past 5+ years in developing data for
82

compliance with the European REACH regulations. This information is likely to be available either directly from the lead industry or from the European Chemicals Agency. It should also be pointed out that the US EPA Ambient Water Quality Criteria for lead is based on 1985 or older science. In 1999 the US EPA Office of Water announced its intent to revise the existing lead criteria to reflect newer science; to date this has not been done. Clearly, based on the data summarized in the ISA, there is substantial “new” information available upon which to revise the criteria document. In moving forward with the lead air quality criteria it will be necessary for the Office of Air to consider the available new science in deriving their assessment of possible effects to organisms in the aquatic environment.
Are there subject areas that should be added, expanded upon, shortened or removed?
The ISA does a good job of covering the vast majority of post-2006 published data relating to let effects on aquatic and terrestrial organisms. It is interesting, however, that a number of endpoints such as physiological stress, hematological effects, and neurobehavioral effects are considered in this document. Traditionally the US EPA has limited their interpretation of environmental effects to those effects that can be directly related to population and community level concerns. This approach has limited endpoints considered for criteria and standards to those associated with organism survival, growth, and reproduction. Alternative biochemical or physiological level endpoints are considered only when a direct link can be made to population or community level concerns. Therefore, since no direct linkages can be made between an observation of a biochemical, behavioral, or physiologic endpoint and a population or community level concern it may be appropriate to eliminate discussion of these types of endpoints from the ISA.
If the ISA was expanded to consider dose-response in terrestrial systems, should we limit data to field soils?
I would recommend the data should be limited to “natural” soil data. Testing can be conducted under either laboratory or field conditions but the test matrix should be a “true soil.”
If the ISA were expanded to consider dose-response in aquatic systems, how might we most efficiently present toxicity data that varies greatly by organism, and environmental parameters that influence bioavailability (pH, dissolved organic carbon etc.)?
The best approach for presenting wide differences in sensitivity among organisms is through a species sensitivity distribution (SSD) approach.
Environmental parameters that influence bioavailability are best discussed in terms of a description of the biotic ligand model. Application of the BLM to natural waters is best described by presenting the results of calculations using a series of natural waters or waters that exhibit a range of composition and chemical/physical parameters found across the United States. By presenting the data in this fashion the reader can easily ascertain the relative importance of each of the parameters on assessing lead toxicity. This applies to both the aquatic environment as well as to the terrestrial environment.
83

Dr. Ian von Lindern
Overview: The draft Integrated Science Assessment (ISA) is organized, comprehensive, and presented in a logical, transparent manner. It is an impressive well-edited document that is convenient to read and digest, despite its size. The document is structured as a follow up to the EPA 2006 criteria review document and presents many of the conclusions as affirmations or supplements to the 2006 edition. The questions outlined in Section 1 are all keyed to the implications of new evidence that has evolved since the last review and how those studies inform the Agency in meeting its responsibilities.
This is an appropriate approach in light of the EPA ISA strategy, which seems to be to examine whether any new information developed since 2006 provides justification for modifying the earlier analyses.
This works well for those familiar with the previous review. However, this format i) may be challenging for uninitiated readers and reviewers, ii) does not inform the reviewer as to the historic conditions and accomplishments (in some areas), and iii) does not address weaknesses (in some areas) in the information base identified or analyses conducted in the last review.
Historic Perspective: There were challenges encountered in the previous review that indicated significant gaps in the knowledge base. These information gaps introduced uncertainties into the process that should be revisited. The last NAAQS review showed that EPA had, in maintaining the irrelevant standard from 1978-2007, “lost track” of key parameters necessary to effectively assess the health and ecological risks of airborne lead in the U.S. Relatively little data were available in several key areas for performing a responsible risk assessment.
It seems EPA intends to conclude in the Risk Assessment Planning document that, although substantive information has accumulated, little of this information changes the analyses or conclusions developed and presented in 2006. Based on the information presented, this conclusion does appear to be justified. However, there seems to be a disconnect in that i) significant data deficiencies were identified in 2006, ii) EPA is the Agency responsible to collect the data to fill these data gaps, iii) now EPA concludes the data continue to be unavailable to appropriately assess lead exposure in the country, and iv) the old risk analyses will be continued to be relied upon for another five years.
The current exposure and risk assessment strategy evaluates pilot examples representing real situations prevalent in the country. These analyses are modeling exercises based on outdated empirical relationships and little concurrent ambient data. These situations show substantial probability of exceeding the new NAAQS and attendant levels of excess risk to surrounding populations. The major problem with respect to current exposure and risk analyses is that EPA is unable to estimate how much of the country is subject to these excessive levels.
The ISA should point this deficiency out and ascertain whether there are technological or scientific barriers to developing the requisite information from existing sources, or through new program activities. The subsequent policy analyses should examine whether relevant databases are being developed, both internal and external to the EPA. Should EPA be developing, supporting, or implementing programmatic activities to make it possible to move from the near total reliance on risk modeling to observational and empirical analysis of contemporaneous data?
84

Several questions should be answered with respect to monitoring and surveillance. What data base is accumulating with respect to compliance with the new standard? Is a network established, is it adequate and effective, and are there detectable blood lead levels associated with any gradient in exposure? Have there been excursions? Certain U.S. sub-populations (e.g. immigrants and inner city children) are at substantially greater risk of exposure due to co-factors associated with different cultures, climates, dietary and nutritional regimes, as are being encountered in the global lead poisoning epidemic. Are these venues being monitored?
ISA Exposure Assessment Review: Evaluation of the Exposure Assessment portion of the document begins with Chapter 1 and extends through Chapter 4.
Chapters 1 and 2 Introduction and Integrative Health and Ecological Overview, respectively, are well organized, edited to provide a clear and transparent presentation of the intent and structure, and effectively summarize the document. Section 1.6 on causality and EPA’s Framework for Causal Determination is particularly strong and organized to clearly present EPA’s conclusions and justifications with respect to health issues. Section 2.7 and 2.8 are also especially pertinent additions and improvements to the Criteria Document process. Overall, the causation and health effects sections are impressive, comprehensive, and well-supported.
In contrast, there is little discussion and few conclusions presented regarding sources, uses, ambient concentrations, exposure or populations at risk. Only 4 of 72 pages in the summary Chapter 2 discuss Ambient Lead and Exposure, followed by 2 pages of Toxicokinetics and Biomarkers, compared to 16 pages of Human Health Effects and 15 pages of Ecological Effects summary. This is followed by an 18 page summary dedicated to Integration of Human Health and Ecological Effects.
The latter is a particularly good presentation and the Agency should be commended for beginning to make these connections formally in policy support documents. It is a step forward in environmental regulatory approach that will well serve both the environment and U.S. health and ecological policy. Table 2.8 in the Chapter 2 summary is particularly strong in making this point. Unfortunately, the relative amount of attention paid to exposure in the summary is appropriate to the makeup of the document as a whole, with more than 70% of the ISA dedicated to health effects and causality. This is also likely reflective of where research and monitoring attention and publication resources have been focused in recent years. With regard to the AQCD it is also points out the greatest deficiencies in the last NAAQS process have not been addressed and are perhaps being compounded and extended in this revision.
Developing effective exposure estimates was the weakest point in the analyses that supported the current NAAQS. This was due to the lack of monitoring data available to assess contemporary exposures in the U.S., or to support the modeling analyses relied on in subsequent development of the NAAQS. Unfortunately, in the last review, the EPA was challenged in effectively estimating the extent of potential damage in the general population; the relationship between air lead levels, emissions and absorption; a safe air lead concentration; or the number of citizens exposed to potentially dangerous levels.
85

This weakness was identified in the 2006 AQCD and the OAQPS made the best of a poorly characterized situation. There were insufficient data to characterize active emissions and emission rates, ambient concentrations and the degree, extent and severity of ongoing redistribution of residual lead in the nation’s environment. As a result, EPA relied on modeling and decades-old empirical relationships to quantify exposures. This resulted in considerable uncertainty inherent in the overall process. Chapter 3 Ambient Lead: Source to Concentration: Chapter 3 addresses the areas identified as data gaps in the last review, and presents the information that will eventually be relied upon in developing exposure risk assessments for the U.S. population. There has been some additional ambient monitoring conducted since 2007 that better informs the Agency with respect to population exposure. Formal and Informal Uses of Lead in the U.S.: Prior to discussing the adequacy of available ambient lead data, it is critical to note that there is no information relative to trends of commercial use and disposition of lead in U.S. commerce in the entire document. That 2006 AQCD indicated that use and consumption of lead in the U.S. were approaching levels near the peak utilization seen before the gasoline additive phase down. Yet, it seems the EPA has little or no information on the current life-cycle of lead in either the formal or informal industrial sector in the U.S. Does the Agency know how much or where this lead is being produced, used, consumed, recycled, recovered, reused, disposed of, or if it is being exported as waste? Is this information obtainable? Are any data bases available? Is the information reliable? It seems these data would inform the Agency as to where appropriate monitoring and testing should be undertaken.
Sources of Atmospheric Lead: Sections 3.1 and 3.2 discuss sources of lead and summarize the National Emissions Inventory and discuss other anthropogenic sources of airborne lead. This discussion provides a good overview of the larger airborne sources in the U.S. and provides a county-by-county database to characterize the magnitude and extent of these sources across the country. These sections indicate that there are some quantitative data regarding larger point sources in the country and a basic understanding of source behavior with respect to numerous smaller lead sites in which the airborne pathway plays a significant role in human and ecologic exposure. However, there does not seem to be an inventory of the latter sites. How many are there? Where are these located? Is the list complete? Are there populations nearby? Are health risks in these areas addressed in other regulatory programs?
Fate and Transport: Section 3.3 provides good discussion of lead fate and transport in the environment and recognizes that the majority of environmental lead is potentially air lead in waiting, or once was air lead, and can easily be transferred to other environmental compartments of exposure significance.
Air Quality Monitoring / Surveillance: Section 3.4 is an informative discussion of lead monitoring techniques and appropriately covers the available technology to effectively monitor air lead in the U.S.
Section 3.5 does provide some new information to address the data gaps identified in 2006. There have been additional monitoring data collected in the interim that provide some concurrent information regarding airborne exposures in the U.S. Although a fair quantitative discussion and an extensive Appendix are provided, no conclusions are drawn with regard to the quality, representativeness and degree of compliance with the NAAQS as currently implemented.
With regard to compliance or implied risk, this information is confusing. It seems that “Source Oriented TSP monitors” indicate the NAAQS is being exceeded in 14 of 22 counties being monitored across the
86

U.S. Conversely, non-source oriented monitors show levels generally well below the new NAAQS standard. Additional discussion is provided with regard to PM10 and PM2.5 monitors analyzed for lead. These networks generally seem to show overall compliance with the new NAAQS, even when TSP monitoring shows the same areas at-risk.
However, there seems to be no “take away” message with regard to these data and analyses. This is in stark contrast to the health issues presented and discussed in the document that are clearly conclusion oriented. Questions that come to mind include:
What is the appropriate monitoring technique? One method shows 2/3rds of all source oriented sites are out of compliance across the U.S.; the other method shows 3 of 323 sites exceed the criteria, but does not specify source type. Does the latter method appropriately reflect the risk associated with these sources?
If 2/3rds of source oriented sites are out of compliance, how many of these sites are there in the country? Are there only 22 that are being effectively monitored, or hundreds or thousands not being monitored? What populations are exposed by these sites? How do these sites relate to the National Emissions Inventory presented earlier in the Chapter, or are these the other anthropogenic sites, for which there is no inventory? It seems there should either be answers provided to these questions to support a national risk assessment, or an indication that the problem is not appropriately characterized by current source inventory and monitoring efforts.
Particle Size: Section 3.5.3 addresses particle size distribution of lead-bearing particulate and seems to be oriented toward eventual monitoring and health risk assessment of lead particulate. Doubtless particle size is a critical parameter with respect to collection efficiency and transport, solubility, chemical-transformation and toxicological properties. However, it must be remembered that lead in any particle size seen within these discussions is, or soon can be, hazardous to children and other receptors.
Concentrations in Other Media: The remainder of Chapter 3 is dedicated to summarizing lead concentrations observed in various environmental media. These are good and informative discussions. The air lead discussion does a good job of describing the large decreases noted with the gasoline phase down. It would also be important to note the decreases associated with point sources in the same time frame, particularly with respect to smelting, mineral processing and secondary recycling. The ambient air lead decreases in the vicinity of these sources were significantly greater than those achieved in urban areas through the phase down. Moreover, many of these industries were shutdown and were replaced in the global sense outside the U.S.
The document would also benefit from a larger historic perspective to the other media similar to that developed for air. Other media and biota have seen significant concentration decreases since the phase down and industry shutdown and cleanups. However, the pattern, length of time, relative magnitude and toxicological significance of these declines vary by media. It would be beneficial to note these patterns, particularly in light of the increasing interest in ecological response and potential secondary standard considerations.
Chapter 3 should develop a conclusion oriented format similar to that employed for the causality associations made in Chapter 2 and the other subject areas of the document.
87

Chapter 4 Exposure, Toxicokinetics and Biomarkers:
Pathways and Exposure Parameters: Chapter 4 addresses Exposure Assessment in Section 4.1 and begins with an appropriate discussion of pathways. There appears to be a typo on line 4 regarding the gasoline phase down date, but the text notes the associated historic reductions in air lead exposures. It is always good to note that significant air lead reductions also were noted in the vicinity of point sources, and other media concentration decreases were observed, both attendant to and independent of the phase down and curtailments in industrial emissions.
This is followed by a discussion of indoor versus outdoor versus personal exposure that does not quite reach a conclusion. It seems that personal exposures are generally higher than the ambient exposures, which is important to note, and indoor versus outdoor tends to vary with site specifics and season and cannot be generalized. Soils and dusts are discussed next. The complexity and interrelationship of these variables and the role of air media in the continual exchange between these media is emphasized, but it might be noted that a clear empirical relationship between soil and dust has yet to be demonstrated, as it also likely tends to vary with specific site conditions, seasonality, etc.
The remainder of this section discusses other media and effectively summarizes the current state of knowledge with respect to relative significance of these media in acting as sources in pathways common to North America, Europe and Australia, where almost all of these studies have derived. A limited amount of discussion is provided for China. However, it should be noted that exposure sources and pathways are moderated by behavior, housing, lifestyle and cultural patterns. These patterns vary immensely for developing and middle-income countries and cultures, as compared to the U.S. Also many immigrant populations in the U.S. may engage in ethnic and cultural behaviors leaving them more susceptible to lead intake and uptake.
All of these sections would benefit from a brief description of how the concentrations and relative intakes have decreased in association with the phase down, industrial source curtailment, and decrease in lead content of consumer goods over the past three decades. Table 4.5 could benefit from some additional description of dry weight versus wet weight considerations for dietary crops and how that relates to ingestion of lead from soils versus foodstuff. Description of how concentrations and intakes from these same media can vary dramatically in cultural, ethnic and socio-economic situations differing from Europe and North America would be a benefit to the document.
In Table 4.6, one study shows lead content in ug as opposed to a concentration. A footnote would be appropriate to allow comparison to other entries in the Table.
Toxicokinetics: The toxicokinetics discussion is concise and well-developed and reflective of the current understanding and practice in risk assessment activities. The discussion could be amplified with respect to the uncertainties associated with uptake and excretion in populations outside of North America and European populations.
Biomarkers: The discussion in Section 4.3.2 Blood Lead measurements has a confusing transition from analytical techniques to ALAD from page 4-35 to 4-36. Perhaps the analytical discussion could be expanded and some transition language be inserted, or the discussion of the significance of ALAD be moved or combined with Section 4.3.4.4.
88

Relationship of Lead in Blood and Lead in Bone: The overall discussion of the health significance and interrelationship of these biomarkers is informative and well presented. It might be useful to discuss the relevance of these biomarkers in terms of internal exposure to organs and tissue and the relevance to immediate toxic health effects.
Exposure-Blood Lead Relationships: Section 4.5 through the Summary in Section 4.7 provides a concise summary of this topic area that has been well vetted in several previous SAB reviews and represents the current scientific consensus for this important segment of risk assessment process.
Chapter 4 should develop a conclusion oriented format similar to that employed for the causality associations made in Chapter 2 and the other subject areas of the document.
Policy Implications: The ISA is reflective of a long history of lead health and risk assessment and attendant regulatory programs. These actions have reduced lead exposures and health effects in the U.S. and other developed countries by orders of magnitude over the past four decades. As the populations in these countries attain ever lower blood lead levels and body burdens, investigators are observing previously undetected adverse outcomes. In the last decade, lead-related research has continued to concentrate on investigating and defining adverse effects at ever-lower exposure levels. Similarly the ISA is heavily weighted toward assessing and characterizing new information regarding health effects.
However, during this time, the EPA and other environmental regulators have diminished the monitoring and programmatic attention paid to lead, as the overt health risks have subsided. This has occurred because the ambient exposures have decreased dramatically to levels unimaginable in previous decades, and other health risks have taken priority.
Nevertheless, the demand for and consumption of lead in the U.S. have increased markedly in this century, accompanied by substantial price increases in the domestic and world market. As noted above, other general exposure considerations related to market and use factors; (i.e. emission sources, commercial uses, waste, recovery, recycling and disposition and fate of lead) in the U.S. today are poorly understood, nor have exposure parameters been quantified. There is no treatment of these factors in the ISA. It is unclear if there are any data, or whether EPA sought such information. Several other issues, generally considered in policy decisions, not included in the ISA are advancements in pollution control capacity, best available technologies, and best practices for source control.
Data Sources: Unfortunately, the best information for production data, emission information, industry transition and economic indicators is more likely to be found in the trade literature and government agency records. Much of the practical knowledge that has been developed in applying scientific findings and methods to remedial and regulatory activities is generated and housed in programmatic activities within EPA and the States.
In 2006, the CASAC urged the Agency to mine these data sources in the last review. The sources cited in the ISA review seem to have been limited to the peer reviewed literature and the national air quality monitoring network. Perhaps in developing the attendant policy recommendations, the Agency will explore the life cycle and economic impacts of lead regulation in both this country and overseas.
Global Considerations: Although U.S. lead demand has increased, domestic production and recycling and recovery of many discarded lead products have been diverted to developing countries. Much of this
89

is diversion results from EPA policies. On the international scene, the increased price and demand observed in the last five years has had devastating effects, substantially more severe than those observed in the 1970s. Environmental exposures and lead poisoning are increasing with several incidences of severe morbidity and substantial mortality associated with the increased demand and high price of metals. Hundreds of children have died at some sites and thousands suffer irreversible health effects that their families and communities must cope with for decades.
More children in the world die and suffer irreversible, dysfunctional brain damage due to lead poisoning today than in the last fifty years. Although air lead levels in the U.S. are at an all time low, the implications for regulation of lead releases and the impact of U.S. policies in the global environment and human health are substantial. If not in the ISA, it seems the EPA has an obligation to inform the policy makers of the global consequences of lead regulation, or lack thereof. Similarly the U.S. has an obligation to export the scientific knowledge base, consequences of irresponsible practices, and information regarding mitigation of adverse effects. The subsequent regulatory policies when implemented have ramifications, not only beyond ambient air lead levels, but throughout the world.
90

Dr. Gail Wasserman
Comments on Chapter 2 - Integrative Health and Ecological Effects Overview
1. I disagree with the use of the conceptual heading “neurological” to encompass what are functional (ie neuropsychological or neurocognitive deficits; neurobehavioral problems) as well as structural and mechanistic components. The super-ordinate heading would be better cast as “central and peripheral nervous system” effects (at the level of cardio-vascular, or immune-system effects). Neurological is too narrow a term for the array of functional, mechanistic, and structural problems considered under this heading. In point of fact, those of us studying neurocognitive or neurobehavioral problems are rarely neurologists, and our work is not published in neurology journals.
2. I found the framework for designating the strength of the causal evidence to be very helpful. The characterization of the minimal BLL at which effects are noted is clear.
3. Many practitioners may read the integrated summary (Chapter 2) rather than the longer, more detailed presentation of the evidence (Chapter 5). There is no mention of effect sizes or clinical significance for the neuropsychological and neurobehavioral outcomes summarized in Chapter 2. This would be essential for a cost-benefit discussion.
4. The integration of associations across human and animal species was clear and useful.
Comments on Chapter 5 - Integrated Health Effects of Lead Exposure
General points:
1. See point 1, raised for Chapter 2.
2. In some places, more cross-talk inter-relating commonalities (or their lack) between content areas reviewed would help. As examples, see specific points made below for pages 5-53, 5-57, 5-58, 5-105.
3. There is little provided in this chapter, or elsewhere, about the clinical significance of the effect sizes noted, which is important for policy-making and cost-benefit analysts. I think this holds for the effect sizes for other outcomes as well.
Also, the point I made for the REA holds here as well: there needs to be a discussion of the metrics of IQ scoring and the clinical significance of small deficits. As a practicing psychologist, I find the parsing of IQ scores into “points lost” that translates into fractions of a single point very uncomfortable, especially given that the standard error of measurement for most IQ tests is 5 points. There needs to be some risk/benefit awareness of the policy implications of interventions at very low blood lead levels.
4. Regarding the expansion of endpoints, I think there is already a wide array. Integration of associations within and across endpoints could be increased, though, especially concerning mechanisms. In other words, are there evaluated (or not yet evaluated) models that interrelate mechanistic impacts across several systems? More specific points:
91
P 5-45. There is inconsistency across age in behavioral effects (depression in adults, ADHD in kids). Some attempt should be made to explain this.
Table 5-2 and 5-3 The Factor-Litvak paper is a secondary summary; it would be better to reference the original source, which is not cited in this chapter. That citation is:
Wasserman, G.A., Liu, X., Lolacono, N.,J., Factor-Litvak, P., Kline, J. K., Popovac, D., Morina, N., Musabegovic, A., Vrenezi, N., Capuni-Paracka, S., Lekic, V., Pretini-Redjepi, E., Hadzialjevic, S., Slavkovich, V., & Graziano, J.H. (1997). Lead exposure and intelligence in 7 year old children. Environmental Health Perspectives, 105, 956-962.
In another report, we noted differential impact on Visual Motor, rather than language, skill, significantly so:
Wasserman, G.A., Graziano, J.H., Factor-Litvak, P., Popovac, D., Morina, N., Musabegovic, A., Vrenzi, N., Capuni-Paracka, S., Lekic, V., Pretini-Redjepi, E., Hadzialevic, S., Slavkovich V., Kline, J., Shrout, P. & Stein, Z. (1994). Consequences of lead exposure and iron supplementation on childhood development at age four years. Neurotoxicology & Teratology, 16, 233-240.
P 5-52, L 29. In fact, MOST tests of neurocognitive function are interrelated, not “several”.
P 5-53 and 54 and Table 5-4. Specific Indices of Cognitive Function. It should be pointed out that these other functions contribute to intelligence, so these effects are more by way of explaining the IQ associations than additional functions impacted. It would helpful to point out if some functions are consistently more impacted than others (for example, the prospective studies often reported stronger associations with visual motor than with verbal skills). The inclusion of the Bayley MDI results in this section represents somewhat of an organizational anomaly, as this assessment is an infant developmental test, and not one that measures the differentiated areas presented in the table. Tests of “intelligence” do not generally measure skills in the early age range tapped on the Bayley, so it is often seen as an analogue to overall intelligence, appropriate to its age-range. On the other hand, developmental research consistently documents reduced stability and predictive validity for tests of abilities measured for infants (as opposed to preschoolers) so that the generally stronger effects shown for MDI relative to the other items in Table 5-4 should be seen in this context. Finally, the discussion of specific indices should include Canfield RL, Gendle MH, Cory-Slechta DA. Impaired neuropsychological functioning in lead-exposed children. Dev.Neuropsychol. 2004;26:513-40, which used the CANTAB battery.
P 5-57. In the discussion of the Surkan study, the point should be made that maternal self-esteem (like depression) is likely related to many components of childrearing that are commonly measured by an instrument such as the HOME Scale (for which most studies of children’s neurocognitive or neurobehavioral function often adjust).
P 5-58. It should not be a surprise that academic performance reveals adverse associations with lead exposure, since these probably result from more primary impacts on both neurocognitive (IQ, processing) and behavioral (attention problems) functions.
92

P 5-62. In a section on timing of exposure and cognition, the report cites our 1998 paper, which is a study of behavior problems. We looked at timing of exposure in the paper above, in preschoolers. The accompanying table (5-7) has the correct reference. This section, on the timing of exposure, beginning on p 5-61, appears in a section on cognition, but then Table 5.5 also considers behavior problems. There is a separate later section on behavior problems, and shouldn’t that section precede a discussion of the duration of exposure? Or consider the timing of behavioral effects separately when those effects are discussed, later.
P 5-69. The Wasserman et al 2000 paper compared different trajectories of lead exposure across ages 4-7y, finding independent prenatal and postnatal associations, as well as a sharply increased slope of BL/IQ association in the 0-10 ug/dl range.
Wasserman, G.A., Liu, X., Popovac, D., Factor-Litvak, P., Kline, J., Waternaux, C., LoIacono, N. & Graziano, J.H. (2000) The Yugoslavia Prospective Lead Study: Contributions of prenatal and postnatal lead exposure to early intelligence, Neurotoxicology and Teratology, 22, 811-818.
P 5-99. The text notes that non-cognitive effects are more complex to study than are IQ tests. I do not disagree, but the report should indicate why.
P5-101, L2, also Figs 5-20 and 5-21. Text should point out that while an adverse association with BPb is generally reflected in negative associations (lower IQ with increasing BPb), for behavior problems, this association is positive (more problems with increasing BPb). Otherwise the use of the word “positive” may be confusing to some readers.
P5-105 (and others in this section). The review should consistently note what features (if any) were adjusted for in these analyses, or other ways to weight the array of evidence. Also, as noted, the section on adults reports associations for mood problems, while in children, externalizing (conduct, attention) problems are most commonly noted. Is there any way to make sense of these developmental differences in content areas?
P5-121. In discussing PD and tremor, some mention should be made of the importance of adjusting for co-exposures, particularly Mn, with commonly reported associations.
P5-127, L 29. I believe this should read “associated”, and not “association”.
There is a new paper following up the New England sample into adulthood: Mazumdar et al. Environmental Health 2011, 10:24
93

Dr. Michael Weitzman
Comments on Chapter 2 – Integrative Health and Ecological Effects Overview
EPA has done a remarkable job in synthesizing a vast literature and presenting it scientifically and comprehensibly.
I have one concern and one additional suggestion:
1. The only mention of lead-based paint as a source of children’s exposure was on page 2-6, in the third paragraph: “Studies have suggested that blood Pb is associated with exposure to Pb paints in older homes…..” It has been my understanding for quite a long time that household lead in dust, primarily from deteriorated lead based paint, is the major source of children’s exposure. I believe that this is central to most pediatric and federal and local efforts to prevent childhood lead exposure. Is this deserving of more discussion?
2. While Chapter 2, 5 and 6 mention lead and delinquent behavior, there is a literature, albeit small, that shows an association between blood lead levels and violent behaviors (e.g. several studies by R. Nevin. Should these be discussed for the purposes of thoroughness?
Comments on Chapter 6 - Susceptible Populations and Lifestages
EPA is to be truly congratulated for a remarkably comprehensive and cogent review of the literature on Susceptibility Factors and Lifestages Related to (a) Lead Exposure and Dose and (b) Lead Induced Health Effects. I do think that the characteristics included are appropriate and consistent and I do believe it appropriate to include material on susceptibility factors related to Pb exposure and dose.
The following comments and suggestions are offered with the intention of improving an already excellent document:
1. There are a fair number of places in the Section concerning Lead Induced Health Effects that better belong in the Section concerning Lead Exposure and Dose, as this is often confusing as written. A few examples include (possibly) sentence 1, last paragraph, pg 6-11; sentence 2, paragraph 1, pg 6-12; paragraph one under Hormones, pg 6-16 and 6-17 and paragraph 2 under Vitamin D Receptor, pg 6-18 and 6-19.
2. Similarly, throughout this chapter there is mention that specific topics are discussed in more detail elsewhere in the overall document and it would be extremely useful to point the reader to those sections in which specific topics are discussed in more detail.
3. For areas of discussion that rely on a small number of studies I urge caution comparable to that so well utilized elsewhere to explicitly identify the level within the five level hierarchy classifying the weight of evidence for causation.
4. In discussing Susceptibility to Lead Exposure and Dose I suggest adding discussion of:
94

a. housing—one could use various cut points, such as pre-1950 housing or pre-1970 housing—data are available on how housing stock age relates to blood lead levels. There also are data about numbers of housing units in the USA that have had windows replaced or lead related abatements or renovations (repairs) and how these relate to lead exposure and these data have, I believe, been well summarized by the National Center for Healthy Housing and HUD. Similarly, household dust lead levels clearly represent a (the) major risk factor for lead exposure, at least of children, and I suggest considering a related section on what is known about soil lead levels and coverings with grass and foundation shrubbery and blood lead levels
b. nutritional status-while briefly mentioned in the section on Lead Induced Health Effects, there is no parallel section on diet and lead exposure: iron deficiency is well documented to increase lead absorption from the GI tract, with a less robust literature on dietary calcium and fat intake. Given the obesity epidemic, with its associated epidemic of low Serum Vitamin D levels (as a fat soluble vitamin it is not yet clear that low serum Vitamin D levels in overweight individuals manifest comparable effects to low Vitamin D levels in the general population)
c. immigrant groups from countries with high lead exposure d. users of folk remedies from multiple countries such as India, Mexico and those in
Southeast Asia.
5. Susceptibility Factors and Lifestages and Lead Induced Health Effects - This section, again, I believe to be excellent, but would benefit from extensive cross referencing to other chapters. Several things that I think deserve some discussion include:
a. are children and adults with ongoing exposure at more risk than those whose exposure is more limited, and does intermittent repeated increased exposures cause additional, cumulative or multiplicative damage?
b. the use of low birthweight in many studies of lead effects on children is very non-specific, very low birthweight, extremely low birthweight, intraventricular hemorrhages all may (or may not) characterize vulnerable populations, as may
c. children who have repeated head tramua (i.e repeat concussions)d. those from bilingual homese. those whose mothers OR fathers are depressed or suffer from other mental illnessesf. pg 6-21: are the associations with lead different for Type 1 and Type 2 Diabetes? g. are there no studies of lead exposure and obesity, or of lead leading to increased rates
of co-morbidities of those who are obese (elevated cholesterol/triglycerides, hypertension, central obesitiy, hepatitis, hypertension) or of asthma and lead exposure?
95