MPSI 2016.12.31 DOC WITHOUT SUPPLEMENTALScorporate.moneygram.com/documents/MGIGlobal/IN/2016... ·...
40
MoneyGram Payment Systems, Inc. and Subsidiaries (A Wholly Owned Subsidiary of MoneyGram Payment Systems Worldwide, Inc., a Wholly Owned Subsidiary of MoneyGram International, Inc.) Consolidated Financial Statements as of December 31, 2016 and 2015, and for each of the Three Years in the Period Ended December 31, 2016, and Independent Auditors’ Report
Transcript of MPSI 2016.12.31 DOC WITHOUT SUPPLEMENTALScorporate.moneygram.com/documents/MGIGlobal/IN/2016... ·...

MoneyGram PaymentSystems, Inc. and Subsidiaries
(A Wholly Owned Subsidiary of MoneyGram Payment Systems Worldwide, Inc., a Wholly Owned Subsidiary of MoneyGram International, Inc.)
Consolidated Financial Statements as of December 31, 2016 and 2015, and for each of theThree Years in the Period Ended December 31, 2016, and Independent Auditors’ Report

1
MONEYGRAM PAYMENT SYSTEMS, INC. AND SUBSIDIARIES(A Wholly Owned Subsidiary of MoneyGram Payment Systems Worldwide, Inc., a Wholly Owned
Subsidiary of MoneyGram International, Inc.)Index to Financial Statements
Independent Auditors' ReportConsolidated Balance Sheets as of December 31, 2016 and 2015Consolidated Statements of Operations for the years ended December 31, 2016, 2015 and 2014Consolidated Statements of Comprehensive Income (Loss) for the years ended December 31, 2016, 2015 and 2014Consolidated Statements of Cash Flows for the years ended December 31, 2016, 2015 and 2014Consolidated Statements of Stockholder's Equity for the years ended December 31, 2016, 2015 and 2014Notes to the Consolidated Financial Statements
2456789

KPMG LLP is a Delaware limited liability partnership and the U.S. member firm of the KPMG network of independent member firms affiliated with KPMG International Cooperative (“KPMG International”), a Swiss entity.
KPMG LLPSuite 14002323 Ross AvenueDallas, TX 75201-2721
2
Independent Auditors’ Report
The Board of Directors MoneyGram Payment Systems, Inc.:
We have audited the accompanying consolidated financial statements of MoneyGram Payment Systems, Inc. and its subsidiaries, which comprise the consolidated balance sheet as of December 31, 2016, and the related consolidated statements of operations, comprehensive income (loss), cash flows and stockholder’s equity for the year then ended, and the related notes to the consolidated financial statements.
Management’s Responsibility for the Financial Statements
Management is responsible for the preparation and fair presentation of these consolidated financial statements in accordance with U.S. generally accepted accounting principles; this includes the design, implementation, and maintenance of internal control relevant to the preparation and fair presentation of consolidated financial statements that are free from material misstatement, whether due to fraud or error.
Auditors’ Responsibility
Our responsibility is to express an opinion on these consolidated financial statements based on our audit. We conducted our audit in accordance with auditing standards generally accepted in the United States of America. Those standards require that we plan and perform the audit to obtain reasonable assurance about whether the consolidated financial statements are free from material misstatement.
An audit involves performing procedures to obtain audit evidence about the amounts and disclosures in the consolidated financial statements. The procedures selected depend on the auditors’ judgment, including the assessment of the risks of material misstatement of the consolidated financial statements, whether due to fraud or error. In making those risk assessments, the auditor considers internal control relevant to the entity’s preparation and fair presentation of the consolidated financial statements in order to design audit procedures that are appropriate in the circumstances, but not for the purpose of expressing an opinion on the effectiveness of the entity’s internal control. Accordingly, we express no such opinion. An audit also includes evaluating the appropriateness of accounting policies used and the reasonableness of significant accounting estimates made by management, as well as evaluating the overall presentation of the consolidated financial statements.
We believe that the audit evidence we have obtained is sufficient and appropriate to provide a basis for our opinion.
Opinion
In our opinion, the 2016 consolidated financial statements referred to above present fairly, in all material respects, the financial position of MoneyGram Payment Systems, Inc. and its subsidiaries as of December 31, 2016, and the results of their operations and their cash flows for the year then ended in accordance with U.S. generally accepted accounting principles.

3
Other Matter
The accompanying consolidated financial statements of MoneyGram Payment Systems, Inc. and its subsidiaries as of December 31, 2015 and for each of the years in the two-year period ended December 31, 2015 were audited by other auditors whose report thereon dated March 25, 2016 (except for the effects of the immaterial error correction disclosed in note 15 to the consolidated financial statements and the adoption of ASU 2015-07, Fair Value Measurement (Topic 820): Disclosures for Investments in Certain Entities That
Calculate Net Asset Value per Share (or Its Equivalent), discussed in notes 2 and 9 to the consolidated financial statements for which the date is March 29, 2017), expressed an unmodified opinion on those financial statements.
Dallas, Texas March 29, 2017
“PRIVILEGED & CONFIDENTIAL” Distribution of the information contained herein is prohibited.
4
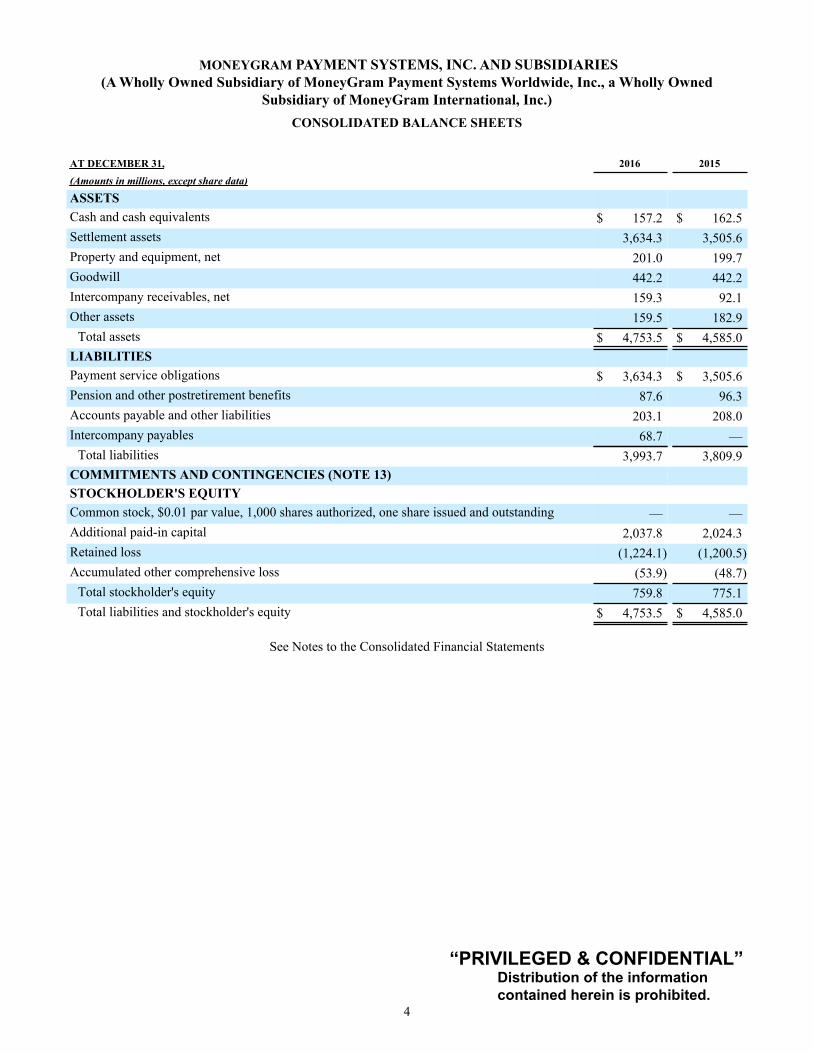
MONEYGRAM PAYMENT SYSTEMS, INC. AND SUBSIDIARIES(A Wholly Owned Subsidiary of MoneyGram Payment Systems Worldwide, Inc., a Wholly Owned
Subsidiary of MoneyGram International, Inc.)CONSOLIDATED BALANCE SHEETS
AT DECEMBER 31, 2016 2015(Amounts in millions, except share data)
ASSETSCash and cash equivalents $ 157.2 $ 162.5Settlement assets 3,634.3 3,505.6Property and equipment, net 201.0 199.7Goodwill 442.2 442.2Intercompany receivables, net 159.3 92.1Other assets 159.5 182.9
Total assets $ 4,753.5 $ 4,585.0LIABILITIESPayment service obligations $ 3,634.3 $ 3,505.6Pension and other postretirement benefits 87.6 96.3Accounts payable and other liabilities 203.1 208.0Intercompany payables 68.7 —
Total liabilities 3,993.7 3,809.9COMMITMENTS AND CONTINGENCIES (NOTE 13)STOCKHOLDER'S EQUITYCommon stock, $0.01 par value, 1,000 shares authorized, one share issued and outstanding — —Additional paid-in capital 2,037.8 2,024.3Retained loss (1,224.1) (1,200.5)Accumulated other comprehensive loss (53.9) (48.7)
Total stockholder's equity 759.8 775.1Total liabilities and stockholder's equity $ 4,753.5 $ 4,585.0
See Notes to the Consolidated Financial Statements

“PRIVILEGED & CONFIDENTIAL” Distribution of the information contained herein is prohibited.
5
MONEYGRAM PAYMENT SYSTEMS, INC. AND SUBSIDIARIES(A Wholly Owned Subsidiary of MoneyGram Payment Systems Worldwide, Inc., a Wholly Owned
Subsidiary of MoneyGram International, Inc.)CONSOLIDATED STATEMENTS OF OPERATIONS
FOR THE YEAR ENDED DECEMBER 31, 2016 2015 2014(Amounts in millions)
REVENUEFee and other revenue $ 1,612.4 $ 1,527.0 $ 1,533.9Investment revenue 18.0 12.1 16.5
Total revenue 1,630.4 1,539.1 1,550.4EXPENSES
Fee and other commissions expense 793.1 759.8 761.5Investment commissions expense 2.5 0.8 0.4
Total commissions expense 795.6 760.6 761.9Compensation and benefits 295.1 309.1 275.0Transaction and operations support 307.5 323.2 328.9Occupancy, equipment and supplies 61.9 62.3 54.4Depreciation and amortization 79.9 66.1 55.5
Total operating expenses 1,540.0 1,521.3 1,475.7OPERATING INCOME 90.4 17.8 74.7Other income
Net securities gains — — 45.4Total other income — — 45.4
Income before income taxes 90.4 17.8 120.1Income tax expense 43.3 64.2 17.1NET INCOME (LOSS) $ 47.1 $ (46.4) $ 103.0
See Notes to the Consolidated Financial Statements

“PRIVILEGED & CONFIDENTIAL” Distribution of the information contained herein is prohibited.
6
MONEYGRAM PAYMENT SYSTEMS, INC. AND SUBSIDIARIES(A Wholly Owned Subsidiary of MoneyGram Payment Systems Worldwide, Inc., a Wholly Owned
Subsidiary of MoneyGram International, Inc.)CONSOLIDATED STATEMENTS OF COMPREHENSIVE INCOME (LOSS)
FOR THE YEAR ENDED DECEMBER 31, 2016 2015 2014(Amounts in millions)
NET INCOME (LOSS) $ 47.1 $ (46.4) $ 103.0OTHER COMPREHENSIVE (LOSS) INCOME
Net change in unrealized holding gains on available-for-sale securities arising duringthe period, net of tax benefit of $0.1, $0.0 and $0.2 for the years ended December 31,2016, 2015 and 2014, respectively (0.3) (0.1) (6.1)
Net change in pension liability due to amortization of prior service credit and netactuarial loss, net of tax benefit of $1.9, $3.1 and $2.5 for the years ended December31, 2016, 2015 and 2014, respectively 3.4 5.0 4.1
Valuation adjustment for pension and postretirement benefits, net of tax (benefit)expense of ($1.1), $7.2 and ($13.4) for the years ended December 31, 2016, 2015 and2014, respectively (1.9) 12.7 (23.2)
Pension settlement charge, net of tax benefit of $0.0, $5.1 and $0.0 for the years endedDecember 31, 2016, 2015 and 2014, respectively — 8.9 —
Unrealized foreign currency translation adjustments, net of tax benefit of $1.3, $4.6 and$5.2 for the years ended December 31, 2016, 2015 and 2014, respectively (6.4) (8.1) (8.9)
Other comprehensive (loss) income (5.2) 18.4 (34.1)COMPREHENSIVE INCOME (LOSS) $ 41.9 $ (28.0) $ 68.9
See Notes to the Consolidated Financial Statements
“PRIVILEGED & CONFIDENTIAL” Distribution of the information contained herein is prohibited.
7
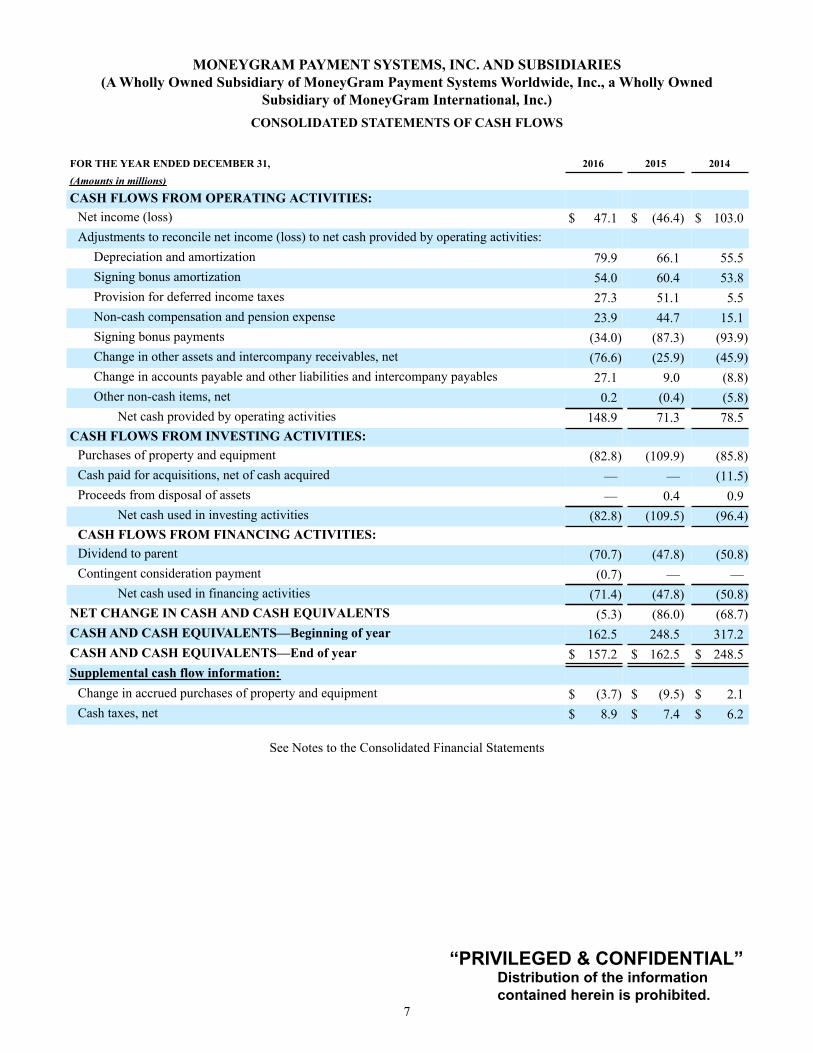
MONEYGRAM PAYMENT SYSTEMS, INC. AND SUBSIDIARIES(A Wholly Owned Subsidiary of MoneyGram Payment Systems Worldwide, Inc., a Wholly Owned
Subsidiary of MoneyGram International, Inc.)CONSOLIDATED STATEMENTS OF CASH FLOWS
FOR THE YEAR ENDED DECEMBER 31, 2016 2015 2014(Amounts in millions)
CASH FLOWS FROM OPERATING ACTIVITIES:Net income (loss) $ 47.1 $ (46.4) $ 103.0Adjustments to reconcile net income (loss) to net cash provided by operating activities:
Depreciation and amortization 79.9 66.1 55.5Signing bonus amortization 54.0 60.4 53.8Provision for deferred income taxes 27.3 51.1 5.5Non-cash compensation and pension expense 23.9 44.7 15.1Signing bonus payments (34.0) (87.3) (93.9)Change in other assets and intercompany receivables, net (76.6) (25.9) (45.9)Change in accounts payable and other liabilities and intercompany payables 27.1 9.0 (8.8)Other non-cash items, net 0.2 (0.4) (5.8)
Net cash provided by operating activities 148.9 71.3 78.5CASH FLOWS FROM INVESTING ACTIVITIES:
Purchases of property and equipment (82.8) (109.9) (85.8)Cash paid for acquisitions, net of cash acquired — — (11.5)Proceeds from disposal of assets — 0.4 0.9
Net cash used in investing activities (82.8) (109.5) (96.4)CASH FLOWS FROM FINANCING ACTIVITIES:Dividend to parent (70.7) (47.8) (50.8)Contingent consideration payment (0.7) — —
Net cash used in financing activities (71.4) (47.8) (50.8)NET CHANGE IN CASH AND CASH EQUIVALENTS (5.3) (86.0) (68.7)CASH AND CASH EQUIVALENTS—Beginning of year 162.5 248.5 317.2CASH AND CASH EQUIVALENTS—End of year $ 157.2 $ 162.5 $ 248.5Supplemental cash flow information:
Change in accrued purchases of property and equipment $ (3.7) $ (9.5) $ 2.1Cash taxes, net $ 8.9 $ 7.4 $ 6.2
See Notes to the Consolidated Financial Statements
“PRIVILEGED & CONFIDENTIAL” Distribution of the information contained herein is prohibited.
8
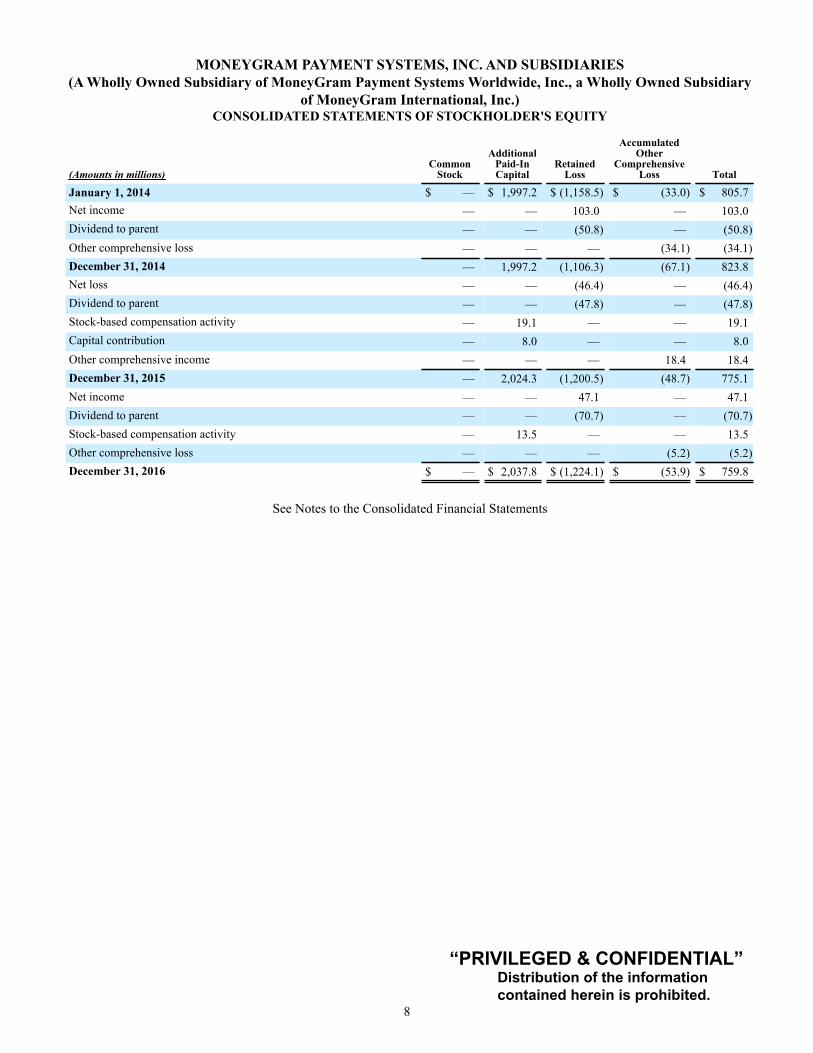
MONEYGRAM PAYMENT SYSTEMS, INC. AND SUBSIDIARIES(A Wholly Owned Subsidiary of MoneyGram Payment Systems Worldwide, Inc., a Wholly Owned Subsidiary
of MoneyGram International, Inc.)CONSOLIDATED STATEMENTS OF STOCKHOLDER'S EQUITY
(Amounts in millions)Common
Stock
AdditionalPaid-InCapital
RetainedLoss
AccumulatedOther
ComprehensiveLoss Total
January 1, 2014 $ — $ 1,997.2 $ (1,158.5) $ (33.0) $ 805.7Net income — — 103.0 — 103.0Dividend to parent — — (50.8) — (50.8)Other comprehensive loss — — — (34.1) (34.1)December 31, 2014 — 1,997.2 (1,106.3) (67.1) 823.8Net loss — — (46.4) — (46.4)Dividend to parent — — (47.8) — (47.8)Stock-based compensation activity — 19.1 — — 19.1Capital contribution — 8.0 — — 8.0Other comprehensive income — — — 18.4 18.4December 31, 2015 — 2,024.3 (1,200.5) (48.7) 775.1Net income — — 47.1 — 47.1Dividend to parent — — (70.7) — (70.7)Stock-based compensation activity — 13.5 — — 13.5Other comprehensive loss — — — (5.2) (5.2)December 31, 2016 $ — $ 2,037.8 $ (1,224.1) $ (53.9) $ 759.8
See Notes to the Consolidated Financial Statements

“PRIVILEGED & CONFIDENTIAL” Distribution of the information contained herein is prohibited.
9
MONEYGRAM PAYMENT SYSTEMS, INC. AND SUBSIDIARIES(A Wholly Owned Subsidiary of MoneyGram Payment Systems Worldwide, Inc., a Wholly Owned
Subsidiary of MoneyGram International, Inc.)NOTES TO THE CONSOLIDATED FINANCIAL STATEMENTS
Note 1 — Description of the Business and Basis of Presentation
MoneyGram Payment Systems, Inc. (the “Company” or “MPSI”) is a wholly owned subsidiary of MoneyGram Payment Systems Worldwide, Inc. (“Worldwide”), which is a wholly owned subsidiary of MoneyGram International, Inc. (“MGI”). References to “MPSI,” the “Company,” “we,” “us” and “our” are to MoneyGram Payment Systems, Inc. and its subsidiaries. References to “MoneyGram" are to MoneyGram International, Inc. and its subsidiaries.
Nature of Operations — MoneyGram offers products and services under its two reporting segments: Global Funds Transfer and Financial Paper Products. The Global Funds Transfer segment provides global money transfer services and bill payment services to consumers. We primarily offer services through third-party agents, including retail chains, independent retailers, post offices and other financial institutions. We also offer Digital solutions such as moneygram.com, mobile solutions, account deposit and kiosk-based services. Additionally, we have Company-operated retail locations in the U.S. and Western Europe. The Financial Paper Products segment provides official check outsourcing services and money orders through financial institutions and agent locations.
Basis of Presentation — The accompanying consolidated financial statements of the Company are prepared in conformity with generally accepted accounting principles in the United States of America (“GAAP”). The Consolidated Balance Sheets are unclassified due to the timing uncertainty surrounding the payment of settlement obligations.
Use of Estimates — The preparation of financial statements in conformity with GAAP requires management to make estimates and assumptions that affect the reported amount of assets and liabilities and disclosure of contingent assets and liabilities at the date of the financial statements and the reported amounts of revenues and expenses during the reporting period. These estimates and assumptions are based on historical experience, future expectations and other factors and assumptions the Company believes to be reasonable under the circumstances. These estimates and assumptions are reviewed on an ongoing basis and are revised when necessary. Changes in estimates are recorded in the period of change. Actual amounts may differ from these estimates.
Principles of Consolidation — The consolidated financial statements include the accounts of the Company. Intercompany profits, transactions and account balances have been eliminated in consolidation, other than those with MGI or Worldwide. "Intercompany receivable, net" and "Intercompany payable" on the Consolidated Balance Sheets as of December 31, 2016 are not comparable to prior year as these balances as of December 31, 2016 are presented on a separate net basis with MGI and Worldwide, respectively, while as of December 31, 2015, presentation was on a combined net basis. The Company reflects intercompany income tax receivables and payables in "Other assets" and "Accounts payable and other liabilities," respectively, as further disclosed in Note 12 — Income Taxes.
The Company participates in various trust arrangements (special purpose entities or “SPEs”) related to official check processing agreements with financial institutions and structured investments within the investment portfolio. Working in cooperation with certain financial institutions, the Company historically established separate consolidated SPEs that provided these financial institutions with additional assurance of its ability to clear their official checks. The Company maintains control of the assets of the SPEs and receives all investment revenue generated by the assets. The Company remains liable to satisfy the obligations of the SPEs, both contractually and by operation of the Uniform Commercial Code, as issuer and drawer of the official checks. As the Company is the primary beneficiary and bears the primary burden of any losses, the SPEs are consolidated in the consolidated financial statements. The assets of the SPEs are recorded in the Consolidated Balance Sheets in a manner consistent with the assets of the Company based on the nature of the asset. Accordingly, the obligations have been recorded in the Consolidated Balance Sheets under “Payment service obligations.” The investment revenue generated by the assets of the SPEs are recorded in "Investment revenue" in the Consolidated Statements of Operations. As of December 31, 2016, the Company had only one SPE remaining with settlement assets equal to the payment service obligations of $1.7 million. As of December 31, 2015, the Company's SPEs had settlement assets equal to payment service obligations of $2.1 million.

“PRIVILEGED & CONFIDENTIAL” Distribution of the information contained herein is prohibited.
10
Note 2 — Summary of Significant Accounting Policies
Cash and cash equivalents — The Company defines cash and cash equivalents and settlement cash and cash equivalents as cash on hand and all highly liquid debt instruments with original maturities of three months or less at the purchase date.
Settlement assets and payment service obligations — Settlement assets represent funds received or to be received from agents for unsettled money transfers, money orders and consumer payments. The Company records corresponding payment service obligations relating to amounts payable under money transfers, money orders and consumer payment service arrangements. Settlement assets consist of settlement cash and cash equivalents, receivables and investments. Payment service obligations primarily consist of: outstanding payment instruments; amounts owed to financial institutions for funds paid to the Company to cover clearings of official check payment instruments, remittances and clearing adjustments; amounts owed to agents for funds paid to consumers on behalf of the Company; commissions owed to financial institution customers and agents for instruments sold; amounts owed to investment brokers for purchased securities and unclaimed instruments owed to various states. These obligations are recognized by the Company at the time the underlying transactions occur.
The Company is regulated by various U.S. state agencies that generally require the Company to maintain a pool of assets with an investment rating bearing one of the three highest grades as defined by a nationally recognized rating agency (“permissible investments”) in an amount equal to the payment service obligations, as defined by each state, for those regulated payment instruments, namely teller checks, agent checks, money orders and money transfers. The regulatory payment service assets measure varies by state, but in all cases excludes investments rated below A-. The most restrictive states may also exclude assets held at banks that do not belong to a national insurance program, varying amounts of accounts receivable balances and/or assets held in one of the SPEs. The regulatory payment service obligations measure varies by state, but in all cases is substantially lower than the Company’s payment service obligations as disclosed in the Consolidated Balance Sheets as the Company is not regulated by state agencies for payment service obligations resulting from outstanding cashier’s checks or for amounts payable to agents and brokers.
Our primary overseas operating subsidiary, MoneyGram International Ltd., is a licensed payment institution in the United Kingdom, enabling us to offer our money transfer service in the European Economic Area. We are also subject to licensing or other regulatory requirements in various other jurisdictions. Licensing requirements may include minimum net worth, provision of surety bonds or letters of credit, compliance with operational procedures, agent oversight and the maintenance of settlement assets in an amount equivalent to outstanding payment service obligations, as defined by our various regulators.
The regulatory and contractual requirements do not require the Company to specify individual assets held to meet its payment service obligations, nor is the Company required to deposit specific assets into a trust, escrow or other special account. Rather, the Company must maintain a pool of liquid assets sufficient to comply with the requirements. No third party places limitations, legal or otherwise, on the Company regarding the use of its individual liquid assets. The Company is able to withdraw, deposit or sell its individual liquid assets at will, with no prior notice or penalty, provided the Company maintains a total pool of liquid assets sufficient to meet the regulatory and contractual requirements. Regulatory requirements also require MPSI to maintain positive net worth, with certain states requiring that the Company maintain positive tangible net worth. The Company was in compliance with its contractual and financial regulatory requirements as of December 31, 2016.
The following table summarizes the amount of Settlement assets and Payment service obligations as of December 31:
(Amounts in millions) 2016 2015
Settlement assets:Settlement cash and cash equivalents $ 1,365.0 $ 1,560.7Receivables, net 999.4 861.4Interest-bearing investments 1,252.1 1,062.4Available-for-sale investments 17.8 21.1
3,634.3 3,505.6Payment service obligations $ (3,634.3) $ (3,505.6)

“PRIVILEGED & CONFIDENTIAL” Distribution of the information contained herein is prohibited.
11
Receivables, net (included in settlement assets) — The Company has receivables due from financial institutions and agents for payment instruments sold and amounts advanced by the Company to certain agents for operational and local regulatory purposes. These receivables are outstanding from the day of the sale of the payment instrument until the financial institution or agent remits the funds to the Company. The Company provides an allowance for the portion of the receivable estimated to become uncollectible based on its history of collection experience, known collection issues, such as agent suspensions and bankruptcies, consumer credit card chargebacks and insufficient funds, and other matters the Company identifies in its routine collection monitoring. Receivables are generally considered past due one day after the contractual remittance schedule, which is typically one to three days after the sale of the underlying payment instrument. Receivables are generally written off against the allowance one year after becoming past due. The following summary details the activity within the allowance for credit losses for the years ended December 31:
(Amounts in millions) 2016 2015 2014
Beginning balance $ 9.2 $ 10.7 $ 10.7Provision 12.9 20.4 11.1Write-offs, net of recoveries (10.3) (21.9) (11.1)
Ending balance $ 11.8 $ 9.2 $ 10.7
Investments (included in settlement assets) — The Company classifies securities as interest-bearing or available-for-sale. The Company has no securities classified as trading or held-to-maturity. Time deposits and certificates of deposits with original maturities of up to 24 months are classified as interest-bearing investments and recorded at amortized cost. Securities held for indefinite periods of time, including any securities that may be sold to assist in the clearing of payment service obligations or in the management of the investment portfolio, are classified as available-for-sale securities. These securities are recorded at fair value, with the net after-tax unrealized gain or loss recorded in "Accumulated other comprehensive loss" in the stockholder's equity section of the Consolidated Balance Sheets. Realized gains and losses and other-than-temporary impairments are recorded in the Consolidated Statements of Operations under "Net securities gains."
Interest income on residential mortgage-backed securities for which risk of credit loss is deemed remote is recorded utilizing the level yield method. Changes in estimated cash flows, both positive and negative, are accounted for with retrospective changes to the carrying value of investments in order to maintain a level yield over the life of the investment. Interest income on residential mortgage-backed securities for which risk of credit loss is not deemed remote is recorded under the prospective method as adjustments of yield.
The Company applies the cost recovery method of accounting for interest to some of the investments within the available-for-sale portfolio. The cost recovery method accounts for interest on a cash basis and deems any interest payments received as a recovery of principal, which reduces the book value of the related security. When the book value of the related security is reduced to zero, interest payments are then recognized as investment income upon receipt. The Company applies the cost recovery method of accounting as it believes it is probable that the Company will not recover all, or substantially all, of its principal investment and interest for its other asset-backed securities given the sustained deterioration in the investment and securities market, the collapse of many asset-backed securities and the low levels to which the securities have been written down.
Securities with gross unrealized losses as of the balance sheet date are subject to a process for identifying other-than-temporary impairments. Securities that the Company deems to be other-than-temporarily impaired are written down to fair value in the period the impairment occurs. The assessment of whether such impairment has occurred is based on management’s evaluation of the underlying reasons for the decline in fair value on an individual security basis. The Company considers a wide range of factors about the security and uses its best judgment in evaluating the cause of the decline in the estimated fair value of the security and the prospects for recovery. The Company considers an investment to be other-than-temporarily impaired when it is deemed probable that the Company will not receive all of the cash flows contractually stipulated for the investment, or whether it is more likely than not that we will sell an investment before recovery of its amortized cost basis. The Company evaluates all residential mortgage-backed and other asset-backed investments for impairment. When an adverse change in expected cash flows occurs, and if the fair value of a security is less than its carrying value, the investment is written down to fair value through a permanent reduction to its amortized cost. Securities gains and losses are recognized upon the sale, call or maturity of securities using the specific identification method to determine the cost basis of securities sold.

“PRIVILEGED & CONFIDENTIAL” Distribution of the information contained herein is prohibited.
12
Fair Value of Financial Instruments — Financial instruments consist of cash and cash equivalents, settlement cash and cash equivalents, investments, derivatives, payment service obligations and debt. The carrying values of cash and cash equivalents, settlement cash and cash equivalents, interest-bearing investments and payment service obligations approximate fair value. The carrying value of debt is stated at amortized cost; however, for disclosure purposes the fair value is estimated. See Note 4 — Fair Value Measurement for information regarding the principles and processes used to estimate the fair value of financial instruments.
Derivative Financial Instruments — The Company recognizes derivative financial instruments in the Consolidated Balance Sheets at fair value. The accounting for changes in the fair value is recognized through the “Transaction and operations support” line in the Consolidated Statements of Operations in the period of change. See Note 6 — Derivative Financial Instruments for additional disclosure.
Property and Equipment — Property and equipment includes computer hardware, computer software, signage, equipment at agent locations, office furniture and equipment and leasehold improvements, and is stated at cost net of accumulated depreciation and amortization. Property and equipment is depreciated and amortized using a straight-line method over the useful life or term of the lease or license. The cost and related accumulated depreciation and amortization of assets sold or disposed of are removed from the financial statements, with the resulting gain or loss, if any, recognized in “Occupancy, equipment and supplies” in the Consolidated Statements of Operations. See Note 7 — Property and Equipment for additional disclosure. The following table summarizes the estimated useful lives by major asset category:
Type of Asset Useful Life
Computer hardware 3 yearsComputer software 5 - 7 yearsSignage 3 yearsEquipment at agent locations 3 - 7 yearsOffice furniture and equipment 7 yearsLeasehold improvements 10 years
Tenant allowances for leasehold improvements are capitalized as leasehold improvements upon completion of the improvement and amortized over the shorter of the remaining term of the lease or 10 years.
Computer software includes acquired and internally developed software. For the years ended December 31, 2016 and 2015, software development costs of $43.7 million and $47.2 million, respectively, were capitalized. At December 31, 2016 and 2015, there were $101.1 million and $86.9 million, respectively, of unamortized software development costs included in property and equipment.
Property and equipment are tested for impairment whenever events or changes in circumstances indicate that the carrying amount may not be recoverable by comparing the carrying value of the assets to the estimated future undiscounted cash flows to be generated by the asset. If an impairment is determined to exist for property and equipment, the carrying value of the asset is reduced to the estimated fair value.
Goodwill and Intangible Assets — Goodwill represents the excess of the purchase price over the fair value of net assets acquired in business combinations and is assigned to the reporting unit in which the acquired business will operate. Intangible assets are recorded at their estimated fair value at the date of acquisition. In the year following the period in which identified intangible assets become fully amortized, the fully amortized balances are removed from the gross asset and accumulated amortization amounts. Goodwill is not amortized, but is instead subject to impairment testing. Intangible assets with finite lives are amortized using a straight-line method over their respective useful lives as follows:
Type of Intangible Asset Useful Life
Contractual and customer relationships 3-15 yearsNon-compete agreements 3-5 yearsDeveloped technology 5-7 years
“PRIVILEGED & CONFIDENTIAL” Distribution of the information contained herein is prohibited.
13
The Company evaluates its goodwill for impairment annually as of October 1 of each year or more frequently if impairment indicators arise in accordance with Accounting Standards Codification (“ASC”) Topic 350, “Intangibles - Goodwill and Other.” Goodwill is tested for impairment using a fair-value based approach and is assessed at the reporting unit level. The carrying value of the reporting unit is compared to its estimated fair value, with any excess of carrying value over fair value deemed to be an indicator of potential impairment, in which case a second step is performed comparing the carrying amount of goodwill to its implied fair value. Intangible assets with finite lives are tested for impairment whenever events or changes in circumstances indicate that the carrying amount may not be recoverable by comparing the carrying value of the assets to the estimated future undiscounted cash flows to be generated by the asset. If an impairment is determined to exist for goodwill or intangible assets, the carrying value of the asset is reduced to the estimated fair value.
Payments on Long-Term Contracts — The Company makes payments to certain agents and financial institution customers as an incentive to enter into long-term contracts. The payments, or signing bonuses, are generally required to be refunded pro rata in the event of nonperformance under, or cancellation of, the contract by the customer. Signing bonuses are viewed as incremental costs of acquiring a contract and are, therefore, capitalized and amortized over the life of the related contract. Amortization of signing bonuses on long-term contracts is recorded in “Fee and other commissions expense” in the Consolidated Statements of Operations. The carrying values of the signing bonuses are reviewed whenever events or changes in circumstances indicate that the carrying amounts may not be recoverable.
Income Taxes — The Company’s operations are included in the consolidated federal income tax return of MoneyGram. The consolidated federal income tax return of MoneyGram includes the income of the Company and activity of the other members of the tax filing group. Consolidated federal income tax expense is allocated to each member of the tax filing group, including the Company, on a separate return basis. In addition, all state and foreign tax expenses are allocated to MoneyGram through MPSI.
The provision for income taxes is computed based on the pre-tax income (loss) included in the Consolidated Statements of Operations. Deferred tax assets and liabilities are recorded based on the future tax consequences attributable to temporary differences that exist between the financial statement carrying value of assets and liabilities and their respective tax basis, and operating loss and tax credit carry-forwards on a taxing jurisdiction basis. The Company measures deferred tax assets and liabilities using enacted statutory tax rates that will apply in the years in which the Company expects the temporary differences to be recovered or paid. The Company's ability to realize deferred tax assets depends on the ability to generate sufficient taxable income within the carry-back or carry-forward periods provided for in the tax law. The Company establishes valuation allowances for its deferred tax assets based on a more-likely-than-not threshold. To the extent management believes that recovery is not likely, a valuation allowance is established in the period in which the determination is made.
The liability for unrecognized tax benefits is recorded as a non-cash item in “Accounts payable and other liabilities” in the Consolidated Balance Sheets. The Company records interest and penalties for unrecognized tax benefits in “Income tax expense” in the Consolidated Statements of Operations. See Note 12 — Income Taxes for additional disclosure.
Foreign Currency Translation — The Company converts assets and liabilities of foreign operations to their U.S. dollar equivalents at rates in effect at the balance sheet dates and records the translation adjustments in “Accumulated other comprehensive loss” in the Consolidated Balance Sheets. Income statements of foreign operations are translated from the operation’s functional currency to U.S. dollar equivalents at the average exchange rate for the month. Foreign currency exchange transaction gains and losses are reported in “Transaction and operations support” in the Consolidated Statements of Operations.
Revenue Recognition — The Company earns revenue primarily through service fees charged to consumers and through its investing activity. A description of these revenues and revenue recognition policies is as follows:
• Fee and other revenue consists of transaction fees, service revenue, foreign exchange revenue and other revenue.
• Transaction fees consist primarily of fees earned on money transfer, money order, bill payment and official check transactions. The money transfer transaction fees vary based on the principal value of the transaction and the locations in which these money transfers originate and to which they are sent. The official check, money order and bill payment transaction fees are fixed fees charged on a per item basis. Transaction fees are recognized at the time of the transaction or sale of the product and are presented on a gross basis.
• Foreign exchange revenue is earned from the management of currency exchange spreads on money transfer transactions involving different “send” and “receive” currencies. Currency exchange spread is the difference between the exchange rate set by the Company to the consumer and the rate at which the Company or its agents are able to acquire currency. Foreign exchange revenue is recognized at the time the exchange in funds occurs and is presented on a gross basis.

“PRIVILEGED & CONFIDENTIAL” Distribution of the information contained herein is prohibited.
14
• Other revenue primarily consists of service charges on aged outstanding money orders and money order dispenser fees. Additionally, for unclaimed payment instruments and money transfers, we recognize breakage income when the likelihood of consumer pick-up becomes remote based on historical experience and there is no requirement for remitting balances to government agencies under unclaimed property laws.
• Investment revenue is earned from the investment of funds generated from the sale of payment instruments, primarily official checks and money orders, and consists of interest income, dividend income, income received on our cost recovery securities and amortization of premiums and discounts.
Fee and Other Commissions Expense — The Company incurs fee commissions primarily related to our Global Funds Transfer services. In a money transfer transaction, both the agent initiating the transaction and the receiving agent earn a commission that is generally either a fixed fee or is based on a percentage of the fee charged to the consumer. The agent initiating the transaction and the receiving agent also earn foreign exchange commissions, which are generally based on a percentage of the foreign exchange spread. In a bill payment transaction, the agent initiating the transaction receives a commission that is generally based on a percentage of the fee charged to the consumer and, in limited circumstances, the biller receives a commission that is based on a percentage of the fee charged to the consumer. The Company generally does not pay commissions to agents on the sale of money orders, except, in certain limited circumstances, for large agents where we may pay a fixed commission based on total money order transactions. Other commissions expense includes the amortization of capitalized agent signing bonus payments.
Investment Commissions Expense — Investment commissions expense consists of amounts paid to financial institution customers based on short-term interest rate indices times the average outstanding cash balances of official checks sold by the financial institution. Investment commissions are recognized each month based on the average outstanding balances of each financial institution customer and their contractual variable rate for that month.
Marketing and Advertising Expense — Marketing and advertising costs are expensed as incurred or at the time the advertising first takes place and are recorded in the “Transaction and operations support” line in the Consolidated Statements of Operations. Marketing and advertising expense was $65.1 million, $59.4 million and $64.7 million for 2016, 2015 and 2014, respectively.
Stock-Based Compensation — Stock-based compensation awards are measured at fair value at the date of grant and expensed over their vesting or service periods. The expense, net of estimated forfeitures, is recognized using the straight-line method and is recorded in "Compensation and benefits" in the Consolidated Statements of Operations. The Company accounts for modifications to its share-based payment awards in accordance with the provisions of ASC Topic 718, "Compensation - Stock Compensation."Incremental compensation cost is measured as the excess, if any, of the fair value of the modified award over the fair value of the original award immediately before its terms are modified, measured based on the share price and other pertinent factors at that date, and is recognized as compensation cost on the date of modification (for vested awards) or over the remaining vesting or service period (for unvested awards). Any unrecognized compensation cost remaining from the original award is recognized over the vesting period of the modified award. See Note 11 — Stock-Based Compensation for additional disclosure of the Company’s stock-based compensation.
Reorganization and Restructuring Expenses — Reorganization and restructuring expenses consist of direct and incremental costs associated with reorganization, restructuring and related activities, including technology; process improvement efforts; independent consulting and contractors; severance; outplacement and other employee related benefits; facility closures, cease-use or related charges; asset impairments or accelerated depreciation and other expenses related to relocation of various operations to existing or new Company facilities and third-party providers, including hiring, training, relocation, travel and professional fees. The Company records severance-related expenses once they are both probable and estimable related to severance provided under an on-going benefit arrangement. One-time, involuntary benefit arrangements and other exit costs are recognized when the liability is incurred. The Company evaluates impairment issues associated with reorganization activities when the carrying amount of the assets may not be fully recoverable, and also reviews the appropriateness of the remaining useful lives of impacted fixed assets. See Note 3 — Reorganization and Restructuring Costs for additional disclosure of the Company’s reorganization and restructuring activities.
Recent Accounting Pronouncements and Related Developments — In May 2014, the Financial Accounting Standards Board ("FASB") issued Accounting Standards Update ("ASU") 2014-09, Revenue from Contracts with Customers (Topic 606). The new guidance sets forth a five-step revenue recognition model which replaces the current revenue recognition guidance in its entirety and is intended to eliminate numerous industry-specific pieces of revenue recognition guidance and requires more detailed disclosures.

“PRIVILEGED & CONFIDENTIAL” Distribution of the information contained herein is prohibited.
15
To further assist with adoption and implementation of ASU 2014-09, the FASB issued the following ASUs:
• ASU 2016-08 (Issued March 2016) — Principal versus Agent Consideration (Reporting Revenue Gross versus Net) • ASU 2016-10 (Issued April 2016) — Identifying Performance Obligations and Licensing • ASU 2016-12 (Issued May 2016) — Narrow-Scope Improvements and Practical Expedients• ASU 2016-20 (Issued December 2016) — Technical Corrections and Improvements to Topic 606, Revenue from Contracts
with Customers
These ASUs are effective for public entities for interim and annual reporting periods beginning after December 15, 2017. Early adoption is permitted, but not before interim and annual reporting periods beginning after December 15, 2016. The Company will not be early adopting these standards and will use the cumulative effect transition method upon adoption. Based on our initial evaluation for money transfer and bill payment services provided by the Global Funds Transfer segment, the Company has determined that each of these services includes only one performance obligation to the customer and the satisfaction of that performance obligation occurs at a point in time, which is not a change from how we currently recognize revenue. The Company continues to evaluate all other impacts from these standards as they pertain to our money transfer and bill payment services and the impacts on products and services provided by our Financial Paper Products segment.
In May 2015, the FASB issued ASU 2015-07, Fair Value Measurement (Topic 820): Disclosures for Investments in Certain Entities That Calculate Net Asset Value per Share (or Its Equivalent) ("ASU 2015-07"), which removes the requirement to categorize within the fair value hierarchy all investments for which fair value is measured using the net asset value per share practical expedient. The Company adopted ASU 2015-07 for the fiscal year ended December 31, 2016 and applied the change retrospectively. The adoption will impact the presentation of pension plan assets measured at fair value using the net asset value per share practical expedient, which were removed from the fair value hierarchy. See Note 10 — Pension and Other Benefits for disclosure of pension plan assets. The adoption of this ASU 2015-07 did not have any impact on the Company's results of operations, financial position and cash flows.
In February 2016, the FASB issued ASU 2016-02, Leases (Topic 842). ASU 2016-02 requires organizations to recognize lease assets and lease liabilities on the balance sheet and to disclose key information about leasing arrangements. The classification criteria for distinguishing between finance leases and operating leases are substantially similar to the classification criteria for distinguishing between capital leases and operating leases in the previous lease guidance. The FASB retained the distinction between finance leases and operating leases, leaving the effect of leases in the statement of comprehensive income and the statement of cash flows largely unchanged from previous GAAP. ASU 2016-02 mandates a modified retrospective transition method and is effective for fiscal years beginning after December 15, 2018. Early adoption of the amendment is permitted. The Company has begun evaluating and planning for the adoption and implementation of ASU 2016-02. The impact of this ASU on the Company’s consolidated financial statements is still being evaluated.
In April 2016, the FASB issued ASU 2016-09, Compensation—Stock Compensation (Topic 718): Improvements to Employee Share-Based Payment Accounting. This standard makes several modifications to Topic 718 related to the accounting for forfeitures, employer tax withholding on share-based compensation and the financial statement presentation of excess tax benefits or deficiencies. Under the ASU, companies are allowed to withhold up to the employees' maximum statutory tax rates in the applicable jurisdictions without resulting in liability classification. Further, the ASU requires that cash payments to tax authorities in connection with shares withheld to meet statutory tax withholding requirements be presented as a financing activity in the statement of cash flows. ASU 2016-09 is effective for fiscal years beginning after December 15, 2016 and early adoption of the amendment is permitted. The Company currently presents cash payments to tax authorities in connection with shares withheld to meet statutory tax withholdings requirements as an operating activity in its statement of cash flows and upon adoption of this ASU we will present these payments as a financing activity, which will be applied retrospectively. The Company does not expect this ASU to have significant impact on the consolidated financial statements.
In June 2016, the FASB issued ASU 2016-13, Financial Instruments - Credit Losses (Topic 326): Measurement of Credit Losses on Financial Instruments. The new credit impairment standard changes the impairment model for most financial assets and certain other instruments. For trade and other receivables, held-to-maturity debt securities, loans and other instruments, entities will be required to use a new forward-looking expected loss model that generally will result in the earlier recognition of allowances for credit losses. For available-for-sale debt securities with unrealized losses, entities will measure credit losses in a manner similar to what they do today, except that the losses will be recognized as allowances rather than as reductions in the amortized cost of the securities. ASU 2016-13 is effective for fiscal years beginning after December 15, 2019 and early adoption of the amendment is permitted. The adoption of ASU 2016-13 will not have a significant impact on our consolidated financial statements.
The Company has determined that there have been no other recently adopted or issued accounting standards that had, or will have, a material impact on its consolidated financial statements.

“PRIVILEGED & CONFIDENTIAL” Distribution of the information contained herein is prohibited.
16
Note 3 — Reorganization and Restructuring Costs
In the first quarter of 2014, the Company announced the implementation of a global transformation program (the "2014 Global Transformation Program"), which included certain reorganization and restructuring activities centered around facilities and headcount rationalization, system efficiencies and headcount right-shoring and outsourcing. In 2015, the Company initiated other restructuring activities to further improve operational efficiencies. The 2014 Global Transformation Program and other restructuring activities included employee termination benefits and other costs which qualify as restructuring activities as defined by ASC 420, Exit or Disposal Cost Obligations ("ASC 420"). Additionally, the 2014 Global Transformation Program included certain reorganization activities related to the relocation of various operations to existing or new Company facilities and third-party providers which are outside the scope of ASC 420. The Company completed the reorganization and restructuring activities related to the 2014 Global Transformation Program and other restructuring activities in the first half of 2016.
The following table is a roll-forward of the restructuring costs accrual as of December 31, 2016:
2014 Global TransformationProgram
OtherRestructuring
(Amounts in millions)
Severance,Outplacementand Related
Benefits Other (1)
Severance,Outplacementand Related
Benefits Total
Balance, December 31, 2015 $ 3.8 $ — $ 0.2 $ 4.0Expenses 0.2 0.1 — 0.3Cash payments (4.0) (0.1) (0.2) (4.3)
Balance, December 31, 2016 $ — $ — $ — $ —(1) Other primarily relates to expenses for facilities relocation and professional fees. Such costs are expensed as incurred.
The following table is a summary of the cumulative restructuring costs incurred to date in operating expenses as of December 31, 2016:
2014 Global TransformationProgram
OtherRestructuring
(Amounts in millions)
Severance,Outplacementand Related
Benefits Other (1)
Severance,Outplacementand Related
Benefits Total
Restructuring costs
Cumulative restructuring costs incurred to date in operatingexpenses $ 17.9 $ 3.1 $ 0.6 $ 21.6
(1) Other primarily relates to expenses for facilities relocation and professional fees. Such costs are expensed as incurred.

“PRIVILEGED & CONFIDENTIAL” Distribution of the information contained herein is prohibited.
17
The following table summarizes the reorganization and restructuring costs recorded for the years ended December 31:
(Amounts in millions) 2016 2015 2014
Restructuring costs in operating expenses:Compensation and benefits $ 0.2 $ 3.7 $ 14.4Transaction and operations support 0.1 1.3 1.9
Total restructuring costs in operating expenses 0.3 5.0 16.3Reorganization costs in operating expenses:
Compensation and benefits — 6.8 5.0Transaction and operations support 0.1 6.7 8.4Occupancy, equipment and supplies 0.1 1.5 0.8
Total reorganization costs in operating expenses 0.2 15.0 14.2Total reorganization and restructuring costs $ 0.5 $ 20.0 $ 30.5
The following table is a summary of the total cumulative restructuring costs incurred to date in operating expenses by reportable segment as of December 31, 2016:
(Amounts in millions)Global Funds
Transfer
FinancialPaper
Products Other Total
2014 Global Transformation ProgramBalance, December 31, 2015 $ 17.8 $ 2.2 $ 0.7 $ 20.7First quarter 2016 0.3 — — 0.3
Total cumulative restructuring costs incurred to date in operatingexpenses 18.1 2.2 0.7 21.0
Other RestructuringTotal cumulative restructuring costs incurred to date in operatingexpenses 0.6 — — 0.6
Total restructuring costs incurred $ 18.7 $ 2.2 $ 0.7 $ 21.6
Note 4 — Fair Value Measurement
Fair value is defined as the exchange price that would be received for an asset or paid to transfer a liability, or the exit price, in an orderly transaction between market participants on the measurement date. A three-level hierarchy is used for fair value measurements based upon the observability of the inputs to the valuation of an asset or liability as of the measurement date. Under the hierarchy, the highest priority is given to unadjusted quoted prices in active markets for identical assets or liabilities (Level 1), followed by observable inputs (Level 2) and unobservable inputs (Level 3). A financial instrument’s level within the hierarchy is based on the lowest level of any input that is significant to the fair value measurement. The following is a description of the Company’s valuation methodologies used to estimate the fair value for assets and liabilities:
Assets and liabilities that are measured at fair value on a recurring basis:
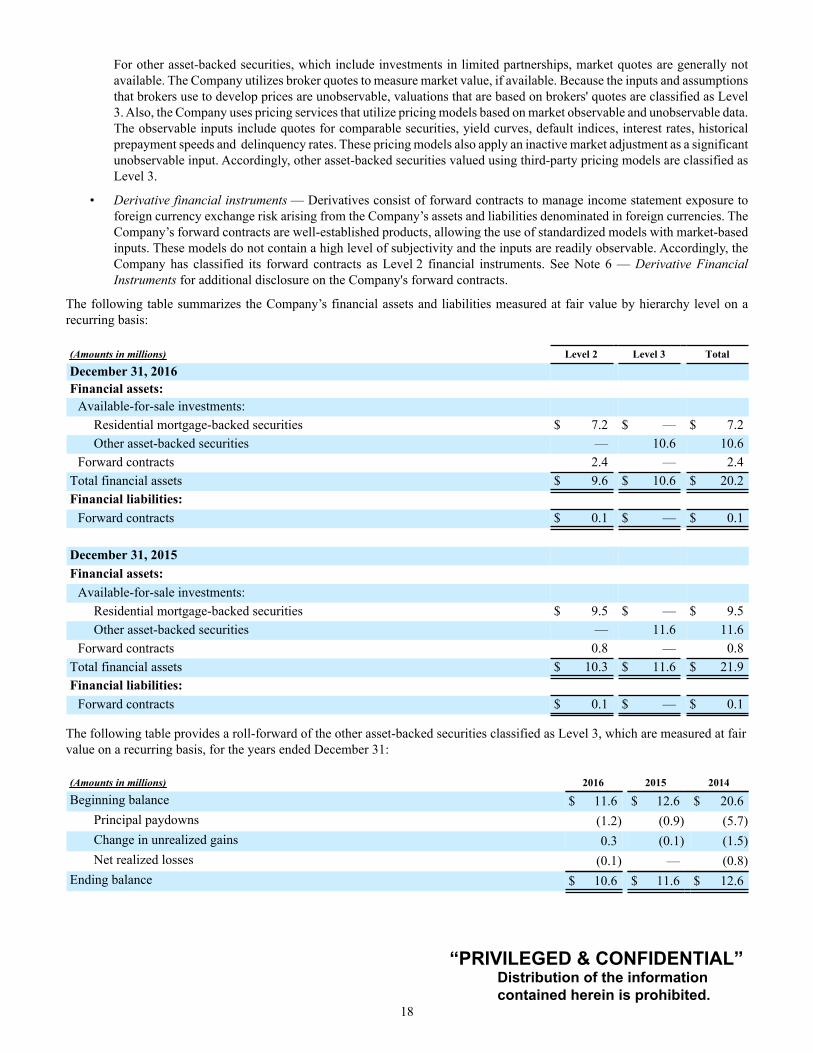
• Available-for-sale investments - For residential mortgage-backed securities issued by U.S. government agencies, fair value measures are obtained from an independent pricing service. As market quotes are generally not readily available or accessible for these specific securities, the pricing service measures fair value through the use of pricing models utilizing reported market quotes adjusted for observable inputs, such as market prices for comparable securities, spreads, prepayment speeds, yield curves and delinquency rates. Accordingly, these securities are classified as Level 2 financial instruments.
“PRIVILEGED & CONFIDENTIAL” Distribution of the information contained herein is prohibited.
18
For other asset-backed securities, which include investments in limited partnerships, market quotes are generally not available. The Company utilizes broker quotes to measure market value, if available. Because the inputs and assumptions that brokers use to develop prices are unobservable, valuations that are based on brokers' quotes are classified as Level 3. Also, the Company uses pricing services that utilize pricing models based on market observable and unobservable data. The observable inputs include quotes for comparable securities, yield curves, default indices, interest rates, historical prepayment speeds and delinquency rates. These pricing models also apply an inactive market adjustment as a significant unobservable input. Accordingly, other asset-backed securities valued using third-party pricing models are classified as Level 3.
• Derivative financial instruments — Derivatives consist of forward contracts to manage income statement exposure to foreign currency exchange risk arising from the Company’s assets and liabilities denominated in foreign currencies. The Company’s forward contracts are well-established products, allowing the use of standardized models with market-based inputs. These models do not contain a high level of subjectivity and the inputs are readily observable. Accordingly, the Company has classified its forward contracts as Level 2 financial instruments. See Note 6 — Derivative Financial Instruments for additional disclosure on the Company's forward contracts.
The following table summarizes the Company’s financial assets and liabilities measured at fair value by hierarchy level on a recurring basis:
(Amounts in millions) Level 2 Level 3 Total
December 31, 2016Financial assets:
Available-for-sale investments:Residential mortgage-backed securities $ 7.2 $ — $ 7.2Other asset-backed securities — 10.6 10.6
Forward contracts 2.4 — 2.4Total financial assets $ 9.6 $ 10.6 $ 20.2Financial liabilities:
Forward contracts $ 0.1 $ — $ 0.1
December 31, 2015Financial assets:
Available-for-sale investments:Residential mortgage-backed securities $ 9.5 $ — $ 9.5Other asset-backed securities — 11.6 11.6
Forward contracts 0.8 — 0.8Total financial assets $ 10.3 $ 11.6 $ 21.9Financial liabilities:
Forward contracts $ 0.1 $ — $ 0.1
The following table provides a roll-forward of the other asset-backed securities classified as Level 3, which are measured at fair value on a recurring basis, for the years ended December 31:
(Amounts in millions) 2016 2015 2014
Beginning balance $ 11.6 $ 12.6 $ 20.6Principal paydowns (1.2) (0.9) (5.7)Change in unrealized gains 0.3 (0.1) (1.5)Net realized losses (0.1) — (0.8)
Ending balance $ 10.6 $ 11.6 $ 12.6
“PRIVILEGED & CONFIDENTIAL” Distribution of the information contained herein is prohibited.
19
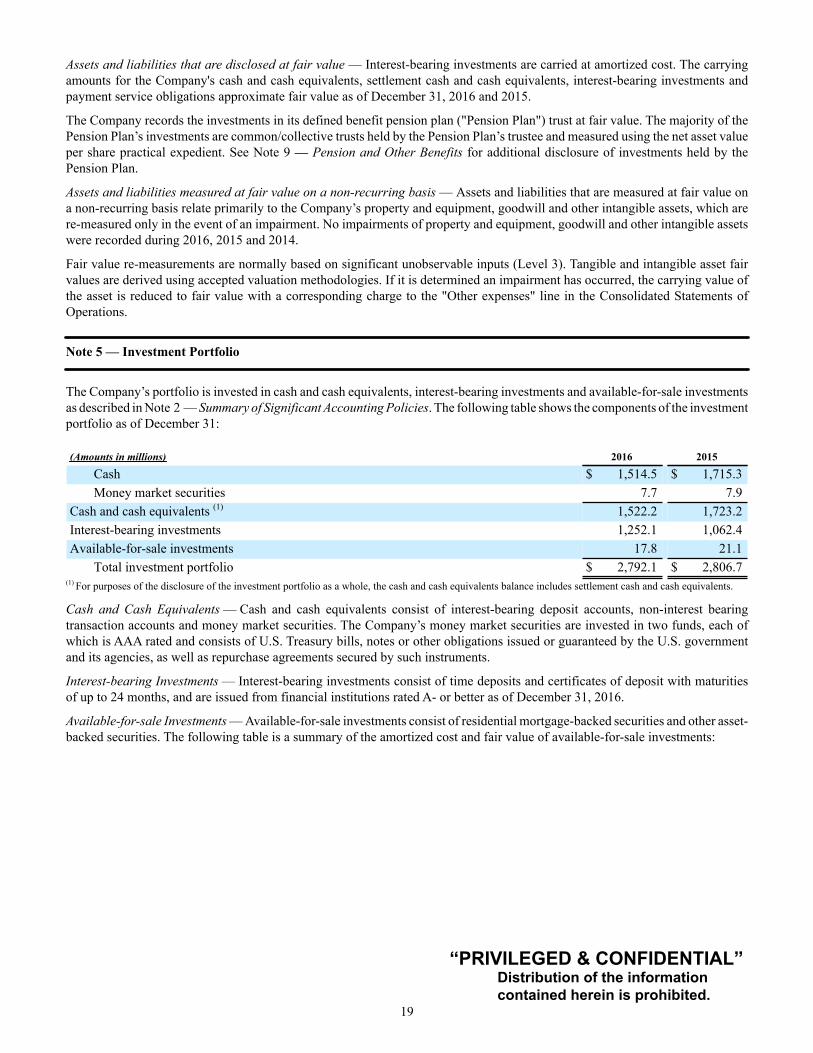
Assets and liabilities that are disclosed at fair value — Interest-bearing investments are carried at amortized cost. The carrying amounts for the Company's cash and cash equivalents, settlement cash and cash equivalents, interest-bearing investments and payment service obligations approximate fair value as of December 31, 2016 and 2015.
The Company records the investments in its defined benefit pension plan ("Pension Plan") trust at fair value. The majority of the Pension Plan’s investments are common/collective trusts held by the Pension Plan’s trustee and measured using the net asset value per share practical expedient. See Note 9 — Pension and Other Benefits for additional disclosure of investments held by the Pension Plan.
Assets and liabilities measured at fair value on a non-recurring basis — Assets and liabilities that are measured at fair value on a non-recurring basis relate primarily to the Company’s property and equipment, goodwill and other intangible assets, which are re-measured only in the event of an impairment. No impairments of property and equipment, goodwill and other intangible assets were recorded during 2016, 2015 and 2014.
Fair value re-measurements are normally based on significant unobservable inputs (Level 3). Tangible and intangible asset fair values are derived using accepted valuation methodologies. If it is determined an impairment has occurred, the carrying value of the asset is reduced to fair value with a corresponding charge to the "Other expenses" line in the Consolidated Statements of Operations.
Note 5 — Investment Portfolio
The Company’s portfolio is invested in cash and cash equivalents, interest-bearing investments and available-for-sale investments as described in Note 2 — Summary of Significant Accounting Policies. The following table shows the components of the investment portfolio as of December 31:
(Amounts in millions) 2016 2015
Cash $ 1,514.5 $ 1,715.3Money market securities 7.7 7.9
Cash and cash equivalents (1) 1,522.2 1,723.2Interest-bearing investments 1,252.1 1,062.4Available-for-sale investments 17.8 21.1
Total investment portfolio $ 2,792.1 $ 2,806.7(1) For purposes of the disclosure of the investment portfolio as a whole, the cash and cash equivalents balance includes settlement cash and cash equivalents.
Cash and Cash Equivalents — Cash and cash equivalents consist of interest-bearing deposit accounts, non-interest bearing transaction accounts and money market securities. The Company’s money market securities are invested in two funds, each of which is AAA rated and consists of U.S. Treasury bills, notes or other obligations issued or guaranteed by the U.S. government and its agencies, as well as repurchase agreements secured by such instruments.
Interest-bearing Investments — Interest-bearing investments consist of time deposits and certificates of deposit with maturities of up to 24 months, and are issued from financial institutions rated A- or better as of December 31, 2016.
Available-for-sale Investments — Available-for-sale investments consist of residential mortgage-backed securities and other asset-backed securities. The following table is a summary of the amortized cost and fair value of available-for-sale investments:

“PRIVILEGED & CONFIDENTIAL” Distribution of the information contained herein is prohibited.
20
(Amounts in millions)Amortized
Cost
GrossUnrealized
GainsFair
Value
December 31, 2016Residential mortgage-backed securities $ 6.6 $ 0.6 $ 7.2Other asset-backed securities 1.0 9.6 10.6
Total $ 7.6 $ 10.2 $ 17.8
December 31, 2015Residential mortgage-backed securities $ 8.7 $ 0.8 $ 9.5Other asset-backed securities 1.7 9.9 11.6
Total $ 10.4 $ 10.7 $ 21.1
As of December 31, 2016 and 2015, 40% and 45%, respectively, of the available-for-sale portfolio were invested in residential mortgage-backed securities issued by U.S. government agencies. These securities have the implicit backing of the U.S. government, and the Company expects to receive full par value upon maturity or pay-down, as well as all interest payments. Included in other asset-backed securities are collateralized debt obligations backed primarily by high-grade debt, mezzanine equity tranches of collateralized debt obligations and home equity loans, along with private equity investments, as summarized in Note 4 — Fair Value Measurement. The other asset-backed securities continue to have market exposure, and this risk is factored into the fair value estimates of the Company, with the average price of an asset-backed security at $0.03 per dollar of par value as of December 31, 2016.
Unrealized Gains and Losses — As of December 31, 2016 and 2015, net unrealized gains, net of tax of $10.8 million and $11.1 million, respectively, were included in the Consolidated Balance Sheets in “Accumulated other comprehensive loss.” The Company had no unrealized losses in its available-for-sale portfolio as of December 31, 2016 and 2015.
Gains and Losses — For 2016 and 2015, the Company had nominal net realized gains or losses. During 2014, the Company realized $45.4 million of net securities gains related to certain securities settlements previously written down to a nominal fair value. There were no other-than-temporary impairments during 2016, 2015 and 2014.
Investment Ratings — In rating the securities in its investment portfolio, the Company uses ratings from Moody’s Investor Service (“Moody’s”), Standard & Poor's (“S&P”) and Fitch Ratings (“Fitch”). If the rating agencies have split ratings, the Company uses the highest two out of three ratings across the rating agencies for disclosure purposes. If none of the rating agencies have the same rating, the Company uses the lowest rating across the agencies for disclosure purposes. Securities issued or backed by U.S. government agencies are included in the AAA rating category. Investment grade is defined as a security having a Moody’s equivalent rating of Aaa, Aa, A or Baa or an S&P or Fitch equivalent rating of AAA, AA, A or BBB. The Company’s investments consisted of the following ratings as of December 31:
2016 2015
(Amounts in millions, except percentages)Number ofSecurities
FairValue
Percent ofInvestments
Number ofSecurities
FairValue
Percent ofInvestments
Investment grade 12 $ 7.2 40% 12 $ 9.4 45%Below investment grade 40 10.6 60% 42 11.7 55%
Total 52 $ 17.8 100% 54 $ 21.1 100%
Had the Company used the lowest rating from the rating agencies in the information presented above, there would be no change to the classifications as of December 31, 2016 and 2015, respectively.
Contractual Maturities — Actual maturities may differ from contractual maturities as borrowers may have the right to call or prepay obligations, sometimes without call or prepayment penalties. Maturities of residential mortgage-backed and other asset-backed securities depend on the repayment characteristics and experience of the underlying obligations.
Fair Value Determination — The Company uses various sources of pricing for its fair value estimates of its available-for-sale portfolio. The percentage of the portfolio for which the various pricing sources were used is as follows as of December 31, 2016and 2015: 95% used a third party pricing service and 5% used broker quotes.

“PRIVILEGED & CONFIDENTIAL” Distribution of the information contained herein is prohibited.
21
Note 6 — Derivative Financial Instruments
The Company uses forward contracts to manage its foreign currency needs and foreign currency exchange risk arising from its assets and liabilities denominated in foreign currencies. While these contracts may mitigate certain foreign currency risk, they are not designated as hedges for accounting purposes. These contracts will result in gains and losses which are reported in the "Transaction and operations support" line item in the Consolidated Statements of Operations. The Company also reports gains and losses from the spread differential between the rate set for its transactions and the actual cost of currency at the time the Company buys or sells in the open market. The “Transaction and operations support” line in the Consolidated Statements of Operations and the "Net cash provided by operating activities" line in the Consolidated Statements of Cash Flows include the following gains (losses) related to assets and liabilities denominated in foreign currencies, for the years ended December 31:
(Amounts in millions) 2016 2015 2014
Net realized foreign currency losses $ (5.4) $ (21.3) $ (25.0)Net gains from the related forward contracts 23.6 32.7 24.0
Net gains (losses) from foreign currency transactions and related forward contracts $ 18.2 $ 11.4 $ (1.0)
As of December 31, 2016 and 2015, the Company had $294.5 million and $295.8 million, respectively, of outstanding notional amounts relating to its foreign currency forward contracts. As of December 31, 2016 and 2015, the Company reflects the following fair values of derivative forward contract instruments in its Consolidated Balance Sheets:
Gross Amount ofRecognized Assets Gross Amount of Offset
Net Amount of AssetsPresented in the
Consolidated BalanceSheets
(Amounts in millions) Balance Sheet Location 2016 2015 2016 2015 2016 2015
Forward contracts Other assets $ 2.6 $ 1.0 $ (0.2) $ (0.2) $ 2.4 $ 0.8
Gross Amount of
Recognized Liabilities Gross Amount of Offset
Net Amount ofLiabilities Presented in
the ConsolidatedBalance Sheets
(Amounts in millions) Balance Sheet Location 2016 2015 2016 2015 2016 2015
Forward contractsAccounts payable andother liabilities $ 0.3 $ 0.3 $ (0.2) $ (0.2) $ 0.1 $ 0.1
The Company's forward contracts are primarily executed with counterparties governed by International Swaps and Derivatives Association agreements that generally include standard netting arrangements. Asset and liability positions from forward contracts and all other foreign exchange transactions with the same counterparty are net settled upon maturity.
The Company is exposed to credit loss in the event of non-performance by counterparties to its derivative contracts. The Company actively monitors its exposure to credit risk through the use of credit approvals and credit limits, and by selecting major international banks and financial institutions as counterparties. Collateral generally is not required of the counterparties or of the Company. In the unlikely event the counterparty fails to meet the contractual terms of the derivative contract, the Company’s risk is limited to the fair value of the instrument. The Company has not had any historical instances of non-performance by any counterparties, nor does it anticipate any future instances of non-performance.
“PRIVILEGED & CONFIDENTIAL” Distribution of the information contained herein is prohibited.
22
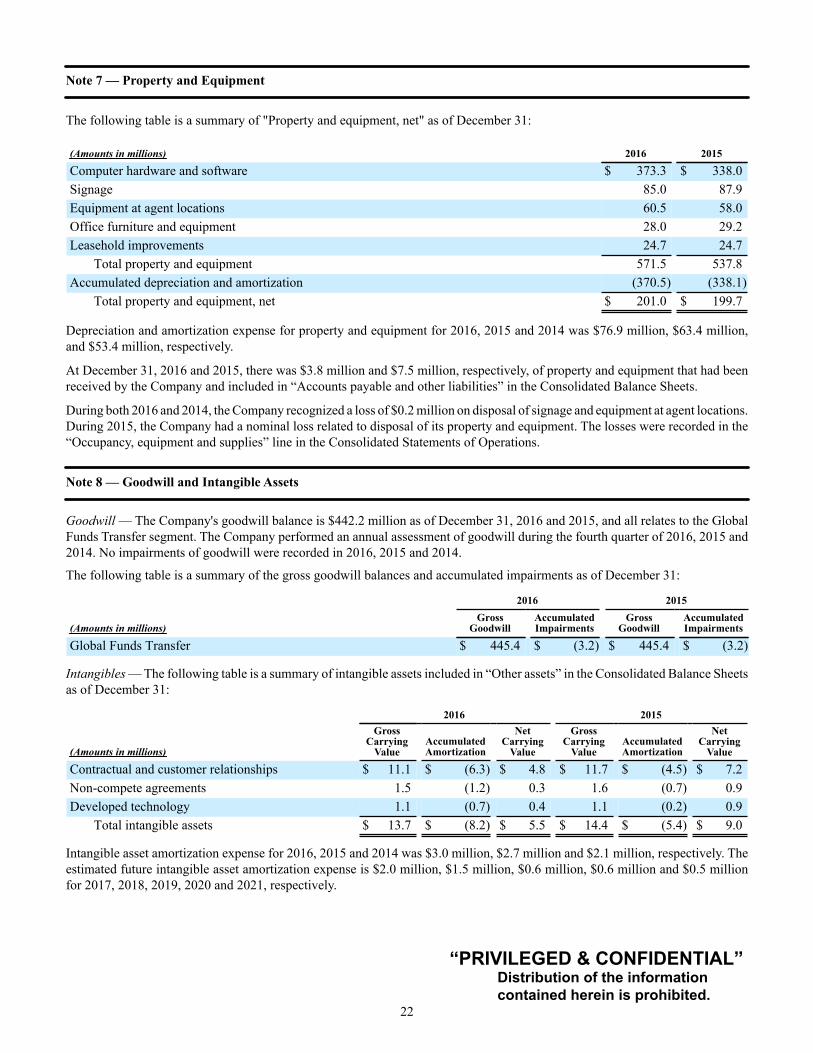
Note 7 — Property and Equipment
The following table is a summary of "Property and equipment, net" as of December 31:
(Amounts in millions) 2016 2015
Computer hardware and software $ 373.3 $ 338.0Signage 85.0 87.9Equipment at agent locations 60.5 58.0Office furniture and equipment 28.0 29.2Leasehold improvements 24.7 24.7
Total property and equipment 571.5 537.8Accumulated depreciation and amortization (370.5) (338.1)
Total property and equipment, net $ 201.0 $ 199.7
Depreciation and amortization expense for property and equipment for 2016, 2015 and 2014 was $76.9 million, $63.4 million, and $53.4 million, respectively.
At December 31, 2016 and 2015, there was $3.8 million and $7.5 million, respectively, of property and equipment that had been received by the Company and included in “Accounts payable and other liabilities” in the Consolidated Balance Sheets.
During both 2016 and 2014, the Company recognized a loss of $0.2 million on disposal of signage and equipment at agent locations. During 2015, the Company had a nominal loss related to disposal of its property and equipment. The losses were recorded in the “Occupancy, equipment and supplies” line in the Consolidated Statements of Operations.
Note 8 — Goodwill and Intangible Assets
Goodwill — The Company's goodwill balance is $442.2 million as of December 31, 2016 and 2015, and all relates to the Global Funds Transfer segment. The Company performed an annual assessment of goodwill during the fourth quarter of 2016, 2015 and 2014. No impairments of goodwill were recorded in 2016, 2015 and 2014.
The following table is a summary of the gross goodwill balances and accumulated impairments as of December 31:
2016 2015
(Amounts in millions)Gross
GoodwillAccumulatedImpairments
GrossGoodwill
AccumulatedImpairments
Global Funds Transfer $ 445.4 $ (3.2) $ 445.4 $ (3.2)
Intangibles — The following table is a summary of intangible assets included in “Other assets” in the Consolidated Balance Sheets as of December 31:
2016 2015
(Amounts in millions)
GrossCarrying
ValueAccumulatedAmortization
NetCarrying
Value
GrossCarrying
ValueAccumulatedAmortization
NetCarrying
Value
Contractual and customer relationships $ 11.1 $ (6.3) $ 4.8 $ 11.7 $ (4.5) $ 7.2Non-compete agreements 1.5 (1.2) 0.3 1.6 (0.7) 0.9Developed technology 1.1 (0.7) 0.4 1.1 (0.2) 0.9
Total intangible assets $ 13.7 $ (8.2) $ 5.5 $ 14.4 $ (5.4) $ 9.0
Intangible asset amortization expense for 2016, 2015 and 2014 was $3.0 million, $2.7 million and $2.1 million, respectively. The estimated future intangible asset amortization expense is $2.0 million, $1.5 million, $0.6 million, $0.6 million and $0.5 million for 2017, 2018, 2019, 2020 and 2021, respectively.

“PRIVILEGED & CONFIDENTIAL” Distribution of the information contained herein is prohibited.
23
Note 9 — Pension and Other Benefits
Pension Benefits — The Company's Pension Plan is a frozen, non-contributory funded plan under which no new service or compensation credits are accrued by the plan participants. Cash accumulation accounts continue to be credited with interest credits until participants withdraw their money from the Pension Plan. It is the Company’s policy to fund at least the minimum required contribution each year plus additional discretionary amounts as available and necessary to minimize expenses of the plan.
Supplemental Executive Retirement Plans — The Company has obligations under various supplemental executive retirement plans (“SERPs”), which are unfunded non-qualified defined benefit pension plans providing postretirement income to their participants. As of December 31, 2016, all benefit accruals under the SERPs are frozen with the exception of one plan for which service is frozen but future pay increases are reflected for active participants. It is the Company’s policy to fund the SERPs as benefits are paid.
The Company's Pension Plan and SERPs are collectively referred to as our “Pension."
Postretirement Benefits Other Than Pensions — The Company has an unfunded defined benefit postretirement plan ("Postretirement Benefits") that provides medical and life insurance for its participants. The Company amended the Postretirement Benefits to close it to new participants as of December 31, 2009. Effective July 1, 2011, the Postretirement Benefits was amended to eliminate eligibility for participants eligible for Medicare coverage. As a result of this plan amendment, the Company no longer receives the Medicare retiree drug subsidy. The Company’s funding policy is to make contributions to the Postretirement Benefits as benefits are paid.
Actuarial Valuation Assumptions — The measurement date for the Company’s Pension and Postretirement Benefits is December 31. The following table is a summary of the weighted-average actuarial assumptions used in calculating net periodic benefit expense (income) and the benefit obligation for the years ended and as of December 31:
Pension Plan SERPs Postretirement Benefits
2016 2015 2014 2016 2015 2014 2016 2015 2014Net periodic benefit expense (income):
Discount rate for benefit obligation 4.31% 4.15% 4.81% 4.32% 4.78% 4.78% 4.53% 4.82% 4.82%Discount rate for interest cost 3.45% 4.15% 4.81% 3.32% 4.78% 4.78% 3.43% 4.82% 4.82%Expected return on plan assets 4.66% 4.74% 5.68% — — — — — —Rate of compensation increase — — — 5.75% 5.75% 5.75% — — —Medical trend rate:Pre-65 initial healthcare cost trend rate — — — — — — 6.50% 6.50% 7.00%Post-65 initial healthcare cost trend rate — — — — — — 7.75% 6.25% 6.00%Pre and post-65 ultimate healthcare cost trend rate — — — — — — 4.50% 4.50% 4.50%Year ultimate healthcare cost trend rate is reachedfor pre and post-65 — — — — — — 2024 2023 2023
Benefit obligation:Discount rate 4.05% 4.31% 4.04% 4.11% 4.32% 4.04% 4.30% 4.53% 4.19%Rate of compensation increase — — — 5.75% 5.75% 5.75% — — —Medical trend rate:Pre-65 initial healthcare cost trend rate — — — — — — 7.00% 6.50% 6.50%Post-65 initial healthcare cost trend rate — — — — — — 8.25% 7.75% 6.25%Pre and post-65 ultimate healthcare cost trend rate — — — — — — 4.50% 4.50% 4.50%Year ultimate healthcare cost trend rate is reachedfor pre/post-65, respectively — — — — — —
2024/2025 2024 2023
The Company utilizes a building-block approach in determining the long-term expected rate of return on plan assets. The expected return on plan assets is calculated using a calculated value of plan assets that is determined each year by adjusting the previous year's value by expected returns, benefit payments, and contributions. Asset gains and losses are reflected as equal adjustments over a three-year period. Historical markets are studied and long-term historical relationships between equity securities and fixed income securities are preserved consistent with the widely accepted capital market principle that assets with higher volatility generate a greater return over the long run. Current market factors, such as inflation and interest rates, are evaluated before long-term capital market assumptions are determined. The long-term portfolio return also takes proper consideration of diversification and rebalancing. Peer data and historical returns are reviewed for reasonableness and appropriateness.

“PRIVILEGED & CONFIDENTIAL” Distribution of the information contained herein is prohibited.
24
Actuarial gains and losses are amortized using the corridor approach, by amortizing the balance exceeding 10% of the greater of the benefit obligation or the fair value of plan assets. The amortization period is primarily based on the average remaining service life of plan participants for the Pension and the average remaining expected life of plan participants for the Postretirement Benefits. The Company estimated the interest cost components utilizing a full yield curve approach in the estimation of these components by applying the specific spot rates along the yield curve used in the determination of the benefit obligation to their underlying projected cash flows.
Pension Assets — The Company employs a liability-driven investment approach whereby a mix of equity and fixed income securities are used to maximize the long-term return of plan assets for a prudent level of risk. Risk tolerance is established through careful consideration of plan liabilities, plan funded status and corporate financial condition. The investment portfolio contains a diversified blend of equity and fixed income securities. Furthermore, equity securities are diversified across large and small capitalized securities and international securities. Other assets, such as real estate and high yield bonds, are used to further diversify equity allocations. Fixed income securities are primarily invested in a mix of investment grade corporate bonds, government bonds, and a smaller allocation to non-investment grade debt. The Company uses a strategy to determine the allocation of return-seeking assets driven by the Pension Plan's funded ratio. Investment risk is measured and monitored on an ongoing basis, including quarterly investment portfolio reviews and periodic liability measurements.
The Company records its pension assets at fair value as described in Note 4 — Fair Value Measurement. The following is a description of the Pension Plan’s investments at fair value and valuation methodologies:
• Mutual fund — Measured at quoted market prices on the day of valuation. Accordingly, this investment is classified as Level 1 financial instruments.
• Common/collective trusts — The fair values of the underlying funds in the common/collective trusts are valued based on the net asset value per share as a practical expedient. This practical expedient would not be used if it is determined to be probable that the fund will sell the investment for an amount different from the reported net asset value. See Note 2 — Summary of Significant Accounting Policies for more information on the change in presentation of investments valued using net asset value per share per ASU 2015-07.
• Real estate — The Pension Plan trust holds an investment in a real estate development project. The fair value of this investment represents the estimated fair value of the plan’s related ownership percentage in the project based upon an appraisal of the underlying real property as of each balance sheet date. The fund investment strategy for this asset is long-term capital appreciation.
The following table is a summary of the Pension Plan’s financial assets recorded at fair value, by hierarchy level:
(Amounts in millions) Level 1 Level 3 Total
December 31, 2016Real estate $ — $ 5.6 $ 5.6
Total investments in the fair value hierarchy $ — $ 5.6 $ 5.6Investments measured at net asset value1 106.6Total financial assets $ 112.2
December 31, 2015Mutual fund $ 19.0 $ — $ 19.0Real estate — 5.5 5.5
Total investments in the fair value hierarchy $ 19.0 $ 5.5 $ 24.5Investments measured at net asset value1 83.4Total financial assets $ 107.9
(1) Common/collective trusts investments that are measured at fair value using the net asset value per share practical expedient have not been classified in the fair value hierarchy. The fair value amounts presented in this table are intended to permit reconciliation of the fair value hierarchy to the total fair value of plan assets presented in the summary of plan assets further below.

“PRIVILEGED & CONFIDENTIAL” Distribution of the information contained herein is prohibited.
25
The Company does not have participant redemption restrictions for its common/collective trust investments. The following table sets forth additional disclosures for the Pension Plans assets fair value estimated using net asset value per share:
(Amounts in millions) Fair ValueRedemptions Frequency
(if currently eligible)Redemption Notice
Period
December 31, 2016 $ 106.6 Daily 15 Days
December 31, 2015 $ 83.4 Daily 15 Days
The Company’s Pension Plan assets include one security that the Company considers to be a Level 3 asset for valuation purposes. This security is an investment in a real estate joint venture and requires the use of unobservable inputs in its fair value measurement. The Company values this investment using the appraisal of underlying asset valuation technique. In 2016, the fair value of this asset remained relatively flat when compared to 2015 and was $5.6 million and $5.5 million, respectively, as of December 31, 2016 and 2015.
Plan Financial Information — Net periodic benefit expense (income) for the Pension and Postretirement Benefits includes the following components for the years ended December 31:
Pension Postretirement Benefits(Amounts in millions) 2016 2015 2014 2016 2015 2014
Settlement charge $ — $ 14.0 $ — $ — $ — $ —Interest cost 6.6 9.4 10.8 — — 0.1Expected return on plan assets (5.3) (5.8) (7.3) — — —Amortization of net actuarial loss 5.6 8.5 6.9 0.2 0.2 0.3Amortization of prior service cost (credit) 0.1 — — (0.6) (0.6) (0.6)
Net periodic benefit expense (income) $ 7.0 $ 26.1 $ 10.4 $ (0.4) $ (0.4) $ (0.2)

“PRIVILEGED & CONFIDENTIAL” Distribution of the information contained herein is prohibited.
26
The following tables are a summary of the amounts recognized in other comprehensive (loss) income and net periodic benefit expense (income) for the years ended December 31:
(Amounts in millions) PensionPostretirement
Benefits
2016Net actuarial loss (gain) $ 3.1 $ (0.1)Amortization of net actuarial loss (5.6) (0.2)Amortization of prior service (cost) credit (0.1) 0.6
Total recognized in other comprehensive (income) loss $ (2.6) $ 0.3Total recognized in net periodic benefit expense (income) 7.0 (0.4)Total recognized in other comprehensive (income) loss and net periodic benefit expense(income) $ 4.4 $ (0.1)
2015Settlement charge $ (14.0) $ —Net actuarial gain (19.6) (0.3)Amortization of net actuarial loss (8.5) (0.2)Amortization of prior service credit — 0.6
Total recognized in other comprehensive (income) loss $ (42.1) $ 0.1Total recognized in net periodic benefit expense (income) 26.1 (0.4)Total recognized in other comprehensive (income) loss and net periodic benefit expense(income) $ (16.0) $ (0.3)
2014Net actuarial gain $ 37.0 $ 0.2Amortization of net actuarial loss (6.9) (0.3)Amortization of prior service credit — 0.6
Total recognized in other comprehensive loss $ 30.1 $ 0.5Total recognized in net periodic benefit expense (income) 10.4 (0.2)Total recognized in other comprehensive loss and net periodic benefit expense (income) $ 40.5 $ 0.3
The estimated net actuarial loss and prior service (cost) credit for the Pension that will be amortized from “Accumulated other comprehensive loss” into “Net periodic benefit expense (income)” during 2017 is $4.5 million ($2.8 million net of tax) and $0.1 million, respectively. The estimated net actuarial loss and prior service credit for the Postretirement Benefits that will be amortized from “Accumulated other comprehensive loss” into “Net periodic benefit expense (income)” during 2017 is $0.1 million ($0.1 million net of tax) and $0.4 million ($0.3 million net of tax), respectively.
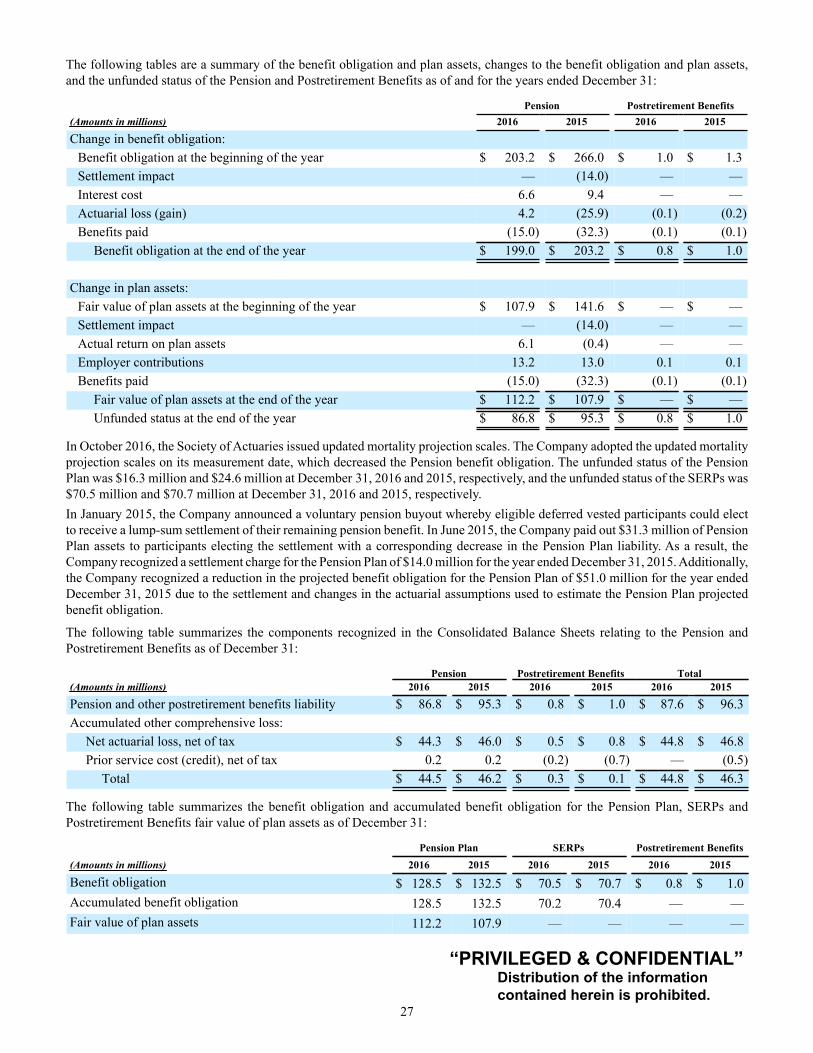
“PRIVILEGED & CONFIDENTIAL” Distribution of the information contained herein is prohibited.
27
The following tables are a summary of the benefit obligation and plan assets, changes to the benefit obligation and plan assets, and the unfunded status of the Pension and Postretirement Benefits as of and for the years ended December 31:
Pension Postretirement Benefits(Amounts in millions) 2016 2015 2016 2015
Change in benefit obligation:Benefit obligation at the beginning of the year $ 203.2 $ 266.0 $ 1.0 $ 1.3Settlement impact — (14.0) — —Interest cost 6.6 9.4 — —Actuarial loss (gain) 4.2 (25.9) (0.1) (0.2)Benefits paid (15.0) (32.3) (0.1) (0.1)
Benefit obligation at the end of the year $ 199.0 $ 203.2 $ 0.8 $ 1.0
Change in plan assets:Fair value of plan assets at the beginning of the year $ 107.9 $ 141.6 $ — $ —Settlement impact — (14.0) — —Actual return on plan assets 6.1 (0.4) — —Employer contributions 13.2 13.0 0.1 0.1Benefits paid (15.0) (32.3) (0.1) (0.1)
Fair value of plan assets at the end of the year $ 112.2 $ 107.9 $ — $ —Unfunded status at the end of the year $ 86.8 $ 95.3 $ 0.8 $ 1.0
In October 2016, the Society of Actuaries issued updated mortality projection scales. The Company adopted the updated mortality projection scales on its measurement date, which decreased the Pension benefit obligation. The unfunded status of the Pension Plan was $16.3 million and $24.6 million at December 31, 2016 and 2015, respectively, and the unfunded status of the SERPs was $70.5 million and $70.7 million at December 31, 2016 and 2015, respectively.In January 2015, the Company announced a voluntary pension buyout whereby eligible deferred vested participants could elect to receive a lump-sum settlement of their remaining pension benefit. In June 2015, the Company paid out $31.3 million of Pension Plan assets to participants electing the settlement with a corresponding decrease in the Pension Plan liability. As a result, the Company recognized a settlement charge for the Pension Plan of $14.0 million for the year ended December 31, 2015. Additionally, the Company recognized a reduction in the projected benefit obligation for the Pension Plan of $51.0 million for the year ended December 31, 2015 due to the settlement and changes in the actuarial assumptions used to estimate the Pension Plan projected benefit obligation.
The following table summarizes the components recognized in the Consolidated Balance Sheets relating to the Pension and Postretirement Benefits as of December 31:
Pension Postretirement Benefits Total(Amounts in millions) 2016 2015 2016 2015 2016 2015
Pension and other postretirement benefits liability $ 86.8 $ 95.3 $ 0.8 $ 1.0 $ 87.6 $ 96.3Accumulated other comprehensive loss:
Net actuarial loss, net of tax $ 44.3 $ 46.0 $ 0.5 $ 0.8 $ 44.8 $ 46.8Prior service cost (credit), net of tax 0.2 0.2 (0.2) (0.7) — (0.5)
Total $ 44.5 $ 46.2 $ 0.3 $ 0.1 $ 44.8 $ 46.3
The following table summarizes the benefit obligation and accumulated benefit obligation for the Pension Plan, SERPs and Postretirement Benefits fair value of plan assets as of December 31:
Pension Plan SERPs Postretirement Benefits(Amounts in millions) 2016 2015 2016 2015 2016 2015
Benefit obligation $ 128.5 $ 132.5 $ 70.5 $ 70.7 $ 0.8 $ 1.0Accumulated benefit obligation 128.5 132.5 70.2 70.4 — —Fair value of plan assets 112.2 107.9 — — — —
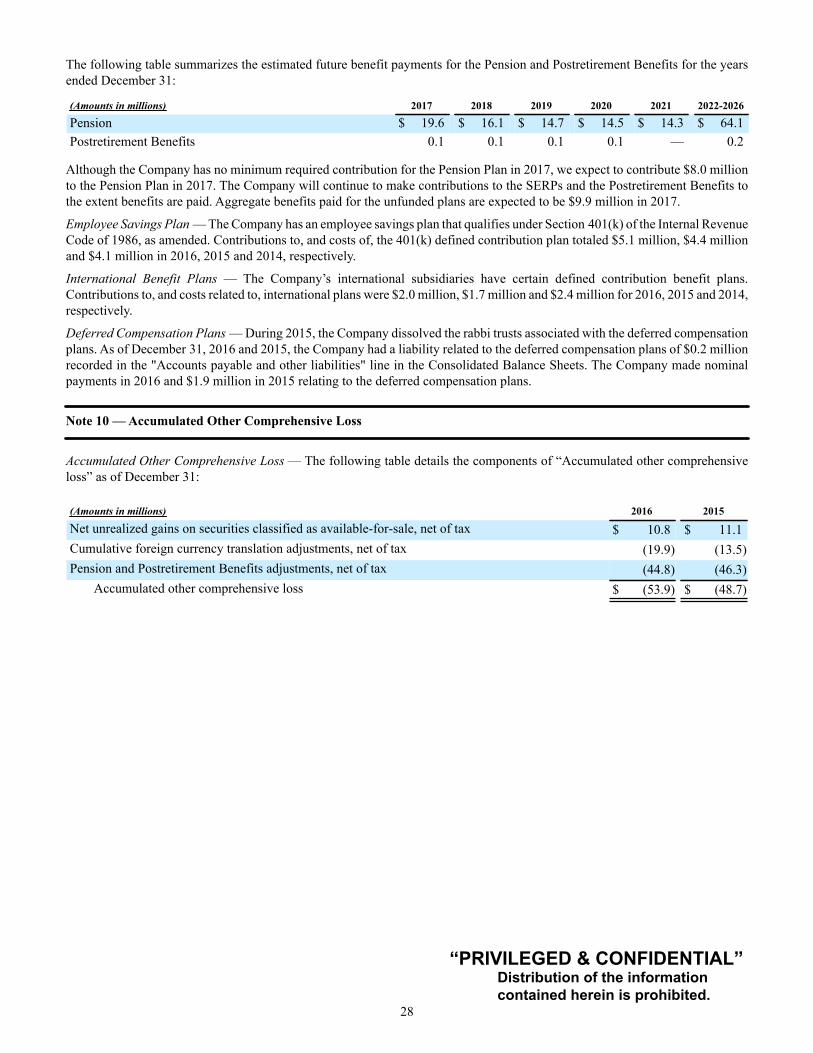
“PRIVILEGED & CONFIDENTIAL” Distribution of the information contained herein is prohibited.
28
The following table summarizes the estimated future benefit payments for the Pension and Postretirement Benefits for the years ended December 31:
(Amounts in millions) 2017 2018 2019 2020 2021 2022-2026
Pension $ 19.6 $ 16.1 $ 14.7 $ 14.5 $ 14.3 $ 64.1Postretirement Benefits 0.1 0.1 0.1 0.1 — 0.2
Although the Company has no minimum required contribution for the Pension Plan in 2017, we expect to contribute $8.0 millionto the Pension Plan in 2017. The Company will continue to make contributions to the SERPs and the Postretirement Benefits to the extent benefits are paid. Aggregate benefits paid for the unfunded plans are expected to be $9.9 million in 2017.
Employee Savings Plan — The Company has an employee savings plan that qualifies under Section 401(k) of the Internal Revenue Code of 1986, as amended. Contributions to, and costs of, the 401(k) defined contribution plan totaled $5.1 million, $4.4 millionand $4.1 million in 2016, 2015 and 2014, respectively.
International Benefit Plans — The Company’s international subsidiaries have certain defined contribution benefit plans. Contributions to, and costs related to, international plans were $2.0 million, $1.7 million and $2.4 million for 2016, 2015 and 2014, respectively.
Deferred Compensation Plans — During 2015, the Company dissolved the rabbi trusts associated with the deferred compensation plans. As of December 31, 2016 and 2015, the Company had a liability related to the deferred compensation plans of $0.2 millionrecorded in the "Accounts payable and other liabilities" line in the Consolidated Balance Sheets. The Company made nominal payments in 2016 and $1.9 million in 2015 relating to the deferred compensation plans.
Note 10 — Accumulated Other Comprehensive Loss
Accumulated Other Comprehensive Loss — The following table details the components of “Accumulated other comprehensive loss” as of December 31:
(Amounts in millions) 2016 2015
Net unrealized gains on securities classified as available-for-sale, net of tax $ 10.8 $ 11.1Cumulative foreign currency translation adjustments, net of tax (19.9) (13.5)Pension and Postretirement Benefits adjustments, net of tax (44.8) (46.3)
Accumulated other comprehensive loss $ (53.9) $ (48.7)
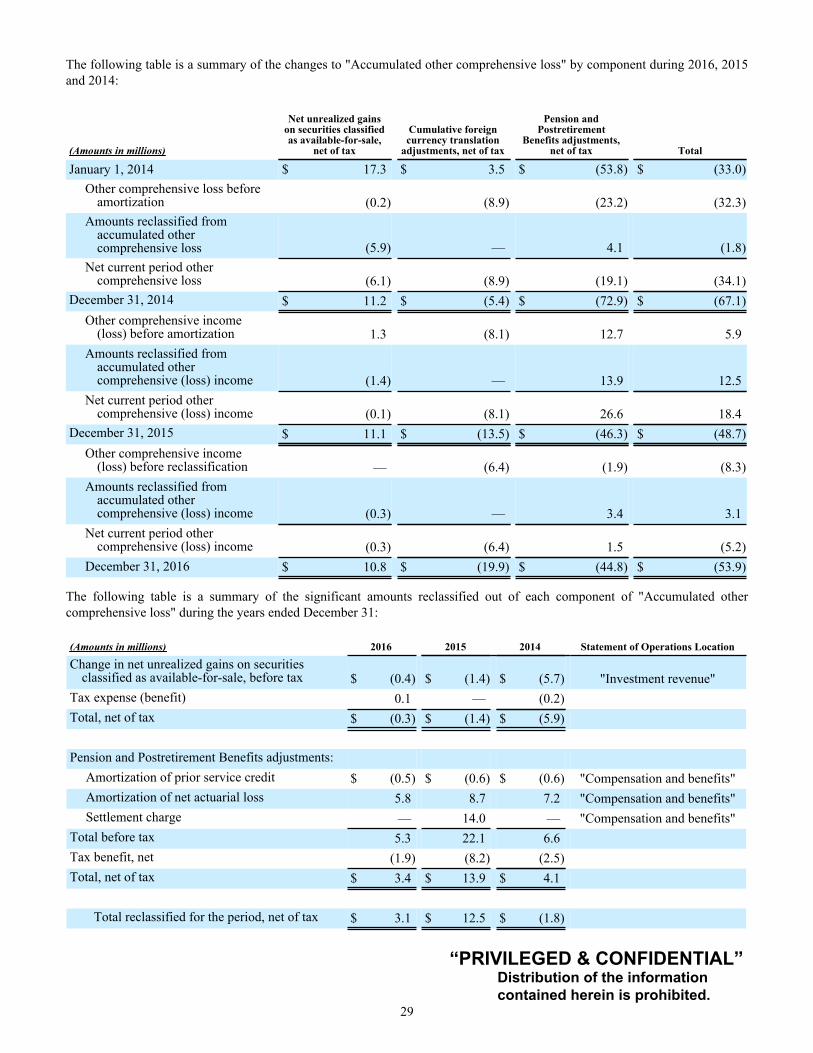
“PRIVILEGED & CONFIDENTIAL” Distribution of the information contained herein is prohibited.
29
The following table is a summary of the changes to "Accumulated other comprehensive loss" by component during 2016, 2015and 2014:
(Amounts in millions)
Net unrealized gainson securities classifiedas available-for-sale,
net of tax
Cumulative foreigncurrency translation
adjustments, net of tax
Pension andPostretirement
Benefits adjustments,net of tax Total
January 1, 2014 $ 17.3 $ 3.5 $ (53.8) $ (33.0)Other comprehensive loss before
amortization (0.2) (8.9) (23.2) (32.3)Amounts reclassified from
accumulated othercomprehensive loss (5.9) — 4.1 (1.8)
Net current period othercomprehensive loss (6.1) (8.9) (19.1) (34.1)
December 31, 2014 $ 11.2 $ (5.4) $ (72.9) $ (67.1)Other comprehensive income
(loss) before amortization 1.3 (8.1) 12.7 5.9Amounts reclassified from
accumulated othercomprehensive (loss) income (1.4) — 13.9 12.5
Net current period othercomprehensive (loss) income (0.1) (8.1) 26.6 18.4
December 31, 2015 $ 11.1 $ (13.5) $ (46.3) $ (48.7)Other comprehensive income
(loss) before reclassification — (6.4) (1.9) (8.3)Amounts reclassified from
accumulated othercomprehensive (loss) income (0.3) — 3.4 3.1
Net current period othercomprehensive (loss) income (0.3) (6.4) 1.5 (5.2)
December 31, 2016 $ 10.8 $ (19.9) $ (44.8) $ (53.9)
The following table is a summary of the significant amounts reclassified out of each component of "Accumulated other comprehensive loss" during the years ended December 31:
(Amounts in millions) 2016 2015 2014 Statement of Operations Location
Change in net unrealized gains on securitiesclassified as available-for-sale, before tax $ (0.4) $ (1.4) $ (5.7) "Investment revenue"
Tax expense (benefit) 0.1 — (0.2)Total, net of tax $ (0.3) $ (1.4) $ (5.9)
Pension and Postretirement Benefits adjustments:Amortization of prior service credit $ (0.5) $ (0.6) $ (0.6) "Compensation and benefits"Amortization of net actuarial loss 5.8 8.7 7.2 "Compensation and benefits"Settlement charge — 14.0 — "Compensation and benefits"
Total before tax 5.3 22.1 6.6Tax benefit, net (1.9) (8.2) (2.5)Total, net of tax $ 3.4 $ 13.9 $ 4.1
Total reclassified for the period, net of tax $ 3.1 $ 12.5 $ (1.8)

“PRIVILEGED & CONFIDENTIAL” Distribution of the information contained herein is prohibited.
30
Note 11 — Stock-Based Compensation
Employees of the Company participate in the stock compensation plans of MGI which provide for the grant of stock options, stock appreciation rights, restricted stock units and restricted stock awards (collectively, "share-based awards") to eligible employees of the Company. The expense associated with the fair value of MoneyGram share-based awards is allocated to the Company and is recorded in “Compensation and benefits” in the Consolidated Statements of Operations.
The calculated fair value of share-based awards is recognized as compensation cost using the straight-line method over the vesting or service period in the Company’s financial statements. Stock-based compensation is recognized only for those options and restricted stock units expected to vest, with forfeitures estimated at the date of grant and evaluated and adjusted periodically to reflect the Company’s historical experience and future expectations. Any change in the forfeiture assumption will be accounted for as a change in estimate, with the cumulative effect of the change on periods previously reported being reflected in the financial statements of the period in which the change is made.
The following table is a summary of the Company's stock-based compensation expense for the years ended December 31:
(Amounts in millions) 2016 2015 2014
Expense recognized related to stock options $ 2.8 $ 4.5 $ 6.2Expense recognized related to restricted stock units 14.5 14.5 (1.3)
Stock-based compensation expense $ 17.3 $ 19.0 $ 4.9
Stock Options — Option awards are granted with an exercise price equal to the closing market price of MoneyGram’s common stock on the date of grant. All outstanding stock options contain certain forfeiture and non-compete provisions.
There were no options granted in 2016 or 2015. All options granted in 2014, 2013 and 2012 have a term of 10 years. Prior to the fourth quarter of 2011, options issued were either time based, vesting over a four-year period, or performance based, vesting over a five-year period. All options issued after the fourth quarter of 2011 are time-based, with options granted in the fourth quarter of 2011 through the first part of 2014 vesting over a four-year period, and the remaining options granted in 2014 vesting over a three-year period, in an equal number of shares each year.
For purposes of determining the fair value of stock option awards, the Company uses the Black-Scholes single option pricing model for time-based and performance-based tranches. The following table provides weighted-average grant-date fair value and assumptions utilized to estimate the grant-date fair value of the options granted during the year ended December 31:
2014
Expected dividend yield(1) 0.0%Expected volatility(2) 64.6% - 68.2%Risk-free interest rate(3) 1.1% - 2.1%Expected life(4) 6.0 - 6.3 yearsWeighted-average grant-date fair value per option $10.99
(1) Expected dividend yield represents the level of dividends expected to be paid on MoneyGram’s common stock over the expected term of the option. MoneyGram does not anticipate declaring any dividends at this time.
(2) Expected volatility is the amount by which MoneyGram’s stock price has fluctuated or will fluctuate during the expected term of the option. MoneyGram’s expected volatility is calculated based on the historical volatility of the price of MoneyGram’s common stock since the spin-off from Viad Corporation on June 30, 2004. The Company also considers any known or anticipated factors that will likely impact future volatility.
(3) The risk-free interest rate for the Black-Scholes model is based on the U.S. Treasury yield curve in effect at the time of grant for periods within the expected term of the option.
(4) Expected life represents the period of time that options are expected to be outstanding. The expected life was determined using the simplified method as the pattern of changes in the value of MoneyGram’s common stock and exercise activity since late 2007 has been inconsistent and substantially different from historical patterns. Additionally, there have been minimal stock option exercises which would be representative of MoneyGram’s normal exercise activity since 2007. Accordingly, the Company does not believe that historical terms are relevant to the assessment of the expected term of the grant. Based on these factors, the Company does not believe that it has the ability to make a more refined estimate than the use of the simplified method.
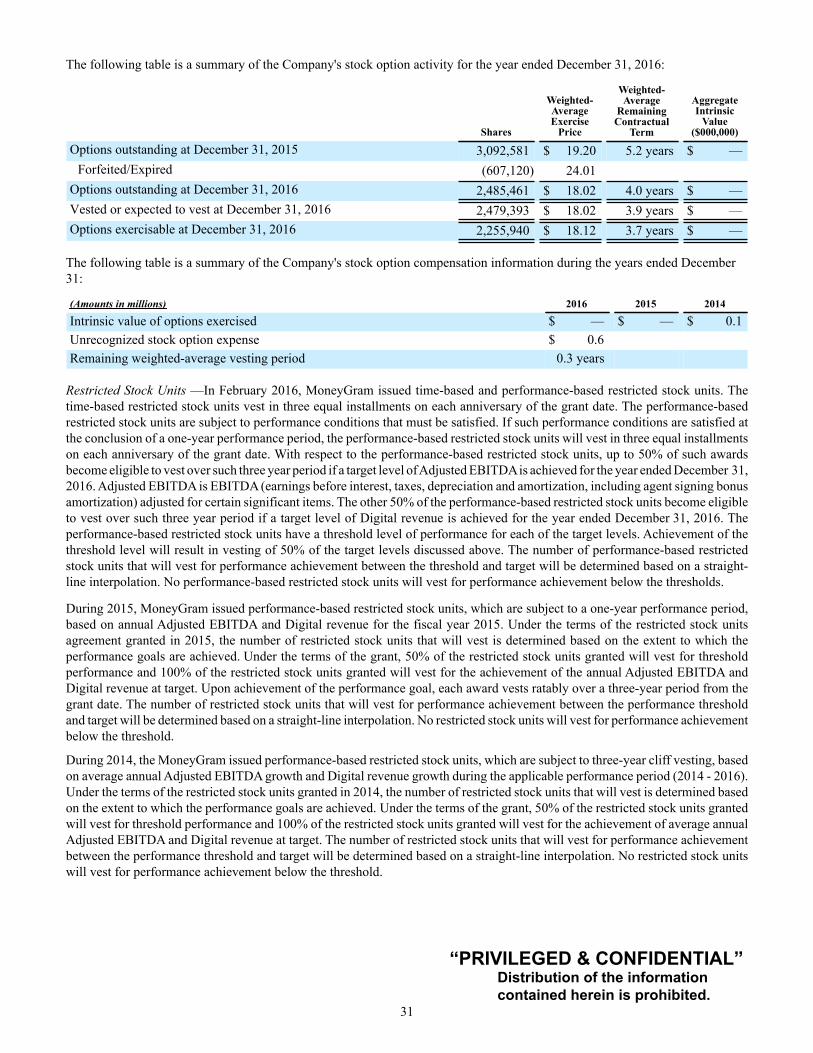
“PRIVILEGED & CONFIDENTIAL” Distribution of the information contained herein is prohibited.
31
The following table is a summary of the Company's stock option activity for the year ended December 31, 2016:
Shares
Weighted-AverageExercise
Price
Weighted-Average
RemainingContractual
Term
AggregateIntrinsic
Value($000,000)
Options outstanding at December 31, 2015 3,092,581 $ 19.20 5.2 years $ —Forfeited/Expired (607,120) 24.01
Options outstanding at December 31, 2016 2,485,461 $ 18.02 4.0 years $ —Vested or expected to vest at December 31, 2016 2,479,393 $ 18.02 3.9 years $ —Options exercisable at December 31, 2016 2,255,940 $ 18.12 3.7 years $ —
The following table is a summary of the Company's stock option compensation information during the years ended December 31:
(Amounts in millions) 2016 2015 2014
Intrinsic value of options exercised $ — $ — $ 0.1Unrecognized stock option expense $ 0.6Remaining weighted-average vesting period 0.3 years
Restricted Stock Units —In February 2016, MoneyGram issued time-based and performance-based restricted stock units. The time-based restricted stock units vest in three equal installments on each anniversary of the grant date. The performance-based restricted stock units are subject to performance conditions that must be satisfied. If such performance conditions are satisfied at the conclusion of a one-year performance period, the performance-based restricted stock units will vest in three equal installments on each anniversary of the grant date. With respect to the performance-based restricted stock units, up to 50% of such awards become eligible to vest over such three year period if a target level of Adjusted EBITDA is achieved for the year ended December 31, 2016. Adjusted EBITDA is EBITDA (earnings before interest, taxes, depreciation and amortization, including agent signing bonus amortization) adjusted for certain significant items. The other 50% of the performance-based restricted stock units become eligible to vest over such three year period if a target level of Digital revenue is achieved for the year ended December 31, 2016. The performance-based restricted stock units have a threshold level of performance for each of the target levels. Achievement of the threshold level will result in vesting of 50% of the target levels discussed above. The number of performance-based restricted stock units that will vest for performance achievement between the threshold and target will be determined based on a straight-line interpolation. No performance-based restricted stock units will vest for performance achievement below the thresholds.
During 2015, MoneyGram issued performance-based restricted stock units, which are subject to a one-year performance period, based on annual Adjusted EBITDA and Digital revenue for the fiscal year 2015. Under the terms of the restricted stock units agreement granted in 2015, the number of restricted stock units that will vest is determined based on the extent to which the performance goals are achieved. Under the terms of the grant, 50% of the restricted stock units granted will vest for threshold performance and 100% of the restricted stock units granted will vest for the achievement of the annual Adjusted EBITDA and Digital revenue at target. Upon achievement of the performance goal, each award vests ratably over a three-year period from the grant date. The number of restricted stock units that will vest for performance achievement between the performance threshold and target will be determined based on a straight-line interpolation. No restricted stock units will vest for performance achievement below the threshold.
During 2014, the MoneyGram issued performance-based restricted stock units, which are subject to three-year cliff vesting, based on average annual Adjusted EBITDA growth and Digital revenue growth during the applicable performance period (2014 - 2016). Under the terms of the restricted stock units granted in 2014, the number of restricted stock units that will vest is determined based on the extent to which the performance goals are achieved. Under the terms of the grant, 50% of the restricted stock units granted will vest for threshold performance and 100% of the restricted stock units granted will vest for the achievement of average annual Adjusted EBITDA and Digital revenue at target. The number of restricted stock units that will vest for performance achievement between the performance threshold and target will be determined based on a straight-line interpolation. No restricted stock units will vest for performance achievement below the threshold.
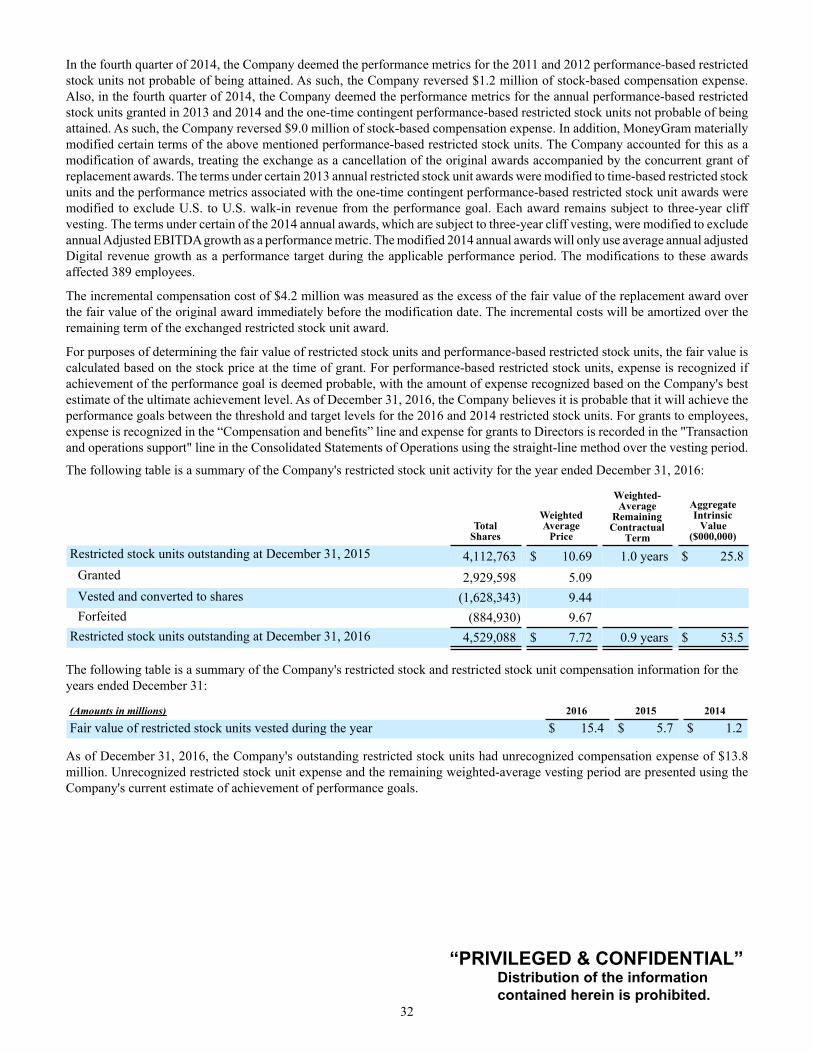
“PRIVILEGED & CONFIDENTIAL” Distribution of the information contained herein is prohibited.
32
In the fourth quarter of 2014, the Company deemed the performance metrics for the 2011 and 2012 performance-based restricted stock units not probable of being attained. As such, the Company reversed $1.2 million of stock-based compensation expense. Also, in the fourth quarter of 2014, the Company deemed the performance metrics for the annual performance-based restricted stock units granted in 2013 and 2014 and the one-time contingent performance-based restricted stock units not probable of being attained. As such, the Company reversed $9.0 million of stock-based compensation expense. In addition, MoneyGram materially modified certain terms of the above mentioned performance-based restricted stock units. The Company accounted for this as a modification of awards, treating the exchange as a cancellation of the original awards accompanied by the concurrent grant of replacement awards. The terms under certain 2013 annual restricted stock unit awards were modified to time-based restricted stock units and the performance metrics associated with the one-time contingent performance-based restricted stock unit awards were modified to exclude U.S. to U.S. walk-in revenue from the performance goal. Each award remains subject to three-year cliff vesting. The terms under certain of the 2014 annual awards, which are subject to three-year cliff vesting, were modified to exclude annual Adjusted EBITDA growth as a performance metric. The modified 2014 annual awards will only use average annual adjusted Digital revenue growth as a performance target during the applicable performance period. The modifications to these awards affected 389 employees.
The incremental compensation cost of $4.2 million was measured as the excess of the fair value of the replacement award over the fair value of the original award immediately before the modification date. The incremental costs will be amortized over the remaining term of the exchanged restricted stock unit award.
For purposes of determining the fair value of restricted stock units and performance-based restricted stock units, the fair value is calculated based on the stock price at the time of grant. For performance-based restricted stock units, expense is recognized if achievement of the performance goal is deemed probable, with the amount of expense recognized based on the Company's best estimate of the ultimate achievement level. As of December 31, 2016, the Company believes it is probable that it will achieve the performance goals between the threshold and target levels for the 2016 and 2014 restricted stock units. For grants to employees, expense is recognized in the “Compensation and benefits” line and expense for grants to Directors is recorded in the "Transaction and operations support" line in the Consolidated Statements of Operations using the straight-line method over the vesting period.
The following table is a summary of the Company's restricted stock unit activity for the year ended December 31, 2016:
TotalShares
WeightedAverage
Price
Weighted-Average
RemainingContractual
Term
AggregateIntrinsic
Value($000,000)
Restricted stock units outstanding at December 31, 2015 4,112,763 $ 10.69 1.0 years $ 25.8Granted 2,929,598 5.09Vested and converted to shares (1,628,343) 9.44Forfeited (884,930) 9.67
Restricted stock units outstanding at December 31, 2016 4,529,088 $ 7.72 0.9 years $ 53.5
The following table is a summary of the Company's restricted stock and restricted stock unit compensation information for the years ended December 31:
(Amounts in millions) 2016 2015 2014
Fair value of restricted stock units vested during the year $ 15.4 $ 5.7 $ 1.2
As of December 31, 2016, the Company's outstanding restricted stock units had unrecognized compensation expense of $13.8 million. Unrecognized restricted stock unit expense and the remaining weighted-average vesting period are presented using the Company's current estimate of achievement of performance goals.
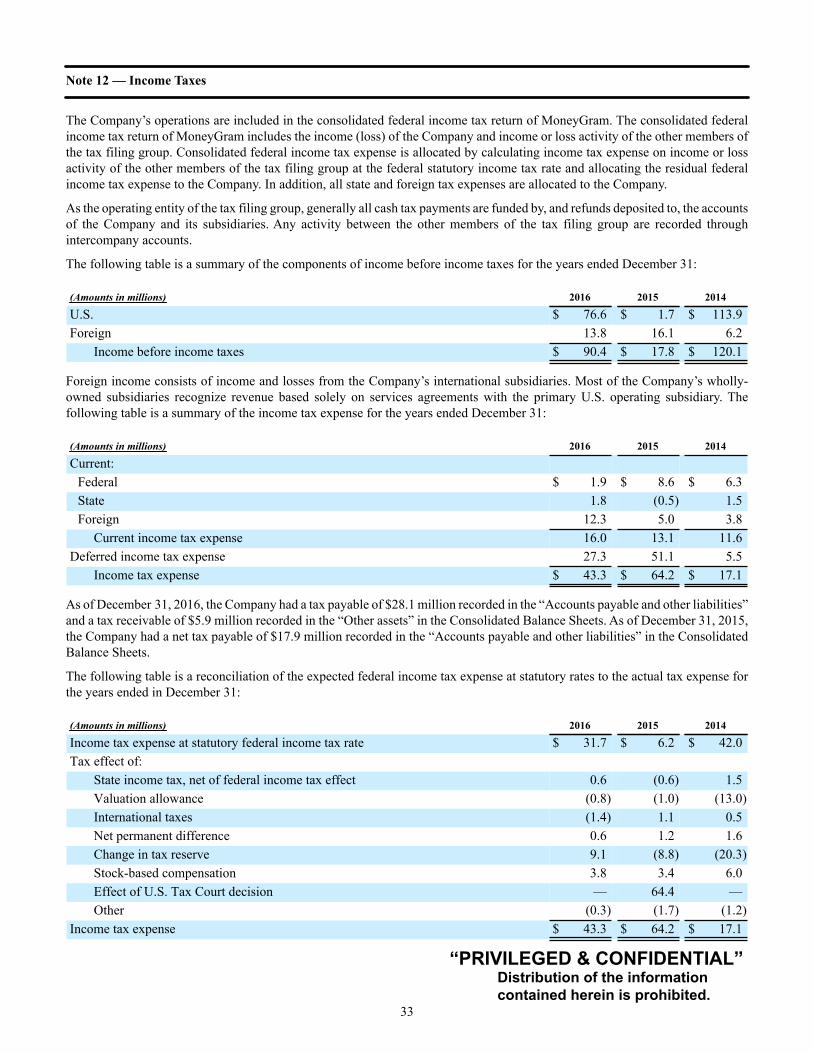
“PRIVILEGED & CONFIDENTIAL” Distribution of the information contained herein is prohibited.
33
Note 12 — Income Taxes
The Company’s operations are included in the consolidated federal income tax return of MoneyGram. The consolidated federal income tax return of MoneyGram includes the income (loss) of the Company and income or loss activity of the other members of the tax filing group. Consolidated federal income tax expense is allocated by calculating income tax expense on income or loss activity of the other members of the tax filing group at the federal statutory income tax rate and allocating the residual federal income tax expense to the Company. In addition, all state and foreign tax expenses are allocated to the Company.
As the operating entity of the tax filing group, generally all cash tax payments are funded by, and refunds deposited to, the accounts of the Company and its subsidiaries. Any activity between the other members of the tax filing group are recorded through intercompany accounts.
The following table is a summary of the components of income before income taxes for the years ended December 31:
(Amounts in millions) 2016 2015 2014
U.S. $ 76.6 $ 1.7 $ 113.9Foreign 13.8 16.1 6.2
Income before income taxes $ 90.4 $ 17.8 $ 120.1
Foreign income consists of income and losses from the Company’s international subsidiaries. Most of the Company’s wholly-owned subsidiaries recognize revenue based solely on services agreements with the primary U.S. operating subsidiary. The following table is a summary of the income tax expense for the years ended December 31:
(Amounts in millions) 2016 2015 2014
Current:Federal $ 1.9 $ 8.6 $ 6.3State 1.8 (0.5) 1.5Foreign 12.3 5.0 3.8
Current income tax expense 16.0 13.1 11.6Deferred income tax expense 27.3 51.1 5.5
Income tax expense $ 43.3 $ 64.2 $ 17.1
As of December 31, 2016, the Company had a tax payable of $28.1 million recorded in the “Accounts payable and other liabilities” and a tax receivable of $5.9 million recorded in the “Other assets” in the Consolidated Balance Sheets. As of December 31, 2015, the Company had a net tax payable of $17.9 million recorded in the “Accounts payable and other liabilities” in the Consolidated Balance Sheets.
The following table is a reconciliation of the expected federal income tax expense at statutory rates to the actual tax expense for the years ended in December 31:
(Amounts in millions) 2016 2015 2014
Income tax expense at statutory federal income tax rate $ 31.7 $ 6.2 $ 42.0Tax effect of:
State income tax, net of federal income tax effect 0.6 (0.6) 1.5Valuation allowance (0.8) (1.0) (13.0)International taxes (1.4) 1.1 0.5Net permanent difference 0.6 1.2 1.6Change in tax reserve 9.1 (8.8) (20.3)Stock-based compensation 3.8 3.4 6.0Effect of U.S. Tax Court decision — 64.4 —Other (0.3) (1.7) (1.2)
Income tax expense $ 43.3 $ 64.2 $ 17.1

“PRIVILEGED & CONFIDENTIAL” Distribution of the information contained herein is prohibited.
34
In 2016, the Company recognized a tax expense of $43.3 million on pre-tax income of $90.4 million, primarily due to a tax settlement reached with the Internal Revenue Service (“IRS”) on the matter discussed below and the reversal of tax benefits on share-based compensation.
In 2015, the Company recognized a tax expense of $64.2 million on pre-tax income of $17.8 million, primarily resulting from the decision of the U.S. Tax Court during the first quarter of 2015 related to the IRS matter discussed in more detail below.
In 2014, the Company recognized a tax expense of $17.1 million, on pre-tax income of $120.1 million, resulting from reductions of uncertain tax positions of prior years and the tax treatment of the net securities gains which were partially offset by the reversal of tax benefits on canceled stock options.
The following table is a summary of the Company's deferred tax assets and liabilities as of December 31:
(Amounts in millions) 2016 2015
Deferred tax assets:Basis difference in revalued investments $ 101.6 $ 101.5Tax loss carryovers 29.9 29.4Postretirement benefits and other employee benefits 29.8 29.1Tax credit carryovers 7.5 12.6Bad debt and other reserves 4.2 4.3Other 8.8 13.7Valuation allowance (124.2) (125.8)
Total deferred tax assets 57.6 64.8Deferred tax liability:
Depreciation and amortization (100.8) (92.0)Total deferred tax liability (100.8) (92.0)
Net deferred tax liability $ (43.2) $ (27.2)
As of December 31, 2016 and 2015, net deferred tax asset positions of $4.4 million and $5.1 million, respectively, were included in “Other assets” and net deferred tax liability positions of $47.6 million and $32.3 million, respectively, were included in “Accounts payable and other liabilities” in the Consolidated Balance Sheets. The valuation allowance as of December 31, 2016 and 2015relates primarily to basis differences in revalued investments, capital loss carryovers and, to a smaller extent, certain foreign tax loss carryovers.
The following table is a summary of the amounts and expiration dates of tax loss carry-forwards (not tax effected) and credit carry-forwards as of December 31, 2016:
(Amounts in millions)Expiration
Date Amount
U.S. capital loss carry-forwards 2017 - 2021 $ 56.8U.S. tax credit carry-forwards 2026 - 2036 $ 7.5
The MoneyGram tax filing group, including the Company, files income tax returns in the U.S. federal jurisdiction and various state and foreign jurisdictions. With a few exceptions, the MoneyGram tax filing group is no longer subject to foreign or U.S., state and local income tax examinations for years prior to 2011. The U.S. federal income tax filings are subject to audit for fiscal years 2014 through 2016.

“PRIVILEGED & CONFIDENTIAL” Distribution of the information contained herein is prohibited.
35
The IRS completed its examination of MoneyGram's consolidated income tax returns through 2013 and issued Notices of Deficiency for 2005-2007 and 2009, and an Examination Report for 2008. The Notices of Deficiency and Examination Report disallow, among other items, approximately $900.0 million of ordinary deductions on securities losses in the 2007, 2008 and 2009 tax returns. In May 2012 and December 2012, MoneyGram filed petitions in the U.S. Tax Court challenging the 2005-2007 and 2009 Notices of Deficiency, respectively. In 2013, MoneyGram reached a partial settlement with the IRS allowing ordinary loss treatment on $186.9 million of deductions in dispute. In January 2015, the U.S. Tax Court granted the IRS's motion for summary judgment upholding the remaining adjustments in the Notices of Deficiency. MoneyGram filed a notice of appeal with the U.S. Tax Court on July 27, 2015 for an appeal to the U.S. Court of Appeals for the Fifth Circuit. Oral arguments were held before the Fifth Circuit on June 7, 2016, and on November 15, 2016, the Fifth Circuit vacated the Tax Court's decision and remanded the case to the Tax Court for further proceedings.
The Tax Court's January 2015 decision was a change in facts which warranted reassessment of MoneyGram's uncertain tax position. Although MoneyGram believes that it has substantive tax law arguments in favor of its position and has appealed the ruling, the reassessment resulted in MoneyGram determining that it is no longer more likely than not that its existing position will be sustained. Accordingly, MoneyGram re-characterized certain deductions relating to securities losses to be capital in nature, rather than ordinary. MoneyGram recorded a full valuation allowance against these losses in the quarter ended March 31, 2015. This change increased "Income tax expense" in the Consolidated Statements of Operations in the quarter ended March 31, 2015 by $63.7 million. During 2015, MoneyGram made payments to the IRS of $61.0 million for federal tax payments and associated interest related to the matter. Pending the outcome of the Tax Court proceeding, MoneyGram may be required to file amended state returns and make additional cash payments of up to $17.5 million on amounts that have previously been accrued.
The IRS completed its examination of MoneyGram's consolidated income tax returns for the tax years 2011 through 2013 and issued a Revenue Agent Report (“RAR”) in the first quarter of 2015 that included disallowing $100.0 million of deductions related to payments MoneyGram made to the U.S. Department of Justice ("U.S. DOJ") pursuant to the Deferred Prosecution Agreement. In April 2016, MoneyGram entered into a settlement agreement with the IRS allowing a deduction of $39.3 million. As of December 31, 2016, MoneyGram had fully settled this matter with $21.2 million of existing deferred tax assets and $0.5 millionof cash after recognizing an additional $7.7 million of income tax expense for the year ended December 31, 2016. The state tax liabilities related to the federal settlement have yet to be settled due to the pending implications of the security losses.
Unrecognized tax benefits are recorded in “Accounts payable and other liabilities” in the Consolidated Balance Sheets. The following table is a reconciliation of unrecognized tax benefits for the years ended December 31:
(Amounts in millions) 2016 2015 2014
Beginning balance $ 30.5 $ 31.7 $ 52.0Additions based on tax positions related to prior years 11.2 8.3 0.3Additions based on tax positions related to current year 4.6 0.2 2.7Settlements with cash or attributes (21.4) — —Reductions for tax positions of prior years and other (0.7) (9.7) (23.3)
Ending balance $ 24.2 $ 30.5 $ 31.7
As of December 31, 2016, 2015 and 2014, the liability for unrecognized tax benefits was $24.2 million, $30.5 million and $31.7 million, respectively, exclusive of interest and penalties. For 2016, the net amount of unrecognized tax benefits that if recognized could impact the effective tax rate was $16.7 million. For 2015 and 2014, all of the unrecognized tax benefits could impact the effective tax rate if recognized. The significant increases and decreases in 2016 were related to an increase in foreign taxes and the IRS settlement with respect to the U.S. DOJ matter as discussed above. The Company accrues interest and penalties for unrecognized tax benefits through “Income tax expense” in the Consolidated Statements of Operations. The Company recorded $2.4 million, $1.9 million and $0.5 million in interest and penalties in its Consolidated Statements of Operations for the years ended December 31, 2016, 2015 and 2014, respectively. As of December 31, 2016 and 2015, the Company had a total of $6.4 million and $4.5 million, respectively, accrued for interest and penalties within "Accounts payable and other liabilities." The Company's interest and penalties accrual as of December 31, 2016 was impacted by $0.5 million of payments related to the settlement of the U.S. DOJ matter. As a result of MoneyGram's litigation related to its securities losses previously discussed, it is possible that there could be a significant decrease to the total amount of unrecognized tax benefits over the next 12 months. However, as of December 31, 2016, it is not possible to reasonably estimate the expected change to the total amount of unrecognized tax positions over the next 12 months.
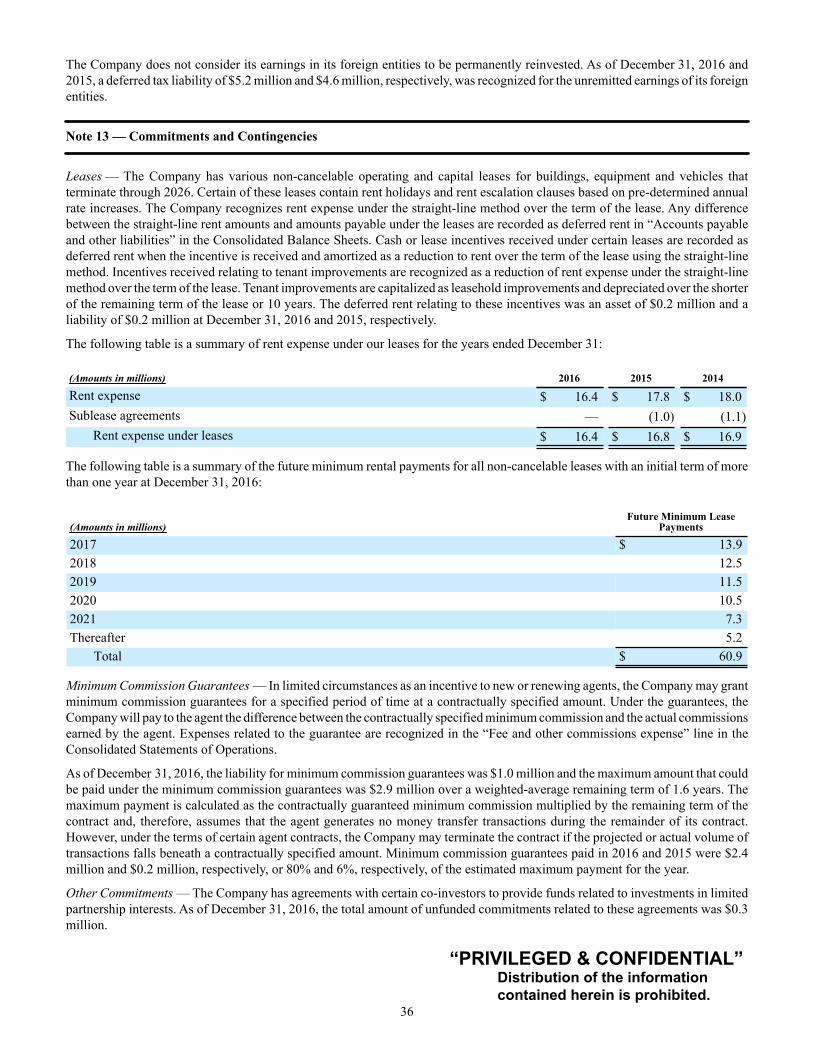
“PRIVILEGED & CONFIDENTIAL” Distribution of the information contained herein is prohibited.
36
The Company does not consider its earnings in its foreign entities to be permanently reinvested. As of December 31, 2016 and 2015, a deferred tax liability of $5.2 million and $4.6 million, respectively, was recognized for the unremitted earnings of its foreign entities.
Note 13 — Commitments and Contingencies
Leases — The Company has various non-cancelable operating and capital leases for buildings, equipment and vehicles that terminate through 2026. Certain of these leases contain rent holidays and rent escalation clauses based on pre-determined annual rate increases. The Company recognizes rent expense under the straight-line method over the term of the lease. Any difference between the straight-line rent amounts and amounts payable under the leases are recorded as deferred rent in “Accounts payable and other liabilities” in the Consolidated Balance Sheets. Cash or lease incentives received under certain leases are recorded as deferred rent when the incentive is received and amortized as a reduction to rent over the term of the lease using the straight-line method. Incentives received relating to tenant improvements are recognized as a reduction of rent expense under the straight-line method over the term of the lease. Tenant improvements are capitalized as leasehold improvements and depreciated over the shorter of the remaining term of the lease or 10 years. The deferred rent relating to these incentives was an asset of $0.2 million and a liability of $0.2 million at December 31, 2016 and 2015, respectively.
The following table is a summary of rent expense under our leases for the years ended December 31:
(Amounts in millions) 2016 2015 2014
Rent expense $ 16.4 $ 17.8 $ 18.0Sublease agreements — (1.0) (1.1)
Rent expense under leases $ 16.4 $ 16.8 $ 16.9
The following table is a summary of the future minimum rental payments for all non-cancelable leases with an initial term of more than one year at December 31, 2016:
(Amounts in millions)Future Minimum Lease
Payments
2017 $ 13.92018 12.52019 11.52020 10.52021 7.3Thereafter 5.2
Total $ 60.9
Minimum Commission Guarantees — In limited circumstances as an incentive to new or renewing agents, the Company may grant minimum commission guarantees for a specified period of time at a contractually specified amount. Under the guarantees, the Company will pay to the agent the difference between the contractually specified minimum commission and the actual commissions earned by the agent. Expenses related to the guarantee are recognized in the “Fee and other commissions expense” line in the Consolidated Statements of Operations.
As of December 31, 2016, the liability for minimum commission guarantees was $1.0 million and the maximum amount that could be paid under the minimum commission guarantees was $2.9 million over a weighted-average remaining term of 1.6 years. The maximum payment is calculated as the contractually guaranteed minimum commission multiplied by the remaining term of the contract and, therefore, assumes that the agent generates no money transfer transactions during the remainder of its contract. However, under the terms of certain agent contracts, the Company may terminate the contract if the projected or actual volume of transactions falls beneath a contractually specified amount. Minimum commission guarantees paid in 2016 and 2015 were $2.4 million and $0.2 million, respectively, or 80% and 6%, respectively, of the estimated maximum payment for the year.
Other Commitments — The Company has agreements with certain co-investors to provide funds related to investments in limited partnership interests. As of December 31, 2016, the total amount of unfunded commitments related to these agreements was $0.3 million.

“PRIVILEGED & CONFIDENTIAL” Distribution of the information contained herein is prohibited.
37
Legal Proceedings — The matters set forth below are subject to uncertainties and outcomes that are not predictable. The Company accrues for these matters as any resulting losses become probable and can be reasonably estimated. Further, the Company maintains insurance coverage for many claims and litigation matters. In relation to various legal matters, including those described below, the Company had $1.2 million and $16.3 million of liability recorded in the “Accounts payable and other liabilities” line in the Consolidated Balance Sheets as of December 31, 2016 and 2015, respectively. A credit of $0.6 million was recorded in the “Transaction and operations support” line in the Consolidated Statements of Operations during 2016 due to the reversal of certain legal settlement accruals. A charge of $2.4 million and $12.4 million were recorded in the “Transaction and operations support” line in the Consolidated Statements of Operations during 2015 and 2014, respectively, for legal proceedings.
Litigation Commenced Against MoneyGram and the Company:
Class Action Securities Litigation — On April 15, 2015, a securities class action lawsuit was filed in the Superior Court of the State of Delaware, County of New Castle, against MoneyGram, all of its directors, certain of its executive officers, Thomas H. Lee Partners, Goldman Sachs and the underwriters of the secondary public offering of MoneyGram's common stock that closed on April 2, 2014 (the “2014 Offering”). The lawsuit was brought by the Iron Workers District Council of New England Pension Fund seeking to represent a class consisting of all purchasers of MoneyGram’s common stock issued pursuant and/or traceable to MoneyGram's registration statement and prospectus, and all documents incorporated by reference therein, for the 2014 Offering. The lawsuit alleges violations of Sections 11, 12(a)(2) and 15 of the Securities Act of 1933, as amended, due to allegedly false and misleading statements in connection with the 2014 Offering and seeks unspecified damages and other relief. In May 2015, MoneyGram and the other defendants filed a notice of removal to the federal district court of the District of Delaware. In September 2016, the court denied plaintiffs' motion to remand. MoneyGram believes that the claims are without merit and intends to vigorously defend against the lawsuit. MoneyGram is unable to predict the outcome, or the possible loss or range of loss, if any, related to this matter.
Class Action Securities Litigation — On March 13, 2017, a putative securities class action lawsuit was filed in the United States District Court for the District of Delaware against MoneyGram, all of its directors, certain of its executive officers, Alipay (UK) Limited, Alipay (Hong Kong) Limited, Matrix Acquisition Corp., and Ant Financial Services Group. The plaintiff, a MoneyGram stockholder, challenges the Merger and the disclosures made in connection with the Merger. The lawsuit alleges violations of Sections 14(a) and 20(a) of the Exchange Act and Rule 14a-9 promulgated thereunder due to allegedly material and misleading omissions in the preliminary proxy statement filed in connection with the Merger. The lawsuit also alleges that the Merger Agreement is unfair to MoneyGram’s stockholders, resulted from an inadequate process, and contains terms that will supposedly deter third parties from making alternative offers. The plaintiff seeks to enjoin the Merger and to recover damages, costs, and attorneys’ fees in unspecified amounts. The plaintiff has not yet served the defendants, and the defendants’ date to answer, move to dismiss, or otherwise respond to the lawsuit has not yet been set. MoneyGram believes that the claims are without merit and intends to vigorously defend itself against the lawsuit.
Other Matters — The Company is involved in various other claims and litigation that arise from time to time in the ordinary course of the Company's business. Management does not believe that after final disposition any of these matters is likely to have a material adverse impact on the Company’s financial condition, results of operations and cash flows.
Government Investigations
State Civil Investigative Demands — The Company received Civil Investigative Demands from a working group of nine state attorneys general who initiated an investigation into whether the Company took adequate steps to prevent consumer fraud during the period from 2007 to 2014. On February 11, 2016, the Company entered into a settlement agreement with 49 states and the District of Columbia to settle any civil or administrative claims such attorneys general may have asserted under their consumer protection laws through the date of the settlement agreement in connection with the investigation. Under the settlement agreement, the Company made a non-refundable payment of $13.0 million to the participating states in March 2016 to be used by the states to provide restitution to consumers. The Company also agreed to implement certain enhancements to its compliance program and provide periodic reports to the states party to the settlement agreement.
Other Matters — The Company is involved in various other government inquiries and other matters that arise from time to time. Management does not believe that after final disposition any of these other matters is likely to have a material adverse impact on the Company’s financial condition, results of operations and cash flows.
In 2015, we initiated an internal investigation to identify any payments processed by the Company that were violations of the U.S. Department of the Treasury's Office of Foreign Assets Control ("OFAC") sanctions regulations. We have notified OFAC of the ongoing internal investigation, which is being conducted in conjunction with the Company's outside counsel. If any violations are confirmed as part of our investigation, we could be subject to fines or penalties.

“PRIVILEGED & CONFIDENTIAL” Distribution of the information contained herein is prohibited.
38
Actions Commenced by MoneyGram:
Tax Litigation — The IRS completed its examination of MoneyGram’s consolidated income tax returns through 2013 and issued Notices of Deficiency for 2005-2007 and 2009, and an Examination Report for 2008. The Notices of Deficiency and Examination Report disallow, among other items, approximately $900.0 million of ordinary deductions on securities losses in the 2007, 2008 and 2009 tax returns. In May 2012 and December 2012, MoneyGram filed petitions in the U.S. Tax Court challenging the 2005-2007 and 2009 Notices of Deficiency, respectively. In 2013, MoneyGram reached a partial settlement with the IRS allowing ordinary loss treatment on $186.9 million of deductions in dispute. In January 2015, the U.S. Tax Court granted the IRS's motion for summary judgment upholding the remaining adjustments in the Notices of Deficiency. MoneyGram filed a notice of appeal with the U.S. Tax Court on July 27, 2015 for an appeal to the U.S. Court of Appeals for the Fifth Circuit. Oral arguments were held before the Fifth Circuit on June 7, 2016, and on November 15, 2016, the Fifth Circuit vacated the Tax Court's decision and remanded the case to the Tax Court for further proceedings.
The January 2015 Tax Court decision was a change in facts which warranted reassessment of MoneyGram's uncertain tax position. Although MoneyGram believes that it has substantive tax law arguments in favor of its position and has appealed the ruling, the reassessment resulted in MoneyGram determining that it is no longer more likely than not that its existing position will be sustained. Accordingly, MoneyGram re-characterized certain deductions relating to securities losses to be capital in nature, rather than ordinary. MoneyGram recorded a full valuation allowance against these losses in the quarter ended March 31, 2015. This change increased "Income tax expense" in the Consolidated Statements of Operations in the quarter ended March 31, 2015 by $63.7 million. During 2015, MoneyGram made payments to the IRS of $61.0 million for federal tax payments and associated interest related to the matter. The November 2016 Fifth Circuit decision to remand the case back to the Tax Court does not change MoneyGram's current assessment regarding the likelihood that these deductions will be sustained. Accordingly, no change in the valuation allowance was made as of December 31, 2016. Pending the outcome of the Tax Court proceeding, MoneyGram may be required to file amended state returns and make additional cash payments of up to $17.5 million on amounts that have previously been accrued.
Note 14 — Subsequent Events
On January 26, 2017, MoneyGram and Alipay (UK) Limited, a United Kingdom limited company, announced that they had entered into a Merger Agreement. The Merger Agreement also includes Matrix Acquisition Corp., a Delaware corporation and wholly owned subsidiary of Parent (“Merger Sub”), and, solely for purposes of certain specified provisions of the Merger Agreement, Alipay (Hong Kong) Holding Limited, a Hong Kong limited company. The Merger Agreement provides that, subject to the terms and conditions set forth in the Merger Agreement, Merger Sub will merge with and into MoneyGram (the “Merger”), with MoneyGram surviving the Merger as a wholly owned subsidiary of Parent. The Merger Agreement contains certain termination rights for the parties, including the right of either party, subject to specified limitations, to terminate the Merger Agreement if the Merger is not consummated by January 26, 2018 (the “end date”); provided, that either Parent or MoneyGram may extend the end date until April 19, 2018, if necessary to obtain required approvals with respect to money transmitter licenses, if, at the end date, all of the other conditions to closing are satisfied. The terms of the Merger Agreement did not impact MoneyGram’s consolidated financial statements as of and for the year ended December 31, 2016.
On March 14, 2017, MoneyGram received an unsolicited proposal from Euronet Worldwide, Inc. to acquire all of the outstanding shares of MoneyGram's common stock and D Stock for $15.20 per share in cash on an as-converted basis. Consistent with its fiduciary duties, MoneyGram’s Board of Directors, in consultation with its legal and financial advisors, will carefully review and consider the proposal to determine the course of action that it believes is in the best interests of MoneyGram and its stockholders.
Note 15 — Correction of Consolidated Statements of Operations for the Years Ended December 31, 2015 and 2014
Subsequent to the issuance of the Company's 2015 financial statements, the Company's management determined that there was an immaterial error in the historical presentation of the foreign exchange revenue on a net basis. As a result, Fee and other revenue and Fee and other commissions expense have been restated from the amounts previously reported to correct the presentation of foreign exchange revenue from a net presentation to a gross presentation in our Consolidated Statements of Operations. The correction was an increase in previously reported Fee and other revenue and Fee and other commissions expense. This correction has no impact on our Consolidated Balance Sheets, Consolidated Statements of Comprehensive Income (Loss), Consolidated Statements of Cash Flows or Consolidated Statements of Stockholders' Equity.
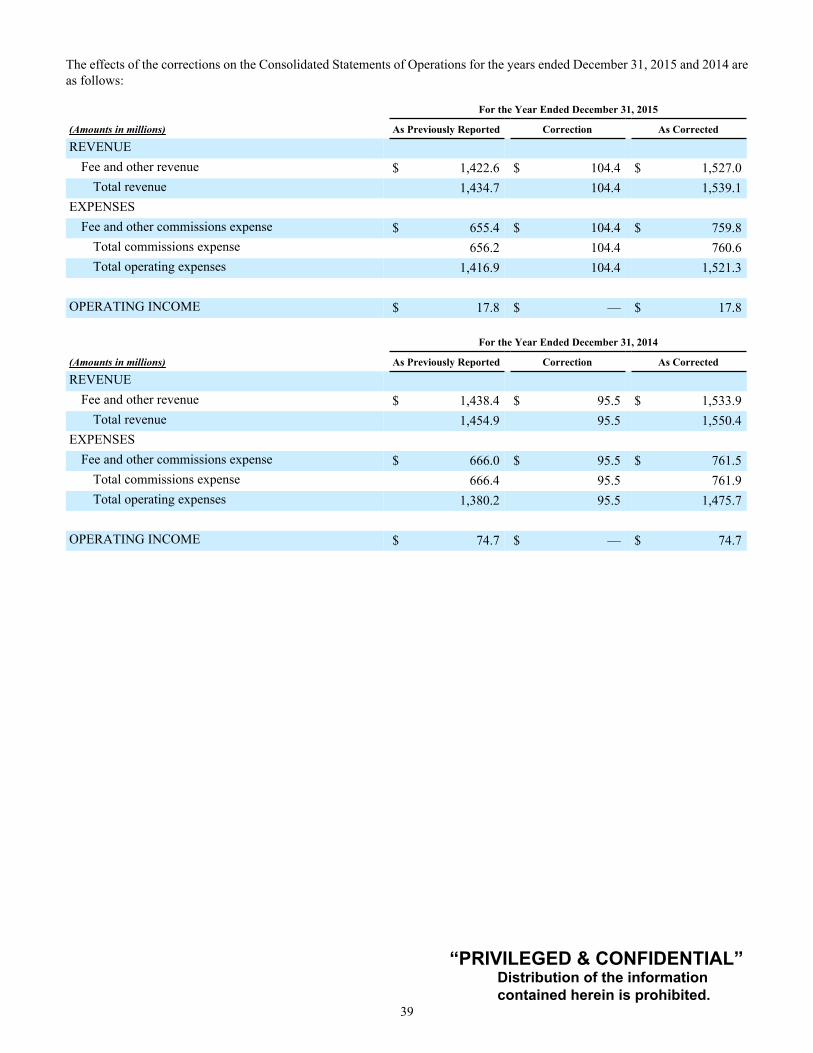
“PRIVILEGED & CONFIDENTIAL” Distribution of the information contained herein is prohibited.
39
The effects of the corrections on the Consolidated Statements of Operations for the years ended December 31, 2015 and 2014 are as follows:
For the Year Ended December 31, 2015
(Amounts in millions) As Previously Reported Correction As Corrected
REVENUEFee and other revenue $ 1,422.6 $ 104.4 $ 1,527.0
Total revenue 1,434.7 104.4 1,539.1EXPENSES
Fee and other commissions expense $ 655.4 $ 104.4 $ 759.8Total commissions expense 656.2 104.4 760.6Total operating expenses 1,416.9 104.4 1,521.3
OPERATING INCOME $ 17.8 $ — $ 17.8
For the Year Ended December 31, 2014
(Amounts in millions) As Previously Reported Correction As Corrected
REVENUEFee and other revenue $ 1,438.4 $ 95.5 $ 1,533.9
Total revenue 1,454.9 95.5 1,550.4EXPENSES
Fee and other commissions expense $ 666.0 $ 95.5 $ 761.5Total commissions expense 666.4 95.5 761.9Total operating expenses 1,380.2 95.5 1,475.7
OPERATING INCOME $ 74.7 $ — $ 74.7