Moving Towards the Future The Era of High Speed Rail in ...
84
1 Moving Towards the Future: The Era of High Speed Rail in the U.S. By Lucy Olmos Professional Report submitted in partial satisfaction of the requirements for the degree of Master of Urban and Regional Planning Department of Planning, Policy, and Design University of California, Irvine CLIENT: Ben Ku, Orange County Transportation Authority PR FACULTY ADVISOR: Marlon Boarnet DATE: 4/19/2010
Transcript of Moving Towards the Future The Era of High Speed Rail in ...
1
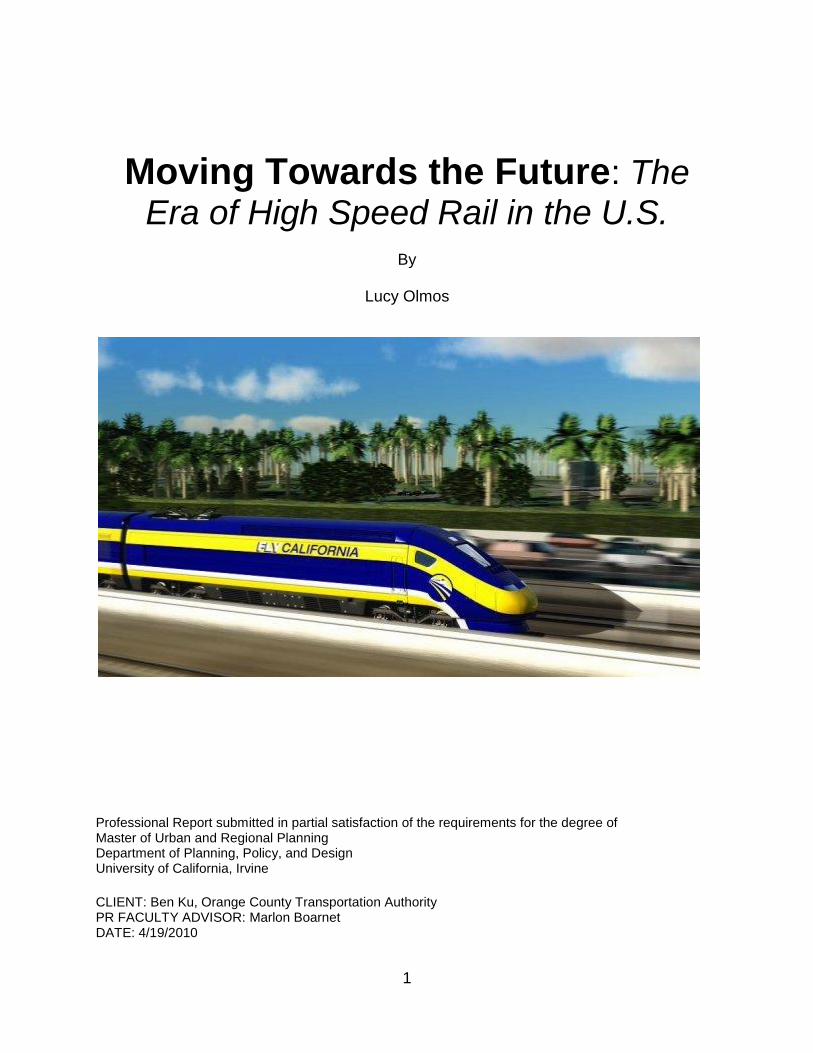
Moving Towards the Future: The Era of High Speed Rail in the U.S.
By
Lucy Olmos
Professional Report submitted in partial satisfaction of the requirements for the degree of Master of Urban and Regional Planning Department of Planning, Policy, and Design University of California, Irvine
CLIENT: Ben Ku, Orange County Transportation Authority PR FACULTY ADVISOR: Marlon Boarnet DATE: 4/19/2010

2
TABLE OF CONTENTS
TABLE OF CONTENTS ----------------------------------------------------- 2
LIST OF FIGURES AND TABLES ---------------------------------------- 5
EXECUTIVE SUMMARY --------------------------------------------------- 6
INTRODUCTION -------------------------------------------------------------- 9
PROBLEM STATEMENT---------------------------------------------------------------------------------------------- 10
PURPOSE AND NEED FOR IMPROVEMENT ----------------------- 11
PURPOSE ------------------------------------------------------------------------------------------------------------ 11 NEED FOR IMPROVEMENT ----------------------------------------------------------------------------------- 11 GROWTH IN POPULATION AND EMPLOYMENT ----------------------------------------------------------------- 12 GROWTH IN TRAVEL DEMAND ------------------------------------------------------------------------------------ 13 CAPACITY OF CURRENT INTERCITY AIR AND RAIL TRAVEL -------------------------------------------------- 13
OBJECTIVES ------------------------------------------------------------------ 16
METHODOLOGY ------------------------------------------------------------ 17
BACKGROUND --------------------------------------------------------------- 18
U.S. HIGH SPEED RAIL ---------------------------------------------------------------------------------------------- 19 CALIFORNIA HIGH-SPEED RAIL AUTHORITY------------------------------------------------------------------- 22 ANAHEIM TO LOS ANGELES SEGMENT -------------------------------------------------------------------------- 23
Existing Rail Service in California ----------------------------------------- 27
INTERCITY PASSENGER RAIL -------------------------------------------------------------------------------------- 27 COMMUTER RAIL ---------------------------------------------------------------------------------------------------- 28 FREIGHT SERVICE --------------------------------------------------------------------------------------------------- 28
ISSUES OF MEASUREMENT -------------------------------------------- 29
TRAVEL CHOICE MODELS ----------------------------------------------------------------------------------------- 31 RAIL RIDERSHIP COMPARISON------------------------------------------------------------------------------------ 31

3
AIR RIDERSHIP COMPARISON ------------------------------------------------------------------------------------- 34 CALIFORNIA HIGH SPEED RAIL PROJECTED RIDERSHIP ----------------------------------------------------- 37
REVIVED FLORIDA HIGH SPEED RAIL PROJECT --------------- 40
BACKGROUND -------------------------------------------------------------------------------------------------------- 40 ANALYSIS -------------------------------------------------------------------------------------------------------------- 41 LESSONS LEARNED -------------------------------------------------------------------------------------------------- 42 FUTURE OF HSR IN FLORIDA -------------------------------------------------------------------------------------- 42
ACELA CASE STUDY ------------------------------------------------------ 43
OVERVIEW ------------------------------------------------------------------------------------------------------------ 44 ACELA EXPRESS ANALYSIS ---------------------------------------------------------------------------------------- 44 SUCCESSES ------------------------------------------------------------------------------------------------------------ 47 FAILURES -------------------------------------------------------------------------------------------------------------- 48
ANALYSIS OF EUROPEAN HIGH SPEED RAIL ------------------- 50
EU’S VISION FOR HIGH SPEED AIL ------------------------------------------------------------------------------- 50 EUROPEAN UNION HIGH SPEED RAIL POLICY ----------------------------------------------------------------- 51 THE GERMAN INTERCITY EXPRESS ------------------------------------------------------------------------------ 52 URBAN FORM CHARACTERISTICS -------------------------------------------------------------------------------- 53 TRANSIT QUALITY --------------------------------------------------------------------------------------------------- 54 TRAVEL BEHAVIOR -------------------------------------------------------------------------------------------------- 55 CONTRAST BETWEEN THE U.S. AND THE EUROPEAN EXPERIENCE ----------------------------------------- 55
FUNDING SOURCES FOR CALIFORNIA HIGH SPEED RAIL 56
FEDERAL -------------------------------------------------------------------------------------------------------------- 56 STATE AND LOCAL FUNDING -------------------------------------------------------------------------------------- 57 PUBLIC-PRIVATE PARTNERSHIPS --------------------------------------------------------------------------------- 58 ANALYSIS OF PRIVATE INVESTMENT ----------------------------------------------------------------------------- 59
Air versus High Speed Rail? -------------------------------------------- 63
ADVANTAGES OF AIR TRAVEL AS A VIABLE SOLUTION TO INTERCITY TRAVEL -------------------------- 63 DISADVANTAGES OF AIR TRAVEL AS A VIABLE SOLUTION TO INTERCITY TRAVEL ---------------------- 67 HIGH SPEED RAIL AS A SOLUTION TO THE GROWTH IN INTERCITY TRAVEL ------------------------------ 68 DISADVANTAGES OF HIGH SPEED RAIL ------------------------------------------------------------------------- 70
Analysis of Actual versus Estimate Numbers (Cost & Ridership) ---------------------------------------------------------------------- 72

4
SYNOPSIS OF GOVERNMENT CONTRACT PROCESS ------------------------------------------------------------ 72 ROLE OF ACADEMIA IN ASSESSING ACCURACY ---------------------------------------------------------------- 72 ANALYSIS -------------------------------------------------------------------------------------------------------------- 75 OPERATION ESTIMATES -------------------------------------------------------------------------------------------- 75
RECOMMENDATIONS ---------------------------------------------------- 77
FUTURE OF HIGH SPEED RAIL ---------------------------------------- 78
REFERENCES ---------------------------------------------------------------- 79
APPENDICE ------------------------------------------------------------------- 84

5
LIST OF FIGURES AND TABLES Figure 1 California High Speed Rail ................................................................................ 6 Figure 2 Congestion………………………………………………………………………….9 Figure 3 President Obama’s Vision for High Speed Rail in the U.S…………………...20 Figure 4 Anaheim to Los Angeles Segment……………………………………………...24 Figure 5 Travel Demand Model……………………………………………………………31 Figure 6 2008 Average Air Passenger Departures Based on Haul……………………..35 Figure 7 Top 10 Destinations for So Cal Air Passengers………………………………..36 Figure 8 Timeline of Key Events (Acela Express)……………………………………….46 Figure 9 Full Cost Comparison…………………………………………………………….65 Figure 10 Cost of Air in California Corridor……………………………………………....66 Figure 11 Average Cost of High Speed Rail……………………………………………..69 Figure 12 Population Comparison Japan and California…………………………………71 Table 1 Status of Environmental Review by Each Section……………………………..26 Table 2 Performance Indicators……………………………………………………………...32 Table 3 Transit Service Utilization in the SCAG Region………………………………......33 Table 4 General Aviation Forecast………………………………………………………......36 Table 5 Benchmarking of the California High Speed Rail…………………………………75 Table 6 Flyvberg’s cost escalation and ridership for 12 urban rail projects……………..75 Table 7 Annual Operating Cost (Millions of 2003 Dollars) (Airports versus HSR)……...76
6
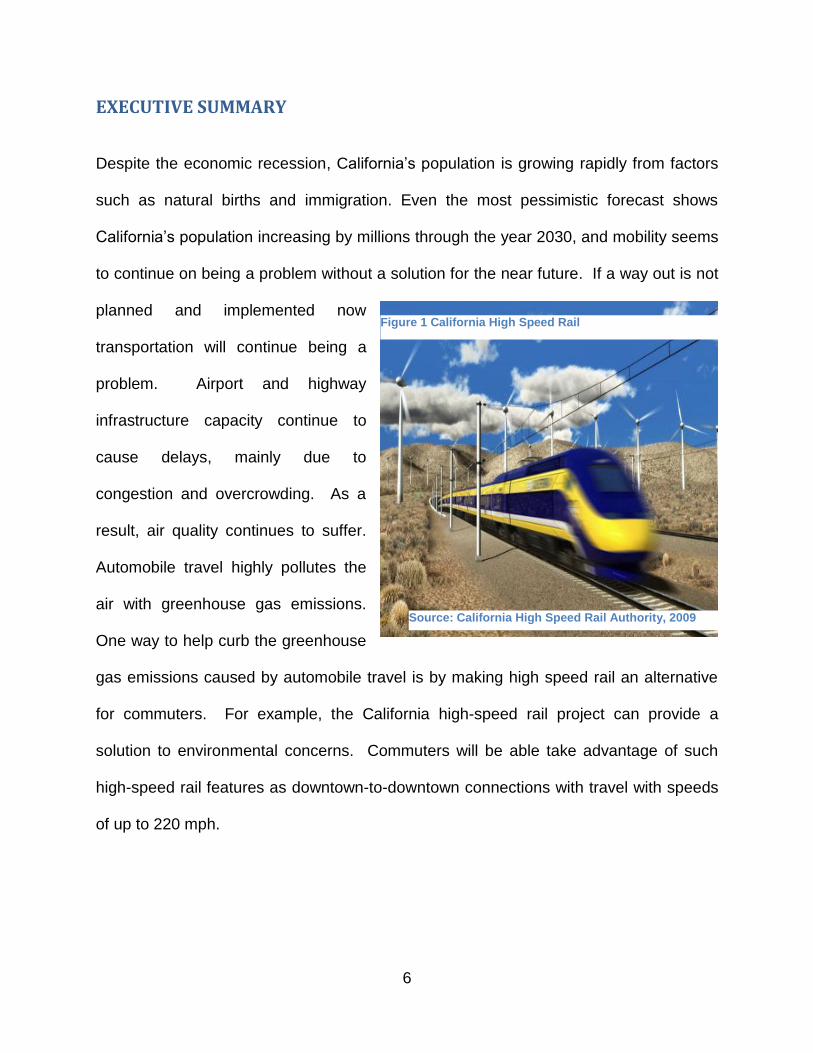
EXECUTIVE SUMMARY Despite the economic recession, California’s population is growing rapidly from factors
such as natural births and immigration. Even the most pessimistic forecast shows
California’s population increasing by millions through the year 2030, and mobility seems
to continue on being a problem without a solution for the near future. If a way out is not
planned and implemented now
transportation will continue being a
problem. Airport and highway
infrastructure capacity continue to
cause delays, mainly due to
congestion and overcrowding. As a
result, air quality continues to suffer.
Automobile travel highly pollutes the
air with greenhouse gas emissions.
One way to help curb the greenhouse
gas emissions caused by automobile travel is by making high speed rail an alternative
for commuters. For example, the California high-speed rail project can provide a
solution to environmental concerns. Commuters will be able take advantage of such
high-speed rail features as downtown-to-downtown connections with travel with speeds
of up to 220 mph.
Figure 1 California High Speed Rail
Source: California High Speed Rail Authority, 2009

7
This report addresses some concerns critics have regarding the high-speed rail,
including cost and ridership forecasts. This report presents twelve different sections to
help address these concerns.
I. The first section provides the purpose and need for the study of high speed rail in
Southern California;
II. the second section provides the objectives;
III. the third provides the methodology used to come up with the conclusion and
recommendations;
IV. the fourth section provides a background of high speed rail in the United States,
California, and Southern California;
V. the fifth section analyzes existing rail transport in Southern California (intercity
and commuter rail);
VI. the sixth section provides measurement of the current air and rail trips taken in
Southern California and analyzes the projected ridership of the California high
speed rail;
VII. the seventh section gives a case study of Florida’s Overland Express (FOX)
project that was unsuccessful during the planning stages, but is now under
review as the Florida High Speed Rail project;
VIII. the eighth section gives another case study, the Acela Express, which is a
successful Amtrak line and is used as an example model for Southern
California’s potential upgrade of existing rail;
IX. the ninth section compares the European Union’s policy on high speed rail with
the United States’;
8
X. the tenth section lists the possible funding sources for high speed rail;
XI. the eleventh section provides an analysis of air and high speed rail transport as
an alternative to automobile travel;
XII. Finally, the twelfth section provides an analysis of the estimate numbers of cost
and ridership of the California high speed rail versus actual numbers taken from
academic Flyvbjerg’s research on estimates versus actual numbers of
transportation projects.
The following is a summary of the main recommendations derived from this study:
Rail improvements within the Orange County segment of the LOSSAN Corridor can
minimize cost by creating feeder trains instead of new track system.
Limit new high speed rail line to Los Angeles-Bakersfield-San Francisco
Expand multimodal transit in downtown areas with high speed rail stops

9
INTRODUCTION
Imagine being able to arrive at the train station five minutes
before departure, hopping inside the train, turning on your
laptop and catching up on work, and in less than three
hours you arrive at your destination. Ideal? For many
people it would be. Many Californians’ spend countless
hours in traffic, paying a high price both in monetary and
non-monetary value. When one sits in traffic there is
nothing productive about it. California law prohibits the use
of cell phone while driving; limiting the amount of work a person can do in an
automobile. The annual delay per traveler in the Los Angeles metropolitan area is an
average of 70 hours (Texas Transportation Institute 2009). In 2009, the Texas
Transportation Institute issued a report that had the Los Angeles metropolitan area as
the most congested region in the nation. San Francisco came in as the fifth most
congested area and San Diego, not lagging too far behind,
took ninth place (Texas Transportation Institute 2009).
With six million additional people expected to populate
Southern California in the next 30 years, mobility can only
worsen (Southern California Association of Governments,
2009). Figure 2 Congestion (Wimborne 2008), shows a typical morning commute for
most Californians. Increased congestion from highway, air, and rail travel continues to
increase, emphasizing a pressing need for upgrades, improvements, and expansion.
Figure 2 Congestion
Source: ABC News (6/13/2008)
“Traffic Congestion Costs
California $20 billion per year
in wasted fuel and time”
California High Speed Rail
Authority

10
Problem Statement
Once it was the image of freedom and liberty, and now for many people it has become
the opposite, mainly an image of frustration and stress: the automobile. The popularity
and dependency of the automobile has led to the issues we face today, mainly highway
traffic congestion. Not only is it an issue for drivers, but traffic congestion creates
environmental concerns. If given a choice, most people would choose not to be in
traffic, however, California’s are not offered any meaningful competitive alternatives to
driving an automobile. High-speed rail is an opportunity to create a viable alternative for
commuters traveling throughout California.
However, whether a lack of transportation alternatives justifies the expenditure of
billions in taxpayers’ dollars to build high speed rail is a question that must be analyzed
before moving forward. This report will address whether building a California High
Speed Rail is more cost effective than upgrading existing rail and/or creating new
airports by analyzing estimated cost and demand for high speed rail service.
This report will analyze a comparative case study: Amtrak’s Acela Express rail upgrade
of Boston-New York-Washington DC corridor. The U.S. Eastern Corridor rail line is a
comparable case to California, with similar densities among connecting regions (San
Diego, Los Angeles, and San Francisco). This report will also compare and contrast the
United State’s policy on high-speed rail with that of the European Union’s. The
comparison of policies will help provide an analysis of how the U.S. federal government

11
can play a role in the creation of a nationwide high-speed rail network. The report is
conducted on behalf of the Orange County Transportation Authority.
PURPOSE AND NEED FOR IMPROVEMENT
PURPOSE
The purpose of this report is to analyze the projected ridership and cost estimates, and
the public benefits of building a California high-speed rail segment.
NEED FOR IMPROVEMENT
The momentum to receive funding for the construction of high-speed rail from the U.S.
federal government has never been as strong. According to U.S. Vice President Biden,
California is better positioned than most states to receive federal funding, because --
―it’s been a priority of your governor, it’s been a priority of your Legislature, they’ve
talked about it, a lot of planning has been done,‖ (Reston 2009). The most current
estimate of the cost of building the California high-speed rail is $45 billion (California
High Speed Rail Authority 2009).
The price tag for building high-speed rail is high, but the ―do nothing‖ scenario cost
might be just as high. Most highways in Southern California have high volumes of traffic
and heavily impacted local streets. Another option to alleviate traffic is to continue
building more airports, roads, and highways. However, none of these options would
help alleviate environmental concerns. Not only is air pollution a serious problem, but
the flight delays and the cost for flying is continuing to increase and becoming a concern
for the average person. Fuel prices will continue to rise as the oil reserve levels drop,
yet automobile dependency is still the dominant force in transportation options.
12
Growth in Population and Employment
According to the California High Speed Rail Authority, California’s projected population
is expected to reach 50 million in the next 20 years (California High Speed Rail
Authority, 2009). Currently, Southern California has two of the top ten most congested
areas in the United States: Los Angeles and San Diego (California High Speed Rail
Authority, 2009). California legislation, such as Assembly Bill 32--Global Warming
Solutions Act-- and Senate Bill 375--Redesigning Communities to Reduce Greenhouse
Gases--are sure to have an effect of either alleviating or worsening congestion. Both
bills focus on limiting suburban sprawl by tying land use with transportation.
California’s budget problems worsened during the housing bubble in the mid years of
this past decade. Since then, the California state government has been feeling the
economic pressure from the effect of the housing crash and the rise of unemployment.
The California State Legislature fiscal budget for 2009-10 had a gap of $60 billion, with
a projected gap of $20 billion for fiscal year 2010-11 (Office of the Governor 2010). In
the coming years, a challenge California will face is how to regain its previous economic
competitiveness. The planning and construction of high-speed rail might be one of the
solutions to solve our economic crisis. High speed rail is projected to create nearly half
a million jobs and improve the quality of life for all Californian residents by reducing
congestion and contributing to the reduction of greenhouse gases (California High
Speed Rail Authority, 2009).

13
Growth in Travel Demand
Much of the growth in travel demand in Southern California in the past decades has
been from the automobile. The future of reduced dependency on the automobile looks
bleak if transit is not expanded. Automobile travel for many people is the only option
due to the lack of alternatives for both short and long distance trips. Another factor is
the distressing reality that the public is uneducated about the real price of driving an
automobile. Most people believe the cost of driving ends at the gas pump. The
external cost is the harm done to the environment from driving an automobile.
However, the invisible cost is not talked about, nor is it calculated in the fuel price. This
unseen cost has contributed to the rise of the automobile.
California is the 12th largest source of greenhouse gases on the planet, with 41% of the
emissions coming from our transportation system (California High Speed Rail Authority,
2009). Projections suggest the increase in population will create a higher travel
demand effect. It is paramount and critical that California increase funding of mass
transit (buses, light rail, high-speed rail) to create alternative modes of transport for the
projected rise in the state’s population. Higher demand for alternative modes of transit
will also facilitate the implementation of key state legislation, such as: SB 375 whose
goal is to reduce greenhouse gas emissions.
Capacity of current intercity air and rail travel
The Los Angeles International Airport (LAX) is the only international airport in Southern
California, with eight other domestic airports (Burbank (BUR), Long Beach (LGB), Santa
14
Ana-Orange County (SNA), Ontario (ONT), El Centro/Imperial (IPL), Oxnard (OXR),
Palmdale/Lancaster (PMD), Palm Springs (PSP), and San Diego). In 2000, Los
Angeles International was ranked as the third busiest commercial airport (SCAG, 2003).
The two passenger rail lines for the Southern California region are Amtrak and
Metrolink. Amtrak is an intercity rail line, while Metrolink is a commuter rail line, both of
which rely heavily on government subsidies and due to California’s economic crisis they
have recently had to reduce service.
Los Angeles International Airport
Los Angeles International accounts for 15,000 general aviation operations and two
percent of all airport activity (SCAG, 2003). In 2002, there were 177,000 air taxi
operations with a growth forecast that is supposed to double by 2030 (SCAG, 2003).
While Southern California boasts from many airports, many of them are in urban areas
and are constrained due to their built out urban environment, NIMBY (not-in-my-
backyard) attitude, and physical capacity for basing aircraft (SCAG, 2003).
Orange County John Wayne Airport
John Wayne Airport is a commercial airport with forty-two turbine aircraft and over 500
propeller driven aircraft (SCAG, 2003). The number of annual passengers that John
Wayne airport is allowed to have is limited to 10.8 million under the existing Settlement
Agreement (SCAG, 2003). The forecasted growth for this airport is one percent
annually, reaching general aviation activity to 315,000 by 2030 (SCAG, 2003).

15
Rail
Existing rail in Southern California consists of intercity rail (Amtrak) and commuter rail
(Metrolink). 85% of the people that take Metrolink are for work purposes, while Amtrak
is known for being more of a longer destination trip train (SCAG, 2008). Neither Amtrak
nor Metrolink have a reputation for their service from downtown to downtown
destinations. In fact, most people that ride the trains have multiple mode splits for their
total trip. Aside from having poor connections, service is limited. Due to the economic
crisis, their service has been reduced to a limited number of times, days, and locations.
In order to keep up with the projected growth in population, California will have to build
nearly 3,000 lane-miles of freeway, in addition to five airport runways and 90 departure
gates by 2020 (California High Speed Rail Authority, 2009). Those projections are
based on the same number of travelers a high-speed train system could service
(California High Speed Rail Authority, 2009). The California High Speed Rail Authority
plans to build the stations in downtown-to-downtown centers where passengers can
more easily connect to other modes of transit network. Fast trains that connect with
other transportation modes are an attractive option to consumers of travel, and are
competitive with automobile travel. This trend may be the beginning of the development
of a strong mass transit system in the Southern California region.

16
OBJECTIVES This report will address the following objectives:
To identify the pros and cons of upgrading the existing rail in comparison to
building a high speed rail line.
To identify the importance of the role of the U.S. federal government in
implementing high speed rail versus the European Union’s role in high-speed rail.
To capitalize on current opportunities at the state and federal levels to fund high-
speed rail.
17
METHODOLOGY
Study activities consist of the following steps:
1. Internal focus groups with transportation peers, professional report client, and
faculty advisor to discuss the high-speed rail potential for the Southern California
region.
2. The literature review will include:
a. Definitions and standards
b. Impact on urban form and land use development
c. Features and context on high speed rail case studies
d. Public’s opinion on high speed rail (Editorials, Newspaper)
3. Analysis of technical reports that document ridership numbers for the ACELA
case study
4. Analysis of the projected ridership data for the proposed Los Angeles to
Anaheim high-speed rail segment in Southern California from the California High
Speed Rail Authority reports
5. Analysis of the annual ridership numbers for the Southern California inter-city,
Southern California Commuter Train Service and air trips from the Southern
California Association of Government (SCAG)
6. European Union analysis and comparison to the United States Federal role in the
development of high speed rail policy
7. Qualitative data includes:
a. Interviews:
i. Andreas Lischke, German Aerospace Center (DLR)
ii. Dan Levitt, Deputy Director of the CA High Speed Rail Authority

18
BACKGROUND Many questions face the public about high-speed rail: If high-speed rail (HSR) is built in
the State of California, will there be demand for such a system? What will be the
environmental benefits derived from high-speed rail? How much congestion will be
reduced from highways and streets? What will be the economic impact from the job
creation derived from HSR? Lastly, and most importantly, how will the $45 billion high-
speed rail project be funded?
High-speed rail is not a new phenomenon. Florida’s FOX project (Florida Overland
Express) and Texas (TGV Projects) have attempted to build high speed trains, but their
attempts have been mostly unsuccessful and have achieved minimal outcomes to
advance high speed rail in the nation (U.S. Government Accountability Office, 2009).
Reports attribute the failure of high-speed rail projects to a lack of popular support and
high cost. The public did not support the program because of the high cost associated
with the finance of HSR, and public awareness that it would be mostly have to be paid
through taxpayer’s dollars (U.S. Government Accountability Office, 2009).
In 2008, funding for high speed rail projects occurred at both the national and the state
level (ARRA funds and CA Proposition 1a). The federal role for high-speed rail projects
became more of a national priority starting under the leadership of President George W.
Bush. The federal role became even more pronounced under President Obama. At the
state level, it was under the leadership of California’s Governor Schwarzenegger. In
recent years, no other state comes close to the State of California in planning and
19
building a high-speed rail line. Funding for high-speed rail will be discussed in detail on
Section 8 of this report.
U.S. High Speed Rail
The vision and funding for high-speed rail prior to the Obama Administration was almost
non-existent in the federal government (U.S. Government Accountability Office, 2009).
It was not until the Rail Passenger Service Act of 1970 that Amtrak was created. The
original intent of the Federal Government was to have Amtrak be a private enterprise,
but Amtrak has been unsuccessful in getting enough revenue to cover its operating
cost. In fact, Amtrak has needed substantial subsidies from the federal government to
keep operating (Congressional Budget Office, 2003). From 1970 to 2001, Amtrak has
received nearly $24 billion for capital and operating needs from the federal government,
while the number of passengers reached about 22 million each year within the 45 states
that Amtrak’s trains service (about 60,000 passengers per day, on average)
(Government Accountability Office, 2001). The original purpose of Amtrak was to
provide intercity passenger rail service, which had almost become obsolete since the
automobile culture took force (Fisher, 2009).
As mass transit died off, so did the investment from the private sector (Fisher, 2009).
This was especially evident in Southern California. Prior to the boom of the automobile,
land speculators like Henry Huntington invested in light rail for the Los Angeles
metropolitan area (Fisher, 2009). It was a profitable business until the post WWII era,
when many factors that led to the demise of the rail lines (Fisher, 2009). The main
reason for its demise was that operating costs exceeded revenue; it was an unprofitable

20
business (Fisher, 2009). This marked the end of private investment in passenger rail
lines for the Southern California region (Fisher, 2009).
Federally Designated High Speed Rail Corridors
Figure 3 ―President Obama’s Vision for High Speed Rail,‖ shows a map of the United
States and the federally designated corridors across the U.S. It is important to be
designated as a federal corridor in terms of federal funding because only federal
corridors can apply for high-speed rail grants.
Prior to the Obama Administration, high speed rail had never received much attention or
substantial funding (Government Accountability Office, 2001). Part of the reason why
Figure 3 President Obama’s Vision for High Speed Rail in the U.S.
Source: Jason Lee, White House Aid

21
there has been no interest from the federal government may be due to Amtrak’s inability
to become a profitable or self-operating entity without any governmental subsidies
(Congressional Budget Office, 2003).
What caused the renewed interest from the federal government in high-speed rail?
Transportation is constantly evolving as new technology emerges. The invention of the
automobile benefited many and became the symbol of freedom for many Americans.
Being an automobile culture has also brought problems. Most serious is the
environmental degradation caused by greenhouse gas emissions and other hazard
pollutants that are released through the different transportation modes.
President George W. Bush’s last term in office was the beginning of federal funding for
high speed rail: allocating several billions in funds through the Passenger Rail
Investment and Improvement Act. Enacted in 2008, it was an opportunity to identify the
vision and goals for a U.S. high speed rail and integrate it into the national
transportation system (U.S. Government Accountability Office 2009). It also authorized
$1.5 billion in funding (U.S. Government Accountability Office 2009). Aside from the
$1.5 billion, the recently enacted American Recovery and Reinvestment of Act of 2009
(ARRA) initiated by the Obama Administration, appropriated $8 billion solely for high-
speed rail, intercity passenger rail, and capital grants (the latter of which were
authorized by the PRIIA) (U.S. Government Accountability Office, 2009). Priority will be
given to projects that supported the development of high-speed rail service (U.S.
Government Accountability Office, 2009). U.S. Vice President Biden asserted that
California was in a good position to receive a large portion of the high speed rail grant

22
(Reston, 2009). The deadline for that grant money was in the first week of October
2009. Out of the $8 billion stimulus money, California was awarded $2.25 billion dollars.
California High-Speed Rail Authority
Established in 1996, the California High-Speed Rail Authority (Authority) is the state
entity responsible for planning, constructing, and operating a high-speed train system
serving California's major metropolitan areas (California High Speed Rail Authority,
2009). The Authority has a nine-member policy board and a core staff to implement the
high-speed train system in California. It was mandated by the State of California to
direct the development and implementation of inter-city high-speed rail throughout the
state (California High Speed Rail Authority, 2009). The proposed California High-Speed
Train Project is a large and complex public works project on a scale comparable with
the construction of Interstate 5 in California in the 1960’s and 1970’s (California High
Speed Rail Authority, 2009).
Encompassing more than 800 route miles, the proposed California high-speed train
system will provide intercity travel in California between the major metropolitan centers
of Sacramento, the San Francisco Bay Area, the Central Valley, Los Angeles, the Inland
Empire, Orange County, and San Diego (California High Speed Rail Authority, 2009). It
will be using ―steel on wheel‖ rail technology, which has already been used in Europe
and Asia. The highest operating speed is expected to reach 220 mph, with capabilities
of up to 250 mph (California High Speed Rail Authority, 2009). Environmental Impact
Reports have predicted an expected ridership of 102.4 million passengers by the year
2035 (California High Speed Rail Authority, 2009). It will be operating on almost

23
exclusive track, though for the most part it will be adjacent to existing rail or highways in
order to mitigate environmental impacts. Based on the Environmental Impact
Reports/Environmental Impact Statements (EIR/EIS), the cost to implement the full
statewide California high-speed train system is anticipated to be $45 billion (California
High Speed Rail Authority, 2009).
Anaheim to Los Angeles Segment
Orange County Orange County occupies 798 square miles and is located in Southern California - south
of Los Angeles County, north of San Diego County, and west of Riverside and San
Bernardino counties. There are thirty-four cities within Orange County, with a
population of nearly 3.1 million (Orange County Transportation Authority, 2009). It is
projected that by the year 2015 the population will increase to nearly 3.5 million, an
increase of 13 percent (Orange County Transportation Authority, 2009).
Orange County's economic success is partially attributed to the amenities provided to its
residents such as prestigious financial centers, numerous shopping and entertainment
centers, community colleges, a California State University campus, and a University of
California campus. Also, Orange County offers many amusement parks, including
Disneyland, Disney California Adventure and Knott's Berry Farm. Convenient air travel
is provided through John Wayne Airport, and countywide bus and rail services are
provided by OCTA, Metrolink, and Amtrak.

24
This report will focus on the California segment going from Anaheim to Los Angeles
(See Figure 4). The proposed alignment for the Anaheim to Los Angeles section will
travel along the existing Los Angeles – San Diego Rail Corridor (LOSSAN) between the
Anaheim Regional Transportation Intermodal Center (ARTIC) and Los Angeles Union
Station. In accordance with the
California Environmental Quality Act
(CEQA) and the National
Environmental Policy Act (NEPA),
the California High Speed Rail
Authority (CHSRA), in cooperation
with the Federal Railroad
Administration (FRA) has begun the
environmental process for the
Anaheim to Los Angeles segment.
The 2008-09 state budget provided
$46,488,000 to continue project
implementation (California High
Speed Rail Authority, 2009). Of this amount, $3.5 million are local funds provided by
the Orange County Transportation Agency (OCTA). This brings OCTA’s total local
investment since 2007 to $7 million (California High Speed Rail Authority, 2009). It is
the largest contribution of any regional transportation agency in California (Orange
County Transportation Authority, 2009).
Figure 4 Anaheim to Los Angeles Segment
Source: California High Speed Rail Authority, 2009

25
Environmental Impact Review Background
The environmental impact report for the Anaheim to Los Angeles segment identified the
existing Los Angeles to San Diego (LOSSAN) Passenger Rail Corridor as the preferred
alignment for this section, with stations in Irvine, Anaheim, Norwalk / Santa Fe Springs,
and Los Angeles Union Station (California High Speed Rail Authority, 2009). Given the
constrained nature of the corridor, high-speed trains should share the corridor with the
other passenger rail operators in the area, which include trains run by the National
Railroad Passenger Association (Amtrak) and the Southern California Regional Rail
Authority (Metrolink). However, this is somewhat premature because agreements have
not become public yet, so whether cooperation will occur between agencies is still
another issue that has yet to be resolved.
While the EIR/EIS identified the preferred corridor as extending from Irvine to Los
Angeles, this report will only focus on the section between Anaheim to Los Angeles that
is expected to be implemented before the Irvine stop. High-speed trains will have an
estimated trip time of approximately 20 minutes between the Anaheim and Los Angeles
stations, with maximum speeds approaching 125 mph (California High Speed Rail
Authority, 2009). The time of 20 minutes only takes into account if there are no stops
between Anaheim and Los Angeles. There will most likely be more than one stop in
between the connection which includes another stop in Orange County and one in Los
Angeles County, location of stops have not been determined. This will undoubtedly
increase the estimated trip time.
26
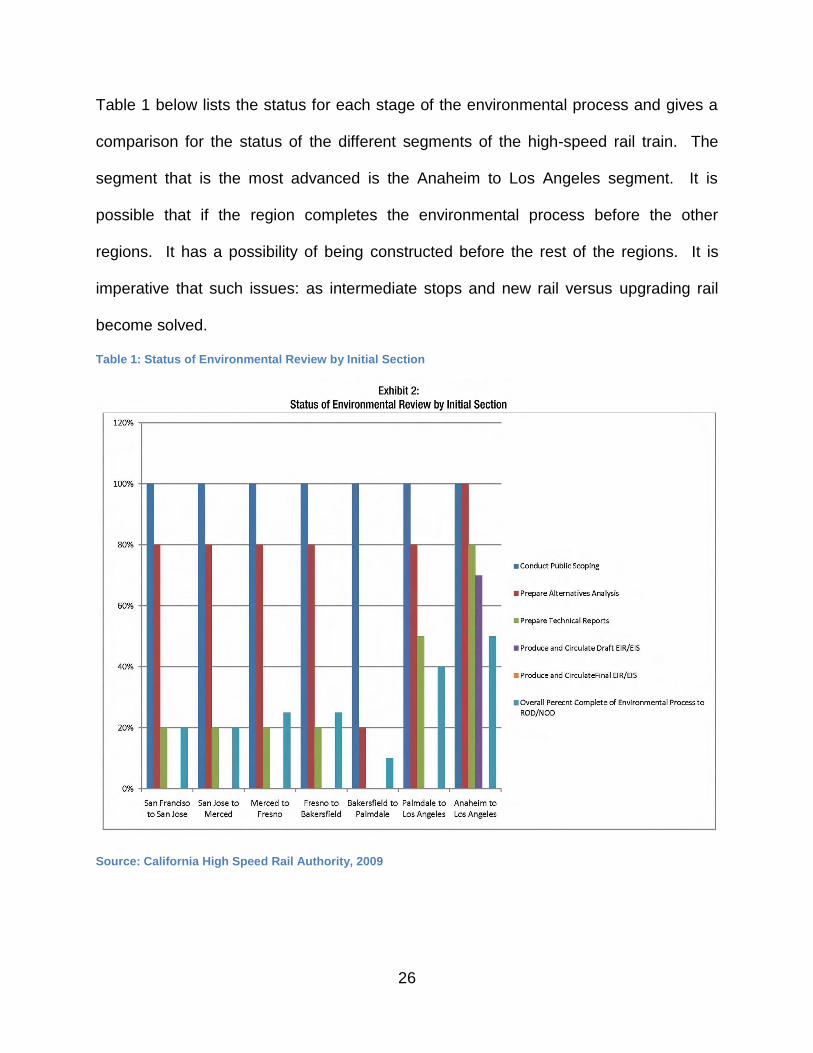
Table 1 below lists the status for each stage of the environmental process and gives a
comparison for the status of the different segments of the high-speed rail train. The
segment that is the most advanced is the Anaheim to Los Angeles segment. It is
possible that if the region completes the environmental process before the other
regions. It has a possibility of being constructed before the rest of the regions. It is
imperative that such issues: as intermediate stops and new rail versus upgrading rail
become solved.
Table 1: Status of Environmental Review by Initial Section
Source: California High Speed Rail Authority, 2009
27
The high-speed train system is projected to carry a minimum of 42 million passengers
annually (32 million intercity trips and 10 million commuter trips) by the year 2020
(California High Speed Rail Authority, 2009). Once the EIR is completed and the
business plan approved by the California legislature, the next process would be to
satisfy the environmental review process for both state and federal laws (California High
Speed Rail Authority, 2009). The following section gives a detailed background on the
existing rail in California.
Existing Rail Service in California This segment of the report will provide an overview of the existing rails in Southern
California: intercity rail, commuter rail, and freight service rail.
Intercity Passenger Rail
In California, Amtrak runs intercity passenger rail as well as in other parts of the United
States. There are four different Amtrak routes: Capitol, Pacific Surfliner, San Joaquin
and Coast. The State of California, through the Department of Transportation Division
of Rail, supports three Amtrak intercity passenger rail services, including the LOSSAN
(Los Angeles to San Diego and San Luis Obispo) Rail Corridor’s Pacific Surfliner. The
California Department of Transportation (DOT) Rail Division helps with funding and
planning assistance, including operating and capital grants for station and equipment
improvements (California Department of Rail Division, 2009).
Like most passenger rail services in the United States, California’s routes need
government subsidies to continue operation. Generally, the revenues received from the

28
farebox are insufficient to cover the expenses. The problem from a consumer’s
perspective is the time and cost difference that is well above that of its main competitor,
the automobile. Another issue is that service is limited; a person that misses a train will
have to wait sometimes a couple hours for the next available train.
Commuter Rail
The regional commuter rail line for Southern California is Metrolink it operates in six
different counties. The Southern California Regional Rail Authority (SCRRA) provides
and maintains Metrolink’s services and facilities. Metrolink systems consist of 53
stations; it carries over 36,000 passengers trips and operates 143 train trips per
weekday (SCAG, 2004). The average train trip length for this rail line is 37 miles and
79% of their frequent riders take Metrolink four or more days per week (SCAG, 2004).
Most of their passengers use their service to commute to work. Metrolink stations are
typically not in downtown areas and about 54% of their customers use connecting
transit to complete their trips (SCAG, 2004).
Freight Service
There are five principle rail alignments in the Southern California region, owned by two
railroads: the Union Pacific Railroad and the Burlington Northern Santa Fe (BNSF). The
majority of freight that comes through the Los Angeles and Long Beach ports use rail to
move to other regions. To help facilitate the movement of freight, the region has been
committed on improving the flow traffic by building grade separations which eases traffic
in the area. However, the freight rail companies (BNSF and UP) have been very vocal
about their unwillingness to cooperate and/or form partnerships with the California high-

29
speed rail authority. A controversial issue to having freight in high-speed trains is the
weight of freight. Freight trains typically weight substantially, and in order for a high-
speed train to achieve the maximum speed its weight needs to be low and with heavy
freight cargo that would be almost impossible. That issue alone could be a reason for
the lack of interest among the freight rail companies to cooperate with high speed rail.
ISSUES OF MEASUREMENT This segment of the report is an analysis of the current rail and air annual ridership
numbers which, will help in assessing the reliability of the projected ridership numbers
for the California high speed rail segment. This section will provide the different
definitions of high-speed rail and an analysis of the projected ridership numbers for the
California high speed rail.
Defining High Speed Rail and Intercity Passenger Rail (IPR) Definitions
High speed rail will vary in speed not only within the California high speed rail segment
but also in all of the United States corridors. To help differentiate the levels of high
speed rail, the U.S. Federal Railroad Administration Department released the definitions
each state should use when applying for federal funds. Below are the definitions used
by the American Recovery and Reinvestment Act of 2009. It seems that California is
unique in that it has the potential to overlap a number of the definitions listed below
such as, HSR Express, HSR Regional, and Emerging HSR.

30
Definitions:
HSR – Express. Frequent, express service between major population centers 200-600 miles apart, with few intermediate stops. Top speeds of at least 150 mph on completely grade-separated, dedicated rights-of-way (with the possible exception of some shared track in terminal areas). Intended to relieve air and highway capacity constraints. HSR – Regional. Relatively frequent service between major and moderate population centers 100-500 miles apart, with some intermediate stops. Top speeds of 110-150 mph, grade-separated, with some dedicated and shared track (using positive train control technology). Intended to relive highway and, to some extent, air capacity constraints. Emerging HSR. Developing corridors of 100-500 miles, with strong potential for future HSR Regional and/or Express service. Top speeds of up to 90-110 mph on primarily shared track (eventually using positive train control technology), with advanced grade crossing protection or separation. Intended to develop the passenger rail market, and provide relief to other modes. Conventional Rail. Traditional intercity passenger rail services of more than 100 miles with as little as one to as many as 7-12 daily frequencies; may or may not have strong potential for future high-speed rail service. Top speeds of up to 79 mph to as high as 90 mph generally on shared track. Intended to provide travel options and to develop the passenger rail market for further development in the future.

31
Travel Choice Models
In California, a person has several choices to choose from when making a decision on
their transportation mode (auto, rail, air). In Southern California, the most popular travel
choice is automobile travel. There are
38,000 square miles connected by 9,000
lanes of freeway (SCAG, 2004). It has
also been among the most congested
regions in the nation since 1990. Our
travel choices have caused harmed to the
environment, being a large contributor to
the greenhouse gas emissions. Figure 5
shows that transportation has not kept up
with population and travel demand (SCAG, 2004). Ninety nine percent of all trips rely
on highways or arterial networks (SCAG, 2004). Auto travel and congestion continue
on being a huge problem for the region. In 2000, the total daily delay from congestion
was estimated to be 2.2 million person hours (SCAG, 2004).
Rail Ridership Comparison
The California Department of Transportation (Caltrans) is the agency responsible for
overseeing all rail activity. In Southern California, we have two passenger rail lines:
Amtrak and Metrolink. Below are figures from Caltrans Division of Rail Operations
Report from 2008-09. To summarize the findings, rail transit has decreased from the
previous years. Some of the factors that can be attributed to the decreased numbers
are the increased fares and the reduction of service due to budget cuts.
Figure 5 Travel Demand Model

32
Caltrans Division of Rail Operations Report from 2008-09:
9.8% decrease in ridership from the 2007-08 numbers
On-time performance increased by 10.7 percentage points (90.4%)
Revenue drop of 5.1%
Expense drop of 2.5%
Farebox ration (49.5%) decreased by .8% from 2008 levels
In order to calculate the numbers above, Caltrans used performance indicators that
measure the numbers from the previous year with the current year, as well as inputting
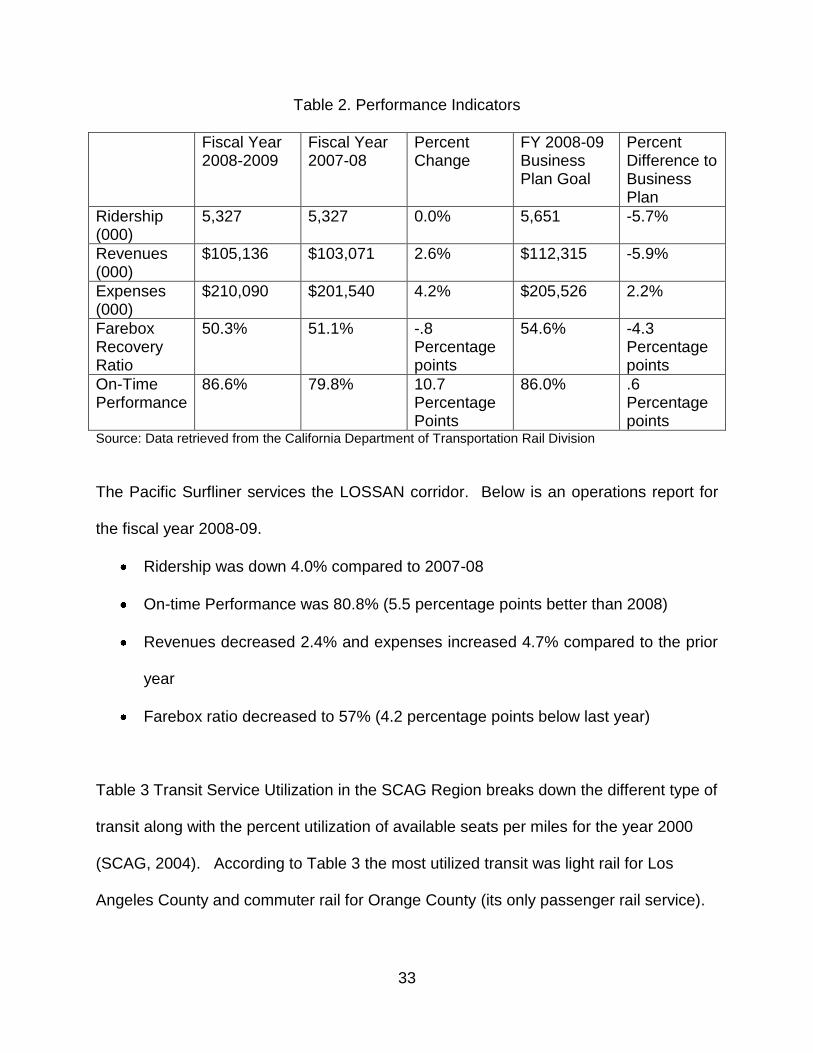
the business goal numbers and averaging the difference (Caltrans, 2008). Table 2
Performance Indicators shows that the current rail service performances which are
based on ridership, revenues, and expenses are not a profitable business. Not enough
people are using the current rail service. Studies have shown that the two main factors
for using public transit are cost and time. The CAHSRA will have to analyze the
numbers below in great detail and try to focus on keeping the current market and on
attracting a new market.
33
Table 2. Performance Indicators
Fiscal Year 2008-2009
Fiscal Year 2007-08
Percent Change
FY 2008-09 Business Plan Goal
Percent Difference to Business Plan
Ridership (000)
5,327 5,327 0.0% 5,651 -5.7%
Revenues (000)
$105,136 $103,071 2.6% $112,315 -5.9%
Expenses (000)
$210,090 $201,540 4.2% $205,526 2.2%
Farebox Recovery Ratio
50.3% 51.1% -.8 Percentage points
54.6% -4.3 Percentage points
On-Time Performance
86.6% 79.8% 10.7 Percentage Points
86.0% .6 Percentage points
Source: Data retrieved from the California Department of Transportation Rail Division
The Pacific Surfliner services the LOSSAN corridor. Below is an operations report for
the fiscal year 2008-09.
Ridership was down 4.0% compared to 2007-08
On-time Performance was 80.8% (5.5 percentage points better than 2008)
Revenues decreased 2.4% and expenses increased 4.7% compared to the prior
year
Farebox ratio decreased to 57% (4.2 percentage points below last year)
Table 3 Transit Service Utilization in the SCAG Region breaks down the different type of
transit along with the percent utilization of available seats per miles for the year 2000
(SCAG, 2004). According to Table 3 the most utilized transit was light rail for Los
Angeles County and commuter rail for Orange County (its only passenger rail service).

34
Table 3 Transit Service Utilization in the SCAG Region
Air Ridership Comparison
The largest airport in Southern California is Los Angeles International which ranks 5th
worldwide, all the airports combined create one of the busiest regions in the nation
(SCAG 2008). In 2002, seventy eight million passengers were served in the region, and
the projected growth forecast is that the number is supposed to double before the year
2030 (SCAG 2008). Airports are a vital part of the local economy, every one million
regional passengers creates a positive economic impact of $620 million (SCAG, 2008).
Airports while creating many economic benefits are very difficult to get approved; most
people have the not-in-my-back-yard (NIMBY) attitude that ends up killing projects to
expand or create new airports. The cost of expanding airports is also more expensive
than upgrading existing rail. Another detriment is that urban airports are physically
constrained; in order to expand most airports would have to buy out neighborhoods.
High speed rail would eliminate the need for short distance flights and would free air
space for out of state and international flights.
35
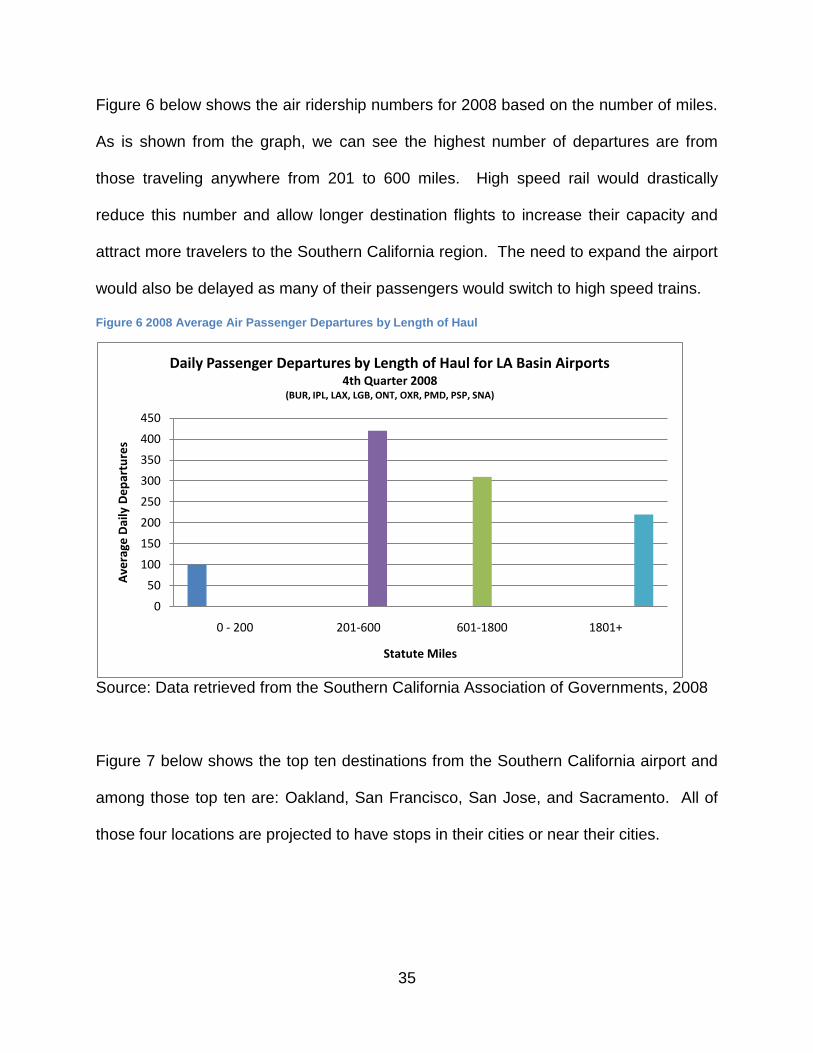
Figure 6 below shows the air ridership numbers for 2008 based on the number of miles.
As is shown from the graph, we can see the highest number of departures are from
those traveling anywhere from 201 to 600 miles. High speed rail would drastically
reduce this number and allow longer destination flights to increase their capacity and
attract more travelers to the Southern California region. The need to expand the airport
would also be delayed as many of their passengers would switch to high speed trains.
Figure 6 2008 Average Air Passenger Departures by Length of Haul
Source: Data retrieved from the Southern California Association of Governments, 2008
Figure 7 below shows the top ten destinations from the Southern California airport and
among those top ten are: Oakland, San Francisco, San Jose, and Sacramento. All of
those four locations are projected to have stops in their cities or near their cities.
0
50
100
150
200
250
300
350
400
450
0 - 200 201-600 601-1800 1801+
Ave
rage
Dai
ly D
ep
artu
res
Statute Miles
Daily Passenger Departures by Length of Haul for LA Basin Airports 4th Quarter 2008
(BUR, IPL, LAX, LGB, ONT, OXR, PMD, PSP, SNA)

36
Figure 7 Top 10 Destinations for Southern California Air Passengers
Source: Data retrieved from the Southern California Association of Government, 2008
Table 4 shown below shows the general aviation forecast. All the regions in Southern
California are expected to grow and for some airports even double its activity. However,
as mentioned in the earlier sections of this report, most of the airports are located in
urban areas and are physically constrained from future growth.
Table 4 General Aviation Forecast
2005 2010 2015 2020 2025 2030 Imperial 105,250 110,278 115,556 115,556 121,875 131,931 Los Angeles
2,130,999 2,282,557 2,432,018 2,432,018 2,380,213 2,780,316
Orange 340,088 356,189 372,255 372,255 388,306 420,965 Riverside 600,526 624,249 661,967 661,967 699,169 777,326 San Bernardino
766,859 811,508 858,893 858,893 906,961 1,008,278
Ventura 371,500 377,392 383,129 383,129 396,827 402,937 TOTAL 4,315,222 4,562,173 4,562,173 4,823,818 5,095,362 5,521,753 Source: Southern California Association of Governments, 2003
0
1
2
3
4
5
6
7
% o
f To
tal P
asse
nge
rs
Destinations
Top 10 Markets for LA Basin Airports 3rd Quarter 2008
(BUR, IPL, LAX, LGB, ONT, OXR, PMD, PSP, SNA)

37
As the demand increases, so will the airports physical capacity and this will lead to less
profitable airlines or routes being pushed out of airports (SCAG, 2003). The less
profitable routes are the airlines which service short distance flights between 200 and
600 miles and they are mainly served by smaller airlines (i.e. Southwest Airlines).
However, Southwest Airlines are beginning to expand their service by providing more
long distance destination flights. Such airlines might see the benefit of eliminating short
destination flights and supporting the construction of high speed rail. It is estimated that
by 2030, urbanized commercial and general airports will have reached their physical or
legal capacity (SCAG, 2003). According to an interview with a staff from the California
high speed rail Authority, small airlines did not lobby against Proposition 1a which will
contribute $9.9 billion towards high speed rail (Interview 9/2009).
California High Speed Rail Projected Ridership
Projecting accurate ridership numbers is central to the success of high speed rail. It is
important not only for California but for the rest of the nation who will witnesses our
successes or our failures. If California’s high speed rail project becomes a success it
might snowball to the rest of the nation who might jump on board and begin their own
high speed train networks.
A ridership projection is important for a business plan because it helps determine the
profitability. Once a ridership projection is estimated then the profitability can be
calculated by analyzing the projected revenue from ticket fares minus the operating
cost. The most recent projected ridership is estimated to average 13.5 million riders by
38
2020 and 41 million riders per year in 2035 for the entire 800 mile high speed rail
network (California High Speed Rail Authority, 2009).
It is estimated that over a third (12 million) of the projected air ridership numbers for
2030 would be diverted to high speed rail and about 6% percent (50 million) auto
travelers would switch to high speed rail (California High Speed Rail Authority, 2009).
More stops will also generate an increase in the number of riders. This might have the
effect of creating a fast intercity rail system instead of having a true long distance high
speed rail network. However, the number of stops is difficult to negotiate because of
the politics and possible money involved to help construct the high speed network.
A private company, Cambridge Systematic (CS), was contracted by the California High
Speed Rail Authority to develop the ridership projection. Their analysis consisted of:
modeling California’s current and future population, employment, household
characteristics, highway network, air and rail services, and transit systems (California
High Speed Rail Authority, 2009). Surveys were given to passengers flying into the
cities with a high speed train stop and they were geared to gathering information such
as: recent trips and their valuations of travel time, cost, and reliability in order to assess
the diversion that would be created from such modes of travel (California High Speed
Rail Authority, 2009).
The model that CS used predicted future trip making from forecasts of population and
employment and then compared the travel time for each mode of travel per household

39
(along with other factors) (California High Speed Rail Authority, 2009). High speed
trains will be able to carry anywhere from 1,300 to 950 passengers and have more room
than the conventional airplane with amenities such as a cafe (California High Speed
Rail Authority, 2009).
An accurate ridership projection for this scale of a project is absolutely necessary.
Unlike other public transportation systems (bus/rail), high speed rail is committed to not
asking for public subsidies once operations begin. The California High Speed Rail
Authority Governing Board feels confident that the projections will attract the predicted
ridership numbers. However, in case that the California High Speed Rail Authority
(CHSRA) does not meet their projected ridership once the high speed trains go into
operation then what are the possible scenarios? The twelfth section of this report goes
more into detail on estimate versus actual ridership and cost numbers, as well as
operation and maintenance cost.
According to a recent newspaper article in the Los Angeles Times, the California High
Speed Rail Authority has not come up with possible scenarios in case they fail to meet
projections (McGreevy, 2010). Jeff Barker, a spokesperson for the California High
Speed Rail Authority was quoted on saying that such details will be addressed in the
future (McGreevy, 2010). Eric Thronson, a fiscal and policy analyst for the Legislative
Analyst Office (LAO), called a risk assessment in the business plan ―incomplete and
inappropriate for a project of this magnitude‖ (McGreevy, 2010). Assemblyman Niello
(R-Fair Oaks) who sits on the Assembly Transportation Committee, also expressed his

40
concern for a project of this magnitude (McGreevy, 2010). It is imperative that the
California High Speed Rail Authority begin to address this along with other concerns
that might surface in the future. Past attempts on building high speed rail networks
have illustrated the importance of political and public support for high speed rail.
REVIVED FLORIDA HIGH SPEED RAIL PROJECT This section provides a case study of the FOX project, it was one of the first planned
high speed train projects that was derailed already having gone through extensive
planning. There is an analysis of potential pitfalls and lessons to be learned from a
project that was unsuccessful. Also, it is important to note that this project has recently
been revived due to Federal funding possibilities. The State of Florida applied for
federal stimulus money for $2.3 billion dollars and has a good probability that it will
receive close to that amount.
Background
The Florida high-speed rail corridor, previously known as the Florida Overland Express
(FOX) project, initiated the planning of a new rail system between Miami, Orlando, and
Tampa. The high-speed rail line would cover 320 miles with seven stops along the
route and reach speeds of 200 mph (GAO, 1999). In 1999, the U.S. General
Accounting Office (GAO) released a report on the feasibility of this new rail line. During
the release of the report, the estimated cost was anywhere from $6 to 8 billion (GAO,
1999). The important players involved in this project were: Florida Department of
Transportation (FDOT) and the Fox Consortium, of which included: Fluor Daniel, a U.S.-
41
based engineering and construction firm; Alstom, the manufacturer of French TGV
trains; and Bombardier, a manufacturer of rail passenger cars (GAO, 1999).
Analysis
Operation of the FOX project had an expected completion date of 2005. However, the
project failed. The failure of the project is largely blamed on an uncertain estimated
cost, ridership forecast overestimate, finance plan, and lastly, an unattainable schedule
projection (GAO, 1999). But with all major infrastructure projects money was the
biggest issue: in short, no one wanted to pay for it. The federal government was
unable to assist monetarily for any of the construction cost (GAO, 1999). The U.S.
General Accounting Office report from 1999 indicates that the FOX project was seeking
$2 billion loan amount under the Department of Transportation’s new Transportation
Infrastructure Finance and Innovation Act (TIFIA) program, whose budget was limited to
$530 million for all the states who sought loans for high speed train projects or rail
upgrades (GAO, 1999). The TIFIA program is designed to help large infrastructure
projects—those costing at least $100 million or 50 percent of a state’s federal-aid
highway apportionment for the preceding fiscal year—access capital by using federal
funds to leverage substantial private investment (GAO, 1999). The amount requested
by the FOX project was well above what it could loan.
A recent study published by the National Research Council notes that large
transportation infrastructure costs are commonly 50 to 100 percent above projections,
while usage (ridership) can be 20 to 60 percent lower than projections (Skamris and
Bent, 1996). Private funding was limited due the wide skepticism of being able to attain
42
estimated ridership. If ridership turned out to be lower, then operating cost and
maintenance might have led to a huge deficit, which would have forced taxpayers to bail
out the rail companies. Public opposition grew against the project because of the high
cost, and by the fact that most of the cost would be shouldered by the public. The
momentum was lost due to a weak public relations campaign from the FOX consortium
and an uneducated public of the benefits high speed trains would create.
Lessons Learned
Lack of public and political support over a lengthy period is why the FOX project
ultimately failed (GAO, 2009). The FOX project failed under a political administration
that did not support the project (GAO, 2009). Prior to that administration, the State of
Florida had committed to provide $70 million annually to the project, but withdrew that
obligation under Governor Jeb Bush’s leadership (GAO, 2009). Public skepticism of the
projected ridership made it easier for the governor to terminate the funding (GAO,
2009).
It is very important for the California High Speed Rail Authority to not lose the
momentum, especially public and political support. Transparency and confidence in the
project will play a major role in determining whether the project fails or succeeds.
Future of HSR in Florida
Florida has experience with high speed trains, already having gone through extensive
planning in for their high-speed rail corridor. No longer called the FOX project, it has
been renamed to be called the Florida High Speed Rail Project. The estimated cost for
the Tampa to Orlando section is $3.5 billion while, the section from Orlando to Miami is

43
projected to cost $8.5 billion (FDOT, 2010). Their previous experience made Florida a
very a strong candidate to receive a large portion of the requested $2.6 billion grant
application for their Tampa-to-Orlando high-speed rail line (Goll, 2010). On January 28,
2010, the Federal Railroad Administration (FRA) announced the Florida Department of
Transportation (FDOT) would receive $1.25 billion as part of the High Speed Intercity
Passenger Rail Program (FDOT, 2010). The first phase of construction that is listed on
their website is the Tampa to Orlando segment (FDOT, 2010). It is possible that the
revived interest in high speed rail has been due to the influx of federal grant money
towards high speed rail. It is very probable that Florida will have a high speed rail in
service in the near future; their past experience will have served as lessons learned for
the possible issues that can come up in the coming years of continued planning.
ACELA CASE STUDY
The Acela Express Amtrak service is the closest project to being the first case study of
emerging high speed rail in the United States. It is located in the Northeast region of
the United States and it is the first attempt in constructing and running an incremental
high speed rail system (Government Accountability Office, 2006). The Acela Express
corridor travels through some of the densest areas in the Eastern United States, such
as: Washington D.C., New York City, and Boston. It can be compared to the California
high speed rail project in terms of having similar densities: San Diego, Los Angeles, and
San Francisco. This segment of the report will give an overview of the Acela Express,
including its successes and failures. An analysis of the Acela Express will help the
California High Speed Rail Authority prevent similar pitfalls in the planning of the

44
California high speed rail project. It will also help analyze whether upgrading existing rail
is more cost effective than the construction of new dedicated high speed rail lines.
Overview
Acela Express began as a small improvement project through Amtrak and ended up
evolving into a high speed rail system (Government Accountability Office, 2006). The
Northeast corridor is the busiest passenger rail in the country; serving about 2/3 the
passengers combined from all Amtrak rail lines (Government Accountability Office,
2006). The Acela express rail line is the busiest of all rail lines, generating the most
revenue for Amtrak (Government Accountability Office, 2006). However, its success
has not come without problems, mainly due to the lack of planning that happened prior
to its construction. As a consequence the system has undergone many challenges that
might have been prevented if more time had been spent on a thorough planning
analysis of the project (Government Accountability Office, 2006).
Acela Express Analysis
Development of Acela Express Analysis Acela Express was developed because there was a need for improving the rail system,
but also for reducing travel time between some of the densest corridors in the northeast
region of the United States. Acela was developed as part of the Northeast Corridor
Improvement Project (NCIP), a plan that goes back to the 1970s and consist of a variety
of improvement projects, among them being the three hour train ride from Boston, New
York, to Washington D.C. (Government Accountability Office, 2006). The technology for
Acela was based on the French TGV (train à grande vitesse, French for ―high speed
45
train‖). In 1996, Amtrak executed contracts with train manufacturers Bombardier and
Alstom to build 20 high-speed train sets and 15 electric high horsepower locomotives;
construct three maintenance facilities; and provide maintenance services for the Acela’s
train sets (Government Accountability Office, 2006).
Below is a timeline and a background on the problems Amtrak experienced during the
development of the Acela Express program (Government Accountability Office, 2006).
Key Dates and Issues:
Operation began in 2000
In 2002 Acela was shut down for two months (resulting in huge image loss for the
system and a legal fight between Amtrak and the train set company)
Since then, Amtrak has faced broader challenges in managing other large-scale
projects

46
Figure 8 Timeline of Key Events (Acela Express)
Source: United States Government Accountability Office, 2006

47
Successes
Aside from some of the technical and maintenance difficulties, Acela Express has
managed to become the most profitable and self sustaining route from all the Amtrak
corridors. For fiscal year 2004, Amtrak’s Acela program accounted for about 44 percent
of the total revenue on the Northeast Corridor, Amtrak’s busiest rail route (Government
Accountability Study, 2006). In 2006, 2,668,174 passenger journeys were made on an
8.8% increase over 2005 (Government Accountability Study, 2006). The numbers keep
rising and it is predicted that they will continue to rise as more improvements are made
to the rail lines and as people become more environmentally conscious.
Acela Express has been able to divert air and highway users to using mass transit and
most of it has been due to its competitive time schedule in comparison to air travel
(avoiding excessive security/delays/comfort) and highway users (traffic delays). Acela’s
name was derived from the terms excellence and acceleration and only years later
renamed to Acela Express (Government Accountability Study, 2006). The idea behind
the name was to create a brand for the service based on those two concepts,
excellence and acceleration (Government Accountability Study, 2006). The marketing
and branding of the Acela Express as fast, comfortable, low prices, and reliable has
been one of the most important successes that Amtrak has accomplished. Acela
Express executives were focused on designing products that meet travelers’ needs and
focused on building the brand around ideas that came directly from customers
(Cassedy, 2002).

48
Acela Express is a major improvement in rail service being the only rail to come close to
competing with airline industries. The fastest Acela Express timing for the 456 mile
Washington, DC to Boston's South is just over 6 1/2 hours, an average of 72mph
(116km/h) (Government Accountability, 2006). The stretch from New York Penn Station
to Washington, DC 225 miles takes 2 hours 48 minutes, an average of 80mph
(129km/h) (Government Accountability, 2006). Even with all its successes Acela
Express still lags far behind its international high speed rail counterparts in terms of
speed.
Failures
Most of the failures that Acela Express experienced occurred during the initial years of
planning and service, such as: keeping the Acela project on schedule and attaining the
project goal of a 3 hour trip time between Boston and New York City (Government
Accountability Office, 2006). Many critics blame the United States Federal Rail
Administration for Acela’s problems specifically for not being able to keep its original 3
hour trip from NYC-Boston-DC (McCaughrin 2007). The restrictions imposed have
prevented Acela Express to come close to being like that of its counterpart in France
and Japan (McCaughrin 2007). Such regulations dealt with weight limitations and
buffering standards which caused slower speeds, faster wear tear problems, higher
prices, and possible higher risk in case of collisions (McCaughrin 2007).
Key Issues that the Acela Express faced (Government Accountability Office, 2006):
new technology
impacts from new safety standards to accommodate high-speed rail

49
manufacturing and production delays,
abbreviated testing of the trains prior to placement in revenue service
Acela Express also went through a legal suit with the manufacturing of the trains and
had to stop service in 2002 and again in 2005, which hurt Acela’s image and ridership
numbers. However, it has overcome most of the failures and its future looks bright.
Federal law limits train sets to not go above 110 mph in urban areas. Amtrak trains
were able to upgrade their tracks and trains to allow for such higher speeds and at
much lower cost than it would be to build dedicated rail for high speed service. The
Southern California region consists of mostly urban areas, which will limit the speed a
train can go. Train sets like Acela Express can serve as feeder trains for Southern
California’s high speed rail service. Acela Express is still considered high speed rail
because of its capability to go faster therefore, the California trains would also be
considered high speed trains but with a lower price tag. It would save a large amount of
taxpayer’s dollars to consider feeder trains, like Acela Express to serve most of the
Southern California and parts of the Northern California region, while limiting high speed
service to major urban hubs, such as: Los Angeles and San Francisco.
The California High Speed Rail Authority should emulate the Acela Express in corridors
where federal limits its speed, mainly urban areas. The lower price tag can help
increase the number of feeder trains in the corridor and can help increase construction
speed on the Los Angeles to San Francisco rail lines, which would be the only true High
50
Speed Rail Express under the federal definition. Increasing the number of feeder trains
will be very appealing in comparison to an air travel. The time difference would also not
be much different because the upgraded train sets would be capable of going faster.
ANALYSIS OF EUROPEAN HIGH SPEED RAIL This segment of the report will analyze the European Union’s vision for high speed rail.
It will also compare and contrast Europe’s transit with the United States by looking at
different factors: urban characteristics, transit quality, and lastly, transit behavior.
EU’s Vision for High Speed ail
Public transit is not a new phenomenon for European countries; high speed rail is but an
extension of public transportation. With the integration of European countries into the
European Union, transportation integration for the movement of goods and people has
become a forefront issue within member countries. The European Union Treaty obliges
the EU countries to contribute to the organization and development of Trans-European
Networks (TENs) in the areas of transport, telecommunications and energy supply
infrastructure. European Commission Treaty (Articles 154 and 155), focuses on the
establishment and development of trans-European networks in the area of transport
(European Commission, 2006). One of the initial concerns was technical and
operational barriers to trade, since most European countries have developed high
speed rail were built from a national perspective (European Commission, 2003).
A large part of the investments in TENtransport (about 25% in 1996/97) is currently
concentrated on high-speed railway lines, often connecting major conurbations

51
(European Commission, 2006). The European Union policy is focused on limiting
suburban sprawl by tying transportation to its land use plans (similar policy only
happened recently in California with the passage of SB 375). High speed rail plays a
central role in continuing to integrating land use and transportation.
European Union High Speed Rail Policy
A key difference between the U.S. and Europe is the harmonization of their high speed
rail policy among all the member states of the European Union. The European Union’s
spatial development policy and urban development measures plays a big role in
influencing the behavior of local business and the population in order to improve the
possibilities for a shift from road traffic to transit (European Commission, 2006).
European Union’s commitment to mass transit is apparent, we just have to analyze the
increase of passenger traffic from rail which increased from 217 billion to 290 billion
passengers from 1970 to 1998 (European Commission, 2006). The European Union
realizes the importance of mass transit, specifically high speed rail and have outlined
priority projects that includes several high speed rail lines in different European
countries (European Commission, 2006).
In order to attract more passengers to rail and to reduce greenhouse gas emissions the
European Commission formed the "railway package" measures which are laid out in the
White Paper (European Commission, 2006). Below is a list of key issues relating to rail
found in EU’s White Paper.
Key points:

52
ensuring high-quality rail services;
removing barriers to entry to the rail freight market;
improving the environmental performance of rail freight services;
gradually setting up a dedicated rail freight network;
progressively opening up the market in passenger services by rail;
improving rail passengers' rights.
The German Intercity Express
Germany’s passenger high speed rail services can be compared to California’s planned
high speed rail in that both offer intercity rail destinations. Another similarity is that
California is developing its rail system based on similar concepts the Germans had
when they first developed their plans for a passenger rail system. The development of
Germany’s high-speed Intercity Express (ICE) service came in response to the declining
share of the transportation market that rail faced in the 1960s, combined with capacity
problems on the nation’s highway, air, and rail networks (Vaca, 1993). The German
national policy response was a decision to shift as much passenger and freight traffic as
possible onto the rail mode (Vaca, 1993). While the California high speed trains will be
exclusively for passengers, there can be future collaboration opportunities. In an
interview with Andreas Lischke from the German Aerospace Center (DLR) (1-26-10), he
emphasized again that the decision to implement high speed rail was not to solve the
congestion problem but to create a competitive option to the air industry.
Intercity Express (ICE) service began with two routes between Hamburg-Munich and
Basel via Mannheim. Since then, the line has expanded to include many more

53
domestic stops, as well as international connections such as the: Paris-Brussels-KoIn-
Amsterdam service. Key to the implementation of high speed trains in Germany is that
the decision to build the new infrastructure was not based upon any feasibility study or
demand projection showing that the service and capacity were needed (Vaca, 1993).
Rather, it was more of a policy decision to meet an obviously growing transportation
demand with rail.
During the initial planning of the ICE rail system, Deutsche Bundesbahn (DB), the
German national railway, roughly estimated that the increased speed and comfort would
cause rail ridership to rise by about 30 percent while decreasing the number of air
passengers (Vaca, 1993). DB was accurate in their rough estimate of ridership
numbers. Lufthansa did, in fact, experience a 50 percent drop in ridership on the
Hannover-Frankfurt corridor once the ICE began operation, and the rail ridership in fact
increased by about 30 percent (Vaca, 1993). The Berlin to Hannover high speed rail
line began in 1998, and soon after it led to the elimination of the air route for this
segment (Lischke Interview, 1-26-10).
Urban Form Characteristics
European Union member countries developed their high speed rail using different
business plans which caused frustration with integrated transport policies. Since the
development of the EU, the European Commission has developed policies focused on
establishing an integrated transport system. In France, part of the Netherlands, Italy
and South Belgium, high speed trains carry passengers on long distance trips, on
dedicated passengers’ rail lines, without connecting medium-sized towns along the way

54
(European Commission, 2006). While in Germany, Spain, and part of Italy, Great
Britain and North Belgium, high speed rail creates an intercity network connecting
regional and local cities at a maximum speed of 200-250 km/h (European Commission,
2006). In the United States, the Acela Express carries passengers on long distance
trips. While the California High Speed Rail Authority can be compared to Germany’s
high speed network, connecting medium-sized towns along the way. The stops that are
being planned for California’s high speed trains are similar to Europe’s model where
they will have downtown to downtown stations.
Transit Quality
In order to make the railways more attractive, the European Commission strengthened
their passengers' rights policy to better protect the passenger - particularly with regard
to reimbursement for train delays (European Commission, 2006). The European
Commission also directed for easier access to information and fares, and the option of
buying international rail tickets more easily (European Commission, 2006). For Europe
the cost comparison from flying or taking a high speed train can be higher than air
travel. Just like air travel, the sooner in advance a passenger books a ticket the better
price the ticket will be. However, the ticket for a high speed train also takes into account
excellent customer service that many claim European airlines lack (Tremlett, 2009).
Another benefit is that passengers do not have to go through airport controls and can
arrive just minutes before the train leaves. The European high speed rail shares similar
characteristics to Acela Express, in that passengers prefer the comfort of extra room,
flexibility, and customer service to that of the competing airline industries.

55
Travel Behavior
Europe’s mass transit system is more advanced than the United States in terms of
technology and ridership numbers. However, like in the United States, Europe also
faces the challenge of an increased number of people driving automobiles. Between
1970 and 2000, the number of cars in the European Union increased from 62.5 million
to nearly 175 million, carrying 79% of passenger traffic (European Commission, 2006).
While the number of automobile owners has increased, their use of high speed rail and
mass transit system has also increased.
Contrast between the U.S. and the European Experience
The ultimate difference between the United States and European countries is that their
central government generally funds the majority of up-front costs of their country’s
respective high speed rail projects, and they do so without the expectation that their
investment will be recouped through ticket revenues (GAO, 2009). Even Spain’s high
speed network which is considered to be among one of the most successful in Europe
still needs public subsidies (GAO, 2009). Spanish officials told the U.S. GAO that the
original high speed line in Spain between Madrid and Seville has been profitable on an
operating cost basis but has not covered all of its costs, including the original
construction costs and it is predicted by a Spanish academic that future high speed
lines might not cover even their operating costs (GAO, 2009).
Although Europe has a more advanced high speed rail network than the United States,
their stages for planning are very elementary. Most European countries lack available
data on ridership numbers before the construction of their high speed rail projects.
56
Unlike the U.S., many of the European investors rely less on ridership forecasts and
more on policy goals for justification of spending billions on a transport system (Vaca,
1996). In Europe, most people use and are familiar with mass transit, and the demand
for public transport is high, while the opposite is true for most places in California where
the demand for public transport is low (Vaca, 1996). In California, rail or mass transit
hardly exists in most places. Therefore, a transition to high speed rail and eventually
mass transit system is a new idea and one that leads investor to believe is a riskier
investment.
FUNDING SOURCES FOR CALIFORNIA HIGH SPEED RAIL Central to this analysis, is the question of how high speed rail will be funded in
California. In this section, I will analyze several different funding sources: Federal,
State, Local, and Public-Private Partnerships.
Federal
The American Recovery Restoration Act of 2009 allowed states to apply for
corridor-wide infrastructure improvements. There were two different application options
each state could have chosen or combined; improving existing rail or creating new rail.
While a comprehensive phasing strategy would have helped meet current demands,
Governor Schwarzenegger opted to apply solely for the new rail line grant.
According to the California High Speed Rail Authority, ―California is the best-prepared
state in the nation to receive and maximize the benefit of a $4.7 billion share of $8
billion in federal funding for high-speed train development under the American Recovery

57
and Reinvestment Act (ARRA)‖ (California High Speed Rail Authority, 2009). Below
are facts from California High Speed Rail Authority website:
The only project offering 200+ MPH service
No other state is farther along in planning and development
Prepared to break ground as early as 2011
The only high-speed train in America backed with state and local funds
Matching state and local financial support – billions of dollars in voter-approved
financing
A decade of engineering and design work in place
The required criteria listed to apply for ARRA funds include (Federal Register, 2009):
Project and program selection should focus on achieving trip time reductions on key operational segments of the LOSSAN Corridor, as well as reducing overall trip time between Los Angeles and San Diego.
Los Angeles – Anaheim: 20 minutes (current 40 minutes) – 50 percent reduction
Los Angeles – San Diego: 2 hours or less (current 2 hours 51 minutes) – 42 percent reduction
In addition to the ARRA grant in August 2009, California applied for another $1.1 billion
for improvements to existing intercity passenger rail services and near-term job
creation.
State and Local Funding
Ever since the creation of the California High Speed Rail Authority, the California state
government has provided funds for studies for the feasibility of a statewide network of a
high speed rail system. The 2007-08 California State budget provided $20.7 million to
continue project implementation, including the preparation of a project financial plan,

58
project management activities, identification of critical rights-of-way acquisitions and the
continuation of detailed project design and related environmental studies (California
High Speed Rail Authority, 2009). A $9.95 billion dollar bond measure was on the
November 2008 ballot with $9 billion for implementing high speed rail and $950 million
for improvements to other rail services that connect to the high-speed rail service and it
passed by the voters of California (California High Speed Rail Authority, 2009). The
funding will largely come from bond money.
Local funding contribution will come from stations where the high-speed train system
shares corridors with existing services, such as: Metrolink between Los Angeles and
Anaheim (California High Speed Rail Authority, 2009). However, the state’s current
financial crisis has investors choosing to put their money in other investments over
California’s bonds. If the state cannot sell bond money, then high speed rail is in a
position where its construction might be delayed for an unknown period. Local funding
will also be difficult being that they are also dealing with cuts from state funding.
Metrolink has had to reduce its service to certain counties to deal with the loss of funds.
Public-Private Partnerships
The California High Speed Rail Authority anticipates private sector contribution for the
construction and operation of the high speed rail, including project debt financing,
vendor financing, system operations and private ownership (California High Speed Rail
Authority, 2009). In order to gage the amount of interest the private sector would have
in investing into the high speed rail project, the Authority released a Request for

59
Expression of Interest (REFI) (California High Speed Rail Authority, 2009). Some of the
results from the REFI showed that despite uncertainty in the financial markets, private
sector interest remains strong (California High Speed Rail Authority, 2009). The
Authority expects public-private partnership contribution to the high speed rail project to
be anywhere from $10 to $12 billion (California High Speed Rail Authority, 2009).
The amount of private investment being asked is very high amounts than what the
private sector is used to contributing. Below is an analysis of past private investments
into mass transit transportation and current investment into mass transit in the Los
Angeles region.
Analysis of Private Investment
Current large-scale transit projects such as the Exposition Light Rail Line are very
costly. The Exposition Line is expected to be roughly $640 million dollars and will be
financed through mostly Proposition C, the ½ cent sales tax. This means that everyone
in Los Angeles County who shops will pay for a light rail system that they may not use.
Joseph Giglio and William D Ankner proposed in their 1998 article ―Public – Private
Partnership: Brave New World‖ that much of the nation’s transportation system is
commercially viable and should not be treated as a true public good. They feel that
private industries should take a role in public transit and that public agencies would
benefit from the competitive nature of the private sector (Giglio, 1998). With growing
concern about the funding of large-scale transportation projects many economists
suggest a public – private partnership or just private rail system could be more cost
effective. In Los Angeles during the1920’s public transit policy was completely in the
60
hands of private industries and subsequently failed. The policy set forth in the 20’s was
inherently flawed and should serve as a guide for what should not be done to fund
current transit programs such as the Expo Light Rail Line.
Historic Policy: In the 1920’s Los Angeles had the Red Cars, one of the most
extensive rail lines in the United States with 1,150 miles of track and 109 million annual
passengers. Forty years later in 1960 the Red Cars were all shut down and many of the
rail lines torn out. There are many theories on why this occurred, from a General
Motors Conspiracy to the public’s general dislike of slow rail, to the public’s growing
desire to have an automobile. David J. St. Clair concludes that the fall of the Red Line
was purely economical and that one of the main contributing factors was the public
transit policy that was prevalent in the 1920’s. According to St. Clair ―Public transit
policy in the 1920’s was generally based on the franchise system. The transit
franchisee, a private transit company, acquired a legal monopoly over public transit
operations in the area and in exchange the transit company paid the city a franchise
fee. The private industry also provided services for the city such as street maintenance
(St. Claire, 1986).‖ The transit operators benefited from this monopoly through transit
revenue and real estate development profits. This proved to be their downfall as the
automobile became much more attractive for travelers and the real estate development
profits were a onetime deal. The private industries were then unable to pay off the debt
they owed for the capital improvements and many went out of business or taken over by
public transit agencies.

61
Comparison of historic and contemporary issue: The funding of transit projects has
always been an issue of debate because public transit is generally regarded as a public
service that only is used by a small percentage of the population. The 1920’s policy of
providing the private industry with an exclusive monopoly of public transit is just not
good planning because of the inherent nature of public transit today. As we can see
from the past, private industries are motivated by revenue generation and are not
concerned about providing access and mobility to people who have no other alternative.
The problem with funding such a public service is the question of who pays. Back in the
1920’s the private industries paid for transit projects because they got benefits from
other sources than farebox revenue. Now the operating costs of transit projects far
outweigh the revenue generated from the farebox. Public transit operates at a loss in
Los Angeles; the government subsidizes it to provide a service to the community, not to
make money. Michael Brooks describes public transit as a public good and therefore ―it
is likely that in a market economy people will under allocate resources to the production
of public goods‖ (Brooks, 2002). The responsibility of funding public transit projects is
now in the hands of the public agencies because the role of public transit shifted in the
1920’s. The rate of automobile travel grew in leaps and bounds because the
automobile was growing in prevalence due to its inherent benefits over the Red Cars. A
public-private venture would be irresponsible because the two’s core ideologies are
mutually exclusive.
The 1920’s policy of providing private agencies a franchise would not work for
contemporary transportations projects. The whole system in Los Angeles has changed
62
and it is impossible to duplicate the success that occurred in the 1920’s because of the
domination of the automobile and the public service role that public transit has now
shifted to. A better solution to funding issues in the Los Angeles area would be putting
the cost on to the automobile drivers because drivers were the cause of the fall of public
transit and are also more responsible for the other sorts of damage that public transit
industries try to alleviate. The other problems that the MTA has to alleviate are
congestion issues, and air quality problems. So a way to solve the funding crises of the
many public transit agencies would be to impose either a higher gas tax or mileage fee.
Europeans currently pay much more for gas, in London they have a mileage fee, and
their transit ridership is much higher than ours. This would provide a large sum of
revenue and also increase transit ridership in our system while reducing congestion and
therefore improving air quality.

63
Air versus High Speed Rail? The following section provides an analysis of the advantages and disadvantages of air
travel and high speed rail as a viable solution to intercity travel.
Currently, in Southern California the automobile covers the majority of intercity
transportation. The domination of the automobile raises some concern because the
automobile is not a viable solution to dealing with the large increase in intercity travel for
several reasons. First, California’s freeway networks are becoming increasingly
congested and construction of new freeways will not be able to keep up with the
projected growth in intercity travel nor will construction of new freeways actually solve
the problem of congestion. Second, automobiles are environmentally damaging
because automobiles pollute the air while only transporting a few passengers. Third,
the automobile is unable to provide the timesaving benefits that other modes of travel
such as high speed rail or airplanes can provide for long distance intercity travel.
Advantages of Air Travel as a viable solution to intercity travel
Airplanes have many attributes that make them a desirable alternative to the automobile
or high-speed rail for long intercity travel. John D. Kasarda mentions that airports are
the fifth wave in transportation induced urban development. According to Kasarda,
airplanes are flying the country into the 21-century because the need for speed,
flexibility and reliability in the movement of people and products is taking center stage in
our fast paced global environment (Kasarda, 2000). Airplanes such as a Boeing 747
can travel 567 miles per hour and can provide nonstop travel to anywhere an airport
exists for roughly 900 passengers (Kasarda, 2000). Kasarda mentions that intellectual

64
capital is becoming the key to success in the business atmosphere so the time saving
benefits provided by airplanes are unmatched. The airplane does not require rights of
way so travel can be nonstop and reliable because there are fewer issues of congestion
or accidents. High-speed rail would require its own right of way because the curvatures
of high-speed rail need to be less significant because of higher travel speeds. This
leads to a higher capital cost. Air does not rely on fixed capital improvements such as
rail lines. If there is some reason why travel between two cities decreases high-speed
rail does not have the flexibility to divert to another city without building more tracks. Air
can easily change their schedule to an area where an airport exists.
Other benefits such as low fare airlines (i.e. Southwest Airlines) and frequent flier mile
are incentive programs that encourage intercity travel. Low cost airlines also give the
consumer a choice of the type of service they want. If the intercity traveler wants to pay
more they are fully capable of going first class with all the perks while another person is
also able to go bare bones and pay for a no frills airline like Southwest. The airline
industry also thrives in areas where there are concentrated areas of development
surrounded by generally barren areas. California fits this scenario rather well because
the areas of San Francisco, Los Angeles, and San Diego are large metropolitan areas
but their surrounding cities are urban sprawl. Even areas outside of California have
similar attributes. Arizona, Nevada, Oregon, Washington, New Mexico all have the
majority of their population situated about a larger urban area and airport while being
surrounded by large tracts of underdeveloped territory.
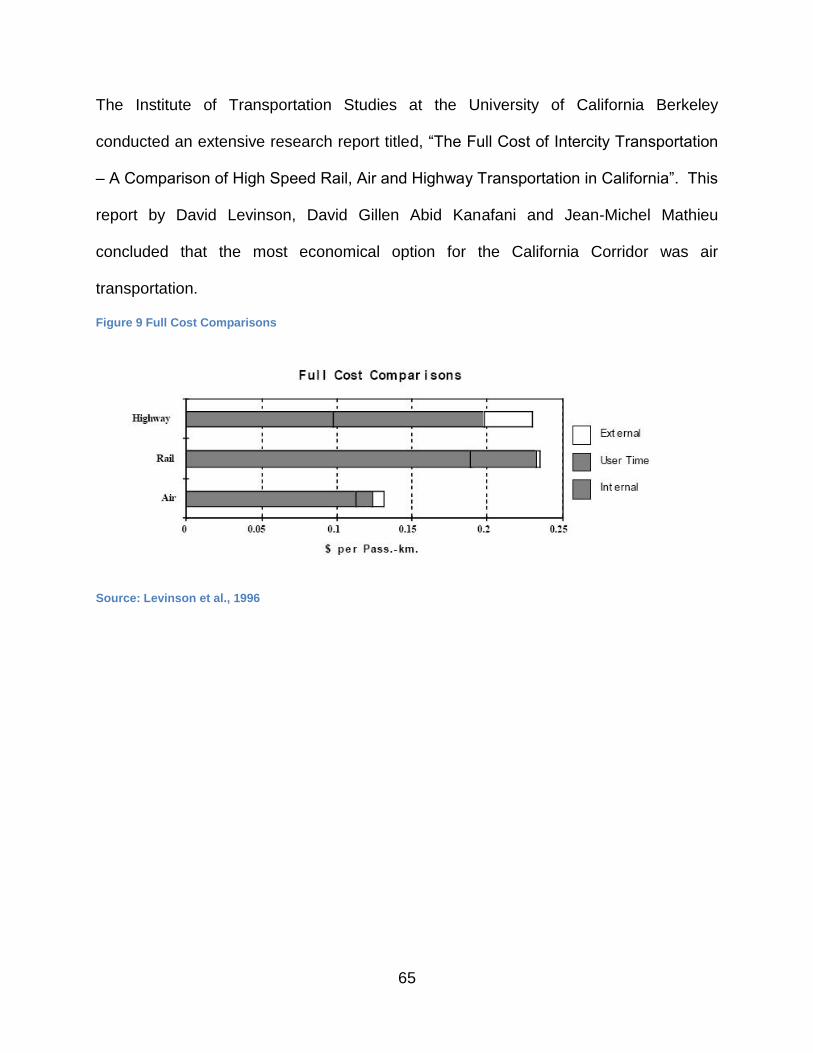
65
The Institute of Transportation Studies at the University of California Berkeley
conducted an extensive research report titled, ―The Full Cost of Intercity Transportation
– A Comparison of High Speed Rail, Air and Highway Transportation in California‖. This
report by David Levinson, David Gillen Abid Kanafani and Jean-Michel Mathieu
concluded that the most economical option for the California Corridor was air
transportation.
Figure 9 Full Cost Comparisons
Source: Levinson et al., 1996

66
The cost per passenger-kilometer traveled (pkt) for air transportation was $0.1315 for
air, which was significantly lower than high-speed rail ($.2350/pkt) and highway
($.2302/pkt) (Levinson et al., 1996). Their extensive research took into account the
external costs (accidents, congestion, noise, and air pollution) internal costs
(construction, operations and maintenance) and user time costs. The cost break down
according to their report is as follows:
Figure 10 Cost of Air in California Corridor
Source: Levinson et al., 1996
ARTCC is air route traffic control centers, TRACON is terminal radar control areas,
ATCT is air traffic control towers, and FSS is flight service centers. Capital costs make
up the bulk of the total cost with the cost of planes consisting of almost 50%. The
external/social costs only make up 6% of the total cost. High-speed rail does have

67
lower external/social costs but overall it is a small percentage that air can offset this
disadvantage through mitigation efforts like soundproofing nearby areas.
Disadvantages of Air Travel as a viable solution to intercity travel
Airports and airplanes create tremendous benefits for travelers but the question still
remains whether airplanes are the best alternative to the car or high-speed rail for
intercity travel in California. While airplanes do not require the construction or
maintenance of expensive right of ways like cars and high-speed rails require, airports
do create their own set of problems.
Airports are very expensive structures that take up a lot of space. In order to provide
the time saving benefits airports must be located within urban areas. This causes
numerous problems. One of the major problems is that airports are a significant cause
of air pollution. In Southern California our air quality is one of the poorest in the nation
and Los Angeles International Airport (LAX) is the third largest source of smog in
Southern California (SCAG, 2004). The reason for this is because U.S aircraft remain
largely exempt from air pollution rules. The International Civil Aviation Organization
governs airports. Noise pollution being another major is also a concern for areas
around airports where the average population density is around 85,000 people in the
65-decibel noise contour, which is high enough to warrant federal soundproofing (Erie,
2004).
All of these factors contribute to a ―not-in-my-back-yard‖ (NIMBY) attitude when it
comes to creating or expanding airports. In order for LAX to be a viable solution to

68
intercity travel LAX will need to expand its passenger handling capacity to account for
the future growth of the region. The public for the reasons listed above vehemently
opposed the master plan LAX expansion proposed by former Los Angeles City Mayor
Richard Riordan. An alternative to the LAX expansion was moving the entire facility to
Palmdale, which is a remote area of Los Angeles that would be able to house a very
large structure without expensive right of way acquisitions and community opposition.
The move to Palmdale would effectively erode many of the time saving benefits of the
airplane because Palmdale is 60 miles away from LAX. The Levinson et al report
created in 1996 does not take into account the September 11th tragedy. Since then
former Mayor James Hahn refocused the LAX master plan to stress security and
modernization rather than excess capacity. The September 11th terrorist attack has had
major influence on the shape and growth of air travel. Security is now a priority so the
time delay figure will be increased as well as capital costs because expanded security-
screening technology.
High Speed Rail as a solution to the growth in intercity travel
High Speed Rail (HSR) can be very effective in carrying a large amount of passengers
at a high rate of speed while consuming far less energy and emitting less toxic
emissions then air transit.
The proposed high speed rail plan connects to downtown to downtown locations. This
is beneficial because rail operates best where there is a high density of people all going
to one area. Downtown Los Angeles would benefit from high speed rail because of the
already existing mass transit connections (light rail and bus) from Union Station to many

69
parts of Los Angeles County. Another advantage besides the time saving benefits is
the location of being close to the central business district which has the potential to
induce more business. Since high speed rail is fitted to a dedicated right of way the risk
of terrorism is lower and therefore even more time can be saved because the security
check in process would be considerable shorter then air travel. Levinson’s report
showed that high speed rail has the lowest levels of external costs (Levinson et al.,
1996).
Figure 11 Average Cost of High Speed Rail
Source: Levinson et al, 1996
One of the major benefits of high speed rail is that the external costs are virtually
nonexistent except for noise. Accident rates are low because the whole system is
grade separated, pollution levels are nearly zero because the high speed rail is electric
and the cost of energy is absorbed into the cost of producing electricity in general.
Since it is a dedicated right of way there are no congestion levels. Basing the decision
of which service would be best for California on only one factor such as total cost
effectiveness is not really good planning, taking account of external/social costs is very
important. With environmental problems and community opposition growing against air
70
travel, high speed rail provides a great alternative that is cleaner and friendlier to
neighborhoods. Since LAX is having a very difficult time trying to expand high speed
rail might be a more feasible solution but not necessarily the most cost effective. High
speed rail would only require a couple of lanes of rail laid out. Existing right of way
could be modified to compensate for the increased speeds of rail and the costs could be
lowered because of this. Another major benefit of high speed rail is that it has the
potential to spur growth in underdeveloped areas. Access to the Central Valley will
increase and unlike air, high speed rail would stop in those areas and economic growth
could occur.
Disadvantages of High Speed Rail
High-speed rail has it shares of disadvantages that cast doubt on its viability in
becoming the mode of choice for the expected growth in intercity travel in California.
The Business Plan for the high speed rail system estimates the whole system to cost to
be up to $45 billion dollars. This is a large sum of money that is used solely for one
purpose. Airports do cost a lot of money but they have secondary uses because they
are used for transporting people and cargo from other countries and other states, unlike
a fixed capital expenditure like the high speed rail lines. David Levinson also points out
that new rail lines sometimes spur denser development around stations but states that
mostly they promote dispersion with park and ride lots encouraging sprawling type
suburban living (Levinson, 1996). Also the central valley citizens would have cause for
complaint because the plan does not have that many stops in the area but the rail line
will cut through their neighborhoods and farmlands disrupting cities and business while
not providing many benefits. Some experts argue that high speed rail has worked well

71
in Japan and France and therefore it should work for California. The problem with this
is that Japan has what Adib Kanafani calls concentrated demand. California’s
population is mostly bipolar with lots of people in Los Angeles and San Francisco and
few in between. Japan has many areas where population levels are quite high, so this
would be a great area for the skip stop patterns of rail (Kanafani, 1994). The levels of
demand then would be lower than the train is capable of handling so there would be a
waste of resources because the trains would be emptier and thus decrease the value of
such an expensive structure. Figure 12 shows a comparison between the population
clusters of California and Japan along where the high speed rail route would go through.
Figure 12 Population Comparison Japan and California
Source: Kanafani, 1994.
72
Analysis of Actual versus Estimate Numbers (Cost & Ridership)
Synopsis of Government Contract Process
The California High Speed Rail Authority contracts out projects to consultants who are
in charge of calculating the cost and ridership numbers for high speed rail passengers
as well as the alternatives to high speed rail (air and highway). Government contracts
usually go through an extensive competitive process to receive such projects. Most of
the work being done in regards to cost and ridership has been through the consulting
firm Parsons Brinckerhoff and Cambridge Systematic. Typically these are contracts that
are substantially valuable in monetary terms. Being that the consulting firms benefit
tremendously from such contracts, there is no incentive to provide accurate numbers
besides honesty and integrity. Transportation infrastructure projects are not the only
projects that have been underestimated in cost and overestimated in ridership.
Accuracy in demand forecast for rail projects is important to consider for many factors.
The demand forecast is used to then calculate the environmental and socioeconomic
benefits. Aside from that, it also serves allocate scarce funds.
Role of Academia in Assessing Accuracy
There are opponents that criticize high speed rail based on unfounded reasons.
However, there are also others who do not criticize high speed rail itself, but do criticize
the accuracy of numbers such as: ridership and cost estimates. Mainly, it is within
academia that we see much of the criticism which is surrounds the facts and accuracy
of numbers derived from consultant’s works. In particular, Bent Flyvbjerg stands out as
one of the leading academics who has presented case studies and research which

73
proves that the majority of the estimates of infrastructure projects are underestimated in
cost and overestimated in ridership numbers.
The objective of Flyvbjerg’s et al. article, ―How (In)accurate Are Demand Forecasts in
Public Works Projects?,‖ is to answer the question of accuracy of demand in
transportation projects by establishing a sample of transportation projects that is large
enough to permit statistically valid answers. The article concludes that the majority of
rail projects overestimated their demand forecast. The formula Flyvbjerg uses to find
the inaccuracy is one I also use to compare California high speed rail demand forecast,
which is the actual minus forecasted traffic in percentage of forecasted traffic (Flyvbjerg,
2005). Actual traffic is counted for the first year of operations, similarly to forecasted
traffic which is the estimate for the first year of operations (Flyvbjerg, 2005). Flyvbjerg
uses a total of 210 transportation projects, including both rail and road projects in
developed and developing countries to measure the inaccuracy of traffic forecast
(Flyvbjerg, 2005).
Flyvbjerg’s results present a striking reality of forecast demands for rail projects.
Flyvbjerg’s findings are that ―rail passenger forecast were overestimated by an average
of 105.6%, resulting in actual traffic that was on average 52.4% lower than forecasted
traffic,‖ both numbers were at the 95% confidence interval (Flyvbjerg, 2005). Flyvbjerg
concludes that rail forecast estimates are significantly misleading and that policymakers
and planners should take more into account risk assessment and management
regarding travel demand (Flyvbjerg, 2005).

74
Bent Flyvberg’s second article on the subject, ―Cost Overruns and Demand Shortfalls in
Urban Rail and Other Infrastructure,‖ demonstrates the general point that urban rail
projects are grossly underestimated in terms of cost projection. His conclusion, if used,
would help improve economic and financial risk assessment of large infrastructure
projects (Flyvbjerg, 2007). Flyvbjerg’s study consists of comparing 434 urban rail
projects with 214 other transportation infrastructure projects; his conclusions provide
statistically significant results in regards to risk assessment of building a project
(Flyvbjerg, 2007). The article emphasizes the current lack of accountability to produce
sound empirical results of estimating cost projections for large infrastructure projects.
This report takes the same methods that Flyvbjerg used to calculate the difference
between forecast and actual construction costs, which are actual costs minus forecast
costs in % of forecast costs (Flyvbjerg, 2007).
Flyvbjerg’s findings show that rail has the largest cost escalations with an average of
44.7% in comparison with bridges, tunnels, roads, and other projects and for 25% of
urban rail projects cost escalations are at least 60% with an actual ridership that is on
average 51% lower than forecast (Flyvbjerg, 2007). Flyvbjerg concludes that the
economic risk for urban rail projects turn out to be substantially more expensive than
said at the time of the decision to build (Flyvbjerg, 2007). Again, we see Flyvbjerg’s
strong emphasis on assessment and management of risk which he strongly urges
should be central when assessing whether an infrastructure project should be built.

75
Analysis
Using Flyvbjerg’s research, Table 5 Benchmarking of the California High Speed Rail,
the numbers for the California high speed rail were recalculated to show the difference
between the actual and the estimate, both in terms of cost and demand. In terms of
cost, there is an underestimate of $18 billion and ridership is overestimated by 5 million
riders. The numbers used to calculate the difference are found in Table 6 Flyvberg’s
cost escalation and ridership for 12 urban rail projects.
Table 5. Benchmarking of the California High Speed Rail
CA HSRA Benchmark (average practice)
Difference between CAHSRA and benchmark (Flyvberg)
Cost Escalation % (constant prices)
$45 Billion 40% $18 billion
Ridership Shortfall %
10 million per year (by 2020)
-47.8 -$5 million
Table 6. Flyvberg’s cost escalation and ridership for 12 urban rail projects
Quartiles (25/50/75%)
Average difference between actual and forecast development %
Standard deviation
Costs 28/45/56 40.3 25.3 Ridership -67/-52/-34 -47.8 25.6 Source: Flyvgjerg, 2007
Operation Estimates
The estimates derived from the private consultants studies show that the operation cost
for aviation would be $65.7 million per year, in comparison the California high speed rail
which would be $152.5 annually; this is based on 2003 dollars (CAHSRA, 2004). The
annual operations and maintenance costs of the high speed rail alternative is based on
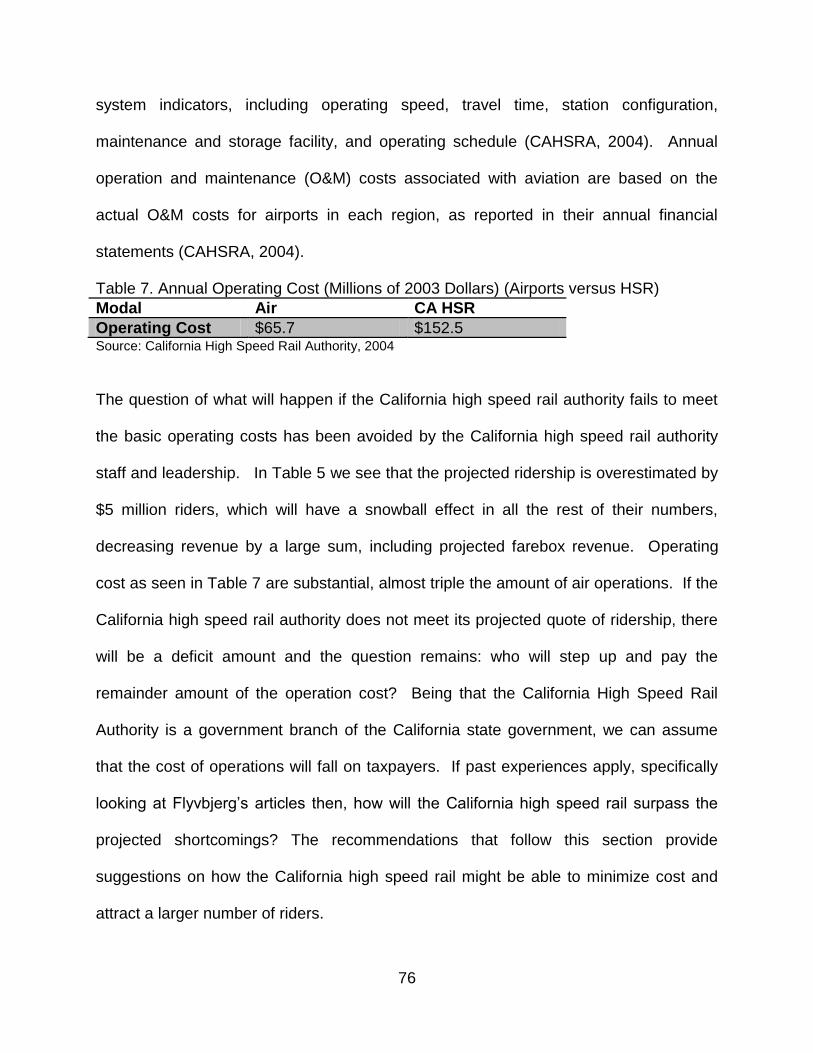
76
system indicators, including operating speed, travel time, station configuration,
maintenance and storage facility, and operating schedule (CAHSRA, 2004). Annual
operation and maintenance (O&M) costs associated with aviation are based on the
actual O&M costs for airports in each region, as reported in their annual financial
statements (CAHSRA, 2004).
Table 7. Annual Operating Cost (Millions of 2003 Dollars) (Airports versus HSR)
Modal Air CA HSR
Operating Cost $65.7 $152.5 Source: California High Speed Rail Authority, 2004
The question of what will happen if the California high speed rail authority fails to meet
the basic operating costs has been avoided by the California high speed rail authority
staff and leadership. In Table 5 we see that the projected ridership is overestimated by
$5 million riders, which will have a snowball effect in all the rest of their numbers,
decreasing revenue by a large sum, including projected farebox revenue. Operating
cost as seen in Table 7 are substantial, almost triple the amount of air operations. If the
California high speed rail authority does not meet its projected quote of ridership, there
will be a deficit amount and the question remains: who will step up and pay the
remainder amount of the operation cost? Being that the California High Speed Rail
Authority is a government branch of the California state government, we can assume
that the cost of operations will fall on taxpayers. If past experiences apply, specifically
looking at Flyvbjerg’s articles then, how will the California high speed rail surpass the
projected shortcomings? The recommendations that follow this section provide
suggestions on how the California high speed rail might be able to minimize cost and
attract a larger number of riders.
77
RECOMMENDATIONS
The California High Speed Rail will be a success if other mass transit projects are also
funded (i.e. light rail, subways, buses). Downtown to downtown destination is a great
concept, but one that also needs to invest in local mass transit options. If people get off
the high speed train and do not have other public transportation to get them to their
destination, then high speed rail will not have as much impact. Below are
recommendations that should be considered for the first phases of high speed rail
segment from Anaheim to Los Angeles.
Rail improvements within the Orange County segment of the LOSSAN Corridor to
create feeder trains to the high speed rail stations
Limit new tracks of high speed rail to Los Angeles – Bakersfield – San Francisco
Identify and nominate projects that focus on near-term job creation and passenger
rail improvements
Multimodal transit needs to be expanded in all the train station and urban centers
A stronger education campaign and outreach to community residents on the benefits
of creating a high speed train system
Create stronger partnerships with the regional transportation agencies, so they can
help create community support for the project
Throughout the California High Speed Rail Authority should also strategically prepare
for future implementation of high-speed rail service and connecting conventional rail
service.

78
FUTURE OF HIGH SPEED RAIL The demand for high speed rail might not be apparent now, but it will be in the near
future as air and highway capacity continues to be exacerbated. However, it is
important to emphasize that high speed rail will not work if mass transit is not built as
well and suburban sprawl is limited creating denser nodes around rail stations.
Europe’s high speed rail was not based on ridership projections but on policy. Their
high speed trains complement the rest of their mass transit. Though our economy might
be slow, it might help improve California’s economy by the job growth it will create.
Federal grants will be extremely important to help finance high speed trains and to spur
the state’s economy. A recovering California economy is crucial for the high speed train
project. Once the economy recovers, it will be easier for California to sell bonds that will
help finance the construction of the system. A strong economy will likely attract a large
number of private investors into the project. Aside from funding the California High
Speed Rail Authority will have to develop and foster strong partnerships with all the
regional transportation agencies that can help disseminate information and gather key
players in all the different regions to keep the project moving along.

79
REFERENCES American High Speed Rail Corporation. (1983). Proposed Los Angeles to San Diego high speed rail system: Orange County segment. [Los Angeles]: American High Speed Rail Corp. Bent, F., Flyvbjerg, M., Skamris, H., and Soren L. B. (2006). Inaccuracy in traffic forecasts. Transport Reviews, vol. 26, no. 1. Brooks, M. P. (2002). Planning Theory for Practitioners. Chicago, IL and Washington, DC: Planners Press, American Planning Assocation. California Department of Transportation (Caltrans) Rail Division. (2008). State of California comprehensive annual report. Retrieved from: http://www.sco.ca.gov/Files- ARD/CAFR/cafr08web.pdf. Accessed on: September 10, 2009. California Department of Transportation (Caltrans) Rail Division. (2003). LOSSAN corridor strategic plan. Retrieved from http://149.136.20.80/rail/dor/assets/File/Report_Files/lossanplan_final.pdf. Accessed on: October 13, 2009. California High Speed Rail Authority. (2009). What will it cost to build the California high- speed train system? Retrieved from: http://www.cahighspeedrail.ca.gov/faqs/financing.htm Accessed on: January 10, 2010 California High Speed Rail Authority. (2009). 2009 Business plan report. Retrieved from: http://www.cahighspeedrail.ca.gov/images/chsr/20091223222521_CHSRA_Busi ness_PPla_Dec_2009.pdf. Accessed on: January 13, 2010. California High Speed Rail Authority. (2004). Capital and operations and maintenance costs. Retrieved from: http://www.cahighspeedrail.ca.gov/images/chsr/20080201122128_Final_Cost_R ept.pdf. accessed on: March 30, 2010. California High-Speed Rail Authority, & Orange County Business Council. (2008). The economic impact of high speed trains for Orange County. Sacramento, CA: California High-Speed Rail Authority]. Cassedy, K. (2002). Case study: Amtrak. ATME 2002 Conference Report. Retrieved from: http://www.atme.org/pubs/members/75_307_1302.CFM. Accessed on: January, 14, 2010. Congressional Budget Office. (2003). The past and future of U.S. passenger rail service. United States Congress. Retrieved from:

80
http://www.cbo.gov/ftpdocs/45xx/doc4571/09-26-PassengerRail.pdf. Accessed on: August 20, 2009. Erie, S. (2004). International airport development at stall speed. Globalizing L.A.: Trade, Infrastructure, and Regional Development. Stanford, CA: Stanford University Press. Pages 172-200, 267-273 European Commission. (2003). The trans-european high speed rail system. European Commission Directorate-General for Energy and Transport. Retrieved from: http://ec.europa.eu/transport/rail/interoperability/doc/2003_high_speed_rail_tsi_g uide_ee.pdf. Accessed on: September 20, 2009. European Commission. (1996). White paper: a strategy for revitalizing the Community's railways. Retrieved from: http://europa.eu/legislation_summaries/transport/rail_transport/l24014_en.htm. Accessed on: January 13, 2010. Federal Register. (2009, June 23). High-speed intercity passenger rail program: notice. Department of Transportation. Washington D.C. Vol. 74 (119).
Fisher, J. (2009). Transportation topics and tales: milestones in transportation history in southern California. LADOT: Los Angeles, CA.
Fleming, S. (2009). High speed passenger rail effectively using Recovery Act funds for high speed rail projects: testimony before the Subcommittee on Surface Transportation and Merchant Marine Infrastructure, Safety. [Washington, D.C.] :: U.S. Govt. Accountability Office. Florida Department of Transportation (FDOT). (2010). Florida high speed rail. Retrieved from: http://www.floridahighspeedrail.org/. Accessed on: January 28, 2010. Flyvbjerg, B. (2007). Cost overruns and demand shortfalls in urban rail and other infrastructure. Transportation Planning and Technology. 30(1), 9-30. Flyvbjert, B. et al. (2005). How (in)accurate are demand forecasts in public works projects? Journal of the American Planning Association. 71(2), 131-146. Gallagher, W. (2005). Southeast high speed rail (SEHSR): a case study. UC Davis: Road Ecology Center. Retrieved from: http://esgycholarship.org/uc/item/9gm3514q. Accessed: November 11, 2009. Giglio, J. and Ankner, W. (1998). ―Public-private partnerships: brave new world,‖ TR News 198. Washington, D.C.: Transportation Research Board. Pages 28-33. U.S. General Accounting Office. (2005). Acela’s continued problems underscore the importance of meeting broader challenges in managing large- scale
81
projects. http://frwebgate.access.gpo.gov/cgi- bin/getdoc.cgi?dbname=gao&docid=f:d05698t.pdf. Accessed: November 11, 2009. U.S. General Accounting Office (GAO) Study 09-317. (2009). High Speed Passenger Rail: Future Development Will Depend on Addressing Financial and Other Challenges and Establishing a Clear Federal Role. Washington D.C. U.S. General Accounting Office (GAO) Study 99-044 (1999). High Speed Rail Projects in the United States. Washington D.C. Kanafani, A. (1994). No rush to catch the train. Access, 4: 8-14 Kasarda, J. (2000). Aerotroplolis: airport-driven urban development. ULI on the Future: Cities in the 21st Century. Washington, DC: Urban Land Institute. Page 32-41 Lee, J. (2009). A Vision for high speed rail. [Web]. Retrieved from http://www.whitehouse.gov/blog/09/04/16/a-vision-for-high-speed-rail Levinson, D., Gillen, D., Kanafani A., Mathieu, J. (1996). The full cost of intercity transportation – a comparison of high Speed rail, air and highway transportation in California.‖ Institute of Transportation Studies. University of California Berkeley. Berkeley CA Levinson, D. (1996). ―California’s high speed rail: some facts‖ Retrieved from: http://www.ce.umn.edu/~levinson/HSR.html. Accessed on: August 22, 2009. Lutz, M. (2009, September 10). Dubai Unveils $7.6-Billion Mass-Transit Rail System. Los Angeles Times. pp.A3. McCaughrin, E. (2007). How the FRA is regulation passenger rail out of existence. East Bay Bicycle Coalition. Retrieved from: http://www.ebbc.org/rail/fra.html. Accessed on: January 14, 2010. McGreevy, P. (2010, January 11). High-speed rail plan flawed, says legislature's financial analyst. Los Angeles Times, http://latimesblogs.latimes.com/lanow/2010/01/highspeed-rail-plan-flawed-says- legislatures-financial-analyst.html Mineta Transportation Institute. (2005). High speed rail projects in the US, identifying the elements for success. MTI Report 05-01. San Jose, California. Nayak, P. R., & Mattison, P. D. (1982). Bullet train from Los Angeles to San Diego: Forecast of ridership and revenues. Cambridge, Mass: Arthur D. Little.
82
Office of the Governor. (2010). Governor’s Budget Summary 2010-11. State of California. Retrieved from: http://gov.ca.gov/press-release/14124/. Accessed on: January 11, 2010. Reston, Maeve. (2009, June 9). Joe Biden says California high-speed rail looking good for federal money. Los Angeles Times. Retrieved from: http://latimesblogs.latimes.com/lanow/2009/06/though-california-is-in-the-throes- of-a-budget-crisis-vice-president-joe-biden-said-today-that-the-states-high- speed-rail.html Richard, S. (2010, January 28). California to get $2.5 billion in high speed rail funding. Los Angeles Times, http://www.latimes.com/news/nation-and-world/la-na-high- speed-rail28-2010jan28,0,2948055.story Skamris, M. and Bent, F. (1996). Accuracy of traffic forecasts and cost estimates on large transportation projects. Transportation Research Record 1518. Southern California Association of Governments. (1991). Southern California high speed rail feasibility study. [Los Angeles, Calif.]: Southern California Association of Governments. Southern California Association of Governments. (2003). General Aviation Study for the SCAG Region. [Los Angeles, Calif.]: Southern California Association of Governments. Southern California Association of Governments. (2008). SCAG 2008 Aviation Quarterly Reports. [Los Angeles, Calif.]: Southern California Association of Governments. Southern California Association of Governments. (2009, November 8). Retrieved from High Speed Regional Transport at: www.scag.ca.gov. Accessed on: January 11, 2010 St. Clair, D. J. (1986). The Motorization of American Cities. New York. Praeger Texas Transportation Institute. (2009). Annual Mobility Report. University Transportation Center for Mobility. Retrieved from: http://tti.tamu.edu/documents/mobility_report_2009.pdf. Accessed on: August 9, 2009. Tremlett, G. (2009, August 5). High speed rail in Spain. The Guardian . http://www.guardian.co.uk/world/2009/aug/05/high-speed-rail-spain-travel Vaca, E. (1996). Intercity rail ridership forecasting and the implementation of high speed rail in California. The University of California Transport Center. California, Berkeley. (pp 1-26).

83
Wimborne, T. (2008, June 13). Review calls for NSW congestion tax. ABC News, http://www.abc.net.au/news/stories/2008/06/13/2273362.htm Zook, C. (1996) High Speed Rail a Problem? High Speed Rail (pp. 23-67). California: Los Angeles.
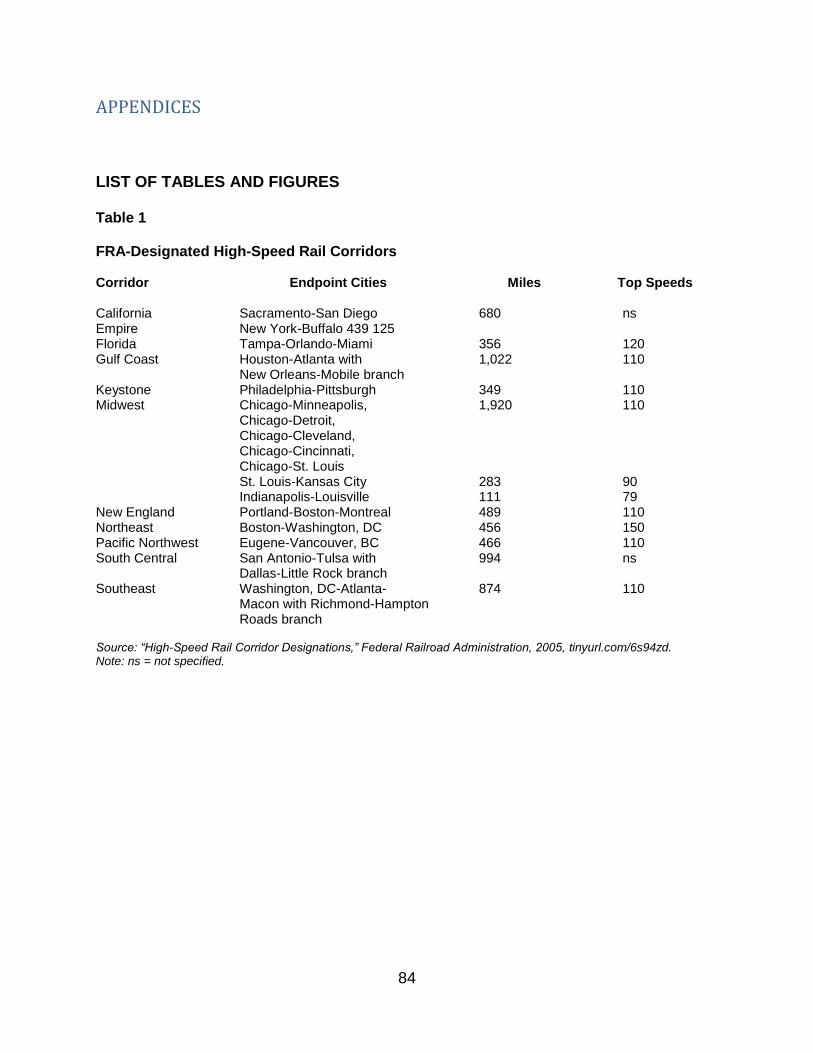
84
APPENDICES LIST OF TABLES AND FIGURES Table 1 FRA-Designated High-Speed Rail Corridors Corridor Endpoint Cities Miles Top Speeds California Sacramento-San Diego 680 ns Empire New York-Buffalo 439 125 Florida Tampa-Orlando-Miami 356 120 Gulf Coast Houston-Atlanta with 1,022 110
New Orleans-Mobile branch Keystone Philadelphia-Pittsburgh 349 110 Midwest Chicago-Minneapolis, 1,920 110
Chicago-Detroit, Chicago-Cleveland, Chicago-Cincinnati, Chicago-St. Louis St. Louis-Kansas City 283 90 Indianapolis-Louisville 111 79
New England Portland-Boston-Montreal 489 110 Northeast Boston-Washington, DC 456 150 Pacific Northwest Eugene-Vancouver, BC 466 110 South Central San Antonio-Tulsa with 994 ns
Dallas-Little Rock branch Southeast Washington, DC-Atlanta- 874 110
Macon with Richmond-Hampton Roads branch
Source: “High-Speed Rail Corridor Designations,” Federal Railroad Administration, 2005, tinyurl.com/6s94zd. Note: ns = not specified.