Moving from Warehouse to Distribution Center Cross Docking.
39
Moving from Warehouse to Distribution Center Cross Docking
-
Upload
magdalen-neal -
Category
Documents
-
view
224 -
download
0
Transcript of Moving from Warehouse to Distribution Center Cross Docking.

Moving from Warehouse to Distribution Center Cross Docking

Todd BrandtUnit Head - Logistics Warehousing
Tom StewartFinance Manager
Materials Management Financial Analysis
Mayo ClinicRochester, MN

Agenda
Mayo Clinic Background
Warehouse vs. Distribution Center
Need for Change
Road to Success
Value

Mayo’s Mission
Mayo will provide the best care to every patient every
day through integrated clinical practice, education, and
research.
Primary Value
The needs of a patient come first.
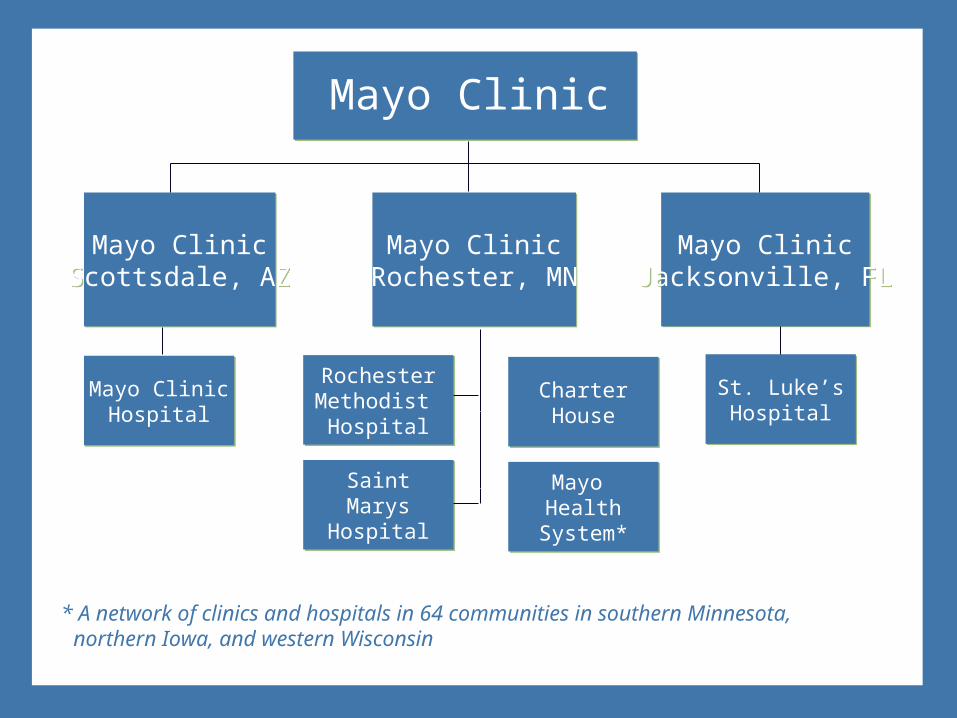
Mayo Clinic
Mayo ClinicScottsdale, AZ
Mayo ClinicScottsdale, AZ
Mayo ClinicRochester, MN
Mayo ClinicRochester, MN
Mayo ClinicJacksonville, FL
Mayo ClinicJacksonville, FL
RochesterMethodist Hospital
RochesterMethodist Hospital
SaintMarys
Hospital
SaintMarys
Hospital
CharterHouse
CharterHouse
Mayo Health
System*
Mayo Health
System*
Mayo ClinicHospital
Mayo ClinicHospital
St. Luke’sHospital
St. Luke’sHospital
* A network of clinics and hospitals in 64 communities in southern Minnesota, northern Iowa, and western Wisconsin

Mayo Clinic Rochester
28,080 Employees*
322,772 Unique Patients*
1,951 Licensed Beds*
77 Buildings
$633M of Supply Spend
*as of 9/06

MAYO CLINIC ROCHESTERDIVISION OF MATERIALS MANAGEMENT
Unit HeadSupply Chain Logistics-
Inventory T. Brandt
Unit HeadSupply Chain Logistics-
Distribution & Whse/Records
S. Borgen
Unit HeadSupply Chain Logistics-
Par Stocking C. Schneider
Director Value Analysis
T. Nelson, R.N.
Admin AsstB. SchroederC. Thornton
Finance ManagerPurchasing
D. Schmitz
Finance ManagerMM Financial Analysis
T. Stewart
Director
Linda Akiens
Department ChairRochester Finance
B. Schmidt
Division ChairSupply Chain Management
J. Francis

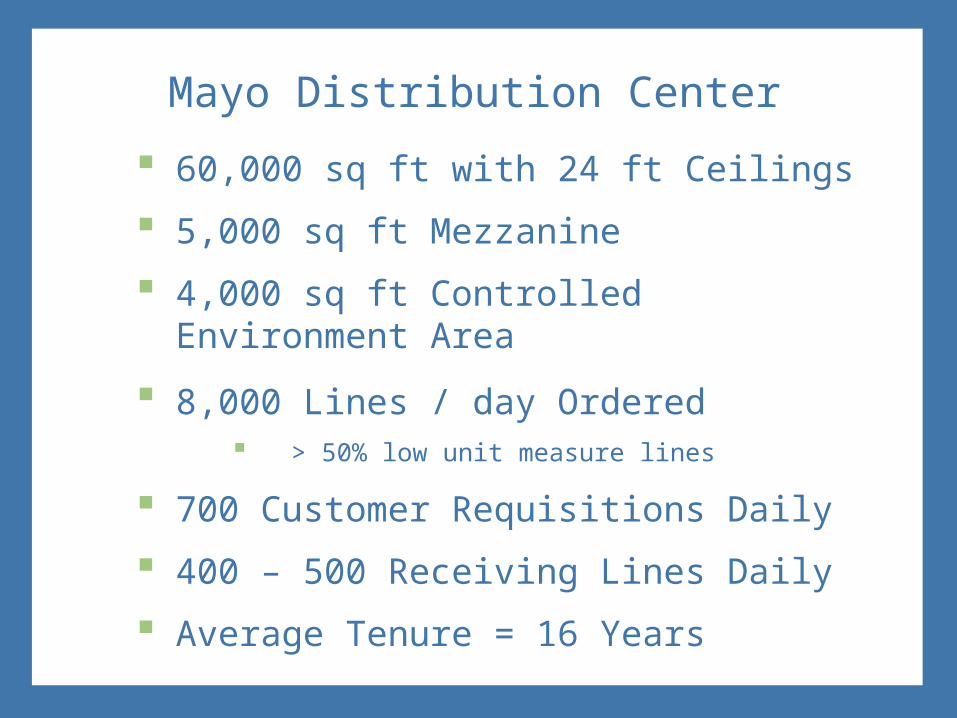
Mayo Distribution Center
60,000 sq ft with 24 ft Ceilings
5,000 sq ft Mezzanine
4,000 sq ft Controlled Environment Area
8,000 Lines / day Ordered > 50% low unit measure lines
700 Customer Requisitions Daily
400 – 500 Receiving Lines Daily
Average Tenure = 16 Years

What is a Warehouse?
Warehouse
Storage
Minimize expense
Fill it up!
Few metrics

Past- The 90’s
Product Migration
Inventory
Low visibility
Few policies and procedures
No stocking criteria
Traditional Approach
Fill it up!

Measurements
Mayo Inventory Center (MIC)
9.5
5.1
-
2.0
4.0
6.0
8.0
10.0
12.0
Inv (in millions) Turns
Inve
ntor
y V
alue
/Tur
ns
1995


Past- New Millennium
Product Stabilization
Inventory
Increased visibility
Develop policies and procedures
Unofficial stocking criteria
Guarded Approach
Limited space available

Measurements
Mayo Inventory Center (MIC)
9.5 10.0
5.1
9.1
-
2.0
4.0
6.0
8.0
10.0
12.0
Inv (in millions) Turns
Inve
ntor
y V
alue
/Tur
ns
1995 2004

Need for Change
Customer Needs
Just in time
Low unit of measure
Growth
Space utilization
Financial Viability
Change patient demographics
Improving cost structure

What is a Distribution Center?
Distribution Center
Organized process
Customer focused
Unique demands
Visible metrics
Cross docking
Consolidation area

Road to success
Assemble Team
Create Strategy Map
Determine Baseline
Implement Plan
Measure Progress
Have Some FUN!

Assembled Team
Leadership Sponsor
Analytical Staff
Line Staff
Supervisors
Systems Support
Consultant

Strategy Map
Current State
Future State
Road Map

Slow Moving Parts
Defined Slow Moving
Identify Items
Criteria
Communicate
Disposition
Monitor

Velocity and ABC Codes
What is Needed
Create Legend
Slotting
Correct Size
Label SKUs
Reporting

Velocity and ABC Codes
Classification Based on Point System* Order Schedule Location Capacity
A2 points Ordered daily by the largest
customer base.Min. 3 days
B
3 points More than one Customer was
ordering either daily or
weekly.Min. 1 week
C
4 points More than one customer ordered
at least once per week. Min. 2 weeks
D
5 points 19 customers are ordering less
than once per week or less
than 52 times per year. All
ESingle Customer SKUs One customer orders daily.
Min. 3 days
F
Single Customer SKUs One customer was ordering either
daily or weekly Min. 1 week
G
Single Customer or Critical (NMMC)
SKUs
One customer was ordering less
than once per week or less
than 52 times per year. Min. 2 weeks

631 “A” SKUs
29 Pick Aisles
2 Floors
427 Over-Stock Locations
“A” Velocity SKUs Current Locations

Order Management and Staff Optimization
Current Patterns
Institution Needs
Customer Needs
Who Controls?
Change

Technology
Enterprise Resource Planning
Point of Use
Warehouse Management
Lot tracking
Expiration tracking
Electronic transactions
Staff productivity

Standard Operating Procedures (SOP’s)
Requires Process Changes
Inventory control
Slotting
Receiving
Picking
Cycle counting
Communication Tool
Change Behaviors

Distribution Processing*
Customers Needs
Lean Process
Save Space
Reduced Inventor
* Internal or External

Cross Docking
Consolidation
Non-stocks
Delivery Times
Reduce trips
Space

Current State
Stock to Non-stock
Inventory
High visibility
Turns
Implement SOP’s
Official stocking criteria
Lean Approach
Low unit of measure
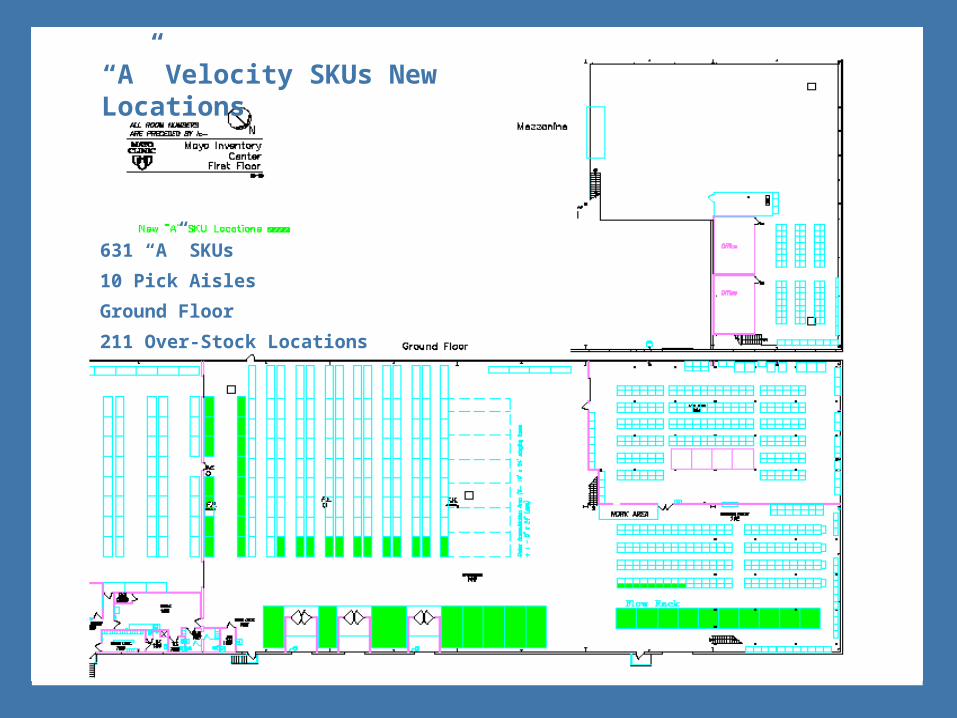
631 “A” SKUs
10 Pick Aisles
Ground Floor
211 Over-Stock Locations
“A” Velocity SKUs New Locations

Product Slotting
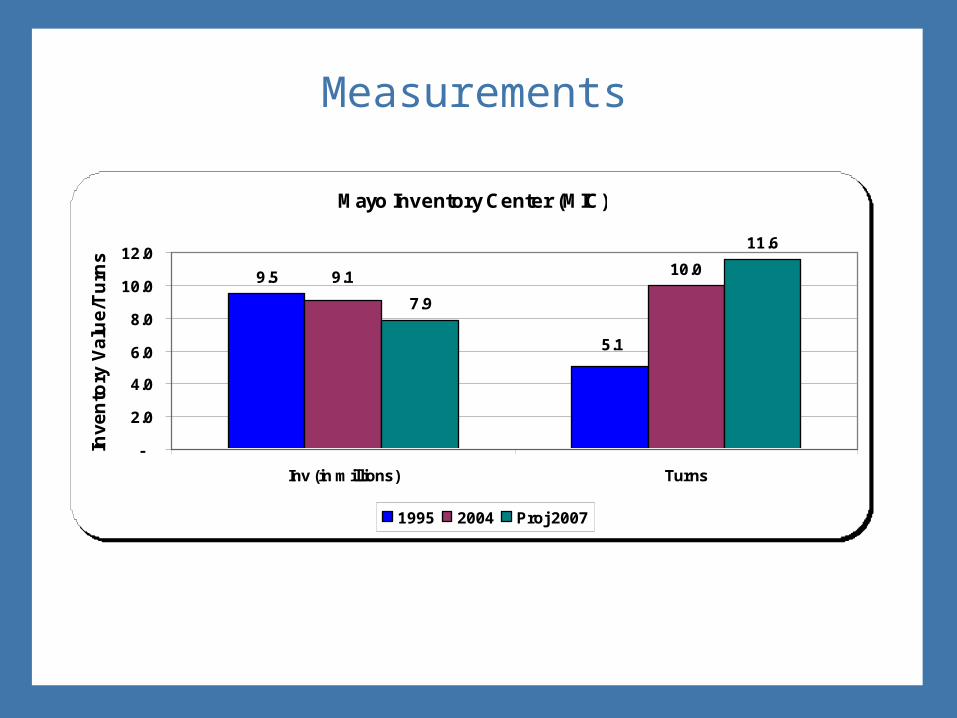
Measurements
Mayo Inventory Center (MIC)
9.5 10.0
7.9
11.6
5.1
9.1
-
2.0
4.0
6.0
8.0
10.0
12.0
Inv (in millions) Turns
Inv
en
tory
Va
lue
/Tu
rns
1995 2004 Proj 2007
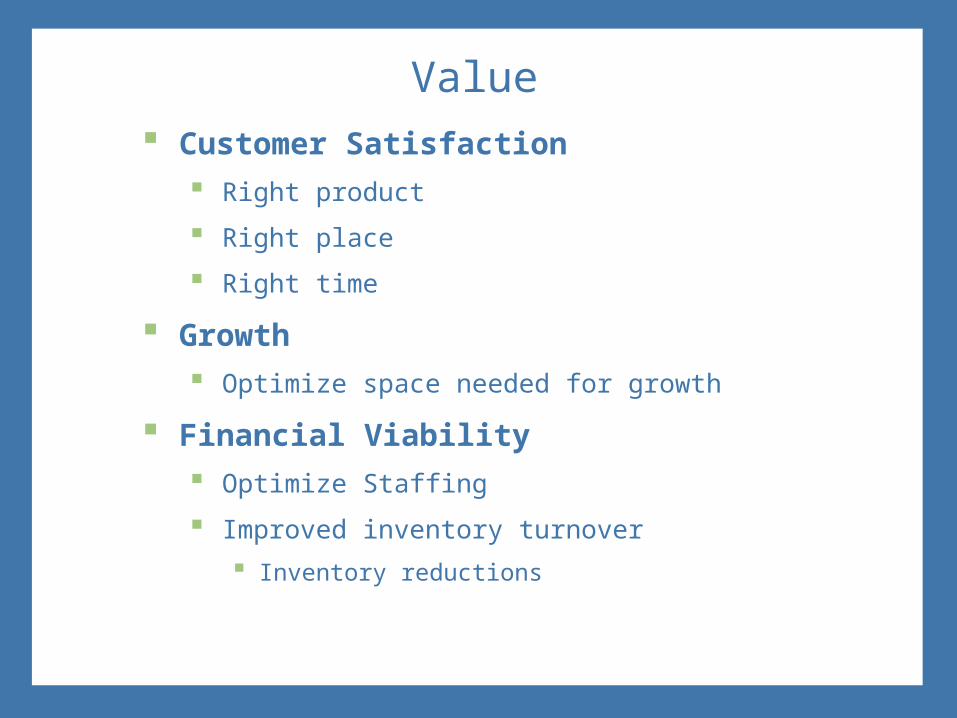
Value Customer Satisfaction
Right product
Right place
Right time
Growth
Optimize space needed for growth
Financial Viability
Optimize Staffing
Improved inventory turnover
Inventory reductions

Cost to Serve Benchmarks
*Data provided by National Medical Logistics
2.0%
3.5%
5.0%
6.5%
8.0%
9.5%COST
TO
SERVE
SCHEDULED BULK DEL. 3 DAYS/ WK
NEXT DAY BULK DEL.. 5
DAYS/ WK
LOW UNIT DEL TO PAR LOC 5
DAYS/WK
LOW UNIT TO PAR LOC. 7 DAYS/WK
CROSS DOCKING
SERVICES
UNLIMITED STAT ORDER
DEL
98%+ FILL RATE
COMMITMENT
SERVICE OFFERING
++ + + + +

Future State
Laboratory Expansion
Lot track
Temperature sensitive
Clinical Growth
Space constraints
Flexibility
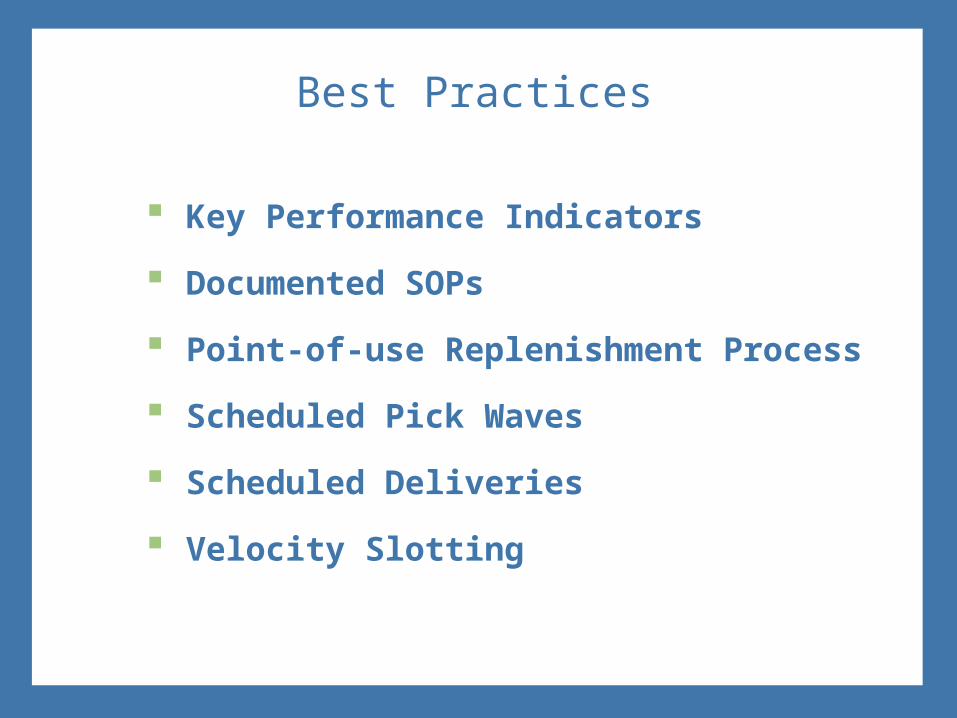
Best Practices
Key Performance Indicators
Documented SOPs
Point-of-use Replenishment Process
Scheduled Pick Waves
Scheduled Deliveries
Velocity Slotting

Summary
Evolution Traditional warehouse
Distribution model
Customer Flexibility
Value Lower cost
Quality
![Index []/ Index Warehouse 1.0 Warehouse 2.0 Special Handling Operations Cross-docking DC Pick & Pack Inventory Control Origin / Vendor Management Our Management Our Offices Office](https://static.fdocuments.in/doc/165x107/5f1a34bed807144c081a93c9/-index-index-warehouse-10-warehouse-20-special-handling-operations-cross-docking.jpg)