MOVING FORWARD FOCUSED and AGILE
12
MOVING FORWARD FOCUSED and AGILE 2020 ANNUAL REPORT
Transcript of MOVING FORWARD FOCUSED and AGILE

MOVING FORWARD
FOCUSEDand AGILE
2020 ANNUAL REPORT

Table of Contents
Shareholder Letter ........................................................................... 4
Six-Year Financials ............................................................................7
Stock Performance .......................................................................... 8
Dividend Information ...................................................................... 8
Non-GAAP Reconciliations .....................................................144
Glossary ............................................................................................146
Corporate Information ................................. inside back cover
Corporate Officers ......................................... inside back cover
Leggett & Platt at a Glance .....................................back cover
leggett.com | LEG
Top left: In 2020, Cedric Cortez achieved 50 years of continuous service at our Wire Mill in Carthage, Missouri. Thank you Cedric for your dedication, commitment, and hard work.
2020 was a year of unprecedented challenges, but with challenges come opportunities. Opportunities for our people to work together for the health and safety of fellow employees and our communities, agility in responding to rapid demand changes, and an intense focus on preserving our balance sheet. We exited the year as a stronger company in a solid financial position and focused on the future.

Our primary concern has been and will always be ensuring the health and safety of employees and their families, along with our customers and suppliers. We quickly took steps to limit the impact of the global COVID-19 pandemic on our people and our operations.
In a matter of weeks, our employees completely redesigned the way we work while maintaining and even increasing productivity. We formed a cross-functional crisis response team to establish and implement new safety protocols across our businesses and to share best practices. We also found many ways to serve others and give back to our communities, which we have highlighted in the sidebars.
Ultimately, our employees navigated the challenges as a team, and we are a stronger company today because of their extraordinary efforts.
1
ONE TEAM, ALIGNED
In just one week, Peterson Chemical Technology researched, developed formulas, obtained certification, and began producing hand sanitizer. PCT develops and produces specialty chemicals used to make foam.
In addition to being distributed within Leggett, the hand sanitizer has been donated to local schools, clinics, grocery stores, correctional facilities, and homeless shelters.

2
Our teams had to think and act creatively to adjust our operating models as the pandemic created dramatic shifts in the markets we serve. Following steep market declines in late March, increased consumer spending on the home drove strong demand in our Bedding, Home Furniture, and Textiles businesses. We navigated production and supply chain constraints in our Bedding business as we worked to meet a strong surge in market demand.
We anticipated a long-term trend toward online sales of compressed mattresses when we acquired ECS in early 2019, and the pandemic accelerated that shift. Retailers and mattress brands have increased their compressed mattress offerings to include multiple options in both product construction and ways to buy. Our investment in ECS positioned us to participate in these market changes.
We remain focused on capturing strategic opportunities across our businesses and will continue to pursue initiatives most valuable to the Company’s future.
FOCUSED AND AGILE
Genesis Seating produced face masks for government and non-profit healthcare organizations. Genesis produces private label finished furniture for homes and offices.
At the onset of the pandemic, Hanes Fabrics donated fabric for thousands of face masks. Hanes is a converter and distributor of nonwoven fabrics.

Our employees did a remarkable job focusing on working capital, especially customer collections and inventory management. These efforts coupled with market demand recovering sooner than expected benefited earnings and cash flow.
In conjunction with the sharp decrease in market demand early in the year, we significantly reduced fixed costs and capital expenditures. As demand returned, we only brought back costs and investments necessary to meet increasing volumes and to secure future growth opportunities. We also amended the covenant in our revolving credit agreement to provide additional liquidity.
As a result of these actions, we exited 2020 in a strong financial position, with a commitment to our long-held priority on balance sheet strength, dividend growth, and investment grade debt ratings.
3
SOLID FINANCIAL FOOTING
In just two months, Spühl constructed a machine that produces about 30,000 face masks per week for Leggett employees. Spühl produces wire forming equipment used to make innersprings.
By sourcing and ordering equipment such as face masks, disinfectants, gloves, and alcohol wipes, Corporate Procurement has helped to protect our essential workers with vital PPE.

Letter to ShareholdersFELLOW SHAREHOLDERS,
Like most companies, we faced a wide variety of challenges this past year stemming from the COVID-19 pandemic. From the onset of the outbreak, our primary mission has been to keep our people safe and our facilities operating, and to manage the extreme swings in demand that we experienced during the year. An incredible group of employees came together across our corporate functions and businesses to develop highly effective protocols to manage the crisis and to serve our customers and shareholders.
To all of our employees – thank you for your dedication, ingenuity, and tenacity. We are extremely proud of all you accomplished, and we ended 2020 as a stronger company as a result of your extraordinary efforts. We are honored and proud to be on your team.
2020 MARKET VOLATILITY: CHALLENGES AND OUR RESPONSE
The impact began in January, directly affecting our operations in China, as well as the global supply chain. The crisis accelerated, impacting virtually all geographies by mid-March. We quickly took action to:
• Implement comprehensive safety protocols,• Monitor and manage supply chain risks,• Align our variable cost structure to demand levels, • Significantly reduce fixed costs and cut capital expenditures, • Prioritize accounts receivable collections and inventory management, and• Amend the financial covenant in our revolving credit facility to provide additional liquidity.
These efforts helped to strengthen cash flow and protect our balance sheet as we moved through the year.
By mid-second quarter, we began to see rapid recovery in businesses serving home-related markets. With consumers spending less on travel and entertainment, they began investing more in their homes. This benefited our Bedding, Home Furniture, Flooring, and Textiles businesses.
In addition, the long-term trends in the bedding market that led us to acquire ECS in early 2019 accelerated as a result of the pandemic. Consumers are increasingly buying compressed mattresses, including hybrids, online and through various retail channels. We are benefiting from this shift to an omni-channel environment.
As demand recovered in Bedding, we began to face global constraints.
• Nonwoven fabrics used in the production of ComfortCore® innersprings were diverted into use for face masks, hospital gowns, and other personal protective equipment.
• Labor availability was impacted by the pandemic itself, as well as government restrictions and relief programs. Labor issues were amplified by the rapid change in our production needs. Our operations shifted from a near shutdown in early April to customer demand in excess of pre-pandemic levels in a matter of weeks across many of our businesses.
• Chemical shortages emerged as producers of the chemicals used to make foam were impacted by tropical storms and hurricanes and reported a variety of equipment and production issues.
We made progress on both the nonwoven fabrics and labor shortages as we moved through 2020. Chemical shortages are ongoing, and are expected to continue through at least mid-2021.
As sales recovered, we maintained most of the fixed cost reductions, adding costs only to support higher volumes and future growth opportunities. Margins benefited from this cost discipline. We ended the year with fixed cost savings of approximately $90 million.
1 For non-GAAP reconciliations, please refer to page 144.4
5000
4500
4000
3500
3000
25002015 2016 2017 2018 2019 2020
TRADE SALES(millions of dollars)
14
12
10
8
6
42015 2016 2017 2018 2019 2020
EBIT MARGINadjusted continuing ops1
(percent)18
16
14
12
10
82015 2016 2017 2018 2019 2020
EBITDA MARGINadjusted continuing ops1
(percent)3.00
2.50
2.00
1.50
1.002015 2016 2017 2018 2019 2020
EPSadjusted continuing ops1
(dollars)
5
2020 FINANCIAL REVIEW
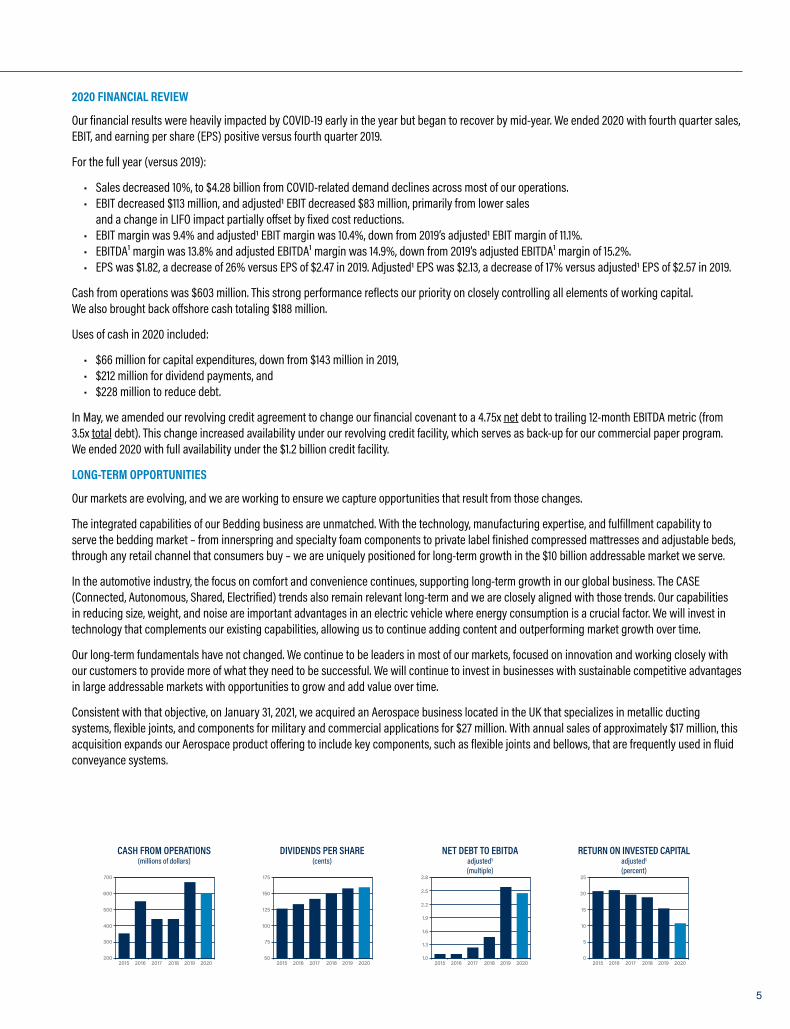
Our financial results were heavily impacted by COVID-19 early in the year but began to recover by mid-year. We ended 2020 with fourth quarter sales, EBIT, and earning per share (EPS) positive versus fourth quarter 2019.
For the full year (versus 2019):
• Sales decreased 10%, to $4.28 billion from COVID-related demand declines across most of our operations. • EBIT decreased $113 million, and adjusted1 EBIT decreased $83 million, primarily from lower sales
and a change in LIFO impact partially offset by fixed cost reductions. • EBIT margin was 9.4% and adjusted1 EBIT margin was 10.4%, down from 2019’s adjusted1 EBIT margin of 11.1%. • EBITDA¹ margin was 13.8% and adjusted EBITDA¹ margin was 14.9%, down from 2019’s adjusted EBITDA¹ margin of 15.2%. • EPS was $1.82, a decrease of 26% versus EPS of $2.47 in 2019. Adjusted1 EPS was $2.13, a decrease of 17% versus adjusted1 EPS of $2.57 in 2019.
Cash from operations was $603 million. This strong performance reflects our priority on closely controlling all elements of working capital. We also brought back offshore cash totaling $188 million.
Uses of cash in 2020 included:
• $66 million for capital expenditures, down from $143 million in 2019, • $212 million for dividend payments, and• $228 million to reduce debt.
In May, we amended our revolving credit agreement to change our financial covenant to a 4.75x net debt to trailing 12-month EBITDA metric (from 3.5x total debt). This change increased availability under our revolving credit facility, which serves as back-up for our commercial paper program. We ended 2020 with full availability under the $1.2 billion credit facility.
LONG-TERM OPPORTUNITIES
Our markets are evolving, and we are working to ensure we capture opportunities that result from those changes.
The integrated capabilities of our Bedding business are unmatched. With the technology, manufacturing expertise, and fulfillment capability to serve the bedding market – from innerspring and specialty foam components to private label finished compressed mattresses and adjustable beds, through any retail channel that consumers buy – we are uniquely positioned for long-term growth in the $10 billion addressable market we serve.
In the automotive industry, the focus on comfort and convenience continues, supporting long-term growth in our global business. The CASE (Connected, Autonomous, Shared, Electrified) trends also remain relevant long-term and we are closely aligned with those trends. Our capabilities in reducing size, weight, and noise are important advantages in an electric vehicle where energy consumption is a crucial factor. We will invest in technology that complements our existing capabilities, allowing us to continue adding content and outperforming market growth over time.
Our long-term fundamentals have not changed. We continue to be leaders in most of our markets, focused on innovation and working closely with our customers to provide more of what they need to be successful. We will continue to invest in businesses with sustainable competitive advantages in large addressable markets with opportunities to grow and add value over time.
Consistent with that objective, on January 31, 2021, we acquired an Aerospace business located in the UK that specializes in metallic ducting systems, flexible joints, and components for military and commercial applications for $27 million. With annual sales of approximately $17 million, this acquisition expands our Aerospace product offering to include key components, such as flexible joints and bellows, that are frequently used in fluid conveyance systems.
700
600
500
400
300
2002015 2016 2017 2018 2019 2020
CASH FROM OPERATIONS(millions of dollars)
175
150
125
100
75
502015 2016 2017 2018 2019 2020
DIVIDENDS PER SHARE(cents)
2.8
2.2
2.5
1.9
1.6
1.3
1.02015 2016 2017 2018 2019 2020
NET DEBT TO EBITDA adjusted1(multiple)
25
20
15
10
5
02015 2016 2017 2018 2019 2020
RETURN ON INVESTED CAPITALadjusted1(percent)

TSR FRAMEWORK
Our primary financial goal is to achieve Total Shareholder Return, or TSR2, that ranks in the top third of the S&P 500 over rolling 3-year periods. Our TSR was below the 11-14% target over the most recent 3-year period. Over those same years, the TSR of the S&P 500 at 14% was well above historical averages. As a result, our recent 3-year averages did not meet our top-third goal. For the 3-year period that ended on December 31, 2020, our TSR performance of 1% placed us in the bottom third of the S&P 500.
Revenue Growth Target: 6-9% annually on average over time, through a combination of growth from GDP (+2%), acquisitions (+2%), and the remainder coming from content and share gains that allow us to grow faster than our markets.
Margin Target: Long-term sustainable EBIT margins should be in the range of 11.5-12.5%, and EBITDA¹ margins should be in the range of 15.5-16.5%.
LONG-TERM CAPITAL PRIORITIES
Our long-term priorities for use of cash are:
1. Fund organic growth 2. Pay dividends3. Fund strategic acquisitions4. Repurchase stock with available cash
Our commitment to dividend growth has not changed. In 2020, our dividend increased for the 49th consecutive year, to an annual rate of $1.60 per share from $1.58 per share in 2019. Based on the December 31, 2020 closing share price of $44.30, the yield was 3.6%. This was one of the highest yields among the 64 companies that comprise the S&P 500 Dividend Aristocrats. With our strong cash generation, we expect to comfortably support continued dividend increases.
For the near term we are prioritizing debt repayment after funding organic growth and dividends as we continue to reduce leverage. We are making progress. We ended 2020 with net debt to trailing 12-months adjusted EBITDA¹ of 2.44x.
We expect a few small bolt-on acquisitions, expanding products or capabilities that align with long-term strategies of our businesses. Large acquisitions and share repurchases are not expected while we work to reduce debt.
Our focus on balance sheet strength and commitment to investment grade debt ratings have not changed. Maintaining this discipline helps ensure access to the credit markets at favorable interest rates and enables us to withstand economic cycles and capture investment opportunities.
OUR CULTURE AND SUSTAINABILITY
We are proud of the culture Leggett & Platt has sustained over many decades – a culture based on our commitment to Enhancing Lives through the betterment of people, communities, and the planet. We will continue to foster a culture of inclusion, diversity, and equity in which everyone is respected, valued, and has an equal opportunity to contribute, thrive, and advance. Our commitment is unwavering, and we are steadfast in maintaining our focus on building a workforce that represents the many customers we serve and the communities in which we operate around the world.
In 2021, we will issue our inaugural sustainability report to provide our stakeholders with a better understanding of our business practices as they relate to Environmental, Social, and Governance (ESG) factors. Going forward we will continually evaluate these business practices, set goals, and measure the impact of those goals.
CONCLUSION
We want to again thank our employees for their continued commitment to keeping each other safe and healthy while serving our customers and shareholders. Your flexibility, commitment, and endurance made all the difference as we navigated 2020. Your actions are the key to our success, and your efforts to overcome the many challenges that have developed are sincerely appreciated. Finally, we want to thank our customers and investors for your support and commitment.
Karl Glassman Mitch Dolloff Chairman and CEO President and COO February 24, 2021 February 24, 2021
Letter continued
6 2 TSR = (change in stock price + dividends)/beginning stock price; assumes dividends are reinvested.

7
Six-Year Financials(Dollar amounts in millions, except per share data) 2020 2019 2018 2017 2016 2015
Total Shareholder Return, or TSR (1)
L&P 3-year TSR Rank among S&P 500 (1% is best) 67% 67% 76% 56% 11% 31%
Leggett & Platt - annual TSR (9%) 47% (22%) 1% 20% 1%
S&P 500 Index - annual TSR 18% 31% (4%) 22% 12% 1%
Summary of Continuing Operations
Trade sales $ 4,280 $ 4,753 $ 4,270 $ 3,944 $ 3,750 $ 3,917
EBIT (earnings before interest and taxes) 401 513 437 468 522 487
Adjusted EBIT (2) 446 529 473 468 492 510
EBIT margin 9.4% 10.8% 10.2% 11.9% 13.9% 12.4%
Adjusted EBIT margin (2) 10.4% 11.1% 11.1% 11.9% 13.1% 13.0%
Summary of Earnings
Net earnings from continuing operations 248 334 306 294 367 328
Net earnings attributable to L&P 248 334 306 293 386 325
EPS (earnings per diluted share) from continuing operations 1.82 2.47 2.26 2.14 2.62 2.27
Adjusted EPS from continuing operations (2) 2.13 2.57 2.48 2.46 2.49 2.36
EPS (including discontinued operations) 1.82 2.47 2.26 2.13 2.76 2.28
Common Stock Data
Cash dividends declared per share 1.60 1.58 1.50 1.42 1.34 1.26
Dividend yield (based on stock price at start of year) 3.1% 4.4% 3.1% 2.9% 3.2% 3.0%
Dividend payout ratio (2) 75% 61% 60% 58% 54% 53%
End-of-year shares outstanding (millions) 132.6 131.8 130.5 131.9 133.5 135.6
Average diluted shares outstanding (millions) 135.9 135.4 135.2 137.3 140.0 142.9
Year-End Financial Position
Cash and cash equivalents $ 349 $ 248 $ 268 $ 526 $ 282 $ 253
Total assets 4,754 4,816 3,382 3,551 2,984 2,964
Long-term debt + current debt maturities 1,900 2,118 1,169 1,252 960 945
Equity 1,390 1,313 1,158 1,191 1,094 1,098
Net debt to adjusted EBITDA (2) 2.4x 2.6x 1.5x 1.2x 1.1x 1.1x
Return on invested capital (2) 10.9% 15.3% 18.9% 19.7% 21.1% 20.6%
Cash Flow Components
Net cash provided by operating activities $ 603 $ 668 $ 440 $ 444 $ 553 $ 359
Dividends paid 212 205 194 186 177 172
Capital expenditures 66 143 160 159 124 103
Acquisitions, net of cash acquired - 1,265 109 39 30 11
Stock repurchases, net 9 7 108 155 193 183
(1) TSR = (change in stock price + dividends) / beginning stock price; assumes dividends are reinvested. Company goal is to be in the top third of the S&P 500 over rolling 3-year periods.(2) For non-GAAP reconciliations, please refer to page 144.

Stock Performance
Dividend Information
8
The following graph and data table show the cumulative total shareholder return for five years (ending December 31, 2020) for Leggett & Platt, the S&P 500 Composite Index, and our Peer Group. These figures assume dividends are reinvested and are based on initial investments of $100 on December 31, 2015. The Peer Group consists of manufacturing companies that, though involved in different industries, resemble Leggett & Platt in diversification, strategy, growth objectives, acquisitiveness, customer breadth, and geographic extent.
Peer Group
Carlisle Companies (CSL)Danaher Corporation (DHR)Dover Corporation (DOV)Eaton Corporation (ETN)Emerson Electric Co. (EMR)Illinois Tool Works (ITW)Ingersoll-Rand (IR)Masco Corporation (MAS)Pentair plc (PNR)PPG Industries (PPG)
Dividend Policy
Leggett & Platt believes in consistently paying dividends, is proud of its dividend growth record, and intends to extend that record into the future. The Company targets dividend payout (over the long term) of approximately 50% of continuing operations adjusted EPS. Quarterly dividends are usually declared in February, May, August, and November, and paid about two weeks after the start of the following quarter. For 2021, the Company’s anticipated payment dates are April 15, July 15, October 15, and January 14 (of 2022).
Dividend Record
• 49 Consecutive Annual Increases (from 1971 to 2020)• Member of S&P 500 “Dividend Aristocrats”• One of highest yields among the “Dividend Aristocrats”
Dividends have been paid on the Company’s common stock each year since 1939. With $1.60 per share of declared dividends, 2020 was our 49th consecutive year of dividend growth, a record that only ten S&P 500 companies currently exceed.
Annual Dividend (cents per share)
Dec 15 Dec 16 Dec 17 Dec 18 Dec 19 Dec 20Leggett $ 100 $ 120 $ 120 $ 93 $ 137 $ 125Peers 100 119 152 137 198 245S&P 500 100 112 136 130 171 203
Cumulative Total Return
Leggett & Platt
Peer Group
S&P 500 Index$150
$200
$100
$50
$0
$250
$300
2015 2016 2017 2018 2019 2020
50
25
02000 2005 2010 2015 2020
75
100
125
175
150
Corporate InformationMailing Address:Leggett & Platt, IncorporatedP.O. Box 757Carthage, MO 64836-0757(417) 358-8131
Website: www.leggett.com
Transfer Agent and Registrar:EQ Shareowner ServicesAttn: Leggett & Platt, Inc.P.O. Box 64854Minneapolis, MN 55164-0854Phone: (800) 468-9716www.shareowneronline.com
Form 10-K:The Company’s Form 10-K is part of this document. The exhibits to the Form 10-K are available on Leggett & Platt’s website or may be obtained from Investor Relations for a reasonable fee.
Independent Registered Public Accounting Firm:PricewaterhouseCoopers LLPSt. Louis, Missouri
Annual Meeting:May 25, 2021 at 10:00 a.m. (local time) The event will be virtual.
Contacting Investor Relations:Susan R. McCoy, Senior Vice PresidentCassie J. Branscum, Senior DirectorTarah L. Sherwood, DirectorJanna M. Fields, SpecialistEmail: [email protected]: (417) 358-8131
Contacting the Board of Directors:Email: [email protected] Write: L&P Board Chair
P.O. Box 637 Carthage, MO 64836
Contacting the Audit Committee:Email: [email protected]: L&P Audit Committee
Attn: Lindsey Odaffer P.O. Box 757 Carthage, MO 64836
Phone: (888) 401-0536
Senior Executives:Karl G. Glassman Chairman, CEOJ. Mitchell Dolloff President, COO, Bedding ProductsJeffrey L. Tate Exec. VP, CFOSteven K. Henderson Exec. VP, Specialized Products and Furniture, Flooring & Textile ProductsScott S. Douglas Sr. VP, General Counsel and SecretarySusan R. McCoy Sr. VP, Investor RelationsTammy M. Trent Sr. VP, Chief Accounting Officer
Corporate Vice Presidents:Andrew C. Bender TreasurerMichael W. Blinzler Chief Information OfficerBenjamin M. Burns Business Support ServicesJennifer J. Coleman Deputy General CounselCharles P. Hutchins Chief Tax OfficerLindsey N. Odaffer Internal Audit and Due DiligenceMarcus T. Olsen ProcurementDarrel E. Wild Chief Credit Officer
Operating Vice Presidents:Jerry W. Greene, Jr. Fabric and Geo ComponentsSimon R. Prior AerospaceJay M. Thompson Adjustable BedKyle S. Williams Work Furniture
Corporate Officers
Leggett & Platt at a GlanceLeggett.com
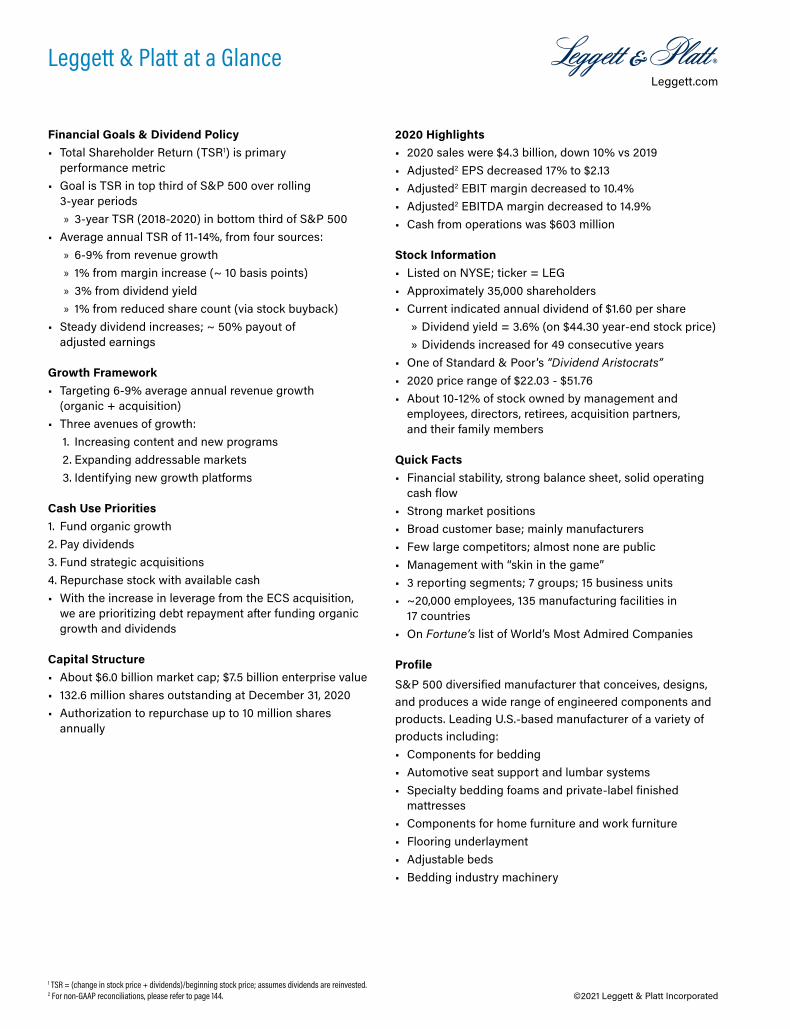
Financial Goals & Dividend Policy• Total Shareholder Return (TSR1) is primary
performance metric• Goal is TSR in top third of S&P 500 over rolling
3-year periods » 3-year TSR (2018-2020) in bottom third of S&P 500
• Average annual TSR of 11-14%, from four sources: » 6-9% from revenue growth » 1% from margin increase (~ 10 basis points) » 3% from dividend yield » 1% from reduced share count (via stock buyback)
• Steady dividend increases; ~ 50% payout of adjusted earnings
Growth Framework• Targeting 6-9% average annual revenue growth
(organic + acquisition)• Three avenues of growth:
1. Increasing content and new programs2. Expanding addressable markets3. Identifying new growth platforms
Cash Use Priorities1. Fund organic growth2. Pay dividends 3. Fund strategic acquisitions4. Repurchase stock with available cash • With the increase in leverage from the ECS acquisition,
we are prioritizing debt repayment after funding organic growth and dividends
Capital Structure• About $6.0 billion market cap; $7.5 billion enterprise value• 132.6 million shares outstanding at December 31, 2020• Authorization to repurchase up to 10 million shares
annually
2020 Highlights• 2020 sales were $4.3 billion, down 10% vs 2019• Adjusted2 EPS decreased 17% to $2.13• Adjusted2 EBIT margin decreased to 10.4%• Adjusted2 EBITDA margin decreased to 14.9%• Cash from operations was $603 million
Stock Information• Listed on NYSE; ticker = LEG • Approximately 35,000 shareholders• Current indicated annual dividend of $1.60 per share
» Dividend yield = 3.6% (on $44.30 year-end stock price) » Dividends increased for 49 consecutive years
• One of Standard & Poor’s “Dividend Aristocrats”• 2020 price range of $22.03 - $51.76• About 10-12% of stock owned by management and
employees, directors, retirees, acquisition partners, and their family members
Quick Facts• Financial stability, strong balance sheet, solid operating
cash flow• Strong market positions• Broad customer base; mainly manufacturers • Few large competitors; almost none are public• Management with “skin in the game”• 3 reporting segments; 7 groups; 15 business units• ~20,000 employees, 135 manufacturing facilities in
17 countries• On Fortune’s list of World’s Most Admired Companies
Profile
S&P 500 diversified manufacturer that conceives, designs, and produces a wide range of engineered components and products. Leading U.S.-based manufacturer of a variety of products including:• Components for bedding• Automotive seat support and lumbar systems• Specialty bedding foams and private-label finished
mattresses• Components for home furniture and work furniture• Flooring underlayment• Adjustable beds• Bedding industry machinery
©2021 Leggett & Platt Incorporated1 TSR = (change in stock price + dividends)/beginning stock price; assumes dividends are reinvested.2 For non-GAAP reconciliations, please refer to page 144.