MOVES-Matrix: Setup, Implementation, and Application · 17 emissions for a network this size using...
18
MOVES-Matrix: Setup, Implementation, and Application Randall L. Guensler, Ph.D., Professor School of Civil and Environmental Engineering, Georgia Institute of Technology 790 Atlantic Drive, Atlanta, GA 30332 TEL: 404/894-0405 Email: [email protected] Haobing Liu, Graduate Research Assistant* School of Civil and Environmental Engineering, Georgia Institute of Technology 790 Atlantic Drive, Atlanta, GA 30332 TEL: 404/426-1678 Email: [email protected] Xiaodan Xu, Graduate Research Assistant School of Civil and Environmental Engineering, Georgia Institute of Technology 790 Atlantic Drive, Atlanta, GA 30332 TEL: 404/502-0794 Email: [email protected] Yanzhi “Ann” Xu, Ph.D., Research Engineer II School of Civil and Environmental Engineering, Georgia Institute of Technology 790 Atlantic Drive, Atlanta, GA 30332 TEL: 404/723-0543 Email: [email protected] Michael O. Rodgers, Ph.D., Principal Research Scientist and Adjunct Professor School of Civil and Environmental Engineering, Georgia Institute of Technology 790 Atlantic Drive, Atlanta, GA 30332 TEL: 404/385-0569 Email: [email protected] Submitted: July 31, 2015 Word Count: 4,201 (Text) + 2,000 (8 Figures) + 750 (3 Table) = 6,951 words *Corresponding author For Presentation at the 95 th Annual Meeting of the Transportation Research Board U.S. Department of Transportation (USDOT) Disclaimer This work was supported by the U.S. Department of Transportation’s University Transportation Centers program. The contents of this paper reflect the view of the authors who are responsible for the facts and accuracy of the data presented herein. The contents do not necessarily reflect the official view or policies of the U.S. Department of Transportation or State of Georgia. This paper does not constitute a standard, specification, or regulation.
Transcript of MOVES-Matrix: Setup, Implementation, and Application · 17 emissions for a network this size using...

MOVES-Matrix: Setup, Implementation, and Application
Randall L. Guensler, Ph.D., Professor
School of Civil and Environmental Engineering, Georgia Institute of Technology
790 Atlantic Drive, Atlanta, GA 30332
TEL: 404/894-0405
Email: [email protected]
Haobing Liu, Graduate Research Assistant*
School of Civil and Environmental Engineering, Georgia Institute of Technology
790 Atlantic Drive, Atlanta, GA 30332
TEL: 404/426-1678
Email: [email protected]
Xiaodan Xu, Graduate Research Assistant
School of Civil and Environmental Engineering, Georgia Institute of Technology
790 Atlantic Drive, Atlanta, GA 30332
TEL: 404/502-0794
Email: [email protected]
Yanzhi “Ann” Xu, Ph.D., Research Engineer II
School of Civil and Environmental Engineering, Georgia Institute of Technology
790 Atlantic Drive, Atlanta, GA 30332
TEL: 404/723-0543
Email: [email protected]
Michael O. Rodgers, Ph.D., Principal Research Scientist and Adjunct Professor
School of Civil and Environmental Engineering, Georgia Institute of Technology
790 Atlantic Drive, Atlanta, GA 30332
TEL: 404/385-0569
Email: [email protected]
Submitted: July 31, 2015
Word Count: 4,201 (Text) + 2,000 (8 Figures) + 750 (3 Table) = 6,951 words
*Corresponding author
For Presentation at the 95th Annual Meeting of the Transportation Research Board
U.S. Department of Transportation (USDOT) Disclaimer
This work was supported by the U.S. Department of Transportation’s University Transportation
Centers program. The contents of this paper reflect the view of the authors who are responsible
for the facts and accuracy of the data presented herein. The contents do not necessarily reflect the
official view or policies of the U.S. Department of Transportation or State of Georgia. This paper
does not constitute a standard, specification, or regulation.

Abstract: The MOtor Vehicle Emission Simulator (MOVES) model is published by the USEPA
to estimate emissions from on-road vehicles in the United States. Traffic simulation model
outputs and smart phone GPS data can provide detailed vehicle activity information in time and
space. Coupling MOVES emission rates with various sources of high-resolution vehicle activity
data can further advance research efforts designed to assess the environmental impacts of
transportation design and operation strategies. However, the MOVES interface is complicated
and the structure of input variables and algorithms involved in running MOVES to assess
operational improvements makes the analyses cumbersome and time consuming. The MOVES
interface also makes it difficult to assess complicated transportation networks and to undertake
analyses of large scale systems that are dynamic in nature. The MOVES-Matrix system
developed by the authors can be used to conduct the same emissions modeling in a fraction of
the time, using a multidimensional array of MOVES outputs. The researchers configured
MOVES to run on a distributed computing cluster, obtaining MOVES emission rate outputs for
Atlanta for each vehicle class and model year at each operations, as a function of calendar year
2010-2020 (1-year interval) and 2025-2050 (5-year interval), local fuel (Summer fuel, Winter
fuel, and Transition fuel), local I/M, meteorology (Temperature: 10-110 F with 5F-bin; Humidity:
0%-100% with 5%-bin ), and other variables of interest. For Atlanta, MOVES was run 22,491
times to generate the speed-bin and operating mode-bin emission rate matrices. The emission
rate matrices allow users to employ big data inputs to and evaluate changes in emissions for
dynamic transportation systems in near-real-time. In the case study, emission rate generation
with MOVES-Matrix is 200-times faster than using the MOVES GUI in the same computer
environment and predicts the same emissions results.
Keywords: MOVES, MOVES-Matrix, Emission Modeling

Guensler, Liu, Xu, Xu, and Rodgers 2016 TRB Meeting
1
Introduction 1
The USEPA created MOVES to estimate emissions from on-road vehicles in the United States. 2
The “binning” approach enables MOVES to model emissions for different fleet activities. New 3
data sources have the potential to provide fleet activity information for use in emissions 4
modeling, such as GPS data from instrumented vehicles (1), traffic simulation outputs (2), and 5
cell phone tracking. Coupling MOVES emission rates with various sources of big data for 6
vehicle activity can further advance research efforts designed to assess the environmental 7
impacts of transportation design and operation strategies. Hot spot analysis and near-road air 8
quality modeling for environmental impact assessment will also benefit from the use of more 9
accurate vehicle activity data. 10
However, the MOVES interface is complicated and the structure of input variables and 11
algorithms involved in running MOVES to assess operational improvements makes the analyses 12
cumbersome and time consuming. The MOVES interface also makes it difficult to assess 13
complicated transportation networks and to undertake analyses of large scale systems that are 14
dynamic in nature. For example, the Atlanta Regional Commission (ARC) Travel Demand 15
Model employs a network of 74,500 roadway links. It is nearly impossible to dynamically model 16
emissions for a network this size using MOVES runs. Even estimating emissions of a single 17
scenario of the entire Atlanta network takes a lot effort. On a typical mid-range PC, a MOVES 18
run takes about 11 seconds to process emissions for one link for each unique environment and 19
fleet scenario. Assuming that an analyst needs to obtain a set of composite emission rates for 20
1000 roadway links in Atlanta, where the fleet composition and operating conditions differ every 21
hour on each road segment, temperatures and humidity values vary throughout the day and year, 22
and three different fuel blends are offered in a year (summer, winter, and transition), a total of 23
31,752,000 individual moves runs are required ((1000 segments)*(24 hours)*(21 temperature 24
bins, 0-100 F in 5 F-bin)*(21 humidity bins, 0%-100% in 5%-bin)*(3 Atlanta fuels)), which 25
would take a single PC more than ten years to complete. A high-performance model providing 26
the same results as the regulatory model (i.e., MOVES model) is needed for dynamic analysis of 27
large roadway networks. 28
Some studies have been done on optimizing model running speed based on the regulatory 29
emission models. Guensler et, al. (3) ran MOBILE6, the predecessor of MOVES model, tens-of-30
thousands of times to generate a matrix of emission rates (known as MOBILE-Matrix) by road 31
class, fleet composition, fuel, I/M, temperature, etc., for Metropolitan Atlanta, Georgia and 32
applied emission rates in conformity analysis and in CALINE4 dispersion model routines. The 33
emission matrices from MOBILE6 facilitated rapid analysis via scripts. With the release of the 34
more advanced MOVES model as the regulatory model replacing the MOBILE series models, it 35
would be useful to build a high-performance model that can efficiently obtain the same results as 36

Guensler, Liu, Xu, Xu, and Rodgers 2016 TRB Meeting
2
MOVES. Liu and Frey (4) developed a simplified MOVES model called MOVES-Lite based on 1
the ratio of operating mode bin as the cycle adjustment factor and the results are within 5% 2
compared with MOVES output. Using the MOVES-Matrix process introduced in this study, the 3
user can program a call of MOVES-Matrix emission rates and obtain the exactly the same 4
emission output as obtained using the MOVES model, without ever having to launch MOVES or 5
transferring MOVES outputs into the analyses. 6
7
MOVES Background 8
MOVES is the approved regulatory model released by the U.S. Environment Protection Agency 9
(EPA) for estimating emissions from the vehicle fleet. In MOVES, a “binning” approach is 10
applied where emission rate and vehicle activity module are connected through operating mode 11
bin. MOVES includes an emission database with base emission rates for each pollutant under 12
each operating mode bin, vehicle regulatory class, model year from 1960 and project to 2050, 13
and at each age level. Through internal calculations, emission rates are weighted by operating 14
mode distribution, and adjusted by air conditioning, fuel, I/M, and meteorology factors, and then 15
aggregated by using fleet composition and VMT data to obtain comprehensive fleet emission 16
rate and emission inventory. Figure 1 presents the MOVES process in project-level analysis. 17
MOVES is capable of using self-defined driving cycle and allows users to incorporate local 18
vehicle operation by importing local driving cycles and operating mode distributions directly. 19
Other refined input is also required, including meteorology, calendar year, fuel type, inspection 20
and maintenance program elements, traffic volume, fleet age distribution and vehicle type 21
distribution. 22
23
24
Figure 1. MOVES Data Processing in Project-Level 25
Guensler, Liu, Xu, Xu, and Rodgers 2016 TRB Meeting
3
Because emissions are a complex function of many locally-dependent variables, and because 1
MOVES integrates aggregation functions for emission estimation for states and counties, the 2
interface is complex and requires a lot of inputs to properly characterize a specific emission 3
scenario needed by a user. A lot of labor is required to prepare MOVES input files. In addition, 4
running MOVES is time consuming, because emission calculations always begins with base 5
emission rates, and for each run, emission data flow need to be adjusted by various indexes such 6
as temperature, humidity, fuel property, etc. This makes it difficult to use MOVES to assess 7
large-scale transportation networks that experience dynamic changes in on-road fleets and 8
operating conditions. 9
10
MOVES-Matrix Development Approach 11
The MOVES-Matrix system was created to obtain the same emissions modeling process, but in a 12
fraction of the time, by creating a multidimensional array of MOVES outputs. There are three 13
steps in preparation of MOVES-Matrix: 1) develop input files and running files for MOVES runs 14
to obtain multi-dimensional emission rates output; 2) run MOVES in advanced computing 15
cluster, and; 3) design algorithm for MOVES-Matrix. Atlanta served as the modeling test case. 16
Two MOVES-Matrix outputs were developed: 1) speed-bin MOVES-Matrix, in which MOVES 17
default driving cycles were applied, and users can just input average speed as operations; 2) 18
OpMode-bin MOVES-Matrix, in which users can input average speed and associated driving 19
schedules or operating mode distributions as operation information. The approach of developing 20
MOVES-Matrix can be easily applied in other regions. Speed-bin MOVES-Matrix can be 21
applied in regional scale analysis by linking with travel demand model. OpMode-bin Matrix can 22
be applied in project scale analysis by linking with traffic simulation or local fleet and operations. 23
24
MOVES-Matrix Inputs and Run File Development 25
MOVES-Matrix enables users to efficiently apply fleet composition data and activity data and 26
obtain emission result without spending time running MOVES because MOVES has effectively 27
been run tens of thousands of times in advance for a metro area. Individual MOVES emission 28
rate outputs are assembled in a multi dimension MOVES-Matrix emission database that includes 29
all combinations of possible emission rates scenarios. For Atlanta, we prepared a Matrix that 30
covers calendar years in intervals of 1 year from 2010 to 2020, and in intervals of 5 years for 31
2025 to 2050 (a total of 17 years, and I/M strategy applies by calendar year), for each local fuel 32
(Summer fuel, Winter fuel, and Transition fuel), meteorology (Temperature: 10-110º F with 5º F-33
bin interval, 21 bins in total; humidity: 0%-100% with 5%-bin interval, 21 bins in total). A total 34
of 22,491 scenarios need to be created for analysis (17 years *3 local fuels for each year * 21 35
temperatures * 21humidities). The 22,491 input files were prepared using a script language, and 36

Guensler, Liu, Xu, Xu, and Rodgers 2016 TRB Meeting
4
each file contain several csv files that contain input values that need to be imported into MOVES 1
input database. 2
In developing MOVES-Matrix, we noted that MOVES outputs multiple emission rate 3
elements for a single input link within each run, in about the same time that it takes to generate a 4
single composite emission rate. For each MOVES input element representing a single 5
transportation link, the user could assign a specific calendar year, road type and operating speed, 6
temperature, humidity, fuel, and I/M settings. However, in addition to the composite emission 7
rate, MOVES can output disaggregated emission rates for each vehicle source and model year 8
type (13 Source Types * 30 model years = 403) for the operational and meteorology settings 9
outlined above. Hence, we were able to obtain emission rates of various pollutants for 403 10
vehicle and model year types in a single MOVES link run. Not only are fewer runs required, but 11
significant time savings also accrue from not having to launch the model as frequently. Multiple 12
links can be applied for each MOVES run, with each link defined as a single speed bin between 13
5 mph to 77 mph for speed-bin MOVES-Matrix, or as single bin of 23 running operating mode 14
bins (5). For each link, emission rates can be further disaggregated by fuel types (e.g., diesel or 15
gasoline vehicle) when MOVES-Matrix is required to model emissions for different vehicle fuel 16
types, instead of just model vehicle emissions with mixed fuel type applied. 17
Table 1 outlines the model inputs for each independent MOVES run. From each run, 18
emission rate outputs are obtained for all criteria pollutants, GHG emissions, and energy 19
consumption for 13(source types)*31(model years) = 403 vehicle models under all operation 20
conditions (in 73 average speed bins 5-77 mph for speed-bin Matrix, or in 23 running operating 21
mode bins 0-40 OpMode-bin Matrix), for a single calendar year, fuel supply, temperature, and 22
humidity. A total of 22,491 MOVES runs are needed to obtain emissions for all combinations of 23
meteorology, fuel and calendar conditions. The researchers launched MOVES in project-level 24
mode in a computing cluster environment, allowing individual MOVES runs to be assigned to 25
the array of computer cores (multiple jobs running as batch mode). Each input file corresponded 26
to one MOVES run, and a importing xml file and a launching xml file were also created for each 27
run to allow MOVES to call relevant input files and conduct runs in batch mode. 28

Guensler, Liu, Xu, Xu, and Rodgers 2016 TRB Meeting
5
Table 1 Content of Input File for Each MOVES Run 1
Input Description
Link Speed-bin Matrix: 73 links with each link assigned one speed bin
OpMode-bin Matrix: 23 links with each link assigned one operating
mode bin
Set volume for each link as 13(source types)*31(model years) = 403
Age Distribution Set uniform age distribution (1/31 for each age group from age 0 to 30
years) for each source type
Source Type Set uniform source type distribution (1/13 for each source type) for
each link
I/M Strategy Default from MOVES, determined by calendar
Fuel Supply Default from MOVES, determined by calendar year and month
Fuel Formulation Default from MOVES, determined by fuel supply
Fuel Usage Fraction Default from MOVES
AVFT Default from MOVES
Meteorology Temperature: 10-110º F with 5º F-bin interval, 21 bins in total
Humidity: 0%-100% with 5%-bin interval, 21 bins in total
OpMode Distribution OpMode-bin Matrix: Set single 100% fraction of a specific operating
mode bin for each link. No need for speed-bin Matrix
Year and Region Year: each year in 2010-2020, 5-year intervals in 2025-2050, input in
xml and mrs file.
Region: Fulton county, Atlanta, input in xml and mrs file.
2
Fulton County can adequately represent Atlanta, because the fuel region and I/M programs of all 3
other counties in the Atlanta Metro area are the same. 4
5
PACE Computing Cluster Runs 6
As the name suggests, PACE (Partnership for an Advanced Computing Environment) is a 7
collaboration between the Georgia Tech faculty and the Office of Information Technology at 8
Georgia Tech, set up for the primary purpose of providing an environment for high performance 9
computing (6). Participating researchers can benefit from the large scale computing and storage 10
infrastructure, which is organized in the forms of shared queues. Dedicated technical services are 11
provided to manage the hardware and software infrastructure for the cluster. Participating faculty 12
members purchase additional nodes and storage through research funding, which are prioritized 13
for their use by the PACE system by managing user priorities over each shared queue. On its 14
largest shared queue, PACE manages around 22,450 cores, with over 1 Petabyte of online 15
Guensler, Liu, Xu, Xu, and Rodgers 2016 TRB Meeting
6
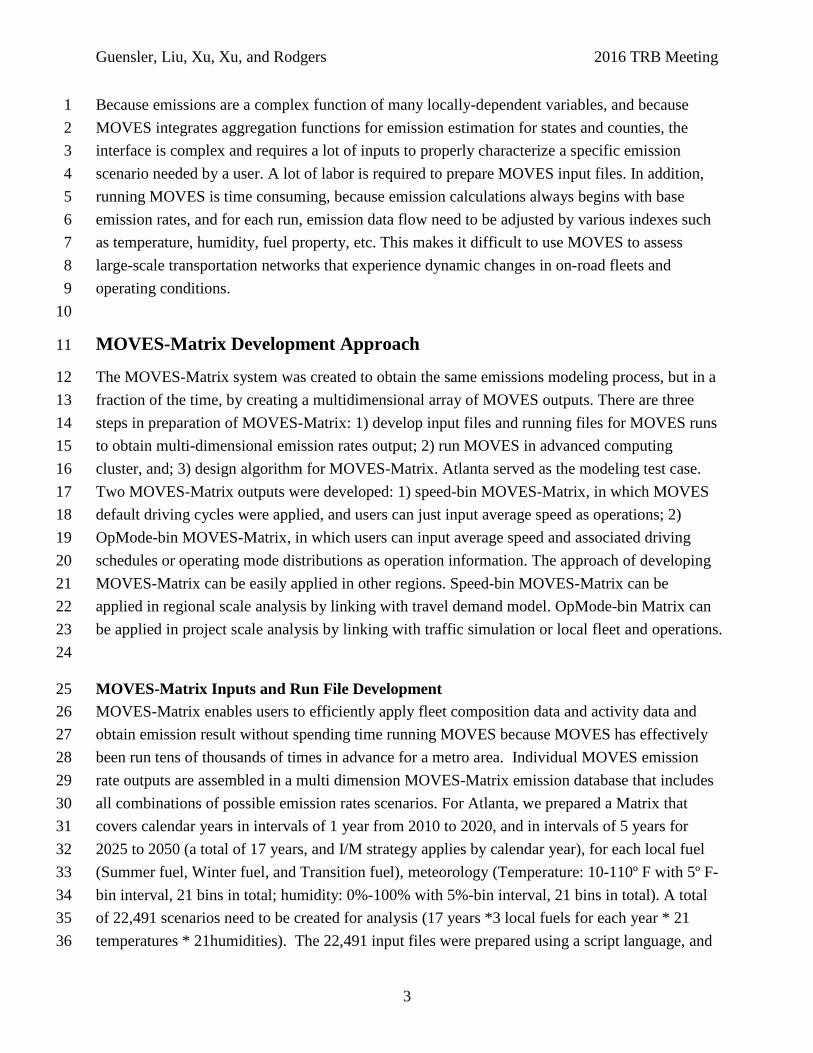
commodity storage, and nearly 300 terabytes of high-performance scratch storage. PACE nodes 1
(each machine is called a node) are divided into two types: 2
Head Nodes – All PACE users have access to these head nodes. These nodes must be used to 3
launch jobs. No computation is performed on these nodes. 4
Cluster Nodes – These nodes are where the actual jobs run. A user has access to a particular 5
cluster node only during the time the user’s job is running on the cluster. Various MOVES 6
runs were conducted on the cluster nodes. 7
8
Figure 2 provides an overview of MOVES launch design in PACE. The programming team 9
created a cluster job launch program in Python to: 1) install MOVES and MySQL into the RAM 10
of each cluster node; 2) launch MOVES jobs in batch mode at each not, and 3) output the 11
emission rates. The number of jobs grouped together per node is based upon the maximum 12
completion time allowed by PACE for each job. For example, if the maximum completion time 13
is 6 hours, and each job takes about 25-30 minutes, then we group 6-hours/0.5-hour = 12 jobs 14
and run the batch mode in a single node. PACE Persistent Storage (PPS) is used to store all input 15
files created by the input file generator for use by MOVES. Once each MOVES run is completed, 16
the output would to delivered to PPS through the job launch program, and we copied the output 17
to external storage. 18
19
20
Figure 2. MOVES Launch Design on PACE 21
22

Guensler, Liu, Xu, Xu, and Rodgers 2016 TRB Meeting
7
Figure 3 presents MOVES process flow in PACE. When a MOVES job was launched on a 1
cluster machine, it first installed MOVES on the machine by unzipping the MOVES source files 2
on the disk. A thin version of MySQL is installed on the server by unzipping its files onto the 3
disk and starting the SQL server on an available port. MOVES command line Java processes 4
were then launched to create input and output database files respectively. MOVES then launched 5
jobs based on input and obtained output. After each job is completed, the output files are zipped 6
stored on the PACE persistent storage. 7
8
9
Figure 3. MOVES Process Flow in PACE 10
11
Depending on the overall usage load, PACE would assign a certain number of nodes to each 12
PACE users. We usually obtained 20 nodes for MOVES running. For speed-bin Matrix, each run 13
took MOVES 30 minutes, so it would take in total of (22,491 runs)*(0.5hour/run)/(20 14
nodes)/(24hours/day), i.e., 23.5 days to finish all runs for the multi dimension emission database 15
of Atlanta speed-bin Matrix. For OpMode-bin Matrix, each run took MOVES 15 minutes, so in 16
total, it would take about (22,491 runs)*(0.25 hour/run)/(20 cores)/(24 hours/day), i.e., 12 days to 17
finish all runs for the database of Atlanta OpMode-bin Matrix. Hourly e-mail notifications were 18
sent to report the status of completed jobs for checking convenience. When an unfinished job 19
was detected, the team would launch them in another round. 20
21
MOVES-Matrix Design and Algorithm 22
In designing MOVES-Matrix, it was important to first assess model user habits. Real-world 23
applications of MOVES for emission inventory development or project-level conformity 24
analyses always use a variety of simplification approaches to limit the number of MOVES runs 25
that will be required. For example, analysts often assume that fleet composition does not vary 26

Guensler, Liu, Xu, Xu, and Rodgers 2016 TRB Meeting
8
(using a default regional registration mix for model years and technology groups) with heavy-1
duty truck fractions quantized in specific percentages by road class (e.g., 0% or 1% on certain 2
local roads and arterials and 3% or 5% on certain freeways). Planning inventories might also 3
assume a single temperature, humidity, and fuel. Every time another transportation scenario 4
needs to be assessed, a new set of emission rates (e.g., new meteorology or fuel scenario) needs 5
to be developed for MOVES and connected with activity data. 6
Based on typical application, the MOVES-Matrix emission database was grouped into 7
22,491packages, with each package storing emission rates for all source types, all source model 8
years, and in all operations (speed bins or operating mode bins), for specific calendar year, 9
month, temperature, humidity, fuel supply (determined by year and month), and I/M strategy 10
(determined by year). Figure 4 provides an overview of emission data structure in MOVES-11
Matrix. A small package (cells package in the figure) of emission rates were extracted based on 12
user’s year, month, and meteorology input, and the emission rates were used to connect to 13
vehicle activity data through MOVES-Matrix algorithm. This conforms to emission analysis of 14
different strategies and sensitivity analysis, given that users tended to assume a single 15
temperature, humidity, and fuel, and try to explore the traffic activity impact and hence effect to 16
emissions. This structure was a contribution that helped speed up the emission generation 17
process, because MOVES-Matrix emission rate searches only need to access a sub-matrix 18
(package). In Figure 4, each cell grabs applicable emission rate, and emission rates need to be 19
weight by onroad activity (per cell) to assemble fleet emission rates. 20
21
22
Figure 4. Emission Database Structure of MOVES-Matrix 23

Guensler, Liu, Xu, Xu, and Rodgers 2016 TRB Meeting
9
After sub-matrix of emission rates is identified and accessed, the emission rate processing is very 1
similar to the MOVES algorithms used in project-level modeling. MOVES-Matrix weighted 2
emission rate source type age distribution to obtain comprehensive emission rate by each source 3
type and by each operation bin. Source type distribution, operations, and VMT provided by each 4
link are used to connect with source type emission rates and calculate emission rate and emission 5
inventory for each link. The functions of emission rate and emission inventory are: 6
7
𝐸𝑚𝑖𝑠𝑠𝑖𝑜𝑛 𝑅𝑎𝑡𝑒 = ∑ ∑ ∑
𝑠𝑜𝑢𝑐𝑒𝑇𝑦𝑝𝑒% × 𝑚𝑜𝑑𝑒𝑙𝑌𝑒𝑎𝑟%𝑠𝑜𝑢𝑐𝑒𝑇𝑦𝑝𝑒
× 𝑜𝑝𝑀𝑜𝑑𝑒%𝑠𝑜𝑢𝑐𝑒𝑇𝑦𝑝𝑒,𝑚𝑜𝑑𝑒𝑙𝑌𝑒𝑎𝑟
× 𝐸𝑚𝑖𝑠𝑠𝑖𝑜𝑛𝑠𝑜𝑢𝑐𝑒𝑇𝑦𝑝𝑒,𝑚𝑜𝑑𝑒𝑙𝑌𝑒𝑎𝑟,𝑜𝑝𝑀𝑜𝑑𝑒𝑜𝑝𝑀𝑜𝑑𝑒𝑚𝑜𝑑𝑒𝑙𝑌𝑒𝑎𝑟 𝑠𝑜𝑢𝑟𝑐𝑒𝑇𝑦𝑝𝑒
8
9
𝐸𝑚𝑖𝑠𝑠𝑖𝑜𝑛 𝐼𝑛𝑣𝑒𝑛𝑡𝑜𝑟𝑦 = 𝑉𝑀𝑇 × 𝐸𝑚𝑖𝑠𝑠𝑖𝑜𝑛 𝑅𝑎𝑡𝑒 10
11
Figure 5 presented data processing of MOVES-Matrix. Because the individual emission rates in 12
MOVES-Matrix were already adjusted by fuel, meteorology and I/M strategy, there is no 13
adjustment calculation involved, which further speeds up the emission generation process. 14
15
16
Figure 5. MOVES-Matrix Data Processing 17
18
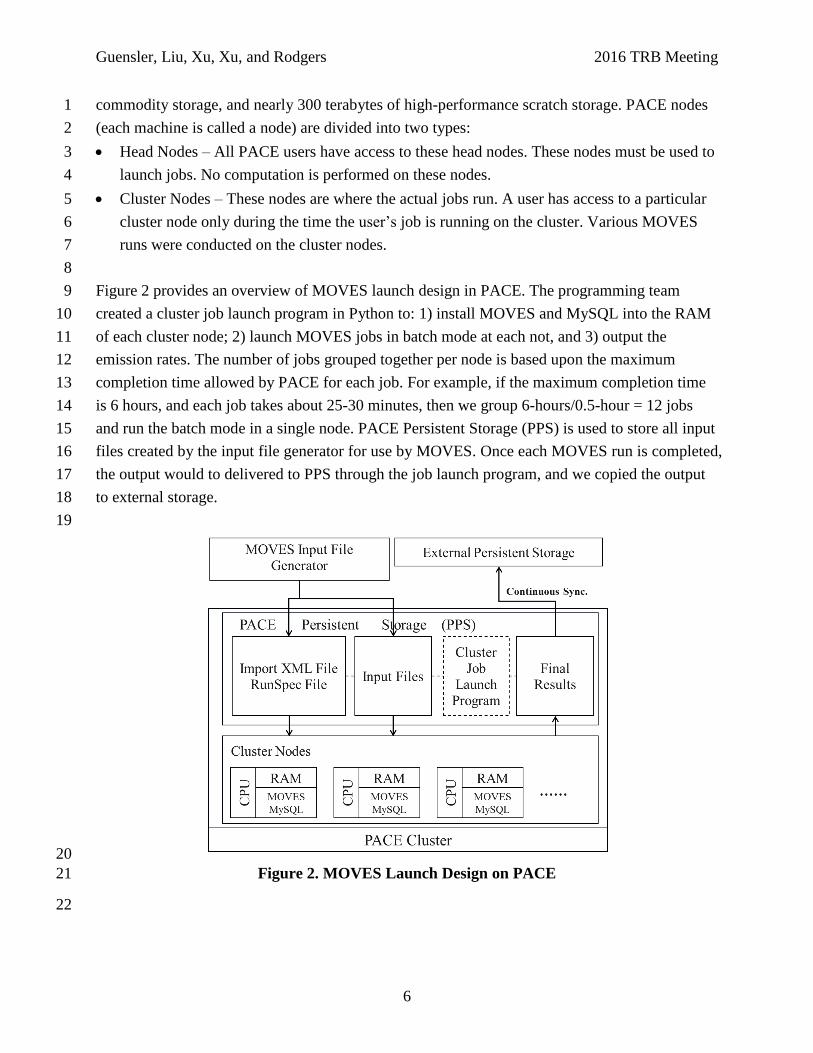
Figure 6 compared MOVES with MOVES-Matrix in terms of overall working mechanism. 19
MOVES begins from base emission rate and these rates need to be adjusted for each run before it 20
is connected to activity data. MOVES-Matrix stores adjusted emission rates for all scenarios, and 21
Guensler, Liu, Xu, Xu, and Rodgers 2016 TRB Meeting
10
for scenario of interest. MOVES-Matrix filtered the emission rates in the specific scenario rather 1
than doing adjustment calculation. In summary, there are two characteristics in terms of design 2
that contributed fast running speed in MOVES-Matrix. 3
4
Directly applying emission rates that have already been adjusted by fuel, meteorology and 5
I/M strategy, in which there is no further adjustment calculation within MOVES-Matrix. 6
Packaging the emission matrix (database) by calendar year, fuel scenario, and meteorology, 7
and filtering the emission rates sub-matrix in the specific scenario of interest, narrows the 8
emission rate search process and speeds up the emission assignment process. 9
10
11
Figure 6. MOVES vs. MOVES-Matrix Working Mechanism 12
13
MOVES-Matrix Application Test 14
We developed speed-bin Matrix and OpMode-bin Matrix for Atlanta. To demonstrate the 15
effectiveness and efficiency of MOVES-Matrix, the researchers developed a set of comparative 16
test runs to compare the performance of MOVES-Matrix with the MOVES GUI for results 17
values and run speeds. Table below listed the coverage of Atlanta MOVES-Matrices, and total 18
emission rates values. 19
20

Guensler, Liu, Xu, Xu, and Rodgers 2016 TRB Meeting
11
Table 2 Coverage of Atlanta Speed-bin and OpMode-bin Matrix 1
Index Speed-bin Matrix OpMode-bin Matrix
Calendar year 2010-2020 (1-year interval)
2025-2050 (5-year interval)
2010-2020 (1-year interval)
2025-2050 (5-year interval)
Fuel type
Winter (Nov - March),
Summer (May - September)
Transition (April, October)
Winter (Nov - March),
Summer (May - September)
Transition (April, October)
Source types all 13 source types all 13 source types
Age age 0~30 years age 0~30 years
Temperature 0F - 110F (5F bins interval) 0F - 110F (5F bins interval)
Humidity 0% - 100% (5% bins interval) 0% - 100% (5% bins interval)
Road type urban restricted access (highway)
urban un-restricted access (local) not applicable
Operation 5-77 mph, 1mph speed bins 23 running operating mode bins
Pollutant HC, CO, NOX, CO2, CH4, CO2e*,
PM10, PM2.5, Energy
HC, CO, NOX, CO2, CH4, CO2e*,
PM10, PM2.5, Energy
# of emission
rates 41 billion 5.4 billion
# of emission
packages 22,491 22,491
*GHGs emissions in CO2 equivalent (CO2_e) in 100 years lifetime. 2
3
Result Validation 4
Because MOVES is the official regulatory emissions model, it is important that results from 5
implementing MOVES-Matrix match the results obtained by the MOVES model. This section 6
set several links with multi combination of fleet composition and operations, and emissions of 7
these links were run in MOVES and MOVES-Matrix. Results were compared to assess MOVES-8
Matrix performance. 9
10
Speed-bin Matrix 11
The team created 120 links with 60 of them are restricted access roads (freeways) and 60 are un-12
restricted access roads (local roads). Each link were randomly assigned VMT, fleet composition, 13
and average speed inputs (in range of 5-75 mph). Calendar year is set to 2012 with a summer 14
fuel supply. Temperature is set as 75F, and humidity is set as 80%. HC, CO, NOX, CO2, CH4, 15
CO2e, PM10, PM2.5 and energy were generated and compared. The 120 links were run using both 16
the speed-bin Matrix and MOVES GUI, and compared rates for all pollutants and energy. The 17

Guensler, Liu, Xu, Xu, and Rodgers 2016 TRB Meeting
12
speed-bin Matrix results equal the results from MOVES GUI (difference<=0.0001%). Figure 7 1
presented the comparison of CO2 emissions from MOVES and MOVES-Matrix. 2
3
OpMode-bin Matrix 4
To test the OpMode-bin Matrix, the team created 30 links. Each link randomly assigned a set of 5
VMT, fleet composition, average speed (in range of 5-75 mph) and associated operating mode 6
distribution. To match the speed-bin Matrix test, calendar year is set to 2012 with a summer fuel 7
supply. Temperature is set as 75F, and humidity is set as 80%. HC, CO, NOX, CO2, CH4, CO2e*, 8
PM10, PM2.5 and energy were generated and compared. The emission rates for all pollutants and 9
energy consumption were compared, and the results from OpMode-bin Matrix are equal to the 10
results from MOVES GUI for each link (difference<=0.0001%). Figure 8 shows the comparison 11
of CO2 emissions from MOVES and MOVES-Matrix. 12

Guensler, Liu, Xu, Xu, and Rodgers 2016 TRB Meeting
13
` 1
Figure 7. Emission Results from MOVES and Speed-bin MOVES-Matrix 2
3
4
Figure 8. Emission Results from MOVES and OpMode-bin MOVES-Matrix 5
6

Guensler, Liu, Xu, Xu, and Rodgers 2016 TRB Meeting
14
MOVES-Matrix Run Time 1
In addition to results, we also compared model running time between MOVES GUI and 2
MOVES-Matrix. The two models are set and run in the same computer with configuration of 3
Intel(R) Xeon(R) CPU W3550 @3.07GHz, windows 7 64-bit, RAM: 6 GB. Based on the same 4
data input and number of tasks, the authors recorded the total running time for these runs in 5
MOVES GUI and MOVES-Matrix. The comparison is shown as table below. 6
7
Table 3 Model Running Time Comparison 8
Model
Running 120 links in
Speed-bin Matrix
Running 30 links in
OpMode-bin Matrix
Run Time Run Speed* Run Time Run Speed*
MOVES GUI 24.25 minutes 2.42 seconds 8.3 minutes 3.35 seconds
MOVES-Matrix 12 seconds 0.02 seconds 4 seconds 0.026 seconds
* Running speed refers that average time to generate emission value for one pollutant in one link. 9
10
In this case, MOVES-Matrix is observed to save a lot of running time relative to MOVES GUI. 11
The 120 Speed-bin Matrix runs took the MOVES GUI 24 minutes to complete, while it took 12
MOVES-Matrix only 2.42 seconds. The 30 OpMode-bin Matrix runs took MOVES GUI 8.3 13
minutes to complete, while it took MOVES-Matrix only 3.35 seconds. The fast calculation speed 14
of MOVES-Matrix provides a potential platform to utilize newer and bigger datasets and conduct 15
dynamic emission modeling. 16
17
Discussion 18
This study introduced MOVES-Matrix, a high-performance emission modeling system. The 19
MOVES-Matrix database for Atlanta was constructed from tens of thousands of MOVES runs. 20
The scenario runs demonstrate that MOVES-Matrix can finish the emissions computation tasks 21
200 times faster than using the MOVES GUI and the generated results were exactly the same. In 22
addition to its high-performance in calculation speed, we believe there are also other benefits 23
below in applying MOVES-Matrix: 24
25
1) MOVES emission rates are employed directly for MOVES-Matrix (no code modification, 26
use of correction factors, or any approximations are employed); 27
2) In project-level emissions analysis, users usually assume a single temperature, humidity, and 28
fuel, and estimate the emissions impact of the changes in vehicle operations and fleet 29

Guensler, Liu, Xu, Xu, and Rodgers 2016 TRB Meeting
15
composition. Because the database is organized into multi packages, and each was applied in 1
specific meteorology and year, MOVES-Matrix fits the users’ work scheme, and allows users 2
to conveniently assess impacts of changes in onroad operating conditions and fleet 3
composition; 4
3) The algorithm of MOVES-Matrix can be realized in Java, Python, Perl or any similar 5
program; 6
4) Scripts in MOVES-Matrix can be programed to link travel demand for regional scale analysis, 7
traffic simulation for project scale analysis, and dispersion models with applicable MOVES 8
emission rates; 9
5) Because the emission database of MOVES-Matrix is based on MOVES output, MOVES-10
Matrix is an open source system. The authors plan to build an online version of MOVES-11
Matrix to allow users to implement emission analysis without running MOVES. 12
13
For regional-scale scenarios involving large amount of (e.g., 74,500 in Atlanta) roadway links, 14
we recommend users to identify fleet composition by road type and traffic analysis zones. Link 15
speed and volume could be obtained from travel demand model based on dynamic traffic 16
assignment. MOVES-Matrix supports batch mode process and enable multi task runs just like 17
how MOVES model works. Each task specifies a single calendar year, meteorology, fuel supply, 18
and fleet model year distribution. Links levels that has the same fleet compositions could be 19
grouped in the same task. In that way, users should be able to obtain emission rate for all speed 20
level and for required fleet composition under multi calendar years and meteorology scenarios. 21
These emission rates are then mapped with links based on traffic analysis zone and link speed, 22
and multiplied by volume to obtain fuel and emission inventory for each link. We are conducting 23
a research on MOVES-Matrix connection with travel demand model, which could serve as a 24
guideline of MOVES-Matrix application in regional scale. 25
Overall, the development of MOVES-Matrix makes the involvement of large scale of traffic 26
activity data in emission modeling easier, and especially, makes real-time or near real-time 27
modeling possible. 28
29
Acknowledgement 30
This work was sponsored by the USDOT’s University Transportation Center program via the 31
National Center for Sustainable Transportation. We would also like to thank Mehmet Belgin in 32
Georgia Tech’s PACE Center for his distributed computing technical support. The team also 33
thanks computer science graduate student Ravikant Gupta for his programming support. 34
35

Guensler, Liu, Xu, Xu, and Rodgers 2016 TRB Meeting
16
Reference 1
1. Liu, H., X. Chen, Y. Wang, and S. Han. (2013). Vehicle Emission and Near-Road Air 2
Quality Modeling for Shanghai, China Based on Global Positioning System Data from Taxis 3
and Revised MOVES Emission Inventory. Transportation Research Record: Journal of the 4
Transportation Research Board. 5
2. Xu, X., H. Liu, Y. Xu, M. Hunter, and R. Guensler. Estimating Vehicle Emissions for 6
Microscopic Simulation Model with MOVES Matrix. Manuscript submitted to the 95th TRB 7
Annual Meeting. 8
3. Guensler, R., K. Dixon, V. Elango, and S. Yoon (2004). “MOBILE-Matrix: Georgia 9
Statewide MTPT Application for Rural Areas.” Transportation Research Record. Number 10
1880. pp. 83-89. National Academy of Sciences. Washington, DC. 2004. 11
4. Liu, B., and H.C. Frey. (2012). Development and Evaluation of a Simplified Version of 12
MOVES for Coupling with a Traffic Simulation Model. Annual Meeting of the Air & Waste 13
Management Association, San Antonio, TX, June 19-22, 2012. 14
5. USEPA. (2010). Development of Emission Rates for Light-Duty Vehicles in the Motor 15
Vehicle Emissions Simulator MOVES2010. EPA-420-R-11-011. Retrieved from: 16
http://www.epa.gov/otaq/models/moves/documents/420r11011.pdf 17
6. PACE (Partnership for an Advanced Computing Environment) in Georgia Tech. Retrieved 18
from: http://pace.gatech.edu/ 19