Movement in the Matrix: pollination and dispersal ...
138
Movement in the Matrix: pollination and dispersal processes in a tropical coffee and forest landscape mosaic by Shalene Jha A dissertation submitted in partial fulfillment of the requirements for the degree of Doctor of Philosophy (Ecology and Evolutionary Biology) in The University of Michigan 2009 Doctoral Committee: Professor John H. Vandermeer, Co-Chair Assistant Professor Christopher W. Dick, Co-Chair Professor Ivette Perfecto Associate Professor Beverly J. Rathcke
Transcript of Movement in the Matrix: pollination and dispersal ...

Movement in the Matrix: pollination and dispersal processes in a tropical coffee and
forest landscape mosaic
by
Shalene Jha
A dissertation submitted in partial fulfillment
of the requirements for the degree of
Doctor of Philosophy
(Ecology and Evolutionary Biology)
in The University of Michigan
2009
Doctoral Committee:
Professor John H. Vandermeer, Co-Chair
Assistant Professor Christopher W. Dick, Co-Chair
Professor Ivette Perfecto
Associate Professor Beverly J. Rathcke


© Shalene Jha
2009

ii
I would like to dedicate this thesis to my mother and father who, from my earliest days,
have suffered through innumerable bedroom bug-collections, terrariums, and windowsill
gardens. With their limitless encouragement and patience, they single-handedly fueled
my love for science. They have been my greatest supporters, through all of my
ecological-endeavors, even when it meant months abroad and a long hike to the nearest
phone. I can never thank them enough for their unconditional love and support.

v
Table of Contents
Dedication .......................................................................................................................... ii
Acknowledgements ........................................................................................................... iii
List of Tables .................................................................................................................... vi
List of Figures .................................................................................................................. vii
Abstract ............................................................................................................................. ix
Chapter
I. Introduction .........................................................................................................1
II. Foraging patterns of Africanized honeybees and native bees and wasps in a
tropical agroforestry landscape ...........................................................................9
III. Contrasting bee foraging on coffee in response to resource scale and local
habitat management ..........................................................................................31
IV. Local agroforestry landscapes mediate bee community composition ..............52
V. Isolation and characterization of nine microsatellite loci for the tropical
understory tree Miconia affinis Wurdack (Melastomataceae) ..........................87
VI. Shade coffee farms promote the genetic diversity of native trees ....................93
VII. Extensive plant gene flow mediated by native bees across a shade coffee
landscape mosaic ..............................................................................................101
VIII. Conclusion ........................................................................................................112

vi
List of Tables
Tables
2.1 We utilized an Analysis of Covariance to measure the influence of all covariates
and factors on the number of visiting insects for each foraging group .....................22
3.1 Pearson correlation coefficient matrix of floral resources at bush, 5 m, 10 m, and
100 m scales. .............................................................................................................42
3.2 Results of repeated-measures ANCOVA, testing the effects of floral resource
levels (at 10m scale), cloud cover, temperature, distance to the forest, vegetation
management (high or low-shade coffee), and bee group (honeybees, native social
bees, native solitary bees) on the number of bee visits per observation period. .......43
3.3 Species present in high-shade coffee (HSC) and low-shade coffee (LSC)
agroforestry habitats and their functional group (FG), classified as an Africanized
honeybee (AHB), native solitary bee (NSOL), or native social bee (NSOC). .........44
4.1 Local seasonal agroforestry characteristics at each study site. ................................68
4.2 Species list of overstory trees (OT), overstory trees in flower (OTF) and
understory plants in flower (UPF) recorded over the 12 week sampling period. .....69
4.3 Species list of bees captured over the 12 week sampling period. Individuals
listed as a „msp. MX#‟ did not match any species within reference collections
while „msp. # (T.G.)‟ matched individuals within reference collections. Nesting
(Nest) and Sociality (Soc) type are indicated as follows: ground (g), cavity (c),
wood (w), social (x) and solitary (o). ........................................................................70
5.1 Forward (F) and reverse (R) sequences with fluorescent dye label (used for
genotyping), repeat motifs, annealing temperatures in °C (Ta), number of alleles
(Na), allelic size range in bp (Size Range), observed heterozygosity (HO),
expected heterozygosity (HE), and GenBank Accession number (Ac. No.) for nine
microsatellite loci for Miconia affinis .......................................................................91
6.1 Number of M. affinis individuals (N), allelic richness (A), expected
heterozygosity (HE), and observed heterozygosity (HO)...........................................96
vii
List of Figures
Figures
2.1 Map of the study region with concentric circles indicating feeder locations at 400
m, 500 m, 600 m, and 800 m from the apiary, upon which nectar feeders were
randomly placed in each habitat. ..............................................................................23
2.2 Species richness of plants flowering and light levels in each habitat and across
the experimental season. ...........................................................................................24
2.3 Mean number of visits in the two coffee habitats on day one and day two for
Africanized honeybees (a-b) native social bees (c-d) native solitary vespid wasps
(e-f) and native solitary bees (g-h) ............................................................................25
2.4 Visitation over the 8-wk experimental period for all visitor groups (a-d). ..............26
3.1 Species richness of bee visitors in high-shade coffee (HSC) and low-shade coffee
(LSC) habitats. ..........................................................................................................45
3.2 Visitation was significantly higher in high-shade coffee habitats (HSC) than low-
shade habitats (LSC) for (A) native solitary bees, (B) native social bees, and (C)
Africanized honeybees. ...........................................................................................46
3.3 Contrasting responses of native and exotic bees under differing habitat
management styles. ...................................................................................................47
4.1 Study sites in Nueva Alemania, a region in the southern portion of the state of
Chiapas, outlined in black within the inserted map of Mexico.................................72
4.2 Photo of one study site, Finca Irlanda, where flowering coffee bushes line the
understory, and shade trees fill the canopy. ..............................................................73
4.3 Observed species accumulation curve reaching 46 species. ....................................74
4.4 Bees are more abundant and their communities are more species rich in habitats
with a greater number of tree species (linear regression for illustration). ................75
4.5 Bee community composition across a gradient of (A) tree species and (B) local
forest cover................................................................................................................76
4.6 Optimal regression trees for (A) solitary bees and (B) social bees..........................77
4.7 Optimal regression trees for each bee tribe, (A) Halictini, (B) Augochlorini, and
(C) Ceratinini.. ..........................................................................................................78
4.8 Optimal regression trees for each nesting guild, (A) cavity-nesting bees, (B)
wood-nesting bees, and (C) ground-nesting bees... ..................................................79
6.1 (A , B) Spatial autocorrelation diagrams showing kinship coefficient Fij (solid
lines) averaged across all pair wise comparisons within distance categories. ..........97
7.1 Study region in Chiapas, Mexico, where M. affinis individuals in forest and
coffee habitats are labeled as green and brown squares, respectively. ...................105
7.2 (A) Bee visitation to M. affinis in forest (green) and coffee (brown) habitats and
photos (top to bottom) of the native solitary bee Xylocopa tabaniformis,

viii
tabaniformis, native social bee Trigona fulviventris, and exotic social bee Apis
mellifera scutellata..................................................................................................106
7.3 Pollen dispersal patterns for M. affinis mothers in (A) forest and (B) coffee
habitats (photo of M. affinis mother in each habitat) in 100m binned distance
categories. ...............................................................................................................107

ix
ABSTRACT
Movement in the Matrix: pollination and dispersal processes in a tropical coffee and
forest landscape mosaic
by
Shalene Jha
Co-Chairs: John H. Vandermeer and Christopher W. Dick
Despite efforts at conservation, tropical forests continue to face destruction, threatening
many tropical tree species, especially those that depend on a narrow guild of pollen and
seed dispersers. My dissertation investigates essential pollen and seed dispersal
processes for Miconia affinis (Melastomataceae), a native bee-pollinated tree that
primarily inhabits tropical forests, but can be found as a colonist in shade coffee systems.
I quantified bee diversity, foraging behavior, and pollination success of M. affinis in
different coffee plantations and determined that honeybee visitation was significantly
higher and ambient fruit set was significantly lower for M. affinis in coffee habitats
compared to forest habitats. I found that native bees and exotic bees exhibited
contrasting foraging patterns in response to coffee management style and foraging scale,
and that native bees were more abundant and diverse in coffee farms with greater
overstory tree diversity. Using eight microsatellite loci, I conducted molecular analyses
that revealed recent colonization of coffee fields by M. affinis from four sources. Levels
of allelic richness and heterozygosity in forest and coffee habitats were high. Forest
populations showed strong spatial genetic structure at the 100 and 200m distance class,
while no spatial genetic structure was detected in the coffee habitats. Molecular-based
pollen dispersal analyses revealed long-distance pollen movement across the landscape
(up to 1800 m) with extensive dispersal between coffee and forest habitats. Overall,
these results provide strong evidence that shade coffee farms can serve as permeable
habitat matrices for critical native plant pollinators and seed dispersers.

1
Chapter I: Introduction
The world‟s tropical forests continue to face habitat destruction and fragmentation,
largely due to human-driven land use change (Laurance 1998, Geist and Lambin 2002).
The result is a loss in both floral and faunal biodiversity, which can lead to a breakdown
in ecological processes within the landscape (Redford 1992, Daily 1997, Bawa et al.
2004, Wright 2005, Ricketts et al. 2008). This loss of faunal biodiversity can severely
impact tropical trees, in particular, because most tropical trees require animals to disperse
their pollen and seeds (reviewed in Bawa 1990, 1992, Levey et al. 2002, Dick et al.
2008). Reproductively specialized tropical trees, those which are dependent on a narrow
guild of pollen and seed dispersers, may be particularly vulnerable to habitat alteration,
yet little is known about their ecology (Ashworth et al. 2004, Aguilar et al. 2006, Jones
and Muller-Landau 2008). My dissertation examines how forest fragmentation and
agricultural land use affect pollinators, seed dispersers, and pollen and seed dispersal
processes in a widespread but understudied tropical habitat: the coffee and forest
landscape mosaic. Specifically, my research investigates the pollination ecology,
population genetics, and gene flow processes for the buzz-pollinated neotropical tree,
Miconia affinis (Melastomataceae).
My dissertation is divided into six studies (chapters), all of which examine
ecological processes within shade coffee farms and forest fragments in Chiapas, Mexico.
The second and third chapters explore the foraging patterns of native and exotic bees
within coffee agroforestry systems. The fourth chapter examines the impact of local and
regional agroforestry management on native bee communities. The fifth chapter briefly
describes the development of microsatellite primers for M. affinis. The sixth and seventh
chapters explore pollen and seed mediated gene flow (respectively) as revealed by
microsatellite based molecular analyses. The last chapter is a synthesis of my thesis
research and discusses the broader impacts of the work.

2
Chapter II: Foraging patterns of Africanized honeybees and native bees and wasps
in a tropical agroforestry landscape
Recent studies examining the influence of Africanized honeybees on native bee foraging
patterns have presented conflicting findings (Robertson et al 1989, Butz-Huryn 1999,
Paini 2004). While some studies suggest that Africanized honeybees physically attack
native bees, exhibiting „interference competition‟, others posit that Africanized
honeybees only exhibit „resource competition‟, by foraging on the most productive
patches in the community, thus eliminating these high resource sites for use by native
bees (Schaffer et al 1979, 1983, Ginsberg 1983).
Though both ecological and temporal factors can influence bee foraging patterns
(e.g., Kunin 1997, Steffan-Dewenter et al. 2002, Veddeler et al. 2006), no studies have
yet examined whether competitive foraging interactions between native and invasive bees
vary with habitat composition. In this study we examined how environmental and
temporal factors affect the foraging patterns of Africanized honeybees, native bees, and
native wasps. We measured the visitation of native and exotic bees and wasps at nectar
feeders within coffee systems, in order to determine the role of vegetation management,
light and floral resource levels, and recruiting ability in predicting the abundance of each
foraging group.
Chapter III: Contrasting bee foraging on coffee in response to resource scale and
local habitat management
Pollination is a potentially vulnerable ecological interaction that merits close examination
in coffee agroforestry systems, where pollination can significantly improve coffee bush
yield (Klein et al. 2003b, Ricketts et al. 2004). Furthermore, the foraging patterns of
native and exotic bees can critically influence coffee pollination success, since exotic
Africanized honeybees may dominate floral resources and may not provide pollinator
services comparable to native bees (Aizen and Feinsinger 1994, reviewed in Butz-Huryn
1997). It is hypothesized that two main factors drive the foraging patterns of native and
exotic bees: food resource availability (e.g., Totland and Matthews 1998, Westphal et al.

3
2003, Veddeler et al. 2006) and habitat composition (e.g., Steffan-Dewenter et al. 2002,
Klein et al. 2003c, Ricketts et al. 2008).
While coffee flower resource availability and agroforestry management can both
potentially mediate native and exotic bee foraging patterns, the impacts of these factors
have never been simultaneously analyzed. In this study, we measured the amount of
flowering coffee available at multiple spatial scales within two distinct agroforestry
habitat types (high-shade and low-shade coffee) and recorded visits to coffee flowers,
documenting bee species, visit duration and visit frequency. This study is the first to
examine whether foraging patterns of native bees and exotic honeybees differ in response
to floral resource level and scale, and in response to local agroforestry management.
Chapter IV: Local and regional agroforestry landscapes mediate bee community
composition
Given our dependence on animal-pollinated crops, it is increasingly urgent to understand
how to best support diverse bee communities within agricultural systems. Approximately
35% of the global food supply relies on pollinator-dependent plants (Klein et al. 2007,
Ricketts et al. 2008). Despite this dependence, major pollinator populations continue to
decline, mostly as a result of human-mediated habitat destruction (reviewed in Kremen et
al. 2002b, Steffan-Dewenter et al. 2005, Ricketts et al. 2008). The conservation of native
pollinators requires local and regional land management that conserves nesting and
foraging resources for native bees (e.g., Potts et al. 2003, Potts et al. 2005). This research
investigates the influence of landscape management on native bee communities across a
large coffee growing region in Chiapas, Mexico. We conducted a regional bee survey
and utilized GIS imaging and machine-learning regression tree modeling to determine
which local and regional habitat factors were most important for predicting native bee
abundance and diversity.
Chapter V: Isolation and characterization of nine microsatellite loci for the tropical
understory tree Miconia affinis Wurdack (Melastomataceae)
The tree M. affinis is found in both primary and secondary forests, ranging from southern
Mexico to southern Venezuela. Understanding the population genetics of this species is
4
of great interest, given it is a buzz-pollinated understory tree, and thus represents both an
understudied pollination syndrome and understudied plant habit. Additionally, M. affinis
inhabits much of the world‟s coffee growing regions, and is often found as a colonist
within coffee farms. Therefore, by examining M. affinis population genetics we can
evaluate the effect of the coffee habitat on seed-mediated and pollinator-mediated gene
flow. We isolated nine microsatellite loci from M. affinis and optimized them for further
research on gene flow and genetic structure.
Chapter VI: Shade coffee farms promote the genetic diversity of native trees
Seed dispersal is a critical process for the regeneration of fragmented landscapes
(reviewed in Levey et al. 2002, and Jones and Muller-Landau 2008) and may be limited
in altered habitats if important seed dispersers are lost (Asquith et al. 1999, Wang et al.
2007, reviewed in Jones and Muller-Landau 2008). Recent molecular studies examining
seed dispersal for tropical trees have revealed that seed dispersal into the pasture matrix
can be limited, leading to low levels of offspring allelic diversity, and highly clumped
relatedness within colonized landscapes (Aldrich and Hamrick 1998, Aldrich et al. 1998,
Sezen et al. 2005, 2007). However, these studies examine a highly simplified pastoral
landscape and a relatively narrow sample of tropical tree diversity. Gene flow patterns
documented in pastoral landscapes are not likely representative of more complex
agricultural systems, like cacao and coffee, which dominate global biodiversity hotspots
(Myers et al. 2000). In this study, we used genetic markers to analyze the seed dispersal
history and spatial genetic structure of M. affinis across coffee and forest habitats.
Chapter VII: Extensive plant gene flow mediated by native bees across a shade
coffee landscape mosaic
Habitat alteration can have negative effects on plant reproduction, especially for tropical
woody plants, since most tropical tree species are self-incompatible, animal pollinated,
and exhibit varying degrees of floral reproductive specialization (reviewed in Bawa 1990,
Bawa 1992, Ashworth et al. 2004, Aguilar et al. 2006). An estimated 8% of plant species
exhibit „buzz-pollination‟, a reproductively specialized syndrome where flowers have
poricidal tubular anthers that limit pollen extraction to a select group of native bees

5
capable of vibrating the anthers in order to release the pollen (Buchmann 1983). Because
Africanized and European honeybees are incapable of buzz-pollinating, plant species
requiring this service may exhibit decreased reproductive success and limited pollen
dispersal when visited by honeybees.
Though molecular studies have found that pollen dispersal between forest trees
and isolated pasture trees may be extensive (Chase et al. 1996, Dick 2001, reviewed in
Lowe et al. 2005, Dick et al. 2008), these previous studies have focused only on
reproductively generalized trees, where exotic honeybees may compensate for reduced
reproduction and limited pollen flow otherwise experienced in disturbed habitats (e.g.,
Dick 2001, Dick et al. 2003). Reproductively specialized trees, on the other hand, may
experience limited reproduction and pollen-mediated gene flow if native pollinators are
absent in the agricultural matrix. We examined the pollination ecology and pollen
dispersal patterns of M. affinis by conducting a detailed breeding system study. We also
examined pollinator visitation and ambient fruit set in both coffee and forest habitats.
Finally, we used microsatellite markers and maternal seedling arrays to examine M.
affinis pollen dispersal patterns across coffee and forest habitats.

6
Chapter I References
Aguilar, R., L. Ashworth, L. Galetto, and M. A. Aizen. 2006. Plant reproductive
susceptibility to habitat fragmentation: review and synthesis through a meta-
analysis. Ecology Letters 9:968-980.
Aizen, M. A. and P. Feinsinger. 1994. Habitat fragmentation, native insect pollinators,
and feral honeybees in Argentine chaco serrano. Ecological Applications 4:378-
392.
Aldrich, P. R. and J. L. Hamrick. 1998. Reproductive dominance of pasture trees in a
fragmented tropical forest mosaic. Science 281:103-105.
Aldrich, P. R., J. L. Hamrick, P. Chavarriaga, and G. Kochert. 1998. Microsatellite
analysis of demographic genetic structure in fragmented populations of the
tropical tree Symphonia globulifera. Molecular Ecology 7:933-944.
Ashworth, L., R. Aguilar, L. Galetto, and M. A. Aizen. 2004. Why do pollination
generalist and specialist plant species show similar reproductive susceptibility to
habitat fragmentation? Journal of Ecology 92:717-719.
Asquith, N. M., J. Terborgh, A. E. Arnold, and C. M. Riveros. 1999. The fruits the agouti
ate: Hymenaea courbaril seed fate when its disperser is absent. Journal of Tropical
Ecology 15:229-235.
Bawa, K. S. 1990. Reproductive Ecology of Tropical Forest Plants. Unesco and
Parthenon Press, Paris and USA.
Bawa, K. S. 1992. Mating Systems, Genetic Differentiation and Speciation in Tropical
Rain-Forest Plants. Biotropica 24:250-255.
Bawa, K. S., W. J. Kress, N. M. Nadkarni, S. Lele, P. H. Raven, D. H. Janzen, A. E.
Lugo, P. S. Ashton, and T. E. Lovejoy. 2004. Tropical ecosystems into the 21st
century. Science 306:227-228.
Butz-Huryn, V. 1997. Ecological impacts of introduced honey bees. Quarterly Review of
Biology 72:275-297
Chase, M. R., C. Moller, R. Kesseli, and K. S. Bawa. 1996. Distant gene flow in tropical
trees. Nature 383:398-399.
Daily, G. C. 1997. Nature's services: Societal dependence on natural ecosystems. Island
Press, Washington, D.C., USA.
Dick, C. W. 2001. Genetic rescue of remnant tropical trees by an alien pollinator.
Proceedings of the Royal Society of London Series B-Biological Sciences
268:2391-2396.
Dick, C. W., G. Etchelecu, and F. Austerlitz. 2003. Pollen dispersal of tropical trees
(Dinizia excelsa: Fabaceae) by native insects and African honeybees in pristine
and fragmented Amazonian rainforest. Molecular Ecology 12:753-764.
Dick, C. W., F. A. Jones, O. J. Hardy, and R. J. Petit. 2008. Spatial scales of seed and
pollen-mediated gene flow in tropical forest trees. Tropical Plant Biology 1:20-33.
Donald, P. F. 2004. Biodiversity impacts of some agricultural commodity production
systems. Conservation Biology 18:17-37.
Geist, H. J. and E. F. Lambin. 2002. Proximate causes and underlying driving forces of
tropical deforestation. Bioscience 52:143-150.

7
Greenberg, R., P. Bichier, and J. Sterling. 1997. Bird populations in rustic and planted
shade coffee plantations of eastern Chiapas, Mexico. Biotropica 29:501-514.
Hanski, I. 1999. Metapopulation ecology. Oxford University Press, New York, NY.
Jones, F. A. and H. C. Muller-Landau. 2008. Measuring long-distance seed dispersal in
complex natural environments: an evaluation and integration of classical and
genetic methods. Journal of Ecology 96:642-652.
Klein, A. M., I. Steffan-Dewenter, and T. Tscharntke. 2003a. Fruit set of highland coffee
increases with the diversity of pollinating bees. Proceedings of the Royal Society
of London Series B-Biological Sciences 270:955-961.
Klein, A. M., I. Steffan-Dewenter, and T. Tscharntke. 2003b. Pollination of Coffea
canephora in relation to local and regional agroforestry management. Journal of
Applied Ecology 40:837-845.
Klein, A. M., B. E. Vaissiere, J. H. Cane, I. Steffan-Dewenter, S. A. Cunningham, C.
Kremen, and T. Tscharntke. 2007. Importance of pollinators in changing
landscapes for world crops. Proceedings of the Royal Society B-Biological
Sciences 274:303-313.
Kremen, C., N. M. Williams, and R. W. Thorp. 2002. Crop pollination from native bees
at risk from agricultural intensification. Proceedings of the National Academy of
Sciences of the United States of America 99:16812-16816.
Kunin, W. E. 1997. Population size and density effects in pollination: Pollinator foraging
and plant reproductive success in experimental arrays of Brassica kaber. Journal
of Ecology 85:225-234.
Laurance, W. F. 1998. A crisis in the making: responses of Amazonian forests to land use
and climate change. Trends in Ecology & Evolution 13:411-415.
Levey, D. J., W. R. Silva, and M. Galetti. 2002. Seed Dispersal and Frugivory: Ecology,
Evolution and Conservation CAB International, Wallingford, UK.
Lowe, A. J., D. Boshier, M. Ward, C. F. E. Bacles, and C. Navarro. 2005. Genetic
resource impacts of habitat loss and degradation; reconciling empirical evidence
and predicted theory for neotropical trees. Heredity 95:255-273.
Myers, N., R. A. Mittermeier, C. G. Mittermeier, G. A. B. da Fonseca, and J. Kent. 2000.
Biodiversity hotspots for conservation priorities. Nature 403:853-858.
Nee, S. and R. M. May. 1992. Dynamics of metapopulations- habitat destruction and
competitive coexistence. Journal of Animal Ecology 61:37-40.
Perfecto, I., R. A. Rice, R. Greenberg, and M. E. VanderVoort. 1996. Shade coffee: A
disappearing refuge for biodiversity. Bioscience 46:598-608.
Perfecto, I. and J. Vandermeer. 2008. Biodiversity conservation in tropical
agroecosystems - A new conservation paradigm. Pages 173-200 Year in Ecology
and Conservation Biology 2008. Blackwell Publishing, Oxford.
Potts, S. G., B. Vulliamy, A. Dafni, G. Ne'eman, and P. Willmer. 2003. Linking bees and
flowers: How do floral communities structure pollinator communities? Ecology
84:2628-2642.
Potts, S. G., B. Vulliamy, S. Roberts, C. O'Toole, A. Dafni, G. Ne'Eman, and P. Willmer.
2005. Role of nesting resources in organising diverse bee communities in a
Mediterranean landscape. Ecological Entomology 30:78-85.
Redford, K. H. 1992. The Empty Forest. Bioscience 42:412-422.

8
Ricketts, T. H., G. C. Daily, P. R. Ehrlich, and C. D. Michener. 2004. Economic value of
tropical forest to coffee production. Proceedings of the National Academy of
Sciences of the United States of America 101:12579-12582.
Ricketts, T. H., J. Regetz, I. Steffan-Dewenter, S. A. Cunningham, C. Kremen, A.
Bogdanski, B. Gemmill-Herren, S. S. Greenleaf, A. M. Klein, M. M. Mayfield, L.
A. Morandin, A. Ochieng, and B. F. Viana. 2008. Landscape effects on crop
pollination services: are there general patterns? Ecology Letters 11:499-515.
Sezen, U. U., R. L. Chazdon, and K. E. Holsinger. 2005. Genetic consequences of
tropical second-growth forest regeneration. Science 307:891-891.
Sezen, U. U., R. L. Chazdon, and K. E. Holsinger. 2007. Multigenerational genetic
analysis of tropical secondary regeneration in a canopy palm. Ecology 88:3065-
3075.
Steffan-Dewenter, I., U. Munzenberg, C. Burger, C. Thies, and T. Tscharntke. 2002.
Scale-dependent effects of landscape context on three pollinator guilds. Ecology
83:1421-1432.
Steffan-Dewenter, I., S. G. Potts, and L. Packer. 2005. Pollinator diversity and crop
pollination services are at risk. Trends in Ecology & Evolution 20:651-652.
Totland, O. and I. Matthews. 1998. Determinants of pollinator activity and flower
preference in the early spring blooming Crocus vernus. Acta Oecologica-
International Journal of Ecology 19:155-165.
Veddeler, D., A. M. Klein, and T. Tscharntke. 2006. Contrasting responses of bee
communities to coffee flowering at different spatial scales. Oikos 112:594-601.
Wang, B. C., V. L. Sork, M. T. Leong, and T. B. Smith. 2007. Hunting of mammals
reduces seed removal and dispersal of the afrotropical tree Antrocaryon
klaineanum (Anacardiaceae). Biotropica 39:340-347.
Westphal, C., I. Steffan-Dewenter, and T. Tscharntke. 2003. Mass flowering crops
enhance pollinator densities at a landscape scale. Ecology Letters 6:961-965.
Wright, S. J. 2005. Tropical forests in a changing environment. Trends in Ecology &
Evolution 20:553-560.

9
Chapter II: Foraging patterns of Africanized honeybees and native bees and wasps
in a tropical agroforestry landscape
ABSTRACT
Ecological and temporal factors can influence animal foraging patterns and may obscure
our understanding of how native and exotic species interact. To understand how such
factors affect foraging, the visitation of native and exotic bees and wasps was observed at
nectar feeders within Mexican agroforestry systems, while documenting (1) vegetation
management (low-shade vs. high-shade coffee), (2) light and floral resource levels and
(3) recruiting ability, as measured by the change in visitation between two consecutive
experimental days. On day one, Africanized honeybee visitation was significantly greater
in low-shade habitats, and native solitary bee abundance was significantly greater in
high-shade habitats, while native social bee and solitary wasp visitation were not
significantly different between habitat types. After 24 h, Africanized honeybee visitation
increased significantly in both habitat types, while native social bee visitation increased
significantly only in high-shade coffee. In contrast, native solitary bee and native solitary
wasp visitation decreased in both habitat types. Overall, this study reveals that
Africanized honeybees exhibit only initial foraging preference for low-shade habitats,
while native bees exhibit both initial and delayed recruitment-based foraging preferences
for high-shade habitats.

10
INTRODUCTION
A large number of studies have revealed that exotic species can negatively impact native
species via interference or resource-driven competitive interactions (reviewed in
Vitousek et al. 1996, Wilcove et al. 1998, Stein et al. 2000, Clavero and Garcia-Berthou
2005). However, if the native species are inherently sensitive to environmental factors,
such as food resource levels, temperature and seasonality, as seen in many bees
(Ackerman 1983, Wolda and Roubik 1986, Stone 1994, Hingston 1998), the impact of an
introduced species upon native species may be difficult to characterize (Tepedino and
Stanton 1981). One exotic species widely debated as having a negative impact on native
bees and wasps is the Africanized honeybee, a hybrid between the African honeybee,
Apis mellifera scutellata (Lepeletier), and the European honeybee Apis mellifera
mellifera. The success of the Africanized honeybee is largely attributed to its large colony
size, long-range foraging and aggressive behaviour (Kerr 1967, Roubik 1978, 1980, Kerr
et al. 1982, Schneider et al. 2004). While most studies agree that aggressive physical
interactions (i.e. interference competition) do not frequently take place between
Africanized honeybees and native insects during foraging (Schaffer et al. 1983, Thorp
1987, Butz-Huryn 1997), much debate remains about whether Africanized honeybees
negatively affect native insects via resource-driven competitive interactions (i.e.
exploitation competition)(Schaffer et al. 1983, Thorp 1987, reviewed in Butz-Huryn
1997, Roubik and Wolda 2001, reviewed in Goulson 2003, Thomson 2004, 2006).
Ultimately, understanding interactions between Africanized honeybees, native
bees and wasps also requires an examination of the ecological factors which mediate their
foraging. Bees vary widely in their ecology (Michener 1979, 2000) and nest-site
preferences (Potts et al. 2005), as do wasps (Evans and West-Eberhard 1970, Ross and
Matthews 1991, Richter 2000); thus their foraging patterns are dependent on important
ecological and behavioural characteristics, including colony size and recruitment
strategy. Africanized honeybees are extremely effective at recruiting colony mates to
forage at a high-quality resource sites (Schaffer et al. 1979, Roubik 1991). Though social
bees use recruitment strategies, they may avoid foraging at sites that are occupied by
another species (i.e. meliponine bees, Johnson and Hubbell 1974, Nagamitsu and Inoue
11
1997), as may wasp species (Richter 1990, Richter and Tisch 1999). Native bees and
wasps that cannot tolerate intense recruitment by other species, like Africanized
honeybees, may not be able to forage extensively at sites of high quality resources.
Local land management directly affects floral and nest-site availability, and a
number of studies have documented decreases in native bee abundance and increases in
Africanized honeybees abundance in less-forested habitats (Aizen and Feinsinger 1994,
Cairns et al. 2005, Brosi et al. 2007). However, few studies have attempted to quantify
how local habitat composition influences bee foraging patterns. Shade coffee
agroforestry systems provide an ideal system in which to examine the impact of local
habitat on native and exotic bee foraging, since coffee flowers are predominantly
pollinated by both native and exotic bees (Roubik 2002, Klein et al. 2003a, Ricketts
2004, 2008). Additionally, shade coffee agroforestry systems are widespread in the
tropics, vary widely in their vegetation management styles, and have gained recent
attention for their potential role as biodiversity refuges (Perfecto et al. 1996, Moguel and
Toledo 1999, Donald 2004). In southern Mexico, a number of coffee agroforestry
regions are uniquely suited for the study of Africanized honeybee and native insect
foraging. In these regions, farmers trap and manage feral Africanized honeybees and
therefore maintain a controlled number of Africanized honeybee colonies within a region.
In this study, we investigate the influence of a number of environmental factors on the
foraging patterns of Africanized honeybees and native bees and wasps. Specifically, we
examine the hypothesis that differences in vegetation management, floral resource levels
and species recruiting ability, will contribute to contrasting habitat preferences and
foraging patterns for native bees and wasps and exotic honeybees.
METHODS
Study site
The study was conducted between 4 May and 22 June 2006, in the highlands of the
Soconusco, in the state of Chiapas, Mexico (92°18‟55‟‟- 92°20‟24‟‟W, 15°09‟38‟‟-
15°10‟48‟‟N) at an altitude ranging between 1125 and 1300m. The study site is

12
composed of a low-shade coffee region, which has an average of 16.1 trees ha-1
, resulting
in 20%-30% canopy cover, and a high-shade coffee region, which has an average of 42.3
trees ha-1
, resulting in 55%-65% canopy cover, and a small uncut forest reserve, La
Montañita, located between the two regions (Figure 2.1). The two coffee regions
investigated are extremely large; each is greater than 300 ha, and each equal in size to a
dozen or more coffee farms typical of the Soconusco area. Also located between the two
coffee regions is an Africanized honeybee apiary, which was constructed in November
2004. The apiary contains an average of 70-100 colonies and had 83 colonies at the time
of the study. All nests in the apiary were obtained by trapping for feral Africanized
honeybees within the two neighboring coffee regions consistently for 3 y before this
study. Throughout the 2006 experimental season, nests found within the two coffee
regions were continuously trapped and added to the apiary. Few feral nests (2) were
found in the coffee fields after the intensive collection between 2002 and 2005.
Bee visitation at nectar feeders
Bee foraging rates were measured for two consecutive days at high-quality-resource
„nectar feeders‟. Each nectar feeder was composed of a small 12-cm-diameter dish with
a 6-cm-diameter foam landing platform and an inexhaustible supply of a 1:1 honey:water
solution, a standard bee attractant and feeder (Johnson and Hubbell 1974, Roubik 1980,
Slaa 2003). Nectar feeders were placed in groups of three, representing a nectar-feeder
site. The three feeders within a site were hung 1m off the ground in the outer branches of
coffee bushes, forming a line of three dishes separated from one another by 1 m. Nectar
feeder sites were selected by randomly choosing a location along a series of concentric
circles located around the managed Africanized honeybee apiary at 400 m, 500 m, 600 m
and 800 m away from the apiary, in both the low-shade and high-shade coffee habitats
(Figure 2.1). Because many of the insects studied are social and employ recruitment
strategies which can only be observed after an extended time period, nectar feeders were
monitored for two consecutive days during peak bee and wasp foraging hours, between
08h00 and 10h00. These observations were repeated fortnightly for a total of 8 wk (four
replicates per habitat). Because individual bees and wasps did not forage at the bait for
more than 10-15 s (initial trials involved documentation of visit duration), the number of

13
bees and wasps visiting each of the three nectar feeders was recorded every minute for a
10-min period. The visitation at the three nectar feeders was then averaged and summed
across the 10 min. Field identifications of bees were made with reference to voucher
specimens, which were identified and stored at El Colegio de la Frontera Sur, Tapachula,
Mexico and the USDA bee laboratory in Logan, Utah, USA. To minimize field
identification errors, morphologically similar species were grouped into single
morphospecies in the field (e.g. Ceratina sp. refers to C. trimaculata, C. ignara and C.
sp)
Coffee plants were not blooming during the study season, and very few
understorey herbs were in bloom over the 8-wk period. The species richness of the
understorey plants located within a 10-m radius were recorded for each nectar-feeder site,
and light readings were taken at the height of each feeder across the sampling dates using
a digital light meter to measure incident light at 633 nm (Pocket Light Meter 840010,
Technika Inc) and to assess potential effects of local vegetation and light on visitation
levels. In order to measure the abundance of plants flowering for each coffee region at the
beginning of the experimental season, we randomly placed six 1 x 50-m transects in each
habitat, low-shade and high-shade coffee, and recorded the proportion of each transect
which contained at least five flowering inflorescences per 10-m2
section (proportion with
≥ 0.5 flowering plants m-2
).
Statistical analyses
To meet conditions of normality, all count data were square root-transformed and all
proportions were arcsine-square root-transformed. All statistical analyses were conducted
with the software R (R Development Core Team, URL http://www.r-project.org, Vienna,
Austria). Visiting insects were grouped into „foraging group‟ based on foraging strategies
and origin; these foraging groups include Africanized honeybees, native social bees,
native solitary bees and native solitary wasps.
To test the effect of the wet season‟s progression on light and flowering levels, we
used a standard Analysis of Variance, ANOVA. To examine the influence of all factors
on the number of visiting insects for each foraging group, we utilized an Analysis of
Covariance, ANCOVA, using a non-sequential test for examining individual coefficients

14
(also known as a Type III sum of squares test). The covariates include (1) distance from
Africanized honeybee apiary, (2) local light conditions, (3) species richness of local
plants in flower and (4) the week of the experiment. The fixed factors include (5) habitat
(low-shade vs. high-shade coffee), (6) foraging group and (7) day of visitation (day one or
day two). In this case, the ANCOVA method is the most suitable because it provides a
descriptive comparison between the visitation levels in different habitats, on the different
days and between foraging groups, so it can test hypotheses concerning the significant
differences between these categorical variables. Also, the ANCOVA, unlike the Analysis
of Variance (ANOVA), disentangles differences in the effects of the fixed factors from
the covariates which change in value and unlike the analyses of deviance, the ANCOVA
is based on exact F and t distributions for testing the significance of factors and
covariates, also yielding measures of R² that can be interpreted as the percentage of
variance explained (Faraway 2005). The model error was independent and normally
distributed.
.
RESULTS
Flowering plants and light levels
During the study, less than 2% of the understorey plant species were in flower, therefore
few flowering species were recorded and most species counts represent single plants with
few flowering heads. In both systems we found, Borreria laevis Lamk. (Rubiaceae),
Desmodium sp. (Fabaceae), Cyperus ferax Rich. (Cyperaceae), Impatiens walleriana
Hook (Balsaminaceae), Solanum nigrum L. (Solanaceae) and Lantana camara L.
(Verbenaceae) in very low abundances. The flowering plant Ipomoea sp.
(Convolvulaceae) was only found in the high-shade coffee system, while Commelina
diffusa Burm. (Commelinaceae) was only found in the low-shade coffee system, though
both were rare. The proportion of transects with flowering plants was not significantly
different between low-shade and high-shade coffee habitats (paired t-test, t10 = 10.8, P =
0.581).

15
Across the eight experimental weeks, there was no significant difference between
the average number of plant species flowering in the low-shade coffee habitats (1.5
species per site) and the high-shade coffee habitats (1.9 species per site)(t-test, t30 = 0.53,
P = 0.087). However, the average number of flowering plant species remained relatively
constant over the eight experimental weeks in the low-shade coffee habitats (ANOVA,
F1,30 = 0.076, P = 0.78), while the number increased between week 1 and week 3 and then
remained very consistent in shade coffee habitats (ANOVA, F1,30 = 14.2, P = 0.002,
Figure 2.2a). Light levels were low in both habitats because readings were taken in the
morning at the time of visitation and week 5 observations were lower than expected due
to unusual weather conditions; however, across the eight experimental weeks, light levels
were significantly lower in the high-shade coffee habitats, with an average of 24.6 W m-2
,
than in the low-shade coffee habitats, which had an average 46.6 W m-2
(t-test, t30 = 1.67,
P < 0.0001). Increases or decreases in light level across the experimental season were not
significant for either the high-shade coffee habitats (ANOVA, F1,30 = 1.76, P = 0.187) or
the low-shade coffee habitats (ANOVA, F1,30 = 2.36, P = 0.127, Figure 2.2b) and
probably reflected changes in light associated with the onset of the rainy season.
Environmental and temporal effects on visitation
Africanized honeybees, native social and solitary bees and native solitary wasps were
observed visiting the nectar feeders. No aggressive physical interactions were observed
between individuals at the nectar feeders. Native solitary bees mostly comprised bees
within the tribe Ceratinini (Xylocopinae), predominantly Ceratina trimaculata Friese and
Ceratina ignara Cresson. Social bees comprised of bees with the subfamily Meliponinae
(Apidae), predominantly Trigona fulviventris Guerin, Trigonisca schulthessi Friese and
Plebeia frontalis Friese. Native solitary wasps visiting the nectar feeders were within the
family Vespidae.
Africanized honeybees
On the first day of the experiment, across all sites, Africanized honeybee visitation was
significantly higher in the low-shade coffee habitats than in the high-shade coffee habitats
(Figure 2.3a). From the first day to the second day of the experiment, Africanized
16
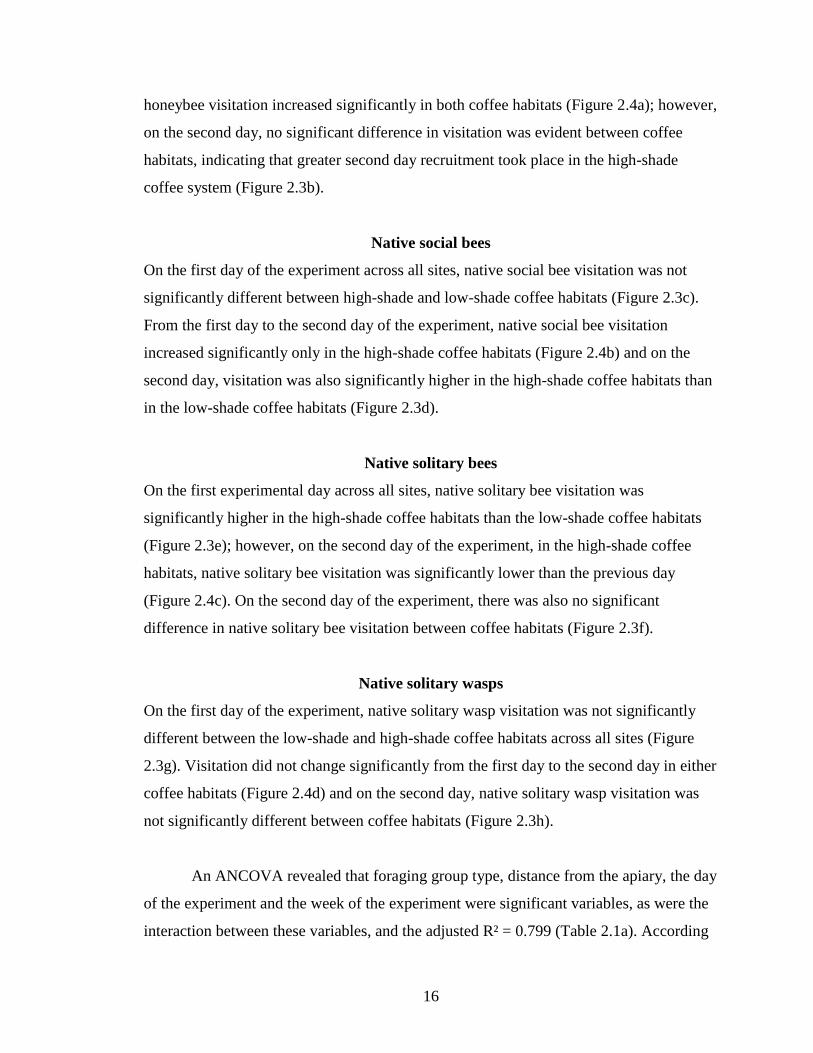
honeybee visitation increased significantly in both coffee habitats (Figure 2.4a); however,
on the second day, no significant difference in visitation was evident between coffee
habitats, indicating that greater second day recruitment took place in the high-shade
coffee system (Figure 2.3b).
Native social bees
On the first day of the experiment across all sites, native social bee visitation was not
significantly different between high-shade and low-shade coffee habitats (Figure 2.3c).
From the first day to the second day of the experiment, native social bee visitation
increased significantly only in the high-shade coffee habitats (Figure 2.4b) and on the
second day, visitation was also significantly higher in the high-shade coffee habitats than
in the low-shade coffee habitats (Figure 2.3d).
Native solitary bees
On the first experimental day across all sites, native solitary bee visitation was
significantly higher in the high-shade coffee habitats than the low-shade coffee habitats
(Figure 2.3e); however, on the second day of the experiment, in the high-shade coffee
habitats, native solitary bee visitation was significantly lower than the previous day
(Figure 2.4c). On the second day of the experiment, there was also no significant
difference in native solitary bee visitation between coffee habitats (Figure 2.3f).
Native solitary wasps
On the first day of the experiment, native solitary wasp visitation was not significantly
different between the low-shade and high-shade coffee habitats across all sites (Figure
2.3g). Visitation did not change significantly from the first day to the second day in either
coffee habitats (Figure 2.4d) and on the second day, native solitary wasp visitation was
not significantly different between coffee habitats (Figure 2.3h).
An ANCOVA revealed that foraging group type, distance from the apiary, the day
of the experiment and the week of the experiment were significant variables, as were the
interaction between these variables, and the adjusted R² = 0.799 (Table 2.1a). According

17
to the ANCOVA, distance from the apiary significantly influenced visitation rates but the
coefficient for this variable was very small (<-0.005), rendering it biologically
insignificant. Backward elimination of factors within the model confirmed that light
levels, flowering plants and distance from the apiary were not important variables for
predicting visitation rates. The adjusted R² = 0.796, indicating that the simplified model
captures most of the variance and the most important predictor variables for visitation are
habitat type, week of experiment, day of experiment and the foraging group type (Table
2.1b). The final model is described below:
ijklkjikjkijikkjiijkl weekY )(
where α is habitat (i = 1, 2 for low-shade/ high-shade coffee habitats), γ is visitor
group (k = 1, 2, 3, 4 for Africanized honeybees, native social bees, native solitary bees
and native solitary wasps, respectively ), β is the day of visitation (j = 1, 2 for day one or
two, respectively) and δk is the species group specific coefficient for the effect of
sampling at different times. In the model, „week‟ represents the order of the experimental
week, so that the value in the model for experimental week number is 1, 3, 5 and 7. For
all groups of visitors, an increase in visitation at the feeders was observed across the
experimental season (Table 2.1, Figure 2.4). Native social bees exhibited the greatest
increase across the experimental season, followed by Africanized honeybees, native
solitary wasps and native solitary bees (Figure 2.4).
DISCUSSION
The tropics are full of naturally occurring resource bursts, such as the sporadic mass
flowering of tropical trees and the ephemeral coffee bloom. These large floral resource
bursts can have major implications on the foraging behaviour of social bees, which may
have evolved recruiting strategies specifically for the exploitation of mass-flowering
patches (Dornhaus and Chittka 1999, 2004, Raine et al. 2006). In this study, we used
nectar feeders to examine foraging levels at a simulated resource burst, and we found

18
marked differences in foraging levels for visiting species, across time and between
habitats types.
Visitation: day 1
There was significantly higher Africanized honeybee visitation in low-shade coffee
habitats than high-shade coffee habitats on the first day of the experiment. This finding is
in accordance with previous studies which have documented greater abundances of
foraging Africanized honeybees in less-forested landscapes (Aizen and Feinsinger 1994,
Rincon et al. 1999, Steffan-Dewenter et al. 2002, Cairns et al. 2005, Brosi et al. 2007).
Unlike Africanized honeybees, both native social and solitary bee visitation was high in
high-shade coffee habitats on the first day of the experiment. In our study, most of the
native solitary bees observed were in the Ceratinini, a wood-nesting tribe, thus solitary
bee visitation to feeders is likely linked with wood-based nest-site availability, which is
more abundant in the high-shade coffee system. Likewise, visitation of native social bees
in high-shade coffee habitats is most likely due to greater nest-site availability, as many
of tropical social bees (especially within the Meliponinae) nest in old trees (Michener
2000, Slaa 2003). Similar patterns of increased visitation with increased proximity to
forested and semi-natural habitats have been documented in coffee agroforestry systems
for native solitary and social bees in Costa Rica (Ricketts 2004), for native social bees in
Indonesia (Klein et al. 2003c, 2006). This relationship also exists for social bees in less-
forested agricultural ecosystems in Germany (Steffan-Dewenter et al. 2002) and the
western United States (Kremen et al. 2002b, 2004, Kim et al. 2006, reviewed in Klein et
al. 2007, 2007).
Native solitary vespid wasp visitation was not significantly influenced by habitat
type. Previous studies within coffee regions have found that solitary vespid wasps in the
family Eumenidae are in fact more often found nesting in the less-forested coffee
plantations (Klein et al. 2004, 2006). These studies have suggested that wasp prey (i.e.
caterpillars) is more abundant in less-forested coffee, and wasp nesting density responds
strongly to prey availability. In Mexican coffee agroforestry systems, it is possible that
wasp prey choice is unaffected by differing coffee management styles, but further study
is necessary to examine this hypothesis.

19
Visitation: day 2
After 24 h had passed, Africanized honeybees and native social bees exhibited
significantly higher visitation levels at the nectar feeders than the previous day. This is a
reflection of the highly developed recruitment strategies utilized by honeybees (Vonfrisch
et al. 1967, Roubik 1980) and native social meliponine bees (Lindauer 1971, Hubbell and
Johnson 1978, Slaa 2003). Also, Africanized honeybees and meliponine bees both often
support large brood sizes (Spivak et al. 1991, Michener 2000) and thus have greater
colony-wide nectar demands. On the second day, Africanized honeybee visitation was
equally high in both habitats, indicating that greater second day recruitment took place in
the high shade coffee system and that foragers had likely saturated all available sites. In
contrast, for native social bees, increased visitation in later foraging bouts occurred only
in high-shade habitats. Apparent habitat-mediated recruitment for native social bees may
be due to greater ease in recruitment and foraging in high-shade habitats, or to greater
nest site proximity. Many social bees, including Africanized honeybees and meliponines,
also use scents to mark forage sites (Free and Williams 1983, Nieh 2004), and more
densely vegetated coffee habitats may allow for greater scent permanence.
Unlike social bees, visitation by solitary bees and wasps decreased on the second
day of the experiment. Decreases in the number of foraging solitary bees and wasps are
likely the result of resource competition, due to large numbers of foraging social bees.
Solitary bees and wasps forage for more diverse resources (food and nest resources) and
have smaller brood sizes (Richter and Tisch 1999, Michener 2000), but there their nectar
demands cannot be satiated by a single day of foraging. Solitary bee and wasp species
have high energetic needs, especially during warm wet-season months, and thus could be
benefited by maintained foraging levels (Stone 1994, Willmer and Stone 2004). Intense
foraging of Africanized honeybees and native social bees may prevent solitary bees from
revisiting high-resource sites, leading to the significant declines in solitary bee visitation
after 24 h of resource exposure.
Species richness and density of understorey plants flowering were not
significantly different between habitat types and did not influence bee or wasp foraging at
20
nectar feeders. However, we detected visitation increases for all foraging groups across
the experimental period. The consistent increase in bee and wasp visitation is best
explained by decreasing regional ambient floral resource availability during the late wet-
season months. In the highlands of Mexico, there is a peak in native tree flowering from
mid-April to early June, followed by a decline in floral resource availability (Croat 1978,
Foster 1982, Bullock and Solis-Magallanes 1990), which leads bees and wasps to forage
more extensively at feeders during this time period.
Conclusions
Though we did not observe any physical competitive interactions between Africanized
honeybees and native bees and wasps, our results suggest that marked decreases in native
solitary bee visitation may be due to high numbers of Africanized honeybees foraging at
resource sites. Previous studies have suggested that competitive interactions between bee
foraging groups would be more common for similarly recruiting social bees (Schaffer et
al. 1979), and only social bees have been documented to exhibit foraging shifts in order
to avoid competition with the Africanized honeybee (Roubik 1980, 1986). Alternatively,
in our study, native social bees exhibited extensive recruitment-based foraging in high-
shade habitats, undeterred by the presence of Africanized honeybees. Findings from this
study reveal that visitation levels for bees and wasps depend both on habitat composition
and the duration of resource availability, and both factors must be considered in the
interpretation of native and exotic species foraging.
ACKNOWLEDGEMENTS
This chapter was coauthored with John Vandermeer and published in the Journal of
Tropical Ecology in 2009. We would like to thank Luis Fernando Chavez, Beverly
Rathcke, Ivette Perfecto, Mike Reiskind, Exzequel Velasquez, the Vandermeer lab group,
the Rathcke lab group and the Perfecto lab group at the University of Michigan. We
would also like to thank Terry Griswold and Olivia Messenger at the USDA Bee Lab in
Logan, Utah, for help with bee identifications. Finally, we would like to express our

21
gratitude to the people of Finca Irlanda and Finca Hamburgo for their permission and
assistance in conducting this study. All experiments conducted were in compliance with
current laws governing biodiversity protection in Mexico.

22
TABLES, FIGURES AND LEGENDS
Table 2.1 We utilized an Analysis of Covariance to measure the influence of all
covariates and factors on the number of visiting insects for each foraging group. First
listed are the model results for visitation rates using an ANCOVA where all relevant
covariates have been included. Second listed are the model results where only significant
covariates have been included. Covariates include (distance= distance to Africanized bee
apiary; Flowers= species richness of blooming understorey plants; Light= light (W m-2
),
Week= sampling week) and all factors (Habitat= high-shade or low-shade coffee, Group
= foraging group, Day=1st or 2
nd day) and relevant interaction terms.
Source df F P
All covariates
Distance 1 5.71 0.078
Flowers 1 1.38 0.241
Light 1 0.02 0.886
Week 1 38.9 < 0.001 ***
Habitat 1 6.34 0.012 *
Group 3 220 < 0.001 ***
Day 1 83.3 < 0.001 ***
Habitat ×Group 3 17.8 < 0.001 ***
Week × Group 3 14.4 < 0.001 ***
Day × Group 3 51.8 < 0.001 ***
Week × Distance 1 2.71 0.101
Group × Distance 3 4.27 0.005 **
Habitat × Day × Group 3 7.81 < 0.001 ***
Residuals 229
Significant covariates
Week 1 36.5 < 0.001 ***
Habitat 1 5.95 0.015 *
Group 3 206 < 0.001 ***
Day 1 78.1 < 0.001 ***
Habitat × Day 1 15.4 < 0.001 ***
Habitat × Group 3 16.6 < 0.001 ***
Week × Group 3 13.5 < 0.001 ***
Day × Group 3 48.5 < 0.001 ***
Habitat × Day ×
Group
3 7.32 < 0.001 ***
Residuals 236

23
Figure 2.1 Map of the study region with concentric circles indicating feeder locations at
400 m, 500 m, 600 m, and 800 m from the apiary, upon which nectar feeders were
randomly placed in each habitat.

24
Figure 2.2 Species richness of plants flowering and light levels in each habitat and
across the experimental season. Mean numbers of flowering plant species across the
experimental season in the low-shade and high-shade coffee habitats (a). Mean light
levels (W m-2
) across the experimental season in the low-shade and the high-shade coffee
habitats (b). Error bars represent SE. *P < 0.05, **P < 0.01, ***P < 0.001

25
Figure 2.3 Mean number of visits in the two coffee habitats on day one and day two for
Africanized honeybees (a-b) native social bees (c-d) native solitary vespid wasps (e-f)
and native solitary bees (g-h). Note the scale. Error bars represent SE. Codes for
significant differences in between habitats: *P < 0.05, **P < 0.01, ***P < 0.001

26
Figure 2.4 Visitation over the 8-wk experimental period for all visitor groups (a-d).
Circle symbols are actual values for visitation on day one while triangle symbols are
actual values for visitation on day two; unfilled symbols represent visitation in low-shade
coffee, while filled symbols represent visitation in high-shade coffee. Lines are model-
based regressions of visitation: solid lines represent visitation on the first day in high-
shade coffee, widely dashed lines represent visitation on the second day in high-shade
coffee, closely dotted lines represent visitation on the first day in low-shade coffee, and
widely dotted lines represent visitation on the second day in low-shade coffee. Codes for
significant differences from day one to day two: *P < 0.05, **P < 0.01, ***P < 0.001

27
Chapter II References
Ackerman, J. D. 1983. Diversity and seasonality of male euglossine bees (Hymenoptera,
Apidae) in central Panama. Ecology 64:274-283.
Aizen, M. A. and P. Feinsinger. 1994. Habitat fragmentation, native insect pollinators,
and feral honeybees in Argentine chaco serrano. Ecological Applications 4:378-
392.
Brosi, B. J., G. C. Daily, and P. R. Ehrlich. 2007. Bee community shifts with landscape
context in a tropical countryside. Ecological Applications 17:418-430.
Bullock, S. H. and J. A. Solis-Magallanes. 1990. Phenology of canopy trees of a tropical
deciduous forest in Mexico. Biotropica 22:22-35.
Butz-Huryn, V. 1997. Ecological impacts of introduced honey bees. Quarterly Review of
Biology 72:275-297
Cairns, C. E., R. Villanueva-Gutierrez, S. Koptur, and D. B. Bray. 2005. Bee populations,
forest disturbance, and africanization in Mexico. Biotropica 37:686-692.
Clavero, M. and E. Garcia-Berthou. 2005. Invasive species are a leading cause of animal
extinctions. Trends in Ecology & Evolution 20:110.
Croat, T. C. 1978. The flora of Barro Colorado Island. Stanford University Press, Palo
Alto, CA, USA.
Donald, P. F. 2004. Biodiversity impacts of some agricultural commodity production
systems. Conservation Biology 18:17-37.
Dornhaus, A. and L. Chittka. 1999. Insect behaviour - Evolutionary origins of bee
dances. Nature 401:38-38.
Dornhaus, A. and L. Chittka. 2004. Why do honey bees dance? Behavioral Ecology and
Sociobiology 55:395-401.
Evans, H. E. and M. J. West-Eberhard. 1970. The Wasps. University of Michigan Press,
Ann Arbor.
Faraway, J. 2005. Extending the linear model with R: Generalized linear, mixed effects
and nonparametric regression models. Chapman and Hall/CRC, Boca Raton.
Foster, R. B. 1982. The seasonal rythm of fruitfall on Barro Colorado Island. Pages 151-
172 in E. G. J. Leigh, A. S. Rand, and D. M. Windsor, editors. Ecology of a
tropical forest: seasonal rhythms and long-term changes. Smithsonian Institution
Press, Washington, D.C., USA.
Free, J. B. and I. H. Williams. 1983. Scent-marking of flowers by honeybees. Journal of
Apicultural Research 22:86–90.
Goulson, D. 2003. Effects of introduced bees on native ecosystems. Annual Review of
Ecology Evolution and Systematics 34:1-26.
Hingston, A. B. 1998. Temporal and spatial variation in abundances of native bee species
on an altitudinal gradient in southern Tasmania. Australian Journal of Zoology
46:497-507.
Hubbell, S. P. and L. K. Johnson. 1978. Comparative Foraging Behavior of 6 Stingless
Bee Species Exploiting a Standardized Resource. Ecology 59:1123-1136.
Johnson, L. K. and S. P. Hubbell. 1974. Aggression and Competition among Stingless
Bees - Field Studies. Ecology 55:120-127.

28
Kerr, W. E. 1967. The history of the introduction of African bees to Brazil. . South
African Bee Journal 39:3-5.
Kerr, W. E., S. D. Delrio, and M. D. Barrionuevo. 1982. The Southern Limits of the
Distribution of the Africanized Honey Bee in South-America. American Bee
Journal 122:196-198.
Kim, J., N. Williams, and C. Kremen. 2006. Effects of cultivation and proximity to
natural habitat on ground-nesting native bees in California sunflower fields.
Journal of the Kansas Entomological Society 79:309-320.
Klein, A. M., S. A. Cunningham, M. Bos, and I. Steffan-Dewenter. 2008. Advances in
pollination ecology from tropical plantation crops. Ecology 89:935-943.
Klein, A. M., I. Steffan-Dewenter, and T. Tscharntke. 2003a. Bee pollination and fruit set
of Coffea arabica and C-canephora (Rubiaceae). American Journal of Botany
90:153-157.
Klein, A. M., I. Steffan-Dewenter, and T. Tscharntke. 2003b. Pollination of Coffea
canephora in relation to local and regional agroforestry management. Journal of
Applied Ecology 40:837-845.
Klein, A. M., I. Steffan-Dewenter, and T. Tscharntke. 2004. Foraging trip duration and
density of megachilid bees, eumenid wasps and pompilid wasps in tropical
agroforestry systems. Journal of Animal Ecology 73:517-525.
Klein, A. M., I. Steffan-Dewenter, and T. Tscharntke. 2006. Rain forest promotes trophic
interactions and diversity of trap-nesting hymenoptera in adjacent agroforestry.
Journal of Animal Ecology 75:315-323.
Klein, A. M., B. E. Vaissiere, J. H. Cane, I. Steffan-Dewenter, S. A. Cunningham, C.
Kremen, and T. Tscharntke. 2007. Importance of pollinators in changing
landscapes for world crops. Proceedings of the Royal Society B-Biological
Sciences 274:303-313.
Kremen, C., N. M. Williams, M. A. Aizen, B. Gemmill-Herren, G. LeBuhn, R. Minckley,
L. Packer, S. G. Potts, T. Roulston, I. Steffan-Dewenter, D. P. Vazquez, R.
Winfree, L. Adams, E. E. Crone, S. S. Greenleaf, T. H. Keitt, A. M. Klein, J.
Regetz, and T. H. Ricketts. 2007. Pollination and other ecosystem services
produced by mobile organisms: a conceptual framework for the effects of land-
use change. Ecology Letters 10:299-314.
Kremen, C., N. M. Williams, R. L. Bugg, J. P. Fay, and R. W. Thorp. 2004. The area
requirements of an ecosystem service: crop pollination by native bee communities
in California. Ecology Letters 7:1109-1119.
Kremen, C., N. M. Williams, and R. W. Thorp. 2002. Crop pollination from native bees
at risk from agricultural intensification. Proceedings of the National Academy of
Sciences of the United States of America 99:16812-16816.
Lindauer, M. 1971. Communication among social bees. Harvard Univ. Press, Cambridge,
MA.
Michener, C. D. 1979. Biogeography of the Bees. Annals of the Missouri Botanical
Garden 66:277-347.
Michener, C. D. 2000. Bees of the World. Johns Hopkins University Press, Baltimore,
MD.
Moguel, P. and V. M. Toledo. 1999. Biodiversity conservation in traditional coffee
systems of Mexico. Conservation Biology 13:11-21.

29
Nagamitsu, T. and T. Inoue. 1997. Aggressive foraging of social bees as a mechanism of
floral resource partitioning in an Asian tropical rainforest. Oecologia 110:432-
439.
Nieh, J. C. 2004. Recruitment communication in stingless bees (Hymenoptera, Apidae,
Meliponini). Apidologie 35:159-182.
Perfecto, I., R. A. Rice, R. Greenberg, and M. E. VanderVoort. 1996. Shade coffee: A
disappearing refuge for biodiversity. Bioscience 46:598-608.
Potts, S. G., B. Vulliamy, S. Roberts, C. O'Toole, A. Dafni, G. Ne'Eman, and P. Willmer.
2005. Role of nesting resources in organising diverse bee communities in a
Mediterranean landscape. Ecological Entomology 30:78-85.
Raine, N. E., T. C. Ings, A. Dornhaus, N. Salefl, and L. Chittka. 2006. Adaptation,
genetic drift, pleiotropy, and history in the evolution of bee foraging behavior.
Pages 305-354 Advances in the Study of Behavior, Vol 36. Elsevier Academic
Press Inc, San Diego.
Richter, M. R. 1990. Hunting Social Wasp Interactions - Influence of Prey Size, Arrival
Order, and Wasp Species. Ecology 71:1018-1030.
Richter, M. R. 2000. Social wasp (Hymenoptera : Vespidae) foraging behavior. Annual
Review of Entomology 45:121-150.
Richter, M. R. and V. L. Tisch. 1999. Resource choice of social wasps: influence of
presence, size and species of resident wasps. Insectes Sociaux 46:131-136.
Ricketts, T. H. 2004. Tropical forest fragments enhance pollinator activity in nearby
coffee crops. Conservation Biology 18:1262-1271.
Rincon, M., D. W. Roubik, B. Finegan, D. Delgado, and N. Zamora. 1999. Understory
bees and floral resources in logged and silviculturally treated Costa Rican
rainforest plots. Journal of the Kansas Entomological Society 72:379-393.
Ross, K. and R. Matthews. 1991. The Social Biology of Wasps. Cornell University Press,
Ithaca.
Roubik, D. 1986. Sporadic food competition with the African honey bee: projected
impact on neotropical social bees. Journal of Tropical Ecology 2:97–111.
Roubik, D. 1991. Aspects of Africanized honey bee ecology in tropical America. . Page
435 in F. D. Spivak M, Breed MD editor. The “African” Honey Bee. Westview,
Boulder, CO
Roubik, D. W. 1978. Competitive Interactions between Neotropical Pollinators and
Africanized Honey Bees. Science 201:1030-1032.
Roubik, D. W. 1980. Foraging Behavior of Competing Africanized Honeybees and
Stingless Bees. Ecology 61:836-845.
Roubik, D. W. 2002. Tropical agriculture - The value of bees to the coffee harvest.
Nature 417:708-708.
Roubik, D. W. and H. Wolda. 2001. Do competing honey bees matter? Dynamics and
abundance of native bees before and after honey bee invasion. Population
Ecology 43:53-62.
Schaffer, W. M., D. B. Jensen, D. E. Hobbs, J. Gurevitch, J. R. Todd, and M. V. Schaffer.
1979. Competition, Foraging Energetics, and the Cost of Sociality in 3 Species of
Bees. Ecology 60:976-987.

30
Schaffer, W. M., D. W. Zeh, S. L. Buchmann, S. Kleinhans, M. V. Schaffer, and J.
Antrim. 1983. Competition for Nectar between Introduced Honey Bees and
Native North-American Bees and Ants. Ecology 64:564-577.
Schneider, S. S., G. D. Hoffman, and D. R. Smith. 2004. The African honey bee: Factors
contributing to a successful biological invasion. Annual Review of Entomology
49:351-376.
Slaa, E. J. 2003. Foraging ecology of stingless bees: from individual behaviour to
community ecology. Utrecht University, Department of Behavioural Biology.,
Utrecht, Germany.
Spivak, M., D. J. C. Fletcher, and M. C. Breed. 1991. The “African” Honey Bee.
Westview, Boulder, CO.
Steffan-Dewenter, I., U. Munzenberg, C. Burger, C. Thies, and T. Tscharntke. 2002.
Scale-dependent effects of landscape context on three pollinator guilds. Ecology
83:1421-1432.
Stein, B., L. Kutner, and J. Adams. 2000. Precious heritage: The status of biodiversity in
the United States. Oxford University Press, New York.
Stone, G. N. 1994. Activity Patterns of Females of the Solitary Bee Anthophora plumipes
in Relation to Temperature, Nectar Supplies and Body-Size. Ecological
Entomology 19:177-189.
Tepedino, V. J. and N. L. Stanton. 1981. Diversity and Competition in Bee-Plant
Communities on Short-Grass Prairie. Oikos 36:35-44.
Thomson, D. 2004. Competitive interactions between the invasive European honey bee
and native bumble bees. Ecology 85:458-470.
Thomson, D. M. 2006. Detecting the effects of introduced species: a case study of
competition between Apis and Bombus. Oikos 114:407-418.
Thorp, R. 1987. World overview of the interactions between honeybees and other flora
and fauna. Pages 40–47 in J. Blyth, editor. Beekeeping and Land Management
Department of Conservation and Land Management, Perth.
Vitousek, P. M., C. M. Dantonio, L. L. Loope, and R. Westbrooks. 1996. Biological
invasions as global environmental change. American Scientist 84:468-478.
Vonfrisch, K., A. M. Wenner, and D. L. Johnson. 1967. Honeybees - Do They Use
Direction and Distance Information Provided by Their Dancers. Science
158:1072-&.
Wilcove, D. S., D. Rothstein, J. Dubow, A. Phillips, and E. Losos. 1998. Quantifying
threats to imperiled species in the United States. Bioscience 48:607-615.
Willmer, P. G. and G. N. Stone. 2004. Behavioral, ecological, and physiological
determinants of the activity patterns of bees. Advances in the Study of
Behavior:347-466.
Wolda, H. and D. W. Roubik. 1986. Nocturnal Bee Abundance and Seasonal Bee
Activity in a Panamanian Forest. Ecology 67:426-433.

31
Chapter III: Contrasting bee foraging on coffee in response to resource scale and
local habitat management
ABSTRACT
It is hypothesized that two main factors drive the foraging patterns of native and exotic
species: food resource availability and habitat composition. These factors are particularly
relevant for native bees and exotic honeybees, essential crop pollinators that are sensitive
to floral resources and habitat management, and that have recently exhibited alarming
population declines. Mechanisms driving native and exotic bee foraging patterns may
critically depend on floral resource availability and habitat composition, yet the impacts
of these factors on bee foraging have never been simultaneously analyzed. In a coffee
producing region in southern Mexico, we investigated the influence of coffee floral
resource levels and habitat management on native and exotic bee foraging. We measured
the amount of flowering coffee available at multiple spatial scales within two distinct
agroforestry habitat types (high-shade and low-shade coffee) and recorded visits to coffee
flowers, documenting bee species, visit duration and visit frequency. We observed a
significantly greater number of visits in high-shade coffee habitats than in low-shade
coffee habitats for both native and exotic bees. In high-shade coffee habitats, native
solitary bee and native social bee visitation decreased significantly in response to
increasing floral resource availability, exhibiting a „dilution effect‟ at the smallest spatial
scale. In contrast, in low-shade coffee habitats, Africanized honeybees exhibited a
„concentration effect‟, increasing visitation significantly in response to increasing floral
resource availability at the largest spatial scale. This study is the first to show that
foraging patterns of native bees and exotic honeybees contrast in response to floral

32
resource level and scale and that this response is mediated by the vegetation management
of the local habitat.
INTRODUCTION
Foraging animals use a number of environmental cues in order to conserve energy and
maximize resource acquisition. Because most habitats have resources that are distributed
in a patchy manner, depending on scale, the ability to discern between low and high
quality resource sites is an essential skill for many foraging communities (e.g. Schoener
1971, Abrams 1982, Mangel and Clark 1986, Abrams 1991, Fauchald 1999, Fauchald
and Tveraa 2006). Communities that are dependent on ephemeral resources may be
particularly reliant on their foraging abilities, especially if there is an abundance of
foragers and a limited number of resources. One such example is the native and exotic
bee community, which is uniquely sensitive to food resource availability due to its
dependence on pollen and nectar, the former of which is provisioned to offspring and the
latter of which is mostly consumed by bees in order to sustain their high metabolic
demands (i.e., Price 1984, Kunin 1993, Michener 2000, Potts et al. 2003).
Bee foraging is of great ecological and economic importance since the subsequent
act of pollination provides an essential reproductive service, benefiting cultivated plants
and their consumers (Buchman 1996, Daily 1997, Kremen et al. 2007, Klein et al. 2008).
Approximately 35% of the global food supply relies on at least partially pollinator-
dependent plants (Klein et al. 2007, Ricketts et al. 2008). Most agricultural systems are
frequented and serviced by native bees and exotic honeybees; however, recent worldwide
declines in honeybee populations have drawn greater attention to the study of wild native
bees as crop pollinators (Kremen et al. 2002b, Steffan-Dewenter et al. 2005, Winfree et
al. 2007). For many crops, native bees alone contribute substantially to increased fruit
yields, highlighting the ecosystem service provided by native bees (Kremen et al. 2004,
Klein et al. 2007, Kremen et al. 2007, Winfree et al. 2007).
Bee foraging is especially critical to coffee agroforestry systems. Coffee
agroforestry systems are ubiquitous across the tropics (Perfecto et al. 1996, Myers et al.

33
2000, Donald 2004) and many varieties of coffee are partially self-incompatible and
exhibit greater fruit set when visited by diverse native bee communities (Klein et al.
2003b, Ricketts et al. 2004). Foraging bee diversity and coffee pollination are heavily
influenced by the local agroforesty landscape (Klein et al. 2003c, Ricketts et al. 2004,
Klein et al. 2007, Ricketts et al. 2008), as seen in many other agricultural systems
(Kremen et al. 2002b, Kremen et al. 2004, Kremen et al. 2007, Steffan-Dewenter and
Westphal 2008), yet it is unknown how local agricultural management influences bee
foraging responses. One previous study has revealed that the bee community exhibits
complex and contrasting foraging responses to coffee flowering, depending on the spatial
scale examined (Veddeler et al. 2006). At the largest spatial scale (field), bee foragers
exhibit a „dilution effect‟, decreasing visitation with increasing floral resource
availability; while at the smallest scale (bush), bee foragers exhibit a „concentration
effect‟, increasing visitation with increasing floral resource availability (Veddeler et al.
2006). These results were among the first to provide evidence that bee foraging
communities could exhibit contrasting foraging responses depending on spatial scale.
However, foraging responses may differ fundamentally between native and exotic species
in a community and between habitat types, and understanding these differences may yield
insight into the mechanisms driving contrasting foraging patterns.
Since the 1970‟s, fragmented neotropical landscapes have been dominated by
exotic Africanized honeybees, and many studies have suggested that the success of these
exotic bees lies in their recruitment-based foraging strategy and versatile nesting
preferences (e.g., Roubik 1980, Spivak et al. 1991, Aizen and Feinsinger 1994, Cairns et
al. 2005, Brosi et al. 2008). Native social bees also exhibit advanced foraging strategies
which may have evolved specifically for the exploitation of mass-flowering patches
(Dornhaus and Chittka 1999, 2004, Raine et al. 2006). However native social bees,
native solitary bees and honeybees interpret the landscape at different scales (Steffan-
Dewenter et al. 2002) and respond differently to local habitat conditions, such as light
cover, floral density and distance to the nearest forest fragment (Klein et al. 2002, Klein
et al. 2003a, Potts et al. 2003, Ricketts 2004). Thus, the foraging patterns exhibited by
the bee community may depend critically on bee community composition and local
habitat composition. In this study, we investigate the foraging responses of native bees

34
and exotic Africanized honeybees within Mexican coffee agroforestry systems in order to
assess the influence of resource availability, resource scale and local habitat composition
on bee foraging patterns.
METHODS
Study area
The study was conducted in Nueva Alemania, a coffee-growing region located in the
southern highlands of Chiapas, Mexico (92°18‟55‟‟to 92°20‟24‟‟W, 15°09‟38‟‟ to
15°10‟48‟‟N) at an altitude ranging between 1125 and 1300m. In the study region,
Coffea Arabica and Coffea robusta, are planted in the understorey (approximately 4,000
coffee bushes per hectare) under a canopy of overstorey trees that vary in density and
diversity, based on the vegetation management style (Perfecto et al. 1996, Moguel and
Toledo 1999, Soto-Pinto et al. 2001). The study site is composed of a low-shade coffee
region, with a mean of 16.1 trees ha-1
(12.1 species ha-1
), resulting in 20%-30% canopy
cover, and a high-shade coffee region, with a mean of 42.3 trees ha-1
(18.4 species ha-1
),
resulting in 55%-65% canopy cover. Located between the two regions is a small
(approximately 20 ha) uncut forest reserve, La Montañita. The two coffee regions
investigated are extremely large; each is greater than 300 ha, and each equal in size to a
dozen or more coffee farms typical of the Soconusco area. Also located between the two
coffee regions is a managed Africanized honeybee apiary, which was constructed in
November of 2004. The apiary contains an average of 70-100 colonies and had 83
domesticated colonies at the time of the study. All nests in the apiary were obtained by
trapping for feral Africanized honeybees across the study region for 3 years before the
study. Throughout the 2006 experimental season, nests found within the study site were
continuously trapped and added to the apiary. Few feral nests (2) were found in the coffee
fields after the intensive collection between 2002 and 2005.
Coffee plants were observed across coffee agroforestry habitat types between
April 20th and April 23rd of 2006, during the peak coffee bloom, which takes place
shortly after the first major winter rainfall. Coffee bushes appear to flower almost

35
uniformly at 2-3 km scales, but at smaller scales (bush, 5 m, 10 m, and 100 m) flowering
occurs in a patchy manner over the three day flowering period. This is likely due to
microsite variations in soil moisture levels. Though coffee bushes were in full flower
during the study season, the flowering of understorey herbs in both habitats was
extremely low (less than 0.01% of the ground covering plants in flower) and was
therefore not included in the study.
Bee observations
Within each coffee system, observation sessions were made between the 8:00 and 14:00,
when bee foraging activity was highest. The site of each observation session was
randomly selected (>300m away from any previously monitored site), and temperature,
distance from the forest, and distance from the apiary were recorded at each site
(distances ranged between 100 m - 2000 m from both the forest and apiary). The closest
bush to the randomly selected point was chosen for bee observations, and 4 fully
flowering branches (minimum of 20 blossoms) were randomly chosen on the shrub. At
each site, the 4 branches were observed for 15 minutes at a time, and observations of
visiting bee species, duration of visit, and number of flowers visited were noted. In
addition, resource levels for each observation site were measured at four scales; shrub, 5
m, 10 m, and 100 m scales. Given the large variation in branch number per bush, we
measured the proportion of fully flowering branches per bush, while for the 5 m, 10 m,
and 100 m scale, the proportion of coffee bushes with greater than ¼ of their branches
fully flowering was measured within a 5 m, 10 m and 100 m radius from the observation
point, respectively.
Within the two agroforestry habitat types, 124 observation sessions were
conducted, and 499 bee visits were recorded. When possible, bees were captured after
the observation period for identification (96 specimens), and we referred to collections at
El Colegio de la Frontera Sur in Tapachula, Mexico and T. Griswold, at the USDA Bee
Lab in Logan, Utah, for guidance with identifications.
Statistical Analyses

36
To meet conditions of normality, visit number and species number per observation period
were square-root transformed and proportions of floral resource at all scales were arcsin-
square-root-transformed for all regression analyses (Sokal 1995). Regression analyses
using absolute floral resource values (not proportions) yielded the same results. All
statistical analyses were conducted with the software R (R Development Core Team,
URL http://www.r-project.org). Species accumulation and estimation curves were
generated using the Chao1 estimator (Chao 1987), utilizing the software, EstimateS
(Colwell and Coddington 1994). Variation in resources levels are correlated across a
range of spatial scales (Table 3.1). Therefore, linear regressions for bee visitation and
bee species richness were independently examined for each resource scale. For further
analysis, all bee visits were classified into bee groups based on foraging strategy (social
vs. solitary) and origin (native vs. exotic Africanized honeybee), so that three bee
functional groups remained: 1) native solitary bees, 2) native social bees, and 3) exotic
Africanized honeybees. To examine the influence of all factors on the number of visiting
bees within each functional group, we utilized an Analysis of Covariance, ANCOVA,
using a non-sequential test for examining individual coefficients (also known as a Type
III sum of squares test). The covariates include (1) floral resource levels, (2) cloud cover,
(3) temperature, (4) distance from the forest, and (5) distance from the apiary. The fixed
factors include (1) vegetation management, and (2) bee functional group. We utilized an
ANCOVA because it provides a descriptive comparison between the visitation levels
across different habitats and between functional groups, and can thus test hypotheses
concerning the significant differences between these two categorical variables. Also, the
ANCOVA, unlike the Analysis of Variance (ANOVA), disentangles differences in the
effects of the covariates, which range in value, from the fixed factors. The ANCOVA is
based on exact F and t distributions for testing the significance of factors and covariates,
yielding measures of R² that can be interpreted as the percentage of variance explained
(Faraway 2005). The model error was independent and normally distributed.
RESULTS

37
Visitation and Species Richness
Across both habitat types, bee visitation per observation period did not correlate with any
measures of temperature (mean =29.1°, SE=0.33), distance from the forest (mean =497
m, SE =20.2), or distance from the apiary (mean =1067 m, SE =24.9 m). Visitation was
significantly influenced by bee foraging group, habitat quality, and resource levels at all
scales, and the model of bee visitation in both habitat types was best fit for the 10 m
resource scale (ANCOVA, Table 3.2).
On average there were 22.3 (SE =13.8) branches in flower per bush across both
habitats, and the average number of branches in flower per bush was not significantly
different between habitat types (t-test, p =0.23, n =67 & 57). We did not observe any
aggressive physical interactions between bee visitors. Bee visitation at coffee bushes was
significantly higher in high-shade coffee habitats, with a mean of 4.61 visits per
observation period (SE =0.46), compared to a mean of 1.56 visits per observation period
(SE =0.27) in low-shade coffee habitats (t-test, p <0.0001, n =67 & 57). The overall
species richness of bee visitors was also greater in high-shade habitats (Table 3.3, Figure
3.1). Estimated species richness converged on observed species richness curves, with an
estimated number of 17.5 species in high-shade habitats and an estimated number of 8.17
species in low-shade coffee habitats. Shannon Wiener diversity indices reflected the
same patterns, with a value of 1.54 in high-shade habitats and 0.62 in low-shade habitats.
Visit duration was not significantly different between high-shade and low-shade
habitats for native solitary bees (t-test, p =0.61, n =12 & 3), native social bees (t-test, p =
0.49, n =75 & 12), or Africanized honeybees, t-test, (p =0.70, n =270 & 119). However,
the number of visits was significantly greater in high-shade habitats than low-shade
habitats, for native solitary bees (t-test, p=0.048, n=67 & 57), native social bees (t-test,
p<0.0001, n=67 & 57), and Africanized honeybees (t-test, p=0.002, n=67 & 57)(Figure
3.2A-C). The proportion of visits conducted by solitary bees was not significantly
different between the two habitat types (t-test, p=0.911, n=67 & 57, Figure 3.2D). The
proportion of visits conducted by social native bees was significantly higher in high-
shade habitats (t-test, p= 0.048, n=67 & 57, Figure 3.2E), while the proportion of
Africanized honeybee visits was slightly higher in low-shade habitats (t-test, p= 0.204,
n=67 & 57, Figure 3.2F).

38
Foraging in Response to Resource Scale
Bee functional groups displayed marked differences in visitation based on resource levels
at multiple scales. In addition, bee functional groups exhibited contrasting foraging
responses between the two habitat types.
Native solitary bees
In low-shade coffee habitats, native solitary bees did not increase or decrease visitation
levels in response to floral resources at any scale. In contrast, within high-shade habitats
native solitary bees showed a significant decrease in visitation with increasing floral
resources at the 5 m and 10 m resource scale, with strongest effects at the 10 m scale
(F1,65 =8.454, r² = 0.112, p =0.005, y =-0.601x + 0.539, Figure 3.3A).
Native social bees
In low-shade coffee habitats, native social bees did not increase or decrease visitation
levels in response to floral resources at any scale. In contrast, within the high-shade
habitats, native social bees showed a significant decrease in visitation with increasing
floral resources only at the 5 m and 10 m resource scale, with strongest effects at the 10
m scale (F1,65 = 6.756, r² = 0.093, p =0.012, y =-1.476x + 1.766, Figure 3.3A).
Africanized honeybees
Unlike the native bees, in the low-shade habitats exotic Africanized honeybees exhibited
a strong significant increase in visitation only at the 100 m scale (F1,55 = 8.792, r² = 0.122,
p =0.004, y =1.586x + 0.200, Figure 3.3B). In contrast, within the high-shade habitats
Africanized honeybees did not increase or decrease visitation levels in response to floral
resources at any scale.
DISCUSSION
Forager visitation
39
Large floral resource bursts, such as the mass-flowering of tropical trees or the annual
coffee bloom, are common in the tropics and can have major implications on the foraging
behaviour of bees. As seen in previous studies, our results indicate that habitat
composition and coffee floral resource availability have stronger effects on visitation
levels than distance to the nearest forest fragment (Klein et al. 2003c, 2006). Past studies
document that social bees often increase in density and diversity with increasing
proximity to tropical forest, suggesting that bees prefer to forage near their nesting sites
(Klein et al. 2003c, 2004, Ricketts 2004). In this study, greater native bee visitation in
high-shade agroforestry habitats is also likely driven by nest site preferences and
availability, since most native social bees in the study (e.g. Melipona beecheii,
Nanotrigona testaceicornis, Plebia sps., Scaptotrigona mexicana) prefer to nest in old
trees or rotting wood, most solitary bees in the study (e.g., Ceratina eximia, Ceratina
ignara, Ceratina sp. 1) are small-bodied and nest in hollow woody stems (Michener
2000), and both substrates are more abundant in high-shade coffee habitats. The fact that
local forest patches are small, and that overstorey trees managed in high-shade coffee
habitats are especially diverse and dense (Moguel and Toledo 1999) could explain why
regional preferences for forest proximity are particularly weak, and why local preferences
for high-shade agroforestry habitats are stronger.
Though we found higher numbers of Africanized honeybee visitors in high-shade
coffee habitats, we documented a greater proportion of visits conducted by Africanized
honeybees in low-shade coffee habitats. This may be due to the honeybee‟s ability to
navigate in open habitats (Barron et al. 2005), to fly greater distances from their nesting
sites (Schneider and Hall 1997), or to tolerate higher temperatures (Heinrich 1979a,
1996) than native solitary and social bees. Previous studies have documented greater
abundances of Africanized honeybees in more disturbed, less forested landscapes (Aizen
and Feinsinger 1994, Cairns et al. 2005, Brosi et al. 2008). Our findings suggest that
Africanized honeybees forage well in forested habitats, but are capable of exploiting high
resources more easily than native bees in less forested habitats, likely due to their
advanced foraging capabilities and high colony needs.

40
Foraging response to resource scale
Most importantly, this study reveals that bee functional groups respond to resources in
significantly different ways across different spatial scales and habitats. While native
solitary and social bees showed no foraging response to floral resources within low-shade
coffee habitats, they exhibited a significant decrease in visitation with increasing floral
resources at the 10 m resource scale in high-shade coffee habitats. These results suggest
that native social and solitary bees perceive and respond to resources at small spatial
scales, a pattern that has been documented for a number of small-bodied bee species
(reviewed in Greenleaf et al. 2007). The significant negative foraging response exhibited
by native solitary and social bees in our study suggests that they respond to floral
resource levels by spreading out between high resource patches, a pattern known as the
„dilution effect‟ (Root and Kareiva 1984, Yamamura 1999, 2002, Veddeler et al. 2006).
This pattern has been observed a number of times for bees, especially in landscapes
where their numbers are assumed to be limited in relation to floral resource availability
(Totland and Matthews 1998, Sargent 2003, Veddeler et al. 2006).
In contrast, in our study, only Africanized honeybees exhibited a positive
foraging response to increasing coffee resource availability, and only within low-shade
coffee habitats. This foraging pattern, known as the „concentration effect‟, is usually the
result of an abundance of foragers that exhibit strong preferences for high-resource sites,
leading to massive recruitment (Heinrich 1979b, Rathcke 1983, Sih and Baltus 1987,
Kunin 1993, Totland and Matthews 1998). While native solitary and social bees exhibit
small foraging scales, honeybees exhibit relatively large foraging scales, as seen in
previous studies (Steffan-Dewenter et al. 2002). Honeybees are capable of foraging
outside of their usual foraging ranges in search of high-resource sites (Schneider and Hall
1997), making themselves available foragers at large spatial scales, especially when
foraging for high-productive, mass-flowering sites (Schaffer et al. 1979, Schaffer et al.
1983). Because honeybees are also known to fly through more open habitats with greater
speed and directness (Srinivasan et al. 1996, Tautz et al. 2004, Barron et al. 2005) the
forager concentration effect best describes the foraging response for honeybees within
low-shade agroforestry habitats. While both the dilution and concentration effect can be
observed for foraging bee communities depending on the spatial scale examined

41
(Veddeler et al. 2006), our study indicates that bee functional group can explain
contrasting foraging responses for bee communities across spatial scales.
We conclude that that coffee vegetation management distinctly impacts bee
community composition and foraging response. Our study reveals that both vegetation
management and bee functional group are critical factors driving contrasting bee foraging
patterns. From a conservation perspective, we demonstrate that land management not
only impacts bee abundance, but also impacts bee foraging patterns on ephemeral mass-
flowering crops.
ACKNOWLEDGEMENTS
This chapter was coauthored with John Vandermeer and published in OIKOS in 2009.
We would like to thank Luis Fernando Chavez, Beverly Rathcke, Ivette Perfecto, Mike
Reiskind, Exzequel Velasquez, Gabriel Dominguez Martinez, the Vandermeer lab group,
the Rathcke lab group, and the Perfecto lab group at the University of Michigan. We
would also like to thank Terry Griswold and Olivia Messenger at the USDA Bee Lab in
Logan, Utah, for help with bee identifications. Finally, we would like to express our
gratitude to the people of Nueva Alemania for their permission and assistance in
conducting this study. All experiments conducted were in compliance with current laws
governing biodiversity protection in Mexico.

42
TABLES, FIGURES AND LEGENDS
Table 3.1 Pearson correlation coefficient matrix of floral resources at bush, 5 m, 10 m,
and 100 m scales. ****P < 0.0001
5 m scale 10 m scale 100 m scale
Bush scale 0.2874**** 0.4711**** 0.0160
5 m scale 0.7104**** 0.3831****
10 m scale 0.3615****
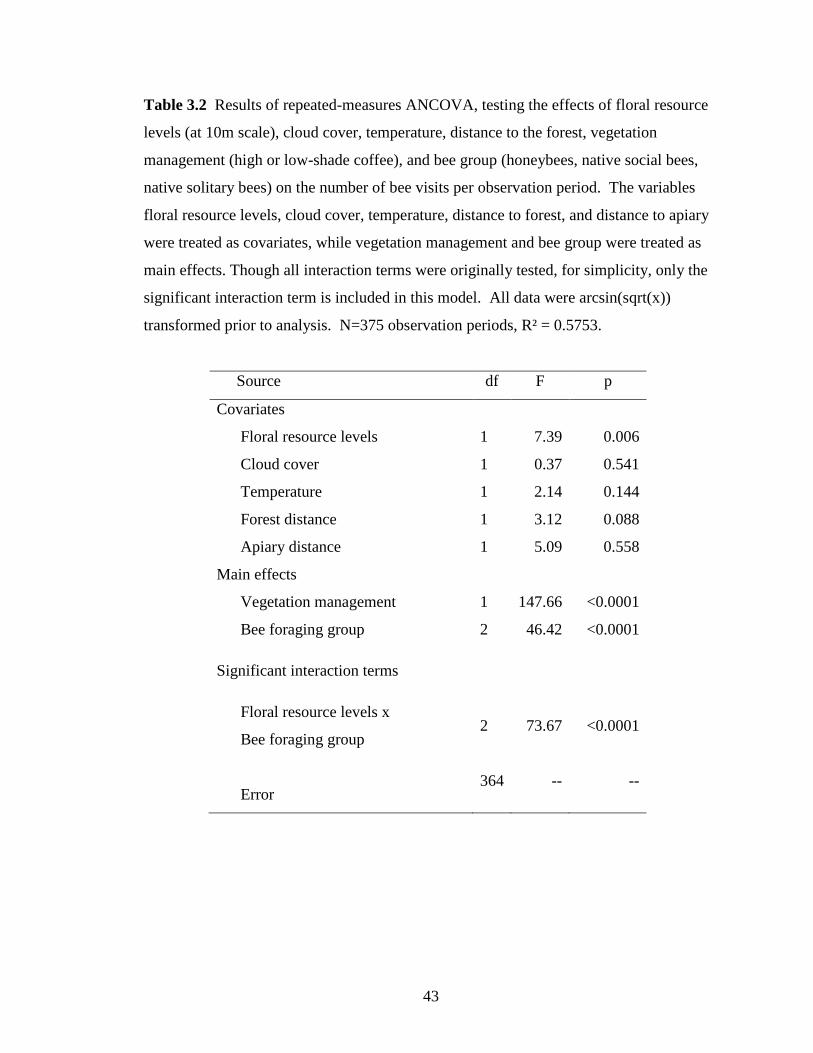
43
Table 3.2 Results of repeated-measures ANCOVA, testing the effects of floral resource
levels (at 10m scale), cloud cover, temperature, distance to the forest, vegetation
management (high or low-shade coffee), and bee group (honeybees, native social bees,
native solitary bees) on the number of bee visits per observation period. The variables
floral resource levels, cloud cover, temperature, distance to forest, and distance to apiary
were treated as covariates, while vegetation management and bee group were treated as
main effects. Though all interaction terms were originally tested, for simplicity, only the
significant interaction term is included in this model. All data were arcsin(sqrt(x))
transformed prior to analysis. N=375 observation periods, R² = 0.5753.
Source df F p
Covariates
Floral resource levels 1 7.39 0.006
Cloud cover 1 0.37 0.541
Temperature 1 2.14 0.144
Forest distance 1 3.12 0.088
Apiary distance 1 5.09 0.558
Main effects
Vegetation management 1 147.66 <0.0001
Bee foraging group 2 46.42 <0.0001
Significant interaction terms
Floral resource levels x
Bee foraging group 2 73.67 <0.0001
Error 364 -- --

44
Table 3.3 Species present in high-shade coffee (HSC) and low-shade coffee (LSC)
agroforestry habitats and their functional group (FG), classified as an Africanized
honeybee (AHB), native solitary bee (NSOL), or native social bee (NSOC).
Species Family LSC HSC FG
Apis mellifera, scutellata (Lepeletier) Apidae x x AHB
Ceratina eximia (Smith) Apidae x NSOL
Ceratina ignara (Cresson) Apidae x NSOL
Ceratina sp. 1 Apidae x NSOL
Eulaema cingulata (Fabricius) Apidae x x NSOC
Melipona beecheii (Bennett) Apidae x NSOC
Nanotrigona testaceicornis (Lepeletier) Apidae x x NSOC
Plebia sp. 1 Apidae x x NSOC
Scaptotrigona mexicana (Guérin-Méneville) Apidae x NSOC
Trigona fulviventris (Guérin-Méneville) Apidae x x NSOC
Xylocopa tabaniformis, tabaniformis (Smith) Apidae x x NSOL
Augochlora aurifera (Cockerell) Halictidae x NSOC
Augochlora nigrocyanea (Cockerell) Halictidae x NSOC
Dialictus sp. 1 Halictidae x NSOC
Dialictus sp. 2 Halictidae x NSOC
Halictus hesperus (Smith) Halictidae x NSOC
Halictus sp. 1 Halictidae x NSOC

45
Figure 3.1 Species richness of bee visitors in high-shade coffee (HSC) and low-shade
coffee (LSC) habitats. Error bars represent observed SD (Colwell and Coddington 1994).

46
Figure 3.2 Visitation was significantly higher in high-shade coffee habitats (HSC) than
low-shade habitats (LSC) for (A) native solitary bees, (B) native social bees, and (C)
Africanized honeybees. The proportion of visits conducted by (D) native solitary bees
was not significantly different between habitat types, (E) social native bees was
significantly higher in high-shade coffee habitats, and (F) Africanized honeybees was
slightly higher in low-shade coffee habitats. Error bars represent SE. Codes for
significant differences in between habitats: *P < 0.05, **P < 0.01, ***P < 0.001

47
Figure 3.3 Contrasting responses of native and exotic bees under differing habitat
management styles. (A) In high-shade coffee habitats, native solitary bee visitation (open
squares, dashed line) and native social bee visitation (closed diamonds, solid line)
decreased significantly as the floral resources decreased at the 10m resource scale. (B) In
low-shade coffee habitats, Africanized honeybee visitation (closed diamonds, solid line)
increased significantly as floral resources increased at the 100m resource scale.

48
Chapter III References
Abrams, P. A. 1982. Functional-Responses of Optimal Foragers. American Naturalist
120:382-390.
Abrams, P. A. 1991. Life-History and the Relationship between Food Availability and
Foraging Effort. Ecology 72:1242-1252.
Aizen, M. A. and P. Feinsinger. 1994. Habitat fragmentation, native insect pollinators,
and feral honeybees in Argentine chaco serrano. Ecological Applications 4:378-
392.
Barron, A. B., H. Zhu, G. E. Robinson, and M. V. Srinivasan. 2005. Influence of flight
time and flight environment on distance communication by dancing honey bees.
Insectes Sociaux 52:402-407.
Brosi, B. J., G. C. Daily, T. M. Shih, F. Oviedo, and G. Duran. 2008. The effects of forest
fragmentation on bee communities in tropical countryside. Journal of Applied
Ecology 45:773-783.
Buchman, G. P., and Nabhan, S.L. 1996. The Forgotten Pollinators. Island
Press/Shearwater Books.
Cairns, C. E., R. Villanueva-Gutierrez, S. Koptur, and D. B. Bray. 2005. Bee populations,
forest disturbance, and africanization in Mexico. Biotropica 37:686-692.
Chao, A. 1987. Estimating the Population-Size for Capture Recapture Data with Unequal
Catchability. Biometrics 43:783-791.
Colwell, R. K. and J. A. Coddington. 1994. Estimating Terrestrial Biodiversity through
Extrapolation. Philosophical Transactions of the Royal Society of London Series
B-Biological Sciences 345:101-118.
Daily, G. C. 1997. Nature's services: Societal dependence on natural ecosystems. Island
Press, Washington, D.C., USA.
Donald, P. F. 2004. Biodiversity impacts of some agricultural commodity production
systems. Conservation Biology 18:17-37.
Dornhaus, A. and L. Chittka. 1999. Insect behaviour - Evolutionary origins of bee
dances. Nature 401:38-38.
Dornhaus, A. and L. Chittka. 2004. Why do honey bees dance? Behavioral Ecology and
Sociobiology 55:395-401.
Faraway, J. 2005. Extending the linear model with R: Generalized linear, mixed effects
and nonparametric regression models. Chapman and Hall/CRC, Boca Raton.
Fauchald, P. 1999. Foraging in a hierarchical patch system. American Naturalist 153:603-
613.
Fauchald, P. and T. Tveraa. 2006. Hierarchical patch dynamics and animal movement
pattern. Oecologia 149:383-395.
Greenleaf, S. S., N. M. Williams, R. Winfree, and C. Kremen. 2007. Bee foraging ranges
and their relationship to body size. Oecologia 153:589-596.
Heinrich, B. 1979a. Keeping a Cool Head - Honeybee Thermoregulation. Science
205:1269-1271.
Heinrich, B. 1979b. Resource Heterogeneity and Patterns of Movement in Foraging
Bumblebees. Oecologia 40:235-245.

49
Heinrich, B. 1996. How the honey bee regulates its body temperature. Bee World 77:130-
137.
Klein, A. M., S. A. Cunningham, M. Bos, and I. Steffan-Dewenter. 2008. Advances in
pollination ecology from tropical plantation crops. Ecology 89:935-943.
Klein, A. M., I. Steffan-Dewenter, D. Buchori, and T. Tscharntke. 2002. Effects of land-
use intensity in tropical agroforestry systems on coffee flower-visiting and trap-
nesting bees and wasps. Conservation Biology 16:1003-1014.
Klein, A. M., I. Steffan-Dewenter, and T. Tscharntke. 2003a. Bee pollination and fruit set
of Coffea arabica and C-canephora (Rubiaceae). American Journal of Botany
90:153-157.
Klein, A. M., I. Steffan-Dewenter, and T. Tscharntke. 2003b. Fruit set of highland coffee
increases with the diversity of pollinating bees. Proceedings of the Royal Society
of London Series B-Biological Sciences 270:955-961.
Klein, A. M., I. Steffan-Dewenter, and T. Tscharntke. 2003c. Pollination of Coffea
canephora in relation to local and regional agroforestry management. Journal of
Applied Ecology 40:837-845.
Klein, A. M., I. Steffan-Dewenter, and T. Tscharntke. 2004. Foraging trip duration and
density of megachilid bees, eumenid wasps and pompilid wasps in tropical
agroforestry systems. Journal of Animal Ecology 73:517-525.
Klein, A. M., I. Steffan-Dewenter, and T. Tscharntke. 2006. Rain forest promotes trophic
interactions and diversity of trap-nesting hymenoptera in adjacent agroforestry.
Journal of Animal Ecology 75:315-323.
Klein, A. M., B. E. Vaissiere, J. H. Cane, I. Steffan-Dewenter, S. A. Cunningham, C.
Kremen, and T. Tscharntke. 2007. Importance of pollinators in changing
landscapes for world crops. Proceedings of the Royal Society B-Biological
Sciences 274:303-313.
Kremen, C., N. M. Williams, M. A. Aizen, B. Gemmill-Herren, G. LeBuhn, R. Minckley,
L. Packer, S. G. Potts, T. Roulston, I. Steffan-Dewenter, D. P. Vazquez, R.
Winfree, L. Adams, E. E. Crone, S. S. Greenleaf, T. H. Keitt, A. M. Klein, J.
Regetz, and T. H. Ricketts. 2007. Pollination and other ecosystem services
produced by mobile organisms: a conceptual framework for the effects of land-
use change. Ecology Letters 10:299-314.
Kremen, C., N. M. Williams, R. L. Bugg, J. P. Fay, and R. W. Thorp. 2004. The area
requirements of an ecosystem service: crop pollination by native bee communities
in California. Ecology Letters 7:1109-1119.
Kremen, C., N. M. Williams, and R. W. Thorp. 2002. Crop pollination from native bees
at risk from agricultural intensification. Proceedings of the National Academy of
Sciences of the United States of America 99:16812-16816.
Kunin, W. E. 1993. Sex and the Single Mustard - Population-Density and Pollinator
Behavior Effects on Seed-Set. Ecology 74:2145-2160.
Mangel, M. and C. W. Clark. 1986. Towards a Unified Foraging Theory. Ecology
67:1127-1138.
Michener, C. D. 2000. Bees of the World. Johns Hopkins University Press, Baltimore,
MD.
Moguel, P. and V. M. Toledo. 1999. Biodiversity conservation in traditional coffee
systems of Mexico. Conservation Biology 13:11-21.

50
Myers, N., R. A. Mittermeier, C. G. Mittermeier, G. A. B. da Fonseca, and J. Kent. 2000.
Biodiversity hotspots for conservation priorities. Nature 403:853-858.
Perfecto, I., R. A. Rice, R. Greenberg, and M. E. VanderVoort. 1996. Shade coffee: A
disappearing refuge for biodiversity. Bioscience 46:598-608.
Potts, S. G., B. Vulliamy, A. Dafni, G. Ne'eman, and P. Willmer. 2003. Linking bees and
flowers: How do floral communities structure pollinator communities? Ecology
84:2628-2642.
Price, M. V. 1984. Insect ecology. 2nd edition. John Wiley and Sons, New York, New
York, USA.
Raine, N. E., T. C. Ings, A. Dornhaus, N. Salefl, and L. Chittka. 2006. Adaptation,
genetic drift, pleiotropy, and history in the evolution of bee foraging behavior.
Pages 305-354 Advances in the Study of Behavior, Vol 36. Elsevier Academic
Press Inc, San Diego.
Rathcke, B. 1983. Competition and facilitation among plants for pollination. Pages 305–
327 in L. Real, editor. Pollination biology. Academic Press, New York, New
York, USA. .
Ricketts, T. H. 2004. Tropical forest fragments enhance pollinator activity in nearby
coffee crops. Conservation Biology 18:1262-1271.
Ricketts, T. H., G. C. Daily, P. R. Ehrlich, and C. D. Michener. 2004. Economic value of
tropical forest to coffee production. Proceedings of the National Academy of
Sciences of the United States of America 101:12579-12582.
Ricketts, T. H., J. Regetz, I. Steffan-Dewenter, S. A. Cunningham, C. Kremen, A.
Bogdanski, B. Gemmill-Herren, S. S. Greenleaf, A. M. Klein, M. M. Mayfield, L.
A. Morandin, A. Ochieng, and B. F. Viana. 2008. Landscape effects on crop
pollination services: are there general patterns? Ecology Letters 11:499-515.
Root, R. B. and P. M. Kareiva. 1984. The Search for Resources by Cabbage Butterflies
(Pieris-Rapae) - Ecological Consequences and Adaptive Significance of
Markovian Movements in a Patchy Environment. Ecology 65:147-165.
Roubik, D. W. 1980. Foraging Behavior of Competing Africanized Honeybees and
Stingless Bees. Ecology 61:836-845.
Sargent, R. D. 2003. Seasonal changes in pollen-packaging schedules in the protandrous
plant Chamerion angustifolium. Oecologia 135:221-226.
Schaffer, W. M., D. B. Jensen, D. E. Hobbs, J. Gurevitch, J. R. Todd, and M. V. Schaffer.
1979. Competition, Foraging Energetics, and the Cost of Sociality in 3 Species of
Bees. Ecology 60:976-987.
Schaffer, W. M., D. W. Zeh, S. L. Buchmann, S. Kleinhans, M. V. Schaffer, and J.
Antrim. 1983. Competition for Nectar between Introduced Honey Bees and
Native North-American Bees and Ants. Ecology 64:564-577.
Schneider, S. S. and H. G. Hall. 1997. Diet selection and foraging distances of African
and European-African hybrid honey bee colonies in Costa Rica. Insectes Sociaux
44:171-187.
Schoener, T. W. 1971. Theory of Feeding Strategies. Annual Review of Ecology and
Systematics 2:369-404.
Sih, A. and M. S. Baltus. 1987. Patch Size, Pollinator Behavior, and Pollinator Limitation
in Catnip. Ecology 68:1679-1690.
51
Sokal, R. R., Rohlf, FJ 1995. Biometry: the principles and practice of statistics in
biological research. 3rd edition. WH Freeman, New York, N.Y.
Soto-Pinto, L., Y. Romero-Alvarado, J. Caballero-Nieto, and G. S. Warnholtz. 2001.
Woody plant diversity and structure of shade-grown-coffee plantations in
Northern Chiapas, Mexico. Revista de Biologia Tropical 49:977-987.
Spivak, M., D. J. C. Fletcher, and M. C. Breed. 1991. The “African” Honey Bee.
Westview, Boulder, CO.
Srinivasan, M. V., S. W. Zhang, M. Lehrer, and T. S. Collett. 1996. Honeybee navigation
en route to the goal: Visual flight control and odometry. Journal of Experimental
Biology 199:237-244.
Steffan-Dewenter, I., U. Munzenberg, C. Burger, C. Thies, and T. Tscharntke. 2002.
Scale-dependent effects of landscape context on three pollinator guilds. Ecology
83:1421-1432.
Steffan-Dewenter, I., S. G. Potts, and L. Packer. 2005. Pollinator diversity and crop
pollination services are at risk. Trends in Ecology & Evolution 20:651-652.
Steffan-Dewenter, I. and C. Westphal. 2008. The interplay of pollinator diversity,
pollination services and landscape change. Journal of Applied Ecology 45:737-
741.
Tautz, J., S. W. Zhang, J. Spaethe, A. Brockmann, A. Si, and M. Srinivasan. 2004.
Honeybee odometry: Performance in varying natural terrain. PLoS Biology
2:915-923.
Totland, O. and I. Matthews. 1998. Determinants of pollinator activity and flower
preference in the early spring blooming Crocus vernus. Acta Oecologica-
International Journal of Ecology 19:155-165.
Veddeler, D., A. M. Klein, and T. Tscharntke. 2006. Contrasting responses of bee
communities to coffee flowering at different spatial scales. Oikos 112:594-601.
Winfree, R., N. M. Williams, J. Dushoff, and C. Kremen. 2007. Native bees provide
insurance against ongoing honey bee losses. Ecology Letters 10:1105-1113.
Yamamura, K. 1999. Relation between plant density and arthropod density in cabbage.
Researches on Population Ecology 41:177-182.
Yamamura, K. 2002. Biodiversity and stability of herbivore populations: influences of
the spatial sparseness of food plants. Population Ecology 44:33-40.

52
Chapter IV: Local agroforestry landscapes mediate bee community composition
ABSTRACT
Though many studies have indicated that tropical bee communities are influenced by
landscape composition, few have investigated the relative importance of both local and
landscape-level habitat parameters in supporting diverse bee communities, especially in
complex human-altered landscapes. Coffee agroforestry systems, which exhibit wide-
ranging habitat management styles, are dependent on robust pollinator communities for
improved coffee yields. In this study, we used pan-traps to examine tropical bee
communities across seven different coffee agroforestry systems in Chiapas, Mexico.
Results indicate that the most predictive factors for bee abundance and diversity are the
number of tree species and the number of flowering tree species within the local
agroforestry landscape. In contrast, community composition did not change substantially
across local and landscape-level habitat gradients. Solitary bees were more abundant in
habitats with less canopy cover and greater understory plant species richness, while social
bees were more abundant in habitats with greater tree species richness and lower coffee
density. For cavity-nesting and ground-nesting bees, abundance was positively affected
by the number of tree species in the farm. Wood-nesting bees were most abundant in
habitats with greater canopy cover and landscape-level forest cover. Overall, across
sociality groups, nesting guilds, and tribes, we found that within-farm local habitat
management was more predictive of bee abundance than landscape-level forest
distributions. Specifically, our results highlight the importance of overstory tree
management in supporting native bee abundance and species richness within shade coffee
agroecosystems.

53
INTRODUCTION
Bee communities are critically important for ecosystem function and the maintenance of
the human agricultural enterprise through their pollinating activities. For example an
estimated 70% of world crops experience increased size, quality, or stability because of
pollinator services (reviewed in Ricketts et al. 2008), benefitting 35% of the global food
supply (reviewed in Klein et al. 2007). Animal pollination also contributes to the
stability of food prices, food security, food diversity, and human nutrition (Steffan-
Dewenter et al. 2005) and is estimated to be worth $200 billion worldwide (Kearns et al.
1998). Unfortunately, native pollinator populations face many threats, and evidence of a
global pollination crisis is steadily growing (Buchman 1996, Allen-Wardell et al. 1998,
Kearns et al. 1998, Larsen et al. 2005, Steffan-Dewenter et al. 2005, Biesmeijer et al.
2006, Winfree 2008). Acute declines in managed honeybee populations are cause for
further concern (Johnson 2007), with recent studies indicating that a reliance on managed
honeybees for crop pollination is risky at best (Winfree et al. 2007, Winfree et al. 2008).
Despite fears of pollinator shortages and strong ecological and agricultural
dependencies on pollination services, we are just beginning to understand how
anthropogenic land use impacts wild and managed pollinators. Though crop pollinators
include a wide array of insects (e.g., beetles, butterflies, flies), bees are the most
important and effective of these pollinators (Roubik 1995, Klein et al. 2007). The bees
(Hymenoptera: Apoidea) comprise of an extremely species-rich fauna, with an estimated
20,000 – 30,000 species worldwide (Michener 2000). Furthermore, bees are ecologically
and functionally diverse, foraging on a broad array of floral forms and nesting in a wide
variety of substrates (Michener 2000). Many of the world‟s crops are primarily and
effectively pollinated by wild native bees, rather than managed honeybees (Kremen et al.
2002b, Kremen et al. 2004, Steffan-Dewenter et al. 2005, Klein et al. 2007, Kremen et al.
2007, Ricketts et al. 2008, Steffan-Dewenter and Westphal 2008). Moreover, recent
studies have revealed that crops experience higher or more stabilized fruit set in habitats
with greater native bee diversity (Kremen et al. 2002b, Klein et al. 2003b, reviewed in
Klein et al. 2007, Hoehn et al. 2008, Vergara and Badano 2009, Winfree and Kremen

54
2009), a pattern explained by the greater niche complementarity existing between
functional groups within diverse communities (reviewed in Fenster et al. 2004, Hooper et
al. 2005, Cardinale et al. 2006, Hoehn et al. 2008).
Diverse pollinator communities are especially essential in the tropics, where the
vast majority of plant species are animal pollinated (Bawa et al. 1985, Bawa 1990).
Tropical regions are home to immense faunal and floral diversity, and encompass many
of the world‟s biodiversity hotspots (Myers et al. 2000). Tropical regions also contribute
substantially to global agriculture and are predominantly comprised of a mosaic of forest
patches and agricultural lands (Lambin et al. 2003, Donald 2004, Perfecto and
Vandermeer 2008). In particular, coffee (Coffea arabica and Coffea robusta) are a
cornerstone of tropical export agriculture and are found almost exclusively in tropical
regions (Perfecto et al. 1996, Donald 2004). Coffee covers over 11 million ha worldwide
and provides income for 25 million people, most of whom are small landholders and
laborers (Donald 2004).
Traditionally, coffee is grown under a canopy of shade trees, which provide food
resources, nitrogen fixation (Perfecto et al. 1996, Moguel and Toledo 1999), soil erosion
prevention (Lin 2007, Lin and Richards 2007, Philpott et al. 2008b) and habitat for birds
and bats that serve as coffee pest predators (Greenberg et al. 2000, Perfecto et al. 2004,
Van Bael et al. 2008, Williams-Guillen et al. 2008). However, in recent years, with the
increased availability of fertilizers, pesticides, and machines, many coffee farms have cut
their shade trees and intensified their farming practices, creating homogenous fields of
coffee that lack vegetation structure or diversity (Perfecto et al. 1996, Donald 2004).
Tropical forest destruction threatens forest-dwelling organisms (Challenger 1998, Geist
and Lambin 2002, Lambin et al. 2003) and can also disturb bee communities within
adjacent agricultural systems, if the communities are dependent on local forest patches or
natural areas (e.g., Steffan-Dewenter et al. 2002, Kremen et al. 2004, Greenleaf and
Kremen 2006, Klein et al. 2006, Klein et al. 2008).
In addition to regional forest distributions, local agroforestry habitat can be
critical in organizing native bee communities within coffee regions (reviewed in Klein et
al. 2008). Studies have found that understory flowering, including coffee and herbaceous
plants, is one of the most predictive local factors of bee abundance and diversity (Klein et
55
al. 2003c, De Marco and Coelho 2004, Veddeler et al. 2006). However, because of a
research emphasis on coffee pollination services, many bee surveys have documented
habitat factors primarily within the understory, and have examined bee communities only
during the coffee blooming period. Additionally, while it is established that bee
communities respond to habitat factors at multiple scales (e.g., Steffan-Dewenter et al.
2002, Westphal et al. 2003, Tylianakis et al. 2006, Veddeler et al. 2006), little is known
about the relative importance of local vs. landscape-level agroforestry factors in
predicting native bee diversity and abundance.
In this study, we investigate the effects of local and landscape-level habitat on bee
abundance and diversity across a coffee growing region in Chiapas, Mexico, using
regression trees (Morgan and Sonquist 1963, Breiman et al. 1984) to examine the most
critical habitat variables driving bee abundance and diversity. We also separately
examine the responses of multiple functional groups within the bee community (based on
sociality, evolutionary history, and nesting) in order to reveal group-specific habitat
requirements. We hypothesize that overall bee diversity and abundance will respond
primarily to forest cover at both local and landscape-level scales. Based on previous
studies, we conjecture that bee functional groups will differ in their responses to local and
landscape habitat factors, but will share strong responses to coffee flowering and forest
cover.
METHODS
Study sites
The study was conducted in the Soconusco, a coffee-growing region located in the
southern foothills of Chiapas, Mexico (15°10‟59‟‟N, 92°20‟44‟‟W (NW corner) to
15°08‟52‟‟N, 92°18‟33‟‟W (SE corner)) at an altitude ranging between 825 and 1300m
(Figure 4.1, Table 4.1). The study area covers approximately 51.8 km2 and is comprised
of a mosaic of coffee farms and forest fragments. In the study region, coffee is
predominately cultivated in the semi-traditional style, under a canopy of overstory trees
that varies in density and diversity depending on the vegetation management style

56
employed in each agroforestry system (Perfecto et al. 1996, Moguel and Toledo 1999,
Soto-Pinto et al. 2001). We examined seven agroforestry systems which vary
substantially in their overtory and understory vegetation management styles. The sites
range from traditional/commercial polycultures to shade monocultures (Moguel and
Toledo 1999, Philpott et al. 2008a)(Figure 4.2).
In each site, we established a 100m x 100m (1 ha) plot, and measured the
following seasonal agroforestry habitat variables: 1) the density and diversity of
overstory trees (trees), 2) the DBH of shade trees (for basal area), 3) the density of
understory coffee bushes, and 4) the plot elevation. We counted all coffee plant
individuals in the 1-ha plot, as well as all trees, which were identified to species and
measured for diameter at breast height. Elevation was measured with a GPS unit
(Trimble GeoExplorer 3) at the SE corner of each plot.
Bee sampling
Within each plot, bees were captured using a pan trap methodology, according to the Bee
Inventory Plot guidelines (LeBuhn et al. 2005). Pan traps are easy to standardize across
sites, decrease the risk of collector‟s bias, and are extremely effective at trapping, thus
they are considered the most practical and informative sampling methodology for bees
(Westphal et al. 2008). Using the Bee Inventory Plot pan trap methodology, we laid 30
pan traps made from 6 oz plastic bowls (SOLO model number: PB6-0099) across two
intersecting 50m transects located in the center of each plot. Before the experiment, 1/3
of the bowls were painted fluorescent blue, 1/3 painted fluorescent yellow and 1/3 left
white, and the colors were alternated along the two transects. Bowls were then filled
with a soapy water solution (1 tsp Dawn® blue soap per gallon water). The fluorescent
colors attract bees, and the soapy water traps them in the pan (e.g., Kearns and Inouye
1993, LeBuhn et al. 2005). To ensure pan trap visibility, coffee branches hanging above
the pan traps were trimmed.
Pan traps were set out at all plots at 9am and collected at 5pm once every two
weeks from Feb 2nd
- April 13th
2006. This period extends from the middle of the dry
season to the beginning of the wet season in southern Mexico. We processed the
specimens on each sampling day by pinning and identifying them to genus or subgenus

57
level. For species-level identifications, we referred to local collections at El Colegio de
la Frontera Sur in Tapachula, Mexico and the expertise of T. Griswold, at the USDA Bee
Lab in Logan, Utah. For some individuals, we could not arrive at species-level
classifications, thus we left their classification at the genus level (with a morphospecies
label). Because many bee groups do not have adequate taxonomic treatments (Michener
2000), especially in the tropics, identification to the morphospecies level was necessary,
and previous work shows that morphospecies-level identifications can serve as a good
proxy in the estimation of species richness (Oliver and Beattie 1996).
Local agroforestry management
Plots were also sampled for daily agroforestry habitat variables once every two weeks
from Feb 2nd
- April 13th
2006, one day after bee sampling days. On each sampling day,
we measured: 5) the density and richness of understory plants in flower, 6) the percent of
coffee bushes in flower, 7) the percent of canopy cover, 8) the percent ground cover, and
9) the density and richness of angiosperm trees in flower (hereafter flowering trees). To
monitor the density and richness of understory plants in flower and the percent of coffee
bushes in flower per plot, we established four 10 x 4m transects, starting with a random
starting point, continuing 10m in the four cardinal directions for each of the four plots.
Transects did not overlap or extend outside of the plot. On each sampling day, we
counted and identified to species all individual understory plants in flower within each
transect. For each transect, we calculated the percent of coffee bushes in flower by
dividing the number of branches in flower by the total number of branches for each bush,
and then averaging across all bushes in each transect. Canopy cover and ground cover
were recorded along the diagonals of each 1 ha plot using a gridded densiometer,
recording the vegetation cover overhead (canopy cover) and the vegetation cover on the
ground (ground cover) every three meters for a total of 46 sampling points for each index.
This was then averaged per plot. We measured the density and richness of trees in flower
throughout the entire plot based on counts taken using binoculars.
Forest cover

58
For each plot, we also measured the percent of primary forest cover within 100m, 500m,
and 1km radii, based on a panchromatic IKONOS® image with 1m spatial resolution
(Land Info Worldwide Mapping, 2007). The image was taken on 10 December 2005 and
had negligible cloud cover. The image was orthorectified and ground-truthed using a 20-
30 points taken at all sampling sites within the region. Boundaries between coffee farms
and forest fragments were measured using the visual aid of the panchromatic image and
with the textural and reflectance patterns of a chlorophyll composite provided by the
multispectral image (spectral bands 4-3-1, 4m spatial resolution). Area of forest within
each radius was calculated using the software ArcMap9.2 (ESRI, 1999-2006).
Statistical Analyses
To meet conditions of normality, all counts and proportions were log(x+1) transformed,
and all variables were first tested for colinearity (Sokal 1995). Density of trees and basal
area were colinear, so they were not tested simultaneously in the analyses. Species
accumulation and estimation curves were generated using the Chao1 estimator (Chao
1987), utilizing the EstimateS software (Colwell and Coddington 1994). To determine
the most important factors predictive of bee abundance at the sociality, nesting guild and
tribe level, we used regression trees. We built regression trees utilizing the rpart package
in the programming language R (R Development Core Team, 2005).
The regression tree is a non-parametric modeling approach that utilizes a
recursive data-partitioning algorithm that chooses the single best predictor variable, and
splits the data into two sections (nodes) based on that variable. Regression trees are
commonly used to examine patterns in ecological data(Recknagel 2001), and are
especially useful for developing habitat models where factors may interact in a
hierarchical fashion (reviewed in De'ath and Fabricius 2000, Olden et al. 2008).
Regression trees are not violated by repeated measures and do not assume linearities in
response variables. Each regression tree model began by including all seasonal and daily
agroforestry habitat variables and forest cover at each of the three radii. After the first
partition, each node is then further split based on the next best predictor variable
(Breiman et al. 1984). To prevent over-fitting, the rpart subroutine splits branches based

59
on a cost complexity value which balances model complexity with model fit. In the
graphical depictions of the regression tree analyses (Figs. 4.6-4.8) the importance of each
predictor variable corresponds to the length of the vertical line (branch) below each split.
RESULTS
Local and landscape-level agroforestry management
Sites exhibited a wide range of seasonal agroforestry management levels, varying
between 13.2% and 69.4% canopy cover and 162 to 258 trees per ha (Table 4.1). Across
all sites and sampling periods, we documented 25 tree species (6 flowered during the
season) and 16 understory flowering plant species (Table 4.2). Coffee flowering began in
the 6th
week of the survey and lasted 9 days across the entire region. Coffee cultivation
accounted for approximately 93.7% of the entire study area and forest for the remaining
6.3%. For the each plot, local forest cover within a 100m to 1km radius ranged between
0.0% and 14.2%.
Bee communities
We trapped a total of 648 bees, including 46 different species representing three families:
Halictidae (72.2%), Apidae (27.5%), and Anthophoridae (0.3%)(Table 4.3). Observed
species accumulation curves (Figure 4.3) approach but do not reach a plateau, and the
estimated species richness in the region is 59 species. For the entire bee community, the
most critical variable for predicting both bee abundance and bee species richness is the
total number of tree species (Figure 4.4). Based on regression tree analyses, tree
diversity explained 46.98% of the variation for bee abundance, and explained 33.02% of
the variation for species richness (regression trees not shown). Overall bee community
composition (tribe level) did not vary substantially based on a gradient of forest cover or
tree diversity, but did show a weak trend of increasing tribe diversity with increasing tree
diversity (Figure 4.5).

60
Given the diverse composition of the sampled bee community, and the likely
divergence in responses to agroforestry management depending on 1) sociality, 2)
evolutionary history (tribe), and 3) nesting guild, we separately examined bee abundance
in response to habitat factors within these three groups. All optimal trees at the sociality,
tribe, and nesting guild levels were 3-branched. Of the nine predictor variables
measured, six variables were selected in the construction of all six regression trees. The
variation explained by each model was relatively high for bee groups, ranging between
20.0% and 56.9%.
Sociality, Tribes and Nesting Guilds
The most predictive factors for solitary bee abundance were percent canopy cover and the
number of herb species flowering, while the most predictive factors for social bee
abundance were the number of tree species, followed by the coffee bush density (Figure
4.6). For the tribe Halictini, the factors with the greatest effect on bee abundance were
the number of tree species and the number of flowering tree species. For the tribe
Augochlorini, the factors showing the greatest effect on bee abundance were the density
of trees, followed by the density of coffee bushes. For the tribe Ceratinini, the traits that
showed the greatest effect on bee abundance were percent canopy cover and the number
of flowering tree species (Figure 4.7).
The most predictive factors for cavity-nesting bee abundance were the number of
tree species and the percent canopy cover within a plot. The factors that showed the
greatest effect on wood-nesting bee abundance were the percent canopy cover, followed
by the percent of forest cover within a 500m radius. The most predictive factors for
ground-nesting bee abundance were the number of tree species, followed by the number
of flowering tree species (Figure 4.8).
DISCUSSION

61
Bee communities
We found that within-farm local habitat management was more predictive of bee
abundance than native forest cover at all scales. A number of other studies have also
found that bee diversity levels may not respond to native habitat fragment size or
availability (Donaldson et al. 2002, Cane et al. 2006, Brosi et al. 2008), a pattern
potentially explained by enhanced nesting opportunities in the human-managed matrix
(Cane et al. 2006). These findings and ours contrast many previous studies which
emphasize the importance of forest proximity and size in providing resources for bees
within agroforestry systems (Aizen and Feinsinger 1994, Klein et al. 2003c, b, De Marco
and Coelho 2004, Ricketts 2004, Ricketts et al. 2004, reviewed in, Klein et al. 2008,
Ricketts et al. 2008, Vergara and Badano 2009). This distinction in response is likely due
to differences in bee community composition and analytical approach (Cane 2001, Brosi
et al. 2008), as well as differences in sampling duration and floral resource levels
between these studies.
To begin, the bee community in this study is dominated by small-bodied bees
within the Halictini, Augochlorini, and Ceratinini, which likely respond differently to
habitat than larger bodied, more forest dependent tribes like the Apini or Meliponini.
Many previous studies documenting changes in bee diversity or community composition
in response to local forest distributions have examined bee communities comprised
largely of bees within the Apini and Meliponini tribes (Brown and Albrecht 2001, Klein
et al. 2003c, Ricketts 2004, Brosi et al. 2007, Brosi et al. 2008). Second, the strong
dependencies on forest proximity seen in studies conducted within coffee systems may
exist only during the ephemeral coffee bloom, but may not be as critical for bee
communities across a longer sampling season. Non-linear dependencies on alternative
floral and nesting resources across the season may also be more easily revealed by
regression tree analyses than by linear regression-based statistical analyses.
Additionally, it is possible that traditional Mexican shade coffee farms exhibit
higher levels of overstory and understory plant richness than other agroforestry systems
(Moguel and Toledo 1999), potentially making local nesting and floral resource levels
more abundant in this study system. Due to a complex history of agriculture-related
deforestation in Chiapas (reviewed in Ramirez-Marcial et al. 2001) forest cover is low

62
and therefore may not play a critical role in providing bee habitat within this region.
Many coffee regions across the tropics are similarly deforested (Perfecto et al. 1996,
Donald 2004), and while native forest preservation is paramount to biodiversity
conservation, most coffee cultivators can only implement land-use change within their
own farms (Philpott et al. 2008b). Our study indicates that local habitat factors, managed
within agroforestry systems, can have strong impacts on local bee abundance and
diversity, potentially improving coffee yields.
Sociality groups
Overall, solitary bees showed the greatest response to low levels of canopy cover and
high understory flowering plant richness. These results echo the findings of many studies
conducted within tropical agricultural systems, all of which document increasing solitary
bee abundance with increasing light intensity and flowering herb cover (Klein et al. 2002,
Klein et al. 2003c, Tylianakis et al. 2006). Reduced canopy cover often leads to
increased understory plant growth and bloom, especially in farms that do not frequently
cut back herbaceous growth. In contrast, for social bees, we documented strong
preferences for high tree species richness and low coffee bush density. Higher tree
species richness and sparser coffee cover may provide social bees with more suitable
nesting options, given that many social bees are wood or ground-nesters (Michener
2000). We did not find that forest cover influenced social bee abundance, as noted in
some studies (Klein et al. 2003c, Ricketts 2004, Brosi in press). Similar to the patterns
documented by Klein and colleagues (2002), our study suggests that social bee
abundance increases with increasing vegetation diversity and density. Additionally, our
results demonstrate that social bee abundance is specifically related to the species
richness of shade trees within an agroecosystem, a novel result to our knowledge.
Tribes
Across all three tribes, nest and forage resource availability were both key factors
predictive of bee abundance. The tribe Halictini includes both solitary and social species
that usually nest within the ground in simple burrows. They are polylectic and provision
their offspring with a large quanity of food resources at the time of oviposition (reviewed
63
in Sakagami and Michener 1962, Michener 2000, Plateaux-Quenu 2008). We found that
the key variables influencing halictine bee abundance were high tree species richness and
high species richness of trees in flower. Given their ground-nesting behavior, these
results indicate that floral resources are the primary drivers of halictine bee abundance
within coffee growing regions. Like the Halictini, the Augochlorini are a polylectic tribe
(Engel 2000) including both solitary and social species. The augochlorines nest both in
the ground and in dead or decaying plant matter (e.g., Eickwort and Sakagami 1979,
Wcislo et al. 2003, Brosi et al. 2006). The key factors predictive of augochlorine
abundance in this study were high tree density, followed by high coffee density. Both
trees and coffee bushes provide potential nesting resources, thus augochlorine bee
response appears to be driven primarily by local nest site availability. The Ceratinini
tribe includes small bees which nest in pithy stems (Okazaki 1992, McIntosh 1996,
Michener 2000). They are polylectic and could potentially provide crop pollination
services (Sakagami and Maeta 1977). We found that ceratinines responded most to high
canopy cover and high species richness of flowering trees. The strong response of
ceratinines to increased canopy cover is expected, given that dense canopy cover
provides greater access to stem nesting sites. Increased abundance in the presence of
high flowering tree species richness indicates that diverse floral resources are also critical
in sustaining high local densities of ceratinine bees.
Nesting guilds
Bee nesting guilds were distinct in their responses to habitat factors, but did not show a
universal response to coffee flowering or forest cover, as hypothesized. Cavity-nesting
bees were most abundant in habitats with high tree species richness and high canopy
cover, indicating that nesting resources are the key factors influencing their local
abundance. Previous studies have shown that cavity-nesting bees may be influenced by
cavity size and shape (Schmidt and Thoenes 1992) and exhibit greater abundance in
habitats with greater cavity availability (Potts et al. 2005). In our study, higher canopy
cover and tree species richness lead to greater diversity in canopy complexity, and
potentially greater cavity availability and size variation. Because dense canopy cover is a

64
result of little to no overstory tree pruning, our results suggest that diverse and relatively
unpruned shade tree management can lead to greater cavity-nesting bee abundance.
We found that high canopy cover was the habitat factor most predictive of wood-
nesting bee abundance. These results echo those of past studies, which have shown that
wood-nesting bees display preferences for sites with greater woody vegetation density,
such as regenerating scrub lands (Potts et al. 2005) and abandoned coffee farms
(Tylianakis et al. 2005). Additionally, many of the wood-nesting species in our study are
stem-nesting bees within the Ceratinini, a tribe which exhibits distinct preferences for old
stems and branches that are often found in the canopy. Our analysis revealed that the
second most important factor for wood-nesting bees is forest coverage within a 500m
radius. Wood-nesting bees were the only guild which exhibited a response to landscape-
level forest resources, likely due to the presence of large, and thus long ranging
(Greenleaf et al. 2007) guild members. We observed a number of large-bodied carpenter
bees (genus Xylocopa), a genus known for extensive foraging ranges, often averaging
over 1 km (Pasquet et al. 2008). Carpenter bees also show a strong preference for nesting
in decaying trees and branches (Michener 2000), a habitat more abundant in forest
fragments. Similar dependences on forest proximity have been documented for other
wood-nesting bees (Tylianakis et al. 2005, Klein et al. 2006, Brosi et al. 2008, Brosi in
press) and for bee communities across a wide range of ecological settings (Steffan-
Dewenter et al. 2001, Kremen et al. 2002b, Steffan-Dewenter et al. 2002, Klein et al.
2003b, Ricketts 2004, Chacoff and Aizen 2006, reviewed in Ricketts et al. 2008).
Ground-nesting bee abundance responded to high tree species richness and high
species richness of flowering trees, but did not show any response to ground vegetation
cover. Thus our results depart from previous studies, where ground-nesting bees
demonstrate preferences for nest sites with minimal vegetation (Wuellner 1999) and
exhibit increased numbers in habitats with greater bare ground availability (Potts et al.
2005). However, other studies conducted within agricultural systems have found that
ground-nesting bee abundance is often highest near forested semi-natural habitat, due to
better nest site availability and less disturbance (Kim et al. 2006). These forested areas
also provide bees with floral resources that are critical when local crops are not flowering
(Kremen et al. 2002a, Kim et al. 2006). In our study, response to non-crop flowering

65
trees suggests that diverse local floral resources are essential for robust ground-nesting
bee communities.
General patterns
Overall, our results suggest that coffee flowering alone does not drive neotropical bee
abundance and diversity within coffee agroforestry systems. Though coffee flowering
provides a diverse spectrum of bees with abundant floral resources, these resources are
only available in short bursts, often for only a few days at a time (Klein et al. 2003b, c, a,
Ricketts 2004, Veddeler et al. 2006). Alternatively, non-crop vegetation, such as
flowering field margins and hedge rows, have been shown to provide pollinators with
floral resources during and outside of the crop flowering season (Marshall 2002, Carvell
et al. 2004, Ockinger and Smith 2007, Dover and Settele 2009). Likewise, we found that
shade trees were critical in supporting native bee diversity and abundance by providing
alternative floral and nesting resources within agroforestry systems. While previous
studies demonstrate that the flowering of understory plants (coffee and herbaceous
plants) affects bee abundance and diversity within coffee farms (Klein et al. 2003c, De
Marco and Coelho 2004, Veddeler et al. 2006), no studies have examined the role of
shade tree management in supporting native bee communities.
Specifically, we found greater bee abundance and species richness in habitats with
greater flowering tree richness. Across agricultural and non-agricultural landscapes,
many studies have also shown that the diversity of flowering plant species is positively
correlated with bee abundance and species richness (Banaszak 1996, Steffan-Dewenter
and Tscharntke 2001, Potts et al. 2003). In contrast, we did not find that floral density
played a critical role in driving local bee abundance or diversity, as seen in a number of
studies (Klein et al. 2003b, c, Hegland and Boeke 2006, Ebeling et al. 2008). Pollinators
in our study may be more specialist in their floral preferences, as is common in tropical
systems (Bawa et al. 1985, Bawa 1990), thus their abundance and diversity responds to
increasing floral diversity more consistently than to increasing floral density. Given that
increased bee diversity leads to increased fruit set for coffee (Klein et al. 2003b, Vergara
and Badano 2009), our results indicate that diversifying trees within shade coffee farms
may increase per bush coffee yields.
66
Conclusions
Positive responses to resource diversity and habitat heterogeneity abound in ecology.
Across ecological systems and organisms, habitat heterogeneity is a key driver of patch
colonization (Gustafson and Gardner 1996, Kindlmann and Burel 2008) and increased
species richness and abundance (e.g., Macarthur and Macarthur 1961, Williams 1964,
Murdoch et al. 1972, Shmida and Wilson 1985, Loyola and Martins 2008, Tylianakis et
al. 2008). Bees and other animals that forage on multiple food sources across the year
can use heterogeneous environments to meet seasonal requirements and maintain their
foraging needs over extended periods of time (Rice et al. 1980, Karr and Freemark 1983,
Griffis-Kyle and Beier 2005). For bees in particular, high habitat heterogeneity can lead to
high species richness and abundance across the landscape (Steffan-Dewenter et al. 2002,
Potts et al. 2003, Brosi et al. 2007, Ebeling et al. 2008, Loyola and Martins 2008, Krauss et
al. 2009). Not surprisingly, across taxa, declines in habitat heterogeneity are the key
drivers of biodiversity loss within agricultural landscapes (Benton et al. 2003).
For native bee communities within Mexican agroforestry systems, we found that
floral and nesting resource heterogeneity was more critical than landscape-level forest
cover. The most critical factors predictive of bee abundance were related to vegetation
management within coffee farms, indicating that coffee farmers do not need to rely solely
on landscape-level forest patches to provide pollinator resources. Instead, farmers can
contribute to biodiversity conservation by creating more hospitable and resource rich
agricultural matrices (i.e., Perfecto and Vandermeer 2008). Specifically, shade coffee
farmers can promote bee abundance and diversity within their own farms by diversifying
their shade trees, allowing these trees to age, and by creating a mosaic of light gaps and
flowering herb patches that will attract foraging pollinators. Given the tremendous
benefit of insect pollination to coffee yields, there is great incentive for farmers to
improve agroforestry management, dually garnering ecosystem services and supporting
biodiversity conservation.

67
ACKNOWLEDGEMENTS
We would like to thank Berry, Brosi, Luis Fernando Chavez, Beverly Rathcke, Ivette
Perfecto, Mike Reiskind, Exzequel Velasquez, Gabriel Dominguez Martinez, the
Vandermeer lab group, the Rathcke lab group, and the Perfecto lab group at the
University of Michigan for help in the design and writing of this project. We would also
like to thank Terry Griswold and Olivia Messenger at the USDA Bee Lab in Logan,
Utah, for their generous assistance with bee identifications. Finally, we would like to
express our gratitude to the people of Nueva Alemania for their permission and assistance
in conducting this study. All experiments conducted were in compliance with current
laws governing biodiversity protection in Mexico.

68
TABLES, FIGURES AND LEGENDS
Table 4.1 Local seasonal agroforestry characteristics at each study site.
Site (Map
name)
Land Use
Classification*
%
Canopy
cover
# of
tree
species
(per
m2)
Tree
density
(per
m2)
Coffee
density
(per
m2)
Basal
area
overstory
trees (per
ha)
Irlanda (IR)
Traditional/
Commercial
Polyculture
62.6 0.0018 0.0167 0.36 6.55
Rancho
Allegre (RA)
Traditional/
Commercial
Polyculture
59.5 0.0017 0.0216 0.32 3.44
Chiripa (CH)
Traditional/
Commercial
Polyculture
28.4 0.0017 0.0162 0.43 4.44
Santa Anita
(SA)
Commercial
Polyculture 69.4 0.0013 0.0258 0.32 6.53
Genova (GE)
Commercial
Polyculture/
Shade
monoculture
13.2 0.0017 0.0177 0.26 4.03
Hamburgo
North (HN)
Shade
monoculture 36.0 0.0014 0.0153 0.45 3.50
Hamburgo
South (HS)
Shade
monoculture 29.8 0.0012 0.0151 0.46 3.96
* based on vegetation management (for additional details, see Philpott et al. 2008b)

69
Table 4.2 Species list of overstory trees (OT), overstory trees in flower (OTF) and
understory plants in flower (UPF) recorded over the 12 week sampling period.
Family Genus Habit and Flowering
Agavaceae Yucca elephantipes OT
Anacardiaceae Mangifera indica OT
Apocynaceae Aspidosperma cruentum OT
Asteraceae Veronia deppeana OTF
Bidens pilosa UPF
Elephantopus mollis UPF
Galinsoga quadriradiata UPF
Impatiens walleriana UPF
Commelina diffusa UPF
Balsaminaceae Ipomoea sp. UPF
Commelinaceae Bidens pilosa UPF
Convolvulaceae Elephantopus mollis UPF
Euphorbiaceae Alchornea latifolia OT
Fabaceae Desmodium sp. UPF
Schizolobium parahybum OT
Inga lauriana OT
Inga michelieae OTF
Inga vera OTF
Inga rodrigueziana OT
Pithecellobium sp OT
Lauraceae Persea americana OT
Cinnamomum sp. OT
Nectandra ambligens OT
Malvaceae Belotia mexicana OT
Melastomataceae Conostegia xalapensis OTF
Miconia argentea OTF
Melastoma sp. UPF
Meliaceae Cedrela odorata OT
Trichilia mauritiana OT
Moraceae Ficus glabrata OT
Myrtaceae Syzygium jambos OTF
Rubiaceae Borreria laevis UPF
Rutaceae Citrus sinesis OT
Solanaceae Cestrum nocturnum OTF
Browallia americana UPF
Solanum sp. UPF
Ulmaceae Trema micrantha OT Verbenaceae Lantana camara UPF

70
Table 4.3 Species list of bees captured over the 12 week sampling period. Individuals
listed as a „msp. MX#‟ did not match any species within reference collections while
„msp. # (T.G.)‟ matched individuals within reference collections. Nesting (Nest) and
Sociality (Soc) type are indicated as follows: ground (g), cavity (c), wood (w), social (x)
and solitary (o).
Family
Tribe Genus Species Nest Soc
Anthophoridae Eucerini Mellissodes tapaneca g o
Apidae Apini Apis mellifera, scutellata c x
Ceratinini Ceratina eximia w o
Ceratinini Ceratina ignara w o
Ceratinini Ceratina msp. 4 (T.G.) w o
Ceratinini Ceratina msp. MX1 w o
Ceratinini Ceratina trimaculata w o
Euglossini Euglossa viridissima c x
Emphorini Melitoma marginella g o
Emphorini Melitoma msp. MX1 g o
Meliponini Plebia msp. 2 (T.G.) w x
Meliponini Trigona fulviventris g x
Meliponini Trigonisca schulthess c x
Halictidae Augochlorini Augochlora aurifera w x
Augochlorini Augochlora nigrocyanea w x
Augochlorini Augochlora nominata w x
Augochlorini Augochlora quiriguensis w x
Augochlorini Augochlora sidaefoliae w x
Augochlorini Augochlora msp. 1 (T.G.) w x
Augochlorini Augochlora msp. 17 (T.G.) w x
Augochlorini Augochlora msp. 6 (T.G.) w x
Augochlorini Augochlora msp. 6 (T.G.) w x
Augochlorini Augochlorella comis g x
Augochlorini Augochloropsis msp. 10 (T.G.) g x
Augochlorini Augochloropsis msp. 5 (T.G.) g x
Augochlorini Caenaugochlora gemella g x
Halictini Dialictus picadensis g x
Halictini Dialictus msp. 12 (T.G.) g x
Halictini Dialictus msp. 17 (T.G.) g x
Halictini Dialictus msp. 19 (T.G.) g x
Halictini Dialictus msp. 21 (T.G.) g x
Halictini Dialictus msp. 37 (T.G.) g x
Halictini Dialictus msp. 42 (T.G.) g x
Halictini Dialictus msp. 49 (T.G.) g x
Halictini Dialictus msp. MX1 g x
Halictini Dialictus msp. MX2 g x
Halictini Dialictus msp. MX3 g x
Halictini Dialictus msp. MX4 g x

71
Halictini Dialictus sp. MX5 g x
Halictini Dialictus sp. MX6 g x
Halictini Dialictus sp. MX7 g x
Halictini Dialictus sp. MX8 g x
Halictini Halictus hesperus g x
Halictini Halictus sp. MX1 g x

72
Figure 4.1 Study sites in Nueva Alemania, a region in the southern portion of the state of
Chiapas, outlined in black within the inserted map of Mexico.

73
Figure 4.2 Photo of a shaded coffee agroforestry system, Finca Irlanda, where coffee
bushes line the understory, and shade trees fill the canopy. For scale, the author stands
on the bottom center of the photo.

74
Figure 4.3 Observed species accumulation curve reaching 46 species.

75
Figure 4.4 Bees are more abundant and their communities are more species rich in
habitats with a greater number of tree species (linear regression for illustration)

76
Figure 4.5 Bee community composition across a gradient of (A) tree species and (B)
local forest cover. The three most dominant tribes are labeled, while the total number of
tribes in each group is noted at the top right of each column.

77
Figure 4.6 Optimal regression trees for (A) solitary bees and (B) social bees. The
terminal nodes are labeled with the mean rating and the actual bee abundance (in
parenthesis) while the importance of each predictor variable corresponds to the length of
the vertical line below each split. The criterion listed at each split designates the left
hand side of the branch, while observations falling outside of the criterion designate the
right side of the branch. The total variation explained (sums of squares for each node) is
included at the bottom of each tree.

78
Figure 4.7 Optimal regression trees for each tribe, (A) Halictini, (B) Augochlorini, and
(C) Ceratinini. The terminal nodes are labeled with the mean rating and the actual bee
abundance in each group (in parenthesis) while the importance of each predictor variable
corresponds to the length of the vertical line below each split. The criterion listed at each
split designates the left hand side of the branch, while observations falling outside of the
criterion designate the right side of the branch. The total variation explained (sums of
squares for each node) is included at the bottom of each tree.

79
Figure 4.8 Optimal regression trees for each nesting guild, (A) cavity-nesting bees, (B)
wood-nesting bees, and (C) ground-nesting bees. The terminal nodes are labeled with the
mean rating and the actual bee abundance in each group (in parenthesis) while the
importance of each predictor variable corresponds to the length of the vertical line below
each split. The criterion listed at each split designates the left hand side of the branch,
while observations falling outside of the criterion designate the right side of the branch.
The total variation explained (sums of squares for each node) is included at the bottom of
each tree.

80
Chapter IV References
2005. R: A language and environment for statistical computing. R Development Core
Team. R Development Core Team, R Foundation for Statistical Computing, URL
http://www.R-project.org, Vienna, Austria.
Allen-Wardell, G., P. Bernhardt, R. Bitner, A. Burquez, S. Buchmann, J. Cane, P. A.
Cox, V. Dalton, P. Feinsinger, M. Ingram, D. Inouye, C. E. Jones, K. Kennedy, P.
Kevan, H. Koopowitz, R. Medellin, S. Medellin-Morales, G. P. Nabhan, B.
Pavlik, V. Tepedino, P. Torchio, and S. Walker. 1998. The potential
consequences of pollinator declines on the conservation of biodiversity and
stability of food crop yields. Conservation Biology 12:8-17.
Banaszak, J. 1996. Ecological bases of conservation of wild bees. Pages 55-62 in A.
Matheson, S. Buchmann, C. O‟Toole, P. Westrich, and I. Williams, editors. The
Conservation of Bees. Academic Press, London.
Bawa, K. S. 1990. Reproductive Ecology of Tropical Forest Plants. Unesco and
Parthenon Press, Paris and USA.
Bawa, K. S., S. H. Bullock, D. R. Perry, R. E. Coville, and M. H. Grayum. 1985.
Reproductive-Biology of Tropical Lowland Rain-Forest Trees .2. Pollination
Systems. American Journal of Botany 72:346-356.
Benton, T. G., J. A. Vickery, and J. D. Wilson. 2003. Farmland biodiversity: is habitat
heterogeneity the key? Trends in Ecology & Evolution 18:182-188.
Biesmeijer, J. C., S. P. M. Roberts, M. Reemer, R. Ohlemuller, M. Edwards, T. Peeters,
A. P. Schaffers, S. G. Potts, R. Kleukers, C. D. Thomas, J. Settele, and W. E.
Kunin. 2006. Parallel declines in pollinators and insect-pollinated plants in Britain
and the Netherlands. Science 313:351-354.
Breiman, L., J. Freidman, R. Olshen, and C. Stone. 1984. Classification and Regression
Trees. Wadsworth, Belomont, CA.
Brosi, B. J., A. Smith-Pardo, and V. H. Gonzalez. 2006. A new wood-nesting
Neocorynura (Hymenoptera : Halictidae : Augochlorini) from Costa Rica, with
notes on its biology. Zootaxa:55-68.
Buchman, G. P., and Nabhan, S.L. 1996. The Forgotten Pollinators. Island
Press/Shearwater Books.
Cardinale, B. J., J. J. Weis, A. E. Forbes, K. J. Tilmon, and A. R. Ives. 2006. Biodiversity
as both a cause and consequence of resource availability: a study of reciprocal
causality in a predator-prey system. Journal of Animal Ecology 75:497-505.
Carvell, C., W. R. Meek, R. F. Pywell, and M. Nowakowski. 2004. The response of
foraging bumblebees to successional change in newly created arable field
margins. Biological Conservation 118:327-339.
Chacoff, N. P. and M. A. Aizen. 2006. Edge effects on flower-visiting insects in
grapefruit plantations bordering premontane subtropical forest. Journal of Applied
Ecology 43:18-27.
Challenger, A. 1998. Utilización y conservación de los ecosistemas terrestres de México.
Pasado, presente y futuro. México. Conabio, IBUNAM y Agrupación Sierra
Madre.
Chao, A. 1987. Estimating the Population-Size for Capture Recapture Data with Unequal
Catchability. Biometrics 43:783-791.

81
Colwell, R. K. and J. A. Coddington. 1994. Estimating Terrestrial Biodiversity through
Extrapolation. Philosophical Transactions of the Royal Society of London Series
B-Biological Sciences 345:101-118.
De'ath, G. and K. E. Fabricius. 2000. Classification and regression trees: A powerful yet
simple technique for ecological data analysis. Ecology 81:3178-3192.
De Marco, P. and F. M. Coelho. 2004. Services performed by the ecosystem: forest
remnants influence agricultural cultures' pollination and production. Biodiversity
and Conservation 13:1245-1255.
Donald, P. F. 2004. Biodiversity impacts of some agricultural commodity production
systems. Conservation Biology 18:17-37.
Dover, J. and J. Settele. 2009. The influences of landscape structure on butterfly
distribution and movement: a review. Journal of Insect Conservation 13:3-27.
Ebeling, A., A. M. Klein, J. Schumacher, W. W. Weisser, and T. Tscharntke. 2008. How
does plant richness affect pollinator richness and temporal stability of flower
visits? Oikos 117:1808-1815.
Eickwort, G. C. and S. F. Sakagami. 1979. Classification of nest architecture of bees in
the trip Augochlorini( Hymenoptera, Halictidae, Halictinae), with description of a
Brazilian nest of Rhinocorynura-inflaticeps. Biotropica 11:28-37.
Engel, M. S. 2000. Classification of the bee tribe Augochlorini (Hymenoptera :
Halictidae). Bulletin of the American Museum of Natural History:4-89.
Fenster, C. B., W. S. Armbruster, P. Wilson, M. R. Dudash, and J. D. Thomson. 2004.
Pollination syndromes and floral specialization. Annual Review of Ecology
Evolution and Systematics 35:375-403.
Geist, H. J. and E. F. Lambin. 2002. Proximate causes and underlying driving forces of
tropical deforestation. Bioscience 52:143-150.
Ghazoul, J. 2005. Response to Steffan-Dewenter et al.: Questioning the global pollination
crisis. Trends in Ecology & Evolution 20:652-653.
Greenberg, R., P. Bichier, A. C. Angon, C. MacVean, R. Perez, and E. Cano. 2000. The
impact of avian insectivory on arthropods and leaf damage in some Guatemalan
coffee plantations. Ecology 81:1750-1755.
Greenleaf, S. S. and C. Kremen. 2006. Wild bee species increase tomato production and
respond differently to surrounding land use in Northern California. Biological
Conservation 133:81-87.
Greenleaf, S. S., N. M. Williams, R. Winfree, and C. Kremen. 2007. Bee foraging ranges
and their relationship to body size. Oecologia 153:589-596.
Griffis-Kyle, K. L. and P. Beier. 2005. Migratory strategy and seasonal patterns of bird
diversity in relation to forest habitat. American Midland Naturalist 153:436-443.
Gustafson, E. J. and R. H. Gardner. 1996. The effect of landscape heterogeneity on the
probability of patch colonization. Ecology 77:94-107.
Hegland, S. J. and L. Boeke. 2006. Relationships between the density and diversity of
floral resources and flower visitor activity in a temperate grassland community.
Ecological Entomology 31:532-538.
Hoehn, P., T. Tscharntke, J. M. Tylianakis, and I. Steffan-Dewenter. 2008. Functional
group diversity of bee pollinators increases crop yield. Proceedings of the Royal
Society B-Biological Sciences 275:2283-2291.

82
Hooper, D. U., F. S. Chapin, J. J. Ewel, A. Hector, P. Inchausti, S. Lavorel, J. H. Lawton,
D. M. Lodge, M. Loreau, S. Naeem, B. Schmid, H. Setala, A. J. Symstad, J.
Vandermeer, and D. A. Wardle. 2005. Effects of biodiversity on ecosystem
functioning: A consensus of current knowledge. Ecological Monographs 75:3-35.
Johnson, R. 2007. CRS report for congress: recent honey bee colony declines
(Government report prepared for members of committees of congress
RL33938).in R. AiAE, Science and Industry Division, editor., Washington, DC.
Karr, J. R. and K. E. Freemark. 1983. Habitat selection and environmental gradients -
dynammics in the stable tropics. Ecology 64:1481-1494.
Kearns, C. A. and D. W. Inouye. 1993. Techniques for Pollination Biologists. University
Press of Colorado, Niwot, Colorado, USA.
Kearns, C. A., D. W. Inouye, and N. M. Waser. 1998. Endangered mutualisms: The
conservation of plant-pollinator interactions. Annual Review of Ecology and
Systematics 29:83-112.
Kim, J., N. Williams, and C. Kremen. 2006. Effects of cultivation and proximity to
natural habitat on ground-nesting native bees in California sunflower fields.
Journal of the Kansas Entomological Society 79:309-320.
Kindlmann, P. and F. Burel. 2008. Connectivity measures: a review. Landscape Ecology
23:879-890.
Klein, A. M., S. A. Cunningham, M. Bos, and I. Steffan-Dewenter. 2008. Advances in
pollination ecology from tropical plantation crops. Ecology 89:935-943.
Klein, A. M., I. Steffan-Dewenter, D. Buchori, and T. Tscharntke. 2002. Effects of land-
use intensity in tropical agroforestry systems on coffee flower-visiting and trap-
nesting bees and wasps. Conservation Biology 16:1003-1014.
Klein, A. M., I. Steffan-Dewenter, and T. Tscharntke. 2003a. Bee pollination and fruit set
of Coffea arabica and C-canephora (Rubiaceae). American Journal of Botany
90:153-157.
Klein, A. M., I. Steffan-Dewenter, and T. Tscharntke. 2003b. Fruit set of highland coffee
increases with the diversity of pollinating bees. Proceedings of the Royal Society
of London Series B-Biological Sciences 270:955-961.
Klein, A. M., I. Steffan-Dewenter, and T. Tscharntke. 2003c. Pollination of Coffea
canephora in relation to local and regional agroforestry management. Journal of
Applied Ecology 40:837-845.
Klein, A. M., I. Steffan-Dewenter, and T. Tscharntke. 2006. Rain forest promotes trophic
interactions and diversity of trap-nesting hymenoptera in adjacent agroforestry.
Journal of Animal Ecology 75:315-323.
Klein, A. M., B. E. Vaissiere, J. H. Cane, I. Steffan-Dewenter, S. A. Cunningham, C.
Kremen, and T. Tscharntke. 2007. Importance of pollinators in changing
landscapes for world crops. Proceedings of the Royal Society B-Biological
Sciences 274:303-313.
Krauss, J., T. Alfert, and I. Steffan-Dewenter. 2009. Habitat area but not habitat age
determines wild bee richness in limestone quarries. Journal of Applied Ecology
46:194-202.
Kremen, C., R. Bugg, N. Nicola, S. SA, R. Thorp, and N. Williams. 2002a. Native bees,
native plants and crop pollination in California. Fremontia 30:41-49.

83
Kremen, C., N. M. Williams, M. A. Aizen, B. Gemmill-Herren, G. LeBuhn, R. Minckley,
L. Packer, S. G. Potts, T. Roulston, I. Steffan-Dewenter, D. P. Vazquez, R.
Winfree, L. Adams, E. E. Crone, S. S. Greenleaf, T. H. Keitt, A. M. Klein, J.
Regetz, and T. H. Ricketts. 2007. Pollination and other ecosystem services
produced by mobile organisms: a conceptual framework for the effects of land-
use change. Ecology Letters 10:299-314.
Kremen, C., N. M. Williams, R. L. Bugg, J. P. Fay, and R. W. Thorp. 2004. The area
requirements of an ecosystem service: crop pollination by native bee communities
in California. Ecology Letters 7:1109-1119.
Kremen, C., N. M. Williams, and R. W. Thorp. 2002b. Crop pollination from native bees
at risk from agricultural intensification. Proceedings of the National Academy of
Sciences of the United States of America 99:16812-16816.
Lambin, E. F., H. J. Geist, and E. Lepers. 2003. Dynamics of land-use and land-cover
change in tropical regions. Annual Review of Environment and Resources
28:205-241.
Larsen, T. H., N. Williams, and C. Kremen. 2005. Extinction order and altered
community structure rapidly disrupt ecosystem functioning. Ecology Letters
8:538-547.
LeBuhn, G., S. Droege, N. Williams, R. Minckley, T. Griswold, C. Kremen, O.
Messinger, J. Cane, T. Roulston, F. Parker, V. Tepedino, and S. Buchmann. 2005.
A standardized method for monitoring bee populations- The Bee Inventory Plot.
available online at http://online.sfsu.edu/~beeplot/.
Levin, S. A. 1998. Ecosystems and the biosphere as complex adaptive systems.
Ecosystems 1:431-436.
Lin, B. B. 2007. Agroforestry management as an adaptive strategy against potential
microclimate extremes in coffee agriculture. Agricultural and Forest Meteorology
144:85-94.
Lin, B. B. and P. L. Richards. 2007. Soil random roughness and depression storage on
coffee farms of varying shade levels. Agricultural Water Management 92:194-
204.
Loyola, R. D. and R. P. Martins. 2008. Habitat structure components are effective
predictors of trap-nesting Hymenoptera diversity. Basic and Applied Ecology
9:735-742.
Macarthur, R. and J. W. Macarthur. 1961. On bird species-diversity. Ecology 42:594-&.
Marshall, E. J. P. 2002. Field margins in northern Europe: Integrating agricultural,
environmental and biodiversity functions. Pages 39-67 in Symposium on Field
Boundary Habitats. Canadian Weed Science Soc, Soc Canadienne Malherbologie,
Saskatoon, CANADA.
McIntosh, M. 1996. Nest-substrate preferences of the twig-nesters Ceratina acantha,
Ceratina nanula (Apidae) and Pemphredon lethifer (Sphecidae). Journal of the
Kansas Entomological Society 69:216-231.
Michener, C. D. 2000. Bees of the World. Johns Hopkins University Press, Baltimore,
MD.
Moguel, P. and V. M. Toledo. 1999. Biodiversity conservation in traditional coffee
systems of Mexico. Conservation Biology 13:11-21.

84
Morgan, J. N. and J. A. Sonquist. 1963. Problems in analysis of survey data, and a
proposal. Journal of the American Statistical Association 58:415-&.
Murdoch, W. W., C. H. Peterson, and F. C. Evans. 1972. Diversity and Pattern in Plants
and Insects. Ecology 53:819-&.
Myers, N., R. A. Mittermeier, C. G. Mittermeier, G. A. B. da Fonseca, and J. Kent. 2000.
Biodiversity hotspots for conservation priorities. Nature 403:853-858.
Ockinger, E. and H. G. Smith. 2007. Semi-natural grasslands as population sources for
pollinating insects in agricultural landscapes. Journal of Applied Ecology 44:50-
59.
Okazaki, K. 1992. Nesting habits of the small carpenter bee, Ceratina dentipes, in
Hengchun Peninsula, Southern Taiwan. Journal of the Kansas Entomological
Society 65:190-195.
Olden, J. D., J. J. Lawler, and N. L. Poff. 2008. Machine learning methods without tears:
A primer for ecologists. Quarterly Review of Biology 83:171-193.
Oliver, I. and A. J. Beattie. 1996. Invertebrate morphospecies as surrogates for species: a
case study. Conservation Biology 10:99–109.
Pasquet, R. S., A. Peltier, M. B. Hufford, E. Oudin, J. Saulnier, L. Paul, J. T. Knudsen, H.
R. Herren, and P. Gepts. 2008. Long-distance pollen flow assessment through
evaluation of pollinator foraging range suggests transgene escape distances.
Proceedings of the National Academy of Sciences of the United States of America
105:13456-13461.
Perfecto, I., R. A. Rice, R. Greenberg, and M. E. VanderVoort. 1996. Shade coffee: A
disappearing refuge for biodiversity. Bioscience 46:598-608.
Perfecto, I. and J. Vandermeer. 2008. Biodiversity conservation in tropical
agroecosystems - A new conservation paradigm. Pages 173-200 Year in Ecology
and Conservation Biology 2008. Blackwell Publishing, Oxford.
Perfecto, I., J. H. Vandermeer, G. L. Bautista, G. I. Nunez, R. Greenberg, P. Bichier, and
S. Langridge. 2004. Greater predation in shaded coffee farms: The role of resident
neotropical birds. Ecology 85:2677-2681.
Philpott, S. M., W. J. Arendt, I. Armbrecht, P. Bichier, T. V. Diestch, C. Gordon, R.
Greenberg, I. Perfecto, R. Reynoso-Santos, L. Soto-Pinto, C. Tejeda-Cruz, G.
Williams-Linera, J. Valenzuela, and J. M. Zolotoff. 2008a. Biodiversity Loss in
Latin American Coffee Landscapes: Review of the Evidence on Ants, Birds, and
Trees. Conservation Biology 22:1093-1105.
Philpott, S. M., B. Lin, S. Jha, and S. J. Brines. 2008b. A multi-scale assessment of
hurricane impacts on agricultural landscapes based on landuse and topographic
features. Agriculture, Ecosystems and Environment 128:12-20.
Plateaux-Quenu, C. 2008. Subsociality in halictine bees. Insectes Sociaux 55:335-346.
Potts, S. G., B. Vulliamy, A. Dafni, G. Ne'eman, and P. Willmer. 2003. Linking bees and
flowers: How do floral communities structure pollinator communities? Ecology
84:2628-2642.
Potts, S. G., B. Vulliamy, S. Roberts, C. O'Toole, A. Dafni, G. Ne'Eman, and P. Willmer.
2005. Role of nesting resources in organising diverse bee communities in a
Mediterranean landscape. Ecological Entomology 30:78-85.

85
Ramirez-Marcial, N., M. Gonzalez-Espinosa, and G. Williams-Linera. 2001.
Anthropogenic disturbance and tree diversity in Montane Rain Forests in Chiapas,
Mexico. Forest Ecology and Management 154:311-326.
Recknagel, F. 2001. Applications of machine learning to ecological modelling.
Ecological Modelling 146:303-310.
Rice, J., B. W. Anderson, and R. D. Ohmart. 1980. Seasonal habitat selection by birds in
the lower Colorado river valley. Ecology 61:1402-1411.
Ricketts, T. H. 2004. Tropical forest fragments enhance pollinator activity in nearby
coffee crops. Conservation Biology 18:1262-1271.
Ricketts, T. H., G. C. Daily, P. R. Ehrlich, and C. D. Michener. 2004. Economic value of
tropical forest to coffee production. Proceedings of the National Academy of
Sciences of the United States of America 101:12579-12582.
Ricketts, T. H., J. Regetz, I. Steffan-Dewenter, S. A. Cunningham, C. Kremen, A.
Bogdanski, B. Gemmill-Herren, S. S. Greenleaf, A. M. Klein, M. M. Mayfield, L.
A. Morandin, A. Ochieng, and B. F. Viana. 2008. Landscape effects on crop
pollination services: are there general patterns? Ecology Letters 11:499-515.
Roubik, D. 1995. Pollination of cultivated plants in the tropics. Food and Agriculture
Organization of the United Nations, Rome, Italy.
Sakagami, S. and C. Michener. 1962. The Nest Architecture of Sweat Bees
University of Kansas Press, Lawrence, Kansas, U.S.A.
Sakagami, S. F. and Y. Maeta. 1977. Some presumably pre-social habits of Japanese
Ceratina bees, with notes on various social types in Hymenoptera. Insectes
Sociaux 24:319-343.
Schmidt, J. O. and S. C. Thoenes. 1992. Criteria for nest site selection in honey-bees
(Hymenoptera, Apidae) - preferences between pheromone attractants and cavity
shapes. Environmental Entomology 21:1130-1133.
Shmida, A. and M. V. Wilson. 1985. Biological determinants of species-diversity.
Journal of Biogeography 12:1-20.
Sokal, R. R., Rohlf, FJ 1995. Biometry: the principles and practice of statistics in
biological research. 3rd edition. WH Freeman, New York, N.Y.
Soto-Pinto, L., Y. Romero-Alvarado, J. Caballero-Nieto, and G. S. Warnholtz. 2001.
Woody plant diversity and structure of shade-grown-coffee plantations in
Northern Chiapas, Mexico. Revista de Biologia Tropical 49:977-987.
Steffan-Dewenter, I., U. Munzenberg, C. Burger, C. Thies, and T. Tscharntke. 2002.
Scale-dependent effects of landscape context on three pollinator guilds. Ecology
83:1421-1432.
Steffan-Dewenter, I., U. Munzenberg, and T. Tscharntke. 2001. Pollination, seed set and
seed predation on a landscape scale. Proceedings of the Royal Society of London
Series B-Biological Sciences 268:1685-1690.
Steffan-Dewenter, I., S. G. Potts, and L. Packer. 2005. Pollinator diversity and crop
pollination services are at risk. Trends in Ecology & Evolution 20:651-652.
Steffan-Dewenter, I. and T. Tscharntke. 2001. Succession of bee communities on fallows.
Ecography 24:83-93.
Steffan-Dewenter, I. and C. Westphal. 2008. The interplay of pollinator diversity,
pollination services and landscape change. Journal of Applied Ecology 45:737-
741.

86
Tylianakis, J. M., A. M. Klein, T. Lozada, and T. Tscharntke. 2006. Spatial scale of
observation affects alpha, beta and gamma diversity of cavity-nesting bees and
wasps across a tropical land-use gradient. Journal of Biogeography 33:1295-1304.
Tylianakis, J. M., A. M. Klein, and T. Tscharntke. 2005. Spatiotemporal variation in the
diversity of hymenoptera across a tropical habitat gradient. Ecology 86:3296-
3302.
Tylianakis, J. M., T. A. Rand, A. Kahmen, A. M. Klein, N. Buchmann, J. Perner, and T.
Tscharntke. 2008. Resource heterogeneity moderates the biodiversity-function
relationship in real world ecosystems. PLoS Biology 6:947-956.
Van Bael, S. A., S. M. Philpott, R. Greenberg, P. Bichier, N. A. Barber, K. A. Mooney,
and D. S. Gruner. 2008. Birds as predators in tropical agroforestry systems.
Ecology 89:928-934.
Veddeler, D., A. M. Klein, and T. Tscharntke. 2006. Contrasting responses of bee
communities to coffee flowering at different spatial scales. Oikos 112:594-601.
Vergara, C. H. and E. I. Badano. 2009. Pollinator diversity increases fruit production in
Mexican coffee plantations: The importance of rustic management systems.
Agriculture Ecosystems & Environment 129:117-123.
Waser, N. M., L. Chittka, M. V. Price, N. M. Williams, and J. Ollerton. 1996.
Generalization in pollination systems, and why it matters. Ecology 77:1043-1060.
Wcislo, W. T., V. H. Gonzalez, and M. S. Engel. 2003. Nesting and social behavior of a
wood-dwelling neotropical bee, Augochlora isthmii (Schwarz), and notes on a
new species, A-alexanderi Engel (Hymenoptera : Halictidae). Journal of the
Kansas Entomological Society 76:588-602.
Westphal, C., R. Bommarco, G. Carre, E. Lamborn, N. Morison, T. Petanidou, S. G.
Potts, S. P. M. Roberts, H. Szentgyorgyi, T. Tscheulin, B. E. Vaissiere, M.
Woyciechowski, J. C. Biesmeijer, W. E. Kunin, J. Settele, and I. Steffan-
Dewenter. 2008. Measuring bee diversity in different European habitats and
biogeographical regions. Ecological Monographs 78:653-671.
Westphal, C., I. Steffan-Dewenter, and T. Tscharntke. 2003. Mass flowering crops
enhance pollinator densities at a landscape scale. Ecology Letters 6:961-965.
Williams-Guillen, K., I. Perfecto, and J. Vandermeer. 2008. Bats limit insects in a
neotropical agroforestry system. Science 320:70-70.
Williams, C. 1964. Patterns in the balance of nature and related problems in quantitative
ecology. Academic Press, London.
Winfree, R. 2008. Pollinator-Dependent Crops: An Increasingly Risky Business. Current
Biology 18:R968-R969.
Winfree, R. and C. Kremen. 2009. Are ecosystem services stabilized by differences
among species? A test using crop pollination. Proceedings of the Royal Society
B-Biological Sciences 276:229-237.
Winfree, R., N. M. Williams, J. Dushoff, and C. Kremen. 2007. Native bees provide
insurance against ongoing honey bee losses. Ecology Letters 10:1105-1113.
Winfree, R., N. M. Williams, H. Gaines, J. S. Ascher, and C. Kremen. 2008. Wild bee
pollinators provide the majority of crop visitation across land-use gradients in
New Jersey and Pennsylvania, USA. Journal of Applied Ecology 45:793-802.
Wuellner, C. T. 1999. Nest site preference and success in a gregarious, ground-nesting
bee Dieunomia triangulifera. Ecological Entomology 24:471-479.

87
Chapter V: Isolation and characterization of nine microsatellite loci for the tropical
understory tree Miconia affinis Wurdack (Melastomataceae)
ABSTRACT
We isolated nine microsatellite loci from the Neotropical understory tree Miconia affinis
(Melastomataceae) and optimized them for research on gene flow and genetic structure.
Loci screened in 43 individuals from a 2.26 km2 region were shown to be unlinked and
polymorphic, with 5 to 14 alleles per locus and observed heterozygosity ranging from
0.394 to 0.810.
INTRODUCTION
The neotropical understory tree Miconia affinis (Melastomataceae) is broadly distributed
in the Neotropics, ranging from southern Mexico to southern Venezuela. Miconia affinis
is known in Mexico and Central America as Cinco Negritos (five black berries) because
of its conspicuous berries, which are borne on magenta stalks during the summer rainy
season. Seeds of M. affinis are broadly dispersed by neotropical birds and bats.

88
Although M. affinis is most often found in remnant forest, widespread seed dispersal
facilitates colonization of M. affinis into adjacent agricultural lands. Like many other
melastomes, M. affinis has deep poricidal anthers which must be vibrated by a pollinator
in order for pollen to be released. "Buzz-pollination" is effected by a select group of bee
pollinators (Buchmann 1983). Therefore, the study of M. affinis provides an opportunity
to evaluate effects of habitat changes on gene flow and reproductive success of a
reproductively specialized understory tree, as well as the pattern of seed dispersal
between forest remants and adjacent agricultural habitat. The purpose of the present
research was to develop microsatellite markers to examine the breeding structure of M.
affinis in remnant forest patches and shade coffee farms in Chiapas, Mexico.
DNA was extracted from a single plant using the DNeasy Plant kit (QIAGEN). A
library of microsatellite repeats was constructed using a combination of procedures
described in Weising et al. (2005) and Glen and Schable (2005). First, the genomic DNA
(6µg) was digested with restriction enzyme RsaI and ligated with forward and reverse
SuperSNX24 adaptors (SuperSNX24 forward 5′-
GTTTAAGGCCTAGCTAGCAGCAGAATC and SuperSNX24 reverse 5′-
GATTCTGCTAGCTAGGCCTTAAACAAAA). The restriction-ligation product was
purified (Geneclean kit, QBiogene), and hybridized with biotinylated di- and
trinucleotide-specific oligonucleotides [oligo mix 2 = (AG)12 (TG)12 (AAC)6 (AAG)8
(AAT)12 (ACT)12 (ATC)8] as described in Glenn & Schable (2005). Hybridized
fragments were captured twice with streptavidin-coated magnetic beads (Dynal), filtered
using a Microcon YM-30 spin filter (Millipore), and then amplified with adaptor-specific
primers. The PCR products were ligated into a TOPO TA Cloning Kit (Invitrogen) and

89
selected colonies were amplified and sequenced (ABI Model 3730 Sequencer). Twelve
of the 50 clones sequenced (24%) contained microsatellites. Primers were designed for
the flanking sequences using PRIMER3 (Rozen & Skaletsky 2000).
We initially screened all 12 loci in 43 individuals sampled across a 2.26 km2
shade coffee farm in Chiapas, Mexico, which has been colonized by M. affinis since
establishment of the farm approximately 100 years ago. PCR was performed in a final
volume of 20μL, containing approximately 2 ng of DNA, 2 μL of 10x PCR buffer,
1,5mM MgCl2, 300 μM of each dNTP, 1 U of HotstartTaq Polymerase (QIAGEN) and
0.25 μM of each primer. The thermal cycle began with a 15 minute denaturation step at
95 ˚C, and was followed by 45 cycles: 30s at 94 ˚C, 60s at the locus-specific annealing
temperature (Table 1), and 30s at 72 ˚, followed by a final extension at 72 ˚C for 20 mins.
Nine of the 12 primer pairs generated consistent and scorable amplification products of
the expected size across all individuals tested. For these nine primer pairs, one primer
from each primer pair was end–labelled with a fluorescent dye, either FAM, HEX or
ROX, and genotyped on an ABI 3730 Sequencer. The genotypes were analyzed using the
ABI Peak Scanner Software v.1.0.
Deviations from Hardy Weinberg Equilibrium (HWE) and linkage disequilibrium
were tested in GENEPOP v.4.0 (Raymond and Rousset 1995) using the Markov chain
method (Guo and Thompson 1992) with 1000 dememorizations, 100 batches and 1000
iterations per batch. A Bonferroni correction for multiple comparisons was applied in
both cases to a significance level of p < 0.05. The probability of null alleles was
calculated using the software MICROCHECKER (Oosterhout et al. 2004).

90
All of the nine loci were polymorphic (Table 5.1). Four loci exhibited significant
deviations from Hardy-Weinberg equilibrium. This may be due to bi-parental inbreeding
and/or null alleles, although only a single locus, Micaff-19, was indicated as having null
alleles in Microchecker. No significant linkage disequilibrium was detected between
any of the loci. The cumulative exclusion probability estimated from sampled adult
individuals reached 0.995 for the first parent and 0.9999 for the second parent. This high
level of polymorphism makes these powerful markers for direct and indirect estimates of
gene flow and population structure. These are the first microsatellite DNA markers for
the Melastomataceae, which contain over 3,000 tropical woody plant species.
ACKNOWLEDGEMENTS
This chapter was coauthored with Christopher Dick and published in Molecular Ecology
Resources in 2009. This project was supported by the Helen Olson Brower Fellowship at
the University of Michigan (to S. Jha) and the National Science Foundation (award DEB
043665 to C. Dick). The authors would like to thank Susana Pereira for assistance in the
lab. The authors would also like to thank the farmers in Nueva Alemania, Chiapas for the
permission to collect samples on their land.

91
TABLES, FIGURES AND LEGENDS
Table 5.1 Forward (F) and reverse (R) sequences with fluorescent dye label (used for
genotyping), repeat motifs, annealing temperatures in °C (Ta), number of alleles (Na),
allelic size range in bp (Size Range), observed heterozygosity (HO), expected
heterozygosity (HE), and GenBank Accession number (Ac. No.) for nine microsatellite
loci for Miconia affinis.
Locus
Primer Sequence
(5' to 3')
Repeat
motif
Ta
(ºC) Na
Size
Range HO HE
Ac. No.
Micaff-
5 R:ROX.GGAGGAGAACTCAACACAACCTCAA
F:CCACCATGAAAAAGGAGAGACAATG
(TG)11
57.0
8
258-
276
0.394
***
0.618
EU675265
Micaff-
7
R:GACAGTCACGGAGCAGTGGAAT
F:ROX.TCGATTAATGAACTTTTGAAATCAGG
(CT)11
53.3
10
248-
298
0.541
***
0.804
EU67
5266
Micaff-
8
R:CGTTACAACTGTGTCCTGCTTGTTG
F:HEX.AGGACAATGAATTAGCGTTGAACCA
(CT)12
56.9
10
278-
300
0.800
0.774
EU67
5267
Micaff-
9
R: 6-FAM.CGTTCGTCGTCTTCTTTCATCTTCT
F:GGCGAGTCAATTCCCATTTCAAAAA
(AG)19
59.8
7
266-
290
0.810
0.783
EU67
5268
Micaff-
14
R: 6-FAM.CCCCTTTTCCTTTATCCTGTCTGT
F:GAACATGTTATTGGATGGGCTACC
(TG)11
54.7
5
214-
222
0.400
***
0.677
EU67
5269
Micaff-
16
R: HEX.TGGGAAATGGGAAGAAACAAGTAAG
F:GCAAAGGTGAGAGCTGTTGAGATTT
(AG)10
(TG)10
56.2
8
242-
270
0.682 0.703
EU67
5270
Micaff-
17
R:CGTCCGTCAAGCAACCTATAAAA
F:6-FAM.ATCACGTCCCAATTCCACGTC
(CT)9
56.3
14
272-
300
0.775
0.834
EU67
5271
Micaff-
18
R: 6-FAM.ACCATCCGAACAACACAACACAAA
F:GCGTCCGTCAAGCAACCTATAAAA
(AG)11
57.4
9
206-
226
0.464
***
0.813
EU675272
Micaff-
19
R: HEX.CGTTCTTGACTTTTCCCTCGACTC
F:GAACGTAGGAACGGGAGTTGGAAT
(AG)6
G
(GA)9
57.9
9
260-
276
0.480
0.814
EU67
5273
***deviation from Hardy–Weinberg equilibrium at p=0.001

92
Chapter V References
Buchmann, S. 1983. Buzz pollination in angiosperms. . Pages 73-113 in C. E. R. Jones,
editor. Little Handbook of experimental pollination biology Van Nostrand, New
York.
Glen, T. C. and N. A. Schable. 2005. Isolating microsatellite DNA loci. Methods in
Enzymology 395:202-222.
Guo, S. and E. Thompson. 1992. Performing the exact test of Hardy–Weinberg
proportion from multiple alleles. Biometrics:361–372.
Oosterhout, C., W. F. Hutchinson, D. P. M. Wills, and P. Shipley. 2004. MICRO-
CHECKER: software for identifying and correcting genotyping errors in
microsatellite data. Molecular Ecology Notes:535–538.
Raymond, M. and F. Rousset. 1995. GENEPOP version 1.2: a population genetics
software for exact test and ecumenicism. Journal of Heredity 86:248–249.
Weising, K., H. Nybom, K. Wolff, and G. Kahl. 2005. DNA Fingerprinting in Plants.
CRC Press, Boca raton.

93
Chapter VI: Shade coffee farms promote the genetic diversity of native trees
Coffee is cultivated across 11 million ha of land within the world‟s richest centers of
terrestrial biodiversity (Myers et al. 2000). In tropical America, coffee is traditionally
grown under a diverse canopy of overstory shade trees, which enhances the quality of the
coffee farm as a conservation matrix and supports a broad spectrum of pollinators that
increase fruit set per bush (Perfecto et al. 1996, Donald 2004, Klein et al. 2008). Unlike
sun coffee monocultures, shade coffee also sustains a diverse array of vertebrates
including bats and migratory birds, which provide farmers with many ecological services,
such as insect predation (Williams-Guillen et al. 2008) and may also conserve seed
dispersal processes necessary for native tree re-establishment (Sekercioglu 2006).
However, little is known about the capacity of shade coffee farms to maintain gene flow
and genetic diversity of remnant tree populations across this common tropical landscape.
In this study, we conducted genetic analyses that reveal recent colonization and extensive
gene flow of a native tree species in shade coffee farms in Chiapas, Mexico. The high
genetic diversity and overlapping deme structure of the colonizing trees also show that
traditional coffee farms maintain genetic connectivity with adjacent habitats and can
serve as foci of forest regeneration.
Previous genetic studies of forest regeneration in degraded tropical landscapes
have focused on canopy trees and have found pronounced fine scale spatial genetic
structure within colonizing tree populations (e.g. Aldrich and Hamrick 1998, Sezen et al.
2005) as a result of limited seed dispersal from scattered maternal trees. Such population
bottlenecks can lead to inbreeding depression and demographic declines for plants in
fragmented landscapes. Alternatively, agricultural matrices that facilitate the movement

94
of seed and pollen dispersers among habitats can increase the breeding size and genetic
diversity of native plant populations.
We used genetic markers to analyze the dispersal history and spatial genetic
structure of the understory tree, Miconia affinis (Melastomataceae) within a network of
coffee farms and forest fragments in Chiapas, Mexico. Though an integral part of
tropical forests, relatively little is known about the population genetics of understory trees
compared to canopy trees. Like many tropical understory trees, the seeds of the genus
Miconia are dispersed by widespread large-bodied birds, such as the Clay-colored Thrush
(Turdus grayi), as well as small-bodied scrub and forest specialists such as the Chestnut-
sided Warbler (Dendroica pensylvanica)(Luck and Daily 2003); thus its colonization
patterns are likely representative of other understory vertebrate-dispersed trees. Miconia
affinis is an obligate outcrosser and requires native bees (e.g. Trigona and Scaptotrigona
spp.) for cross-fertilization through buzz-pollination, of which the ubiquitous Africanized
honeybees are incapable. The survey area of 1200 ha encompasses an uncut primary
forest and three adjacent shade coffee farms (Figure 1). The three farms were clear-cut
and burned in the late 1930‟s and immediately replanted with coffee bushes and canopy
tree species, including nitrogen-fixing legumes and many other fruit trees (means of
157.21 ha-1
overstory trees, and 14.67 ha-1
tree species). Since the creation of these
coffee farms, farmers have allowed native understory trees, like M. affinis, to colonize the
coffee plots because they help to reduce soil erosion.
Strong spatial genetic structure of M. affinis found in the forest plots (Sp statistic
= 0.020) is similar to levels reported in species with extreme seed dispersal limitation
(Vekemans and Hardy 2004); in contrast, no spatial genetic structure was detected for
any distance class within the coffee farms (Sp statistic = 0.006), revealing more extensive
gene flow across the shade coffee matrix (Figure 1). Limited seed dispersal in the forest,
relative to the coffee farm, may be due to the short foraging ranges of forest specialist
birds. Using an individual-based clustering approach, M. affinis individuals in the
landscape were assigned to four well-supported demes (96% posterior probability), which
were overlapping in space and not aggregated by habitat or age class, indicating that
colonization into the farms was recent and from multiple source populations (Figure 6.1).
Levels of M. affinis genetic diversity within the coffee farms did not differ from forest

95
populations (Table 6.1). These results depart from previous agricultural colonization
studies which report strong spatial genetic structure and reduced genetic diversity in the
founding canopy tree populations, usually caused by the reproductive dominance of just a
few maternal trees in the early colonizing stages (Sezen et al. 2005).
By conserving resident bird populations, our results reveal that shade coffee farms
support extensive dispersal processes crucial for the connectivity of remnant forest and
agricultural habitats. The colonization pattern and high genetic diversity of M. affinis
also points to the role of shade-coffee farms as potential foci of native forest
regeneration, as coffee farms typically fall out of production in less than a century.
However, despite the clear ecological benefits of traditional shade coffee farms, these
farms are rapidly being converted to input-intensive monocultures (Perfecto et al. 1996,
Donald 2004). Thus it is imperative to highlight the ecological function of shade coffee
farms, not only in providing refuge for native fauna, but also in preserving habitat
connectivity and gene-flow processes essential for reforestation by native tree species.
ACKNOWLEDGEMENTS
This chapter was coauthored with Christopher Dick and published in Current Biology in
2008. This project was supported by the Helen Olson Brower Fellowship at the
University of Michigan (to S. Jha) and the National Science Foundation (award DEB
043665 to C. Dick). The authors would like to thank John Vandermeer for help in the
development and implementation of this project. The authors would also like to thank
the farmers in Nueva Alemania, Chiapas for the permission to collect samples on their
land.

96
TABLES, FIGURES AND LEGENDS
Table 6.1 Number of M. affinis individuals (N), allelic richness (A), expected
heterozygosity (HE), and observed heterozygosity (HO).
N A (SD) HE (SD) HO (SD)
Forest 305 12.375 1.017 0.807 0.022 0.588 0.048
Coffee 119 11.375 0.944 0.777 0.030 0.616 0.068

97
Figure 6.1 (A , B) Spatial autocorrelation diagrams showing kinship coefficient Fij
(solid lines) averaged across all pair wise comparisons within distance categories.
Dashed lines show 95% confidence limits (CL) around the null expectation of no genetic
structure (Fij = 0.00). Thus values above the upper 95% CL represent significantly higher
relatedness than expected at random, while values below the lower 95% CL represents
significantly lower relatedness than expected for each distance class.
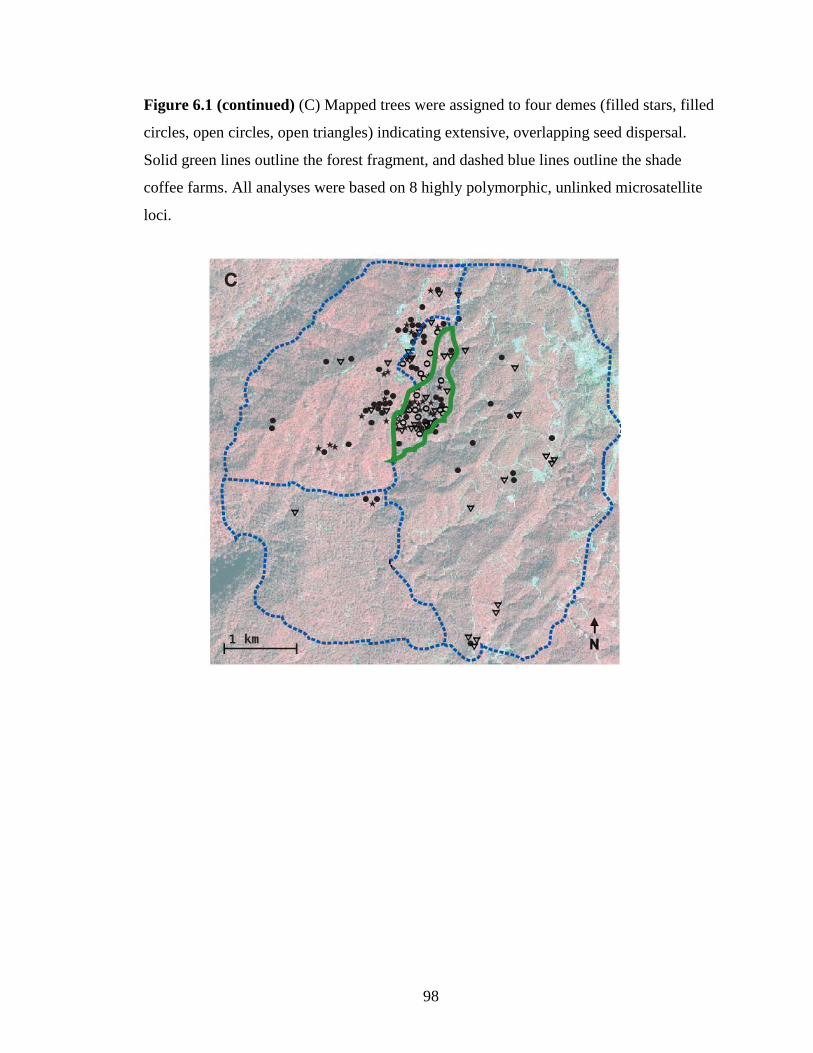
98
Figure 6.1 (continued) (C) Mapped trees were assigned to four demes (filled stars, filled
circles, open circles, open triangles) indicating extensive, overlapping seed dispersal.
Solid green lines outline the forest fragment, and dashed blue lines outline the shade
coffee farms. All analyses were based on 8 highly polymorphic, unlinked microsatellite
loci.
99
APPENDIX
Materials and Methods
Coffee farmers occasionally replant overstory leguminous trees (usually to replace dead
or damaged leguminous trees), but they do not plant understory forest trees like M. affinis
in the coffee fields. Seed dispersers of M. affinis were recorded in the forest and coffee
using visual surveys and 24 hour mist-netting followed by fecal analyses (Williams-
Guillen et al. in prep). GPS coordinates were measured and leaf tissue was sampled from
all trees in the 1200 ha landscape from 2005-2006. DNA was extracted using the
QIAGEN DNeasy kit (as described in Jha and Dick in press) and all individuals were
genotyped at 8 unlinked microsatellite loci in order to estimate gene diversity statistics
and to analyze spatial genetic structure.
We used the software SPAGedi (Hardy and Vekemans 2002) to compute the
pairwise relatedness metric Fij (Loiselle et al. 1995) which is based on the regression
slope of relatedness bF, and which is robust to sampling method (Vekemans and Hardy
2004). We computed relatedness at 50m distance intervals up to 450m. We obtained the
95% confidence limits (CL) around the null expectation of no genetic structure (Fij =
0.00) by permuting multi-locus genotypes and spatial coordinates (1000 iterations)(Hardy
and Vekemans 2002). We also tested for spatial genetic structure using Moran‟s Index
and rij (Peakall and Smouse 2001), and found the same patterns with the same
significance levels for the distance values analyzed.
To calculate the number of demes we used the software STRUCTURAMA
(Huelsenbeck et al. in press), which incorporates a Bayesian clustering approach to assign
individuals to K populations, and which provides posterior probabilities of observing the
data under different estimates of K without prior assumptions of population structure.
Individuals are assigned to populations by minimizing the squared distance among
sampled partitions, where partition distance is defined as the minimum number of
individuals that have to be deleted from the assignment vector in order to make the two
partitions the same. In our analysis, we found the greatest support for K=4 demes, and
this was additionally confirmed for each locus analyzed separately and for multiple
combinations of loci using STRUCTURE (Pritchard et al. 2000).
100
Chapter VI References
Aldrich, P. R. and J. L. Hamrick. 1998. Reproductive dominance of pasture trees in a
fragmented tropical forest mosaic. Science 281:103-105.
Donald, P. F. 2004. Biodiversity impacts of some agricultural commodity production
systems. Conservation Biology 18:17-37.
Hardy, O. J. and X. Vekemans. 2002. SPAGEDi: a versatile computer program to analyse
spatial genetic structure at the individual or population levels. Molecular Ecology
Notes 2:618-620.
Huelsenbeck, J. P., P. Andolfatto, and E. T. Huelsenbeck. in press. Structurama: bayesian
inference of population structure. Bioinformatics.
Jha, S. and C. W. Dick. in press. Microsatellite markers for Miconia affinis
(Melastomataceae). Molecular Ecology Resources.
Klein, A. M., S. A. Cunningham, M. Bos, and I. Steffan-Dewenter. 2008. Advances in
pollination ecology from tropical plantation crops. Ecology 89:935-943.
Loiselle, B. A., V. L. Sork, J. Nason, and C. Graham. 1995. Spatial Genetic-Structure of
a Tropical Understory Shrub, Psychotria Officinalis (Rubiaceae). American
Journal of Botany 82:1420-1425.
Luck, G. W. and G. C. Daily. 2003. Tropical countryside bird assemblages: Richness,
composition, and foraging differ by landscape context. Ecological Applications
13:235-247.
Myers, N., R. A. Mittermeier, C. G. Mittermeier, G. A. B. da Fonseca, and J. Kent. 2000.
Biodiversity hotspots for conservation priorities. Nature 403:853-858.
Peakall, R. and P. E. Smouse. 2001. GENALEX (version 5.1): genetic analysis in Excel,
Population Genetic Software for Teaching and Research, . Australian National
University, Canberra, Australia.
Perfecto, I., R. A. Rice, R. Greenberg, and M. E. VanderVoort. 1996. Shade coffee: A
disappearing refuge for biodiversity. Bioscience 46:598-608.
Pritchard, J. K., M. Stephens, and P. J. Donnelly. 2000. Inference of population structure
using multilocus genotype data. Genetics 155:945-959.
Sekercioglu, C. H. 2006. Ecological significance of bird populations. Pages 15-51
Handbook of the Birds of the World.
Sezen, U. U., R. L. Chazdon, and K. E. Holsinger. 2005. Genetic consequences of
tropical second-growth forest regeneration. Science 307:891-891.
Vekemans, X. and O. J. Hardy. 2004. New insights from fine-scale spatial genetic
structure analyses in plant populations. Molecular Ecology 13:921-935.
Williams-Guillen, K., K. Goodall, and C. Taylor. in prep. Avian and bat seed dispersers
of Miconia affinis.
Williams-Guillen, K., I. Perfecto, and J. Vandermeer. 2008. Bats limit insects in a
neotropical agroforestry system. Science 320:70-70.
101
Chapter VII: Extensive plant gene flow mediated by native bees across a shade
coffee landscape mosaic
ABSTRACT
Coffee farms cover much of the tropics and may critically impact native plant and animal
communities. Shade coffee farms provide refuge for migratory birds and forest
mammals, but their ability to sustain native plants and pollinators is not known. Our
study of native tree gene flow within shade coffee farms and forest fragments revealed
pollen transfer by native insects spanning more than 1800 m. Furthermore, pollen
dispersal between coffee and forest habitats was extensive, constituting 43% of all
pollination events. These results highlight the role that shade coffee farms can play in
sustaining native pollinators and maintaining the population viability of native plants in
degraded tropical landscapes.
As the second most valuable commodity in the world (Vandermeer 2003) coffee extends
across 11 million ha of land, embedded in some of the world‟s richest centers of
terrestrial biodiversity (Myers et al. 2000). In the neotropics, coffee is traditionally
„shade-grown‟ under a diverse canopy of overstory trees (Moguel and Toledo 1999)
which supports millions of small-scale farmers who benefit from ecological services
provided by the shade trees, such as nitrogen-fixation, soil erosion and pest control
(Perfecto et al. 1996, Donald 2004, Williams-Guillen et al. 2008). Though shade-grown
coffee has garnered interest as habitat for forest dwelling mammals and migratory
songbirds (Greenberg et al. 1997, Klein et al. 2008, Van Bael et al. 2008), little is known

102
about the diversity of insect pollinators within shade coffee farms and their role in
maintaining the genetic diversity of remnant trees.
Because most tropical plants are dependent on insect pollinators (Bawa 1990),
depauperate insect faunas within agricultural landscapes may lead to reproductive
declines and restricted gene flow among remnant forest trees (reviewed in Nason and
Hamrick 1997, Dick et al. 2008). Though recent tropical studies suggest that pollen
dispersal may not be as limited in fragmented habitats as expected (Dick et al. 2003,
Sezen et al. 2005, 2007), these studies have examined large, self-compatible canopy trees
that can be pollinated by ubiquitous Africanized honeybees, and thus represent systems
where pollen-mediated gene flow may be maintained even if native pollinators are lost.
Alternatively, self-incompatible reproductively specialized plants that rely only on native
pollinators may be especially sensitive to pollinator loss in degraded landscapes (Aguilar
et al. 2006).
Our analysis of reproductive isolation and gene flow focused on a buzz-pollinated
understory tree, Miconia affinis (Melastomataceae), within a 1200 ha shade coffee and
forest landscape mosaic in Chiapas, Mexico (Fig. 1). As a buzz-pollinated plant, M.
affinis requires sonication for pollen removal, a mechanism that cannot be effected by
Africanized honeybees. Mating system studies conducted on M. affinis trees across
habitats revealed that M. affinis is self-incompatible, yielding no fruits without cross
pollination and significantly higher fruit set with cross-buzz-pollination (bee movement
simulated with a vibrating tuning fork)(Linear Mixed Effects Model, p<0.0001, Fig. 2B).
Thus M. affinis serves as a unique bio-indicator of native pollinator communities in
coffee agroecosystems.
Across 59 M. affinis trees, the most common native bees visiting flowers were
buzz-pollinating carpenter bees (Xylocopa sps), Meliponine bees (Melipona beecheii and
Trigona fulviventris) and orchid bees (Euglossa viridissima). We found that a
significantly greater number of buzz-pollinating native solitary and social bees visited M.
affinis in forest habitats (t23,36= 4.36, p<0.0001 and t23,36= 3.04, p=0.003, respectively)
and a significantly greater number of Africanized honeybees visited M. affinis in coffee
habitats (t23,36= -5.62, p<0.0001)(Fig. 2A). Ambient fruit set was significantly higher in

103
forest than in the coffee habitats (t29,59= 16.86, p<.0001, Fig. 2C), suggesting that M.
affinis experiences high reproduction in forests due to increased native bee pollination.
Pollen dispersal was assessed via direct paternity analysis (Marshall et al. 1998)
and indirect pollen dispersal estimation (Smouse et al. 2001) utilizing microsatellite
genotypes of seeds collected from M. affinis trees (24 seeds from each tree, 24 scattered
mother trees, 12 in each habitat). Based on paternity analysis, M. affinis pollen dispersal
distances across habitat types ranged from 0.10m - to 1890m (n= 375 total events), with
an average pollen dispersal distance of 419m (average probability of exclusion Pe=
0.986). Despite extensive gene flow across habitats, pollen dispersal distributions within
forest and shade coffee habitats were significantly different (Kolmogorov-Smirnov Z test,
Z=1.83, p=0.002), with longer pollen dispersal distances in shade coffee (589m ± 90.6m)
than in forest (279m ± 59.3m) (Fig. 3). Mean pollen dispersal distances in both habitats
were significantly greater than nearest neighbor distances, which averaged 11.2m (±
3.81m) for mothers in forest habitats and 37.6m (± 11.1m) in coffee habitats
(Kolmogorov-Smirnov Z test, Z=0.83, p<0.0001, and Z=6.34, p<0.0001, respectively),
indicating that pollinators frequently bypass nearby flowering plants, especially within
coffee habitats where M. affinis populations are more scattered. Additionally, pollen
dispersal exhibited a fat-tailed exponential distribution in forest and coffee habitats,
indicating that long distance dispersal is highly likely for trees in both habitats.
In coffee habitats, 65.1% of seeds per mother tree were fathered by M. affinis
forest trees, while in forest habitats 78.0% of seeds per mother tree were fathered by M.
affinis forest trees (Fig. 3). Given the average landscape pollen dispersal distance, the
proportion of seeds pollinated by M. affinis forest trees was not significantly different
than expected in coffee habitats (expected 66%)(Wilcoxin Signed Ranks test, Z=-0.784,
p=0.433) but was significantly less than expected in forest habitats (expected
85.4%)(Wilcoxin Signed Ranks test, Z=-2.43, p=0.014), revealing extensive pollen flow
between habitats and demonstrating that trees within coffee farms can play a
disproportionately large role in maintaining gene flow across the entire landscape.
In this study, we provide evidence for the conservation of native bee pollination
and the maintenance of extensive pollen dispersal within shade coffee systems. Though
native bee visitation was lower in coffee, M. affinis exhibited relatively high reproductive

104
success in both forest and coffee habitats. This indicates that native bees are foraging
substantially within shade coffee farms, a benefit to cultivated coffee (Perfecto et al.
1996, Donald 2004, Klein et al. 2008) and to native plants. Furthermore, we documented
frequent cross-habitat gene flow and some of the longest precisely recorded pollination
distances for native neotropical bees. We found that pollen dispersal distances for M.
affinis trees were greater where interplant distance was greatest (e.g., Dick et al. 2003);
however, in this study, Africanized honeybees were not the source of extensive pollen-
mediated gene flow. Rather, native bees mediate long distance pollen dispersal across
the landscape, providing essential gene flow for native tropical trees.
ACKNOWLEDGEMENTS
This chapter was coauthored with Christopher Dick and is currently being submitted to
journals. The project was supported by the Helen Olson Brower Fellowship at the
University of Michigan (to S. Jha) and the National Science Foundation (award DEB
043665 to C. Dick). The authors would like to thank John Vandermeer, Ivette Perfecto,
Beverly Rathcke and all lab members for help in the development and implementation of
this project. The authors would also like to thank Gabriel Dominguez-Martinez, for his
help scouting trees, and the farmers in Nueva Alemania, for their permission to conduct
experiments on their land. All experiments conducted were in compliance with current
laws governing biodiversity protection in Mexico.

105
TABLES, FIGURES AND LEGENDS
Figure 7.1 Study region in Chiapas, Mexico, where M. affinis individuals in forest and
coffee habitats are labeled as green and brown squares, respectively. Black dashed lines
outline the forest fragment and shade coffee habitats. Three focal trees are labeled with
white numbers, located in coffee (1 & 3) and forest (2) habitats. Solid black lines
radiating from the focal trees indicate 10 recorded pollen sources, as revealed by
paternity analysis.
1
2
3

106
Figure 7.2 (A) Bee visitation to M. affinis in forest (green) and coffee (brown) habitats
and photos (top to bottom) of the native solitary bee Xylocopa tabaniformis,
tabaniformis, native social bee Trigona fulviventris, and exotic social bee Apis mellifera
scutellata. (B) Photo of M. affinis inflorescence and pollination treatments for 3 flowers
per inflorescence (control, self-pollinated, self-buzz-pollinated, cross pollinated, cross-
buzz-pollinated, and open) in both habitats and (C) the open pollination treatment
examined separately in forest and coffee habitats. *P < 0.05, **P < 0.01, ***P < 0.001
A

107
Figure 7.3 Pollen dispersal patterns for M. affinis mothers in (A) forest and (B) coffee
habitats (photo of M. affinis mother in each habitat) in 100m binned distance categories.
Green bars represent the number of pollen dispersal events from M. affinis fathers (pollen
donors) in forest habitats and brown bars represent the number of pollen dispersal events
from M. affinis fathers in coffee habitats. Dotted lines represent nearest neighbor-
distances to mother trees in each habitat and the solid lines represent average pollen
dispersal distances for mothers in each habitat.
108
APPENDIX
Materials and Methods
Study site
Shade coffee farms were clear-cut and burned in the late 1930‟s and immediately
replanted with coffee bushes and canopy trees. Canopy trees include nitrogen-fixing
leguminous trees (Inga sps.), fruit trees such as orange (Citrus sinensis) and mango
(Mangifera indica), and other native species (mean of 157.21 ha-1 overstory trees, and
14.67 ha-1 tree species). Since the establishment of the coffee farms, managers have
allowed for the colonization of understory trees, like M. affinis, because of their service
in reducing soil erosion (Jha and Dick 2008). GPS coordinates were recorded and leaf
tissue was sampled from all M. affinis trees in the 1200 ha landscape (445 individuals).
DNA was extracted using the QIAGEN DNeasy kit (as described in Jha and Dick 2009).
Mating and pollination system
We conducted mating system studies on 90 M. affinis trees across both forest and
coffee habitats. We selected 3 flowers for each of six treatments on each of the 90 study
trees. The inflorescences were bagged before flowering and only opened during the
pollination treatment. The treatments included control flowers (not-pollinated), self-
pollinated flowers (pollinated with a non-vibrating tuning fork, pollen donated from a
flower in the same tree), self-buzz-pollinated flowers (pollinated with a vibrating tuning
fork, pollen donated from a flower in the same tree), cross pollinated flowers (pollinated
with a non-vibrating tuning fork, pollen donated from a flower on a tree >20m away) and
cross-buzz-pollinated flowers (pollinated with a vibrating tuning fork, pollen donated
from a flower on a tree >20m away). Pollinator observations consisted of 30 minute
visual surveys of 4 inflorescences on each of 59 M. affinis trees located in both forest and
coffee habitats. All counts were square root transformed before statistical analysis.

109
Pollen Dispersal Analyses
The genetic analysis was based on eight unlinked and highly polymorphic
microsatellite loci with an overall exclusion probability of 0.9999 (Jha and Dick 2009).
We used direct paternity analyses to calculate individual pollen dispersal distances by
examining the multi-locus segregation probabilities, using the program CERVUS
(Marshall et al. 1998). We used the critical delta values based on the paternity simulation
to calculate paternity for 24 seeds collected from 24 mothers (12 mothers in coffee, 12
mothers in forest habitats, for a total of 576 seeds). We assigned paternity for 375 seeds
with an exclusion probability of 99% or higher. To examine differences between actual
parentage and expected parentage of maternal seed arrays, we compared the actual
proportion of pollen donors from the forest with the proportion of forest trees within
419.6m (average pollen dispersal distance) of each mother tree. Square root and arcsine-
square root transformed proportions and distances yielded the same statistical results as
non–transformed data. Because the analyses do not assume normality, the reported
statistics reflect tests conducted on non-transformed data.
We also conducted an indirect paternity analysis using the program TWOGENER
(Smouse et al. 2001) within the program, POLLDISP (Robledo-Arnuncio et al. 2007)
which uses genotypic data from the maternal seed arrays to estimate the differentiation of
allelic frequencies (ФFT) among the pollen pools. We calculated greater differentiation in
pollen allele pools within forest habitats (ФFT = 0.087) than within coffee habitats (ФFT =
0.047). Additionally, since maternal tree density was higher in the forest (0.70 trees/ha in
forest, 0.01 trees/ha in the coffee), estimated average dispersal distances were much
greater in coffee habitats (803.6m) than in forest habitats (101.5m). In both forest and
coffee habitats, the exponential dispersal function best fit the data (coffee: a=401.8,
b=0.094, error=0.095, forest: a=47.35, b=0.057, error=0.223) and a fat-tailed distribution
can be inferred from the relatively low curve shape parameter (b<1) for both functions
(Clark 1998).
Photos of bees in Figure 3 (top to bottom) were taken by Gary McDonald, Mike
Reiskind, and James Nieh. Photos of M. affinis in Figures 3 and 4 were taken by S. Jha.

110
Chapter VII References
Aguilar, R., L. Ashworth, L. Galetto, and M. A. Aizen. 2006. Plant reproductive
susceptibility to habitat fragmentation: review and synthesis through a meta-
analysis. Ecology Letters 9:968-980.
Bawa, K. S. 1990. Reproductive Ecology of Tropical Forest Plants. Unesco and
Parthenon Press, Paris and USA.
Clark, J. S. 1998. Why trees migrate so fast: Confronting theory with dispersal biology
and the paleorecord. American Naturalist 152:204-224.
Dick, C. W., G. Etchelecu, and F. Austerlitz. 2003. Pollen dispersal of tropical trees
(Dinizia excelsa: Fabaceae) by native insects and African honeybees in pristine
and fragmented Amazonian rainforest. Molecular Ecology 12:753-764.
Dick, C. W., F. A. Jones, O. J. Hardy, and R. J. Petit. 2008. Spatial scales of seed and
pollen-mediated gene flow in tropical forest trees. Tropical Plant Biology 1:20-33.
Donald, P. F. 2004. Biodiversity impacts of some agricultural commodity production
systems. Conservation Biology 18:17-37.
Greenberg, R., P. Bichier, and J. Sterling. 1997. Bird populations in rustic and planted
shade coffee plantations of eastern Chiapas, Mexico. Biotropica 29:501-514.
Jha, S. and C. W. Dick. 2008. Shade coffee farms promote genetic diversity of native
trees. Current Biology 18:1126-1128.
Jha, S. and C. W. Dick. 2009. Microsatellite markers for Miconia affinis
(Melastomataceae). Molecular Ecology Resources 9 344-345.
Klein, A. M., S. A. Cunningham, M. Bos, and I. Steffan-Dewenter. 2008. Advances in
pollination ecology from tropical plantation crops. Ecology 89:935-943.
Marshall, T. C., J. Slate, L. E. B. Kruuk, and J. M. Pemberton. 1998. Statistical
confidence for likelihood-based paternity inference in natural populations.
Molecular Ecology 7:639-655.
Moguel, P. and V. M. Toledo. 1999. Biodiversity conservation in traditional coffee
systems of Mexico. Conservation Biology 13:11-21.
Myers, N., R. A. Mittermeier, C. G. Mittermeier, G. A. B. da Fonseca, and J. Kent. 2000.
Biodiversity hotspots for conservation priorities. Nature 403:853-858.
Nason, J. D. and J. L. Hamrick. 1997. Reproductive and genetic consequences of forest
fragmentation: Two case studies of neotropical canopy trees. Journal of Heredity
88:264-276.
Perfecto, I., R. A. Rice, R. Greenberg, and M. E. VanderVoort. 1996. Shade coffee: A
disappearing refuge for biodiversity. Bioscience 46:598-608.
Robledo-Arnuncio, J. J., F. Austerlitz, and P. E. Smouse. 2007. POLDISP: a software
package for indirect estimation of contemporary pollen dispersal. Molecular
Ecology Notes 7:763-766.
Sezen, U. U., R. L. Chazdon, and K. E. Holsinger. 2005. Genetic consequences of
tropical second-growth forest regeneration. Science 307:891-891.
Sezen, U. U., R. L. Chazdon, and K. E. Holsinger. 2007. Multigenerational genetic
analysis of tropical secondary regeneration in a canopy palm. Ecology 88:3065-
3075.

111
Smouse, P. E., R. J. Dyer, R. D. Westfall, and V. L. Sork. 2001. Two-generation analysis
of pollen flow across a landscape. I. Male gamete heterogeneity among females.
Evolution 55:260-271.
Van Bael, S. A., S. M. Philpott, R. Greenberg, P. Bichier, N. A. Barber, K. A. Mooney,
and D. S. Gruner. 2008. Birds as predators in tropical agroforestry systems.
Ecology 89:928-934.
Vandermeer, J. H. 2003. Tropical Agroecosystems. CRC Press, Boca Raton, Florida.
Williams-Guillen, K., I. Perfecto, and J. Vandermeer. 2008. Bats limit insects in a
neotropical agroforestry system. Science 320:70-70.

112
Chapter VIII: Conclusion
This dissertation research examines the impacts of land use on bee communities, bee
foraging behavior, and pollen and seed dispersal processes for a reproductively
specialized tropical tree. The integration of field-collected community data, regional
geographic information and population-level genetic analyses provides a robust
understanding of the ecology and genetics of a specialized tropical plant species in an
understudied yet ubiquitous tropical agricultural system. By documenting native faunal
biodiversity and revealing critical plant gene flow processes, this thesis provides
mechanistic insight into the capacity of shade coffee agroecosystems to serve as
biodiversity refuges and critical habitat corridors.
In chapters two and three, we found that Africanized honeybees and native bees
exhibited strikingly different foraging patterns with coffee agroforestry systems. In the
first study, we observed that Africanized honeybees exhibited only initial foraging
preferences for low-shade coffee habitats, while native bees exhibited both initial and
delayed recruitment-based foraging preferences for high-shade coffee habitats. In
chapter three, we observed a significantly greater number of visitors to coffee flowers in
high-shade coffee habitats than in low-shade coffee habitats for both native and exotic
bees. We found that within high-shade coffee habitats, native solitary bees and native
social bees exhibited a „dilution effect‟ at the smallest spatial scale, while in low-shade
coffee habitats, Africanized honeybees exhibited a „concentration effect‟ at the largest
spatial scale. This second study was the first to show that the foraging patterns of native
bees and exotic honeybees contrast one another in response to floral resource level and
that this response is mediated specifically by the vegetation management of the local
habitat.

113
In chapter four, we utilized machine-learning regression tree modeling in order to
reveal that, in general, native bees are more abundant and species rich in habitats with a
greater number of flowering overstory tree species. We found that native solitary bees
exhibited preferences for habitats with greater herb diversity, while native social bees
exhibited preferences for greater overstory tree diversity and density. Bee communities
differed in their response to habitat factors, with greater cavity-nesting bee abundance in
habitats with greater overstory tree species richness, greater wood-nesting bee abundance
in habitats with greater canopy cover, and greater soil-nesting bee abundance, with
greater flowering overstory tree species. Overall, our results indicated that habitat
heterogeneity was critical for maintaining diverse bee communities, and that within-farm
habitat management was more predictive of native bee abundance than regional forest
distribution.
In chapter five, we isolated eight microsatellite loci from M. affinis that were
unlinked, polymorphic and did not exhibit null alleles. These microsatellites were used
in chapters six and seven to examine the population genetics of M. affinis across coffee
and forest landscapes. In chapter six, we conducted spatial genetic structure analyses in
order to reveal historical seed dispersal patterns across the coffee and forest landscape.
Using a Bayesian clustering approach, we classified all M. affinis individuals into 4 well-
supported demes, which were overlapping and not aggregated by habitat or age class,
providing strong support for recent colonization of M. affinis from multiple source
populations. Despite recent colonization, M. affinis within the coffee matrix exhibited
high allelic diversity that was not significantly different from levels found in the forest.
Results from our genetic analysis indicated strong spatial genetic structure in the forest at
the 100 and 200m distance class and no spatial genetic structure in the coffee
agroecosystems. These results indicate strong seed dispersal limitation in the forest and
extensive seed dispersal in coffee habitats, likely due to differences in seed disperser
communities between habitats.
In chapter seven, we confirmed that M. affinis individuals are self-incompatible
and reliant on buzz-pollination. We also found that honeybee visitation was significantly
higher and ambient fruit set was significantly lower for M. affinis individuals in non-
forested habitats. Pollen dispersal molecular analyses revealed extensive pollen

114
movement across the landscape, with some of the longest recorded dispersal events
precisely recorded for native tropical bees. We documented pollen dispersal by native
bees spanning 1800 m, with 43% of pollination events taking place across habitat types.
These results provide strong evidence that shade coffee farms can serve as habitat
corridors for native bees and can sustain native bee pollinator communities.
Synthesis
As agricultural areas continue to expand, especially in the tropics, it is critical that we
understand how agricultural land management impacts pollinator communities and pollen
dispersal processes for tropical trees. By focusing on a pantropically prevalent
agricultural system, the findings from this research project provide global insight into the
preservation of tropical tree populations in fragmented agricultural landscapes. As the
second most valuable commodity in the world, coffee farming sustains the livelihoods of
millions of people across the tropics. Results from this research provide information on
how to most effectively manage native and exotic pollinators within coffee
agroecosystems, where their services are essential for improved coffee yield.
This dissertation research also examines the reproductive and dispersal processes
of a pantropically dominant plant family, the Melastomataceae, and one of the most
diverse genera in the world (Miconiae alone has 2200 pantropical species). The research
reveals how native bee pollinators of M. affinis move within the forest and coffee
landscape and whether pollen dispersal patterns are sufficiently extensive to maintain
genetic diversity for native trees living within coffee farms and forest fragments. Though
shade coffee farms have received attention for their ability to provide habitat for native
and migratory birds (Perfecto et al. 1996, Greenberg et al. 1997, Donald 2004), till now
little was known about the role of shade coffee farms in maintaining essential pollen and
seed dispersal processes for native trees. This dissertation research revealed that both
dispersal processes are maintained for M. affinis within shade coffee farms and between
coffee farms and forest fragments. Though the preservation of tropical forest fragments
is paramount, migration between forest fragments, across agroecological landscapes, is

115
also essential for metapopulation stability (Nee and May 1992, Hanski 1999, Perfecto and
Vandermeer 2008). This dissertation reveals the potential role of shade coffee farms in
providing a matrix permeable to native plant seed dispersers and pollinators.
By focusing on international collaboration, this research also strengthens
understanding between scientists and managers in the United States and Mexico.
Specifically, this dissertation research has provided us with the opportunity to
communicate with local coffee farmers about land management, pollination services and
erosion control within their farms. As worldwide tropical deforestation continues, it is
urgent that we continue the dialogue between agriculturalists and ecologists in order to
understand how to best maintain ecological processes required for crop production, native
bee preservation, and the conservation of tropical plant populations.

116
Chapter VIII References
2005. R: A language and environment for statistical computing. R Development Core
Team. R Development Core Team, R Foundation for Statistical Computing, URL
http://www.R-project.org, Vienna, Austria.
Abrams, P. A. 1982. Functional-Responses of Optimal Foragers. American Naturalist
120:382-390.
Abrams, P. A. 1991. Life-History and the Relationship between Food Availability and
Foraging Effort. Ecology 72:1242-1252.
Ackerman, J. D. 1983. Diversity and seasonality of male euglossine bees (Hymenoptera,
Apidae) in central Panama. Ecology 64:274-283.
Aguilar, R., L. Ashworth, L. Galetto, and M. A. Aizen. 2006. Plant reproductive
susceptibility to habitat fragmentation: review and synthesis through a meta-
analysis. Ecology Letters 9:968-980.
Aizen, M. A. and P. Feinsinger. 1994. Habitat fragmentation, native insect pollinators,
and feral honeybees in Argentine chaco serrano. Ecological Applications 4:378-
392.
Aldrich, P. R. and J. L. Hamrick. 1998. Reproductive dominance of pasture trees in a
fragmented tropical forest mosaic. Science 281:103-105.
Aldrich, P. R., J. L. Hamrick, P. Chavarriaga, and G. Kochert. 1998. Microsatellite
analysis of demographic genetic structure in fragmented populations of the
tropical tree Symphonia globulifera. Molecular Ecology 7:933-944.
Allen-Wardell, G., P. Bernhardt, R. Bitner, A. Burquez, S. Buchmann, J. Cane, P. A.
Cox, V. Dalton, P. Feinsinger, M. Ingram, D. Inouye, C. E. Jones, K. Kennedy, P.
Kevan, H. Koopowitz, R. Medellin, S. Medellin-Morales, G. P. Nabhan, B.
Pavlik, V. Tepedino, P. Torchio, and S. Walker. 1998. The potential
consequences of pollinator declines on the conservation of biodiversity and
stability of food crop yields. Conservation Biology 12:8-17.
Ashworth, L., R. Aguilar, L. Galetto, and M. A. Aizen. 2004. Why do pollination
generalist and specialist plant species show similar reproductive susceptibility to
habitat fragmentation? Journal of Ecology 92:717-719.
Asquith, N. M., J. Terborgh, A. E. Arnold, and C. M. Riveros. 1999. The fruits the agouti
ate: Hymenaea courbaril seed fate when its disperser is absent. Journal of Tropical
Ecology 15:229-235.
Banaszak, J. 1996. Ecological bases of conservation of wild bees. Pages 55-62 in A.
Matheson, S. Buchmann, C. O‟Toole, P. Westrich, and I. Williams, editors. The
Conservation of Bees. Academic Press, London.
Barron, A. B., H. Zhu, G. E. Robinson, and M. V. Srinivasan. 2005. Influence of flight
time and flight environment on distance communication by dancing honey bees.
Insectes Sociaux 52:402-407.
Bawa, K. S. 1990. Reproductive Ecology of Tropical Forest Plants. Unesco and
Parthenon Press, Paris and USA.
Bawa, K. S. 1992. Mating Systems, Genetic Differentiation and Speciation in Tropical
Rain-Forest Plants. Biotropica 24:250-255.

117
Bawa, K. S., S. H. Bullock, D. R. Perry, R. E. Coville, and M. H. Grayum. 1985.
Reproductive-Biology of Tropical Lowland Rain-Forest Trees .2. Pollination
Systems. American Journal of Botany 72:346-356.
Bawa, K. S., W. J. Kress, N. M. Nadkarni, S. Lele, P. H. Raven, D. H. Janzen, A. E.
Lugo, P. S. Ashton, and T. E. Lovejoy. 2004. Tropical ecosystems into the 21st
century. Science 306:227-228.
Benton, T. G., J. A. Vickery, and J. D. Wilson. 2003. Farmland biodiversity: is habitat
heterogeneity the key? Trends in Ecology & Evolution 18:182-188.
Biesmeijer, J. C., S. P. M. Roberts, M. Reemer, R. Ohlemuller, M. Edwards, T. Peeters,
A. P. Schaffers, S. G. Potts, R. Kleukers, C. D. Thomas, J. Settele, and W. E.
Kunin. 2006. Parallel declines in pollinators and insect-pollinated plants in Britain
and the Netherlands. Science 313:351-354.
Breiman, L., J. Freidman, R. Olshen, and C. Stone. 1984. Classification and Regression
Trees. Wadsworth, Belomont, CA.
Brosi, B. J. in press. The complex responses of social stingless bees (Apidae: Meliponini)
to tropical deforestation. Forest Ecology and Management in press.
Brosi, B. J., G. C. Daily, and P. R. Ehrlich. 2007. Bee community shifts with landscape
context in a tropical countryside. Ecological Applications 17:418-430.
Brosi, B. J., G. C. Daily, T. M. Shih, F. Oviedo, and G. Duran. 2008. The effects of forest
fragmentation on bee communities in tropical countryside. Journal of Applied
Ecology 45:773-783.
Brosi, B. J., A. Smith-Pardo, and V. H. Gonzalez. 2006. A new wood-nesting
Neocorynura (Hymenoptera : Halictidae : Augochlorini) from Costa Rica, with
notes on its biology. Zootaxa:55-68.
Brown, J. C. and C. Albrecht. 2001. The effect of tropical deforestation on stingless bees
of the genus Melipona (Insecta: Hymenoptera: Apidae: Meliponini) in central
Rondonia, Brazil. Journal of Biogeography 28:623-634.
Buchman, G. P., and Nabhan, S.L. 1996. The Forgotten Pollinators. Island
Press/Shearwater Books.
Buchmann, S. 1983. Buzz pollination in angiosperms. . Pages 73-113 in C. E. R. Jones,
editor. Little Handbook of experimental pollination biology Van Nostrand, New
York.
Bullock, S. H. and J. A. Solis-Magallanes. 1990. Phenology of canopy trees of a tropical
deciduous forest in Mexico. Biotropica 22:22-35.
Butz-Huryn, V. 1997. Ecological impacts of introduced honey bees. Quarterly Review of
Biology 72:275-297
Cairns, C. E., R. Villanueva-Gutierrez, S. Koptur, and D. B. Bray. 2005. Bee populations,
forest disturbance, and africanization in Mexico. Biotropica 37:686-692.
Cane, J. H. 2001. Habitat fragmentation and native bees: a premature verdict?
Conservation Ecology 5:art. no.-3.
Cane, J. H., R. L. Minckley, L. J. Kervin, T. H. Roulston, and N. M. Williams. 2006.
Complex responses within a desert bee guild (Hymenoptera : Apiformes) to urban
habitat fragmentation. Ecological Applications 16:632-644.
Cardinale, B. J., J. J. Weis, A. E. Forbes, K. J. Tilmon, and A. R. Ives. 2006. Biodiversity
as both a cause and consequence of resource availability: a study of reciprocal
causality in a predator-prey system. Journal of Animal Ecology 75:497-505.

118
Carvell, C., W. R. Meek, R. F. Pywell, and M. Nowakowski. 2004. The response of
foraging bumblebees to successional change in newly created arable field
margins. Biological Conservation 118:327-339.
Chacoff, N. P. and M. A. Aizen. 2006. Edge effects on flower-visiting insects in
grapefruit plantations bordering premontane subtropical forest. Journal of Applied
Ecology 43:18-27.
Challenger, A. 1998. Utilización y conservación de los ecosistemas terrestres de México.
Pasado, presente y futuro. México. Conabio, IBUNAM y Agrupación Sierra
Madre.
Chao, A. 1987. Estimating the Population-Size for Capture Recapture Data with Unequal
Catchability. Biometrics 43:783-791.
Chase, M. R., C. Moller, R. Kesseli, and K. S. Bawa. 1996. Distant gene flow in tropical
trees. Nature 383:398-399.
Clark, J. S. 1998. Why trees migrate so fast: Confronting theory with dispersal biology
and the paleorecord. American Naturalist 152:204-224.
Clavero, M. and E. Garcia-Berthou. 2005. Invasive species are a leading cause of animal
extinctions. Trends in Ecology & Evolution 20:110.
Colwell, R. K. and J. A. Coddington. 1994. Estimating Terrestrial Biodiversity through
Extrapolation. Philosophical Transactions of the Royal Society of London Series
B-Biological Sciences 345:101-118.
Croat, T. C. 1978. The flora of Barro Colorado Island. Stanford University Press, Palo
Alto, CA, USA.
Daily, G. C. 1997. Nature's services: Societal dependence on natural ecosystems. Island
Press, Washington, D.C., USA.
De'ath, G. and K. E. Fabricius. 2000. Classification and regression trees: A powerful yet
simple technique for ecological data analysis. Ecology 81:3178-3192.
De Marco, P. and F. M. Coelho. 2004. Services performed by the ecosystem: forest
remnants influence agricultural cultures' pollination and production. Biodiversity
and Conservation 13:1245-1255.
Dick, C. W. 2001. Genetic rescue of remnant tropical trees by an alien pollinator.
Proceedings of the Royal Society of London Series B-Biological Sciences
268:2391-2396.
Dick, C. W., G. Etchelecu, and F. Austerlitz. 2003. Pollen dispersal of tropical trees
(Dinizia excelsa: Fabaceae) by native insects and African honeybees in pristine
and fragmented Amazonian rainforest. Molecular Ecology 12:753-764.
Dick, C. W., F. A. Jones, O. J. Hardy, and R. J. Petit. 2008. Spatial scales of seed and
pollen-mediated gene flow in tropical forest trees. Tropical Plant Biology 1:20-33.
Donald, P. F. 2004. Biodiversity impacts of some agricultural commodity production
systems. Conservation Biology 18:17-37.
Donaldson, J., I. Nanni, C. Zachariades, J. Kemper, and J. Thompson. 2002. Effects of
habitat fragmentation on pollinator diversity and plant reproductive success in
renosterveld shrublands of South Africa. Conservation Biology Series
(Cambridge) 16.
Dornhaus, A. and L. Chittka. 1999. Insect behaviour - Evolutionary origins of bee
dances. Nature 401:38-38.

119
Dornhaus, A. and L. Chittka. 2004. Why do honey bees dance? Behavioral Ecology and
Sociobiology 55:395-401.
Dover, J. and J. Settele. 2009. The influences of landscape structure on butterfly
distribution and movement: a review. Journal of Insect Conservation 13:3-27.
Ebeling, A., A. M. Klein, J. Schumacher, W. W. Weisser, and T. Tscharntke. 2008. How
does plant richness affect pollinator richness and temporal stability of flower
visits? Oikos 117:1808-1815.
Eickwort, G. C. and S. F. Sakagami. 1979. Classification of nest architecture of bees in
the trip Augochlorini( Hymenoptera, Halictidae, Halictinae), with description of a
Brazilian nest of Rhinocorynura-inflaticeps. Biotropica 11:28-37.
Engel, M. S. 2000. Classification of the bee tribe Augochlorini (Hymenoptera :
Halictidae). Bulletin of the American Museum of Natural History:4-89.
Evans, H. E. and M. J. West-Eberhard. 1970. The Wasps. University of Michigan Press,
Ann Arbor.
Faraway, J. 2005. Extending the linear model with R: Generalized linear, mixed effects
and nonparametric regression models. Chapman and Hall/CRC, Boca Raton.
Fauchald, P. 1999. Foraging in a hierarchical patch system. American Naturalist 153:603-
613.
Fauchald, P. and T. Tveraa. 2006. Hierarchical patch dynamics and animal movement
pattern. Oecologia 149:383-395.
Fenster, C. B., W. S. Armbruster, P. Wilson, M. R. Dudash, and J. D. Thomson. 2004.
Pollination syndromes and floral specialization. Annual Review of Ecology
Evolution and Systematics 35:375-403.
Foster, R. B. 1982. The seasonal rythm of fruitfall on Barro Colorado Island. Pages 151-
172 in E. G. J. Leigh, A. S. Rand, and D. M. Windsor, editors. Ecology of a
tropical forest: seasonal rhythms and long-term changes. Smithsonian Institution
Press, Washington, D.C., USA.
Free, J. B. and I. H. Williams. 1983. Scent-marking of flowers by honeybees. Journal of
Apicultural Research 22:86–90.
Geist, H. J. and E. F. Lambin. 2002. Proximate causes and underlying driving forces of
tropical deforestation. Bioscience 52:143-150.
Glen, T. C. and N. A. Schable. 2005. Isolating microsatellite DNA loci. Methods in
Enzymology 395:202-222.
Goulson, D. 2003. Effects of introduced bees on native ecosystems. Annual Review of
Ecology Evolution and Systematics 34:1-26.
Greenberg, R., P. Bichier, A. C. Angon, C. MacVean, R. Perez, and E. Cano. 2000. The
impact of avian insectivory on arthropods and leaf damage in some Guatemalan
coffee plantations. Ecology 81:1750-1755.
Greenberg, R., P. Bichier, and J. Sterling. 1997. Bird populations in rustic and planted
shade coffee plantations of eastern Chiapas, Mexico. Biotropica 29:501-514.
Greenleaf, S. S. and C. Kremen. 2006. Wild bee species increase tomato production and
respond differently to surrounding land use in Northern California. Biological
Conservation 133:81-87.
Greenleaf, S. S., N. M. Williams, R. Winfree, and C. Kremen. 2007. Bee foraging ranges
and their relationship to body size. Oecologia 153:589-596.

120
Griffis-Kyle, K. L. and P. Beier. 2005. Migratory strategy and seasonal patterns of bird
diversity in relation to forest habitat. American Midland Naturalist 153:436-443.
Guo, S. and E. Thompson. 1992. Performing the exact test of Hardy–Weinberg
proportion from multiple alleles. Biometrics:361–372.
Gustafson, E. J. and R. H. Gardner. 1996. The effect of landscape heterogeneity on the
probability of patch colonization. Ecology 77:94-107.
Hanski, I. 1999. Metapopulation ecology. Oxford University Press, New York, NY.
Hardy, O. J. and X. Vekemans. 2002. SPAGEDi: a versatile computer program to analyse
spatial genetic structure at the individual or population levels. Molecular Ecology
Notes 2:618-620.
Hegland, S. J. and L. Boeke. 2006. Relationships between the density and diversity of
floral resources and flower visitor activity in a temperate grassland community.
Ecological Entomology 31:532-538.
Heinrich, B. 1979a. Keeping a Cool Head - Honeybee Thermoregulation. Science
205:1269-1271.
Heinrich, B. 1979b. Resource Heterogeneity and Patterns of Movement in Foraging
Bumblebees. Oecologia 40:235-245.
Heinrich, B. 1996. How the honey bee regulates its body temperature. Bee World 77:130-
137.
Hingston, A. B. 1998. Temporal and spatial variation in abundances of native bee species
on an altitudinal gradient in southern Tasmania. Australian Journal of Zoology
46:497-507.
Hoehn, P., T. Tscharntke, J. M. Tylianakis, and I. Steffan-Dewenter. 2008. Functional
group diversity of bee pollinators increases crop yield. Proceedings of the Royal
Society B-Biological Sciences 275:2283-2291.
Hooper, D. U., F. S. Chapin, J. J. Ewel, A. Hector, P. Inchausti, S. Lavorel, J. H. Lawton,
D. M. Lodge, M. Loreau, S. Naeem, B. Schmid, H. Setala, A. J. Symstad, J.
Vandermeer, and D. A. Wardle. 2005. Effects of biodiversity on ecosystem
functioning: A consensus of current knowledge. Ecological Monographs 75:3-35.
Hubbell, S. P. and L. K. Johnson. 1978. Comparative Foraging Behavior of 6 Stingless
Bee Species Exploiting a Standardized Resource. Ecology 59:1123-1136.
Huelsenbeck, J. P., P. Andolfatto, and E. T. Huelsenbeck. in press. Structurama: bayesian
inference of population structure. Bioinformatics.
Jha, S. and C. W. Dick. 2008. Shade coffee farms promote genetic diversity of native
trees. Current Biology 18:1126-1128.
Jha, S. and C. W. Dick. 2009. Microsatellite markers for Miconia affinis
(Melastomataceae). Molecular Ecology Resources 9 344-345.
Jha, S. and C. W. Dick. in press. Microsatellite markers for Miconia affinis
(Melastomataceae). Molecular Ecology Resources.
Johnson, L. K. and S. P. Hubbell. 1974. Aggression and Competition among Stingless
Bees - Field Studies. Ecology 55:120-127.
Johnson, R. 2007. CRS report for congress: recent honey bee colony declines
(Government report prepared for members of committees of congress
RL33938).in R. AiAE, Science and Industry Division, editor., Washington, DC.

121
Jones, F. A. and H. C. Muller-Landau. 2008. Measuring long-distance seed dispersal in
complex natural environments: an evaluation and integration of classical and
genetic methods. Journal of Ecology 96:642-652.
Karr, J. R. and K. E. Freemark. 1983. Habitat selection and environmental gradients -
dynammics in the stable tropics. Ecology 64:1481-1494.
Kearns, C. A. and D. W. Inouye. 1993. Techniques for Pollination Biologists. University
Press of Colorado, Niwot, Colorado, USA.
Kearns, C. A., D. W. Inouye, and N. M. Waser. 1998. Endangered mutualisms: The
conservation of plant-pollinator interactions. Annual Review of Ecology and
Systematics 29:83-112.
Kerr, W. E. 1967. The history of the introduction of African bees to Brazil. . South
African Bee Journal 39:3-5.
Kerr, W. E., S. D. Delrio, and M. D. Barrionuevo. 1982. The Southern Limits of the
Distribution of the Africanized Honey Bee in South-America. American Bee
Journal 122:196-198.
Kim, J., N. Williams, and C. Kremen. 2006. Effects of cultivation and proximity to
natural habitat on ground-nesting native bees in California sunflower fields.
Journal of the Kansas Entomological Society 79:309-320.
Kindlmann, P. and F. Burel. 2008. Connectivity measures: a review. Landscape Ecology
23:879-890.
Klein, A. M., S. A. Cunningham, M. Bos, and I. Steffan-Dewenter. 2008. Advances in
pollination ecology from tropical plantation crops. Ecology 89:935-943.
Klein, A. M., I. Steffan-Dewenter, D. Buchori, and T. Tscharntke. 2002. Effects of land-
use intensity in tropical agroforestry systems on coffee flower-visiting and trap-
nesting bees and wasps. Conservation Biology 16:1003-1014.
Klein, A. M., I. Steffan-Dewenter, and T. Tscharntke. 2003a. Bee pollination and fruit set
of Coffea arabica and C-canephora (Rubiaceae). American Journal of Botany
90:153-157.
Klein, A. M., I. Steffan-Dewenter, and T. Tscharntke. 2003b. Fruit set of highland coffee
increases with the diversity of pollinating bees. Proceedings of the Royal Society
of London Series B-Biological Sciences 270:955-961.
Klein, A. M., I. Steffan-Dewenter, and T. Tscharntke. 2003c. Pollination of Coffea
canephora in relation to local and regional agroforestry management. Journal of
Applied Ecology 40:837-845.
Klein, A. M., I. Steffan-Dewenter, and T. Tscharntke. 2004. Foraging trip duration and
density of megachilid bees, eumenid wasps and pompilid wasps in tropical
agroforestry systems. Journal of Animal Ecology 73:517-525.
Klein, A. M., I. Steffan-Dewenter, and T. Tscharntke. 2006. Rain forest promotes trophic
interactions and diversity of trap-nesting hymenoptera in adjacent agroforestry.
Journal of Animal Ecology 75:315-323.
Klein, A. M., B. E. Vaissiere, J. H. Cane, I. Steffan-Dewenter, S. A. Cunningham, C.
Kremen, and T. Tscharntke. 2007. Importance of pollinators in changing
landscapes for world crops. Proceedings of the Royal Society B-Biological
Sciences 274:303-313.

122
Krauss, J., T. Alfert, and I. Steffan-Dewenter. 2009. Habitat area but not habitat age
determines wild bee richness in limestone quarries. Journal of Applied Ecology
46:194-202.
Kremen, C., R. Bugg, N. Nicola, S. SA, R. Thorp, and N. Williams. 2002a. Native bees,
native plants and crop pollination in California. Fremontia 30:41-49.
Kremen, C., N. M. Williams, M. A. Aizen, B. Gemmill-Herren, G. LeBuhn, R. Minckley,
L. Packer, S. G. Potts, T. Roulston, I. Steffan-Dewenter, D. P. Vazquez, R.
Winfree, L. Adams, E. E. Crone, S. S. Greenleaf, T. H. Keitt, A. M. Klein, J.
Regetz, and T. H. Ricketts. 2007. Pollination and other ecosystem services
produced by mobile organisms: a conceptual framework for the effects of land-
use change. Ecology Letters 10:299-314.
Kremen, C., N. M. Williams, R. L. Bugg, J. P. Fay, and R. W. Thorp. 2004. The area
requirements of an ecosystem service: crop pollination by native bee communities
in California. Ecology Letters 7:1109-1119.
Kremen, C., N. M. Williams, and R. W. Thorp. 2002b. Crop pollination from native bees
at risk from agricultural intensification. Proceedings of the National Academy of
Sciences of the United States of America 99:16812-16816.
Kunin, W. E. 1993. Sex and the Single Mustard - Population-Density and Pollinator
Behavior Effects on Seed-Set. Ecology 74:2145-2160.
Kunin, W. E. 1997. Population size and density effects in pollination: Pollinator foraging
and plant reproductive success in experimental arrays of Brassica kaber. Journal
of Ecology 85:225-234.
Lambin, E. F., H. J. Geist, and E. Lepers. 2003. Dynamics of land-use and land-cover
change in tropical regions. Annual Review of Environment and Resources
28:205-241.
Larsen, T. H., N. Williams, and C. Kremen. 2005. Extinction order and altered
community structure rapidly disrupt ecosystem functioning. Ecology Letters
8:538-547.
Laurance, W. F. 1998. A crisis in the making: responses of Amazonian forests to land use
and climate change. Trends in Ecology & Evolution 13:411-415.
LeBuhn, G., S. Droege, N. Williams, R. Minckley, T. Griswold, C. Kremen, O.
Messinger, J. Cane, T. Roulston, F. Parker, V. Tepedino, and S. Buchmann. 2005.
A standardized method for monitoring bee populations- The Bee Inventory Plot.
available online at http://online.sfsu.edu/~beeplot/.
Levey, D. J., W. R. Silva, and M. Galetti. 2002. Seed Dispersal and Frugivory: Ecology,
Evolution and Conservation CAB International, Wallingford, UK.
Lin, B. B. 2007. Agroforestry management as an adaptive strategy against potential
microclimate extremes in coffee agriculture. Agricultural and Forest Meteorology
144:85-94.
Lin, B. B. and P. L. Richards. 2007. Soil random roughness and depression storage on
coffee farms of varying shade levels. Agricultural Water Management 92:194-
204.
Lindauer, M. 1971. Communication among social bees. Harvard Univ. Press, Cambridge,
MA.

123
Loiselle, B. A., V. L. Sork, J. Nason, and C. Graham. 1995. Spatial Genetic-Structure of
a Tropical Understory Shrub, Psychotria Officinalis (Rubiaceae). American
Journal of Botany 82:1420-1425.
Lowe, A. J., D. Boshier, M. Ward, C. F. E. Bacles, and C. Navarro. 2005. Genetic
resource impacts of habitat loss and degradation; reconciling empirical evidence
and predicted theory for neotropical trees. Heredity 95:255-273.
Loyola, R. D. and R. P. Martins. 2008. Habitat structure components are effective
predictors of trap-nesting Hymenoptera diversity. Basic and Applied Ecology
9:735-742.
Luck, G. W. and G. C. Daily. 2003. Tropical countryside bird assemblages: Richness,
composition, and foraging differ by landscape context. Ecological Applications
13:235-247.
Macarthur, R. and J. W. Macarthur. 1961. On bird species-diversity. Ecology 42:594-&.
Mangel, M. and C. W. Clark. 1986. Towards a Unified Foraging Theory. Ecology
67:1127-1138.
Marshall, E. J. P. 2002. Field margins in northern Europe: Integrating agricultural,
environmental and biodiversity functions. Pages 39-67 in Symposium on Field
Boundary Habitats. Canadian Weed Science Soc, Soc Canadienne Malherbologie,
Saskatoon, CANADA.
Marshall, T. C., J. Slate, L. E. B. Kruuk, and J. M. Pemberton. 1998. Statistical
confidence for likelihood-based paternity inference in natural populations.
Molecular Ecology 7:639-655.
McIntosh, M. 1996. Nest-substrate preferences of the twig-nesters Ceratina acantha,
Ceratina nanula (Apidae) and Pemphredon lethifer (Sphecidae). Journal of the
Kansas Entomological Society 69:216-231.
Michener, C. D. 1979. Biogeography of the Bees. Annals of the Missouri Botanical
Garden 66:277-347.
Michener, C. D. 2000. Bees of the World. Johns Hopkins University Press, Baltimore,
MD.
Moguel, P. and V. M. Toledo. 1999. Biodiversity conservation in traditional coffee
systems of Mexico. Conservation Biology 13:11-21.
Morgan, J. N. and J. A. Sonquist. 1963. Problems in analysis of survey data, and a
proposal. Journal of the American Statistical Association 58:415-&.
Murdoch, W. W., C. H. Peterson, and F. C. Evans. 1972. Diversity and Pattern in Plants
and Insects. Ecology 53:819-&.
Myers, N., R. A. Mittermeier, C. G. Mittermeier, G. A. B. da Fonseca, and J. Kent. 2000.
Biodiversity hotspots for conservation priorities. Nature 403:853-858.
Nagamitsu, T. and T. Inoue. 1997. Aggressive foraging of social bees as a mechanism of
floral resource partitioning in an Asian tropical rainforest. Oecologia 110:432-
439.
Nason, J. D. and J. L. Hamrick. 1997. Reproductive and genetic consequences of forest
fragmentation: Two case studies of neotropical canopy trees. Journal of Heredity
88:264-276.
Nee, S. and R. M. May. 1992. Dynamics of metapopulations- habitat destruction and
competitive coexistence. Journal of Animal Ecology 61:37-40.

124
Nieh, J. C. 2004. Recruitment communication in stingless bees (Hymenoptera, Apidae,
Meliponini). Apidologie 35:159-182.
Ockinger, E. and H. G. Smith. 2007. Semi-natural grasslands as population sources for
pollinating insects in agricultural landscapes. Journal of Applied Ecology 44:50-
59.
Okazaki, K. 1992. Nesting habits of the small carpenter bee, Ceratina dentipes, in
Hengchun Peninsula, Southern Taiwan. Journal of the Kansas Entomological
Society 65:190-195.
Olden, J. D., J. J. Lawler, and N. L. Poff. 2008. Machine learning methods without tears:
a primer for ecologists The Quarterly Review of Biology 83:171-192.
Oliver, I. and A. J. Beattie. 1996. Invertebrate morphospecies as surrogates for species: a
case study. Conservation Biology 10:99–109.
Oosterhout, C., W. F. Hutchinson, D. P. M. Wills, and P. Shipley. 2004. MICRO-
CHECKER: software for identifying and correcting genotyping errors in
microsatellite data. Molecular Ecology Notes:535–538.
Pasquet, R. S., A. Peltier, M. B. Hufford, E. Oudin, J. Saulnier, L. Paul, J. T. Knudsen, H.
R. Herren, and P. Gepts. 2008. Long-distance pollen flow assessment through
evaluation of pollinator foraging range suggests transgene escape distances.
Proceedings of the National Academy of Sciences of the United States of America
105:13456-13461.
Peakall, R. and P. E. Smouse. 2001. GENALEX (version 5.1): genetic analysis in Excel,
Population Genetic Software for Teaching and Research, . Australian National
University, Canberra, Australia.
Perfecto, I., R. A. Rice, R. Greenberg, and M. E. VanderVoort. 1996. Shade coffee: A
disappearing refuge for biodiversity. Bioscience 46:598-608.
Perfecto, I. and J. Vandermeer. 2008. Biodiversity conservation in tropical
agroecosystems - A new conservation paradigm. Pages 173-200 Year in Ecology
and Conservation Biology 2008. Blackwell Publishing, Oxford.
Perfecto, I., J. H. Vandermeer, G. L. Bautista, G. I. Nunez, R. Greenberg, P. Bichier, and
S. Langridge. 2004. Greater predation in shaded coffee farms: The role of resident
neotropical birds. Ecology 85:2677-2681.
Philpott, S. M., W. J. Arendt, I. Armbrecht, P. Bichier, T. V. Diestch, C. Gordon, R.
Greenberg, I. Perfecto, R. Reynoso-Santos, L. Soto-Pinto, C. Tejeda-Cruz, G.
Williams-Linera, J. Valenzuela, and J. M. Zolotoff. 2008a. Biodiversity Loss in
Latin American Coffee Landscapes: Review of the Evidence on Ants, Birds, and
Trees. Conservation Biology 22:1093-1105.
Philpott, S. M., B. Lin, S. Jha, and S. J. Brines. 2008b. A multi-scale assessment of
hurricane impacts on agricultural landscapes based on landuse and topographic
features. Agriculture, Ecosystems and Environment 128:12-20.
Plateaux-Quenu, C. 2008. Subsociality in halictine bees. Insectes Sociaux 55:335-346.
Potts, S. G., B. Vulliamy, A. Dafni, G. Ne'eman, and P. Willmer. 2003. Linking bees and
flowers: How do floral communities structure pollinator communities? Ecology
84:2628-2642.
Potts, S. G., B. Vulliamy, S. Roberts, C. O'Toole, A. Dafni, G. Ne'Eman, and P. Willmer.
2005. Role of nesting resources in organising diverse bee communities in a
Mediterranean landscape. Ecological Entomology 30:78-85.
125
Price, M. V. 1984. Insect ecology. 2nd edition. John Wiley and Sons, New York, New
York, USA.
Pritchard, J. K., M. Stephens, and P. J. Donnelly. 2000. Inference of population structure
using multilocus genotype data. Genetics 155:945-959.
Raine, N. E., T. C. Ings, A. Dornhaus, N. Salefl, and L. Chittka. 2006. Adaptation,
genetic drift, pleiotropy, and history in the evolution of bee foraging behavior.
Pages 305-354 Advances in the Study of Behavior, Vol 36. Elsevier Academic
Press Inc, San Diego.
Ramirez-Marcial, N., M. Gonzalez-Espinosa, and G. Williams-Linera. 2001.
Anthropogenic disturbance and tree diversity in Montane Rain Forests in Chiapas,
Mexico. Forest Ecology and Management 154:311-326.
Rathcke, B. 1983. Competition and facilitation among plants for pollination. Pages 305–
327 in L. Real, editor. Pollination biology. Academic Press, New York, New
York, USA. .
Raymond, M. and F. Rousset. 1995. GENEPOP version 1.2: a population genetics
software for exact test and ecumenicism. Journal of Heredity 86:248–249.
Recknagel, F. 2001. Applications of machine learning to ecological modelling.
Ecological Modelling 146:303-310.
Redford, K. H. 1992. The Empty Forest. Bioscience 42:412-422.
Rice, J., B. W. Anderson, and R. D. Ohmart. 1980. Seasonal habitat selection by birds in
the lower Colorado river valley. Ecology 61:1402-1411.
Richter, M. R. 1990. Hunting Social Wasp Interactions - Influence of Prey Size, Arrival
Order, and Wasp Species. Ecology 71:1018-1030.
Richter, M. R. 2000. Social wasp (Hymenoptera : Vespidae) foraging behavior. Annual
Review of Entomology 45:121-150.
Richter, M. R. and V. L. Tisch. 1999. Resource choice of social wasps: influence of
presence, size and species of resident wasps. Insectes Sociaux 46:131-136.
Ricketts, T. H. 2004. Tropical forest fragments enhance pollinator activity in nearby
coffee crops. Conservation Biology 18:1262-1271.
Ricketts, T. H., G. C. Daily, P. R. Ehrlich, and C. D. Michener. 2004. Economic value of
tropical forest to coffee production. Proceedings of the National Academy of
Sciences of the United States of America 101:12579-12582.
Ricketts, T. H., J. Regetz, I. Steffan-Dewenter, S. A. Cunningham, C. Kremen, A.
Bogdanski, B. Gemmill-Herren, S. S. Greenleaf, A. M. Klein, M. M. Mayfield, L.
A. Morandin, A. Ochieng, and B. F. Viana. 2008. Landscape effects on crop
pollination services: are there general patterns? Ecology Letters 11:499-515.
Rincon, M., D. W. Roubik, B. Finegan, D. Delgado, and N. Zamora. 1999. Understory
bees and floral resources in logged and silviculturally treated Costa Rican
rainforest plots. Journal of the Kansas Entomological Society 72:379-393.
Robledo-Arnuncio, J. J., F. Austerlitz, and P. E. Smouse. 2007. POLDISP: a software
package for indirect estimation of contemporary pollen dispersal. Molecular
Ecology Notes 7:763-766.
Root, R. B. and P. M. Kareiva. 1984. The Search for Resources by Cabbage Butterflies
(Pieris-Rapae) - Ecological Consequences and Adaptive Significance of
Markovian Movements in a Patchy Environment. Ecology 65:147-165.

126
Ross, K. and R. Matthews. 1991. The Social Biology of Wasps. Cornell University Press,
Ithaca.
Roubik, D. 1986. Sporadic food competition with the African honey bee: projected
impact on neotropical social bees. Journal of Tropical Ecology 2:97–111.
Roubik, D. 1991. Aspects of Africanized honey bee ecology in tropical America. . Page
435 in F. D. Spivak M, Breed MD editor. The “African” Honey Bee. Westview,
Boulder, CO
Roubik, D. 1995. Pollination of cultivated plants in the tropics. Food and Agriculture
Organization of the United Nations, Rome, Italy.
Roubik, D. W. 1978. Competitive Interactions between Neotropical Pollinators and
Africanized Honey Bees. Science 201:1030-1032.
Roubik, D. W. 1980. Foraging Behavior of Competing Africanized Honeybees and
Stingless Bees. Ecology 61:836-845.
Roubik, D. W. 2002. Tropical agriculture - The value of bees to the coffee harvest.
Nature 417:708-708.
Roubik, D. W. and H. Wolda. 2001. Do competing honey bees matter? Dynamics and
abundance of native bees before and after honey bee invasion. Population
Ecology 43:53-62.
Sakagami, S. and C. Michener. 1962. The Nest Architecture of Sweat Bees
University of Kansas Press, Lawrence, Kansas, U.S.A.
Sakagami, S. F. and Y. Maeta. 1977. Some presumably pre-social habits of Japanese
Ceratina bees, with notes on various social types in Hymenoptera. Insectes
Sociaux 24:319-343.
Sargent, R. D. 2003. Seasonal changes in pollen-packaging schedules in the protandrous
plant Chamerion angustifolium. Oecologia 135:221-226.
Schaffer, W. M., D. B. Jensen, D. E. Hobbs, J. Gurevitch, J. R. Todd, and M. V. Schaffer.
1979. Competition, Foraging Energetics, and the Cost of Sociality in 3 Species of
Bees. Ecology 60:976-987.
Schaffer, W. M., D. W. Zeh, S. L. Buchmann, S. Kleinhans, M. V. Schaffer, and J.
Antrim. 1983. Competition for Nectar between Introduced Honey Bees and
Native North-American Bees and Ants. Ecology 64:564-577.
Schmidt, J. O. and S. C. Thoenes. 1992. Criteria for nest site selection in honey-bees
(Hymenoptera, Apidae) - preferences between pheromone attractants and cavity
shapes. Environmental Entomology 21:1130-1133.
Schneider, S. S. and H. G. Hall. 1997. Diet selection and foraging distances of African
and European-African hybrid honey bee colonies in Costa Rica. Insectes Sociaux
44:171-187.
Schneider, S. S., G. D. Hoffman, and D. R. Smith. 2004. The African honey bee: Factors
contributing to a successful biological invasion. Annual Review of Entomology
49:351-376.
Schoener, T. W. 1971. Theory of Feeding Strategies. Annual Review of Ecology and
Systematics 2:369-404.
Sekercioglu, C. H. 2006. Ecological significance of bird populations. Pages 15-51
Handbook of the Birds of the World.
Sezen, U. U., R. L. Chazdon, and K. E. Holsinger. 2005. Genetic consequences of
tropical second-growth forest regeneration. Science 307:891-891.

127
Sezen, U. U., R. L. Chazdon, and K. E. Holsinger. 2007. Multigenerational genetic
analysis of tropical secondary regeneration in a canopy palm. Ecology 88:3065-
3075.
Shmida, A. and M. V. Wilson. 1985. Biological determinants of species-diversity.
Journal of Biogeography 12:1-20.
Sih, A. and M. S. Baltus. 1987. Patch Size, Pollinator Behavior, and Pollinator Limitation
in Catnip. Ecology 68:1679-1690.
Slaa, E. J. 2003. Foraging ecology of stingless bees: from individual behaviour to
community ecology. Utrecht University, Department of Behavioural Biology.,
Utrecht, Germany.
Smouse, P. E., R. J. Dyer, R. D. Westfall, and V. L. Sork. 2001. Two-generation analysis
of pollen flow across a landscape. I. Male gamete heterogeneity among females.
Evolution 55:260-271.
Sokal, R. R., Rohlf, FJ 1995. Biometry: the principles and practice of statistics in
biological research. 3rd edition. WH Freeman, New York, N.Y.
Soto-Pinto, L., Y. Romero-Alvarado, J. Caballero-Nieto, and G. S. Warnholtz. 2001.
Woody plant diversity and structure of shade-grown-coffee plantations in
Northern Chiapas, Mexico. Revista de Biologia Tropical 49:977-987.
Spivak, M., D. J. C. Fletcher, and M. C. Breed. 1991. The “African” Honey Bee.
Westview, Boulder, CO.
Srinivasan, M. V., S. W. Zhang, M. Lehrer, and T. S. Collett. 1996. Honeybee navigation
en route to the goal: Visual flight control and odometry. Journal of Experimental
Biology 199:237-244.
Steffan-Dewenter, I., U. Munzenberg, C. Burger, C. Thies, and T. Tscharntke. 2002.
Scale-dependent effects of landscape context on three pollinator guilds. Ecology
83:1421-1432.
Steffan-Dewenter, I., U. Munzenberg, and T. Tscharntke. 2001. Pollination, seed set and
seed predation on a landscape scale. Proceedings of the Royal Society of London
Series B-Biological Sciences 268:1685-1690.
Steffan-Dewenter, I., S. G. Potts, and L. Packer. 2005. Pollinator diversity and crop
pollination services are at risk. Trends in Ecology & Evolution 20:651-652.
Steffan-Dewenter, I. and T. Tscharntke. 2001. Succession of bee communities on fallows.
Ecography 24:83-93.
Steffan-Dewenter, I. and C. Westphal. 2008. The interplay of pollinator diversity,
pollination services and landscape change. Journal of Applied Ecology 45:737-
741.
Stein, B., L. Kutner, and J. Adams. 2000. Precious heritage: The status of biodiversity in
the United States. Oxford University Press, New York.
Stone, G. N. 1994. Activity Patterns of Females of the Solitary Bee Anthophora plumipes
in Relation to Temperature, Nectar Supplies and Body-Size. Ecological
Entomology 19:177-189.
Tautz, J., S. W. Zhang, J. Spaethe, A. Brockmann, A. Si, and M. Srinivasan. 2004.
Honeybee odometry: Performance in varying natural terrain. PLoS Biology
2:915-923.
Tepedino, V. J. and N. L. Stanton. 1981. Diversity and Competition in Bee-Plant
Communities on Short-Grass Prairie. Oikos 36:35-44.

128
Thomson, D. 2004. Competitive interactions between the invasive European honey bee
and native bumble bees. Ecology 85:458-470.
Thomson, D. M. 2006. Detecting the effects of introduced species: a case study of
competition between Apis and Bombus. Oikos 114:407-418.
Thorp, R. 1987. World overview of the interactions between honeybees and other flora
and fauna. Pages 40–47 in J. Blyth, editor. Beekeeping and Land Management
Department of Conservation and Land Management, Perth.
Totland, O. and I. Matthews. 1998. Determinants of pollinator activity and flower
preference in the early spring blooming Crocus vernus. Acta Oecologica-
International Journal of Ecology 19:155-165.
Tylianakis, J. M., A. M. Klein, T. Lozada, and T. Tscharntke. 2006. Spatial scale of
observation affects alpha, beta and gamma diversity of cavity-nesting bees and
wasps across a tropical land-use gradient. Journal of Biogeography 33:1295-1304.
Tylianakis, J. M., A. M. Klein, and T. Tscharntke. 2005. Spatiotemporal variation in the
diversity of hymenoptera across a tropical habitat gradient. Ecology 86:3296-
3302.
Tylianakis, J. M., T. A. Rand, A. Kahmen, A. M. Klein, N. Buchmann, J. Perner, and T.
Tscharntke. 2008. Resource heterogeneity moderates the biodiversity-function
relationship in real world ecosystems. PLoS Biology 6:947-956.
Van Bael, S. A., S. M. Philpott, R. Greenberg, P. Bichier, N. A. Barber, K. A. Mooney,
and D. S. Gruner. 2008. Birds as predators in tropical agroforestry systems.
Ecology 89:928-934.
Vandermeer, J. H. 2003. Tropical Agroecosystems. CRC Press, Boca Raton, Florida.
Veddeler, D., A. M. Klein, and T. Tscharntke. 2006. Contrasting responses of bee
communities to coffee flowering at different spatial scales. Oikos 112:594-601.
Vekemans, X. and O. J. Hardy. 2004. New insights from fine-scale spatial genetic
structure analyses in plant populations. Molecular Ecology 13:921-935.
Vergara, C. H. and E. I. Badano. 2009. Pollinator diversity increases fruit production in
Mexican coffee plantations: The importance of rustic management systems.
Agriculture Ecosystems & Environment 129:117-123.
Vitousek, P. M., C. M. Dantonio, L. L. Loope, and R. Westbrooks. 1996. Biological
invasions as global environmental change. American Scientist 84:468-478.
Vonfrisch, K., A. M. Wenner, and D. L. Johnson. 1967. Honeybees - Do They Use
Direction and Distance Information Provided by Their Dancers. Science
158:1072-&.
Wang, B. C., V. L. Sork, M. T. Leong, and T. B. Smith. 2007. Hunting of mammals
reduces seed removal and dispersal of the afrotropical tree Antrocaryon
klaineanum (Anacardiaceae). Biotropica 39:340-347.
Wcislo, W. T., V. H. Gonzalez, and M. S. Engel. 2003. Nesting and social behavior of a
wood-dwelling neotropical bee, Augochlora isthmii (Schwarz), and notes on a
new species, A-alexanderi Engel (Hymenoptera : Halictidae). Journal of the
Kansas Entomological Society 76:588-602.
Weising, K., H. Nybom, K. Wolff, and G. Kahl. 2005. DNA Fingerprinting in Plants.
CRC Press, Boca raton.
Westphal, C., R. Bommarco, G. Carre, E. Lamborn, N. Morison, T. Petanidou, S. G.
Potts, S. P. M. Roberts, H. Szentgyorgyi, T. Tscheulin, B. E. Vaissiere, M.

129
Woyciechowski, J. C. Biesmeijer, W. E. Kunin, J. Settele, and I. Steffan-
Dewenter. 2008. Measuring bee diversity in different European habitats and
biogeographical regions. Ecological Monographs 78:653-671.
Westphal, C., I. Steffan-Dewenter, and T. Tscharntke. 2003. Mass flowering crops
enhance pollinator densities at a landscape scale. Ecology Letters 6:961-965.
Wilcove, D. S., D. Rothstein, J. Dubow, A. Phillips, and E. Losos. 1998. Quantifying
threats to imperiled species in the United States. Bioscience 48:607-615.
Williams-Guillen, K., K. Goodall, and C. Taylor. in prep. Avian and bat seed dispersers
of Miconia affinis.
Williams-Guillen, K., I. Perfecto, and J. Vandermeer. 2008. Bats limit insects in a
neotropical agroforestry system. Science 320:70-70.
Williams, C. 1964. Patterns in the balance of nature and related problems in quantitative
ecology. Academic Press, London.
Willmer, P. G. and G. N. Stone. 2004. Behavioral, ecological, and physiological
determinants of the activity patterns of bees. Advances in the Study of
Behavior:347-466.
Winfree, R. 2008. Pollinator-Dependent Crops: An Increasingly Risky Business. Current
Biology 18:R968-R969.
Winfree, R. and C. Kremen. 2009. Are ecosystem services stabilized by differences
among species? A test using crop pollination. Proceedings of the Royal Society
B-Biological Sciences 276:229-237.
Winfree, R., N. M. Williams, J. Dushoff, and C. Kremen. 2007. Native bees provide
insurance against ongoing honey bee losses. Ecology Letters 10:1105-1113.
Winfree, R., N. M. Williams, H. Gaines, J. S. Ascher, and C. Kremen. 2008. Wild bee
pollinators provide the majority of crop visitation across land-use gradients in
New Jersey and Pennsylvania, USA. Journal of Applied Ecology 45:793-802.
Wolda, H. and D. W. Roubik. 1986. Nocturnal Bee Abundance and Seasonal Bee
Activity in a Panamanian Forest. Ecology 67:426-433.
Wright, S. J. 2005. Tropical forests in a changing environment. Trends in Ecology &
Evolution 20:553-560.
Wuellner, C. T. 1999. Nest site preference and success in a gregarious, ground-nesting
bee Dieunomia triangulifera. Ecological Entomology 24:471-479.
Yamamura, K. 1999. Relation between plant density and arthropod density in cabbage.
Researches on Population Ecology 41:177-182.
Yamamura, K. 2002. Biodiversity and stability of herbivore populations: influences of
the spatial sparseness of food plants. Population Ecology 44:33-40.