Mouriño-Carballido, Beatriz, and Dennis J. McGillicuddy Jr ... · B. Mourin˜o-Carballido was...
15
Mesoscale variability in the metabolic balance of the Sargasso Sea Beatriz Mourin ˜o-Carballido 1 and Dennis J. McGillicuddy Jr. Applied Ocean Physics & Engineering, Woods Hole Oceanographic Institution, Woods Hole 02543, Massachusetts Abstract Net community production (NCP) experiments based on in vitro changes in dissolved oxygen were carried out in three mesoscale eddies investigated in the Sargasso Sea in the summer of 2004. NCP estimates ranged from negative to positive values, and the age and type of the sampled eddy were important factors responsible for this variability. Positive rates occurred in younger cyclones and in areas of eddy-eddy interactions, whereas negative NCP rates were observed in anticyclones and older cyclone features that were decaying. This information was combined with a nine-year data set from the BATS program and satellite altimeter data to assess the role of mesoscale eddies in the metabolic balance of the Sargasso Sea. Indirect NCP estimates (NCPe) were obtained by calculating the difference between 14 C phytoplankton production and bacterial carbon demand rates. The results showed highly variable NCPe rates that spanned the range of direct NCP observations. The metabolic balance of the photic layer in the ocean is determined by net community production (NCP), the difference between gross primary production (GPP) and total respiration (R). An excess of production over respiration, referred to as net autotrophic metabolic balance, implies a net synthesis of organic carbon that can be exported either vertically to the deep ocean, laterally to other regions, or to higher trophic levels. A negative balance, referred to as net heterotrophic balance, represents a net demand for allochthonous supplies of organic carbon or the consumption of dissolved organic matter produced elsewhere. Thus, the determination of NCP constitutes an important step in understanding carbon budgets and global change predictions. The Winkler technique has been used for over 70 years to estimate plankton photosynthesis and respiration rates based on in vitro changes in dissolved oxygen. However, when compared with the method to measure phytoplank- ton carbon incorporation rates based on 14 C uptake, this technique is a laborious and time-consuming procedure (Williams and Jenkinson 1982), which has severely hampered the development of a global database. Research efforts have been focused on building empirical regional-scale GPP : R relationships in order to predict NCP. The contradictory results obtained thus far have opened debate about the net metabolic state of the open ocean, i.e., whether the open ocean as a whole is in equilibrium or slightly autotrophic metabolic balance (Williams 1998) versus the net metabolic balance being heterotrophic (Duarte et al. 1999). In recent years, an intense effort has been made to address and investigate this enigmatic discrepancy. A number of studies using local-scale measure- ments of net oxygen production and respiration carried in the NE subtropical Atlantic, in different seasons and geographical locations, have repeatedly reported a net heterotrophic balance of the photic layer (Serret et al. 2002). The only study published to date that describes seasonal changes in the metabolic balance of a subtropical oligotrophic site, based on in vitro changes in oxygen concentration, reported net heterotrophy throughout the year at station ALOHA in the subtropical Pacific (Williams et al. 2004). It has been proposed that the measured net heterotrophy could be an artifact of undersampling episodic events of net autotrophy that would be decoupled from the more constant heterotrophic processes (Karl et al. 2003). In the lack of measurable nutrients during the summer, Jenkins and Goldman (1985) described the development of a sub- surface oxygen maximum associated with photosynthetic production in the Sargasso Sea. Their study of the seasonal cycle of oxygen supersaturation leads to a photosynthetic oxygen production estimation of the order of 0.5 mmol m 22 d 21 , which is consistent with a net autotro- phic metabolic balance through the year. One of the mechanisms that could generate pulses of net autotrophy is associated with mesoscale eddies. The suggested ecological role for mesoscale processes is not new. However, due to the costs and logistics involved in sampling high-frequency stochastic events, the knowledge about the role that these features play in the net metabolic state of open oceanic regions is scarce and limited to a few observations (Gonzalez et al. 2001; Fernandez et al. 2004; Maixandeau et al. 2005). A recent study conducted in the 1 Corresponding author. Present address: Departamento de Ecoloxı ´a e Bioloxı ´a Animal, Universidade de Vigo, 36310 Vigo, Spain, [email protected]. Acknowledgments We thank the following individuals for their help with this research: V. Kosnyrev, W. Jenkins, P. Rowe, L. Anderson, and F. Tapia (Woods Hole Oceanographic Institution) and P. Serret and V. Pe ´rez (University of Vigo). R. Leben (University of Colorado) provided the altimetry data that were essential for targeted sampling of eddy features described in this study. We are grateful to the participants of OC404-1 and OC404-4 cruises for their valuable support at sea and the numerous people who were involved in the collection and analysis of the Bermuda Atlantic Time Series data. We thank J. Doutt and D. Nowack for the design and construction of the temperature control system used in summer 2004. We thank N. Gruber, S. Neuer, K. Buesseler, D. Steinberg, and C. Carlson for their comments on this manuscript. B. Mourin ˜ o-Carballido was supported by a Fulbright post- doctoral fellowship. Support of this activity by the U.S. National Science Foundation and the National Aeronautics and Space Administration is greatly appreciated. Limnol. Oceanogr., 51(6), 2006, 2675–2689 E 2006, by the American Society of Limnology and Oceanography, Inc. 2675
Transcript of Mouriño-Carballido, Beatriz, and Dennis J. McGillicuddy Jr ... · B. Mourin˜o-Carballido was...

Mesoscale variability in the metabolic balance of the Sargasso Sea
Beatriz Mourino-Carballido1 and Dennis J. McGillicuddy Jr.Applied Ocean Physics & Engineering, Woods Hole Oceanographic Institution, Woods Hole 02543, Massachusetts
Abstract
Net community production (NCP) experiments based on in vitro changes in dissolved oxygen were carried outin three mesoscale eddies investigated in the Sargasso Sea in the summer of 2004. NCP estimates ranged fromnegative to positive values, and the age and type of the sampled eddy were important factors responsible for thisvariability. Positive rates occurred in younger cyclones and in areas of eddy-eddy interactions, whereas negativeNCP rates were observed in anticyclones and older cyclone features that were decaying. This information wascombined with a nine-year data set from the BATS program and satellite altimeter data to assess the role ofmesoscale eddies in the metabolic balance of the Sargasso Sea. Indirect NCP estimates (NCPe) were obtained bycalculating the difference between 14C phytoplankton production and bacterial carbon demand rates. The resultsshowed highly variable NCPe rates that spanned the range of direct NCP observations.
The metabolic balance of the photic layer in the ocean isdetermined by net community production (NCP), thedifference between gross primary production (GPP) andtotal respiration (R). An excess of production overrespiration, referred to as net autotrophic metabolicbalance, implies a net synthesis of organic carbon thatcan be exported either vertically to the deep ocean, laterallyto other regions, or to higher trophic levels. A negativebalance, referred to as net heterotrophic balance, representsa net demand for allochthonous supplies of organic carbonor the consumption of dissolved organic matter producedelsewhere. Thus, the determination of NCP constitutes animportant step in understanding carbon budgets and globalchange predictions.
The Winkler technique has been used for over 70 yearsto estimate plankton photosynthesis and respiration ratesbased on in vitro changes in dissolved oxygen. However,when compared with the method to measure phytoplank-ton carbon incorporation rates based on 14C uptake, thistechnique is a laborious and time-consuming procedure
(Williams and Jenkinson 1982), which has severelyhampered the development of a global database.
Research efforts have been focused on building empiricalregional-scale GPP : R relationships in order to predict NCP.The contradictory results obtained thus far have openeddebate about the net metabolic state of the open ocean, i.e.,whether the open ocean as a whole is in equilibrium orslightly autotrophic metabolic balance (Williams 1998)versus the net metabolic balance being heterotrophic(Duarte et al. 1999). In recent years, an intense effort hasbeen made to address and investigate this enigmaticdiscrepancy. A number of studies using local-scale measure-ments of net oxygen production and respiration carried inthe NE subtropical Atlantic, in different seasons andgeographical locations, have repeatedly reported a netheterotrophic balance of the photic layer (Serret et al.2002). The only study published to date that describesseasonal changes in the metabolic balance of a subtropicaloligotrophic site, based on in vitro changes in oxygenconcentration, reported net heterotrophy throughout theyear at station ALOHA in the subtropical Pacific (Williamset al. 2004). It has been proposed that the measured netheterotrophy could be an artifact of undersampling episodicevents of net autotrophy that would be decoupled from themore constant heterotrophic processes (Karl et al. 2003). Inthe lack of measurable nutrients during the summer, Jenkinsand Goldman (1985) described the development of a sub-surface oxygen maximum associated with photosyntheticproduction in the Sargasso Sea. Their study of the seasonalcycle of oxygen supersaturation leads to a photosyntheticoxygen production estimation of the order of0.5 mmol m22 d21, which is consistent with a net autotro-phic metabolic balance through the year.
One of the mechanisms that could generate pulses of netautotrophy is associated with mesoscale eddies. Thesuggested ecological role for mesoscale processes is notnew. However, due to the costs and logistics involved insampling high-frequency stochastic events, the knowledgeabout the role that these features play in the net metabolicstate of open oceanic regions is scarce and limited to a fewobservations (Gonzalez et al. 2001; Fernandez et al. 2004;Maixandeau et al. 2005). A recent study conducted in the
1 Corresponding author. Present address: Departamento deEcoloxıa e Bioloxıa Animal, Universidade de Vigo, 36310 Vigo,Spain, [email protected].
AcknowledgmentsWe thank the following individuals for their help with this
research: V. Kosnyrev, W. Jenkins, P. Rowe, L. Anderson, and F.Tapia (Woods Hole Oceanographic Institution) and P. Serret andV. Perez (University of Vigo). R. Leben (University of Colorado)provided the altimetry data that were essential for targetedsampling of eddy features described in this study. We are gratefulto the participants of OC404-1 and OC404-4 cruises for theirvaluable support at sea and the numerous people who wereinvolved in the collection and analysis of the Bermuda AtlanticTime Series data. We thank J. Doutt and D. Nowack for thedesign and construction of the temperature control system used insummer 2004. We thank N. Gruber, S. Neuer, K. Buesseler, D.Steinberg, and C. Carlson for their comments on this manuscript.
B. Mourino-Carballido was supported by a Fulbright post-doctoral fellowship. Support of this activity by the U.S. NationalScience Foundation and the National Aeronautics and SpaceAdministration is greatly appreciated.
Limnol. Oceanogr., 51(6), 2006, 2675–2689
E 2006, by the American Society of Limnology and Oceanography, Inc.
2675

NE subtropical Atlantic estimated that the potentialenhancement of primary production rates associated withmesoscale features could be ,7% of the total net primaryproduction of the region (Mourino et al. 2005).
This observation contrasts with results obtained in themore dynamic NW Atlantic, where substantial evidenceindicates that mesoscale eddies are the main mechanism thattransports nutrients into the photic layer (Siegel et al. 1999).
Three different types of mid-ocean eddies have beenidentified in the Sargasso Sea (McGillicuddy et al. 1999):cyclones, anticyclones, and mode-water eddies (MWEs).Cyclones and MWEs tend to displace upper oceanisopycnals toward the surface, causing nutrient input intothe euphotic zone. Eddy age is another important factorthat controls the associated biological response (Sweeney etal. 2003). The formation and intensification phases of theeddy’s lifetime occur when nutrients are transported intothe euphotic layer and the associated biological responseoccurs (McGillicuddy and Robinson 1997).
Measurements of net oxygen production and respirationwere conducted in the Sargasso Sea in summer 2004, duringthe first year of field work of the Eddy Dynamics, Mixing,
Export, and Species composition (EDDIES) project. Ourgoal was to (1) assess the spatial variability in the netmetabolic carbon balance of planktonic communitiesassociated with different kinds of eddy features, and(2) determine the temporal variability in the metabolicbalance associated with two different times during thelifetime of one particular eddy. This information wascombined with a nine-year data set from the BermudaAtlantic Time Series Study (BATS) in the oligotrophicnorthwestern Sargasso Sea (31.7uN, 64.2uW) and altimetersatellite images in order to investigate the role of mesoscaleeddies in the metabolic balance of the Sargasso Sea.
Methods
Locating and tracking mesoscale eddies—Eddy featuresof interest were identified prior to, and tracked during, theEDDIES cruises using near-real-time satellite altimetrymeasurements from TOPEX/Poseidon, Jason, GeosatFollow-On, and European Remote Sensing platforms,available through the Colorado Center for AstrodynamicsResearch, Northwestern Atlantic Near Real-Time Altime-
Fig. 1. Objective analysis of sea-level anomaly (SLA) (mm) for 05 June 2004 prior to the first cruise. SLA is computed relative toa long-term mean sea level, such that positive (negative) mesoscale features in SLA are associated with anticyclonic (cyclonic) eddies. Thecoastline is shown in black. The solid black line indicates the mean path of the Gulf Stream. The dashed lines correspond to a onestandard deviation meander envelope. Cyan, pink, and black lines represent satellites passes. The five eddies features (A1, A2, A3, C1,C2) identified prior to, and tracked during, the EDDIES cruises are indicated. A1, C1, and C2 were the three eddies selected for thisstudy. BATS, Bermuda Atlantic Time-series site.
2676 Mourino-Carballido and McGillicuddy
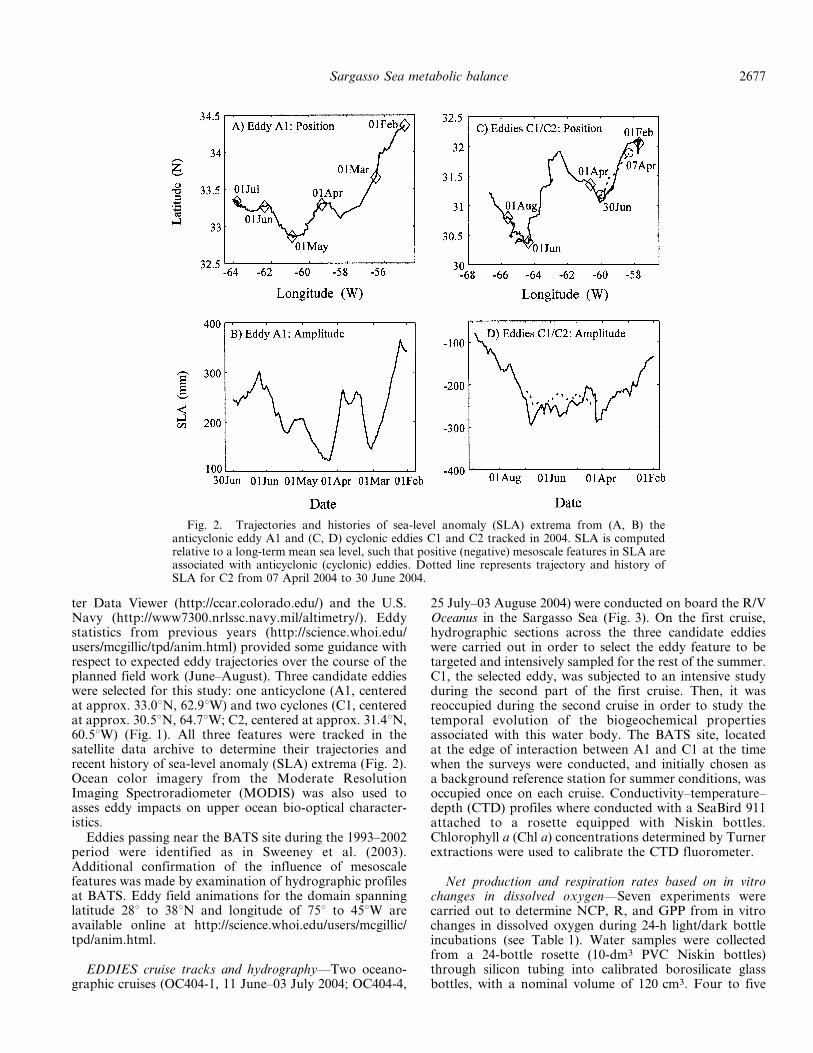
ter Data Viewer (http://ccar.colorado.edu/) and the U.S.Navy (http://www7300.nrlssc.navy.mil/altimetry/). Eddystatistics from previous years (http://science.whoi.edu/users/mcgillic/tpd/anim.html) provided some guidance withrespect to expected eddy trajectories over the course of theplanned field work (June–August). Three candidate eddieswere selected for this study: one anticyclone (A1, centeredat approx. 33.0uN, 62.9uW) and two cyclones (C1, centeredat approx. 30.5uN, 64.7uW; C2, centered at approx. 31.4uN,60.5uW) (Fig. 1). All three features were tracked in thesatellite data archive to determine their trajectories andrecent history of sea-level anomaly (SLA) extrema (Fig. 2).Ocean color imagery from the Moderate ResolutionImaging Spectroradiometer (MODIS) was also used toasses eddy impacts on upper ocean bio-optical character-istics.
Eddies passing near the BATS site during the 1993–2002period were identified as in Sweeney et al. (2003).Additional confirmation of the influence of mesoscalefeatures was made by examination of hydrographic profilesat BATS. Eddy field animations for the domain spanninglatitude 28u to 38uN and longitude of 75u to 45uW areavailable online at http://science.whoi.edu/users/mcgillic/tpd/anim.html.
EDDIES cruise tracks and hydrography—Two oceano-graphic cruises (OC404-1, 11 June–03 July 2004; OC404-4,
25 July–03 Auguse 2004) were conducted on board the R/VOceanus in the Sargasso Sea (Fig. 3). On the first cruise,hydrographic sections across the three candidate eddieswere carried out in order to select the eddy feature to betargeted and intensively sampled for the rest of the summer.C1, the selected eddy, was subjected to an intensive studyduring the second part of the first cruise. Then, it wasreoccupied during the second cruise in order to study thetemporal evolution of the biogeochemical propertiesassociated with this water body. The BATS site, locatedat the edge of interaction between A1 and C1 at the timewhen the surveys were conducted, and initially chosen asa background reference station for summer conditions, wasoccupied once on each cruise. Conductivity–temperature–depth (CTD) profiles where conducted with a SeaBird 911attached to a rosette equipped with Niskin bottles.Chlorophyll a (Chl a) concentrations determined by Turnerextractions were used to calibrate the CTD fluorometer.
Net production and respiration rates based on in vitrochanges in dissolved oxygen—Seven experiments werecarried out to determine NCP, R, and GPP from in vitrochanges in dissolved oxygen during 24-h light/dark bottleincubations (see Table 1). Water samples were collectedfrom a 24-bottle rosette (10-dm3 PVC Niskin bottles)through silicon tubing into calibrated borosilicate glassbottles, with a nominal volume of 120 cm3. Four to five
Fig. 2. Trajectories and histories of sea-level anomaly (SLA) extrema from (A, B) theanticyclonic eddy A1 and (C, D) cyclonic eddies C1 and C2 tracked in 2004. SLA is computedrelative to a long-term mean sea level, such that positive (negative) mesoscale features in SLA areassociated with anticyclonic (cyclonic) eddies. Dotted line represents trajectory and history ofSLA for C2 from 07 April 2004 to 30 June 2004.
Sargasso Sea metabolic balance 2677

depths were chosen according to the profiles of fluores-cence and photosynthetically available radiation (PAR).Samples from each depth were collected from threedifferent Niskin bottles to minimize exchange of oxygenwith the head space in the bottle. When ship logisticsprecluded predawn sampling, precautions were taken tominimize exposure of samples to light and temperaturegreater than those experienced in situ. From each depth,ten to fourteen clear and dark bottles were incubated for24 h in a light- and temperature-controlled on-deckincubator (Mourino et al. unpubl. data). Averagedstandard deviation (STD) of incubator temperature fromthe target temperature for each experiment was ,0.5uC (seeTable 1). Five to seven replicates bottles were fixedimmediately after the incubation experiments started inorder to quantify the initial oxygen concentrations.Measurements of dissolved oxygen were made with anautomated Winkler titration system on the basis ofa potentiometric end-point detector, as described inWilliams and Jenkinson (1982).
Net community production (NCP), community respira-tion (R), and gross primary production (GPP) rates werecalculated as
NCPij ~ Lijz { Iijz
Rij ~ Iijz { Dijz
GPPij ~ Lijz { Dijz
where L, D, and I are light and dark incubated and time
zero replicates. Subscripts represent experiment number (i),
depth level in each particular experiment (j), and number of
replicates for each depth level in each particular experiment
(z).Standard errors associated with NCP (SENCP), R
(SER), and GPP (SEGPP) were calculated as
SERij ~
ffiffiffiffiffiffiffiffiffiffiffiffiffiffiffiffiffiffiffiffiffiffiffiffiffiffiffiffiffiffiffiffiffiffiffiffiffiffiSEI2
ijz z SED2ijz
� �r
SENCPij ~
ffiffiffiffiffiffiffiffiffiffiffiffiffiffiffiffiffiffiffiffiffiffiffiffiffiffiffiffiffiffiffiffiffiffiffiffiffiSEL2
ijz z SEI2ijz
� �r
SEGPPij ~
ffiffiffiffiffiffiffiffiffiffiffiffiffiffiffiffiffiffiffiffiffiffiffiffiffiffiffiffiffiffiffiffiffiffiffiffiffiffiffiffiSEL2
ijz z SED2ijz
� �r
where SLE, SEI, and SED are standard errors of light and
dark incubated and time zero replicates.Oxygen concentration values of light and dark incubated
and time zero replicates were subjected to meticulousquality control. The averaged standard errors of NCP andR rates, calculated from the quality-controlled data, were0.15 mmol O2 m23 d21 (n 5 30) and 0.25 mmol O2
m23 d21 (n 5 27). These results are comparable to theaveraged standard errors of NCP and R rates (0.32 mmolO2 m23 d21, n 5 63; 0.20 mmol O2 m23 d21, n 5 119;respectively) reported by Robinson et al. (2002) in theirstudy of the plankton respiration in the Eastern AtlanticOcean using the same methodology. For comparativepurposes, GPP, NCP, and R rates were integrated to the1% light depth measured during the cruises (,100 m).Associated standard errors (mg C m22 d21) for each of thedepth-integrated rates (GPP, NCP, and R) were calculatedas:
SEi ~
ffiffiffiffiffiffiffiffiffiffiffiffiffiffiffiXNj
j ~ 1
E2ij
vuut
where Nj is the number of depth levels for each experiment
and E is
Eij ~1
2dj z 1 { dj
ffiffiffiffiffiffiffiffiffiffiffiffiffiffiffiffiffiffiffiffiffiffiffiffiffiffiffiffiffiffiffiffiffiffiffiffiffiSE2
ij z SE2ij z 1
� �r
where SEij (mg C m23 d21) is the standard error for each
rate at each depth level.
Bermuda Atlantic Time-series Study (BATS) data—Tointerpret our results in a regional context, we obtained insitu hydrographic and biogeochemical data from the BATSprogram for the 1993–2002 period and April to September2004, which were used in combination with altimetry datafor the same periods. Details of the BATS samplingscheme, analytical methods, data quality control, andintercalibration procedures appear in the BATS MethodsManual (Knap et al. 1993). Data are available from theBATS web site at http://www.bbsr.edu/cintoo/bats/bats.html.
Fig. 3. Location of CTD sampling stations studied duringthe OC404-1 (dots) and OC404-4 (crosses) cruises in the SargassoSea in summer 2004. Circles around dots indicate stations whereNCP experiments were conducted. Numbers represent CTDstations. A1, C1, and C2 indicate the location of anticycloniceddy A1 and cyclonic eddies C1 and C2, respectively. BATS,Bermuda Atlantic Time-series site.
2678 Mourino-Carballido and McGillicuddy

Indirect estimates of NCP (NCPe) for the 1993–2002period were calculated according to
NCPe ~ 14C PP { BCD
where 14C PP is the rate of 14C incorporation byphytoplankton and BCD is the rate of bacterial carbondemand. BCD was estimated as
BCD ~BG | ICF | CCF
BGE
where BG is bacterial growth rate measured by the {3H-methyl}-thymidine (3H-TdR) technique (Steinberg et al.2001); ICF and CCF are isotope and carbon conversionfactors, respectively; and BGE is the bacterial growthefficiency reported in the literature (see Table 2). PP andBG were integrated down to the base of the euphotic zoneat the BATS site (,100 m; Steinberg et al. 2001).Photosynthetic (PQ 5 1.4) and respiratory (RQ 5 1.1)quotients were assumed in order to transform oxygen tocarbon units (Laws 1991; Laws et al. 2000).
There are two important caveats associated with ourestimates of NCP. First, the 14C assimilation technique
underestimates gross primary production, and, second,estimating respiration on the basis of BCD underestimatestotal respiration.
The 14C technique underestimates gross primary pro-duction depending on a variety of factors, including lengthof the incubation (Karl et al. 1998; Marra 2002; Corno et al.2006). Studies comparing in vitro O2 fluxes with 14Cproduction rates during JGOFS (Joint Global Ocean FluxStudy) cruises determined that 14C productivities incubatedover 24 h were about 45% of gross carbon production ratescalculated from gross O2 production (Bender et al. 1999;Laws et al. 2000). In contrast to the 24-h incubations used inBender and Laws studies, BATS 14C incubations are dawn-to-dusk. Therefore, BATS 14C rates may be closer to grossprimary production than the factor of two indicated byBender and Laws. However, it is not possible to quantify thisrelationship at BATS because 14C and 18O methods have notbeen compared there.
The second caveat to interpretation of NCPe is thatestimating respiration on the basis of BCD ignorescontributions from other trophic levels that could consti-tute a significant fraction of the total respiration. Hetero-trophic bacteria are considered to be responsible for a large
Table 1. Details of oxygen evolutions experiments carried out during the OC404-1 and OC404-4 cruises in the Sargasso Sea insummer 2004. Numbers in brackets represent CTD stations and dates used to describe hydrographic properties (see Fig. 3).
Cruise Exp No. Stn. No. Location Position Date Depth (m) PAR T CTC Mean STD
OC404-1 1 6 (4) A1 32.67uN, 63.47uW 15 (15) Jun 2004 0 100 24.4OC404-1 1 6 (4) A1 32.67uN, 63.47uW 15 (15) Jun 2004 20 33 23.9OC404-1 1 6 (4) A1 32.67uN, 63.47uW 15 (15) Jun 2004 40 14 24.0OC404-1 1 6 (4) A1 32.67uN, 63.47uW 15 (15) Jun 2004 80 1 21.9 x 21.8 0.3OC404-1 2 15 (12) C2 31.18uN, 59.60uW 19 (18) Jun 2004 0 100 23.8OC404-1 2 15 (12) C2 31.18uN, 59.60uW 19 (18) Jun 2004 20 33 23.7OC404-1 2 15 (12) C2 31.18uN, 59.60uW 19 (18) Jun 2004 40 20 22.1 x 22.1 0.2OC404-1 2 15 (12) C2 31.18uN, 59.60uW 19 (18) Jun 2004 80 7 18.7 x 19 1OC404-1 3 20 (18) C1 30.50uN, 64.92uW 22 (21) Jun 2004 0 100 24.6OC404-1 3 20 (18) C1 30.50uN, 64.92uW 22 (21) Jun 2004 20 33 24.3OC404-1 3 20 (18) C1 30.50uN, 64.92uW 22 (21) Jun 2004 40 20 21.4 x 21.4 0.3OC404-1 3 20 (18) C1 30.50uN, 64.92uW 22 (21) Jun 2004 60 7 19.9 x 19.9 0.3OC404-1 3 20 (18) C1 30.50uN, 64.92uW 22 (21) Jun 2004 100 1 19.0 x 19.1 0.3OC404-1 4 63 (40) C1 30.87uN, 65.33uW 02 Jul (27 Jun) 2004 0 100 27.6OC404-1 4 63 (40) C1 30.87uN, 65.33uW 02 Jul (27 Jun) 2004 25 33 25.0 x 25.0 0.1OC404-1 4 63 (40) C1 30.87uN, 65.33uW 02 Jul (27 Jun) 2004 45 20 23.0 x 23.0 0.3OC404-1 4 63 (40) C1 30.87uN, 65.33uW 02 Jul (27 Jun) 2004 65 7 20.9 x 21.0 0.2OC404-1 4 63 (40) C1 30.87uN, 65.33uW 02 Jul (27 Jun) 2004 115 1 19.0 x 19.1 0.4OC404-1 5 65 BATS 31.63uN, 64.17uW 03 Jul 2004 0 100 26.3OC404-1 5 65 BATS 31.63uN, 64.17uW 03 Jul 2004 20 33 24.1 x 24.0 0.2OC404-1 5 65 BATS 31.63uN, 64.17uW 03 Jul 2004 40 20 21.4 x 21.4 0.1OC404-1 5 65 BATS 31.63uN, 64.17uW 03 Jul 2004 90 1 19.1 x 19.0 0.2OC404-4 6 26 BATS 31.67uN, 64.17uW 30 Jul 2004 0 100 27.9OC404-4 6 26 BATS 31.67uN, 64.17uW 30 Jul 2004 20 20 27.8OC404-4 6 26 BATS 31.67uN, 64.17uW 30 Jul 2004 40 7 23.9 x 24 1OC404-4 6 26 BATS 31.67uN, 64.17uW 30 Jul 2004 60 4.5 21.5 x 21.6 0.9OC404-4 6 26 BATS 31.67uN, 64.17uW 30 Jul 2004 115 1 19.5 x 19.7 0.9OC404-4 7 50 (7) C1 30.68uN, 65.77uW 05 Aug (27 Jul) 2004 0 100 27.7OC404-4 7 50 (7) C1 30.68uN, 65.77uW 05 Aug (27 Jul) 2004 30 33 27.6OC404-4 7 50 (7) C1 30.68uN, 65.77uW 05 Aug (27 Jul) 2004 50 20 24.6 x 24.5 0.2OC404-4 7 50 (7) C1 30.68uN, 65.77uW 05 Aug (27 Jul) 2004 75 4.5 21.6 x 21.7 0.4OC404-4 7 50 (7) C1 30.68uN, 65.77uW 05 Aug (27 Jul) 2004 115 1 19.7 x 19.9 0.8
PAR, photosynthetic active radiation level (%) used for on deck samples incubation; T, temperature in situ; CTC, constant temperature control system;mean, averaged temperature along the experiments; STD, standard deviation. A1 is anticyclonic eddy A1; C2, cyclonic eddy C2; C1, cyclonic eddy C1;BATS, Bermuda Atlantic Time-series site.
Sargasso Sea metabolic balance 2679

fraction of the total respiration, particularly in the leastproductive areas (Williams 1981). Del Giorgio and Duarte(2002) reviewed the current information on the contribu-tion of various biotic components and depth layers torespiration in the open ocean, and they assumed thatzooplankton respiration represents 5% of the combinedmicroplankton respiration in the photic and thermoclinewaters. Roman et al. (2002) estimated mesozooplanktonproduction at BATS site to be 2% of primary production atthis site. Using heterotrophic microplankton biomass datafrom Caron et al. (1995) (0.95 mg C L21) and the averagedweight-specific respiration rate for flagellates and ciliatespublished in Caron et al. (1990) (5.5 3 1026 nL O2
mm23 h21), we estimate heterotrophic microplanktonrespiration for the Sargasso Sea to be ,40 mg Cm22 d21. This number is one order of magnitude lowerthan our estimation of bacteria carbon demand (see below).On this basis, we assumed bacterial remineralization torepresent the main contribution to total respiration.
Unfortunately, it is not possible to quantify the errorsassociated with underestimation of gross primary pro-duction by the 14C assimilation technique and underesti-mation of respiration by BCD in computation of NCPeand thereby asses the absolute accuracy of the NCPeestimates. However, to the extent that these systematicerrors remain constant over time, we can interpret NCPe asa proxy for variability in NCP.
A Monte Carlo procedure was used to incorporate theuncertainty in the parameters and conversion factors
mentioned above into our calculations of NCPe andBCD. For each iteration, parameter values were drawnat random from their probability distributions. PP andBG were assumed to be normally distributed withmeans and standard deviations computed from the BATSdataset for 1993–2002 (Table 3). Variability, both withinand between cruises conducted on a given month ofthe year, was incorporated into these calculations. Valuesfor ICF, CCF, and BGE were drawn from uniformdistributions with limits defined by values reported in theliterature (Table 2). Ten thousand iterations were used toobtain an empirical probability distribution of NCPeand BCD. Finally, we computed the probability ofautotrophy for each month as the ratio between thenumber of iterations with NCPe . 0 and the total numberof iterations.
Results
Eddy trajectories and sea-level anomaly (SLA) history—The three candidate eddies: anticyclone A1 and cyclones C1and C2, were tracked in the satellite data archive todetermine their trajectories and recent history of sea-levelanomaly extrema (Fig. 2). Retrospective analysis of sea-level anomaly suggested a remote origin for A1 at approx.40uN, 40uW in April 2003 (data not shown). In June 2004,A1 was a persistently strong feature located north ofBATS, at approx. 33.5uN, 62.7uW, with sea-level anomalyextremum greater than 20 cm.
Table 3. Computed monthly averaged rates (mg C m22 d21) of 14C incorporation by phytoplankton (14C PP), bacterial growth(BG), bacterial carbon demand (BCD), and estimated net community production (NCPe), integrated to the 1% light depth (100 m) forthe period from 1993 to 2002. STD is standard deviation; p statistic probability for BATS site to be in net autotrophic balance.
Month
14C PP BG BCD NCPe
p (NCPe.0)Mean STD Mean STD Mean STD Mean STD
Jan 373 153 62 52 293 378 72 417 0.67Feb 465 137 50 17 238 205 225 246 0.84Mar 531 252 60 22 289 251 246 356 0.78Apr 499 363 94 67 446 519 47 622 0.59May 462 207 98 65 479 529 211 566 0.59Jun 365 112 94 25 449 365 282 380 0.50Jul 477 178 126 72 605 616 2120 655 0.53Aug 348 152 95 56 446 458 2105 498 0.51Sep 356 81 71 50 340 390 17 400 0.64Oct 378 112 57 31 274 275 105 298 0.72Nov 346 168 47 27 223 231 122 289 0.72Dec 366 159 42 18 198 183 164 244 0.78Ann. rate 46 87 70 9 336 78 382 37
Table 2. Ranges of parameters values used in the Monte Carlo simulations. ICF is the isotope conversion factor; CCF, carbonconversion factor and BGE, bacterial growth efficiency.
Parameter Min. Max. Units Source
ICF 0.2 5.6 31018 cell mol21 Carlson et al. 1996CCF 3.5 13 fg C cell21 Ducklow and Carlson 1992; Christian and Karl 1994; Caron et al.
1995; Carlson and Ducklow 1996; Carlson et al. 1996; Zubkov etal. 2000; Fukuda et al. 2002; Gundersen et al. 2002
BGE 7 19 % Carlson and Ducklow 1996
2680 Mourino-Carballido and McGillicuddy

In June 2004, sea-level anomalys associated with C1 andC2 were centered at 30.5uN, 64.7uW and 31.3uN, 60.5uW,respectively. Retrospective analysis of the sea-level anom-aly archive showed that both cyclonic eddies had originatedfrom the same feature that split in two in late March 2004.C1 intensified significantly during May 2004, during whichtime its edge affected BATS site and reached a sea-levelanomaly extremum greater than 225 cm in June 2004.Between the first and second cruise (June–August 2004), C1moved westward (approx. 31.0uN, 65.6uW) and wasassociated with a less intense sea-level anomaly. C2fluctuated within a 10–20 cm extremum from the time ofits split with C1 through the period of observations.
Hydrographic structure and mesoscale variability inmetabolic balance—The vertical thermal structure acrossA1 revealed a bolus of 26.5 sigma-t and 16uC water(Fig. 4A), as opposed to the thick lens of 18uC watercharacteristic of mode water eddies in this region (McGil-licuddy et al. 1999). A 1500 m cast at the center of A1 (datanot shown) indicated depression of the main pycnocline ofseveral hundred meters. The depression of the mainpycnocline is responsible for the positive sea-level anomalyassociated with A1 (Fig. 1) and its overall anticyclonicrotation (data not shown). A relative increase in oxygen
concentration (.230 mmol m23) was observed in theupper 80 3 10 kPa north from eddy center and also atthe southern periphery. The deep chlorophyll maximum(DCM), typically located at ,100 3 10 kPa in thesurrounding waters, shoaled to ,60 m at station 4, whereChl a concentration was .0.5 mg m23. However, whenthis station was reoccupied seven hours later and samplesfor the NCP experiment were collected, the DCM(,0.4 mg m23) was located at ,110 3 10 kPa (Fig. 5).Such rapid fluctuations could indicate small-scale spatialvariability or the presence of internal wave packets, whichhave been reported as a common feature in the SargassoSea (Eriksen 1988) and are associated with high subsurfacechlorophyll concentrations in large mesoscale features(Granata et al. 1995).
The CTD section across C2 (Fig. 4B) revealed a clearupward perturbation of both the seasonal and mainpycnoclines. The 26.4 isopycnal shoaled ,200 3 10 kPaover horizontal scales of ,80 km. Although sigma-t at 1003 10 kPa resembled that of deeper layers, sigma-t at 50 310 kPa was quite patchy, and the sense of sigma-t at 5 310 kPa was nearly opposite to those of the deeper layers. Amesoscale peak in oxygen concentration (.240 mmol m23)was observed at the eddy center at ,60 3 10 kPa. Thedistribution of Chl a concentration was more homo-
Fig. 4. Vertical distribution of sigma-t, oxygen concentration, and Chl a concentration across eddies (A) A1, (B) C2, and (C) C1. (D)Northern CTD section across the C1 eddy during the first cruise; (E) second reoccupation of the C1-center section (C), three days later.(F) Central CTD section across C1 eddy during the second cruise. Dashed lines printed over oxygen and chlorophyll plots representsigma-t distribution. Numbers on the top axis represent CTD station numbers. The asterisks indicate stations where net communityproduction (NCP) experiments were carried out.
Sargasso Sea metabolic balance 2681

geneous than observed in A1. Slightly higher Chl a con-centrations (.0.45 mg m23) were measured at stations 12and 11.
Two E-W sections through the center of C1 during thefirst cruise (Fig. 4C,D) revealed its impact on the mainpycnocline as well as on the upper ocean properties. The26.4 isopycnal shoaled more than 80 3 10 kPa overhorizontal scales of ,80 km. Oxygen concentration inexcess of 230 mmol m23 was observed at the eddy center(stations 18 and 19) in the first section (Fig. 4C) and in thewestern part of the northern CTD section at ,50 3 10 kPa(Fig. 4D). The DCM resided at 110 m, which was slightlydeeper than at C2. Higher Chl a concentrations (.0.45 mgm23) were observed at the western periphery of the eddy(station 51), where the DCM shoaled ,20 3 10 kPa, in thesouthern section (Fig. 4C), and at both sides of the eddycenter (stations 42 and 40) in the northern CTD section(Fig. 4D). A small spatial scale feature, missed on the firstoccupation of the transect through the center of C1(Fig. 4C), was observed when this transect was reoccupiedthree days later (Fig. 4E). The vertical hydrographicstructure showed shoaling of the main pycnocline anddeepening of the seasonal pycnocline associated withthinning of the 18uC water mass. The subsurface maximumin dissolved oxygen at ,50 m weakened between the firstand second occupations. Moreover, the second transectrevealed a large subsurface minimum in dissolved oxygen(,145 mmol m23) at ,300 m. Chl a at the eddy centerdecreased, and the minimum chlorophyll was located onestation west of the eddy center (station 36).
Based on the information provided by the CTD sectionsacross the eddies, measurements of net oxygen productionand respiration were conducted at stations influenced byeddy activity, where relatively enhanced fluorescence wasobserved. The metabolic balance of the photic layer wasalso studied at BATS site, initially chosen as a backgroundreference station for summer conditions. Unfortunately, noexperiments were conducted on the second occupation ofthe transect through the center of C1 (Fig. 4E), where thelarge subsurface minimum in dissolved oxygen wasobserved at ,300 m. The vertical distribution of NCP, R,
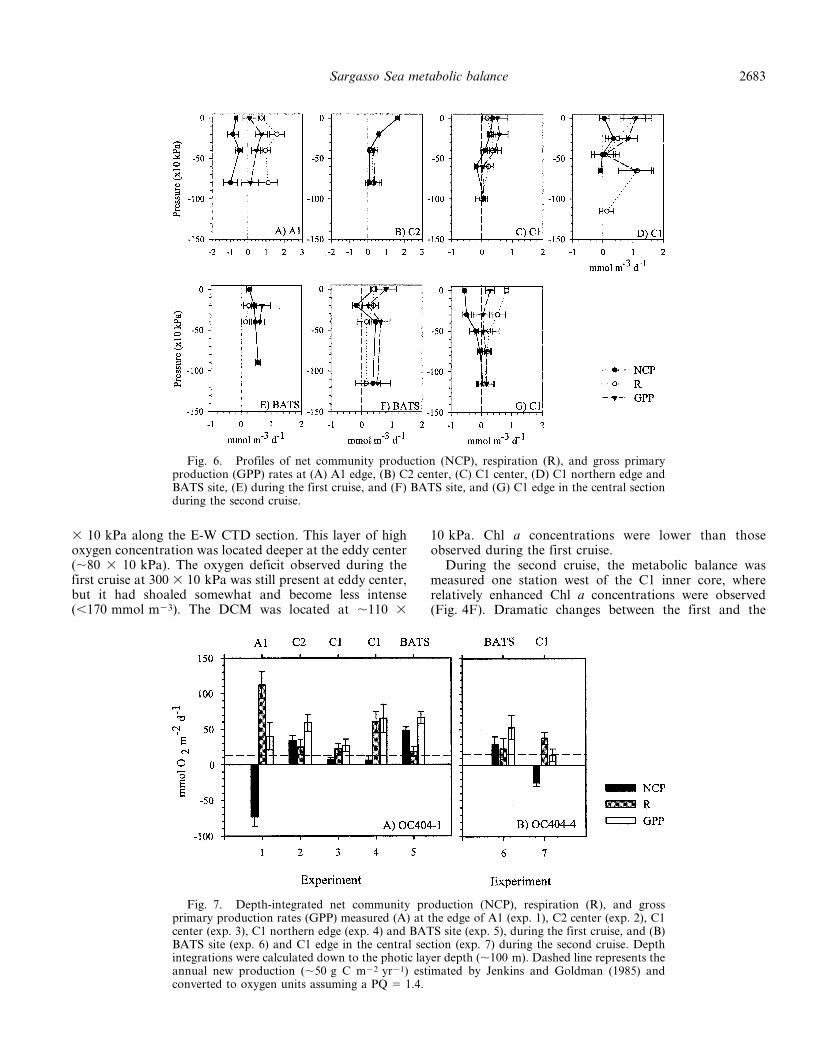
and GPP rates at the edge of A1 (station 4, see Fig. 4),center of C2 (station 12) and C1 (station 18), northern edgeof C1 (station 40), and BATS site, during the first cruise isshown in Figure 6. During the first cruise, only theexperiment carried out at A1 yielded negative NCPestimates (,20.5 mmol O2 m23 d21) at all depths wherethe experiment was performed, consistent with relativelyhigh respiration rates (.0.8 mmol O2 m23 d21). NCP rateswere positive in the upper 40 3 10 kPa at C1 and C2, anddecreased to almost zero further down. Maximum values ofNCP were found at the surface in the center of C2 and C1,although NCP at the surface of C2 (1.6 6 0.1 mmol O2
m23 d21) was four times higher than at C1 (0.35 60.5 mmol O2 m23 d21). In the northern section across C1,the maximum NCP value was found at 25 3 10 kPa (0.4 60.3 mmol O2 m23 d21). At BATS site, high values of NCP(.3.0 mmol O2 m23 d21) were measured in the upper 90 310 kPa.
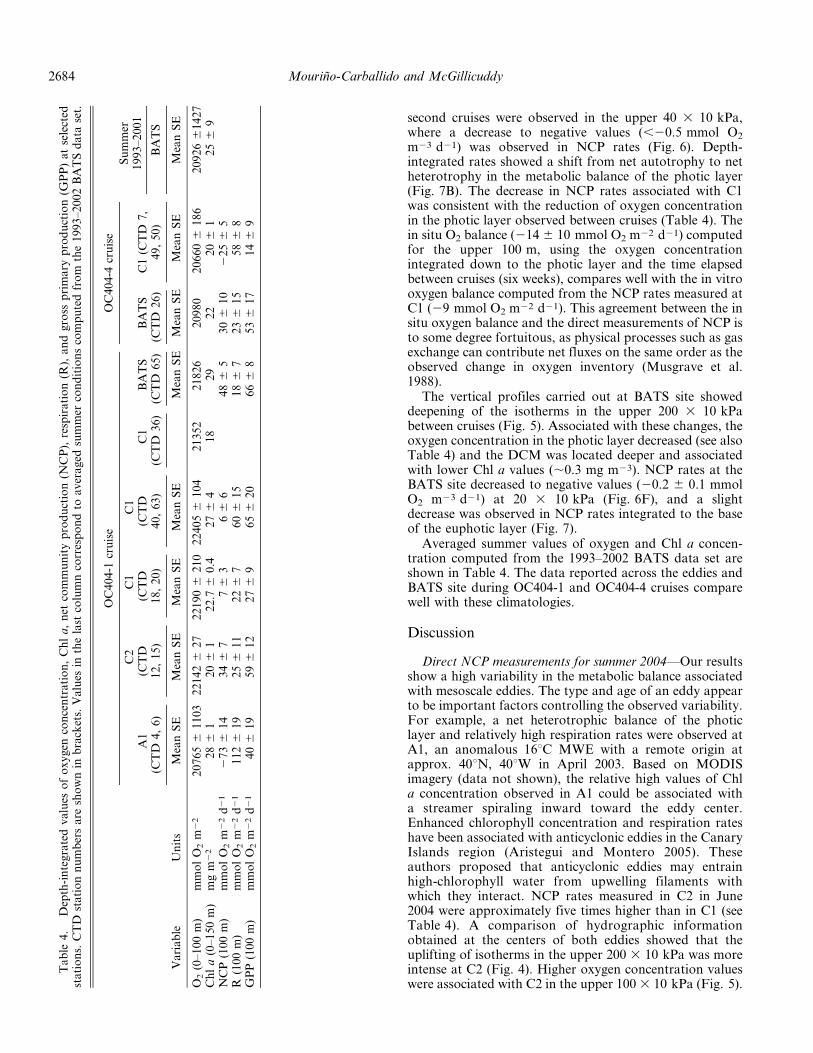
Depth-integrated rates revealed significant differencesbetween the eddies (Fig. 7A). During the first cruise, A1exhibited negative NCP (273 6 14 mmol O2 m22 d21) andrelatively high R (112 6 19 mmol O2 m22 d21). Thehighest depth-integrated NCP rates were obtained for C2(34 6 7 mmol O2 m22 d21) and BATS (48 6 5 mmol O2
m22 d21). Low values of NCP (,8 mmol O2 m22 d21)were found at C1, which exhibited relatively high values ofR (60 6 15 mmol O2 m22 d21) in the experiment carriedout north of the eddy center.
Temporal changes at C1 and the BATS site—Because ofthe small spatial scale feature observed across C1 duringthe first cruise, the resolution of stations in the eddy corewas increased during the second cruise (Fig. 4F). The E-Wsection through the eddy center during the second cruiseshowed a similar vertical hydrographic structure observedduring the second occupation of the eddy center as thatobserved during the first cruise, although some evolutionwas evident (Fig. 4E). The depression of the upper seasonalpycnocline at eddy center appeared to have relaxedsomewhat with respect to the first cruise. A band of.220 mmol m23 oxygen concentration was observed at 60
Fig. 5. Profiles of temperature, oxygen concentration, and Chl a in the upper 200 3 10 kPa at A1 (CTD 6, first cruise), C2 (CTD 15,first cruise), C1 (CTD 20, first cruise), C1 (CTD 63, first cruise), C1 (CTD 50, second cruise), and BATS site (CTD 65, first cruise, andCTD 26, second cruise). Circles correspond to summer averages calculated for the BATS site from the 1993–2002 data sets.
2682 Mourino-Carballido and McGillicuddy
3 10 kPa along the E-W CTD section. This layer of highoxygen concentration was located deeper at the eddy center(,80 3 10 kPa). The oxygen deficit observed during thefirst cruise at 300 3 10 kPa was still present at eddy center,but it had shoaled somewhat and become less intense(,170 mmol m23). The DCM was located at ,110 3
10 kPa. Chl a concentrations were lower than thoseobserved during the first cruise.
During the second cruise, the metabolic balance wasmeasured one station west of the C1 inner core, whererelatively enhanced Chl a concentrations were observed(Fig. 4F). Dramatic changes between the first and the
Fig. 6. Profiles of net community production (NCP), respiration (R), and gross primaryproduction (GPP) rates at (A) A1 edge, (B) C2 center, (C) C1 center, (D) C1 northern edge andBATS site, (E) during the first cruise, and (F) BATS site, and (G) C1 edge in the central sectionduring the second cruise.
Fig. 7. Depth-integrated net community production (NCP), respiration (R), and grossprimary production rates (GPP) measured (A) at the edge of A1 (exp. 1), C2 center (exp. 2), C1center (exp. 3), C1 northern edge (exp. 4) and BATS site (exp. 5), during the first cruise, and (B)BATS site (exp. 6) and C1 edge in the central section (exp. 7) during the second cruise. Depthintegrations were calculated down to the photic layer depth (,100 m). Dashed line represents theannual new production (,50 g C m22 yr21) estimated by Jenkins and Goldman (1985) andconverted to oxygen units assuming a PQ 5 1.4.
Sargasso Sea metabolic balance 2683
second cruises were observed in the upper 40 3 10 kPa,where a decrease to negative values (,20.5 mmol O2
m23 d21) was observed in NCP rates (Fig. 6). Depth-integrated rates showed a shift from net autotrophy to netheterotrophy in the metabolic balance of the photic layer(Fig. 7B). The decrease in NCP rates associated with C1was consistent with the reduction of oxygen concentrationin the photic layer observed between cruises (Table 4). Thein situ O2 balance (214 6 10 mmol O2 m22 d21) computedfor the upper 100 m, using the oxygen concentrationintegrated down to the photic layer and the time elapsedbetween cruises (six weeks), compares well with the in vitrooxygen balance computed from the NCP rates measured atC1 (29 mmol O2 m22 d21). This agreement between the insitu oxygen balance and the direct measurements of NCP isto some degree fortuitous, as physical processes such as gasexchange can contribute net fluxes on the same order as theobserved change in oxygen inventory (Musgrave et al.1988).
The vertical profiles carried out at BATS site showeddeepening of the isotherms in the upper 200 3 10 kPabetween cruises (Fig. 5). Associated with these changes, theoxygen concentration in the photic layer decreased (see alsoTable 4) and the DCM was located deeper and associatedwith lower Chl a values (,0.3 mg m23). NCP rates at theBATS site decreased to negative values (20.2 6 0.1 mmolO2 m23 d21) at 20 3 10 kPa (Fig. 6F), and a slightdecrease was observed in NCP rates integrated to the baseof the euphotic layer (Fig. 7).
Averaged summer values of oxygen and Chl a concen-tration computed from the 1993–2002 BATS data set areshown in Table 4. The data reported across the eddies andBATS site during OC404-1 and OC404-4 cruises comparewell with these climatologies.
Discussion
Direct NCP measurements for summer 2004—Our resultsshow a high variability in the metabolic balance associatedwith mesoscale eddies. The type and age of an eddy appearto be important factors controlling the observed variability.For example, a net heterotrophic balance of the photiclayer and relatively high respiration rates were observed atA1, an anomalous 16uC MWE with a remote origin atapprox. 40uN, 40uW in April 2003. Based on MODISimagery (data not shown), the relative high values of Chla concentration observed in A1 could be associated witha streamer spiraling inward toward the eddy center.Enhanced chlorophyll concentration and respiration rateshave been associated with anticyclonic eddies in the CanaryIslands region (Aristegui and Montero 2005). Theseauthors proposed that anticyclonic eddies may entrainhigh-chlorophyll water from upwelling filaments withwhich they interact. NCP rates measured in C2 in June2004 were approximately five times higher than in C1 (seeTable 4). A comparison of hydrographic informationobtained at the centers of both eddies showed that theuplifting of isotherms in the upper 200 3 10 kPa was moreintense at C2 (Fig. 4). Higher oxygen concentration valueswere associated with C2 in the upper 100 3 10 kPa (Fig. 5).
Table
4.
Dep
th-i
nte
gra
ted
va
lues
of
ox
yg
enco
nce
ntr
ati
on
,C
hl
a,
net
com
mu
nit
yp
rod
uct
ion
(NC
P),
resp
ira
tio
n(R
),a
nd
gro
ssp
rim
ary
pro
du
ctio
n(G
PP
)a
tse
lect
edst
ati
on
s.C
TD
sta
tio
nn
um
ber
sa
resh
ow
nin
bra
cket
s.V
alu
esin
the
last
colu
mn
corr
esp
on
dto
av
era
ged
sum
mer
con
dit
ion
sco
mp
ute
dfr
om
the
19
93
–2
00
2B
AT
Sd
ata
set.
Va
ria
ble
Un
its
OC
40
4-1
cru
ise
OC
40
4-4
cru
ise
Su
mm
er1
99
3–
20
01
A1
C2
C1
C1
C1
BA
TS
BA
TS
(CT
D4
,6
)(C
TD
12
,1
5)
(CT
D1
8,
20
)(C
TD
40
,6
3)
(CT
D3
6)
(CT
D6
5)
(CT
D2
6)
C1
(CT
D7
,4
9,
50
)B
AT
S
Mea
nS
EM
ean
SE
Mea
nS
EM
ean
SE
Mea
nS
EM
ean
SE
Mea
nS
EM
ean
SE
O2
(0–
10
0m
)m
mo
lO
2m
22
20
76
56
11
03
22
14
26
27
22
19
06
21
02
24
05
61
04
21
35
22
18
26
20
98
02
06
60
61
86
20
92
66
14
27
Ch
la
(0–
15
0m
)m
gm
22
28
61
20
61
22
.76
0.4
27
64
18
29
22
20
61
25
69
NC
P(1
00
m)
mm
ol
O2
m2
2d
21
27
36
14
34
67
76
36
66
48
65
30
61
02
25
65
R(1
00
m)
mm
ol
O2
m2
2d
21
11
26
19
25
61
12
26
76
06
15
18
67
23
61
55
86
8G
PP
(10
0m
)m
mo
lO
2m
22
d2
14
06
19
59
61
22
76
96
56
20
66
68
53
61
71
46
9
2684 Mourino-Carballido and McGillicuddy

Although no large differences in Chl a concentration wereobserved between C2 and C1, the DCM was in generalshallower at C2. These observations suggest that moreintense pumping of nutrients into the surface layers couldhave been taking place at C2. Deepening sea-level anomalyin C2 over time also indicates that the feature wasintensifying, as opposed to C1, which appeared to be ina decay phase (data not shown).
The hydrographic data also show changes through thecenter of C1 between the first and second cruise (Fig. 4).These changes in the hydrographic structure of C1coincided with the decrease in intensity of the subsurfaceminimum in oxygen concentration observed between 150and 400 3 10 kPa, a decrease in Chl a concentration, andthe shift in the metabolic balance at the center of the eddy,which changed from net autotrophic to net heterotrophic.Although we can not discard the idea that some of thetemporal changes observed in the metabolic balanceassociated with C1 were associated with imperfect samplingof a small-scale feature during the first cruise, these datasuggest that, at the time we sampled C1 during the secondcruise, the eddy was in a late state of decaying biologicalresponse.
Whereas the NCP differences between eddies and thetemporal changes observed in C1 are consistent with priorexpectations based on eddy age (Sweeney et al. 2003), themeasurements at BATS site, initially chosen as ourbackground reference station for summer conditions,remain enigmatic. Two possible scenarios can be invokedto interpret these results: (1) NCP estimates at BATSconstitute good reference points for summer conditions,and the mesoscale eddies sampled in this study containedNCP comparable to the background level, or (2) NCPestimates at the BATS site are enhanced with respect tobackground summer conditions, and the magnitude of theenhancement is similar to that observed in association witheddy-driven upwelling. Therefore, the background condi-tions must be determined in order to distinguish betweenthe two scenarios proposed above.
Variability in NCP background conditions: NCPe esti-mates from BATS data—Whilst a relatively extensivedatabase of phytoplankton photosynthetic carbon assim-ilation exists for subtropical regions (Steinberg et al.2001; Teira et al. 2005), the laborious and time-consuming estimation of NCP and R rates has severelyhampered the development of a regional database (Serretet al. 2002). This situation is particularly acute for theSargasso Sea, where, to our knowledge, only one directestimate of NCP has been reported so far, describing a netheterotrophic balance of the surface waters in summer-time (20.7 6 0.1 mmol O2 m23 d21; Williams andJenkinson 1982).
The lack of an extensive set of direct NCP estimates forthis region makes it challenging to interpret our results.However, several different estimates of net productionprovide valuable information about seasonal patterns inthe balance between photosynthesis and respiration in thisregion. By studying the seasonal cycle of oxygen supersat-uration, Jenkins and Goldman (1985) estimated photosyn-
thetic production to be of the order of 0.5 mmol m22 d21,consistent with a net autotrophic metabolic balancethrough the year. Serret et al. (pers. comm.) used a pre-dictive model for NCP, based on an empirical relationshipswith 14C-derived primary production rates, to find seasonalalternations of net autotrophic and net heterotrophicconditions, which could lead to an annually compensatedmetabolic balance at BATS site in the upper 200 m. Usingthe observed variability of the 13C : 12C ratio for the sameregion, Gruber et al. (pers. comm.) estimated positivevalues for NCP during almost the entire year, withmaximum values found in late spring. From a nine yearstudy carried out at BATS, Steinberg et al. (2001) reportedhigher primary production (PP) than bacterial carbondemand (BCD) values in winter and spring-bloom events,with a tight coupling of BCD and PP in the summer. Someperiods in the time series wherein BCD exceeds PP wereascribed to a greater portion of gross primary productionpartitioned as dissolved organic carbon, or to an over-estimation of BCD due to the use of an inappropriately lowbacterial growth efficiency coefficient.
We studied the seasonal variability in the balancebetween photosynthesis and respiration at BATS byestimating monthly averages of NCP (NCPe) for the1993–2002 period, computed as the difference between14C PP and BCD (see Methods section). There was highvariability in the 14C PP values (Fig. 8), with maximummonthly averages found in March (531 mg C m22 d21)associated with the spring bloom. Second-to-largest meanvalues were found for July (477 mg C m22 d21). Detailedanalysis of hydrographic and moored data highlights therole of mesoscale activity on the extreme values observed inJuly 1995, a period during which a mode water eddy waspresent at BATS (McNeil et al. 1999). BCD was maximumfrom April to September, after the spring bloom. Themaximum averaged monthly value was found in July(,700 mg C m22 d21). The variability in BCD and NCPevalues spanned in general the variability of available directobservations of dark community respiration and netcommunity production from in vitro changes in dissolvedoxygen experiments. NCPe monthly values, which were notsignificantly different from zero, were always positiveexcept in the summer months. The statistical probabilityof BATS site to be in net autotrophic balance is higher than0.5 through the year (see Table 3). Our estimate of theannual net community production in the photic layer (1 63 mol C m22) is lower than the values reported by Jenkinsand Goldman (1985; ,3.4 mol C m22) and Gruber et al.(1998; ,2.3 mol C m22). These differences could beattributed, at least partially, to the fact that our NCPeanalyses did not include the production of dissolvedorganic matter by phytoplankton, which can be significant,particularly in oligotrophic regions (Karl et al. 1998; Teiraet al. 2001).
The pattern in NCPe values we found for BATScontrasts with results obtained for station ALOHA, inthe oligotrophic North Pacific (Williams et al. 2004), whererespiration tends to exceed photosynthesis throughout theyear. Although we do not have seasonal coverage in directNCP measurements, it is interesting to note that the direct
Sargasso Sea metabolic balance 2685

NCP observations described here are consistent with theKarl et al.’s (2003) hypothesis of autotrophy in the openocean being episodic. However, unlike the constancy inheterotrophic processes proposed by Karl et al. (2003), ouranalyses show that total variability in BCD (coefficient ofvariation, CV, 65%) is higher than that of PP rates (CV 556%) (Fig. 8). These results suggest that episodic pulses ofnet autotrophy at BATS sites could be explained, at leastpartially, by variability in respiration processes. The idea ofpulses in net autotrophy being generated by a reduction inrespiration rates is consistent with recent observations ofnet autotrophic balances associated with cyclonic eddies inthe NE Atlantic (Gonzalez et al. 2001; Maixandeau et al.2005), and ascribed to a relative reduction in respirationrates.
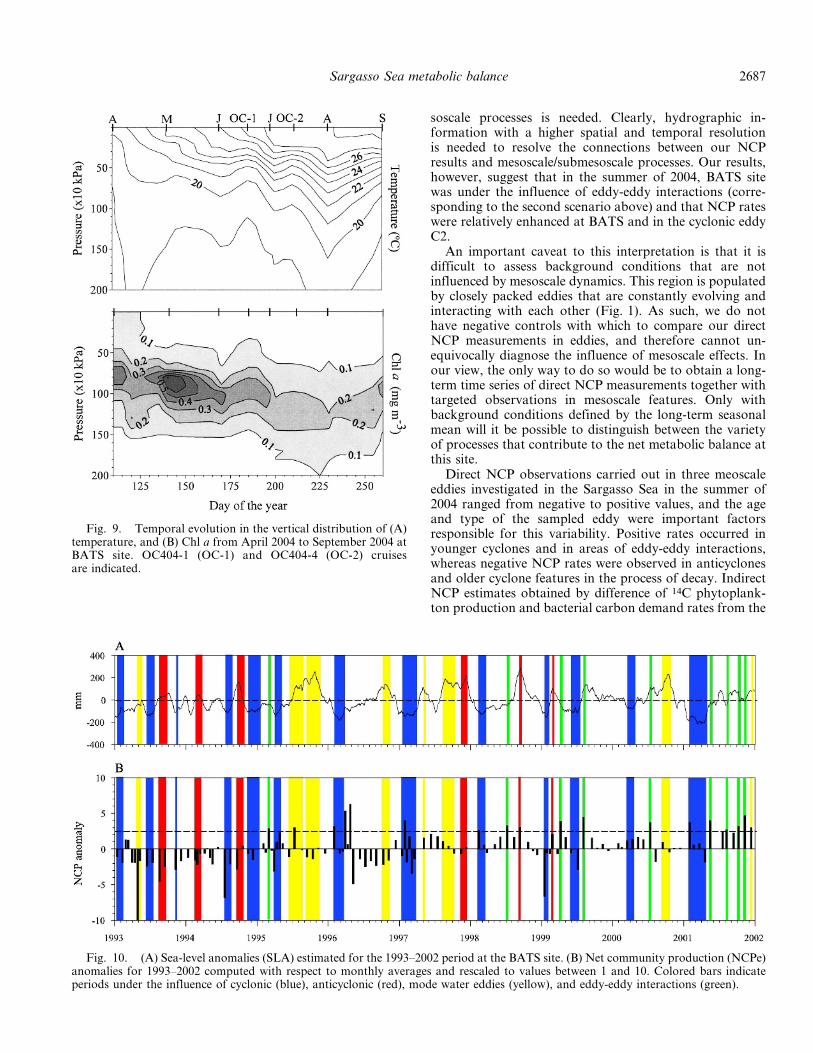
Mechanisms responsible for enhanced NCP rates at BATSin summer 2004—Our direct NCP observations suggest thataveraged metabolic balance reported for the summermonths is the result of highly variable NCP rates associatedwith mesoscale eddies. To investigate the influence ofprocesses that could be responsible for the enhanced NCPrates found at BATS in the summer of 2004, we studied thetemporal evolution of temperature and Chl a at BATSfrom April to September 2004 (Fig. 9). Vertical sectionsshowed an uplifting of the isotherms in the upper 200 310 kPa at the time this station was occupied during theOC404-1 and OC404-4 cruises. The Chl a distributionshowed that the deep chlorophyll maximum was slightlyshallower during the first EDDIES cruise (OC404-1) (seealso vertical profiles in Fig. 5). Sea-level anomaly data
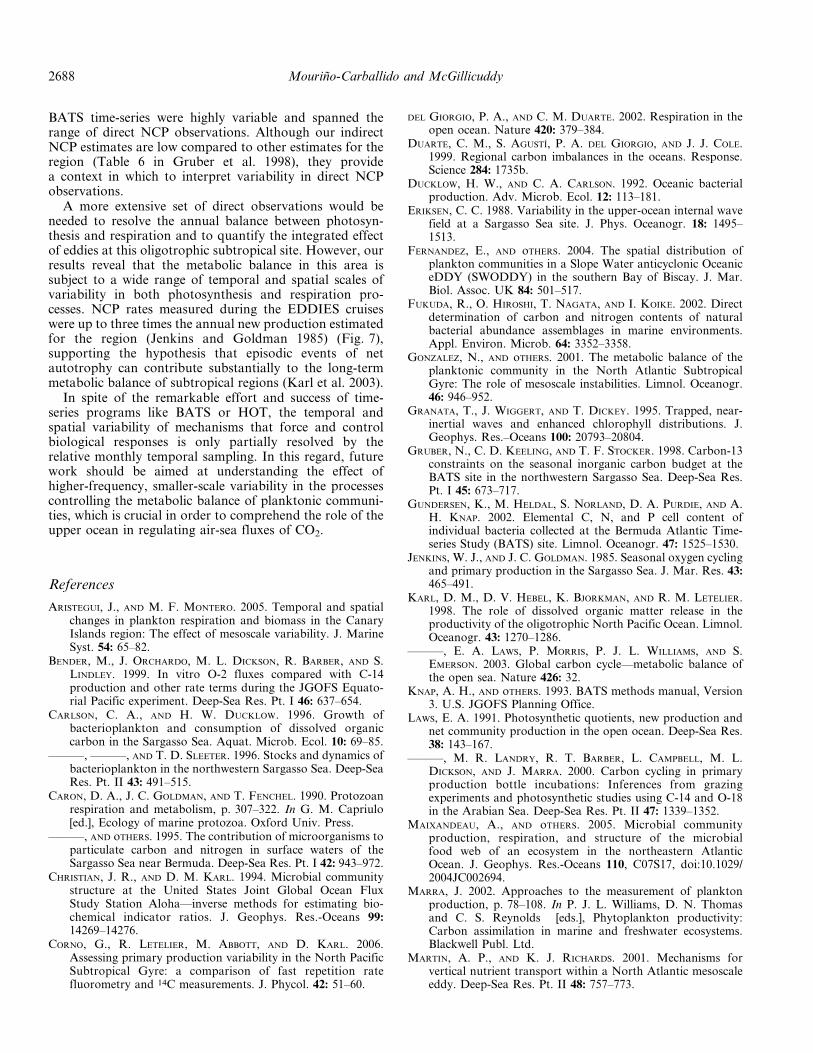
from altimeter images indicated that in early and late July,when NCP experiments were carried out at BATS, thisstation could have been under the influence of submeso-scale processes associated with interaction of A1 and C1.Unfortunately, we cannot resolve submesoscale processeswith the data set available in this study. However,a combination of altimeter and hydrographic data fromthe time series at BATS provides valuable information as toa potential link between enhanced NCP rates and eddy-eddy interactions. Figure 10 shows NCPe anomalies for1993–2002, which were computed with respect to monthlyaverages (see Table 3) and rescaled to values between zeroand 10. Colored bars indicate periods under the influenceof cyclonic (blue), anticyclonic (red), and mode watereddies (yellow). NCP anomalies were considered unusuallylarge when they were greater than an arbitrary threshold of2.5 in our 1–10 scale (i.e., 25% of the largest value). Sevenof these large NCPe anomalies occurred in periods whenBATS was under the influence of mesoscale eddies.Analysis of the altimeter images for 1993–2002 reveals thatnine other events of large NCP anomalies were associatedwith eddy-eddy interactions (green) and therefore werepotentially influenced by the input of nutrients into thephotic layer driven by submesoscale processes. The 1993–2002 retrospective analyses indicate that, although sub-jected to an important interannual variability, most of thetime, BATS was under the influence of cyclonic andanticyclonic eddies, meanders, or eddy-eddy interactions.
A number of studies (Martin and Richards 2001;Sanchez and Gil 2004) have already suggested that a betterunderstanding of the biogeochemical impacts of subme-
Fig. 8. Monthly means of (A) 14C incorporation rates by phytoplankton (14C PP), (B)bacterial carbon demand (BCD), and (C) net community production (NCPe) estimated for the1993–2002 period at the BATS site. Black dots represent individual observational points, withvalues of BCD and NCPe computed using the best-guess parameter set. White squares aremonthly means integrated to the 1% light depth (100 m) (see Table 3). Medium dashed linerepresents standard deviations about the monthly means, for BCD and NCPe derived from theMonte Carlo analysis. Long dashed line represents the annual new production estimated for theregion by Jenkins and Goldman (1985). NCP rates estimated from in vitro changes in dissolvedoxygen after 24-h incubations in the BATS region are also indicated.
2686 Mourino-Carballido and McGillicuddy
soscale processes is needed. Clearly, hydrographic in-formation with a higher spatial and temporal resolutionis needed to resolve the connections between our NCPresults and mesoscale/submesoscale processes. Our results,however, suggest that in the summer of 2004, BATS sitewas under the influence of eddy-eddy interactions (corre-sponding to the second scenario above) and that NCP rateswere relatively enhanced at BATS and in the cyclonic eddyC2.
An important caveat to this interpretation is that it isdifficult to assess background conditions that are notinfluenced by mesoscale dynamics. This region is populatedby closely packed eddies that are constantly evolving andinteracting with each other (Fig. 1). As such, we do nothave negative controls with which to compare our directNCP measurements in eddies, and therefore cannot un-equivocally diagnose the influence of mesoscale effects. Inour view, the only way to do so would be to obtain a long-term time series of direct NCP measurements together withtargeted observations in mesoscale features. Only withbackground conditions defined by the long-term seasonalmean will it be possible to distinguish between the varietyof processes that contribute to the net metabolic balance atthis site.
Direct NCP observations carried out in three meoscaleeddies investigated in the Sargasso Sea in the summer of2004 ranged from negative to positive values, and the ageand type of the sampled eddy were important factorsresponsible for this variability. Positive rates occurred inyounger cyclones and in areas of eddy-eddy interactions,whereas negative NCP rates were observed in anticyclonesand older cyclone features in the process of decay. IndirectNCP estimates obtained by difference of 14C phytoplank-ton production and bacterial carbon demand rates from the
Fig. 9. Temporal evolution in the vertical distribution of (A)temperature, and (B) Chl a from April 2004 to September 2004 atBATS site. OC404-1 (OC-1) and OC404-4 (OC-2) cruisesare indicated.
Fig. 10. (A) Sea-level anomalies (SLA) estimated for the 1993–2002 period at the BATS site. (B) Net community production (NCPe)anomalies for 1993–2002 computed with respect to monthly averages and rescaled to values between 1 and 10. Colored bars indicateperiods under the influence of cyclonic (blue), anticyclonic (red), mode water eddies (yellow), and eddy-eddy interactions (green).
Sargasso Sea metabolic balance 2687
BATS time-series were highly variable and spanned therange of direct NCP observations. Although our indirectNCP estimates are low compared to other estimates for theregion (Table 6 in Gruber et al. 1998), they providea context in which to interpret variability in direct NCPobservations.
A more extensive set of direct observations would beneeded to resolve the annual balance between photosyn-thesis and respiration and to quantify the integrated effectof eddies at this oligotrophic subtropical site. However, ourresults reveal that the metabolic balance in this area issubject to a wide range of temporal and spatial scales ofvariability in both photosynthesis and respiration pro-cesses. NCP rates measured during the EDDIES cruiseswere up to three times the annual new production estimatedfor the region (Jenkins and Goldman 1985) (Fig. 7),supporting the hypothesis that episodic events of netautotrophy can contribute substantially to the long-termmetabolic balance of subtropical regions (Karl et al. 2003).
In spite of the remarkable effort and success of time-series programs like BATS or HOT, the temporal andspatial variability of mechanisms that force and controlbiological responses is only partially resolved by therelative monthly temporal sampling. In this regard, futurework should be aimed at understanding the effect ofhigher-frequency, smaller-scale variability in the processescontrolling the metabolic balance of planktonic communi-ties, which is crucial in order to comprehend the role of theupper ocean in regulating air-sea fluxes of CO2.
References
ARISTEGUI, J., AND M. F. MONTERO. 2005. Temporal and spatialchanges in plankton respiration and biomass in the CanaryIslands region: The effect of mesoscale variability. J. MarineSyst. 54: 65–82.
BENDER, M., J. ORCHARDO, M. L. DICKSON, R. BARBER, AND S.LINDLEY. 1999. In vitro O-2 fluxes compared with C-14production and other rate terms during the JGOFS Equato-rial Pacific experiment. Deep-Sea Res. Pt. I 46: 637–654.
CARLSON, C. A., AND H. W. DUCKLOW. 1996. Growth ofbacterioplankton and consumption of dissolved organiccarbon in the Sargasso Sea. Aquat. Microb. Ecol. 10: 69–85.
———, ———, AND T. D. SLEETER. 1996. Stocks and dynamics ofbacterioplankton in the northwestern Sargasso Sea. Deep-SeaRes. Pt. II 43: 491–515.
CARON, D. A., J. C. GOLDMAN, AND T. FENCHEL. 1990. Protozoanrespiration and metabolism, p. 307–322. In G. M. Capriulo[ed.], Ecology of marine protozoa. Oxford Univ. Press.
———, AND oTHERS. 1995. The contribution of microorganisms toparticulate carbon and nitrogen in surface waters of theSargasso Sea near Bermuda. Deep-Sea Res. Pt. I 42: 943–972.
CHRISTIAN, J. R., AND D. M. KARL. 1994. Microbial communitystructure at the United States Joint Global Ocean FluxStudy Station Aloha—inverse methods for estimating bio-chemical indicator ratios. J. Geophys. Res.-Oceans 99:14269–14276.
CORNO, G., R. LETELIER, M. ABBOTT, AND D. KARL. 2006.Assessing primary production variability in the North PacificSubtropical Gyre: a comparison of fast repetition ratefluorometry and 14C measurements. J. Phycol. 42: 51–60.
DEL GIORGIO, P. A., AND C. M. DUARTE. 2002. Respiration in theopen ocean. Nature 420: 379–384.
DUARTE, C. M., S. AGUSTI, P. A. DEL GIORGIO, AND J. J. COLE.1999. Regional carbon imbalances in the oceans. Response.Science 284: 1735b.
DUCKLOW, H. W., AND C. A. CARLSON. 1992. Oceanic bacterialproduction. Adv. Microb. Ecol. 12: 113–181.
ERIKSEN, C. C. 1988. Variability in the upper-ocean internal wavefield at a Sargasso Sea site. J. Phys. Oceanogr. 18: 1495–1513.
FERNANDEZ, E., AND oTHERS. 2004. The spatial distribution ofplankton communities in a Slope Water anticyclonic OceaniceDDY (SWODDY) in the southern Bay of Biscay. J. Mar.Biol. Assoc. UK 84: 501–517.
FUKUDA, R., O. HIROSHI, T. NAGATA, AND I. KOIKE. 2002. Directdetermination of carbon and nitrogen contents of naturalbacterial abundance assemblages in marine environments.Appl. Environ. Microb. 64: 3352–3358.
GONZALEZ, N., AND oTHERS. 2001. The metabolic balance of theplanktonic community in the North Atlantic SubtropicalGyre: The role of mesoscale instabilities. Limnol. Oceanogr.46: 946–952.
GRANATA, T., J. WIGGERT, AND T. DICKEY. 1995. Trapped, near-inertial waves and enhanced chlorophyll distributions. J.Geophys. Res.–Oceans 100: 20793–20804.
GRUBER, N., C. D. KEELING, AND T. F. STOCKER. 1998. Carbon-13constraints on the seasonal inorganic carbon budget at theBATS site in the northwestern Sargasso Sea. Deep-Sea Res.Pt. I 45: 673–717.
GUNDERSEN, K., M. HELDAL, S. NORLAND, D. A. PURDIE, AND A.H. KNAP. 2002. Elemental C, N, and P cell content ofindividual bacteria collected at the Bermuda Atlantic Time-series Study (BATS) site. Limnol. Oceanogr. 47: 1525–1530.
JENKINS, W. J., AND J. C. GOLDMAN. 1985. Seasonal oxygen cyclingand primary production in the Sargasso Sea. J. Mar. Res. 43:465–491.
KARL, D. M., D. V. HEBEL, K. BJORKMAN, AND R. M. LETELIER.1998. The role of dissolved organic matter release in theproductivity of the oligotrophic North Pacific Ocean. Limnol.Oceanogr. 43: 1270–1286.
———, E. A. LAWS, P. MORRIS, P. J. L. WILLIAMS, AND S.EMERSON. 2003. Global carbon cycle—metabolic balance ofthe open sea. Nature 426: 32.
KNAP, A. H., AND oTHERS. 1993. BATS methods manual, Version3. U.S. JGOFS Planning Office.
LAWS, E. A. 1991. Photosynthetic quotients, new production andnet community production in the open ocean. Deep-Sea Res.38: 143–167.
———, M. R. LANDRY, R. T. BARBER, L. CAMPBELL, M. L.DICKSON, AND J. MARRA. 2000. Carbon cycling in primaryproduction bottle incubations: Inferences from grazingexperiments and photosynthetic studies using C-14 and O-18in the Arabian Sea. Deep-Sea Res. Pt. II 47: 1339–1352.
MAIXANDEAU, A., AND oTHERS. 2005. Microbial communityproduction, respiration, and structure of the microbialfood web of an ecosystem in the northeastern AtlanticOcean. J. Geophys. Res.-Oceans 110, C07S17, doi:10.1029/2004JC002694.
MARRA, J. 2002. Approaches to the measurement of planktonproduction, p. 78–108. In P. J. L. Williams, D. N. Thomasand C. S. Reynolds [eds.], Phytoplankton productivity:Carbon assimilation in marine and freshwater ecosystems.Blackwell Publ. Ltd.
MARTIN, A. P., AND K. J. RICHARDS. 2001. Mechanisms forvertical nutrient transport within a North Atlantic mesoscaleeddy. Deep-Sea Res. Pt. II 48: 757–773.
2688 Mourino-Carballido and McGillicuddy

MCGILLICUDDY, D. J., R. JOHNSON, D. A. SIEGEL, A. F. MICHAELS,N. R. BATES, AND A. H. KNAP. 1999. Mesoscale variations ofbiogeochemical properties in the Sargasso Sea. J. Geophys.Res.-Oceans 104: 13381–13394.
———, AND A. R. ROBINSON. 1997. Eddy-induced nutrient supplyand new production in the Sargasso Sea. Deep-Sea Res. Pt. I44: 1427–1450.
MCNEIL, J. D., H. W. JANNASCH, T. DICKEY, D. MCGILLICUDDY,M. BRZEZINSKI, AND C. M. SAKAMOTO. 1999. New chemical,bio-optical and physical observations of upper ocean responseto the passage of a mesoscale eddy off Bermuda. J. Geophys.Res.-Oceans 104: 15537–15548.
MOURINO, B., E. FERNANDEZ, R. PINGREE, B. SINHA, J. ESCANEZ,AND D. DE ARMAS. 2005. Constraining effect of mesoscalefeatures on carbon budget of photic layer in the NEsubtropical Atlantic. Mar. Ecol. Prog. Ser. 287: 45–52.
MUSGRAVE, D. L., J. CHOU, AND W. J. JENKINS. 1988. Applicationof a model of upper-ocean physics for studying seasonalcycles of oxygen. J. Geophys. Res.-Oceans 93: 15679–15700.
NEUER, S., AND oTHERS. 2002. Differences in the biological carbonpump at three subtropical ocean sites. Geophys. Res. Lett. 29,1885, doi:10.1029/2002GL015393.
ROBINSON, C., AND oTHERS. 2002. Plankton respiration in theeastern Atlantic Ocean. Deep-Sea Res. Pt. I 49: 787–813.
ROMAN, M. R., H. A. ADOLF, M. R. LANDRY, L. P. MADIN, D. K.STEINBERG, AND X. ZHANG. 2002. Estimates of oceanicmesozooplankton production: A comparison using theBermuda and Hawaii time-series data. Deep-Sea Res. Pt. II49: 175–192.
SANCHEZ, R., AND J. GIL. 2004. 3D structure, mesoscaleinteractions and potential vorticity conservation in a swoddyin the Bay of Biscay. J. Mar. Syst. 46: 47–68.
SERRET, P., E. FERNANDEZ, AND C. ROBINSON. 2002. Biogeographicdifferences in the net ecosystem metabolism of the openocean. Ecology 83: 3225–3234.
SIEGEL, D. A., D. J. MCGILLICUDDY, AND E. A. FIELDS. 1999.Mesoscale eddies, satellite altimetry, and new production inthe Sargasso Sea. J. Geophys. Res.-Oceans 104: 13359–13379.
STEINBERG, D. K., C. A. CARLSON, N. R. BATES, R. J. JOHNSON, A.F. MICHAELS, AND A. H. KNAP. 2001. Overview of the U.S.JGOFS Bermuda Atlantic Time-series Study (BATS): Adecade-scale look at ocean biology and biogeochemistry.Deep-Sea Res. Pt. II 48: 1405–1447.
SWEENEY, E. N., D. J. MCGILLICUDDY, AND K. O. BUESSELER. 2003.Biogeochemical impacts due to mesoscale eddy activity in theSargasso Sea as measured at the Bermuda Atlantic Time-series Study (BATS). Deep-Sea Res. Pt. II 50: 3017–3039.
TEIRA, E., M. J. PAZO, P. SERRET, AND E. FERNANDEZ. 2001.Dissolved organic carbon production by microbial popula-tions in the Atlantic Ocean. Limnol. Oceanogr. 46:1370–1377.
———, AND oTHERS. 2005. Variability of chlorophyll and primaryproduction in the eastern North Atlantic Subtropical Gyre:Potential factors affecting phytoplankton activity. Deep-SeaRes. Pt. I 52: 569–588.
WILLIAMS, P. J. L. 1981. Microbial contribution to overall marineplankton metabolism: Direct measurements of respiration.Oceanol. Acta 4: 359–364.
———. 1998. The balance of plankton respiration and photosyn-thesis in the open oceans. Nature 394: 55–57.
———, AND N. W. JENKINSON. 1982. A transportablemicroprocessor-controlled precise Winkler titration suitablefor field station and shipboard use. Limnol. Oceanogr. 27:576–584.
———, P. J. MORRIS, AND D. M. KARL. 2004. Net communityproduction and metabolic balance at the oligotrophic oceansite, station ALOHA. Deep-Sea Res. Pt. I 51: 1563–1578.
ZUBKOV, M. V., M. A. SLEIGH, P. H. BURKILL, AND R. J. G.LEAKEY. 2000. Bacterial growth and grazing loss in contrast-ing areas of North and South Atlantic. J. Plank. Res. 22:685–711.
Received: 18 November 2005Accepted: 13 June 2006Amended: 29 July 2006
Sargasso Sea metabolic balance 2689