
ภัยธรรมชาติ (Natural Disasters) · ภัยธรรมชาติ (Natural Disasters) . ดร. ภูีเว ประคยงํามินทร *

Moung Jin Lee
Korea Adaptation Center for Climate Change
Korea Environment Institute

2/24
Introduction Ⅰ
Ⅱ
Ⅲ
Outline
Method theory & Study area
Analysis of relation between natural disasters and precipitation
Ⅳ Results of analysis
Ⅴ Conclusion and Discussion

3/24
1. Background Ⅰ. Introduction
Climate Change in Korea
▲ Temperature Change of 6 Major Cities in Korea
Precipitation Outlook of Korea
1.7℃ Increase
Temperature rise of 6 major cities(Seoul, Busan,
Incheon, Daejeon, Daegu, Gwangju) in Korea:
+1.7℃/100 yrs(Global average: 0.74℃)
Temperature rise prediction
2050s: + 2℃(SRES A1B, Global average: 1.8℃ )
2050s: + 3.2℃(RCP 8.5, Global average: 2.3℃)
Precipitation rise of 6 major cities in Korea:
Rainfall rise prediction
2050s: +15% (SRES A1B, Global average: 3.0%)
2050s: +15.6% (RCP 8.5, Global average: 3.2℃ )
Temperature
Precipitation

4/24
1. Background Ⅰ. Introduction
Natural Disasters and Climate Change
▲ Number of Large-Scale Natural Disasters by Year
since 1950
Occurs due to natural phenomena and recognition a risk
that is beyond human control.
Natural disaster is associated with extreme Climate
Change
Intense heavy rainfall events will become even more
frequent in the future
Natural Disasters
Green: Meteorological (Typhoon and storm etc)
Yellow: Climate (Heat wave and forest fire etc)
Blue: Hydrological (Flood and landslide etc)
Red: Geophysical (Earthquake and volcano etc)
(KMA, 2010)
1980s 1990s 2000s 2011 year
Hydrological disasters: Over 80% increasing
Geophysical disasters NOT increasing
Natural disasters increasing: influence of climate change
▲ Number of Heavy Rain Occurred by hourly over
300mm by Year since 1980s in Korea
Hourly over 300mm: about Doubled

5/24
2. Research Questions Ⅰ. Introduction
What is scientific and quantitative correlation natural
disaster and precipitation in Korea?
What are the driving factors affecting natural
disaster loss?
Which is method to predict the future of scientific
and quantitative for natural disaster and adapt
appropriate policies?
Which is method to predict the future of scientific
and quantitative for natural disaster and adapt
appropriate policies?
What natural disaster mitigation technology have
been adopted at the local level?

6/24
4. Research Objectives Ⅰ. Introduction
Correlation Analysis of Precipitation and Natural Disasters
Literature Review, Natural Disasters Occurrence, Precipitation Arrangement
Predict Future Changes in Precipitation
Rainfall Probability, Analysis of a Future Climate Scenario
Detecting of Natural Disasters location
Aerial Photogrammetry, Optics and SAR Remote sensing
Geospatial Database Construction
Topography, Soil, Forest, Geology
Natural Disasters Vulnerability Analysis
Frequency Ratio, Logistic Regression, Neural Network
Climate Change Adaptation
With in Disaster Risk Management

7/24
1. Method theory Ⅱ. Method theory &
Study area
Existing researches on natural disaster and climate change individually conducted
Climate changes: 1)Rainfall probability & 2)Climate change scenario
1)Karl and Knight, 1998 and Sheng and Hashino, 2003
2)Ian A Nalder, 1998 and Craig D. Smith , 2009
GIS & Natural disaster 1)Probability Statistic & 2)Structural geology
1)Lee, S. et al., 2000-2009
2)Van Westen, C.J., 1996-2000
Natural disaster & Climate Changes : 1)Past climate events of landslide
1)Andrew Collison, 2000 and Matthias Jakob, 2009

8/24
1. Method theory Ⅱ. Method theory &
Study area
Climate Change Mapping of Probability Statistic
)(exp
)(exp
1)( 00 xxxx
xf
Rainfall probability:
Gumbel Distribution Function
Spatial statistical downscaling of climate
change scenario:
Co-Kriging & Temperature lapse rate
)(
1
* )()()()(un
aaa umuZumuZ
|) (| × m)Elevation(+T_i = T
April)-(October(1.74) × Ri =R 1000
Elvation
September)-(May(0.46) × Ri =R 1000
Elvation
Frequency ratio
)(
)(
)(
)(
)(
)(
)(
)(
1
1
1
1
1
1
DLP
DLP
LP
LP
DP
DP
LDP
LDP
A
A
A
A
A
A
Logistic regression
Neural Network
- Accumulative distribution function and a probability density
function
- Using average and standard deviation
- The types of linear between non-observed spots and adjacent
observed spots
- Inferred and reflected as inversely proportional to distance and
observed values.
- The posterior probability of an occurrence given the presence and
absence of the predictor pattern are denoted.
- The dependent variable has only two groups, logistic multiple
regression may be preferred over discriminant analysis.
- Categorical data may also be used.
- The back-propagation training algorithm is trained using a set of
examples of associated input and output values.

9/24
1. Method theory Ⅱ. Method theory &
Study area
Mapping of probability statistic method to MATLB is implemented
Frequency ratio
Fuzzy Operator
Bayesian
Neural Network

10/24
2. Study area Ⅱ. Method theory &
Study area
Landslide occurred on July 14, 2006
- Rainfall over 400mm
Deokjeok-ri : 694 landslide occurred
Karisan-ri : 470 landslide occurred
Calculate to
Dekjeok-ri’s correlation
and weight
Applying to
Dekjeok-ri’s correlation
and weight to Karisan-ri
Dekjeok-ri: Longitude 128 11’ 00 128 18’ 00 and Latitude 38 2’ 30 38 60’ 30
Karisan-ri: Longitude 128 17’ 30 128 24’ 50 and Latitude 38 1’ 50 38 61’ 10
Cross-validation

11/24
3. Spatial database Ⅱ. Method theory &
Study area
Classification Factors Data Type Scale
Natural disaster Landslide Point 1:5,000
Remote sensing
IRS
SPOT 5
QuckBrid
ALOS PALSAR
Grid
5m x 5m
1m x 1m
1m x 1m
10m x 10m
Exposure Precipitation 3-day accumulate(449mm) Point -
Sensitivity
Topographic Map
Slope
Aspect
Curvature
Grid 1:5,000
Geological Map Geology Polygon 1:5,000
Soil Map
Topography
Soil drainage
Soil material
Soil thickness
Soil texture
Polygon 1:25,000
Adaptive capacity Forest Map
Timber diameter
Timber type
Timber density
Timber age
Polygon 1:25,000
IRS SPOT 5 QuckBrid ALOS PALSAR ALOS PALSAR

12/24
2. Rainfall probability Ⅲ. Analysis of relation between natural disasters and precipitation
Calculation of rainfall probability of study area
Hourly weather data from KMA(1/1, 1973 and 12/31, 2006)
In study area maximum 3-day accumulate precipitation(449mm)
The future target years is 1, 3, 10, 50, and 100 years
Recurrence interval of rainfall probability (mm)
Future target year 3-Day
1year 163.5mm
3 year 199.5mm
10 year 290.0mm
50 year 400.9mm
100 year 447.7mm
447.7mm for the 100 target year, 3-day of consistence indicates 100 year frequency precipitation
of at least 447.7mm in 3-day.

13/24
3. Future climate change
scenarios Analysis of spatial statistical downscaling of climate change scenario
KMA-RCM Row Data Existing
3-day accumulation recurrence interval of parameters
Parameter Deokjeok-ri Karisan-ri
a b a b
1year 53.95 49.86 53.79 53.38
3year 58.51 51.38 53.78 58.40
10year 58.42 56.19 55.04 65.61
50year 57.18 60.86 52.46 68.84
100year 55.90 67.79 52.79 80.12
Ⅲ. Analysis of relation between natural disasters and precipitation
14/24
1. Natural Disasters
Vulnerability Ⅳ. Results of analysis
Class Frequency ratio
Aspect
Flat 0.00
North 0.60
Northeast 0.39
East 1.77
Southeast 1.83
South 0.99
Southwest 1.03
West 0.91
Northwest 0.77
Curvature
Concave 1.10
Flat 0.67
Convex 1.21
Slope
(degree)
0~5° 0.14
6~10° 0.07
11~15° 0.22
16~20° 0.34
21~25° 0.78
26~30° 1.04
31~35° 1.86
36~40° 1.48
41~90° 1.81
Geology Banded gneiss 1.06
Granite 0.03
Timber
diameter
Non forest area 0.14
Very small diameter 1.03
Small diameter 1.19
Medium diameter 1.17
Timber
density
Non forest area 0.75
Loose 1.33
Moderate 0.84
Dense 0.56
Timber
type
Non forest area 0.09
Mixed broad-leaf tree 0.45
Pine 1.37
Needle and broad 1.17
Artificial pine 1.39
Rigida pine 0.47
Korea nut pine 1.12
Artificial Larch 0.66
Larch 0.00
Artificial mixed broad-leaf 0.00
Poplat 2.18
Class Frequency ratio
Timber
age
Non forest area 0.14
1st age 1.03
2nd age 1.28
3rd age 1.14
4th age 1.25
5th age 0.07
Soil drainage
No Data 0.00
Well drained 0.42
Somewhat poorly dray 1.54
Moderately well dray 0.76
Soil thickness
(cm)
No Data 0.00
20 0.80
50 0.54
100 1.41
150 0.30
Soil material
No data 0.00
Valley alluvium 0.18
Gneiss residuum 0.62
Fluvial alluvium 0.00
Colluvium 1.37
Alluvial colluvium 0.63
Soil
texture
No data 0.00
Sandy loam 1.09
Rocky loam 0.21
Loam 0.00
Silt loam 0.00
Rocky sandy loam 0.28
Very rocky loam 0.48
Overflow area 0.00
Topography
Nodata 0.00
Valley area 0.33
Valley and alluvial 0.00
Plains 0.00
Piedmont slope area 1.07
Lower hilly area an 0.43
Fluvial plains 0.00
Alluvial fan 0.26
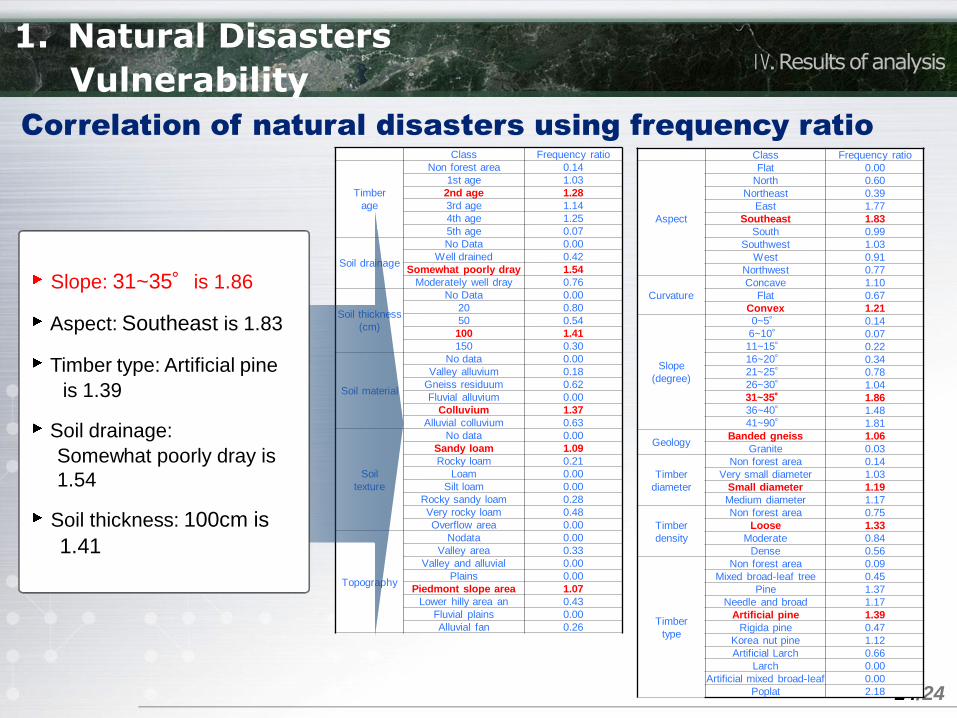
Slope: 31~35°is 1.86
Aspect: Southeast is 1.83
Timber type: Artificial pine
is 1.39
Soil drainage:
Somewhat poorly dray is
1.54
Soil thickness: 100cm is
1.41
Correlation of natural disasters using frequency ratio

15/24
1. Natural Disasters
Vulnerability Ⅳ. Results of analysis
Correlation of natural disasters using neural network
Target year 1 2 3 4 5 6 7 8 9 10 Average S.D. N.W.*
Aspect 0.0655 0.0736 0.0599 0.0701 0.0674 0.0869 0.0560 0.0781 0.0882 0.0796 0.0725 0.0108 1.0000
Curvature 0.0773 0.0711 0.0802 0.0745 0.0710 0.0692 0.0741 0.0694 0.0688 0.0753 0.0731 0.0038 1.0077
Slope 0.0884 0.0824 0.0890 0.0873 0.0823 0.0818 0.0984 0.0810 0.0946 0.0885 0.0874 0.0058 1.2046
Geology 0.0829 0.0655 0.0699 0.0677 0.0741 0.0750 0.0720 0.1031 0.0819 0.0762 0.0768 0.0108 1.0593
Timber diameter 0.0820 0.0850 0.0737 0.0555 0.0682 0.0760 0.0899 0.0743 0.0763 0.0687 0.0750 0.0097 1.0335
Timber density 0.0746 0.1028 0.0846 0.0844 0.0902 0.0594 0.0697 0.0815 0.0559 0.0909 0.0794 0.0146 1.0947
Timber type 0.0545 0.0886 0.0804 0.0861 0.0846 0.0603 0.0668 0.0730 0.0826 0.0565 0.0733 0.0130 1.0112
Timber age 0.0807 0.0724 0.0738 0.0693 0.0784 0.0781 0.0571 0.0816 0.0616 0.0880 0.0741 0.0094 1.0216
Soil drainage 0.0783 0.0736 0.0928 0.0797 0.0868 0.0941 0.0826 0.0863 0.0849 0.0775 0.0837 0.0066 1.1535
Soil thickness 0.0735 0.0657 0.0744 0.0720 0.0730 0.0744 0.0809 0.0715 0.0713 0.0708 0.0728 0.0038 1.0030
Soil material 0.0885 0.0735 0.0879 0.0905 0.0802 0.0812 0.0871 0.0718 0.0694 0.0740 0.0804 0.0078 1.1086
Topography 0.0735 0.0777 0.0667 0.0774 0.0732 0.0770 0.0792 0.0571 0.0810 0.0660 0.0729 0.0075 1.0048
Slope(1.2046), Soil drainage(1.1535) is highest,
Soil thickness(1.0030), Aspect (1.0000) is lowest

16/24
1. Natural disasters
Vulnerability Ⅳ. Results of analysis
),(
),(*,
jib
TijiaePPH sji
PH is the probability of vulnerability
Ti the threshold (3-day: 449mm)
A and B are other parameters
Origin Deokjeokri & cross-validation to Karisanri
Application of threshold 3-day accumulative rainfall(449mm)
Future target year (1, 3, 10, 50, and 100 years)
Vulnerability model integration

17/24
1. Natural disasters
Vulnerability Ⅳ. Results of analysis
Without climate change Target 100 year
Future target year Low (1~57%) Medium (58~75%) High (76~87%) Very High(88~100%)
Without climate change 16.21 43.29 27.46 13.02
1 9.88 29.19 47.70 13.22
3 9.29 24.15 49.82 16.72
10 8.48 20.46 49.80 21.24
50 7.89 16.62 49.68 25.79
100 7.14 13.55 49.48 29.81

18/24
1. Natural disasters
Vulnerability Ⅳ. Results of analysis
Without climate change Target 100 year
Future target year Low (1~57%) Medium (58~75%) High (76~87%) Very High(88~100%)
Without climate change 31.60 59.89 21.47 5.45
1 10.28 80.89 21.59 5.49
3 8.26 78.12 23.80 8.08
10 6.59 74.38 26.61 10.67
50 5.36 68.18 31.34 13.37
100 4.58 62.29 34.48 16.90

19/24
1. Natural disasters
Vulnerability Ⅳ. Results of analysis
Very high Future target 100 year
Damaged Infrastructure 40%
Ecological zoning
map
1 grade 35%
2 grade 20%
3 grade 15%

20/24
1. Conclusion and Discussion Ⅴ. Conclusion and Discussion
Objective 1: What is scientific and quantitative
correlation natural disaster and precipitation in Korea?
- By Rainfall probability and climate change scenario, intensive
heavy rainfall will be increased
- 3-day accumulate precipitation affects natural disaster
occurrence more than the 1-day precipitation relation between
precipitation and natural disaster at 2000s
Objective 2.1: What are the driving factors affecting
natural disaster loss?
- Use of the frequency ratio, logistic regression, and neural
network determined the correlations among the natural
disaster-related factors and weights

21/24
Ⅴ. Conclusion and Discussion
Objective 2.2: What are the driving factors affecting
natural disaster loss?
- The most important facter contributing to natural disasters
occurrence is slope
- Timber diameter: Very small diameter(1.03) is the lowest
importance.
Objective 3: What natural disaster mitigation technology
have been adopted at the local level?
- Analysis of natural disaster can be easily and conveniently
conducted by RS&GIS
- Spatial statistical analysis be possible to calculate weights
reflecting the types of natural disaster and the characteristics
of different areas.
- Correlation and weights are cross-validated to different areas
to prepare vulnerability.
1. Conclusion and Discussion

22/24
Ⅴ. Conclusion and Discussion
Objective 4: Which is method to predict the future of
scientific and quantitative for natural disaster and
adapt appropriate policies?
- There are cause of extreme event for assessment and
management the vulnerability analysis to a disaster risk
factors.
- Temporal: Current event or Continuous future event
- There have same base on scientific and quantitative local risk
management
- The climate change adaptation is expanding disaster risk
management Characteristics Natural disaster risk management Climate change adaptation
Hazard
characteristics
Temporal Current event Continuous future event
Dynamics Stationary Non-stationary
Spatial scope Regional Global but heterogeneous
Uncertainty Low to medium Medium to very high
Systems of concern Social systems and built infrastructure All systems
System view Static Dynamic and adaptive
Targets for risk reduction Exposure to hazards and internal Vulnerability Magnitude of hazards and internal Vulnerability
1. Conclusion and Discussion

Thank you for Your Attention.
Lee, Moung Jin Ph.D.
Korea Adaptation Center for Climate Change
Korea Environment Institute