Mott Community College Employee Open Forum May 9, 2011 College Finances.
54
Mott Community College Employee Open Forum May 9, 2011 College Finances
-
Upload
kelley-stevens -
Category
Documents
-
view
218 -
download
2
Transcript of Mott Community College Employee Open Forum May 9, 2011 College Finances.

Mott Community College
Employee Open ForumMay 9, 2011
College Finances

2
STRATEGIC PLAN• 7-0. Budget/Finance
• 7-1. Focus on controllable revenues and costs to sustain our current reputation and facilities and provide funding for strategic priorities
• 7-2. Establish short and long-term budget and finance priorities that provide a balanced approach to the needs of a learning organization with the flexibility to realign resources
• 7-3. Implement a comprehensive strategy to address the long-term deficit which enables us to continue to provide affordable high quality education
• A balanced approach
_____________________________________________________________________

PRIOR YEAR BUDGET IMPACT
3

Prior year Impact in Dollars
Series1$0
$1,000,000
$2,000,000
$3,000,000
$4,000,000
$5,000,000
$6,000,000
$2,585,000
$1,400,000
$871,353
$552,155
$464,851
Lost Property Taxes Debt ContributionHealth Insurance Increase MPSERS IncreaseLost State Aid 4
$5,873,359
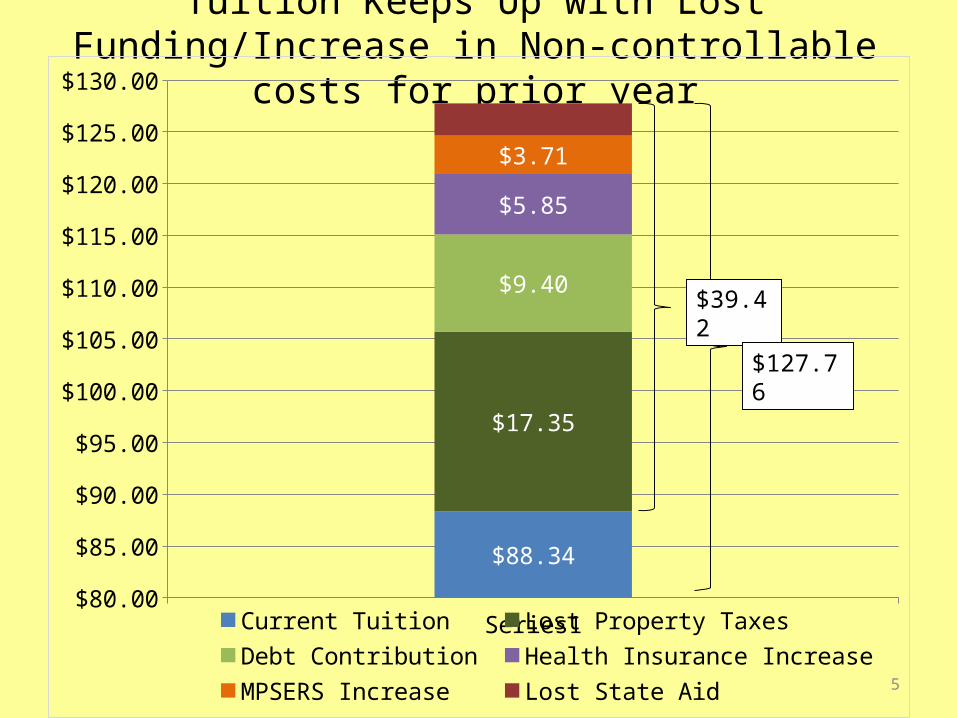
Tuition Keeps Up with Lost Funding/Increase in Non-controllable costs for prior year
Series1$80.00
$85.00
$90.00
$95.00
$100.00
$105.00
$110.00
$115.00
$120.00
$125.00
$130.00
$88.34
$17.35
$9.40
$5.85
$3.71
Current Tuition Lost Property Taxes Debt Contribution
Health Insurance Increase MPSERS Increase Lost State Aid 5
$39.42
$127.76

Prior Year Budget Balancing Steps
6
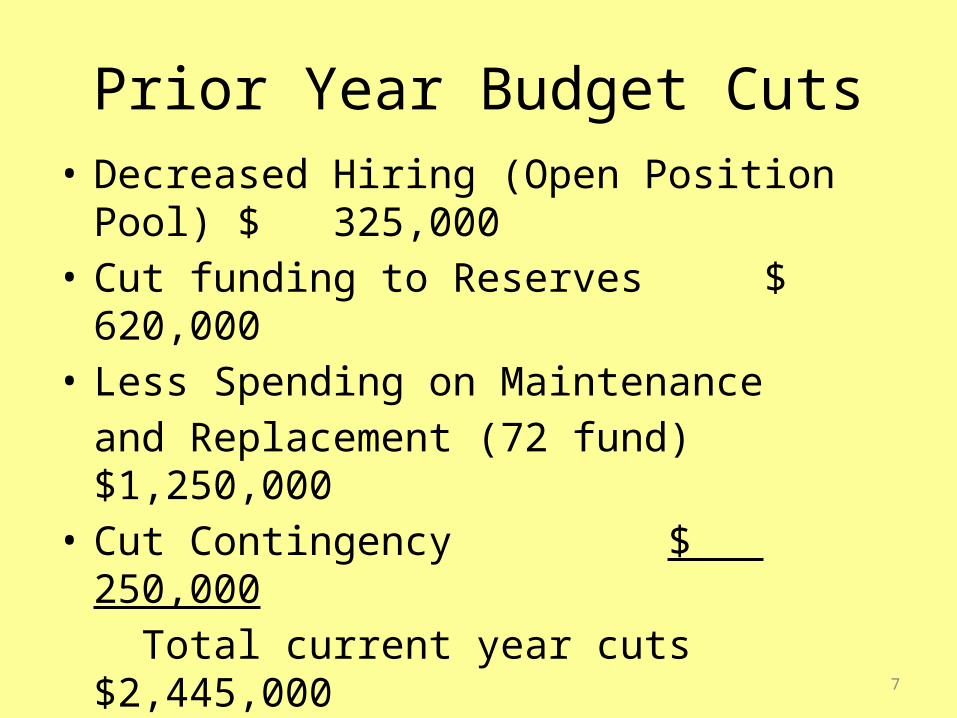
Prior Year Budget Cuts• Decreased Hiring (Open Position Pool) $ 325,000• Cut funding to Reserves $ 620,000• Less Spending on Maintenance
and Replacement (72 fund) $1,250,000• Cut Contingency $ 250,000
Total current year cuts $2,445,000Set-aside cuts from last year $1,400,000Total budgetary expenditure cuts $3,845,000
7

Prior Year Budget Cuts (continued)
Total Budgetary Expenditure Cuts (from previous slide) $3,845,000
Current Year Shortfall ($5,900,000)
Shortfall Remaining ($2,055,000)
65% of current year shortfall is made up through budget cuts.
8
FUNDING SOURCES(2011-2012)
State Aid
Property Taxes-Operating
-Debt
Tuition9

Trends in Funding Sources & Enrollment
1999
-200
020
00-2
001
2001
-200
220
02-2
003
2003
-200
420
04-2
005
2005
-200
620
06-2
007
2007
-200
820
08-2
009
2009
-201
020
10-2
011
$3,500,000
$8,500,000
$13,500,000
$18,500,000
$23,500,000
$28,500,000
$33,500,000
0
5,000
10,000
15,000
20,000
25,000
30,000
35,000
40,000
State Aid Property Taxes Headcount
Fund
ing
10
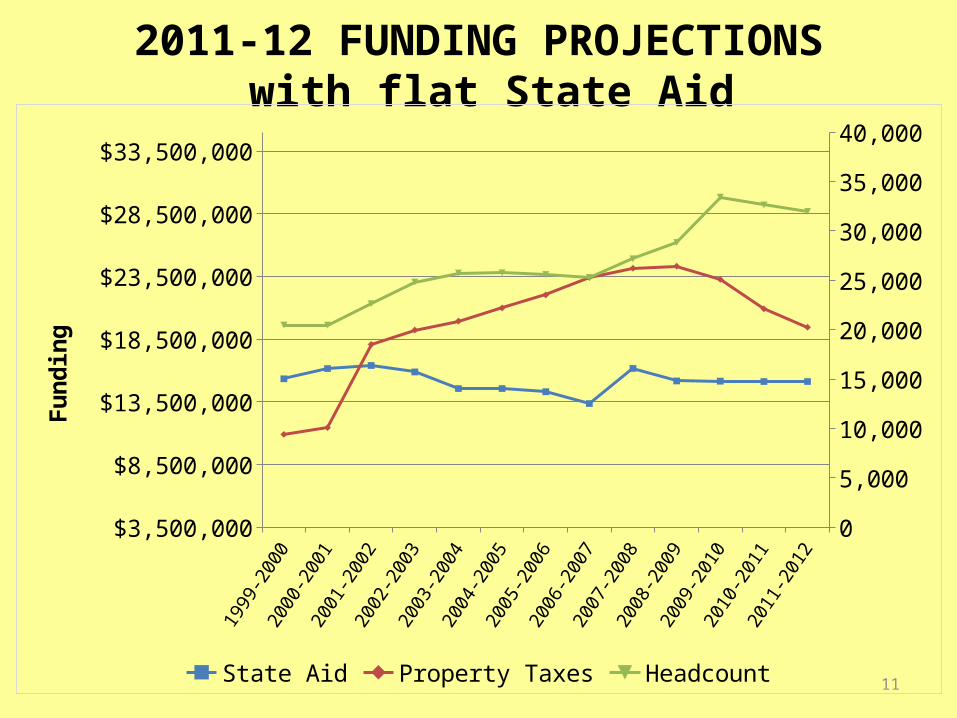
2011-12 FUNDING PROJECTIONS with flat State Aid
1999
-200
020
00-2
001
2001
-200
220
02-2
003
2003
-200
420
04-2
005
2005
-200
620
06-2
007
2007
-200
820
08-2
009
2009
-201
020
10-2
011
2011
-201
2
$3,500,000
$8,500,000
$13,500,000
$18,500,000
$23,500,000
$28,500,000
$33,500,000
0
5,000
10,000
15,000
20,000
25,000
30,000
35,000
40,000
State Aid Property Taxes Headcount
Fund
ing
11

2011-12 FUNDING PROJECTIONS with 3.5% Decrease in State Aid
1999
-200
020
00-2
001
2001
-200
220
02-2
003
2003
-200
420
04-2
005
2005
-200
620
06-2
007
2007
-200
820
08-2
009
2009
-201
020
10-2
011
2011
-201
2
$3,500,000
$8,500,000
$13,500,000
$18,500,000
$23,500,000
$28,500,000
$33,500,000
0
5,000
10,000
15,000
20,000
25,000
30,000
35,000
40,000
State Aid Property Taxes Headcount
Fund
ing
12
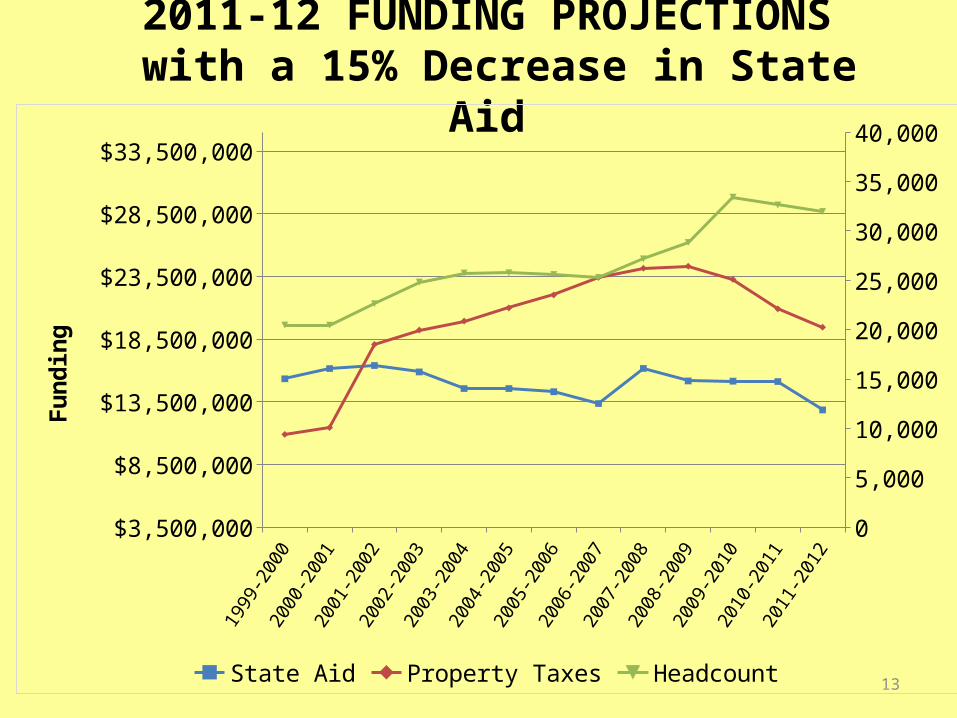
2011-12 FUNDING PROJECTIONS with a 15% Decrease in State Aid
1999
-200
020
00-2
001
2001
-200
220
02-2
003
2003
-200
420
04-2
005
2005
-200
620
06-2
007
2007
-200
820
08-2
009
2009
-201
020
10-2
011
2011
-201
2
$3,500,000
$8,500,000
$13,500,000
$18,500,000
$23,500,000
$28,500,000
$33,500,000
0
5,000
10,000
15,000
20,000
25,000
30,000
35,000
40,000
State Aid Property Taxes Headcount
Fund
ing
13

THEN and NOWTuition32%
Taxes
26%
State Aid36%
Other6%
1999-2000 Tu-ition
48%
Taxes28%State Aid
20%
Other
4%
2010-2011
14
State Aid Funding
$15,344,107State Aid Funding
$15,121,880

THEN and NOWProjected 2011-2012 with flat
State aidTuition32%
Taxes
26%
State Aid36%
Other6%
1999-2000 Tu-ition
49%
Taxes27%State Aid
21%
Other
4%
2011-2012
15
State Aid Funding
$15,344,107State Aid Funding
$15,121,880

THEN and NOWProjected 2011-2012 with -
3.5%State aidTuition32%
Taxes
26%
State Aid36%
Other6%
1999-2000Tu-ition
49%
Taxes27%State Aid
20%
Other
4%
2011-2012
16
State Aid Funding
$15,344,107State Aid Funding
$14,592,614

THEN and NOWProjected 2011-2012 with -
15%State aidTuition32%
Taxes
26%
State Aid36%
Other6%
1999-2000Tu-ition
50%
Taxes27%
State Aid18%
Other
4%
2011-2012
17
State Aid Funding
$15,344,107State Aid Funding
$12,853,598
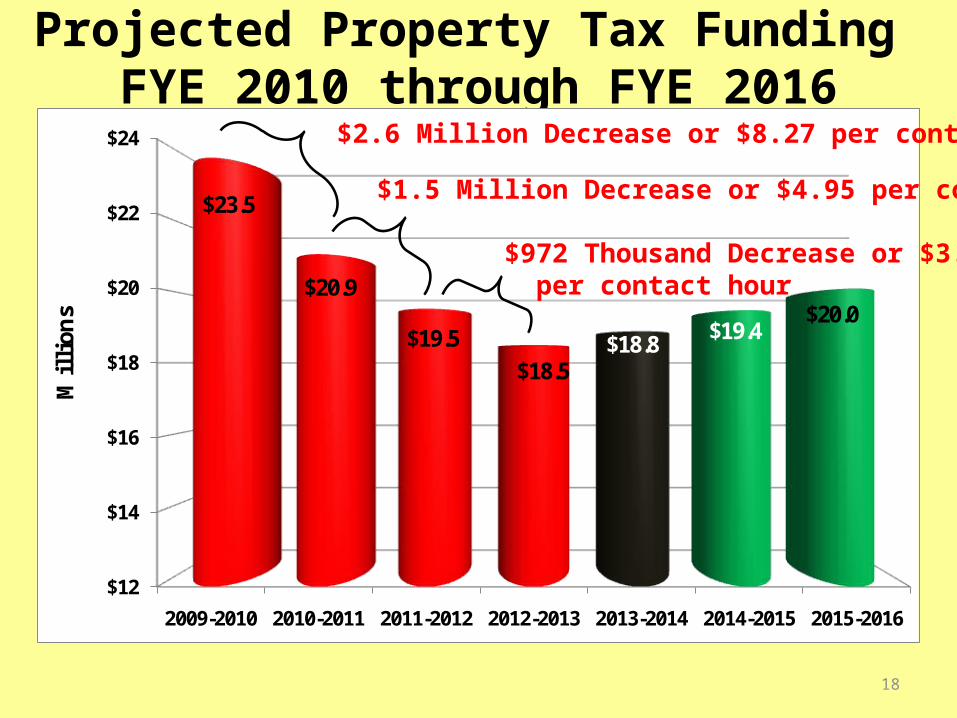
Projected Property Tax Funding FYE 2010 through FYE 2016
$12
$14
$16
$18
$20
$22
$24
2009-2010 2010-2011 2011-2012 2012-2013 2013-2014 2014-2015 2015-2016
$23.5
$20.9
$19.5$18.5
$18.8 $19.4$20.0
Million
s
18
$2.6 Million Decrease or $8.27 per contact hour
$1.5 Million Decrease or $4.95 per contact hour
$972 Thousand Decrease or $3.33 per contact hour
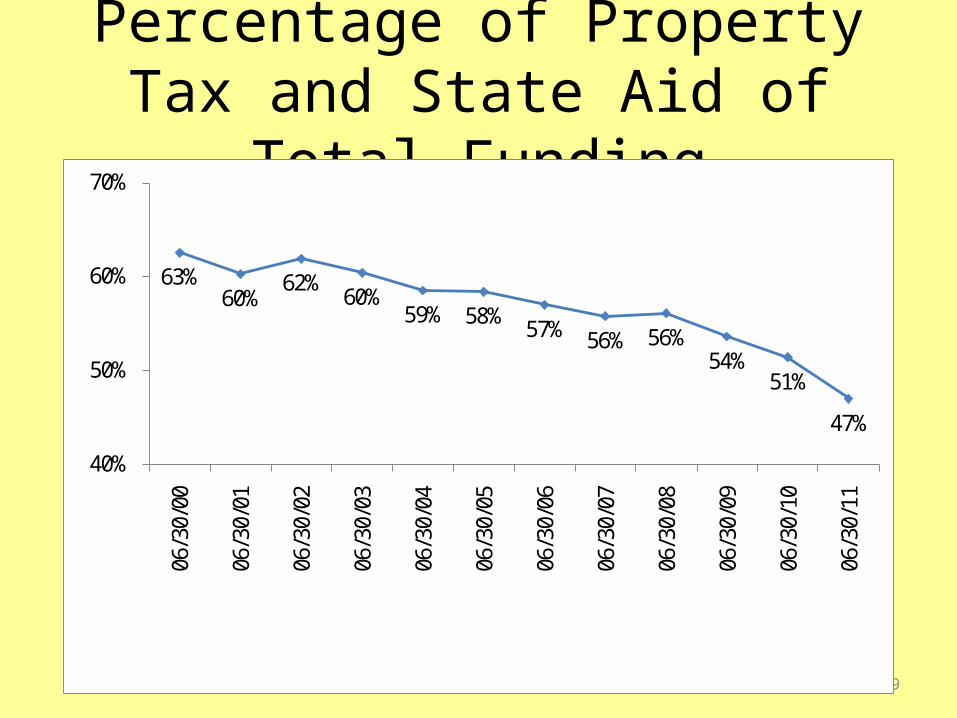
Percentage of Property Tax and State Aid of Total Funding
19
63%60%
62%60%
59% 58% 57% 56% 56%54%
51%
47%
40%
50%
60%
70%06
/30/
00
06/3
0/01
06/3
0/02
06/3
0/03
06/3
0/04
06/3
0/05
06/3
0/06
06/3
0/07
06/3
0/08
06/3
0/09
06/3
0/10
06/3
0/11

Percentage of Property Tax and State Aid of Total Funding projected for 2011-2012 with flat State aid
20
63%60%
62%60%
59% 58% 57% 56% 56%54%
51%
47% 47%
40%
50%
60%
70%06
/30/
00
06/3
0/01
06/3
0/02
06/3
0/03
06/3
0/04
06/3
0/05
06/3
0/06
06/3
0/07
06/3
0/08
06/3
0/09
06/3
0/10
06/3
0/11
06/3
0/12

Percentage of Property Tax and State Aid of Total Funding projected for 2011-2012 with -3.5% State aid
21
63%60%
62%60%
59% 58% 57% 56% 56%54%
51%
47% 47%
40%
50%
60%
70%06
/30/
00
06/3
0/01
06/3
0/02
06/3
0/03
06/3
0/04
06/3
0/05
06/3
0/06
06/3
0/07
06/3
0/08
06/3
0/09
06/3
0/10
06/3
0/11
06/3
0/12

Percentage of Property Tax and State Aid of Total Funding projected for 2011-2012 with -15% State aid
22
63%60%
62%60%
59% 58% 57% 56% 56%54%
51%
47%45%
40%
50%
60%
70%06
/30/
00
06/3
0/01
06/3
0/02
06/3
0/03
06/3
0/04
06/3
0/05
06/3
0/06
06/3
0/07
06/3
0/08
06/3
0/09
06/3
0/10
06/3
0/11
06/3
0/12

What’s Happening with Property Taxes?(Operating)
2009-2010
2010-2011
2011-2012
2012-2013
2013-2014
2014-2015
2015-2016
15,000,000
17,000,000
19,000,000
21,000,000
23,000,000
25,000,000
27,000,000
29,000,000
31,000,000
33,000,000
35,000,000 Historical Average Increase 7 Year Forecast
23
Total lost operating property tax funding over 7 year period is $60.2 million. The average per year is $8.6 million.
$32.2M
$20.0M
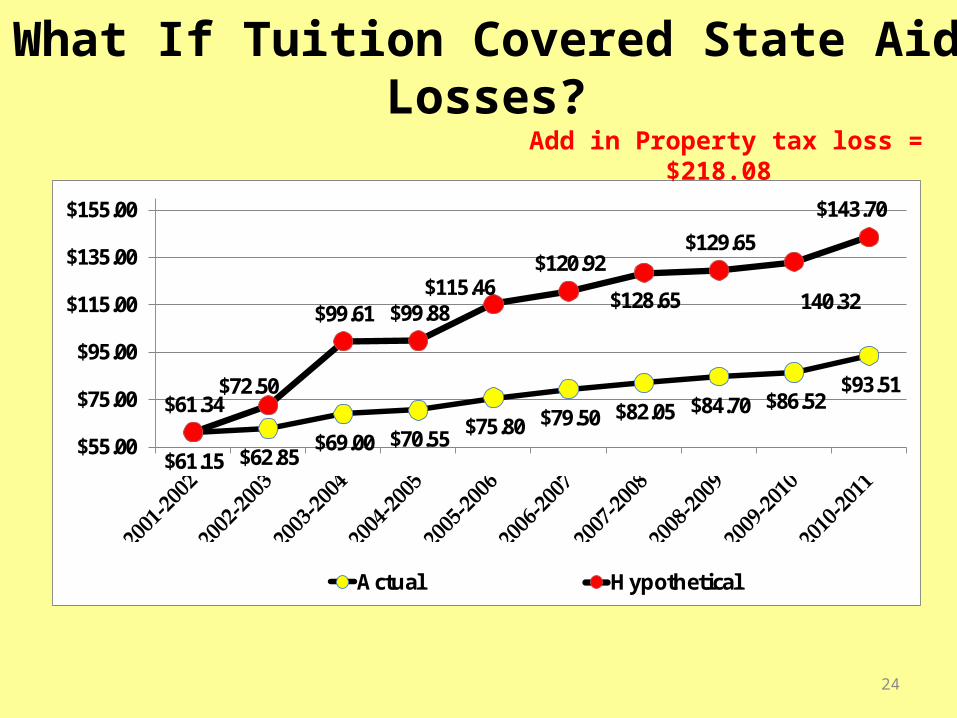
What If Tuition Covered State Aid Losses?
$61.15 $62.85$69.00 $70.55 $75.80 $79.50 $82.05 $84.70 $86.52
$93.51$61.34
$72.50
$99.61 $99.88$115.46
$120.92
$128.65
$129.65
140.32
$143.70
$55.00
$75.00
$95.00
$115.00
$135.00
$155.00
Actual Hypothetical
24
Add in Property tax loss = $218.08

What’s Happening with Property Taxes?(Bonds)
2009-2010
2010-2011
2011-2012
2012-2013
2013-2014
2014-2015
2015-2016
6,000,000
6,500,000
7,000,000
7,500,000
8,000,000
8,500,000
9,000,000
9,500,000
10,000,000
10,500,000
11,000,000
Historical Average Increase 7 Year Forecast
25
Total lost bond tax funding over 7 year period is $15.8 million. The average per year is $2.3 million.
$10.4M
$7.0M

Bond Funds1. County and City Taxable Values will decline by 7% for
2011-20122. The Financial Impact (Shortfall) to the Bond Funds will be
$ 850,000 in 11/12.3. We are legally required to levy a millage rate that will be
sufficient to collect enough dollars to make the current year required payments
-OR- Have enough funds available from other sources to cover any shortfall from a lower millage rate.
4. Commitment made to voters in 2004 to keep millage at .69 through 2011. (GF contribution $1.4 million last year) 26

What Have We Done Regarding Controlling/Cutting Costs?
27

Past Expenditure Reductions1) Energy Conservation Project
- Utility costs averaged 8.2% in 2003, Now they are 2.4%• Savings $520K
2) Hold on vacant positions• Average savings of $800K per year
3) Change in timing of custodial shift• Savings of approximately $170K per year
4) Eliminating and restructuring food service• Was losing approximately $100K per year• Now generating $48K per year in revenues
28

Past Expenditure Reductions5) Utility Reduction Analyst Project
• Resulted in $720K savings between 2004-2010 on Telecommunications/IT, Water, and Waste
6) Employee Contract Bargaining• Employees agreed to pay freezes with incremental
increases over 9 years at 1.35%• Industry average is 2.8%
– Savings of $460K per year
7) Course Section Efficiency• Maximizing section seat count before adding new
sections
8) Discretionary budget cuts• Average savings of $400K per year
29

Past Expenditure Reductions9) Reduction of ORP (optional retirement plan) costs
• Average annual savings of $400K
10) Combining Deans position• Fine Arts and Social Science combined saving $168K per
year
12) Outsourcing custodial and grounds work at sites• Savings of approx. $350K per year
13) Changes to health insurance coverage and plans • Savings $500K
14) New print shop lease• Savings of $200,000 per year
30
A Comparisonto
7 Other MichiganPeer Community Colleges
Based on 2009 –2010 ACS Data
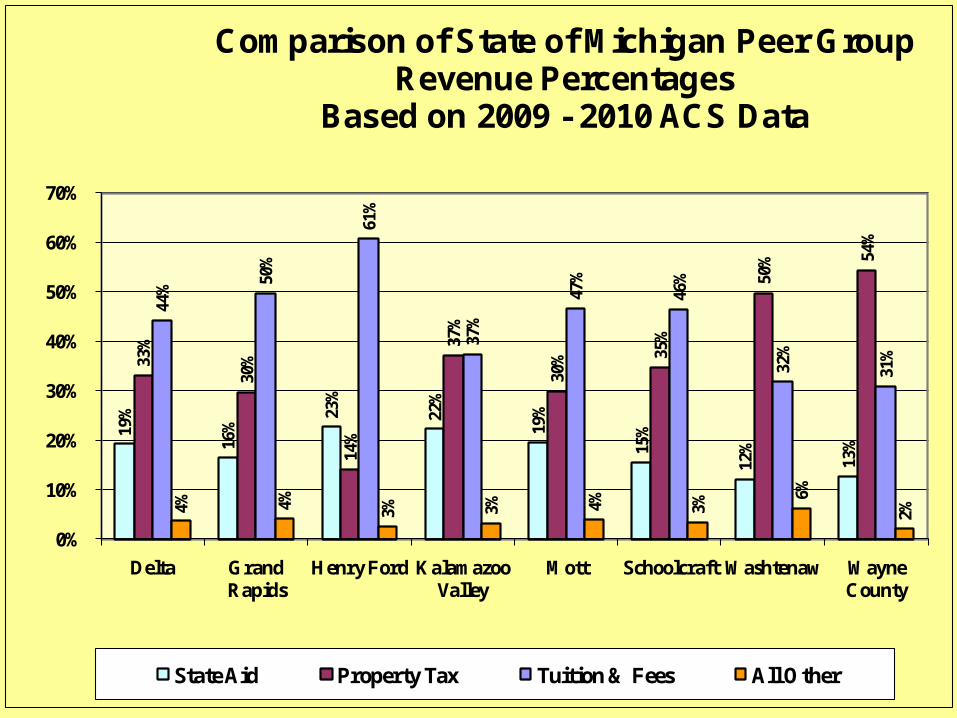
19%
16%
23%
22%
19%
15%
12%
13%
33%
30%
14%
37%
30% 35
%
50% 54
%
44%
50%
61%
37%
47%
46%
32%
31%
4% 4% 3% 3% 4% 3%
6%
2%
0%
10%
20%
30%
40%
50%
60%
70%
Delta Grand Rapids
Henry Ford Kalamazoo Valley
Mott Schoolcraft Washtenaw Wayne County
Comparison of State of Michigan Peer Group Revenue Percentages
Based on 2009 - 2010 ACS Data
State Aid Property Tax Tuition & Fees All Other

MCC is 3rd Lowest in Millage Rate, and has the Largest Property Tax Decline
1.79 1.80 1.99 2.04 2.41 2.483.00 3.41
-3.76
-8.64
-10.98
-1.64
-3.14 -8.64 -8.64
-5.33
-12.00
-10.00
-8.00
-6.00
-4.00
-2.00
0.00
2.00
4.00
6.00G
rand
Rap
ids
Scho
olcr
aft
Mott
Del
ta
Kala
maz
oo V
alle
y
Way
ne C
ount
y
Hen
ry F
ord
Was
hten
aw
Prior Year Comparison of Millage Rates/Property Tax Declines with
State Grouping

34
0
5,000,000
10,000,000
15,000,000
20,000,000
25,000,000
Current Year Comparison of State Aid

MCC is 3rd Lowest in Property Tax Revenue
010,000,00020,000,00030,000,00040,000,00050,000,00060,000,00070,000,00080,000,000
Current Year Comparison of State of Michigan Peer Group Property Tax
Revenue

MCC is 4th lowest in Total Revenue
0
20,000,000
40,000,000
60,000,000
80,000,000
100,000,000
120,000,000
140,000,000
Current Year Comparison of State Peer Group Total Revenue

Tuition & Fees: Local ComparisonCollege Yearly Tuition & Fees
Mott CC 3,329 Saginaw Valley University 7,308 Eastern Michigan University 8,377Oakland University 9,285 Baker College - Flint 9,840 Ferris State University 9,930 University of Michigan - Flint 10,097 Central Michigan University 10,380 Michigan State University 11,722Davenport University 11,814University of Michigan - Ann Arbor 13,461 ITT Technical of Flint 25,064Kettering University 29,116
Cost as based on in district/state rates from the College’s web sites
MCC’s annual cost is approximately 46% of that of the next most affordable college/university in our
area.37
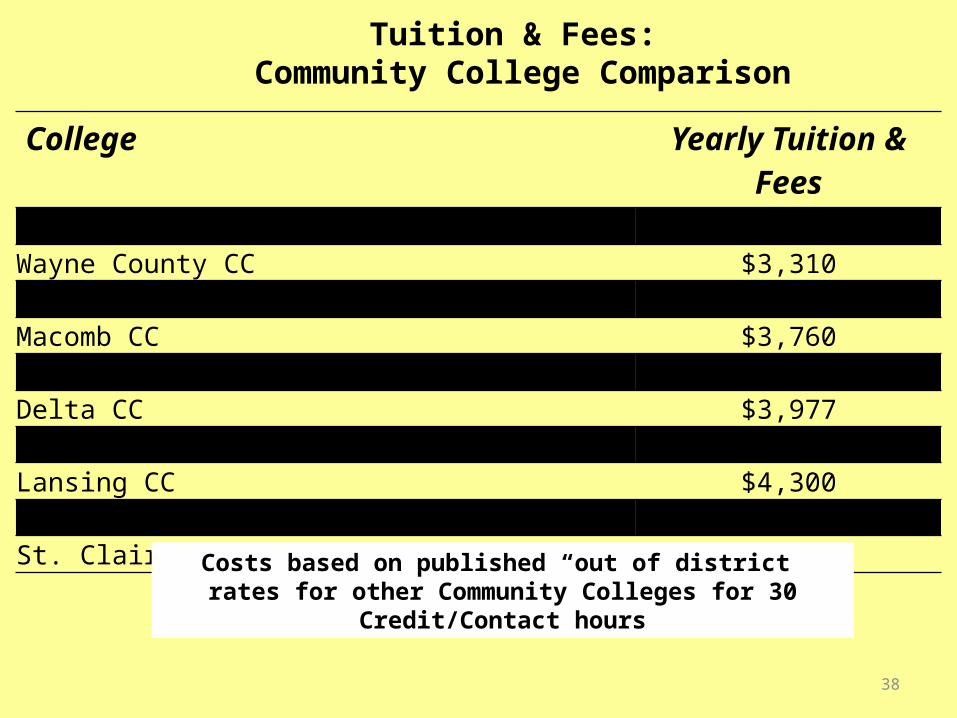
Tuition & Fees: Community College
ComparisonCollege Yearly Tuition & Fees
Mott CC (In-District) $3,229Wayne County CC $3,310Oakland CC $3,457Macomb CC $3,760Schoolcraft CC $3,910Delta CC $3,977Washtenaw CC $4,140Lansing CC $4,300Henry Ford CC $4,402St. Clair CC $5,663
Costs based on published “out of district” rates for other Community Colleges for 30
Credit/Contact hours
38
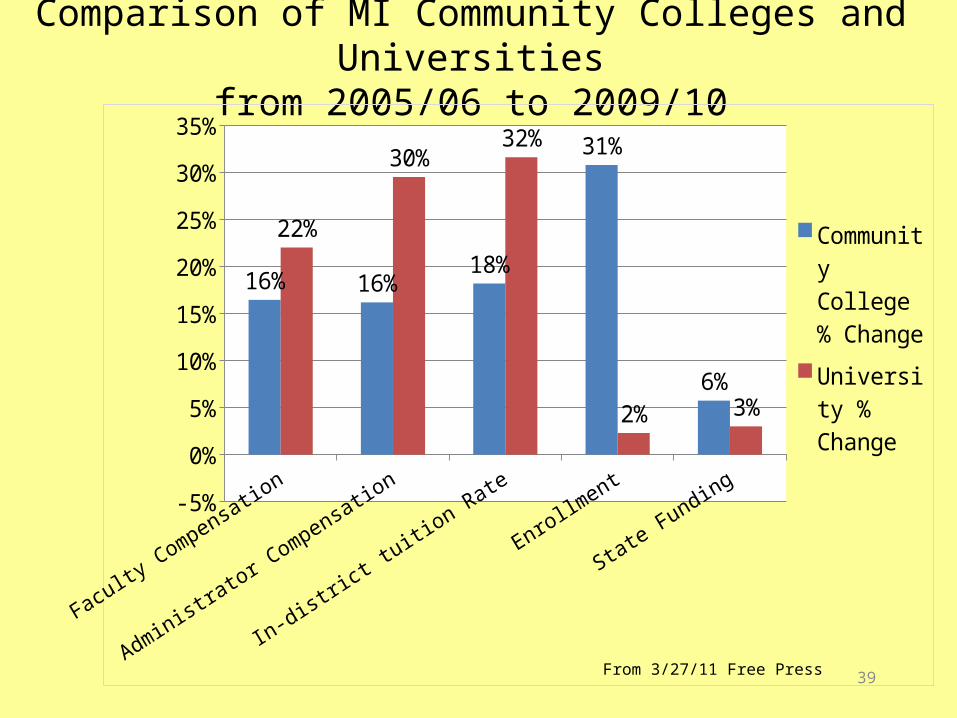
Comparison of MI Community Colleges and Universitiesfrom 2005/06 to 2009/10
Faculty Compensation
Administrator Compensation
In-district tu
ition Rate
Enrollment
State Funding-5%
0%
5%
10%
15%
20%
25%
30%
35%
16% 16%18%
31%
6%
22%
30%32%
2% 3%
Community College % Change
University % Change
39From 3/27/11 Free Press

CURRENT YEAR BUDGET IMPACT
40

FYE 2012 Impact in Dollars
Series1$0
$1,000,000
$2,000,000
$3,000,000
$4,000,000
$5,000,000
$6,000,000
$7,000,000
$8,000,000
$9,000,000
$3,000,000
$1,500,000
$900,000
$850,000
$750,000
$675,000$453,656
Capital Funding Restoration Lost Property TaxesHealth Insurance Increase Debt ContributionContingency Restoration MPSERS IncreaseLost State Aid
41
$8,128,658

Tuition Keeps Up with Lost Funding/Increase in Non-controllable costs for FYE 2012
Series1$80$85$90$95
$100$105$110$115$120$125$130$135$140$145$150$155$160
$98.68
$20.94
$10.47
$6.28
$5.93
$4.71$3.17
Current Tuition Capital Funding RestorationLost Property Taxes Health Insurance IncreaseDebt Contribution2 Contingency RestorationMPSERS Increase Lost State Aid
42
$56.73
$155.41
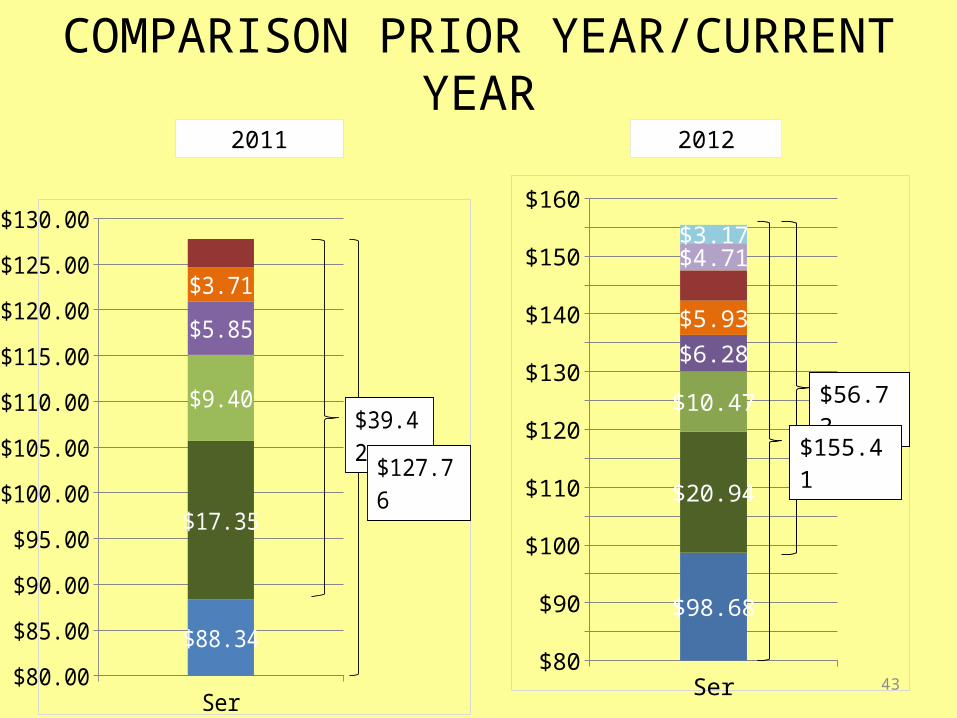
COMPARISON PRIOR YEAR/CURRENT YEAR
43Series1$80$85$90$95
$100$105$110$115$120$125$130$135$140$145$150$155$160
$98.68
$20.94
$10.47
$6.28 $5.93
$4.71$3.17
$56.73
$155.41
Series1$80.00
$85.00
$90.00
$95.00
$100.00
$105.00
$110.00
$115.00
$120.00
$125.00
$130.00
$88.34
$17.35
$9.40
$5.85
$3.71
$39.42
$127.76
2011 2012
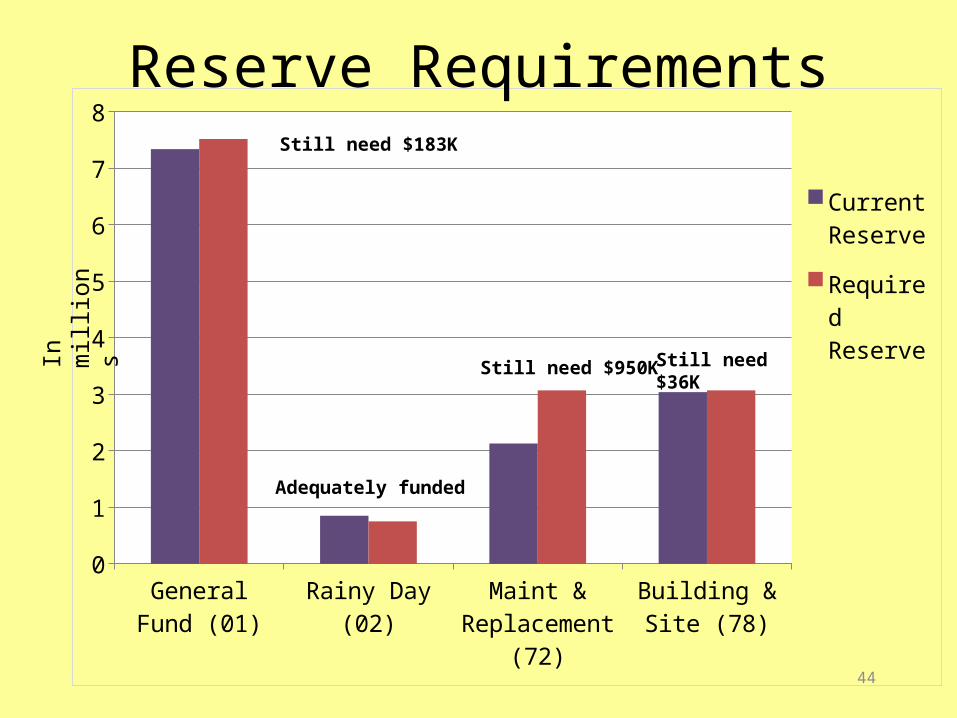
0
1
2
3
4
5
6
7
8
Current Reserve
Required Reserve
Reserve Requirements
44
In m
illio
ns
Still need $183K
Still need $950K Still need $36K
Adequately funded

FEDERAL FINANCIAL ASSISTANCEPELL GRANTS
45

-
5
10
15
20
25
30
2001 2002 2003 2004 2005 2006 2007 2008 2009 2010 2011
Mill
ions
Academic Year
Pell Awards
Increased Five-Fold in Ten Years
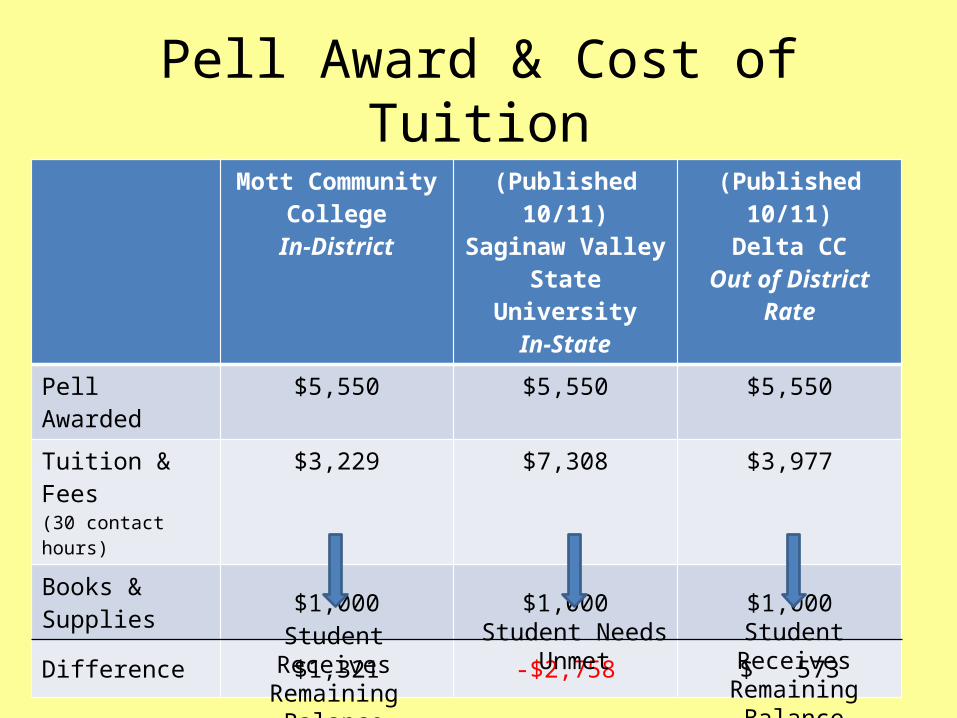
Pell Award & Cost of TuitionMott Community
CollegeIn-District
(Published 10/11)Saginaw ValleyState University
In-State
(Published 10/11)Delta CC
Out of District Rate
Pell Awarded $5,550 $5,550 $5,550
Tuition & Fees(30 contact hours)
$3,229 $7,308 $3,977
Books & Supplies $1,000 $1,000 $1,000
Difference $1,321 -$2,758 $ 573
Student Receives Remaining
Balance
Student Needs Unmet
Student Receives Remaining
Balance

Pell Distribution – 09/10
Awarded Educational Tuition & Fees
EducationalBooks & Supplies
Charges
Non-Educational
Govt. Refund
$24,787,898 $14,787,184 $2,896,345 $7,104,367
Sample of Approx. 8,000 Students

STATE INFLUENCES
49
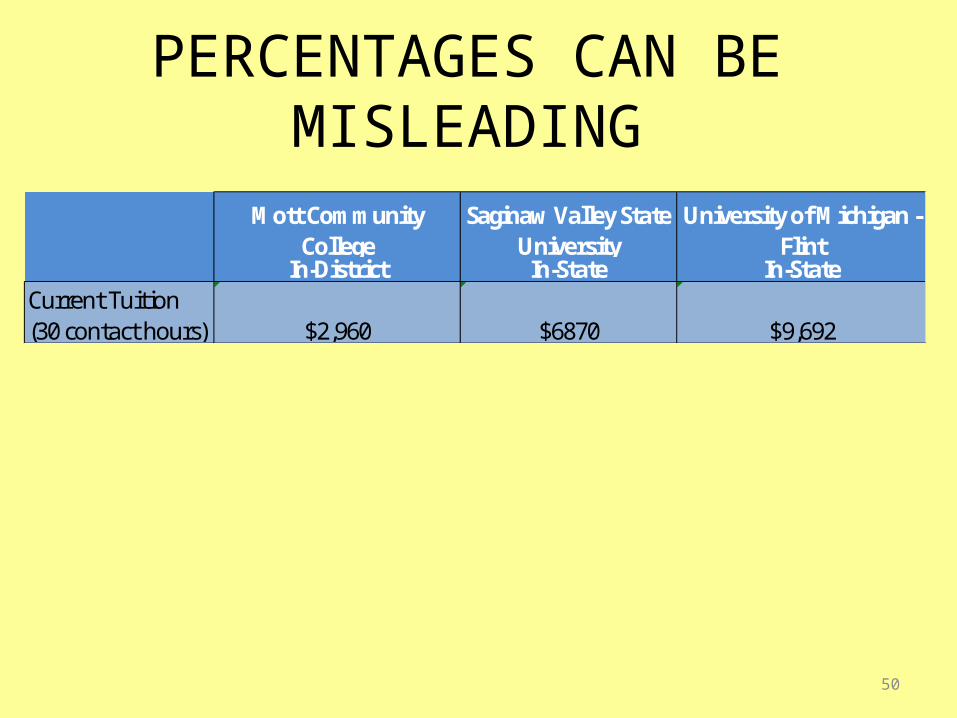
PERCENTAGES CAN BE MISLEADING
50
Current Tuition (30 contact hours) $2,960 $6870 $9,692
Mott Community College
Saginaw Valley State University
University of Michigan - Flint
In-District In-State In-State

PERCENTAGES CAN BE MISLEADING
51
Current Tuition (30 contact hours)
Tuition Change
Contact Hour
ChangeTuition Change
Contact Hour
ChangeTuition Change
Contact Hour
Change5% increase 148 5 344 11 485 16
$2,960 $6870 $9,692
Mott Community College
Saginaw Valley State University
University of Michigan - Flint
In-District In-State In-State
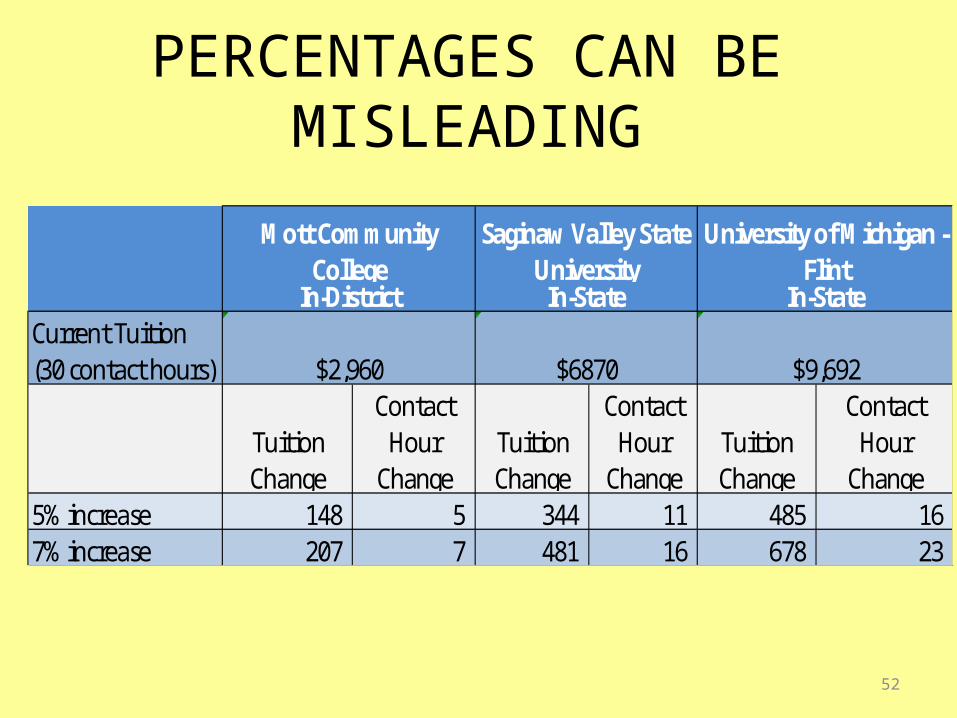
PERCENTAGES CAN BE MISLEADING
52
Current Tuition (30 contact hours)
Tuition Change
Contact Hour
ChangeTuition Change
Contact Hour
ChangeTuition Change
Contact Hour
Change5% increase 148 5 344 11 485 16 7% increase 207 7 481 16 678 23
$2,960 $6870 $9,692
Mott Community College
Saginaw Valley State University
University of Michigan - Flint
In-District In-State In-State

K-12 Schools Universities Community Colleges-15
-10
-5
0
5
10
15
20
25
30
35
(8.8)
4.8
35
3.4 -
5
Enrollment
Appropriations
Enrollment vs AppropriationsFY 06 – FY11
53
In p
erce
nts

COMMENTS/QUESTIONS?
54