
Motor Industry Facts 2009 - SMMT€¦ · 8 Production The UK is the fourth largest vehicle producer...
36
Motor Industry Facts 2009 www.smmt.co.uk
Transcript of Motor Industry Facts 2009 - SMMT€¦ · 8 Production The UK is the fourth largest vehicle producer...
Motor Industry Facts 2009
www.smmt.co.uk

From production and first registration data to used vehicle sales and those on the road, SMMT Automotive Information Services is the primary source of data on the motor industry.
Call us to find out more on 020 7235 7000or go to www.smmt.co.uk/dataservices

www.smmt.co.uk 3
Industry performanceDesign engineering 4Sector profile 5Research and development 5
ProductionKey manufacturing sites 6Car production annual totals 8CV production annual totals 9UK top five producers 10Engine producers 11
New car registrationsAnnual UK totals and best sellers 12Fleet and business 13Segment totals and market share 14Best sellers by segment 15Overseas registration data 18
Commercial vehicle registrationsAnnual UK totals 19Segment totals 19Bus and coach 20
Vehicles in useUsed car sales 21Age of cars on the road 22Cars on the road 22Colours of cars on the road 22 Commercial vehicles on the road 23
Environmental performanceUK production sites performance 24 Average new car CO2 emissions 25 New car market by VED band 25 Lowest emissions 26 Change in average new car CO2 emissions by segment 26
Alternatively fuelled vehicles 27 Eco innovations 27 End of life vehicles 29 New car life cycle CO2 29
Key issuesVehicle security 30 Road safety 31Taxation - Fuel prices 32 Taxation - VED 33
SMMT informationGlossary of terms 34SMMT group activities 35
Con
tent
s

www.smmt.co.uk 4
IndustryPerformanceThe automotive industry is a vital part of the UK economy• More than 40 companies manufacture vehicles in the UK – ranging from global
volume car, van, truck and bus builders, to specialist niche makers.• 1.6m cars and commercial vehicles are produced each year, plus three
million engines. • £51 billion turnover and £10.3 billion value added to the UK economy.• Over 800,000 UK jobs rely on automotive manufacturing.• UK automotive manufacturing supplies over 100 markets worldwide offering some
resilience to UK issues.
• New cars emit less CO2 than older models – the average new car CO2 emissions have fallen 17% in the last decade.
The UK is home to• Seven volume car manufacturers and nine CV manufacturers.• More specialist sports car manufacturers than any other country in Europe.
• Nineteen out of the top 20 global components suppliers have a base in the UK.• Seven Formula 1 teams are based in the UK, supported by more than 300 specialist
motorsport companies employing nearly 50,000 people in motorsport valley.
Design engineeringThe UK is a centre for design engineering, employing 7,500 people and generating a turnover of some £650 million, with around 65% exported.
The UK is home to the dedicated facilities of vehicle manufacturers, such as those at Ford’s engineering centre at Dunton, Jaguar Land Rover at Gaydon and Whitley, and Nissan’s R&D centre at Cranfield.
Renowned names such as Lotus Engineering, MAHLE, Millbrook, MIRA, Perkins, Pi Technology, Prodrive, Ricardo, RLE, Revolve, TRW Conekt, TWI and Zytek are also active in the UK.
The motor industry in the UK has a strong future and is at the heart of the low-carbon agenda, investing in R&D that will deliver even cleaner, safer and more fuel-efficient cars.

www.smmt.co.uk 5
Research and developmentAt €20 billion, the automotive sector is Europe’s largest investor in R&D, driving industry forward and helping deliver more sustainable motoring for the 21st century.
The automobile and parts sector was the fourth largest contributor to R&D in the UK top 850 companies and the top global 1,400 companies in 2007.*
Eight of the top 25 R&D investors globally are vehicle manufacturer and parts companies.*
In total, there are 30 vehicle manufacturer and parts companies listed in the UK.*
* Source: DUIS 2008 R&D scorecard
Sector profile
2003 2004 2005 2006 2007
Automotive manufacturing sector turnover (£bn) 46.3 46.9 48.2 49.3 51.0
Share of total transport manufacturing turnover (%) 68.0 67.1 67.7 66.7 66.7
Total net capital investment (£bn) 1.2 1.4 1.3 1.4 1.5
Automotive sector value added (£bn) 9.2 9.4 9.4 9.9 10.3Total employees directly dependent on the UK
automotive sector 889,000 866,000 874,000 841,000 841,000
Value of exports (£bn) 21.9 22.5 23.7 24.1 24.5
Percentage of total UK exports (%) 11.6 11.8 11.2 9.9 11.1
All automotive sectors - value added share of GDP (%) 3.7 3.4 3.3 3.2 3.0
UK share of global passenger car production (%) 4.0 3.8 3.5 3.0 3.0
Number of UK volume car manufacturers 9 9 8 7 7
Number of UK commercial vehicle manufacturers 9 9 9 9 9

www.smmt.co.uk 6
ProductionKey manufacturing sites
Manufacturer Where What
1 Alexander Dennis Guildford and Falkirk CV, bus and coach
2 Aston Martin Gaydon Car
3 Bentley Crewe Car, engine
4 BMW MINI Oxford Car, engine
5 Caterham Dartford Car
6 Cummins Darlington Engine
7 Dennis Eagle Warwick CV
8 Euromotive Hythe Bus and coach
9 FordBridgend, Dagenham
and SouthamptonCV, engine, bus
and coach
10 Honda Swindon Car
11 IBC Luton CV
12 Jaguar Birmingham, Halewood Car
Manufacturer Where What
13 John Dennis Coachbuilders Guildford Bus and coach
14 Land Rover Solihull, Halewood Car, CV
15 LDV Birmingham CV
16 Leyland Trucks Leyland CV
17 Lotus Norwich Car
18 LTI Coventry Car
19 Mellor Coachcraft Bolton Bus and coach
20 Mercedes-Benz MTC Woking Car
21 Minibus Options Whaley Bridge Bus and coach
22 MG Motors Longbridge Car
23 Modec Coventry CV
24 Morgan Malvern Car
25 Nissan Sunderland Car, engine

www.smmt.co.uk 7
15
1
6
9 10
12
1619
20
21
17
13
14
9
1
8
30
32
3130
26
29
28
25
27
72
4
22
231214
18
3
11
95
Manufacturer Where What
26 Optare Leeds CV
27 Plaxton Scarborough Bus and coach
28 Rolls-Royce Goodwood Car
29 Smith (Tanfield) Tyne and Wear CV
30 Toyota Burnaston and Deeside Car and engine
31 Vauxhall Ellesmere Port Car, CV
32 Warnerbus Dunstable Bus and coach

www.smmt.co.uk 8
ProductionThe UK is the fourth largest vehicle producer in Europe and is home to some of the most productive vehicle plants.
Year Production % change Home market % change % of total Export market % change % of total
1999 1,799,004 2.2 649,279 -11.0 36.1 1,149,725 11.5 63.9
2000 1,641,452 -8.8 578,462 -10.9 35.2 1,062,990 -7.5 64.8
2001 1,492,365 -9.1 598,151 3.4 40.1 894,214 -15.9 59.9
2002 1,629,934 9.2 582,484 -2.7 35.7 1,047,450 17.2 64.3
2003 1,657,558 1.7 513,798 -11.8 31.0 1,143,760 9.2 69.0
2004 1,647,246 -0.6 467,160 -9.1 28.4 1,180,086 3.1 71.6
2005 1,596,356 3.1 411,245 -11.9 25.8 1,185,111 0.4 74.2
2006 1,442,085 9.7 335,992 -18.3 23.3 1,106,093 -6.7 76.7
2007 1,534,567 6.4 349,108 3.9 22.7 1,185,459 7.2 77.3
2008 1,446,619 -5.7 318,033 -8.9 22.0 1,128,586 -4.8 78.0
Car
pro
duct
ion
annu
al tot
als

www.smmt.co.uk 9
Ten year totals for CV production in the UK
Year Production % change Export market % change % of total Home market % change % of total
1999 173,557 -3.9 63,674 30.9 36.7 109,883 -10.6 63.3
2000 172,442 -19.3 76,181 19.6 44.2 96,261 -12.4 55.8
2001 192,873 -0.06 96,224 26.3 49.9 96,649 0.4 50.1
2002 191,267 11.8 114,235 18.7 59.7 77,032 -20.3 40.3
2003 188,871 -0.8 102,917 -9.9 54.5 85,954 11.6 45.5
2004 209,293 -1.3 128,107 24.5 61.2 81,186 -5.5 38.8
2005 206,756 10.8 130,276 1.7 63.0 76,480 -5.8 37.0
2006 207,707 -1.2 136,222 4.6 65.6 71,485 -6.5 34.4
2007 215,686 3.8 131,562 -3.4 61.0 84,124 17.7 39.0
2008 202,896 -5.9 125,611 -4.5 61.9 77,285 -8.1 38.1

www.smmt.co.uk 10
ProductionTop five UK producers 2008
Make Volume
Nissan 386,555
BMW MINI 234,461
Honda 230,423
Toyota 213,329
Land Rover 184,831
Car
sMake Volume
IBC 87,248
Ford 66,215
Leyland Trucks 24,662
LDV 9,308
Vauxhall 9,250
CV
Make Model Volume
BMW MINI 234,461
Nissan Qashqai 224,989
Honda CR-V 120,150
Toyota Avensis 110,741
Honda Civic 110,273Mod
el

www.smmt.co.uk 11
Engi
nes
Manufacturing sites
Automotive 2004 2005 2006 2007 2008
Bentley 8,000 10,000 9,386 10,014 7,675
BMW 146,000 181,000 217,000 367,000 371,269
Cummins 44,000 54,000 65,000 79,000 80,000
Ford (Bridgend) 621,000 552,000 671,202 758,581 704,181
Ford (Dagenham) 682,000 605,000 683,729 900,776 1,047,570
Honda 188,000 146,000 190,538 248,000 203,647
Land Rover 47,000 17,000 0 0 0
Nissan 2,720,000 282,000 212,046 119,000 112,829
Powertrain 114,000 30,000 0 0 0
Toyota 580,000 427,000 438,000 345,000 297,398
Vauxhall 12,000 0 0 0 0
Others 4,000 0 0 0 0
Non-automotive
Perkins 300,000 300,000 300,000 300,000 300,000
Others 40,000 40,000 40,000 40,000 40,000
Total 3,058,000 2,644,000 2,826,901 3,167,371 3,164,569

www.smmt.co.uk 12
NewCarRegistrationsAnnual UK totals and best sellers
Ten year registrations
Make Volume
Ford Focus 101,593
Vauxhall Corsa 99,574
Ford Fiesta 94,989
Vauxhall Astra 90,641
VW Golf 65,029
Peugeot 207 53,462
BMW 3 Series 49,384
Ford Mondeo 44,150
Vauxhall Zafira 43,169
Vauxhall Vectra 42,555
Total market 2,131,795
Make Volume
VW Golf 45,599
Ford Focus 39,924
Ford Mondeo 37,331
Vauxhall Astra 29,769
VW Passat 29,726
BMW 3 Series 27,964
Audi A4 25,600
Vauxhall Vectra 22,692
Audi A3 22,044
Citroën C4 20,783
Total diesel market 928,605
Top
ten
in 2
008
Top
ten
dies
les
1999 2000 2001 2002 2003 2004 2005 2006 2007 2008
Reg 2,197,615 2,221,647 2,458,769 2,563,631 2,579,050 2,567,269 2,439,717 2,344,894 2,404,007 2,131,795
% Change -2.2 1.1 10.7 4.3 0.6 -0.5 -5.0 -3.9 2.5 -11.3
Fuel
typ
es
AFV
DIESEL
PETROL
1999 2000 2001 2002 2003 2004 2005 2006 2007 2008
2.6
2.3
2.0
1.7
1.4
1.1
0.8
0.5
0
1,893,690
303,925
313,192
436,591
602,623 704,637 835,334
897,887
898,521967,436
928,605
357
0
1,690
2,847 4,266 4,218
6,2559,439
16,640
15,830
1,908,098
2,020,488
1,958,161
1,870,147
1,727,717
1,535,575
1,436,904 1,419,931
Tota
l: 2,
197,
615
Tota
l: 2,
221,
647
Tota
l: 2,
458,
769
Tota
l: 2,
563,
631
Tota
l: 2,
579,
050
Tota
l: 2,
567,
269
Tota
l: 2,
439,
717
Tota
l: 2,
344,
864
Tota
l: 2,
404,
007
Tota
l: 2,
131,
795
1,187,360
volu
me (
million
s)

www.smmt.co.uk 13
Make Volume
Ford Focus 74,695
Vauxhall Astra 71,502
Vauxhall Corsa 60,249
VW Golf 45,402
Ford Fiesta 40,554
Ford Mondeo 39,480
Vauxhall Zafira 37,985
Vauxhall Vectra 36,189
BMW 3 Series 27,317
Peugeot 307 27,186
Total non-private registrations
1,239,536
Year 2004 2005 2006 2007 2008
Fleet 1,093,494 1,184,874 1,156,274 1,194,811 1,109,963
Business 273,709 178,330 154,868 163,389 129,573
Private 1,200,066 1,076,513 1,033,722 1,045,807 892,259
Total 2,567,269 2,439,717 2,344,864 2,404,007 2,131,795
Non
-priv
ate
reg
Flee
t an
d
busine
ss

www.smmt.co.uk 14
Segment 1999 2000 2001 2002 2003 2004 2005 2006 2007 2008
Mini 39,635 52,203 47,899 40,370 38,940 36,171 27,195 23,297 21,512 28,094
1.8 2.3 1.9 1.6 1.5 1.4 1.1 1.0 0.9 1.3
Supermini 593,745 688,686 773,995 831,264 873,690 839,604 732,756 753,872 770,601 726,006
27.0 31.0 31.5 32.4 33.9 32.7 30.0 32.2 32.1 34.1
Lower Medium 703,611 661,502 741,817 771,319 719,164 729,690 761,328 694,428 722,012 605,817
32.0 29.8 30.2 30.1 27.9 28.4 31.2 29.7 30.0 28.4
Upper Medium 513,218 476,860 507,736 505,026 480,220 459,061 427,278 393,999 386,414 340,796
23.4 21.5 20.7 19.7 18.6 17.9 17.5 16.8 16.1 16.0
Executive 115,509 104,583 109,433 114,382 118,579 109,667 111,112 100,339 104,468 98,572
5.3 4.7 4.5 4.5 4.6 4.3 4.6 4.3 4.3 4.6
Luxury Saloon 12,375 11,406 11,053 10,193 13,500 13,620 11,678 13,227 13,120 9,977
0.6 0.5 0.4 0.4 0.5 0.5 0.5 0.6 0.5 0.5
Specialist Sports 68,846 67,208 65,358 60,108 65,178 73,940 64,681 65,047 65,731 50,256
3.1 3.0 2.7 2.3 2.5 2.9 2.7 2.8 2.7 2.4
4x4/SUV 98,926 99,212 121,556 137,582 159,144 179,439 187,392 175,805 176,290 136,525
4.5 4.5 4.9 5.4 6.2 7.0 7.7 7.5 7.3 6.4
Multi-Purpose 51,750 59,987 79,922 93,387 110,635 126,077 116,297 124,850 143,859 135,752
2.4 2.7 3.3 3.6 4.3 4.9 4.8 5.3 6.0 6.4
Total 2,197,615 2,221,647 2,458,769 2,563,631 2,579,050 2,567,269 2,439,717 2,344,864 2,404,007 2,131,795Seg
men
t to
tals a
nd m
arke
t sh
are
New
CarR
egistr
atio
ns

Model Registrations Market Share
Hyundai i10 6,760 24.1%
Chevrolet Matiz 6,452 23.0%
smart fortwo coupé 5,733 20.4%
Vauxhall Agila 4,388 15.6%
Hyundai Amica 1,846 6.6%
Segment total - 28,094
Diesel share - 0.6%
Min
i
www.smmt.co.uk 15
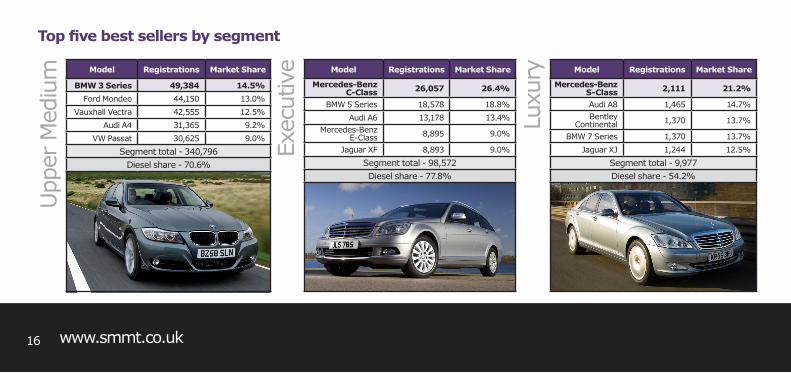
Top five best sellers by segment
Model Registrations Market Share
Vauxhall Corsa 99,574 13.7%
Ford Fiesta 94,989 13.1%
Peugeot 207 53,462 7.4%
MINI 40,736 5.6%
VW Polo 35,710 4.9%
Segment total - 726,006
Diesel share - 16.5%Sup
erm
ini
Model Registrations Market Share
Ford Focus 101,593 16.8%
Vauxhall Astra 90,641 15.0%
VW Golf 65,029 10.7%
Honda Civic 34,474 5.7%
Renault Mégane 33,543 5.5%
Segment total - 605,817
Diesel share - 46.7%
Low
er M
ediu
m
Model Registrations Market Share
BMW 3 Series 49,384 14.5%
Ford Mondeo 44,150 13.0%
Vauxhall Vectra 42,555 12.5%
Audi A4 31,365 9.2%
VW Passat 30,625 9.0%
Segment total - 340,796
Diesel share - 70.6%
Upp
er M
ediu
m
www.smmt.co.uk 16
Top five best sellers by segment
Model Registrations Market Share
Mercedes-Benz C-Class 26,057 26.4%
BMW 5 Series 18,578 18.8%
Audi A6 13,178 13.4%Mercedes-Benz
E-Class 8,895 9.0%
Jaguar XF 8,893 9.0%
Segment total - 98,572
Diesel share - 77.8%
Exec
utiv
e Model Registrations Market Share
Mercedes-Benz S-Class 2,111 21.2%
Audi A8 1,465 14.7%Bentley
Continental 1,370 13.7%
BMW 7 Series 1,370 13.7%
Jaguar XJ 1,244 12.5%
Segment total - 9,977
Diesel share - 54.2%
Luxu
ry

www.smmt.co.uk 17
Top five best sellers by segment
Model Registrations Market Share
Audi TT 9,286 18.5%
Mazda MX-5 6,109 12.2%
VW Eos 4,939 9.8%Mercedes-Benz
SLK 3,986 7.9%
Vauxhall Tigra 2,610 5.2%
Segment total - 50,256
Diesel share - 11.6%
Spo
rts Model Registrations Market Share
Honda CR-V 14,464 10.6%
Land RoverFreelander 13,135 9.6%
Toyota RAV4 7,910 5.8%
Land Rover Discovery 7,019 5.1%
Range Rover Sport 6,975 5.1%
Segment total - 136,525
Diesel share - 82.6%
4x4/
SUV Model Registrations Market Share
Vauxhall Zafira 43,169 31.8%
Ford C-Max 21,615 15.9%
Ford S-Max 9,519 7.0%
Ford Galaxy 8,664 6.4%
VW Touran 8,515 6.3%
Segment total - 135,752
Diesel share - 59.1%
MPV

www.smmt.co.uk 18
NewCarRegistrationsOverseas new car registrations 2008
1
34
5
6
8
10
97
2
Country Volume
1 France1 2,050,282
2 Germany1 3,090,040
3 Italy1 2,161,302
4 Spain1 1,161,176
5 UK2 2,131,795
6 China3 5,731,700
7 USA3 6,917,300
8 Russia3 2,921,400
9 Japan3 4,319,900
10 EU271 14,331,332
Source:1 – ACEA passenger car registrations 20082 – SMMT3 – Global Insight (December 2008)

www.smmt.co.uk 19
CommercialVehicleRegistrationsAnnual UK totals and best sellers
Year LCVs up to 3.5 Rigids Artics Bus and coach All CVs
1999 231,761 33,628 18,163 4,548 288,1002000 239,482 35,517 18,663 4,381 298,0432001 254,075 37,279 18,294 3,763 313,4112002 266,346 35,135 16,785 3,992 322,2582003 303,755 36,788 18,802 4,342 363,6872004 329,599 37,461 18,851 4,012 389,9232005 322,930 38,957 19,884 4,198 385,9692006 327,162 36,973 18,601 4,232 386,9682007 337,741 35,614 15,133 3,993 392,481
2008 289,463 38,651 18,759 4,511 351,384
Ten
year
reg
istrat
ion
tota
ls
Ten
year
ann
ual
regi
stra
tions
by
segm
ent
1999 2000 2001 2002 2003 2004 2005 2006 2007 2008
400
375
350
325
300
275
250
225
200
288,
100
-2.2
%
298,
043
3.5
%
313,
411
5.2
%
322,
258
2.8
%
363,
687
12.9
%
389,
923
2.8
%
385,
969
-1.0
%
386,
968
0.0
%
392,
481
1.5
%
351,
384
-9.6
%
volu
me (
thou
san
ds)

www.smmt.co.uk 20
CommercialVehicleRegistrationsBus and coach
Year Registrations
1999 4,548
2000 4,381
2001 3,763
2002 3,992
2003 4,342
2004 4,012
2005 4,198
2006 4,232
2007 3,993
2008 4,511
Manufacturer Factory
Alexander Dennis Guildford and Falkirk
Euromotive Hythe
Ford Southampton
IBC Luton
John Dennis Coachbuilders Guildford
LDV Birmingham
Mellor Coachcraft Bolton
Minibus Options Whaley Bridge
Optare Leeds
Plaxton Scarborough
Warnerbus Dunstable
Bus
and
coa
ch ten
ye
ar reg
istrat
ions
Prod
uctio
n -
UK b
us, co
ach
and
min
ibus
mak
ers

www.smmt.co.uk 21
VehiclesInUse
Year Volume
2004 7,731,609
2005 7,576,724
2006 7,584,466
2007 7,487,544
2008 7,157,982
Top
ten
used
car
sal
es
2008
Use
d ca
r sa
les
in G
B
2004
-200
8
© Experian Ltd 2008. All rights reserved. Reproduced by SMMT with permission. No third party reproduction without prior written consent from copyright owner.For further information contact: [email protected]
Make Volume
Vauxhall Astra 315,260
Ford Fiesta 305,115
Vauxhall Corsa 293,293
Ford Focus 261,245
VW Golf 215,669
Ford Mondeo 200,687
Renault Clio 194,974
BMW 3 Series 187,086
Vauxhall Vectra 182,822
Fiat Punto 149,547

www.smmt.co.uk 22
VehiclesInUseColour 2008* % of parc
Aluminium/ silver 7,414,703 24
Blue 7,178,110 23
Black 4,219,220 14
Red 4,050,720 13
Green 2,643,806 8
Colour 1998 % of parc
Red 6,792,507 26
Blue 6,498,402 25
White 3,495,878 13
Green 2,527,345 10
Silver 2,330,806 9
Top
five
2008
Top
five
1998
Colours of cars on the road 2008 v 1998
Ann
ual t
otal
s of
car
s on
UK roa
ds
1994 -
2008
Years old Year Volume*
Less than three 2008-2006 7,136,000
Three to six 2005-2003 7,425,000
Six to nine 2002-2000 7,027,000
Nine to 12 1999-1997 5,230,000
More than 12 Pre 1997 4,349,000
Age
of c
ars
on
the
road
* Forecasted data for 2008 census1994 1995 1996 1997 1998 1999 2000 2001 2002 2003 2004 2005 2006 2007 2008
35
30
25
20
15
10
5
0
24,3
41,1
25
24,8
30,1
69
25,4
12
,046
26,1
77,
603
26,8
62
,024
27,
391,3
48
27,
807,
471
28,4
47,
067
29,1
55,6
06
29,7
21,2
16
30,0
89,7
12
30,4
77,
058
30,8
17,
036
31,1
05,9
88
31,1
67,
00
0*
volu
me (
million
s)

www.smmt.co.uk 23
2008* 2007 2006 2005 2004 2003 2002 2001 2000 1999 1998
LCVs up to 3.5t 3,722,000 3,545,724 3,420,620 3,227,461 3,109,744 2,979,759 2,898,250 2,824,323 2,767,750 2,710,201 2,709,325
Trucks over 3.5t 620,000 598,447 595,266 586,129 580,718 587,862 579,465 570,837 574,456 563,431 574,134
Buses and coaches 108,000 103,787 102,401 103,175 102,978 101,069 100,099 98,224 98,312 95,942 89,575
Total CV 4,450,000 4,247,958 4,118,287 3,916,765 3,793,440 3,668,690 3,577,814 3,493,384 3,440,518 3,369,574 3,373,034
Ann
ual t
otal
s of
co
mm
ercial
veh
icle
s on
UK roa
ds 1
998-
2008

www.smmt.co.uk 24
EnvironmentalPerformance
Source: SMMT Sustainability Report (ninth annual report on the UK automotive sector)
UK production sites performance
Year m3 per vehicle produced
2003 3.4
2004 3.4
2005 3.2
2006 3.3
2007 3.0
YearWaste to landfill (kg) per vehicle
produced
2003 17.9
2004 19.8
2005 14.5
2006 17.0
2007 12.75
Ener
gy c
onsu
mpt
ion
CO
2 em
ission
from
pr
oduc
tion
and
dist
ribut
ion
Wat
er u
se
m3
per ve
hicle
prod
uced
Was
te to
land
fill
per ve
hicle
prod
uced
2003 2004 2005 2006 2007
3000
2500
2250
2000
1750
1500
kwh
per ve
hicl
e
2003 2004 2005 2006 2007
0.75
0.70
0.65
0.60
0.55
0.50
CO
2 eq
uiva
lent
(to
nnes
) pe
r ve
hicle
prod
uced

Average new car CO2 emissions New car market by VED band
97 98 99 00 01 02 03 04 05 06 07 08
190
185
180
175
170
165
160
155
150
g/km
VED band Volume Market share
2008 2008 2007 1997
A (sub-100g/km) 3,917 0.2% 0.0% 0.0%
B (101-120g/km) 230,216 10.8% 5.3% 0.0%
C (121-150g/km) 803,756 37.7% 32.7% 7.8%
D (151-165g/km) 435,979 20.5% 24.6% 15.1%
E (166-185g/km) 331,588 15.6% 17.4% 32.0%
F (186-225g/km) 240,750 11.3% 13.7% 32.3%
G (over 225g/km) 85,589 4.0% 6.2% 12.8%
www.smmt.co.uk 25

www.smmt.co.uk 26
0
2000
4000
6000
8000
10000
12000
14000
16000
18000
New
car
reg
istr
atio
ns
2000 2001 2002 2003 2004 2005 2006 2007 2008
Lowest emissions Change in average new car CO2 by segment
Rank Model Fuel type CO2g/km
1 smart fortwo Electric 0
2 SEAT Ibiza Diesel 99
2 VW Polo Diesel 99
4 smart fortwo Diesel 103
5 MINI Diesel 104
5 Toyota Prius Petrol/electric 104
7 Citroën C1 Petrol and diesel 108
7 Peugeot 107 Petrol 108
7 Toyota Aygo Petrol and diesel 108
10 Honda Civic Petrol/electric 109
10 Škoda Fabia Diesel 109
Top
ten
mod
els
-3.6
%
-2.9
%
-3.1
%
-4.8
%
-3.5
%
-2.8
%
-4.2
%
-4%
-2.4
%
Min
i
Low
er
mediu
m
Upper
mediu
m
Execu
tive
Speci
alist
sp
ort
s
Superm
ini
% ch vs 2007 % ch vs 1997
Luxury
Dual
purp
ose
4x4
MP
V
-16%
-14.2
%
-16.2
%
-18.5
%
-21.2
% -16.8
%
-2.4
%
-23.2
%
-26.2
%
+5%
0%
-5%
-10%
-15%
-20%
-25%
-30%
EnvironmentalPerformance
0
2000
4000
6000
8000
10000
12000
14000
16000
18000
New
car
reg
istr
atio
ns
2000 2001 2002 2003 2004 2005 2006 2007 2008
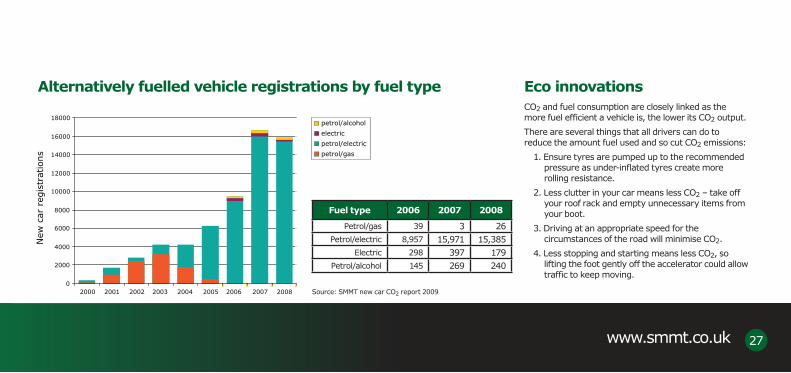
Alternatively fuelled vehicle registrations by fuel type Eco innovationsCO2 and fuel consumption are closely linked as the more fuel efficient a vehicle is, the lower its CO2 output.
There are several things that all drivers can do to reduce the amount fuel used and so cut CO2 emissions:
1. Ensure tyres are pumped up to the recommended pressure as under-inflated tyres create more rolling resistance.
2. Less clutter in your car means less CO2 – take off your roof rack and empty unnecessary items from your boot.
3. Driving at an appropriate speed for the circumstances of the road will minimise CO2.
4. Less stopping and starting means less CO2, so lifting the foot gently off the accelerator could allow traffic to keep moving.
Source: SMMT new car CO2 report 2009
Fuel type 2006 2007 2008
Petrol/gas 39 3 26Petrol/electric 8,957 15,971 15,385
Electric 298 397 179Petrol/alcohol 145 269 240
petrol/alcohol
electric
petrol/electric
petrol/gas
www.smmt.co.uk 27

www.smmt.co.uk 28
5. Over-revving will increase emissions as modern engines are designed to be efficient from the moment the engine is turned on. Changing gear at 2000rpm in a diesel car and 2500 rpm in a petrol car will save fuel, money and CO2.
6. If you’re in a traffic jam and idling, switch off the engine.
Manufacturers have designed various eco-innovations to help drivers save fuel and CO2:
Stop-start technologies automatically cut the engine when a vehicle is stationary. The engine is simply started by pressing the accelerator.
Tyre pressure monitoring systems measure the pressure of each of the tyres and will give a warning through the dashboard display if they become under-inflated.
Gear shift indicators show the driver the optimum time to change gear (up and down) while driving.
Low rolling resistance tyres are designed to improve the fuel efficiency of a car by minimising the energy wasted as heat when the tyre rolls down the road.
Eco innovations (continued)
www.smmt.co.uk 29
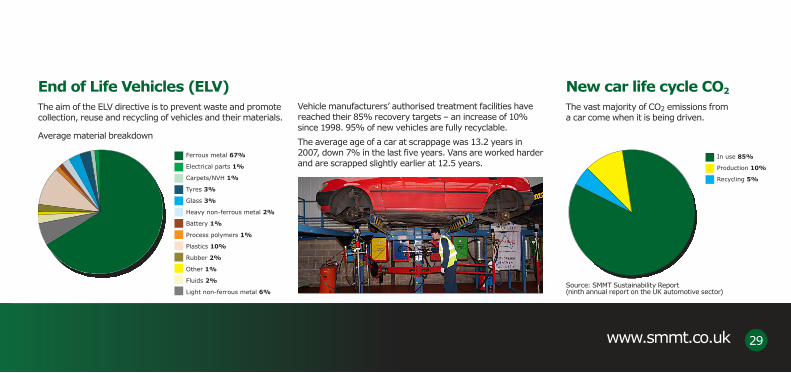
End of Life Vehicles (ELV)The aim of the ELV directive is to prevent waste and promote collection, reuse and recycling of vehicles and their materials.
Average material breakdown
Vehicle manufacturers’ authorised treatment facilities have reached their 85% recovery targets – an increase of 10% since 1998. 95% of new vehicles are fully recyclable.
The average age of a car at scrappage was 13.2 years in 2007, down 7% in the last five years. Vans are worked harder and are scrapped slightly earlier at 12.5 years.
New car life cycle CO2
The vast majority of CO2 emissions from a car come when it is being driven.
Ferrous metal 67%
Electrical parts 1%
Carpets/NVH 1%
Tyres 3%
Glass 3%
Heavy non-ferrous metal 2%
Battery 1%
Process polymers 1%
Plastics 10%
Rubber 2%
Other 1%
Fluids 2%
Light non-ferrous metal 6%
In use 85%
Production 10%
Recycling 5%
Source: SMMT Sustainability Report (ninth annual report on the UK automotive sector)

per 1,000 cars on the road
Minis and superminis 7
Small saloons 7
Medium saloons 7
Large saloons 6
Luxury saloons 6
Sports 7
4x4 and MPV 4
www.smmt.co.uk 30
KeyIssues
Theft from vehicles
Attempted theft of
and from vehicles
Theft of vehicles
2003/2003 1,425 662 2782003/2004 1,337 543 2412004/2005 1,210 462 2142005/2006 1,121 425 1852006/2007 1,129 384 1762007/2008 994 342 161
Vehicle security
Car
the
ft rat
e by
typ
e of
ve
hicle
on the
roa
d
Red
uctio
n in
veh
icle
cr
ime
1997
- 2
008
(tho
usan
ds)
Source: Car Theft Index 2006 Source: British Crime Survey

www.smmt.co.uk 31
Year 2003 2004 2005 2006 2007
Pedestrians 7,933 7,478 7,129 7,051 6,924Pedal cyclists 2,411 2,308 2,360 2,442 2,564
Motorcycles (users and passengers)
7,652 6,648 6,508 6,484 6,737
Car users 17,291 16,144 14,617 14,254 12,967Bus/coach users 500 488 363 426 455Other road users 1,428 1,285 1,178 1,188 1,073
All road users 37,215 34,351 32,155 31,845 30,720
Road safety
Killed
or se
rious
ly
inju
red
casu
altie
s by
ro
ad u
ser ty
pe20
03 -
200
7
Perc
enta
ge c
hang
e ki
lled
or s
erio
usly
inju
red
2003
- 2
007
Source: DfT Road Casualties Great Britain 2007
Pedestrians -12.1%
Pedal cyclists 6.3%
Motorcycles(users and passengers) -12.0%
Bus/coach users -9%
Other road users -24.9%
+10%
+5%0%
-5%
-10%
-15%
-20%
-25%
-30%
-25.0%Car users
All road users -17.5%

www.smmt.co.uk 32
KeyIssuesPump price (p) all tax as % total
Year Unleaded Diesel Unleaded Diesel
1989 38.5 36.1 59.6% 62.8%
1990 42.3 40.4 58.0% 60.9%
1991 45.4 44.0 62.3% 62.9%
1992 46.2 45.4 65.2% 64.7%
1993 49.3 49.2 66.8% 65.7%
1994 50.7 50.9 71.0% 69.8%
1995 53.5 53.7 74.0% 73.7%
1996 56.4 57.4 76.1% 75.0%
1997 61.8 62.5 77.3% 76.6%
1998 64.8 65.5 81.4% 81.8%
Pump price (p) all tax as % total
Year Unleaded Diesel Unleaded Diesel
1999 70.2 72.5 81.4% 83.0%
2000 79.9 81.3 75.6% 75.2%
2001 75.7 77.8 76.1% 74.4%
2002 73.2 75.5 77.5% 75.6%
2003 76.0 77.9 75.6% 74.1%
2004 80.9 82.5 73.1% 72.0%
2005 87.2 91.3 68.9% 66.5%
2006 92.0 95.7 66.2% 64.2%
2007 95.0 97.4 66.3% 65.0%
2008 107.5 118.1 61.7% 57.5%
Ave
rage
ann
ual
fuel
pric
es

www.smmt.co.uk 33
Current band CO2 g/km New band CO2 g/km Standard Rate (£)* First Year Rate (£)
2008-2009 2009-2010 2010-2011 2010-2011
A Up to 100 A up to 100 0 0 0 0
B 101-120 B 101-110 35 35 20 0
C 111-120 35 35 30 0
C 121-150 D 121-130 120 120 90 0
E 131-140 120 120 110 110
F 141-150 120 125 125 125
D 151-165 G 151-165 145 150 155 155
E H 166-175 170 175 180 250
I 176-185 170 175 200 300
F 166-185 J 186-200 210 215 235 425
K** 201-225 210 215 245 550
L 226-255 400 405 425 750
G Over 225 M Over 255 400 405 435 950
VED
Rat
es
* AFV discount 2009-10 A-I £20, J-M £15, 2010 onwards £10 all cars
** All cars over 225g/km registered to 1 March 2001-23 March 2006 in K band

www.smmt.co.uk 34
SMMTInformationGlossary - SMMT segmentationA Mini eg smart
B Supermini eg Nissan Micra, MINI
C Lower Medium eg Ford Focus
D Upper Medium eg Vauxhall Insignia
E Executive eg BMW 5 Series
F Luxury Saloon eg Rolls-Royce
G Specialist Sports eg Porsche 911
H Dual Purpose (4x4/SUV) eg Honda CR-V
I Multi Purpose Vehicle eg Renault Espace
Segment A - MiniNormally less than 1.0 cc• Bodystyle “miniature”• Normally two-door• Length normally not exceeding 3050 mm (10 feet)•
Segment B - SuperminiNormally between 1.0 - 1.4 CC• Bodystyle bigger than mini• Length normally not exceeding 3745 mm (12.5 feet)• Performance greater than mini• More variety of trims per range •
Segment C - Lower MediumNormally between 1.3 - 2.0 CC• Length under 4230 mm (14 feet)•
Segment D - Upper MediumNormally between 1.6 - 2.8 CC• Length normally under 4470 mm (14.9 feet)•
Segment E - ExecutiveNormally between 2.0 - 3.5 CC• Bodystyle generally bigger than upper medium• Normally four-door• Length normally under 4800 mm (16 feet)• More luxuriously appointed•
Segment F - Luxury SaloonNormally upward from 3.5 CC• Most luxurious available•
Segment G - Specialist SportsSports coupés• Sports saloons• Traditional sports•
Segment H - Dual Purpose (4x4/SUV)4x4 off road•
Segment I - Multi Purpose Vehicle4x2 or 4x4 estates with a seating capacity of up to • eight people

www.smmt.co.uk 35
SMMT companiesForesight Vehicle
Foresight Vehicle is administered by SMMT and is the UK’s prime knowledge transfer network for the automotive industry. This research and development programme aims to promote technology and stimulate suppliers to develop market-driven technologies for future motor vehicles (cars, taxis, HGVs, buses and light commercial vans).
www.foresightvehicle.org.uk
Industry Forum
The Industry Forum programme delivers ‘learning by doing’ training, teaching companies practical skills to cut waste, improve productivity and lower costs throughout the supply chain.
www.industryforum.co.uk
Motor Codes Ltd
Motor Codes Ltd has been established as a wholly-owned subsidiary of SMMT, to house all motor industry codes of practice currently operated by the Society. The Motor Industry Code of Practice for Service and Repair is the first Motor Codes brand to be launched to the public, marking a major development in consumer protection in the automotive sector. With the support of government, the National Consumer Council (NCC) and Trading Standards, the Code has completed stage one of the OFT’s Consumer Codes Approval Scheme and is now active in thousands of garages across the country.
www.motorindustrycodes.co.uk

Produced for SMMT by Adstorm Marketing & Advertising www.adstorm.co.ukApril 2009
SMMT, Forbes House, Halkin Street, London SW1X 7DS tel: +44 (0)20 7235 7000fax: +44 (0)20 7235 7112 www.smmt.co.uk e-mail [email protected] on Revive 50:50 silk, produced from part recycled, part sustainably sourced paper stock and certified as an FSC mixed sources product


