Motivations of UK Students to Study Abroad: A Survey of ... · PDF fileMotivations of UK...
36
University of Sussex Sussex Centre for Migration Research Motivations of UK Students to Study Abroad: A Survey of School-Leavers Working Paper No 64 Jill Ahrens, Russell King, Ronald Skeldon, Sussex Centre for Migration Research Máiréad Dunne Centre for Higher Education Research, University of Sussex December 2010
Transcript of Motivations of UK Students to Study Abroad: A Survey of ... · PDF fileMotivations of UK...
University of Sussex
Sussex Centre for Migration Research
Motivations of UK Students to Study Abroad:
A Survey of School-Leavers
Working Paper No 64
Jill Ahrens, Russell King, Ronald Skeldon,
Sussex Centre for Migration Research
Máiréad Dunne
Centre for Higher Education Research, University of Sussex
December 2010
2
Abstract
This paper examines the attitudes and plans of Year 13 (final-year secondary school or ‘upper
sixth form’) pupils towards studying at university abroad. Our main empirical base is a
questionnaire survey of more than 1400 Year 13 pupils in a stratified sample of schools and
sixth-form colleges, both state and independent sector, in two parts of England (Brighton and
Sussex, and Leicester and Leicestershire). In addition, 15 face-to-face interviews were taken
with teachers and HE advisers in the schools surveyed, and follow-up telephone interviews
were made with 20 pupils from the questionnaire survey. The objectives of the research were,
firstly, to discover the proportions of school-leavers who are applying to study at a non-UK
university, or who had considered doing so but not actually gone ahead with the application,
and which countries and universities they were attracted to. Against this orientation to (think
about) studying abroad as the key dependent variable, the paper analyses several independent
variables, based on quantitative data drawn from the questionnaire results and informed by
insights from the qualitative interviews. These include pupils’ academic profile, type of school,
gender and ethnic heritage, parental socio-economic class, and family and personal links (prior
residence abroad, travel experiences, friends or relatives who had studied abroad etc.). Results
show that students applying abroad, or who considered this option, are academic high-
achievers and high-aspirers, more likely to come from independent schools, have parents who
are in the higher socio-occupational classes (managers, directors, professionals, teachers etc.)
and who are themselves graduates, and have family links and extensive travel experience
abroad. Females are slightly more likely to consider the study-abroad option. The relationship
with ethnicity is not clear, except that foreign-domiciled non-UK nationals have a greater
propensity to apply to non-UK universities, as do UK-nationals studying at international schools.
Overall, however, and for all groups surveyed and interviewed, the study-abroad strategy
appears to be supplementary to the dominance of what are widely perceived as the best UK
universities, above all Oxford, Cambridge, and the other Russell Group research-intensive
universities.
Introduction
Within the global thematic map of migration
studies – an interdisciplinary research field
nowadays of burgeoning scale – the
mobility of students has not been a major
focus of concern. Rather, in this so-called
‘age of migration’ (Castles and Miller
2009), the main academic and policy
interest has been concentrated on
‘economic’ migrants and on refugees and
asylum-seekers. However, there are signs
of a growing appreciation of the role of
students in the evolving patterns of
international mobility, not so much because
of their numbers – at around 3 million they
are a relatively small fraction of the overall
‘stock’ of 200 million international migrants
(King et al. 2010: 84-85) – but because of
their strategic importance as ‘elite’
migrants and as temporary sojourners who
may ‘convert’ into long-term skilled
immigrants after graduation in their chosen
destination country.
Existing studies of international student
mobility (ISM) tackle the phenomenon from
a number of different angles. From a
human and economic development
perspective, the main analytical lenses are
the ‘brain drain’ debate and the rise of
international student migration as a multi-
billion-dollar global business, where
countries like the USA, the UK and Australia
are the major beneficiaries (for introductory
overviews see Castles and Miller 2009:
140-142; Skeldon 1997: 108-112; for
more detailed treatments see de Wit et al.
2008; Hawthorne 2008; Varghese 2008).
Within Europe there has been much
interest in the ‘Erasmus phenomenon’ of
student exchanges and the ‘year abroad’
(see Bracht et al. 2006; Krazklewska and
Krupnik 2006; King and Ruiz-Gelices 2003;
Murphy-Lejeune 2002; Maiworm and

3
Teichler 1996). Other studies view ISM as
part of a broader canvas of ‘knowledge
mobility’ and the migration and circulation
of academic and scientific talent (Ackers
and Gill 2008; Byram and Dervin 2008;
Gürüz 2008; Solimano 2008).
Attempts to theoretically frame ISM reflect
some of the above perspectives (Findlay et
al. 2005, 2006: 292-294). It is seen as part
of skilled migration, either amongst highly-
developed countries or (with links to brain
drain) from lesser- to more-developed
countries; as part of the globalisation of
higher education; or as part of youth
mobility and consumption cultures in which
‘going abroad’ is seen as a rite of passage
and a means of accumulating ‘mobility
capital’ (Murphy-Lejeune 2002). In their
recent research on the international
mobility of Hong Kong and UK students,
Brooks and Waters have drawn attention to
the way in which ISM is embedded within
structures of social class reproduction and
elite formation (Brooks and Waters 2009;
Waters 2006, 2009; Waters and Brooks
2010).
Meanwhile, empirical studies (which
include much of the literature already cited
above) tend to focus either on students’
mobility behaviour and experiences whilst
they are abroad or survey their attitudes
and experiences of mobility post-
graduation. What is unique about the
research reported in this paper is that we
are surveying university applicants in their
final year of school or sixth-form college, i.e.
before they move into higher education.
From the point of view of migration
decision-making, such a move can be seen
as a threefold choice: to stay in the parental
home and go to a local university; to move
to a university in another part of the country
and hence move out of the parental home,
at least during term-time; or to go to
university abroad. As far as we are aware,
no survey of UK school-leavers’ attitudes
towards and plans for study abroad has
ever been carried out before.
Although the statistics suggest that the
number of UK-domiciled students heading
abroad to study is greatly outweighed – by
at least ten times – by foreign students
coming in, both flows are experiencing a
long-term rise in numbers (Findlay et al.
2009: 4-5). However, we need to be clear
about exactly what is being measured by
such statistics. Migration abroad and in-
migration for study purposes can include
study at various levels, not just university.
Especially within the higher education (HE)
sector we need to further distinguish
between degree mobility (students moving
to another country to take their entire
degree programme there) and credit
mobility (or ‘within-programme’ mobility)
whereby students move abroad for a
shorter period (typically a term, a semester
or a ‘year abroad’) which is contained within
their degree programme. Earlier work by
King and Ruiz-Gelices (2003) and then by
Findlay et al. (2005, 2006) focused on the
credit-mobility experiences of UK
undergraduate students; in the present
paper were are concerned only with degree
mobility, specifically the propensity of UK
school-leavers to apply to study at a non-UK
university or other HE institution. The
research was commissioned by the UK
government’s Department of Business,
Innovation and Skills (BIS).1
Two broad concerns drive public interest in
UK students’ degree mobility. One relates to
the government’s target of getting 40 rising
to 50 per cent of school-leavers into higher
1 The research was originally commissioned, via
competitive tender, by DIUS (the Department for
Innovation, Universities and Skills), which became
reconfigured into BIS during the period of the research
contract (2008-09). The research team for the DIUS/BIS
study was led by Allan Findlay at the University of Dundee
and Russell King at Sussex: several other colleagues at
both universities were also involved in various parts of the
research (Alistair Geddes, Fiona Smith and Alex Stam at
Dundee, Jill Ahrens, Máiréad Dunne and Ron Skeldon at
Sussex). The DIUS/BIS project comprised three main
elements: a metadata analysis of relevant statistics on UK
ISM in comparison with that on other countries (see
Findlay et al. 2010), a survey of UK school-leavers’
attitudes towards study abroad, and a survey of UK
students already studying at universities abroad – in North
America, Australia and various European countries. In the
present paper we explore the findings of the second of
these three studies. The overall results of the DIUS/BIS
research project were synthesised in Findlay and King
(2010), but this was mainly devoted to the first and third
of the three studies listed above.
4
education.2 ‘Leakage’ of UK-domiciled
students to non-UK universities, where they
are ‘lost’ from the national figures, could
therefore compromise achieving these
targets. This is the quantitative concern.
Second there is a qualitative component.
This refers to the issue of selectivity: is it
the ‘brightest and best’ of the UK’s aspiring
university students who seek to study
abroad, or are there other selection filters?
Research questions
This leads us to a more explicit statement
of research questions, limiting them to
those which can be realistically answered
by a fairly large-scale questionnaire survey
of ‘Year 13’ (final-year) school students who
have recently applied to university or other
form of HE. As we shall see, this statistical
evidence is supported by interviews with
sixth-form heads and HE advisers in a range
of different institutions, and follow-up
telephone interviews with a small sample of
school-leavers. The following questions
reflect those listed by the commissioning
body of this research.
1. What proportion of school-leavers
aspiring to enter HE are applying, or
thinking of applying, to study abroad?
2. For those who are applying, or
considering applying, to study abroad,
which countries, institutions, and
subject areas are they oriented
towards?
3. Does the type of school hold an
influence? The main contrast we wish
explore here is that between state
schools (comprehensives, sixth-form
colleges etc.) and the independent, fee-
paying sector. What kinds of
information, advice and support are
available within the school
environment? What kinds of direct
overseas linkages do schools have –
2 These targets were those of the previous Labour
government. The present Coalition government’s
commitment to attaining these targets may well be less.
school trips, exchanges, twinning
arrangements etc?
4. What is the academic profile of those
who wish to study abroad?
5. Are demographic factors relevant, such
as pupils’ gender and ethnic origin?
6. What is the role of parental educational
and occupational background in
framing the propensity to want, or be
advised, to pursue studies abroad?
7. What is the role of personal and family
links abroad? Here we aim to identify
the possible relevance of prior
residence outside the UK, travel and
holiday experience, parents’ foreign
residential history, and other family
members or close friends who have
studied at university abroad.
When we come to the results and analysis
part of this paper, we will revisit these
research questions and restate them in
more formalised hypotheses.
Research design and methodology
The core research instrument was a
questionnaire survey of 1400 sixth-form or
equivalent pupils, backed up by in-depth
interviews with 15 guidance teachers and
advisers charged with managing their
respective schools’ applications to
university. Most of the material in this
paper is derived from these two principal
research instruments. A third, relatively
minor, part of the research design was 20
follow-up telephone interviews with Year 13
university applicants who had applied to
study abroad, or thought about applying,
and who had indicated on their
questionnaire their willingness to be
contacted this way.
We selected two parts of England to
administer the questionnaire survey and
the teacher/adviser interviews: Brighton
and Sussex in the South East of England,
and Leicester and Leicestershire in the East
Midlands. Both areas consist of one
medium-sized city with a constellation of
surrounding smaller towns and rural
districts. Brighton/Sussex was deemed

5
Table 1 Target sample number for the Schools Survey
total state ind. boys girls achieved
Leicester
schools 700 350 350 350 350 1136
Sussex
schools 700 350 350 350 350 853
Totals 1400 700 700 700 700 1989
broadly representative of the more affluent
South of England, and Leicester(shire) of
the Midlands and North of England with
their heritage of industrial employment and
postwar immigration. Whilst the population
of Brighton and Sussex is predominantly
White, that of Leicester (less so the county)
contains substantial immigrant-origin
cohorts, especially from the Indian
subcontinent.
Within each region, our initial research
design identified a mix of state and private-
sector schools (with reserves in case of
refusals) to administer the questionnaire:
seven schools to be chosen in each area,
with a target of 700 completed
questionnaires, hence 1400 from the 14
English schools. The questionnaire samples
were equally divided by type of school (700
state, 700 independent, 350 of each in
each region) and by respondent gender
(700 males, 700 females, 350 in each
region).
Table 1 sets out this sample design, with
the numbers of questionnaires collected.
The schools were contacted in the summer
of 2008 in order to lay the groundwork for
the surveys and visits during the upcoming
Autumn Term (i.e. September to December
2008): letters and emails were sent, along
with follow-up telephone calls. Response
was patchy. Some schools agreed to
cooperate straightaway; others did not
respond; and some refusals were received.
Whilst it was gratifying to get the first
tranche of schools on board, the delays
(especially from those schools which
eventually said ‘no’) were frustrating.
For Leicester(shire) we carried out the
questionnaire survey in five independent
schools, one in the city of Leicester and four
elsewhere in the county, and in two sixth-
form colleges, both located in the city but
drawing in some pupils from the wider
county. Despite the imbalance in the
numbers of the two types of school, we
received more completed questionnaires
from the state sixth-from colleges, due to
their large size. Attempts to get cooperation
from the wider-age-range comprehensive
schools (11-18) were unsuccessful – all
three schools contacted eventually declined
to participate. Nevertheless, the requisite
targets were well exceeded, for all
subcategories.
In Sussex we needed to extend the sample
of schools surveyed from seven to eleven.
Eventually, the schools which agreed to
collaborate consisted of six independent
schools, two located in Brighton and four in
the county of Sussex. For the state sector,
five schools/colleges participated in the
survey. This group comprised one further
education college, two sixth-form colleges
and one comprehensive school, all situated
in Brighton and Hove, and another
comprehensive located in Sussex. All
contacted schools eventually agreed to take
part in the survey; however, the rate of
completed questionnaires was lower than
in the Leicester sample, and the Sussex
school sizes were on average smaller than
their Leicester counterparts. This is why we
had to enlarge the sample number of
institutions to eleven rather than the
original seven.
The questionnaire was drawn-up and
piloted in such a way as to ensure that
maximum relevant information could be
collected with minimal imposition on the
schools and their pupils. It took 15 minutes
6
to complete on average, with a range
between 10 and 20 minutes. It was filled in
on the hard-copy version, either in special
sessions (such as morning assembly)
organised by the schools with the
researchers present, or distributed via tutor
groups, and collected by the researchers on
a later visit or posted back to the research
team at the University of Sussex. The on-
site methods worked very well on the whole,
and we are extremely grateful to the
schools for facilitating this exercise.
The questionnaire was designed to provide
useful data to answer, or at least shed light
on, the research aims listed above. The
questionnaire was divided into five sections
that mainly involved closed questions,
simple to tick or write a one-word response,
with a few spaces for elaborations where it
was thought necessary or useful. Section 1
documents the respondents’ current
studies: A2 and AS levels or other
qualifications. Section 2 records past
studies, mainly GCSE grades. Section 3
asks the important questions about plans
to study at university, including universities
applied for. The key question here is 3.3
which asks about applying to study abroad
– whether respondents are actually doing
this; or whether they considered applying
abroad, but then decided not to. Other
questions in section 3 elicit motivation for
(not) applying to study abroad, levels of
information and guidance available etc.
Section 4 asks about pupils’ previous links
outside the UK (travel, holidays, residence
abroad), and section 5 collects general
demographic data, both for respondents
and their parents, including the education
and occupations of the latter.3
The second research instrument was a
target-sample of staff interviews. We
interviewed, in most institutions where the
questionnaire was administered, the
corresponding local ‘key informant’ –
usually the head of sixth form, HE adviser or
other such strategic person. These
interviews, which usually lasted between 20
minutes and one hour, yielded useful
3 The questionnaire is available to bona fide researchers
on request: please contact Russell King or Jill Ahrens.
insights based on the interviewees’
accumulated experience of monitoring HE
applications over many years. The staff
interviews were recorded (permission was
always sought, and granted in all cases)
and subsequently transcribed. The
interviewees were offered the chance to
check the transcripts for accuracy, which a
few respondents did, and the transcripts
revised accordingly.
In order to conform to ethical approval
guidelines and to undertakings to ensure
individuals’ confidentiality and school
anonymity, we do not name interviewees or
identify schools. In the analysis which
follows, schools (and interviewees within
each school) are coded in the following
manner (L stands for Leicester(shire); S for
Sussex, including Brighton):
L1 Independent day school, girls
L2 Independent day school, girls
L3 Independent day school, boys
L4 Ind. day/boarding school, mixed
L5 Ind. day/boarding school, mixed
L6 State sixth-form college, mixed
L7 State sixth-form college, mixed
S1 Ind. day/boarding school, girls
S2 Ind. day/boarding school, girls
S3 Ind. day/boarding school, mixed
S4 Ind. day/boarding school, mixed
S5 Ind. day/boarding school, mixed
S6 Ind. day/boarding school, mixed
S7 State FE college, mixed
S8 State sixth-form college, mixed
S9 State sixth-form college, mixed
S10 State comprehensive, mixed
S11 State comprehensive, mixed
The staff interview extracts will use the
above codes. In addition, and in order to
cover certain aspects of the situation in
London, we interviewed one HE adviser at a
large Inner-London sixth-form college. This
interview is coded IL1. For the small sample
of follow-up pupil interviews, we add ‘p’ to
the code as follows: Lp1, Sp3 etc.
Referring back to Table 1, it will be seen
that our target samples for schools in
7
England were 700 questionnaire returns in
Leicester(shire), 700 for Brighton and
Sussex, 700 state-school pupils, 700
independent-sector pupils, 700 males and
700 females, all subdivided into evenly-
matched quotas of 350 and 175 – e.g. 350
state-sector respondents in Leicester, made
up of 175 males and 175 females. The fact
that these targets were exceeded by some
margin meant that a random selection of
completed questionnaires for coding was
drawn from some schools where excessive
numbers of questionnaires were filled in.4
At this point we need to spell out a crucial
refinement which we make when
presenting the results pertaining to the key
question: ‘Have you ever thought about
applying to a non-UK university?’ (question
3.3 in the questionnaire). Three responses
are possible to this question: ‘Yes, and I am
in the process of applying’; ‘Yes, but in the
end I decided not to apply’; and ‘No’. The
refinement concerns the distinction
between UK-domiciled pupils and non-UK-
domiciled pupils. The latter group consists
primarily, if not exclusively, of foreign-
national pupils who have been sent to
England as boarders or in the care of
guardians in order to access British
secondary and probably higher education.
These students are, in a sense, moving in
the opposite direction to the UK students
considering moving to study abroad, who
are the main focus of this research. We
found that foreign pupils sent to schools in
the UK are also aiming to access (good)
British universities but, given their
international background, are also more
likely to consider applying to universities
abroad as well.5
4 It was tempting to code up all completed questionnaires;
however this would have unbalanced the carefully
stratified nature of the total sample. For instance, we had
a greater excess of questionnaires from Leicester than for
Sussex, and for state schools than for independents. 5 We were not alone in being surprised at the existence of
this partially ‘hidden’ population of foreign students in UK
schools. A recent Times Higher Education article
commented on the discrepancy between estimates of
overseas students in British universities according to
whether the students are classified by nationality
(513,570 in 2007-08) or by domicile when applying
(389,330). The inference here is that almost 125,000
overseas students have applied from a UK domicile – as
How to separate out these two categories of
respondents was not simple. It was decided
not to ask the explicit nationality question
because of it potential sensitivity in certain
cases – pupils may have been uncertain
over their precise nationality, or be refugees
or asylum-seekers. Accordingly we
identified the non-UK-domiciled and foreign
nationals indirectly by their answers to
several questions: if they had been resident
outside the UK for more than ten years
(question 4.2), if they had been born
outside the UK (question 5.4), their ethnic
origin (i.e. other than White-UK/Irish,
question 5.5.), their parents’ residence
(5.6), plus any clues given in ‘open’
answers to other questions (e.g. ‘I may
return to Hong Kong for university’).
As a result of this refinement to our
respondent categories, we have alongside
the ‘non-abroad-oriented’ respondents
(those who answered ‘No’ to question 3.3),
two comparator samples. We term these as
follows:
1. The ‘standard sample’ – this is the
number of respondents in the overall
sample (n=1400) who answered
positively to the study-abroad question,
either in terms of actually applying to
study abroad (n=101) or of having
thought about it but then not done so
(n=182).
2. The ‘narrow sample’ – as above but
minus those who are, on the
questionnaire evidence, highly likely to
be non-UK students (n=159, so the
total narrow sample becomes 1241).
This reduces the two ‘positive’
response categories to n=50 and
n=154 respectively.
To clarify these two categories a little
further: 1 is broadly representative of the
Year 13 pupil population, with the caveat
that the stratified sample division (50 per
cent each for state and independent sector
schools) does not reflect the real division
between the two (which is actually more like
89 and 11 per cent); and 2 is broadly
representative of the UK-national Year 13
boarders or whilst attending a UK language or foundation
course (Gill 2009).
8
population (subject to the same caveat).
Our reasons for an equal sample
stratification between state and
independent schools, rather than a
representative sample divide, will become
apparent later.
Results
We divide the presentation of our survey
results into several subsections. We start
with the basic questions, how many and
what proportions of university applications
are applying to study abroad, or have at
least thought about this possibility? We
then move on to examine the
characteristics of the prospectively
internationally mobile pupils/students and
the potential factors which discriminate
them from those, the vast majority, who do
not have the same inclinations to pursue
their university degrees outside the UK.
Throughout the analysis, we mix
questionnaire results with extracts from
interviews with teachers and HE advisers in
the schools surveyed and with occasional
quotes from the telephone interviews with
pupils.6
How many and what proportions?
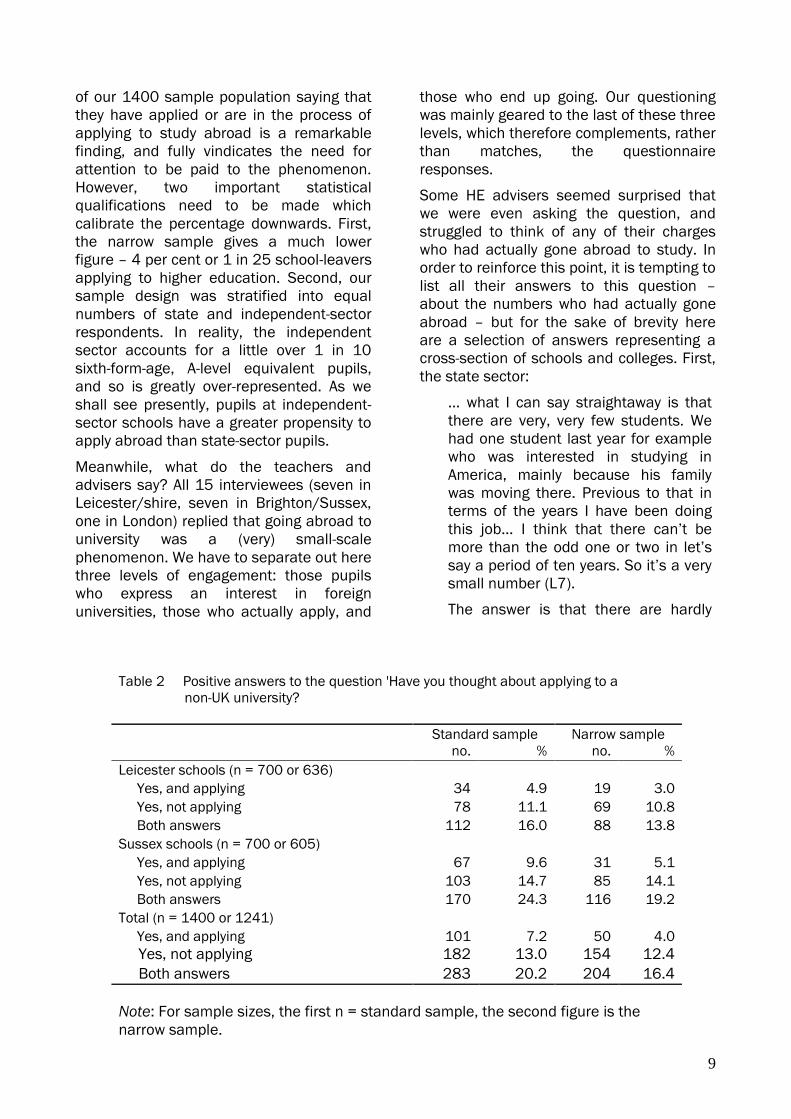
Table 2 sets out the questionnaire results
for answers to the key question 3.3: ‘Have
you ever thought about applying to a non-
UK university?’ Responses to the two
possible positive answers are tabulated for
the two sample types described above,
together with the percentage proportions,
for both the Leicester sample and the
Sussex sample, as well as the total sample.
For the standard sample the totals are 700
each for Leicester and Sussex and 1400
overall; for the narrow sample, net of the
overseas pupils, the totals are 636 for
Leicester and 605 for Sussex. In other
6 It has to be said that the telephone interviews with pupils
did not work very well. Often it was difficult to find a time
(either cold-calling or by prior emailing) to have the
conversation, and their recollections of filling out the
questionnaire were sometimes very vague. We attained
the target of 20 interviews, but many of them were very
short.
words, overseas pupils are more numerous
in our Sussex sample of schools than they
are in Leicester – 95 vs. 64.
Three trends can be noted from this table.
First, there is a big difference between
those who merely thought about applying
abroad, and those who are actually
applying. For instance, taking the total
narrow sample, less than a quarter of those
who considered applying abroad actually
went ahead and did so or are in the process
of doing so (50 out of 204).
Second, the proportions are much lower for
the narrow sample (where the non-UK
pupils are taken out) than for the standard
sample. These inter-column differences are
much greater for the first of the two positive
answers (the ‘pro-active’ answer) than they
are for the second. This means that non-UK
pupils who are sent to British schools from
abroad are more likely to be committed to
applying to university abroad than are UK-
domiciled pupils. And this is the case even
though the precise purpose of many
overseas pupils coming to UK schools or
sixth-forms is to use this as a means to
access good universities in Britain. We
return to this point later on.
Thirdly, pupils from the Sussex schools are
more oriented to the possibility of studying
abroad than those from Leicester(shire).
Taking the ‘standard sample’ data, twice as
many Sussex respondents declared that
they were applying to study abroad than
Leicester pupils (67 vs. 34, or 1 in 10
compared to 1 in 20). However, these
differences attenuate (but remain
noticeable) when we look at the other
answer (‘thought about applying, but did
not’) and when we shift across to the
‘narrow sample’ columns. This is partly
explained by the greater difference between
the sizes of the two sample types for
Sussex (standard sample 170, narrow 116)
than for Leicester (standard 112, narrow
88), reflecting the already-noted fact that
Sussex schools attract a higher number of
foreign students into their sixth forms.
Beyond these three trends, the overall
significance of these findings needs to be
brought out. To have more than 7 per cent
9
of our 1400 sample population saying that
they have applied or are in the process of
applying to study abroad is a remarkable
finding, and fully vindicates the need for
attention to be paid to the phenomenon.
However, two important statistical
qualifications need to be made which
calibrate the percentage downwards. First,
the narrow sample gives a much lower
figure – 4 per cent or 1 in 25 school-leavers
applying to higher education. Second, our
sample design was stratified into equal
numbers of state and independent-sector
respondents. In reality, the independent
sector accounts for a little over 1 in 10
sixth-form-age, A-level equivalent pupils,
and so is greatly over-represented. As we
shall see presently, pupils at independent-
sector schools have a greater propensity to
apply abroad than state-sector pupils.
Meanwhile, what do the teachers and
advisers say? All 15 interviewees (seven in
Leicester/shire, seven in Brighton/Sussex,
one in London) replied that going abroad to
university was a (very) small-scale
phenomenon. We have to separate out here
three levels of engagement: those pupils
who express an interest in foreign
universities, those who actually apply, and
those who end up going. Our questioning
was mainly geared to the last of these three
levels, which therefore complements, rather
than matches, the questionnaire
responses.
Some HE advisers seemed surprised that
we were even asking the question, and
struggled to think of any of their charges
who had actually gone abroad to study. In
order to reinforce this point, it is tempting to
list all their answers to this question –
about the numbers who had actually gone
abroad – but for the sake of brevity here
are a selection of answers representing a
cross-section of schools and colleges. First,
the state sector:
… what I can say straightaway is that
there are very, very few students. We
had one student last year for example
who was interested in studying in
America, mainly because his family
was moving there. Previous to that in
terms of the years I have been doing
this job… I think that there can’t be
more than the odd one or two in let’s
say a period of ten years. So it’s a very
small number (L7).
The answer is that there are hardly
Table 2 Positive answers to the question 'Have you thought about applying to a
non-UK university?
Standard sample Narrow sample
no. % no. %
Leicester schools (n = 700 or 636)
Yes, and applying 34 4.9 19 3.0
Yes, not applying 78 11.1 69 10.8
Both answers 112 16.0 88 13.8
Sussex schools (n = 700 or 605)
Yes, and applying 67 9.6 31 5.1
Yes, not applying 103 14.7 85 14.1
Both answers 170 24.3 116 19.2
Total (n = 1400 or 1241)
Yes, and applying 101 7.2 50 4.0
Yes, not applying 182 13.0 154 12.4
Both answers 283 20.2 204 16.4
Note: For sample sizes, the first n = standard sample, the second figure is the
narrow sample.
10
any. I can’t remember the last time we
had an application to an overseas
institution… it’s so rare you would
notice it (S7).
These answers are all the more significant
because they are from informants
representing large institutions – amongst
the largest we surveyed.
From the independent sector the answers
were a bit more varied. Whilst some,
especially the smaller schools containing
wholly or mainly day-pupils, reinforced the
‘hardly any’ picture given above, the private
boarding schools have a slightly different
story to tell. L1 is Head of Sixth Form in a
small independent day girls school:
In the seven years I have been here in
post, none have gone. We have had
experience of Erasmus years, but
nobody has actually gone abroad to
study (L1).
Other, larger independents, but still (mainly)
day schools, were not much different:
I would say that it is extremely small. I
have one year 12 student currently
looking into going to Art School in
Bilbao in Spain. Her mother is Spanish
and she is a fluent Spanish speaker
and she is quite seriously looking at
that… We have one or two pupils with
an Irish background who look into the
Irish universities but as yet I am not
aware that any have gone. I usually in
every year get one or two enquiries
about American universities, but it
doesn’t materialise (L2).
Well, very few in fact. We have a
handful of overseas pupils who might
look at going back to their home
country. But in terms of UK born and
bred pupils, some of them might be
interested in going to America. Very,
very few might be interested in
mainland Europe or something like
Australia, but apart from that they all
go for UK universities (S3).
The schools where there does seem to be a
stronger (but still very much minority-scale)
interest in studying abroad are the more
prestigious ‘public schools’, especially
those with a strong presence of boarders.
Four examples, two each from schools in
Leicestershire and Sussex:
OK, the general profile is that there are
relatively few students that go… to
overseas universities. There are
usually half a dozen a year that
express an interest in American
universities. Last year we had
someone go to McGill, that was partly
because he had Canadian
connections. This year we have
somebody… who is actually half-
Australian… and he is going to go to
university in Australia (L4).
… if I think about the last few years,
America was their intended destination
[of those who apply overseas] and they
tend to be quite a broad range of
universities, not just the ones we
know; universities that I would never
have heard of… The nations [of
destination] tend to be America and
the Irish Republic… but we are talking
small, very small numbers (L5).
We’ve had a fair number, obviously
smaller than the ones that go to British
universities. I would say 5 or 6 every
year [to the United States] and we
have had girls go to Australia and
Canada. I think it is partly the make-up
of the students we have, because they
are all very international. So the idea of
going abroad is already part of their
make-up. But the American
universities are obviously the second
choice… not the second choice but the
alternative to the UK universities. [As
for European universities] very few,
hardly any I think (S1).
Not that many really… single figures.
There are quite a lot of possibilities in
America and really not any applications
to any European universities… We
have many talented sportsmen who
could be applying to American
universities with scholarships… but
they are not doing that in significant
numbers (S4).
11
To round off this first series of interviews on
numbers applying (and going) abroad, we
can hear from the HE adviser to a large,
ethnically diverse, sixth-form college in
Inner London:
Only a few end up going abroad. I would
say out of a year group of 400 or 500
students we would get only a handful
who would actually go ahead and
apply… maybe one per cent… Usually
[to] America, occasionally Canada.
Occasionally we get the sports
scholarship type student (IL1).
Although few of the staff interviewees were
able to give precise percentages on how
many pupils had applied (or had actually
gone) to study abroad, we have the
impression that the figures and estimates
given (‘hardly any’, ‘only a handful’ etc.),
when measured against the sizes of the
schools’ university-applicant cohorts, were
less than 1-2 per cent, and therefore below
the outcomes given on Table 2.
If there is a discrepancy, why might pupils
have higher study-abroad inclinations than
their teachers think they have? We suggest
a number of reasons.
First, teachers were more focused on the
relatively few cases of (former) pupils who
had actually gone to study abroad, whereas
the questionnaire respondents were
replying on the basis of thinking of studying
abroad. If we consider the ‘middle ground’
of those who had actually made
applications, we can observe more
congruence, although the teachers’
evidence is mainly impressionistic rather
than statistical.
Second, applications might be made
without the teachers knowing. The teachers
and advisers are mostly responsible for
managing the UCAS system of applying to
UK institutions of higher education. Pupils
might be working with the help of their
parents, friends or private tutors to make
applications abroad, unbeknownst to their
schools. Or, pupils might be planning a Gap
Year and thinking of applying abroad at a
later stage. A few of the teachers admitted
to these possibilities:
So when they go off and make their
own research [referring to those
looking for sports scholarships
abroad], we don’t know if they made
the application. If it’s not through the
normal UCAS process we’re not going
to pick them up (S9).
One thing I haven’t mentioned so far…
these medical schools in Prague that
teach in English… We’ve had a few
boys who haven’t made the cut
expressing an interest in them, so
these would be post-A-level
applications… A few boys looked into it
and one boy applied and I know he
didn’t take up the offer because he
was going to take a Gap Year instead. I
have no idea if he is intending to re-
apply (L3).
We are led to conclude that this factor of
teacher/adviser ignorance must be very
relevant. As the two quotes above indicate,
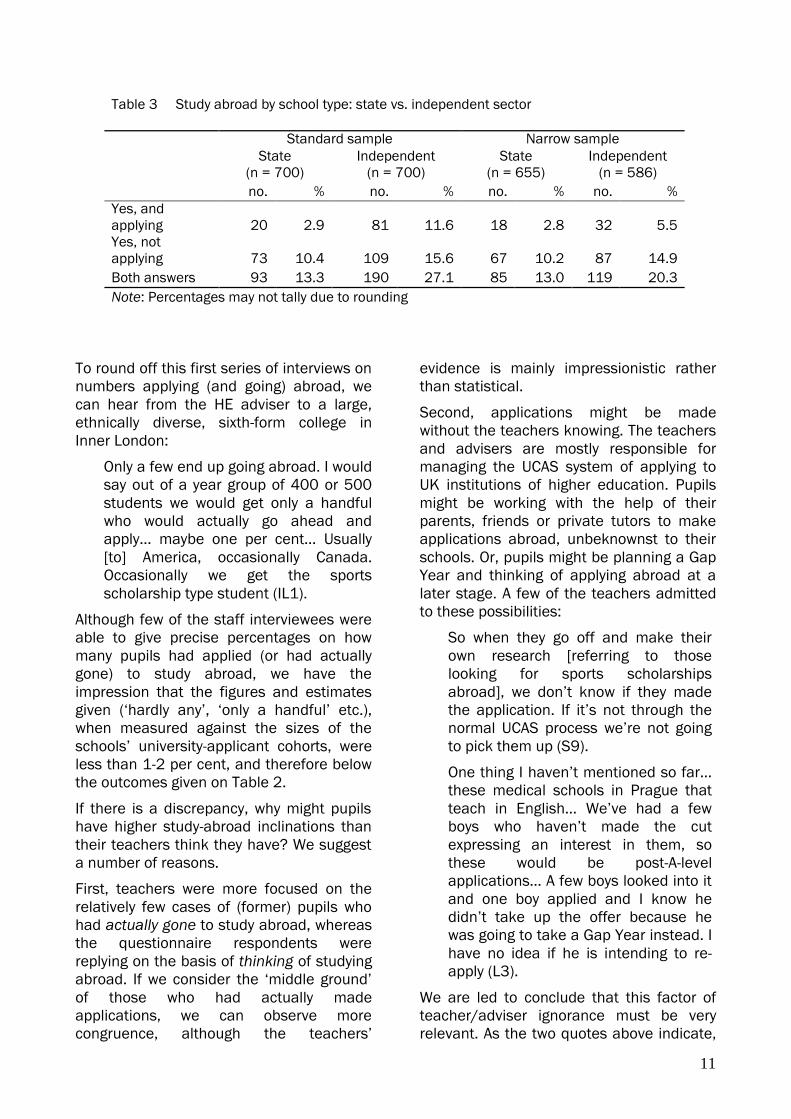
Table 3 Study abroad by school type: state vs. independent sector
Standard sample Narrow sample
State
(n = 700)
Independent
(n = 700)
State
(n = 655)
Independent
(n = 586)
no. % no. % no. % no. %
Yes, and
applying 20 2.9 81 11.6 18 2.8 32 5.5
Yes, not
applying 73 10.4 109 15.6 67 10.2 87 14.9
Both answers 93 13.3 190 27.1 85 13.0 119 20.3
Note: Percentages may not tally due to rounding
12
teachers’ main task, and hence their socio-
psychological (if not financial) ‘reward’, is to
get their pupils into (good) UK universities.
There is probably no reward for placing
them abroad, and this is mainly outside
their job remit as they see it.
Third, pupils may have inserted a positive
answer to question 3.3 on a partial
misinterpretation that it could also refer to
UK degrees with a year or semester at a
foreign university.7 Certainly many teachers
and advisers – virtually all of them in fact –
mentioned that the ‘Erasmus route’ of
studying abroad for up to a year within the
framework of a UK degree was a more
attractive proposition than doing the entire
degree at a foreign university. Two typical
quotes:
They are interested in studying abroad,
they are interested in universities that
offer an Erasmus year… They like the
idea of having a British base and of
having a year in the middle and
spending it abroad (L1).
I think that those who have done
Modern Languages are more likely to
apply to a UK university that offers the
Erasmus scheme or would be looking
to a university that offers a one-year
placement abroad as part of the
degree course [than apply to do a full
programme abroad] (L5).
Fourth, whilst recording students who have
left to study abroad or who are actually
applying to do so is a relatively objective
measure, the notion of having ‘thought of’
studying abroad is far more imprecise,
ranging from serious consideration and
active research into the options, to a
fleeting thought or passing whim. No doubt
the relatively much greater share of
students (around one eighth) who ticked
the response ‘I thought about it but decided
not to apply abroad’ embraces a range of
depth of ‘thought’. Teacher and adviser
interviews again shed light on this process,
7 The questionnaire wording was quite clear that this is not
what is being asked, but given the circumstances in which
the survey was carried out – often in a crowded hall with
limited time to think and concentrate – we cannot
discount this possibility.
stressing in particular that it is often a
passing phase whereby interest dissipates
when the actual form-filling stage arrives.
… we start with the students in their
first year here when they are doing
their AS levels… we start doing some
intensive work with them in January
and February and at that stage you’ll
find quite a number of them that will
say ‘Yeah, I’m interested in the idea of
studying abroad’ – that is their first
answer… [But] when they get to the
nitty-gritty stage of actually applying…
something seems to happen by the 9
or 10 months later when they start
applying. Maybe it’s just the realities of
distance and families and things like
that… I also think by the nature of the
way the UCAS application timescales
work, it dominates everything, so they
have to sort it out… (IL1).
You can certainly have students… I
have students come to me and talk
about applying to America, but usually
nothing comes of it. It’s all talk and
they end up applying for home
universities (S7).
Overall, we are unable to gauge the precise
relevance of any of these four factors in
boosting the pupils’ feelings and actions
towards studying abroad beyond what the
teachers seem to be saying. However, it is
our considered opinion that the main
reason for the discrepancy is simply that
the teachers do not know what is
happening with regard to international
flows. This is a disappointing finding in one
sense, but it does have important policy
implications. The key policy question is
whether teachers should be encouraged to
support international applications to non-
UK universities. If this route saves the tax-
payer money, and if it helps to train a
British-national educational elite via study
at the world’s leading universities, then the
answer is ‘yes’. If, on the other hand, there
is concerns about a 1960s-style ‘brain-
drain’, then the answer might be ‘no’. It is
also regrettable that there is no national (or
international) database which makes it
possible to know how many school-leavers
apply and finally go to study abroad.
13
State vs. independent sector
Prior quotes given in the earlier sections of
this report have indicated that applying to
study abroad seems to be heavily
associated with independent or private
schools. Interviews with state-school staff
often referred to the likelihood of greater
numbers from the independent schools
being interested in studying at university
abroad, and these latter schools are also
where the bulk of the overseas boarding
pupils are enrolled.
Table 3 provides the statistical evidence.
We can see that, for respondents applying
abroad in the standard sample, the
independent-sector rate is four times that
of the state sector: 11.6 vs. 2.9 per cent.
However, moving across to the narrow
sample, where the non-UK pupils, who are
far more numerous in independent schools,
are filtered out, we can observe that this
differential narrows appreciably to 5.5 vs.
2.8 per cent. For the other variant answer –
‘Yes, I thought about applying abroad, but
decided not to go ahead’ – the inter-sector
contrast remains clear, but the contrast is
not so strong, especially for the narrow
sample. However, given the fuzziness of the
notion of ‘thought about it’ noted earlier,
the key comparison should be those pupils
who actually apply to study abroad; and
here the differential is sharper, with
independent-sector pupils about twice as
likely to apply abroad as state-sector pupils
in the narrow sample, and 50 per cent
more likely to think about this option but
not actually apply.
It is perhaps useful to include here a few
comments on the patterns of university
applications within the UK. Although this is
outside the strict remit of our research for
this paper, it provides useful context and
furthermore brings out a different aspect of
the contrast between the state and
independent sectors.8 The independent
schools are very much geared to getting
virtually 100 per cent of their pupils into
(good) universities – after all, this is what
8 On the changing patterns of ‘going away to uni’ see
Christie (2007); Holdsworth (2009); and for the US case
Mulder and Clark (2002).
the fee-paying parents have invested in.
The key term which cropped up in every
independent school interview, and in the
more academically oriented sixth forms,
was Russell Group, referring to the well-
established research universities –
generally large universities in big or
medium-sized cities. Of course, Oxford and
Cambridge are the prime targets for the
best students, and the numbers getting in
to Oxbridge are seen as a key indicator of a
school’s prestige.
We illustrate some of these characteristics
by two interview extracts from the Leicester
survey, one from an independent school
one from a state-sector sixth-form college.
Setting aside the small minority of pupils
who apply abroad, these interview quotes
exemplify the clear, but differentiated,
geographical component that exists in
application patterns.
For Leicester independent schools, the
main targets, beyond Oxbridge, were the
Russell Group universities ranging along the
M1/A1 corridor, from the London University
colleges up to Nottingham, Sheffield, Leeds
etc.
… 100 per cent go to university. We
are a small selective school and they
are quite high achievers… Without it
ever being stated it is part of the
culture… part of the expectation of the
school that you go to university… The
majority are Russell Group
universities… the most popular last
year were Birmingham, Nottingham is
very popular… Sheffield, Leeds… these
are the universities… We also get every
year three or four into Oxford or
Cambridge, mainly Cambridge… four
applied last year and three got in (L1).
For the state schools, the picture is more
varied, dependent above all on the social
background of the pupils and, especially in
Leicester, their ethnic heritage as well. L6 is
a large, socially and ethnically diverse,
sixth-form college which draws students
from the city of Leicester and beyond, and
sends around 85 per cent of its school-
leavers into some form of HE.
14
Somewhere in the region of 70 per
cent of our students are of non-white-
British origin… Asian and Black African,
now more East European… [Some of]
these students come to us not having
been in the country very long… So the
cultural mix is extreme and the social
mix probably equally diverse… The
higher socio-economic groups are
definitely students who have come to
us through the county schools…
[Regarding universities] Midland
universities, and that is culturally
driven, it’s about Asian students not
moving away from home. So Leicester,
DMU [De Montfort University],
Coventry, Aston, Warwick and to some
extent the Nottingham universities…
and Birmingham and maybe I should
add Loughborough as well… these are
the main attractors… I mean it’s nice
that we are next to what was voted
‘University of the Year’ [Leicester
University], so why would you want to
move somewhere else if that is on your
doorstep? It is the cultural expectation
of these kids [referring to the Asian-
heritage pupils] and it is particularly for
girls to stay at home… [The white
population] are far more diverse
across the country and take the gap
years… (L6).
The Sussex staff interviews generally
backed up the trends noted above, except
that the county’s geographical location (less
centrally placed within England than
Leicester) and its much smaller numbers of
minority ethnic origin students tended to
dampen down the ‘local effect’ in the
pattern of applications. For the
independents, Oxbridge and the rest of the
Russell Group once again reign supreme:
About 10 to 12 per cent of the year
group would go to Oxbridge… And the
rest would aim at the Russell
universities… Warwick, Bristol, London
– UCL, KCL and Imperial are popular,
York to some extent, Edinburgh is quite
popular, Bath, Loughborough, UEA, a
little bit of Leicester, Leeds… So, a fair
spread (S3).
And as regards the Sussex state-school
perspective, here is a typical quote from
one of the Brighton sixth-form colleges:
The majority [referring to the last few
years] went to London and the South
East… one or two going to Scottish
universities, not very many. Another
year there was a move towards Leeds,
Sheffield, Liverpool and Manchester,
so it varies a bit from year to year…
[However] I think there was a shift to
more local universities after the
finance changed [referring to the
introduction of fees]… Ethnic
minorities want to stay in Brighton…
but that would be only a few students
[since they are not numerous at the
college]… (S8).
Having sustained the hypothesis that
orientation to studying abroad is stronger
amongst pupils in the independent sector,
and having explored some aspects of the
contextual geography of applications to UK
universities, it is clear that there are further
relationships between propensity to look
abroad to study and other factors of an
academic, cultural and socio-economic
nature. These are dealt with in subsequent
sections of the report; for now we round off
this discussion on state vs. independent
schools by returning to the all-important
numbers question.
To do this we combine the statistical
findings from Tables 2 and 3, and re-
balance them by the proportionate national
(English) data on 16-18 year-old pupil
enrolment in state and independent
school/colleges. Table 2 showed that 7.2
per cent of the standard sample and 4.0
per cent of the narrow sample were
applying abroad, but these figures were
based on a 50:50 sample split between
state and independent schools. Table 3
separated the standard and narrow sample
findings on ‘study abroad’ into state and
independent sector. Table 4 provides a
revised set of estimates for the proportions
applying abroad (and also ‘thought about
it’), taking into account the ratio of state vs.
independent pupils aged 16-18 and taking
one or more A-levels or A-level equivalents
in England in 2007-08. This ratio is 89.1
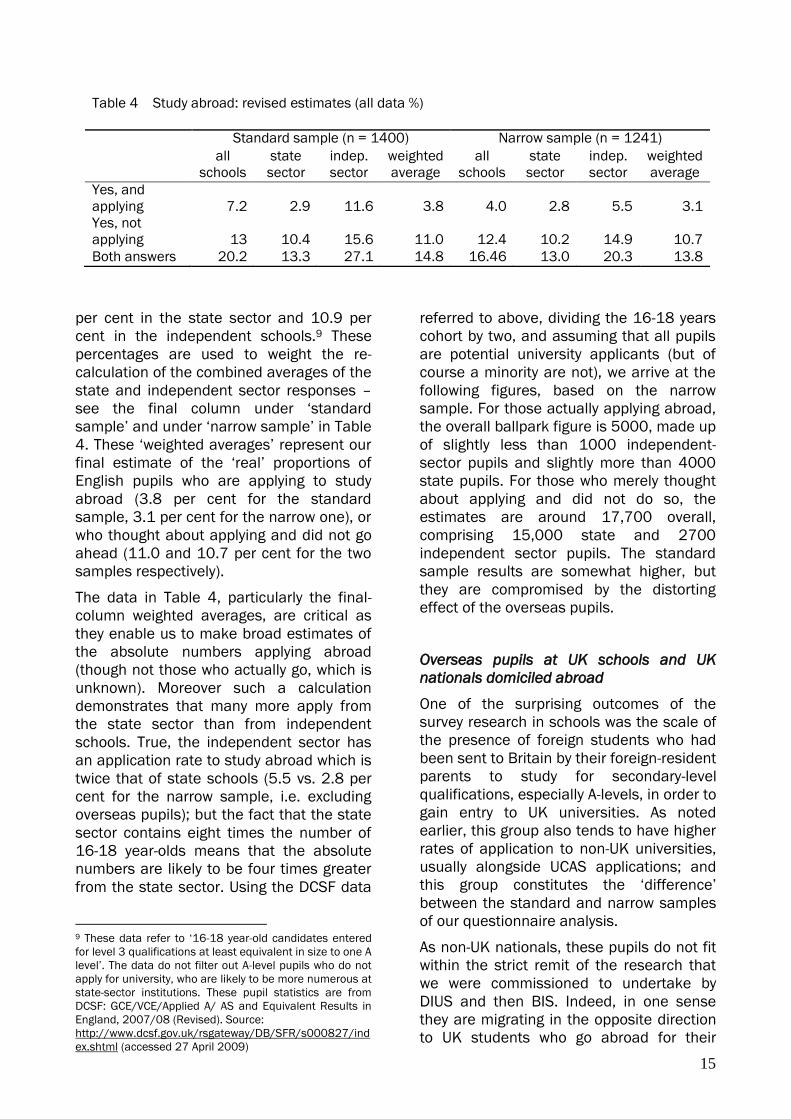
15
per cent in the state sector and 10.9 per
cent in the independent schools.9 These
percentages are used to weight the re-
calculation of the combined averages of the
state and independent sector responses –
see the final column under ‘standard
sample’ and under ‘narrow sample’ in Table
4. These ‘weighted averages’ represent our
final estimate of the ‘real’ proportions of
English pupils who are applying to study
abroad (3.8 per cent for the standard
sample, 3.1 per cent for the narrow one), or
who thought about applying and did not go
ahead (11.0 and 10.7 per cent for the two
samples respectively).
The data in Table 4, particularly the final-
column weighted averages, are critical as
they enable us to make broad estimates of
the absolute numbers applying abroad
(though not those who actually go, which is
unknown). Moreover such a calculation
demonstrates that many more apply from
the state sector than from independent
schools. True, the independent sector has
an application rate to study abroad which is
twice that of state schools (5.5 vs. 2.8 per
cent for the narrow sample, i.e. excluding
overseas pupils); but the fact that the state
sector contains eight times the number of
16-18 year-olds means that the absolute
numbers are likely to be four times greater
from the state sector. Using the DCSF data
9 These data refer to ‘16-18 year-old candidates entered
for level 3 qualifications at least equivalent in size to one A
level’. The data do not filter out A-level pupils who do not
apply for university, who are likely to be more numerous at
state-sector institutions. These pupil statistics are from
DCSF: GCE/VCE/Applied A/ AS and Equivalent Results in
England, 2007/08 (Revised). Source:
http://www.dcsf.gov.uk/rsgateway/DB/SFR/s000827/ind
ex.shtml (accessed 27 April 2009)
referred to above, dividing the 16-18 years
cohort by two, and assuming that all pupils
are potential university applicants (but of
course a minority are not), we arrive at the
following figures, based on the narrow
sample. For those actually applying abroad,
the overall ballpark figure is 5000, made up
of slightly less than 1000 independent-
sector pupils and slightly more than 4000
state pupils. For those who merely thought
about applying and did not do so, the
estimates are around 17,700 overall,
comprising 15,000 state and 2700
independent sector pupils. The standard
sample results are somewhat higher, but
they are compromised by the distorting
effect of the overseas pupils.
Overseas pupils at UK schools and UK
nationals domiciled abroad
One of the surprising outcomes of the
survey research in schools was the scale of
the presence of foreign students who had
been sent to Britain by their foreign-resident
parents to study for secondary-level
qualifications, especially A-levels, in order to
gain entry to UK universities. As noted
earlier, this group also tends to have higher
rates of application to non-UK universities,
usually alongside UCAS applications; and
this group constitutes the ‘difference’
between the standard and narrow samples
of our questionnaire analysis.
As non-UK nationals, these pupils do not fit
within the strict remit of the research that
we were commissioned to undertake by
DIUS and then BIS. Indeed, in one sense
they are migrating in the opposite direction
to UK students who go abroad for their
Table 4 Study abroad: revised estimates (all data %)
Standard sample (n = 1400) Narrow sample (n = 1241)
all
schools
state
sector
indep.
sector
weighted
average
all
schools
state
sector
indep.
sector
weighted
average
Yes, and
applying 7.2 2.9 11.6 3.8 4.0 2.8 5.5 3.1
Yes, not
applying 13 10.4 15.6 11.0 12.4 10.2 14.9 10.7
Both answers 20.2 13.3 27.1 14.8 16.46 13.0 20.3 13.8
16
university education. But they are worth
saying a little bit about, for several reasons.
First, they are a significant presence in A-
level cohorts, especially in independent
boarding schools (although their presence
is not restricted to this type of school).
Second, their disproportionate presence
amongst those who answered some form of
‘Yes’ to question 3.3 complicates the
statistical picture. And third, for the UK’s
graduate labour market, their passage
through the second- and third-level
education system in Britain, especially if
they stay on after graduating, acts as a
compensating flow for the ‘loss’ of UK-
nationals who opt to study abroad. So, one
country’s ‘brain drain’ is another’s ‘brain
gain’; and in the case of the UK, brain drain
and gain might be occurring
simultaneously. For the time being we do no
more than signal this phenomenon as one
worthy of further research, and make a few
summary points based on evidence from
the interview material. In fact, teachers and
advisers had more information about these
overseas pupils and seemed more
interested in talking about them than they
did about what they saw as the more
tenuous issue of local students applying to
study abroad.
Although many foreign nationalities are
present in Britain’s schools (school S1
claimed to have pupils from 54 different
countries!), four groups stood out as the
main ones reported by the interviewees:
Chinese, East Europeans (mainly Russians),
Germans and Nigerians. These pupils
generally come from wealthy and privileged
backgrounds in their home countries, and
are sent to often expensive independent
schools in England in order to use these as
stepping-stones to the best universities,
above all Oxford and Cambridge, but also
the LSE. But they may ‘hedge their bets’ by
also applying to the top Ivy League
universities in the US. And some will return
to universities in their home countries,
especially where there are good universities
to fall back on.10
10 Such as the University of Hong Kong, the National
University of Singapore, and the top German universities.
The following interview extracts, selected
from a much larger volume of insightful
information, give some pointers about the
non-UK students and their application
strategies for university.
We have a small boarding community
of about 30 boys… The profile of the
boarders is primarily Far Eastern –
Chinese, Hong Kong Chinese, Korean.
They have come into the country with
the aim to go to a British university. So
they are all looking to go to Oxford,
Cambridge and the London colleges.
There is an obsession with the LSE –
they have quite a narrow view of
British universities… But we have had
in the past… candidates from either
Africa or the Middle East who have
come here to do A-Levels and then go
to American universities. Last year our
only candidate that went abroad was a
Middle Eastern candidate – he is from
Dubai – who went to study Medicine in
California (L3).
We have got an international
community. We offer a British education
and that is why the international
students come… on the last count we
had students from 54 countries of the
world. Quite a number from Asia; a
growing number from Europe,
particularly from Eastern Europe. They
used to be from Russia exclusively, but
now they are also from the Ukraine and
places like Latvia… Let me think – when
I say Asia, there are quite a variety of
Asian girls from a variety of countries.
We get a couple from America and quite
a large number from Nigeria and other
places in Africa… a few German girls
because it ties in with their German
system… [For the overseas pupils] I am
thinking American universities… actually
there is also Hong Kong. For some it is
because they are from that part of the
world. Quite a lot of them would choose
the American universities because of
the Liberal Arts approach… they see that
as attractive. A lot of them have the Ivy
League… or their parents have the Ivy
Leagues in their heads, it is just a strong
appeal. Particularly for girls that
17
wouldn’t get in [to Oxbridge]… nearly all
of them would put in a British
application at the same time. They do it
dual, and if they don’t get into Oxford
and Cambridge, they want them to get
into Harvard. The Hong Kong Chinese
are slightly different, because again they
put in dual application and if they don’t
succeed over here, their fallback is to go
to Hong Kong (S1).
Intriguingly, the overseas pupils studying in
English schools have their mirror-image in
the form of UK-nationals studying at
international schools abroad. Yet in some
respects the behaviour of the latter group is
quite different. Questionnaire data from a
small-scale survey of UK-nationals at
international schools in Europe (107 pupils
responded) reveals that 93 per cent were in
the process of applying to study abroad (i.e.
outside the country where they are currently
studying); of these, two-thirds were applying
to UK universities (not necessarily
exclusively).11 Only 3 per cent of the
international-school sample had thought
about applying abroad but did not go
ahead, and only 4 per cent had not
contemplated foreign study. The general
picture from the international schools is
that the best students academically are
those who are set on getting into UK
universities, using other countries’
universities as a back-up. Nevertheless,
despite this UK-orientation, international
schools’ UK-national pupils do have a
higher tendency than UK-resident pupils to
apply to non-UK universities, so this
channel of higher education international
mobility should not be ignored.
Countries targeted
The interview extracts from the teachers
and advisers quoted earlier give a clear
indication of the range of countries which
are targeted by pupils aspiring or thinking
to move abroad for their higher education.
11 This survey was administered by Allan Findlay and his
colleagues at Dundee, who sent the questionnaire to a
small selection of European international schools where
there were significant numbers of sons and daughters of
British ‘expats’ attending.
Summing up from the various quotes
already given, the English-speaking
countries loom large, above all the United
States, Canada, Australia and Ireland.
Additionally, some of the foreign students
will return to their home countries for their
university education, either as a fall-back to
not getting into world-class universities,
such as the Hong Kong Chinese (see the
quote immediately above), or as part of
their planned educational progression, such
as many of the Germans.
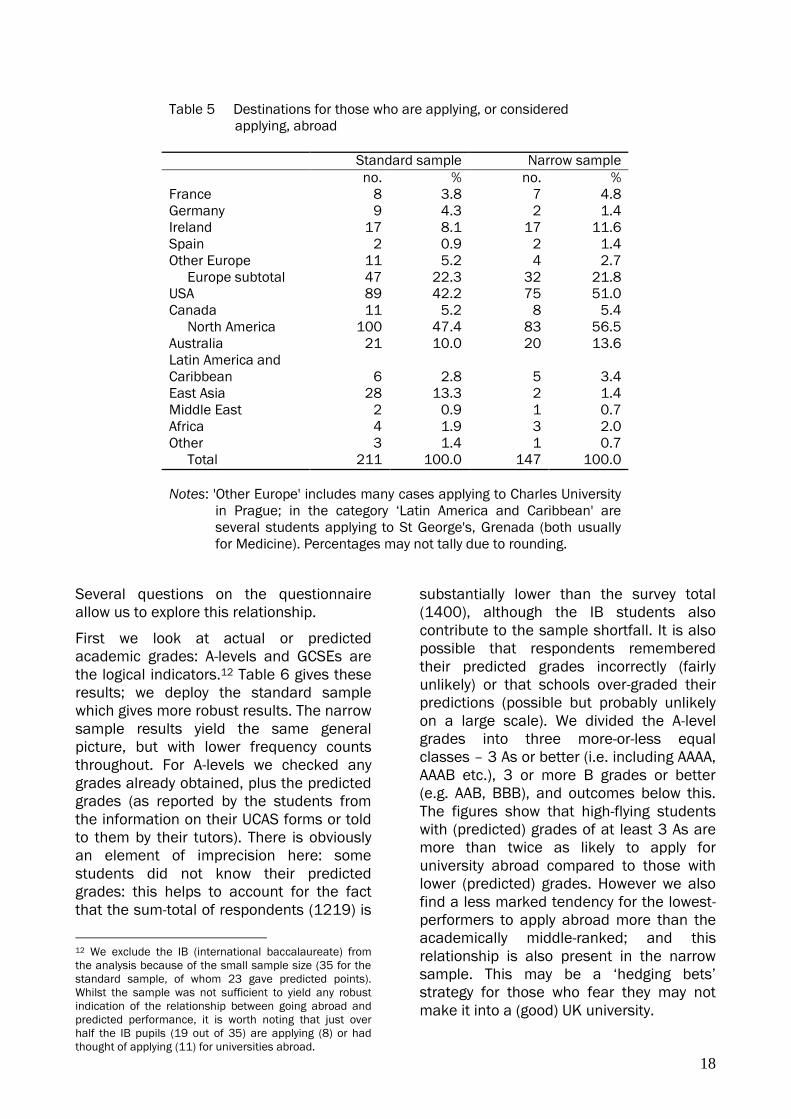
Question 3.3 on the main questionnaire
asked those who are applying to study
abroad and those who thought about
applying, to name their preferred country.
Table 5 sets out the answers for the two
samples. The United States is the dominant
destination accounting for half of the
narrow-sample responses and four in ten of
the standard sample. The main difference
between the standard and narrow samples,
apart from the aggregate numbers
responding (211 vs. 147), is the German
and East Asian (mainly Chinese) effect: the
narrow sample has far fewer respondents
for these countries. Filtering out the non-UK
respondents reveals the dominant
Anglophone nature of the top destinations:
in order of importance the US (51.0 per
cent), Australia/NZ (13.6 per cent), Ireland
(11.6 per cent) and Canada (5.4 per cent).
Note that Ireland attracts more than half of
those opting for a European destination.
Our data indicate very little UK-domiciled
student movement to continental European
countries such as France or Germany. This,
in turn, suggests that secondary data,
which do report some continental European
destinations, are potentially flawed,
perhaps by conflating Erasmus-like credit
mobility in the statistics.
Academic performance
Here we investigate the hypothesis that
those who might go abroad to study, or at
least consider the possibility, are the
academic high-flyers seeking ‘world-class’
universities – most of which are in the
United States.
18
Several questions on the questionnaire
allow us to explore this relationship.
First we look at actual or predicted
academic grades: A-levels and GCSEs are
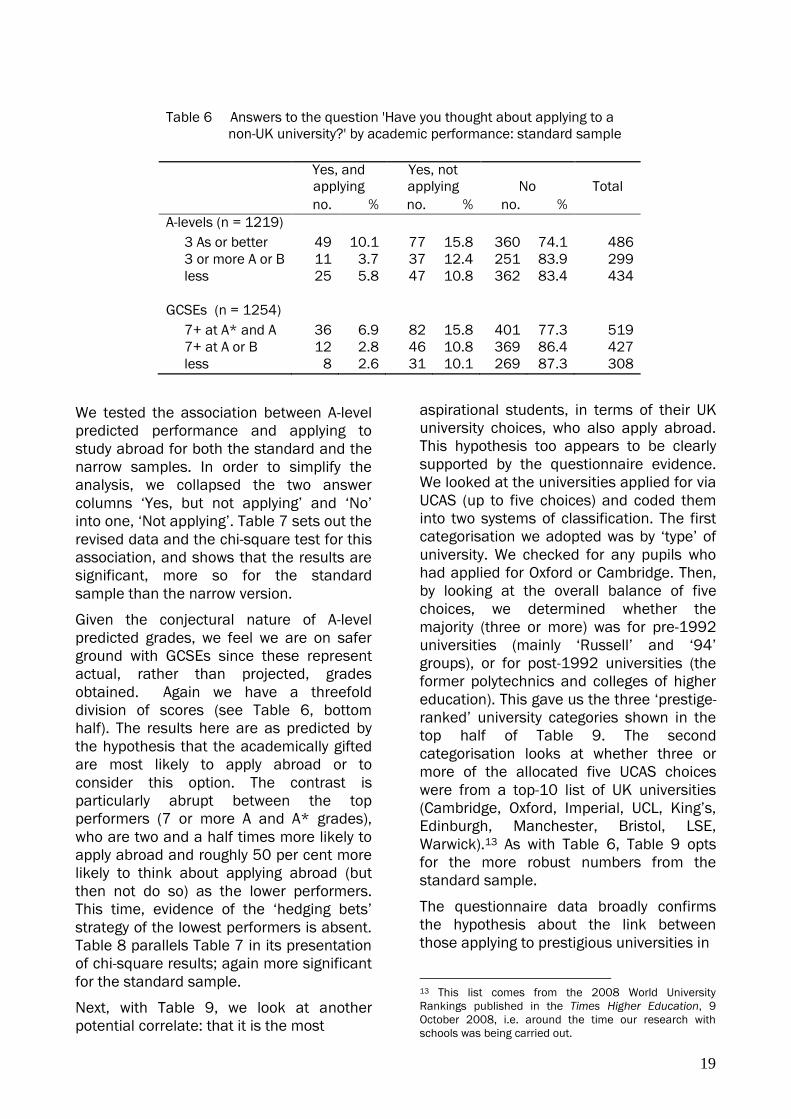
the logical indicators.12 Table 6 gives these
results; we deploy the standard sample
which gives more robust results. The narrow
sample results yield the same general
picture, but with lower frequency counts
throughout. For A-levels we checked any
grades already obtained, plus the predicted
grades (as reported by the students from
the information on their UCAS forms or told
to them by their tutors). There is obviously
an element of imprecision here: some
students did not know their predicted
grades: this helps to account for the fact
that the sum-total of respondents (1219) is
12 We exclude the IB (international baccalaureate) from
the analysis because of the small sample size (35 for the
standard sample, of whom 23 gave predicted points).
Whilst the sample was not sufficient to yield any robust
indication of the relationship between going abroad and
predicted performance, it is worth noting that just over
half the IB pupils (19 out of 35) are applying (8) or had
thought of applying (11) for universities abroad.
substantially lower than the survey total
(1400), although the IB students also
contribute to the sample shortfall. It is also
possible that respondents remembered
their predicted grades incorrectly (fairly
unlikely) or that schools over-graded their
predictions (possible but probably unlikely
on a large scale). We divided the A-level
grades into three more-or-less equal
classes – 3 As or better (i.e. including AAAA,
AAAB etc.), 3 or more B grades or better
(e.g. AAB, BBB), and outcomes below this.
The figures show that high-flying students
with (predicted) grades of at least 3 As are
more than twice as likely to apply for
university abroad compared to those with
lower (predicted) grades. However we also
find a less marked tendency for the lowest-
performers to apply abroad more than the
academically middle-ranked; and this
relationship is also present in the narrow
sample. This may be a ‘hedging bets’
strategy for those who fear they may not
make it into a (good) UK university.
Table 5 Destinations for those who are applying, or considered
applying, abroad
Standard sample Narrow sample
no. % no. %
France 8 3.8 7 4.8
Germany 9 4.3 2 1.4
Ireland 17 8.1 17 11.6
Spain 2 0.9 2 1.4
Other Europe 11 5.2 4 2.7
Europe subtotal 47 22.3 32 21.8
USA 89 42.2 75 51.0
Canada 11 5.2 8 5.4
North America 100 47.4 83 56.5
Australia 21 10.0 20 13.6
Latin America and
Caribbean 6 2.8 5 3.4
East Asia 28 13.3 2 1.4
Middle East 2 0.9 1 0.7
Africa 4 1.9 3 2.0
Other 3 1.4 1 0.7
Total 211 100.0 147 100.0
Notes: 'Other Europe' includes many cases applying to Charles University
in Prague; in the category ‘Latin America and Caribbean' are
several students applying to St George's, Grenada (both usually
for Medicine). Percentages may not tally due to rounding.
19
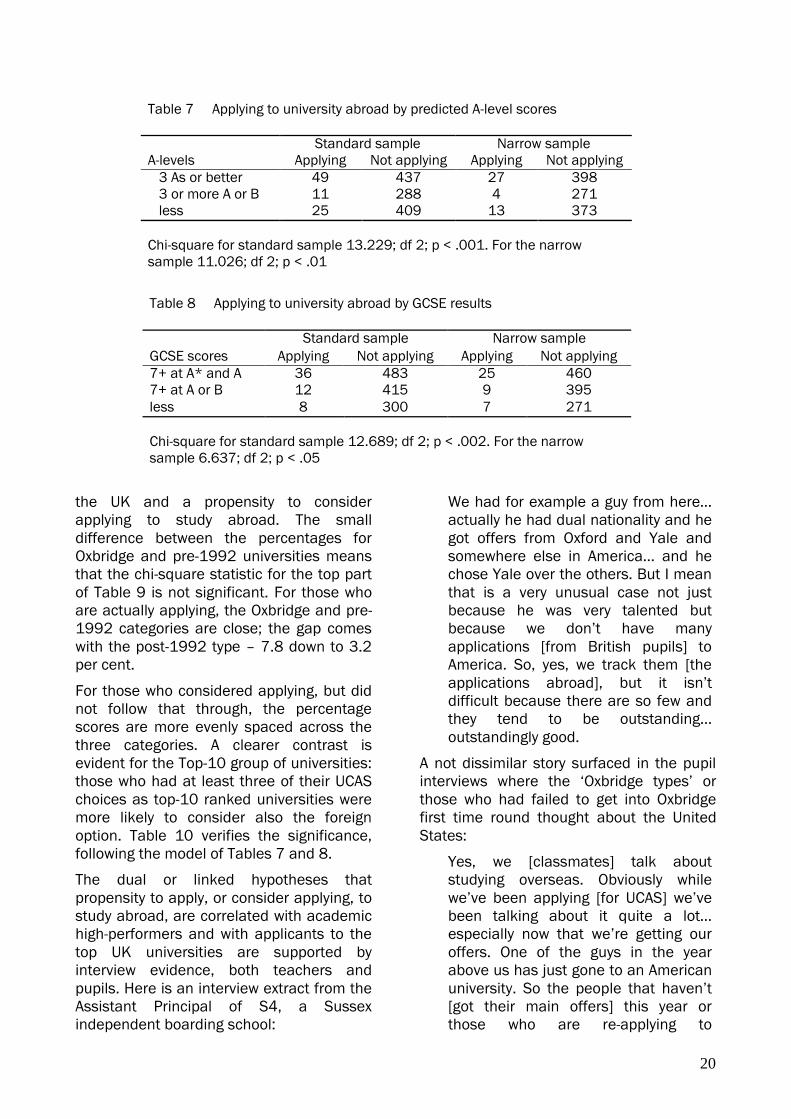
We tested the association between A-level
predicted performance and applying to
study abroad for both the standard and the
narrow samples. In order to simplify the
analysis, we collapsed the two answer
columns ‘Yes, but not applying’ and ‘No’
into one, ‘Not applying’. Table 7 sets out the
revised data and the chi-square test for this
association, and shows that the results are
significant, more so for the standard
sample than the narrow version.
Given the conjectural nature of A-level
predicted grades, we feel we are on safer
ground with GCSEs since these represent
actual, rather than projected, grades
obtained. Again we have a threefold
division of scores (see Table 6, bottom
half). The results here are as predicted by
the hypothesis that the academically gifted
are most likely to apply abroad or to
consider this option. The contrast is
particularly abrupt between the top
performers (7 or more A and A* grades),
who are two and a half times more likely to
apply abroad and roughly 50 per cent more
likely to think about applying abroad (but
then not do so) as the lower performers.
This time, evidence of the ‘hedging bets’
strategy of the lowest performers is absent.
Table 8 parallels Table 7 in its presentation
of chi-square results; again more significant
for the standard sample.
Next, with Table 9, we look at another
potential correlate: that it is the most
aspirational students, in terms of their UK
university choices, who also apply abroad.
This hypothesis too appears to be clearly
supported by the questionnaire evidence.
We looked at the universities applied for via
UCAS (up to five choices) and coded them
into two systems of classification. The first
categorisation we adopted was by ‘type’ of
university. We checked for any pupils who
had applied for Oxford or Cambridge. Then,
by looking at the overall balance of five
choices, we determined whether the
majority (three or more) was for pre-1992
universities (mainly ‘Russell’ and ‘94’
groups), or for post-1992 universities (the
former polytechnics and colleges of higher
education). This gave us the three ‘prestige-
ranked’ university categories shown in the
top half of Table 9. The second
categorisation looks at whether three or
more of the allocated five UCAS choices
were from a top-10 list of UK universities
(Cambridge, Oxford, Imperial, UCL, King’s,
Edinburgh, Manchester, Bristol, LSE,
Warwick).13 As with Table 6, Table 9 opts
for the more robust numbers from the
standard sample.
The questionnaire data broadly confirms
the hypothesis about the link between
those applying to prestigious universities in
13 This list comes from the 2008 World University
Rankings published in the Times Higher Education, 9
October 2008, i.e. around the time our research with
schools was being carried out.
Table 6 Answers to the question 'Have you thought about applying to a
non-UK university?' by academic performance: standard sample
Yes, and
applying
Yes, not
applying No Total
no. % no. % no. %
A-levels (n = 1219)
3 As or better 49 10.1 77 15.8 360 74.1 486
3 or more A or B 11 3.7 37 12.4 251 83.9 299
less 25 5.8 47 10.8 362 83.4 434
GCSEs (n = 1254)
7+ at A* and A 36 6.9 82 15.8 401 77.3 519
7+ at A or B 12 2.8 46 10.8 369 86.4 427
less 8 2.6 31 10.1 269 87.3 308
20
the UK and a propensity to consider
applying to study abroad. The small
difference between the percentages for
Oxbridge and pre-1992 universities means
that the chi-square statistic for the top part
of Table 9 is not significant. For those who
are actually applying, the Oxbridge and pre-
1992 categories are close; the gap comes
with the post-1992 type – 7.8 down to 3.2
per cent.
For those who considered applying, but did
not follow that through, the percentage
scores are more evenly spaced across the
three categories. A clearer contrast is
evident for the Top-10 group of universities:
those who had at least three of their UCAS
choices as top-10 ranked universities were
more likely to consider also the foreign
option. Table 10 verifies the significance,
following the model of Tables 7 and 8.
The dual or linked hypotheses that
propensity to apply, or consider applying, to
study abroad, are correlated with academic
high-performers and with applicants to the
top UK universities are supported by
interview evidence, both teachers and
pupils. Here is an interview extract from the
Assistant Principal of S4, a Sussex
independent boarding school:
We had for example a guy from here…
actually he had dual nationality and he
got offers from Oxford and Yale and
somewhere else in America… and he
chose Yale over the others. But I mean
that is a very unusual case not just
because he was very talented but
because we don’t have many
applications [from British pupils] to
America. So, yes, we track them [the
applications abroad], but it isn’t
difficult because there are so few and
they tend to be outstanding…
outstandingly good.
A not dissimilar story surfaced in the pupil
interviews where the ‘Oxbridge types’ or
those who had failed to get into Oxbridge
first time round thought about the United
States:
Yes, we [classmates] talk about
studying overseas. Obviously while
we’ve been applying [for UCAS] we’ve
been talking about it quite a lot…
especially now that we’re getting our
offers. One of the guys in the year
above us has just gone to an American
university. So the people that haven’t
[got their main offers] this year or
those who are re-applying to
Table 8 Applying to university abroad by GCSE results
GCSE scores
Standard sample Narrow sample
Applying Not applying Applying Not applying
7+ at A* and A 36 483 25 460
7+ at A or B 12 415 9 395
less 8 300 7 271
Chi-square for standard sample 12.689; df 2; p < .002. For the narrow
sample 6.637; df 2; p < .05
Table 7 Applying to university abroad by predicted A-level scores
Standard sample Narrow sample
A-levels Applying Not applying Applying Not applying
3 As or better 49 437 27 398
3 or more A or B 11 288 4 271
less 25 409 13 373
Chi-square for standard sample 13.229; df 2; p < .001. For the narrow
sample 11.026; df 2; p < .01
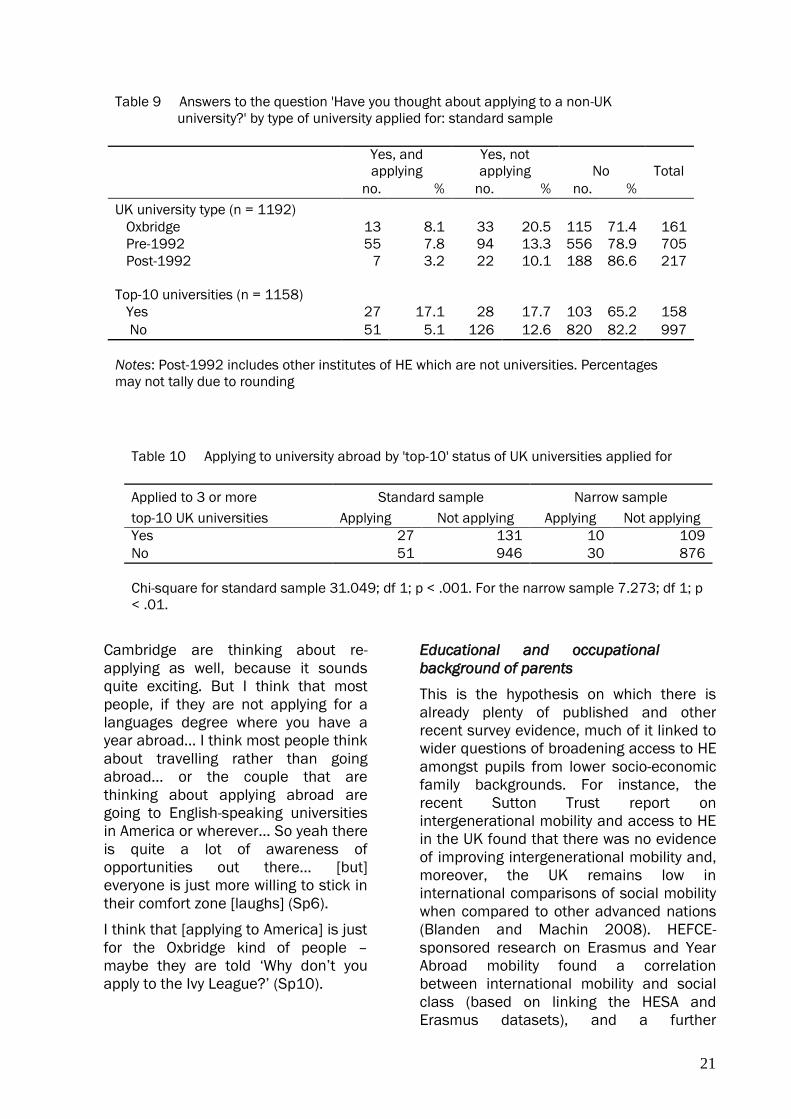
21
Cambridge are thinking about re-
applying as well, because it sounds
quite exciting. But I think that most
people, if they are not applying for a
languages degree where you have a
year abroad… I think most people think
about travelling rather than going
abroad… or the couple that are
thinking about applying abroad are
going to English-speaking universities
in America or wherever… So yeah there
is quite a lot of awareness of
opportunities out there… [but]
everyone is just more willing to stick in
their comfort zone [laughs] (Sp6).
I think that [applying to America] is just
for the Oxbridge kind of people –
maybe they are told ‘Why don’t you
apply to the Ivy League?’ (Sp10).
Educational and occupational
background of parents
This is the hypothesis on which there is
already plenty of published and other
recent survey evidence, much of it linked to
wider questions of broadening access to HE
amongst pupils from lower socio-economic
family backgrounds. For instance, the
recent Sutton Trust report on
intergenerational mobility and access to HE
in the UK found that there was no evidence
of improving intergenerational mobility and,
moreover, the UK remains low in
international comparisons of social mobility
when compared to other advanced nations
(Blanden and Machin 2008). HEFCE-
sponsored research on Erasmus and Year
Abroad mobility found a correlation
between international mobility and social
class (based on linking the HESA and
Erasmus datasets), and a further
Table 9 Answers to the question 'Have you thought about applying to a non-UK
university?' by type of university applied for: standard sample
Yes, and
applying
Yes, not
applying No Total
no. % no. % no. %
UK university type (n = 1192)
Oxbridge 13 8.1 33 20.5 115 71.4 161
Pre-1992 55 7.8 94 13.3 556 78.9 705
Post-1992 7 3.2 22 10.1 188 86.6 217
Top-10 universities (n = 1158)
Yes 27 17.1 28 17.7 103 65.2 158
No 51 5.1 126 12.6 820 82.2 997
Notes: Post-1992 includes other institutes of HE which are not universities. Percentages
may not tally due to rounding
Table 10 Applying to university abroad by 'top-10' status of UK universities applied for
Applied to 3 or more Standard sample Narrow sample
top-10 UK universities Applying Not applying Applying Not applying
Yes 27 131 10 109
No 51 946 30 876
Chi-square for standard sample 31.049; df 1; p < .001. For the narrow sample 7.273; df 1; p
< .01.
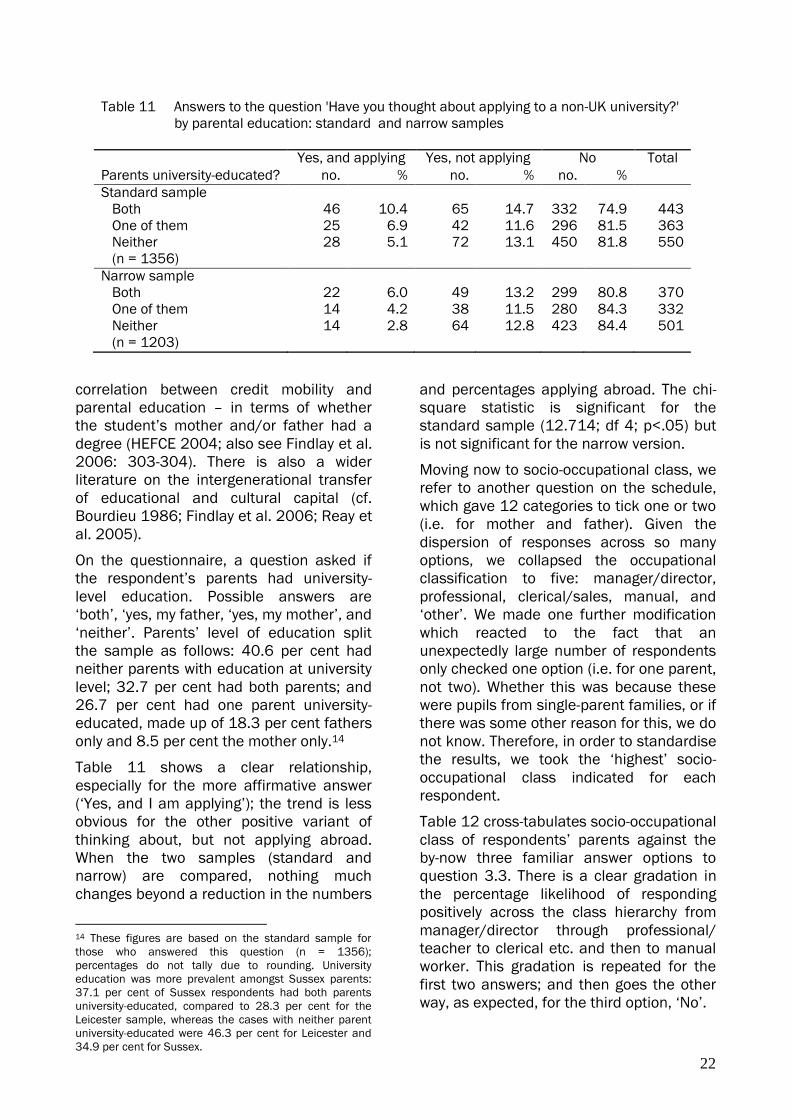
22
correlation between credit mobility and
parental education – in terms of whether
the student’s mother and/or father had a
degree (HEFCE 2004; also see Findlay et al.
2006: 303-304). There is also a wider
literature on the intergenerational transfer
of educational and cultural capital (cf.
Bourdieu 1986; Findlay et al. 2006; Reay et
al. 2005).
On the questionnaire, a question asked if
the respondent’s parents had university-
level education. Possible answers are
‘both’, ‘yes, my father, ‘yes, my mother’, and
‘neither’. Parents’ level of education split
the sample as follows: 40.6 per cent had
neither parents with education at university
level; 32.7 per cent had both parents; and
26.7 per cent had one parent university-
educated, made up of 18.3 per cent fathers
only and 8.5 per cent the mother only.14
Table 11 shows a clear relationship,
especially for the more affirmative answer
(‘Yes, and I am applying’); the trend is less
obvious for the other positive variant of
thinking about, but not applying abroad.
When the two samples (standard and
narrow) are compared, nothing much
changes beyond a reduction in the numbers
14 These figures are based on the standard sample for
those who answered this question (n = 1356);
percentages do not tally due to rounding. University
education was more prevalent amongst Sussex parents:
37.1 per cent of Sussex respondents had both parents
university-educated, compared to 28.3 per cent for the
Leicester sample, whereas the cases with neither parent
university-educated were 46.3 per cent for Leicester and
34.9 per cent for Sussex.
and percentages applying abroad. The chi-
square statistic is significant for the
standard sample (12.714; df 4; p<.05) but
is not significant for the narrow version.
Moving now to socio-occupational class, we
refer to another question on the schedule,
which gave 12 categories to tick one or two
(i.e. for mother and father). Given the
dispersion of responses across so many
options, we collapsed the occupational
classification to five: manager/director,
professional, clerical/sales, manual, and
‘other’. We made one further modification
which reacted to the fact that an
unexpectedly large number of respondents
only checked one option (i.e. for one parent,
not two). Whether this was because these
were pupils from single-parent families, or if
there was some other reason for this, we do
not know. Therefore, in order to standardise
the results, we took the ‘highest’ socio-
occupational class indicated for each
respondent.
Table 12 cross-tabulates socio-occupational
class of respondents’ parents against the
by-now three familiar answer options to
question 3.3. There is a clear gradation in
the percentage likelihood of responding
positively across the class hierarchy from
manager/director through professional/
teacher to clerical etc. and then to manual
worker. This gradation is repeated for the
first two answers; and then goes the other
way, as expected, for the third option, ‘No’.
Table 11 Answers to the question 'Have you thought about applying to a non-UK university?'
by parental education: standard and narrow samples
Parents university-educated?
Yes, and applying Yes, not applying No Total
no. % no. % no. %
Standard sample
Both 46 10.4 65 14.7 332 74.9 443
One of them 25 6.9 42 11.6 296 81.5 363
Neither 28 5.1 72 13.1 450 81.8 550
(n = 1356)
Narrow sample
Both 22 6.0 49 13.2 299 80.8 370
One of them 14 4.2 38 11.5 280 84.3 332
Neither 14 2.8 64 12.8 423 84.4 501
(n = 1203)
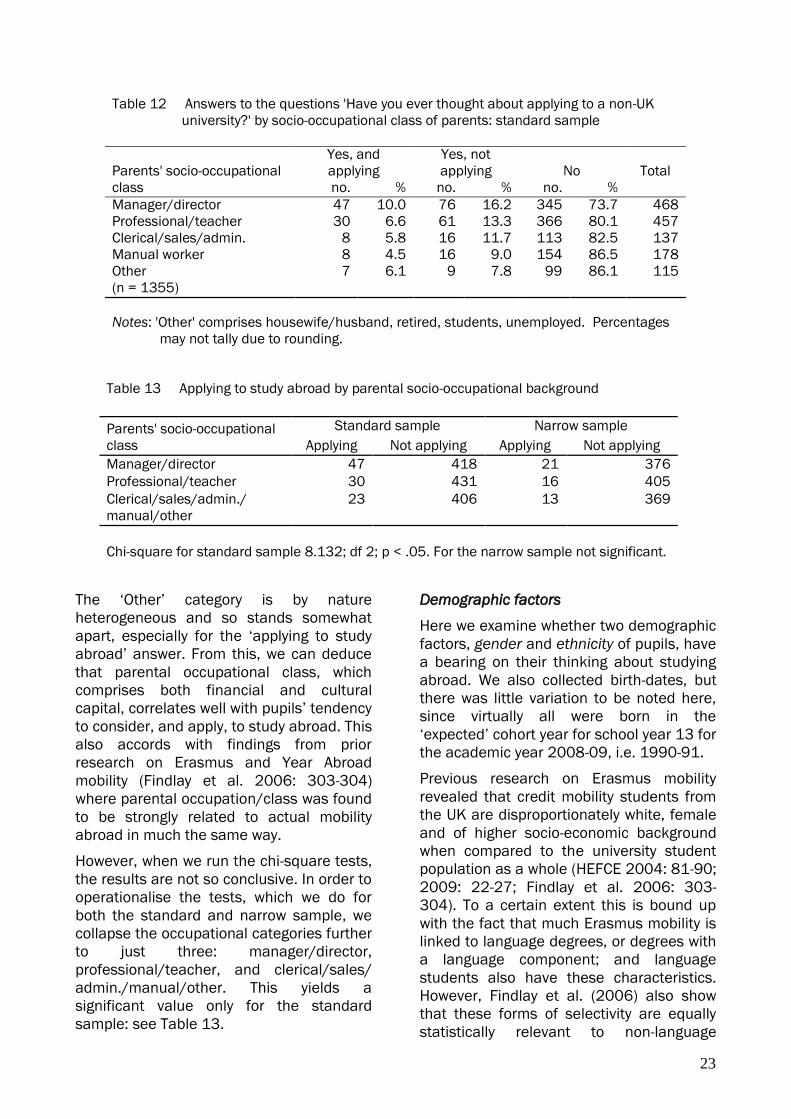
23
The ‘Other’ category is by nature
heterogeneous and so stands somewhat
apart, especially for the ‘applying to study
abroad’ answer. From this, we can deduce
that parental occupational class, which
comprises both financial and cultural
capital, correlates well with pupils’ tendency
to consider, and apply, to study abroad. This
also accords with findings from prior
research on Erasmus and Year Abroad
mobility (Findlay et al. 2006: 303-304)
where parental occupation/class was found
to be strongly related to actual mobility
abroad in much the same way.
However, when we run the chi-square tests,
the results are not so conclusive. In order to
operationalise the tests, which we do for
both the standard and narrow sample, we
collapse the occupational categories further
to just three: manager/director,
professional/teacher, and clerical/sales/
admin./manual/other. This yields a
significant value only for the standard
sample: see Table 13.
Demographic factors
Here we examine whether two demographic
factors, gender and ethnicity of pupils, have
a bearing on their thinking about studying
abroad. We also collected birth-dates, but
there was little variation to be noted here,
since virtually all were born in the
‘expected’ cohort year for school year 13 for
the academic year 2008-09, i.e. 1990-91.
Previous research on Erasmus mobility
revealed that credit mobility students from
the UK are disproportionately white, female
and of higher socio-economic background
when compared to the university student
population as a whole (HEFCE 2004: 81-90;
2009: 22-27; Findlay et al. 2006: 303-
304). To a certain extent this is bound up
with the fact that much Erasmus mobility is
linked to language degrees, or degrees with
a language component; and language
students also have these characteristics.
However, Findlay et al. (2006) also show
that these forms of selectivity are equally
statistically relevant to non-language
Table 12 Answers to the questions 'Have you ever thought about applying to a non-UK
university?' by socio-occupational class of parents: standard sample
Parents' socio-occupational
class
Yes, and
applying
Yes, not
applying No Total
no. % no. % no. %
Manager/director 47 10.0 76 16.2 345 73.7 468
Professional/teacher 30 6.6 61 13.3 366 80.1 457
Clerical/sales/admin. 8 5.8 16 11.7 113 82.5 137
Manual worker 8 4.5 16 9.0 154 86.5 178
Other 7 6.1 9 7.8 99 86.1 115
(n = 1355)
Notes: 'Other' comprises housewife/husband, retired, students, unemployed. Percentages
may not tally due to rounding.
Table 13 Applying to study abroad by parental socio-occupational background
Parents' socio-occupational
class
Standard sample Narrow sample
Applying Not applying Applying Not applying
Manager/director 47 418 21 376
Professional/teacher 30 431 16 405
Clerical/sales/admin./ 23 406 13 369
manual/other
Chi-square for standard sample 8.132; df 2; p < .05. For the narrow sample not significant.

24
students who engage in international study
for credit.
Unlike the female-dominated Erasmus
flows with their strong association with
foreign-language degrees, our
questionnaire data exhibit only moderate
sex-selectivity. Table 14 shows that there is
a greater tendency for females to apply,
and consider applying abroad; however, this
difference is at the margins of statistical
significance (based on chi-square values
applied to dichotomised ‘applying’ and ‘not
applying’ columns). At least as far as the
standard sample is concerned – where p =
.057 – the male:female ratio is slightly
more marked for those actually applying to
go abroad; for the narrow sample this
gender difference is rather less evident.15
The situation with ethnicity is much more
complex. Whereas sex is a dichotomous
variable, ethnicity is not (except in an
artificial and simplistic division into ‘white’
and ‘non-white’). Leicester is a particularly
emblematic place to examine for ethnicity-
related research because of the city’s now-
exactly-equal division between its white
population and the ‘non-white’ population,
which is predominantly Indian. But there is
a rather specific geography to this division,
which reflects itself in a particular way in
enrolment. The city itself is very ‘Asian’ and
therefore all secondary schools in the city
and its suburbs have large shares of Asian-
heritage pupils. This applies also to the
15 Our interpretation of this difference is that foreign-
national pupils sent to study in Britain are more likely to
be males than females – partly, perhaps, because boys’
education is prioritised over girls’ in some cultures, and/or
because of the perceived need to ‘protect’ girls by not
sending them away.
private schools which have significant
shares of the Asian-heritage pupils who
come from the wealthier segments of the
Asian population: many elements of these
groups are business people and
professionals who came to Leicester from
East Africa, especially Uganda. However,
the Asian pupils, and other minority-ethnic
pupils, are more heavily concentrated in the
city’s state schools, especially those which
are close to, or draw on, inner-city
residential areas. Out in the county, the
ethnic mix of the general population is
different and predominantly white, and this
is reflected within the schools. However, the
picture even here is not clear-cut.
Independent schools within easy reach of
Leicester recruit heavily from the city – both
Asian pupils and, especially, white pupils.
This suggests a form of ‘white flight’ to
these independent schools which
particularly reflects the shortage of this type
of school in Leicester itself. County
boarding schools – which are more in the
mould of traditional public schools – are
overwhelmingly white; their minority ethnic
pupils are more likely to be overseas
students than drawn from locally-resident
non-white minority-ethnic populations.
Brighton and Sussex, by contrast, are
predominantly ‘white’ areas of the country,
especially the county areas. The city of
Brighton and Hove has small minority
ethnic communities originating from the
traditional postwar countries of immigration
in South Asia and the Caribbean, and
refugee groups from the Horn of Africa,
notably Sudan. Parts of Brighton have
substantial estates of social housing (or
former social housing now in private
Table 14 Study abroad by gender of respondents: standard and narrow samples
Yes, and applying Yes, not applying No Total
no. % no. % no. %
Standard sample
Males 41 5.9 79 11.4 575 82.7 695
Females 60 8.7 103 14.9 528 76.4 691
Narrow sample
Males 23 3.6 68 10.8 540 85.6 631
Females 27 4.5 85 14.2 485 81.2 597
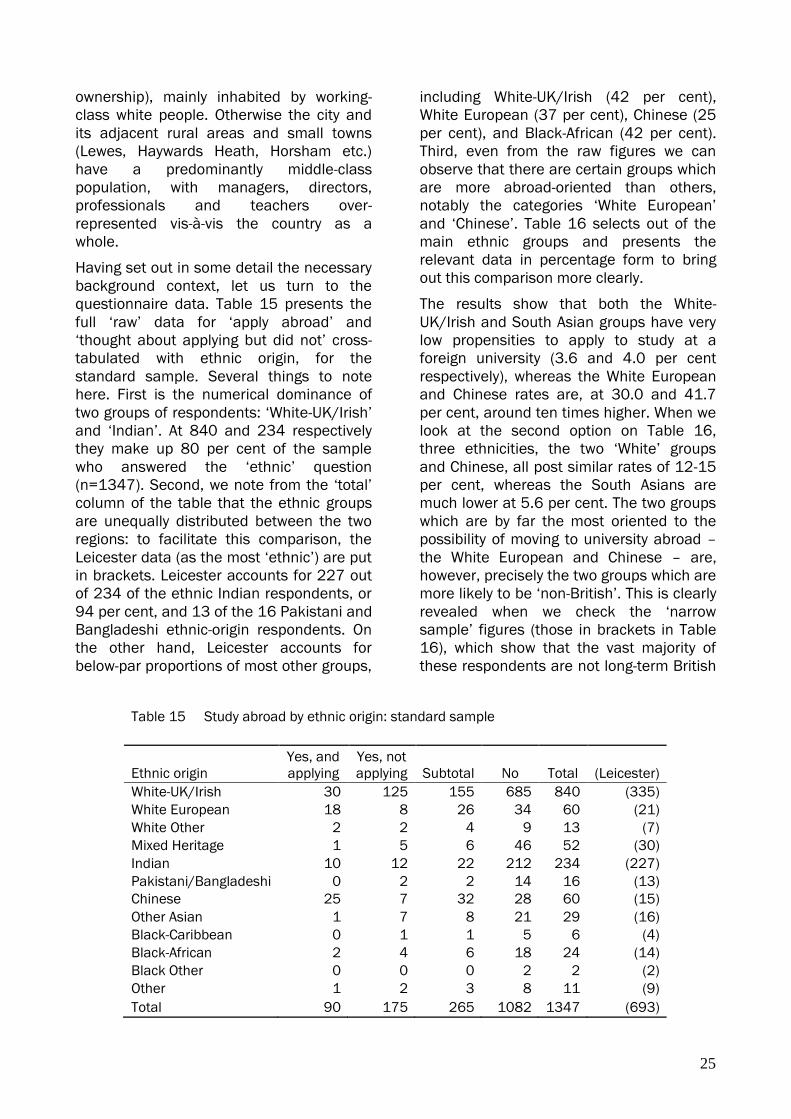
25
ownership), mainly inhabited by working-
class white people. Otherwise the city and
its adjacent rural areas and small towns
(Lewes, Haywards Heath, Horsham etc.)
have a predominantly middle-class
population, with managers, directors,
professionals and teachers over-
represented vis-à-vis the country as a
whole.
Having set out in some detail the necessary
background context, let us turn to the
questionnaire data. Table 15 presents the
full ‘raw’ data for ‘apply abroad’ and
‘thought about applying but did not’ cross-
tabulated with ethnic origin, for the
standard sample. Several things to note
here. First is the numerical dominance of
two groups of respondents: ‘White-UK/Irish’
and ‘Indian’. At 840 and 234 respectively
they make up 80 per cent of the sample
who answered the ‘ethnic’ question
(n=1347). Second, we note from the ‘total’
column of the table that the ethnic groups
are unequally distributed between the two
regions: to facilitate this comparison, the
Leicester data (as the most ‘ethnic’) are put
in brackets. Leicester accounts for 227 out
of 234 of the ethnic Indian respondents, or
94 per cent, and 13 of the 16 Pakistani and
Bangladeshi ethnic-origin respondents. On
the other hand, Leicester accounts for
below-par proportions of most other groups,
including White-UK/Irish (42 per cent),
White European (37 per cent), Chinese (25
per cent), and Black-African (42 per cent).
Third, even from the raw figures we can
observe that there are certain groups which
are more abroad-oriented than others,
notably the categories ‘White European’
and ‘Chinese’. Table 16 selects out of the
main ethnic groups and presents the
relevant data in percentage form to bring
out this comparison more clearly.
The results show that both the White-
UK/Irish and South Asian groups have very
low propensities to apply to study at a
foreign university (3.6 and 4.0 per cent
respectively), whereas the White European
and Chinese rates are, at 30.0 and 41.7
per cent, around ten times higher. When we
look at the second option on Table 16,
three ethnicities, the two ‘White’ groups
and Chinese, all post similar rates of 12-15
per cent, whereas the South Asians are
much lower at 5.6 per cent. The two groups
which are by far the most oriented to the
possibility of moving to university abroad –
the White European and Chinese – are,
however, precisely the two groups which are
more likely to be ‘non-British’. This is clearly
revealed when we check the ‘narrow
sample’ figures (those in brackets in Table
16), which show that the vast majority of
these respondents are not long-term British
Table 15 Study abroad by ethnic origin: standard sample
Yes, and
applying
Yes, not
applying Subtotal No Total (Leicester) Ethnic origin
White-UK/Irish 30 125 155 685 840 (335)
White European 18 8 26 34 60 (21)
White Other 2 2 4 9 13 (7)
Mixed Heritage 1 5 6 46 52 (30)
Indian 10 12 22 212 234 (227)
Pakistani/Bangladeshi 0 2 2 14 16 (13)
Chinese 25 7 32 28 60 (15)
Other Asian 1 7 8 21 29 (16)
Black-Caribbean 0 1 1 5 6 (4)
Black-African 2 4 6 18 24 (14)
Black Other 0 0 0 2 2 (2)
Other 1 2 3 8 11 (9)
Total 90 175 265 1082 1347 (693)
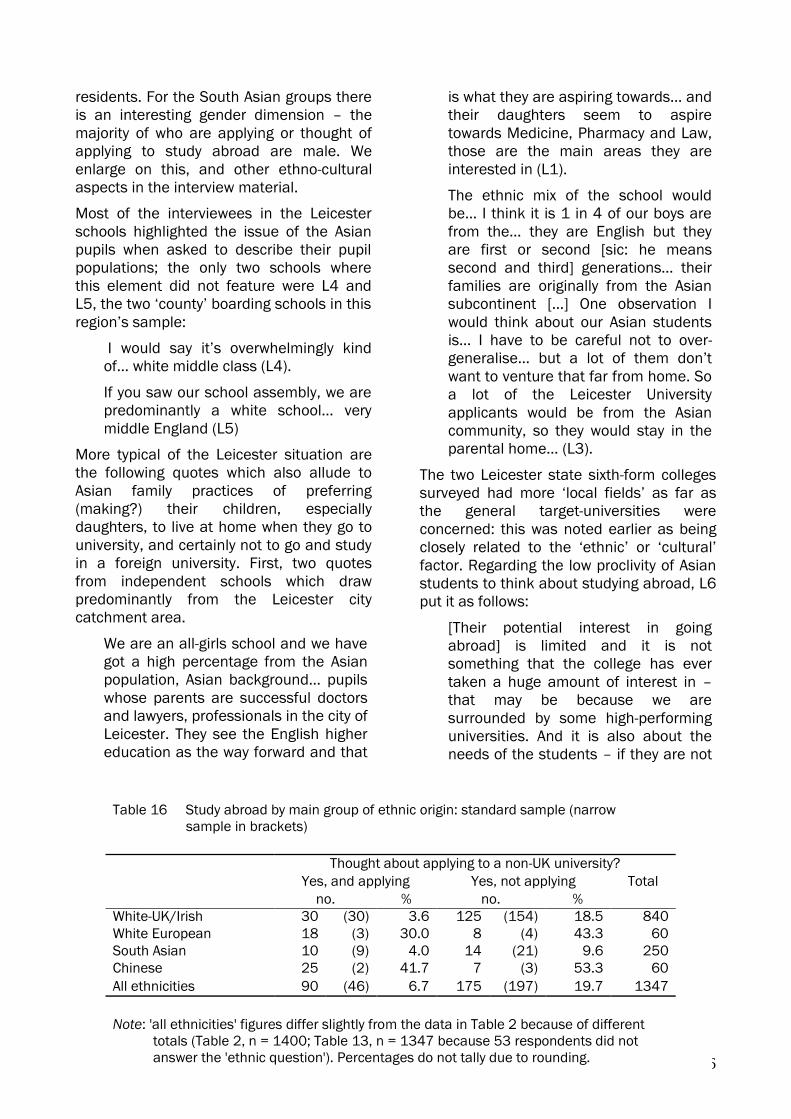
26
residents. For the South Asian groups there
is an interesting gender dimension – the
majority of who are applying or thought of
applying to study abroad are male. We
enlarge on this, and other ethno-cultural
aspects in the interview material.
Most of the interviewees in the Leicester
schools highlighted the issue of the Asian
pupils when asked to describe their pupil
populations; the only two schools where
this element did not feature were L4 and
L5, the two ‘county’ boarding schools in this
region’s sample:
I would say it’s overwhelmingly kind
of… white middle class (L4).
If you saw our school assembly, we are
predominantly a white school… very
middle England (L5)
More typical of the Leicester situation are
the following quotes which also allude to
Asian family practices of preferring
(making?) their children, especially
daughters, to live at home when they go to
university, and certainly not to go and study
in a foreign university. First, two quotes
from independent schools which draw
predominantly from the Leicester city
catchment area.
We are an all-girls school and we have
got a high percentage from the Asian
population, Asian background… pupils
whose parents are successful doctors
and lawyers, professionals in the city of
Leicester. They see the English higher
education as the way forward and that
is what they are aspiring towards… and
their daughters seem to aspire
towards Medicine, Pharmacy and Law,
those are the main areas they are
interested in (L1).
The ethnic mix of the school would
be… I think it is 1 in 4 of our boys are
from the… they are English but they
are first or second [sic: he means
second and third] generations… their
families are originally from the Asian
subcontinent […] One observation I
would think about our Asian students
is… I have to be careful not to over-
generalise… but a lot of them don’t
want to venture that far from home. So
a lot of the Leicester University
applicants would be from the Asian
community, so they would stay in the
parental home… (L3).
The two Leicester state sixth-form colleges
surveyed had more ‘local fields’ as far as
the general target-universities were
concerned: this was noted earlier as being
closely related to the ‘ethnic’ or ‘cultural’
factor. Regarding the low proclivity of Asian
students to think about studying abroad, L6
put it as follows:
[Their potential interest in going
abroad] is limited and it is not
something that the college has ever
taken a huge amount of interest in –
that may be because we are
surrounded by some high-performing
universities. And it is also about the
needs of the students – if they are not
Table 16 Study abroad by main group of ethnic origin: standard sample (narrow
sample in brackets)
Thought about applying to a non-UK university?
Yes, and applying Yes, not applying Total
no. % no. %
White-UK/Irish 30 (30) 3.6 125 (154) 18.5 840
White European 18 (3) 30.0 8 (4) 43.3 60
South Asian 10 (9) 4.0 14 (21) 9.6 250
Chinese 25 (2) 41.7 7 (3) 53.3 60
All ethnicities 90 (46) 6.7 175 (197) 19.7 1347
Note: 'all ethnicities' figures differ slightly from the data in Table 2 because of different
totals (Table 2, n = 1400; Table 13, n = 1347 because 53 respondents did not
answer the 'ethnic question'). Percentages do not tally due to rounding.
27
going to choose Bristol [because it is
too far away] they are not going to
study in Brussels (L6).
Finally, it is worth listening in to part of the
long interview with IL1 which gives an Inner-
London perspective which certainly
replicates some of the Leicester issues of
university application patterns from ethnic-
minority pupils (especially Asian-heritage),
but also raises other important factors,
such as finance and the emotional
concerns of single-parent families.
We are a London sixth-form college
that has 1400 students… and a
number of them will go to university…
75 per cent of them [who go to
university] will stay in London… There
is a diverse ethnic mix… about two-
thirds are from ethnic minority groups,
from a whole range of backgrounds […]
We have a lot of students who aren’t
very mobile, often due to their
background finances which come into
that – there is no doubt about that […]
I think there are emotional implications
as well… I am increasingly thinking that
when I think about our students […] I
had a student in here earlier today
who’s got an interview at Cambridge
coming up soon. She’s from a white
working-class family and her mother –
she just lives with her mother, single-
parent family – I had her mother sat
here saying ‘Look, she’s not going to
university; I went to work at the age of
fourteen’. I mean, it’s a fantastic
chance to actually say this is possible
[for the student] and she [the mother]
is actually going to go with her to the
interview, which is great. But what I’m
saying is that a lot of students – it’s a
lot of girls actually – a lot of students
don’t want to leave their mother
behind. I think it is often when they’ve
only got their mothers and the father is
not on the scene, and they can’t… they
mustn’t do it [go away to university],
you know (IL1).
This lengthy and insightful quote also
cautions us against laying too much
emphasis on ‘culture’ and ‘ethnicity’ when,
especially in the current economic climate,
wider structural issues of financial
constraints and social class are also
relevant. We should also avoid stereotyping
Asian students as inherently immobile.
Furthermore, we should remember that
Asian and other migrant-origin pupils are
often part of transnational families with
extensive mobility histories – for instance,
the Ugandan Asians who are numerous in
Leicester. Family links within and beyond
the UK may also facilitate secondary and
university education, via a pattern of staying
with relatives.
Disciplinary orientation and languages
Earlier research into Erasmus-type mobility
demonstrated the strong connection to
foreign-language degrees, especially as
regards credit mobility to Europe – typically
to countries like France, Germany, Spain
and Italy (HEFCE 2004; Findlay et al. 2006).
What is the role of foreign languages in
degree mobility?
We tried to answer this question by looking
at the A-levels being taken. Looking at the
A-level combinations, we classed them into
five main sets: science student, no
language (n=382); science student, with
language (n=47); arts student, no language
(n=622); arts student, with language
(n=99); other, i.e. mixed arts/science, no
language (n=170). The enumeration is for
the 1332 students who gave codable
answers to the relevant question.16
Table 17 gives the picture for the standard
sample, with the narrow sample in
brackets. The table shows a higher
proportion of science students applying to
study abroad, especially the science-
language combination. However, these
science students are disproportionately
overseas pupils (compare the figures in
brackets for the narrow sample).
16 This subject classification was based on the
predominant balance of the A-levels being taken. For
instance someone taking Maths, Physics and Economics
would be classed as Science; but Maths, History and
Economics as Arts. Some rather arbitrary allocations had
to be made, e.g. Geography as Arts, Psychology as
Science.
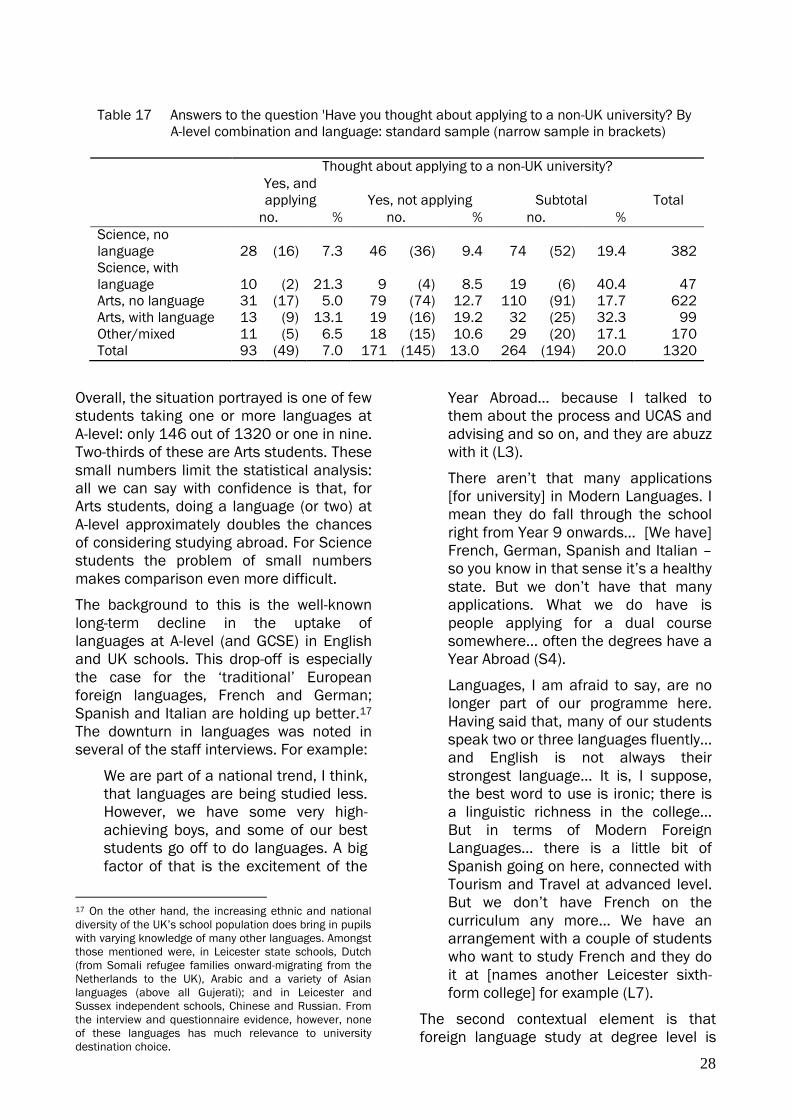
28
Overall, the situation portrayed is one of few
students taking one or more languages at
A-level: only 146 out of 1320 or one in nine.
Two-thirds of these are Arts students. These
small numbers limit the statistical analysis:
all we can say with confidence is that, for
Arts students, doing a language (or two) at
A-level approximately doubles the chances
of considering studying abroad. For Science
students the problem of small numbers
makes comparison even more difficult.
The background to this is the well-known
long-term decline in the uptake of
languages at A-level (and GCSE) in English
and UK schools. This drop-off is especially
the case for the ‘traditional’ European
foreign languages, French and German;
Spanish and Italian are holding up better.17
The downturn in languages was noted in
several of the staff interviews. For example:
We are part of a national trend, I think,
that languages are being studied less.
However, we have some very high-
achieving boys, and some of our best
students go off to do languages. A big
factor of that is the excitement of the
17 On the other hand, the increasing ethnic and national
diversity of the UK’s school population does bring in pupils
with varying knowledge of many other languages. Amongst
those mentioned were, in Leicester state schools, Dutch
(from Somali refugee families onward-migrating from the
Netherlands to the UK), Arabic and a variety of Asian
languages (above all Gujerati); and in Leicester and
Sussex independent schools, Chinese and Russian. From
the interview and questionnaire evidence, however, none
of these languages has much relevance to university
destination choice.
Year Abroad… because I talked to
them about the process and UCAS and
advising and so on, and they are abuzz
with it (L3).
There aren’t that many applications
[for university] in Modern Languages. I
mean they do fall through the school
right from Year 9 onwards… [We have]
French, German, Spanish and Italian –
so you know in that sense it’s a healthy
state. But we don’t have that many
applications. What we do have is
people applying for a dual course
somewhere… often the degrees have a
Year Abroad (S4).
Languages, I am afraid to say, are no
longer part of our programme here.
Having said that, many of our students
speak two or three languages fluently…
and English is not always their
strongest language… It is, I suppose,
the best word to use is ironic; there is
a linguistic richness in the college…
But in terms of Modern Foreign
Languages… there is a little bit of
Spanish going on here, connected with
Tourism and Travel at advanced level.
But we don’t have French on the
curriculum any more… We have an
arrangement with a couple of students
who want to study French and they do
it at [names another Leicester sixth-
form college] for example (L7).
The second contextual element is that
foreign language study at degree level is
Table 17 Answers to the question 'Have you thought about applying to a non-UK university? By
A-level combination and language: standard sample (narrow sample in brackets)
Thought about applying to a non-UK university?
Yes, and
applying Yes, not applying Subtotal Total
no. % no. % no. %
Science, no
language 28 (16) 7.3 46 (36) 9.4 74 (52) 19.4 382
Science, with
language 10 (2) 21.3 9 (4) 8.5 19 (6) 40.4 47
Arts, no language 31 (17) 5.0 79 (74) 12.7 110 (91) 17.7 622
Arts, with language 13 (9) 13.1 19 (16) 19.2 32 (25) 32.3 99
Other/mixed 11 (5) 6.5 18 (15) 10.6 29 (20) 17.1 170
Total 93 (49) 7.0 171 (145) 13.0 264 (194) 20.0 1320
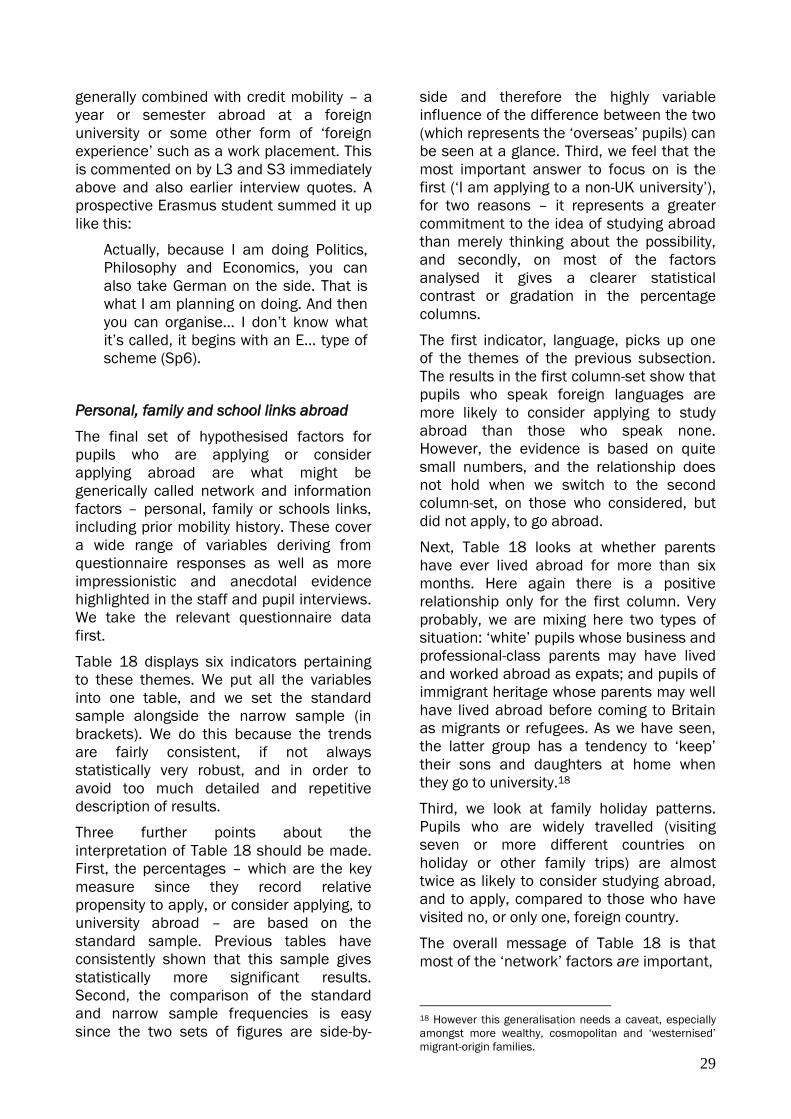
29
generally combined with credit mobility – a
year or semester abroad at a foreign
university or some other form of ‘foreign
experience’ such as a work placement. This
is commented on by L3 and S3 immediately
above and also earlier interview quotes. A
prospective Erasmus student summed it up
like this:
Actually, because I am doing Politics,
Philosophy and Economics, you can
also take German on the side. That is
what I am planning on doing. And then
you can organise… I don’t know what
it’s called, it begins with an E… type of
scheme (Sp6).
Personal, family and school links abroad
The final set of hypothesised factors for
pupils who are applying or consider
applying abroad are what might be
generically called network and information
factors – personal, family or schools links,
including prior mobility history. These cover
a wide range of variables deriving from
questionnaire responses as well as more
impressionistic and anecdotal evidence
highlighted in the staff and pupil interviews.
We take the relevant questionnaire data
first.
Table 18 displays six indicators pertaining
to these themes. We put all the variables
into one table, and we set the standard
sample alongside the narrow sample (in
brackets). We do this because the trends
are fairly consistent, if not always
statistically very robust, and in order to
avoid too much detailed and repetitive
description of results.
Three further points about the
interpretation of Table 18 should be made.
First, the percentages – which are the key
measure since they record relative
propensity to apply, or consider applying, to
university abroad – are based on the
standard sample. Previous tables have
consistently shown that this sample gives
statistically more significant results.
Second, the comparison of the standard
and narrow sample frequencies is easy
since the two sets of figures are side-by-
side and therefore the highly variable
influence of the difference between the two
(which represents the ‘overseas’ pupils) can
be seen at a glance. Third, we feel that the
most important answer to focus on is the
first (‘I am applying to a non-UK university’),
for two reasons – it represents a greater
commitment to the idea of studying abroad
than merely thinking about the possibility,
and secondly, on most of the factors
analysed it gives a clearer statistical
contrast or gradation in the percentage
columns.
The first indicator, language, picks up one
of the themes of the previous subsection.
The results in the first column-set show that
pupils who speak foreign languages are
more likely to consider applying to study
abroad than those who speak none.
However, the evidence is based on quite
small numbers, and the relationship does
not hold when we switch to the second
column-set, on those who considered, but
did not apply, to go abroad.
Next, Table 18 looks at whether parents
have ever lived abroad for more than six
months. Here again there is a positive
relationship only for the first column. Very
probably, we are mixing here two types of
situation: ‘white’ pupils whose business and
professional-class parents may have lived
and worked abroad as expats; and pupils of
immigrant heritage whose parents may well
have lived abroad before coming to Britain
as migrants or refugees. As we have seen,
the latter group has a tendency to ‘keep’
their sons and daughters at home when
they go to university.18
Third, we look at family holiday patterns.
Pupils who are widely travelled (visiting
seven or more different countries on
holiday or other family trips) are almost
twice as likely to consider studying abroad,
and to apply, compared to those who have
visited no, or only one, foreign country.
The overall message of Table 18 is that
most of the ‘network’ factors are important,
18 However this generalisation needs a caveat, especially
amongst more wealthy, cosmopolitan and ‘westernised’
migrant-origin families.
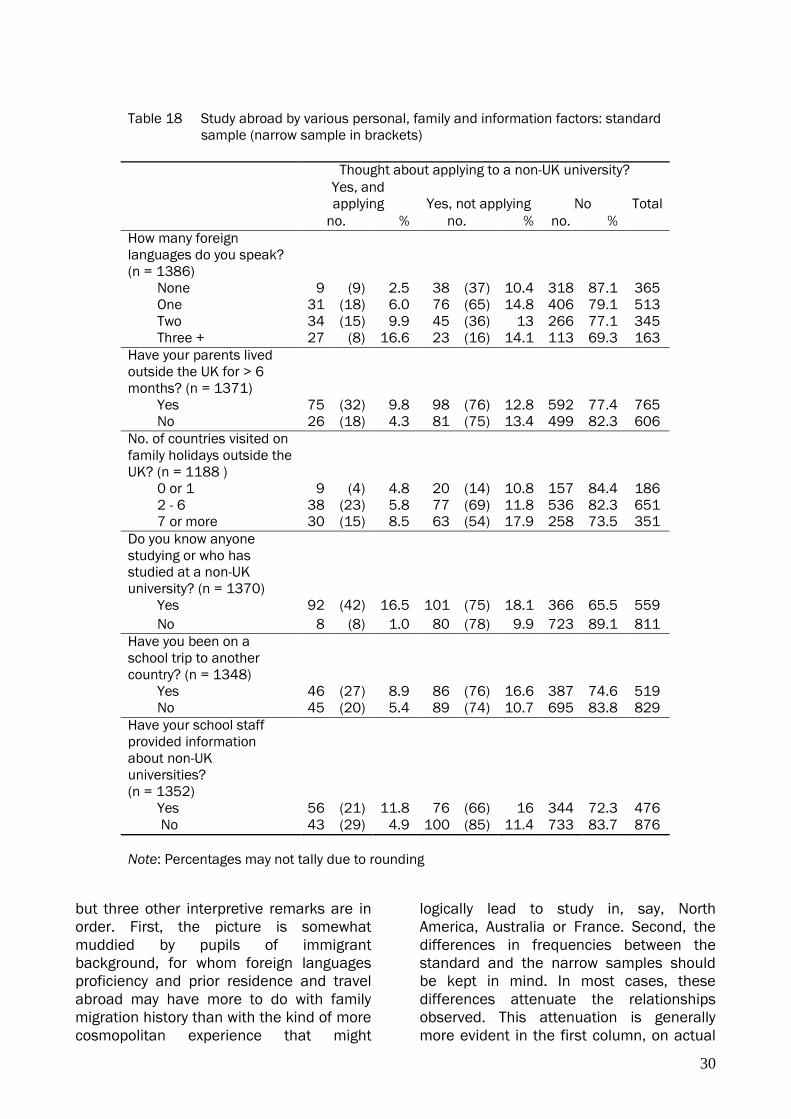
30
but three other interpretive remarks are in
order. First, the picture is somewhat
muddied by pupils of immigrant
background, for whom foreign languages
proficiency and prior residence and travel
abroad may have more to do with family
migration history than with the kind of more
cosmopolitan experience that might
logically lead to study in, say, North
America, Australia or France. Second, the
differences in frequencies between the
standard and the narrow samples should
be kept in mind. In most cases, these
differences attenuate the relationships
observed. This attenuation is generally
more evident in the first column, on actual
Table 18 Study abroad by various personal, family and information factors: standard
sample (narrow sample in brackets)
Thought about applying to a non-UK university?
Yes, and
applying Yes, not applying No Total
no. % no. % no. %
How many foreign
languages do you speak?
(n = 1386)
None 9 (9) 2.5 38 (37) 10.4 318 87.1 365
One 31 (18) 6.0 76 (65) 14.8 406 79.1 513
Two 34 (15) 9.9 45 (36) 13 266 77.1 345
Three + 27 (8) 16.6 23 (16) 14.1 113 69.3 163
Have your parents lived
outside the UK for > 6
months? (n = 1371)
Yes 75 (32) 9.8 98 (76) 12.8 592 77.4 765
No 26 (18) 4.3 81 (75) 13.4 499 82.3 606
No. of countries visited on
family holidays outside the
UK? (n = 1188 )
0 or 1 9 (4) 4.8 20 (14) 10.8 157 84.4 186
2 - 6 38 (23) 5.8 77 (69) 11.8 536 82.3 651
7 or more 30 (15) 8.5 63 (54) 17.9 258 73.5 351
Do you know anyone
studying or who has
studied at a non-UK
university? (n = 1370)
Yes 92 (42) 16.5 101 (75) 18.1 366 65.5 559
No 8 (8) 1.0 80 (78) 9.9 723 89.1 811
Have you been on a
school trip to another
country? (n = 1348)
Yes 46 (27) 8.9 86 (76) 16.6 387 74.6 519
No 45 (20) 5.4 89 (74) 10.7 695 83.8 829
Have your school staff
provided information
about non-UK
universities?
(n = 1352)
Yes 56 (21) 11.8 76 (66) 16 344 72.3 476
No 43 (29) 4.9 100 (85) 11.4 733 83.7 876
Note: Percentages may not tally due to rounding
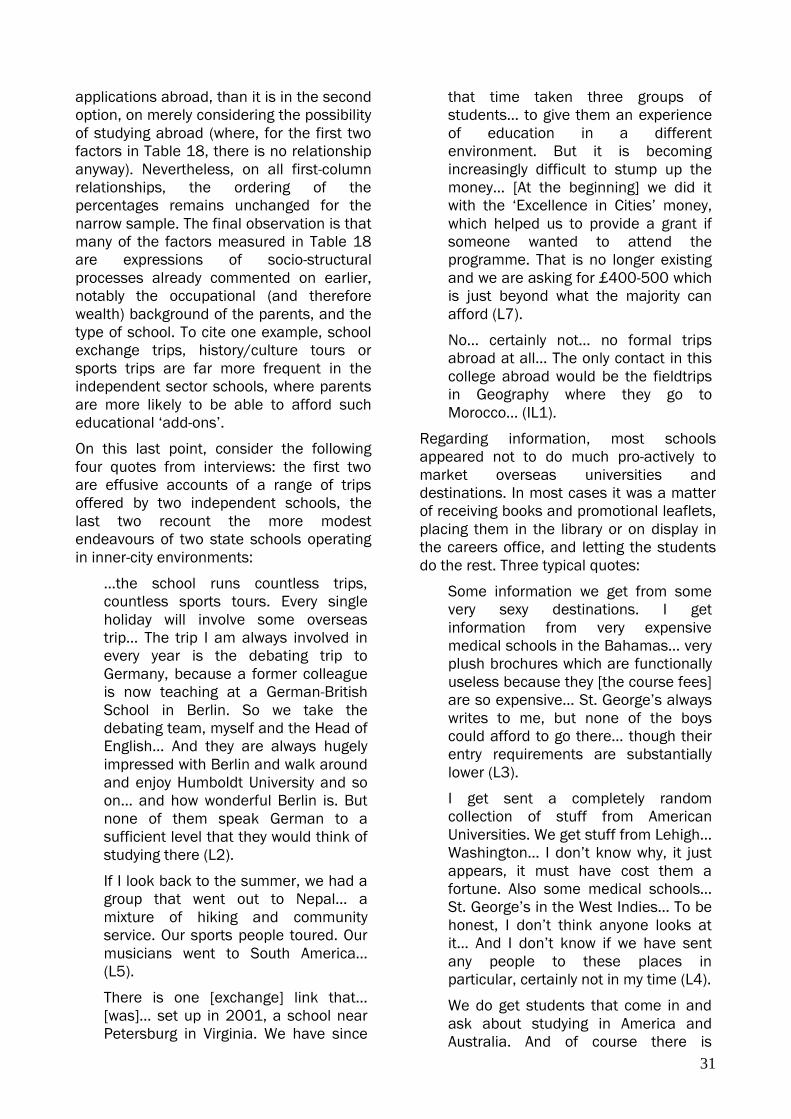
31
applications abroad, than it is in the second
option, on merely considering the possibility
of studying abroad (where, for the first two
factors in Table 18, there is no relationship
anyway). Nevertheless, on all first-column
relationships, the ordering of the
percentages remains unchanged for the
narrow sample. The final observation is that
many of the factors measured in Table 18
are expressions of socio-structural
processes already commented on earlier,
notably the occupational (and therefore
wealth) background of the parents, and the
type of school. To cite one example, school
exchange trips, history/culture tours or
sports trips are far more frequent in the
independent sector schools, where parents
are more likely to be able to afford such
educational ‘add-ons’.
On this last point, consider the following
four quotes from interviews: the first two
are effusive accounts of a range of trips
offered by two independent schools, the
last two recount the more modest
endeavours of two state schools operating
in inner-city environments:
…the school runs countless trips,
countless sports tours. Every single
holiday will involve some overseas
trip… The trip I am always involved in
every year is the debating trip to
Germany, because a former colleague
is now teaching at a German-British
School in Berlin. So we take the
debating team, myself and the Head of
English… And they are always hugely
impressed with Berlin and walk around
and enjoy Humboldt University and so
on... and how wonderful Berlin is. But
none of them speak German to a
sufficient level that they would think of
studying there (L2).
If I look back to the summer, we had a
group that went out to Nepal… a
mixture of hiking and community
service. Our sports people toured. Our
musicians went to South America…
(L5).
There is one [exchange] link that…
[was]… set up in 2001, a school near
Petersburg in Virginia. We have since
that time taken three groups of
students… to give them an experience
of education in a different
environment. But it is becoming
increasingly difficult to stump up the
money… [At the beginning] we did it
with the ‘Excellence in Cities’ money,
which helped us to provide a grant if
someone wanted to attend the
programme. That is no longer existing
and we are asking for £400-500 which
is just beyond what the majority can
afford (L7).
No… certainly not… no formal trips
abroad at all… The only contact in this
college abroad would be the fieldtrips
in Geography where they go to
Morocco… (IL1).
Regarding information, most schools
appeared not to do much pro-actively to
market overseas universities and
destinations. In most cases it was a matter
of receiving books and promotional leaflets,
placing them in the library or on display in
the careers office, and letting the students
do the rest. Three typical quotes:
Some information we get from some
very sexy destinations. I get
information from very expensive
medical schools in the Bahamas… very
plush brochures which are functionally
useless because they [the course fees]
are so expensive… St. George’s always
writes to me, but none of the boys
could afford to go there… though their
entry requirements are substantially
lower (L3).
I get sent a completely random
collection of stuff from American
Universities. We get stuff from Lehigh…
Washington… I don’t know why, it just
appears, it must have cost them a
fortune. Also some medical schools…
St. George’s in the West Indies… To be
honest, I don’t think anyone looks at
it… And I don’t know if we have sent
any people to these places in
particular, certainly not in my time (L4).
We do get students that come in and
ask about studying in America and
Australia. And of course there is
32
Erasmus and we tell them about that…
so we do highlight that to them. But we
don’t chase people up at all; they
would have to come and talk to us
about it (S9).
These rather off-hand remarks by three
staff tend to support our earlier
interpretation that teachers and advisers
are not well-informed about HE options or
highly motivated to get their pupils to
consider applying.
One of the key elements in stimulating
interest in going abroad to university seems
to be personal and family links. In the words
of one staff interviewee:
I can’t think of anyone who has
considered that option [of applying
abroad to study] who hasn’t had that
sort of reason in their family (L2).
And from a student interviewee, over the
telephone:
I am not sure yet [about applying
abroad] because I was thinking about
a gap year. In my gap year, I might do
that… I am interested in America, I
have family there – uncles and aunts,
my godfather is there and a bunch of
cousins… Miami, Florida and Florida
State [those are the universities I
might apply to], that is where they
[family] are, so I can acclimatise (Lp6).
Inevitably each story is individual, and so it
is hard to generalise, but the kind of stories
brought to our attention in the staff
interviews were cases where the pupil’s
parents had separated and one had gone to
live in another country (the USA, Canada,
Australia, etc.), second-generation Irish
pupils drawn by family links to Ireland and
especially to Trinity College Dublin, and
migrant-origin pupils with relatives in other
migrant destination countries – typically,
again, North America. These transnational
family linkages were alluded to earlier and
are exemplified in the following two quotes
which hint at alternative study-abroad
channels:
We have a number of students – I
couldn’t put a number on it – who live
with their relations and not with their
parents. Parents are often abroad. For
instance I have just been dealing with
a student who had to return to Toronto
because his mother is seriously ill
there. He has been actually staying
with his aunt and uncle in Leicester…
[but] his family origins are in the
subcontinent of India and in Uganda
(L7).
I can think of several Afro-Caribbean
students who have relatives in
America… and often they would say
that they could go and live with their
aunt and uncle in Chicago or New York
(IL1).
Key findings and conclusions
This paper has presented a fairly detailed
analysis of the material collected from a
school-leavers’ survey of attitudes towards
studying at university abroad. It is based on
questionnaire data from 1400 pupils in
Sussex and Leicestershire; interviews with
15 teaching and advisory staff in the
institutions surveyed; and a small input of
the ‘student voice’ from the 20 telephone
interviews. The key findings and
conclusions are highlighted as follows: we
sequence them in response to the seven
research questions posed in the early part
of the paper.
1. Based on a sample of 700 state-school
pupils and 700 independent-school
pupils, 7.2 per cent of respondents
were in the process of applying to study
abroad, mostly alongside UCAS
applications for UK university
admission; and a further 13.0 per cent
had thought about the ‘foreign option’
(to what depth, we cannot say), but not
gone ahead. Taken together, these
figures suggest at first glance that one
in five Year 13 pupils intending to
proceed to higher education consider
the possibility of applying abroad,
although only one in fourteen actually
make an application. If these seem
unexpectedly high figures, then we
need to make it clear that they are
weighted upwards by two distorting
33
factors. One is that independent
schools have much higher rates of
application abroad (11.6 per cent as
against 2.9 per cent for state pupils),
and we know that pupils at
independent schools are only a small
minority (around 11 per cent) of total
sixth-form pupils in England and the
UK. Second, our standard sample
included a proportion of pupils who
were not UK-nationals but overseas
students sent to English schools as a
stepping-stone to UK (and foreign)
universities. Taking these students out
of the questionnaire results, creating
thereby a ‘narrow sample’ of
predominantly UK-domiciled UK-
nationals, lowers the percentage
considerably: overall, 4.0 per cent apply
to study abroad (2.8 per cent for the
state sector, 5.5 per cent for the
independent sector), and 12.4 per cent
think about applying abroad, but do not
in fact do so (10.2 state, 14.9
independent). Bearing in mind that
around 89 per cent of Year 13 pupils in
England are in state schools and only
11 per cent in independent schools,
the final ratios become 3.1 per cent of
HE applicants are applying to study
abroad, and 10.7 per cent consider the
possibility but do not act on it. This
translates into approximately 5000
Year 13 pupils in England applying to
study abroad, plus a further 15,700
who consider the option but do not
make an application.
2. Foreign study is mainly targeted at
North American universities, often but
not always the premier institutions,
seen as alternatives to the top
universities in the UK. After the United
States, Australia and Ireland are the
next most frequently applied for, but a
long way behind. All are Anglophone
countries. Science-oriented pupils have
somewhat higher rates of applying
abroad, and language has some
influence.
3. As noted under 1, above, the
independent sector has a much higher
tendency for its pupils to consider
applying abroad. This in turn is related
to other factors such as parental
occupation and education, level of
information and support available
within the school, frequency and range
of school trips, all of which are
analysed separately in the paper but
which in reality are likely to be strongly
interrelated.
4. There is a clear relationship between
propensity to consider studying abroad
and academic performance, as
measured by (predicted) A-level scores
and (achieved) GCSE grades. A similar
correlation exists with applicants who
apply to the (perceived) ‘best’ UK
universities – Oxbridge, the Russell
Group, etc.
5. Regarding demographic correlates,
females have a greater tendency than
males to consider studying abroad,
although the contrast is barely
statistically significant. Ethnicity works
in more complex ways. Pupils who are
the offspring of ‘traditional’ immigrant
minorities in the UK (South Asian, Afro-
Caribbean etc.) have low propensities
towards the idea of studying abroad;
however Chinese and ‘White
Europeans’ have higher-than-average
rates, although these are partly
explained by their presence in the
schools with boarders.
6. There is a relationship between
orientation to study abroad and
parental social class, measured here
on the basis of broad occupational
categories. This is highly likely to be
causally linked with the previous factor,
given that socio-economic class is
known to be a key determinant of
academic attainment.
7. In the last analysis, personal and family
links are often decisive at the individual
level; the most typical and robust
indicators here are history of
personal/family travel abroad, friends
and family members who have studied
or are studying abroad, and school trips
and exchanges.
34
To conclude, we affirm that this paper
represents the first study on English school-
leavers’ attitudes and plans of studying at
university abroad. It is of relevance to
government debates on internationalising
the student experience through increased
mobility, as evidenced for example in the
UK’s participation in the Bologna Process of
creating a ‘European Higher Education
Area’ and the Prime Minister’s Initiatives of
Tony Blair (PMI 1 1992; PMI 2 2006) which
also favour enhanced international student
mobility (Gürüz 2008: 192-195). At a
different level, this paper contributes to the
still small geographical and social-science
literature on student migration. We highlight
the essential character of student mobility
as spatial, life-style and educational
processes which have local, regional,
national and international expressions.
Here, our focus has been on (potential)
international moves, but we have seen how
they are embedded in a choice matrix of
other university destinations open to
school-leavers.
While economic, cultural and technological
globalisation sets the general context for
the internationalisation of HE and thus ISM
(de Wit 2008; Gürüz 2008; Varghese
2008), it also seems to have the effect of
sharpening the perceived differences in
prestige between national HE systems, and
individual universities within them.
Increased information about universities
and the reputations of the research
activities and teaching programmes,
nowadays codified in national and
international ranking lists which are widely
available, creates a global hierarchy of
universities in which few are in doubt as to
which are at the top (Hazelkorn 2009).
But there are other inequalities which in a
sense are more disturbing. Our school-
leavers’ survey data leave little doubt about
the selective nature of international
mobility. We observe, in the tables and the
associated discussion, a series of
overlapping dimensions of privilege
interacting with and reinforcing each other:
state vs. independent schools, North vs.
South, university-educated parents vs.
parents with no higher education, high vs.
low socio-economic status. Such patterns in
our survey data link to academic
performance and network factors which
directly shape decisions and thoughts
about studying abroad. In sum, the socially
and economically more powerful groups –
the business-owners, professional and
managerial classes, those with inherited
wealth – see international mobility as a way
of strategising to enhance the educational
capital of their offspring beyond the
national to the global. Whilst this may
ultimately help to produce a globally
competitive cadre of UK-origin
internationally-educated graduates, it
clearly works against any socially inclusive
HE agenda of widening participation in
international mobility for students.
Acknowledgements
This paper derives from research
commissioned by the Department for
Innovation, Universities and Skills (DIUS),
subsequently the Department for Business,
Innovation and Skills (BIS). The title of the
project, which ran during 2008-2009, was
‘Motivations and Experiences of UK
Students to Study Abroad’. Allan Findlay
(University of Dundee) was the lead
investigator. This paper gives the full results
of the main Sussex component of the
research, the ‘Schools Survey’. Thanks to all
those schools, teachers and pupils who
took part.
References
Ackers, L. and Gill, B. (2008) Moving People
and Knowledge: Scientific Mobility in an
Enlarging European Union. Cheltemham:
Edward Elgar.
Blanden, J. and Machin, S. (2008) Recent
Changes in Intergenerational Mobility in the
UK. London: Sutton Trust.
Bourdieu, P. (1986) The forms of capital, in
Richardson, J.G. (ed.) Handbook of Theory
and Research for the Sociology of

35
Education. New York: Greenwood Press,
241-256.
Bracht, O., Engel, C., Janson, K., Over, A.,
Schomberg, H. and Teichler, U. (2006) The
Professional Value of Erasmus Mobility:
Final Report. Kassel: International Centre
for Higher Education Research.
Brooks, R. and Waters, J. (2009)
International higher education and the
mobility of UK students, Journal of
Research in International Education, 8(2):
191-209.
Byram, M. and Dervin, F. (eds) (2008)
Students, Staff and Academic Mobility in
Higher Education. Newcastle: Cambridge
Scholars Publishing.
Castles, S. and Miller, M.J. (2009) The Age
of Migration: International Population
Movements in the Modern World.
Basingstoke: Macmillan (4th edition).
Christie, H. (2007) Higher education and
spatial (im)mobility: non-traditional
students and living at home, Environment
and Planning A, 39(10): 2445-2463.
de Wit, H. (2008) The internationalization of
higher education in a global context, in de
Wit, H., Agarwal, P., Said, M.E., Sehoole,
M.T. and Sirozi, M. (eds) The Dynamics of
International Student Circulation in a Global
Context. Rotterdam: Sense Publishers, 1-
14.
de Wit, H., Agarwal, P., Said, M.E., Sehoole,
M.T. and Sirozi, M. (eds) (2008) The
Dynamics of International Student
Circulation in a Global Context. Rotterdam:
Sense Publishers.
Findlay, A.M., Geddes, A. and Smith, F.
(2010) Motivations and Experiences of UK
Students Studying Abroad, Statistical
Sources - Summary Metadata Report,
London: BIS Research Paper, No. 8A.
Findlay, A.M., King, R., Stam, A. and Ruiz-
Gelices, E. (2006) Ever reluctant
Europeans: the changing geographies of UK
students studying and working abroad,
European Urban and Regional Studies,
13(4): 291-318.
Findlay, A.M. and King, R. (2010)
Motivations and Experiences of UK
Students Studying Abroad. London: BIS
Research Paper, No. 8.
Findlay, A.M., Stam, A., King, R. and Ruiz-
Gelices, E. (2005) International
opportunities: searching for the meaning of
student migration, Geographical Helvetica,
60(3): 192-200.
Gill, J. (2009) Fine-tuned data show UK
challenging US as the top overseas draw,
Times Higher Education, 21 May: 6-7.
Gürüz, K. (2008) Higher Education and
International Student Mobility in the Global
Knowledge Economy. Albany: State
University of New York Press.
Hawthorne, L. (2008) The Growing Global
Demand for Students as Skilled Migrants.
Washington: Migration Policy Institute.
Hazelkorn, E. (2009) Higher education
rankings and the global ‘battle for talent’, in
Bhandari, R. and Laughlin, S. (eds) Higher
Education on the Move: New Developments
in Global Mobility. New York: IIE, 79-93.
HEFCE (2004) International Student
Mobility: Final Report. London: HEFCE
Issues Paper 30.
HEFCE (2009) Attainment in Higher
Education: Erasmus and Placement
Students. London: HEFCE Issues Paper 44.
King, R., with Black, R., Collyer, M., Fielding,
A. and Skeldon, R. (2010) People on the
Move: An Atlas of Migration. Berkeley:
University of California Press.
King, R. and Ruiz-Gelices, E. (2003)
International student migration and the
European ‘Year Abroad’: the effects on
European identity and subsequent
migration behaviour, International Journal
of Population Geography, 9(2): 229-252.
36
Krzaklewska, E. and Krupnik, S. (2006) The
Experience of Studying Abroad for
Exchange Students in Europe. Research
Report, Erasmus Student Network Survey
2005.
Maiworm, F. and Teichler, U. (1996) Study
Abroad and Early Careers: Experiences of
Former Erasmus Graduates. London:
Jessica Kingsley.
Mulder, C. and Clark, W. (2002) Leaving
home for college and gaining
independence, Environment and Planning
A, 34(6): 981-999.
Murphy-Lejeune, E. (2002) Student Mobility
and Narrative in Europe: The New
Strangers. London: Routledge.
Reay, D., David, M. and Ball, S.J. (2005)
Degrees of Choice: Class, Race, Gender
and Higher Education. Stoke-on-Trent:
Trentham Books.
Skeldon, R. (1997) Migration and
Development: A Global Perspective.
London: Longman.
Solimano, A. (ed.) (1997) The International
Mobility of Talent. Oxford: Oxford University
Press.
Varghese, N.V. (2008) Globalization of
Higher Education and Cross-Border Student
Mobility. Paris: International Institute for
Education Planning.
Waters, J. (2006) Geographies of cultural
capital: education, international migration
and family strategies between Hong Kong
and Canada, Transactions of the Institute of
British Geographers, 31(2): 217-37.
Waters, J. (2009) In pursuit of scarcity:
transnational students, ‘employability', and
the MBA, Environment and Planning A,
41(8): 1865-1883.
Waters, J. and Brooks, R. (2010) Accidental
achievers: international higher education,
class reproduction and privilege in the
experiences of UK students overseas,
British Journal of Sociology of Education,
31(2): 217-228.