Motivational Spillovers from Awards: Crowding Out … underlying assumption driving this costless...
42
Motivational Spillovers from Awards: Crowding Out in a Multitasking Environment Timothy Gubler University of California, Riverside [email protected] Ian Larkin UCLA [email protected] Lamar Pierce Washington University in St. Louis [email protected] July 14, 2015 This paper uses data from an attendance award program implemented at one of five industrial laundry plants to show the complex costs of corporate awards previously ignored in the literature. We show that although the attendance award had direct, positive effects on employees who had previously had punctuality problems, it also led to strategic gaming behavior centered on the specific eligibility criteria for the award. The award program temporary changed behavior in award-eligible workers, but did not habituate improved attendance. Furthermore, we show that the extrinsic reward from the award program crowded out the internal motivation of those employees who had previously demonstrated excellent attendance, generating worse punctuality during periods of ineligibility. Most novelly, we show that the attendance award program also crowded out internal motivation and performance in tasks not included in the award program. Workers with above average pre-program attendance lost 8% efficiency in daily laundry tasks after the program’s introduction. We argue that these motivation spillovers result from the inequity of internally-motivated workers’ previously unrewarded superior attendance contributions. Our paper suggests that even purely symbolic awards can generate gaming and crowding out costs that may spill over to other important tasks.
Transcript of Motivational Spillovers from Awards: Crowding Out … underlying assumption driving this costless...

Motivational Spillovers from Awards: Crowding Out in a Multitasking Environment
Timothy Gubler University of California, Riverside
Ian Larkin UCLA
Lamar Pierce Washington University in St. Louis
July 14, 2015 This paper uses data from an attendance award program implemented at one of five industrial laundry plants to show the complex costs of corporate awards previously ignored in the literature. We show that although the attendance award had direct, positive effects on employees who had previously had punctuality problems, it also led to strategic gaming behavior centered on the specific eligibility criteria for the award. The award program temporary changed behavior in award-eligible workers, but did not habituate improved attendance. Furthermore, we show that the extrinsic reward from the award program crowded out the internal motivation of those employees who had previously demonstrated excellent attendance, generating worse punctuality during periods of ineligibility. Most novelly, we show that the attendance award program also crowded out internal motivation and performance in tasks not included in the award program. Workers with above average pre-program attendance lost 8% efficiency in daily laundry tasks after the program’s introduction. We argue that these motivation spillovers result from the inequity of internally-motivated workers’ previously unrewarded superior attendance contributions. Our paper suggests that even purely symbolic awards can generate gaming and crowding out costs that may spill over to other important tasks.

Introduction
A large literature in management, social psychology, and economics has focused on how monetary reward
policies such as pay for performance motivate employee productivity (Prendergast 1999; Gerhart et al. 2009;
Larkin et al. 2012). Although monetary rewards indeed motivate productivity (Eisenberger et al. 1999;
Prendergast 1999; Lazear, 2000), they also can generate dysfunctional consequences (Lepper and Green 1978;
Gneezy et al. 2011). Multitasking theory, for example, holds that rewarding workers for one task can reduce
attention and productivity toward others (Milgrom and Roberts 1991). Similarly, workers’ strategic gaming of
reward systems to increase pay can harm the organization (Kerr 1975; Obloj and Sengul 2012; Larkin 2014).
The introduction of monetary rewards, which increase extrinsic motivation for a task (Amabile 1993), may also
“crowd out” intrinsic or other non-reward based motivation (Deci et al. 1999).
These and other costs of monetary rewards are one reason managers use nonmonetary but still
extrinsically oriented rewards, such as status and prestige from award programs (Silverman 2004). Corporate
award programs are one of the most common nonmonetary extrinsic rewards in firms (Frey 2007), with over
80% of corporations using award programs such as “employee of the month,” “top sales club,” and awards for
innovative ideas (Garr 2012). Academics have only recently studied such programs (Frey and Neckermann
2008), with new work arguing that awards motivate employees through mechanisms that include status-based
competition and social comparison (Moldovanu et al. 2007; Kosfeld and Neckermann 2011), increased
self-esteem (Kuhnen and Tymula 2010), and strengthened employer identification (Neckermann et al. 2014).
Consistent with long-running practicioner claims (Davidson 1999), this literature argues that corporate award
programs extrinsically motivate in ways fundamentally different from monetary compensation (Frey 2007;
Besley and Ghatak 2008; Blanes i Vidal and Nossol 2011), thus avoiding the psychological and financial costs
of monetary rewards by habituating positive behavior (Frey and Neckermann 2008; Neckermann et al. 2014).
In this paper, we use unique field data from a corporate attendance award program to provide the first
evidence that awards carry substantial costs beyond the simple prize money and program implementation costs
typically assumed in prior work. Using insights from agency theory, we argue that although the
“reward-motivated” employees who are primarily driven by extrinsic rewards will indeed positively respond to
awards, they will game the program rules in the same way they would a compensation system, acting purely to
1

maintain eligibility and reverting to weak performance when eligibility is lost. Applying insights from social
psychology and behavioral economics, we additionally argue that awards will crowd out intrinsic and prosocial
motivation in “internally-motivated” employees (Grant 2007; Sauermann and Cohen 2010)—which are those
employees who performed highly even in the absence of rewards.
More novelly, we build new theory on potential negative motivational spillovers from the introduction of an
award for a given task on other tasks in an organization. Multitasking theory typically holds that two tasks must
share an effort constraint in order for rewards on one task to reduce performance on the other nonrewarded
task. We argue that even absent a common effort constraint, motivation and productivity in a non-awarded
task can be reduced by the introduction of an award, due to the award program violating a psychological
contract between the firm and its internally motivated employees based on equity and reciprocity. The award
program, by providing the same reward to externally-motivated employees who previously paid little attention
to the now-awarded task, insufficiently acknowledges the prior unrewarded contributions of employees who
had already been doing the task well for non-reward based reasons.
We empirically test these arguments using data from an attendance award program implemented in an
industrial laundry plant in the midwestern United States. In March 2011, the managers at one of the company’s
five plants independently—but systematically and carefully—implemented a monthly attendance award
program that recognized all employees with perfect attendance, and awarded one such employee, randomly
selected from all those with perfect attendance in that month, a $75 gift card. Perfect attendance was defined to
cover both punctuality and a lack of unexcused absences. The independent implementation of the award at
only one plant allows us to investigate its effect in a quasi-experimental way, using employees at the other four
plants as a quasi-control group for the single “treated” plant.
In line with previous literature, we find that the award improved the attendance of employees with
previously poor attendance. We present clear evidence, however, that employees took actions to stay eligible
for the award, even when those actions ran contrary to the spirit of the award. Furthermore, once an employee
became disqualified for the award in a given month, she immediately reverted to her pre-award level of
attendance and punctuality, suggesting that the award did not increase baseline motivation for good attendance.
2

Most importantly, we find significant evidence that employees who were previously internally motivated for
attendance before the program suffered from crowding out once it was introduced, both directly on attendance
and in motivational spillovers to work efficiency. In total, our results suggest that the award program
implemented at the treatment plant cost the plant 1.4% of daily productivity, suggesting that awards can be
much more costly than currently recognized by the academic literature.
Theoretical Motivation
We next provide theoretical predictions for the organizational effect of award programs. We first establish that
existing research almost uniformly represents awards as a costless method for motivating employees, and how
these conclusions ignore potential multitasking and crowding costs commonly seen in financial rewards. We
highlight individual differences in reward-based and internal motivation levels that shape the relative
importance of specific award program costs and benefits. We then provide new theory that an award for one
task can reduce internal motivation for another task through negative motivational spillovers, even when these tasks
are functionally unrelated.
Corporate Awards as Extrinsic Rewards
Corporate awards programs have been vastly understudied by academic researchers despite their widespread
use (Frey and Neckermann 2008). Although no standard definition exists for “award,” scholars note that
corporate awards contain four fundamental traits: they involve a formal program set up by management; they
involve public recognition to winners; they involve the formal bestowal of something tangible, such as money
or a certificate or trophy; and they involve scarcity or competition, such that not everyone can win (Frey and
Neckermann 2008). Although theoretical and empirical research on awards is growing, this work focuses
almost exclusively on the potential benefits of award programs, considering the costs to be negligible. This
focus is based on a critical underlying assumption in the literature—that awards, despite representing extrinsic
rewards, avoid the deleterious economic and psychological mechanisms known to haunt monetary rewards.
Both theoretical and empirical research (Huberman et al. 2004; Frey 2006; 2007; Kosfeld and
Neckermann 2011) argues peer recognition to be the primary mechanism by which awards improve employee
motivation and performance. Although other motivational mechanisms such as increased organizational loyalty
3
(Neckermann et al. 2014), improved purpose or meaning (Kosfeld et al. 2014), and competition for scarce
rewards (Frey 2007; Larkin 2010) are also important, a recent field experiment by Ashraf et al. (2014) found
strong evidence that employer and peer recognition primarily drive award-based performance effects. This is
consistent with evidence from economics (Mas and Moretti 2009) and management (Blanes i Vidal and Nossol
2011) that workers improve when observed by peers. It is difficult, however, to unpack the exact mechanisms
by which awards influence behavior because they often present similar empirical predictions.
Existing studies of awards are quiet, however, on the mechanisms through which corporate awards
might produce substantial costs to a firm, a fact recognized by scholars. Both Neckermann and Frey (2013) and
Gallus and Frey (2015), for example, cite the present manuscript as the only study to examine negative effects.
Existing research instead explicitly considers only two competing hypotheses on the effect of awards on
motivation: increased motivation and no effect. Kosfeld and Neckermann’s influential experimental study
(2011) highlights this costless model of awards with the title “Getting More Work for Nothing?”, using a
formal model that contains only two predictions for different employee types: one type will be positively
motivated while the other will be unaffected. Blanes i Vidal and Nossol (2011) similarly promote this view in an
important study of peer recognition of performance, stating in the abstract that “we find that merely providing
this information [on peer performance] leads to a large and long-lasting increase in productivity that is costless to
the firm” (p. 1721, emphasis in the original).
Existing empirical studies are consistent with this exclusive focus on award benefits, finding that
awards positively affect the motivation and/or task performance of at least some workers. These results hold
across many empirical settings, including surveys of corporate employees (Neckermann and Frey 2013),
short-term motivation experiments with students (Kosfeld and Neckermann 2011), and field experiments with
corporate (Neckermann et al. 2014) and non-profit (Ashraf et al. 2014) employees. One study suggests that a
sales award carrying significant prestige and visibility, but no monetary reward, motivates salespeople to
sacrifice nearly 5% of their compensation to win (Larkin 2010). Critically, studies have found that awards can
improve not only core productivity tasks (Bradler et al. 2014), but also important ancillary tasks such as
attendance (Scott and Markham 1982; Markham et al. 2002).
4

The underlying assumption driving this costless awards model is that non-pecuniary rewards avoid
most of the economic and psychological problems associated with money. Frey (2007), in a seminal paper on
awards, lists a number of ways in which awards fundamentally differ from monetary compensation, including
their low monetary costs, their establishment of a “special relationship” (p. 7) between employees and
employers (unlike money), and their lower likelihood of crowding out intrinsic motivation. Yet there is growing
evidence that non-monetary rewards may indeed generate many of the same behavioral responses as money.
Foundational neuroscience studies using functional magnetic resonance imaging (fMRI) have shown monetary
rewards and social comparison stimuli to activate common areas of the human brain (Fliessbach et al. 2007; Lin
et al. 2012). Larkin’s (2010) study of software salespeople also showed that that they explicitly and consciously
trade financial rewards for the social recognition of an award.
We argue that if instead, awards function more like pecuniary rewards, they can produce additional
costs not recognized by existing awards research but well-understood in existing economics and social
psychology theory. In the following section, we apply established insights from these fields to awards.
Extending Incentive Theory to Awards
Awards provide extrinsic motivation: A fundamental tenet of agency theory holds that agents prefer shirking to
working, and that compensation helps motivate effort (Hölmstrom 1979). Social psychologists have instead
argued that some employees will exert their highest effort even absent formal rewards (Deci and Ryan 1985).
As discussed, the empirical awards literature universally finds that awards increase performance for at least
some employees. Logically, this implies that the employees who improved their performance were not
motivated to perform at their highest level absent the award; if this were not the case, and the agents were
exerting their maximal effort, then no improvement could be observed.
Our first insight from agency theory, then, is that any identified performance improvement on the
now-awarded task depends on the existance of what we will call “reward-motivated” employees—those
workers who lack the intrinsic or prosocial motivation to perform highly on the task without a reward. In
contrast, “internally-motivated” employees – those who perform highly absent direct rewards – will see little or
no improvement, simply because they were already working at or near their maximal level. We note that
5

internal motivators include pure intrinsic motivation, or the value from enjoying the task itself (Amabile et al.
1994), but also extrinsic social factors such as prosocial motivation, peer image, social pressure, and gratitude
(Deci 1971; Benabou and Tirole 2006; Grant 2007; Mas and Moretti 2009; Grant and Gino 2010; Wrzesniewski
et al. 2014). Empirical studies usually find it impossible to distinguish between pure intrinsic motivation and
extrinsic social factors (Larkin et al. 2012). However, absent a formal corporate reward for an activity, both of
these motivators stem from non-reward factors. In this research, we study the introduction of a formal
corporate reward. Consequently, whether “reward-motivated” employees are truly intrinsically motivated or are
motivated by extrinsic social factors is not key to our argument or analysis.
The vast literature on employee motivation commonly uses task performance as a proxy for employee
motivation (Lawler 1973). An employee’s intrinsic motivation is commonly proxied by performance absent any
reward (Deci and Ryan 1985). The effect of rewards on motivation are similarly measured using performance
changes following adjustments to incentive elements such as goals (Locke et al. 1981) and monetary rewards
(Lazear 2000). We follow this convention in our study, although we recognize that performance is an imperfect
(but likely the best available) measure of motivation. Therefore, in our setting, we identify
“internally-motivated” employees as those with high task performance in the absence of formal rewards. We
deem those with low task performance as “reward-motivated.” As we note in the empirical section, an
important component of our setting is the absence of long-term career-based rewards such as promotion,
which might extrinsically motivate high performance even without short-term formal rewards.
Thus, for reward-motivated employees – those with low internal motivation towards a task absent
formal rewards – our extension of agency theory to the awards setting predicts:
Prediction 1: The introduction of an award program for a previously unrewarded task improves
reward-motivated employee performance on that task.
Existing research primarily focuses on this single prediction, which we use as a baseline to corroborate the
burgeoning evidence that awards increase performance on the targeted task for some employees.
Awards induce gaming: A second tenet of agency theory holds that employees care only about their own rewards,
and not the goals of the principal or broader organization (Hölmstrom 1979). Theory and empirical evidence
6

find that employees openly act in ways contrary to the principal’s interest, and against the spirit of the reward
system, if their rewards increase by doing so—a behavior called “gaming” (Oyer 1998; Prendergast 1999).
Widespread evidence shows that gaming behavior is common in monetary reward systems, and can be
extremely costly to firms (Kerr 1975; Oyer 1998; Frank and Obloj 2014). For example, Larkin (2014)
demonstrates that salespeople will offer price cuts to customers that directly cost their employer 6-8% revenue,
if the customers agree to shift the purchase timing in order to increase the salesperson’s commission.
Because prior work has clearly demonstrated that awards influence the motivation of at least some
employees, the changed behavior will likely be at least partly strategic in nature. As a formal program, any
corporate award has rules for determining winners; these rules may not be fully disclosed to employees, but
almost always are to some extent (Frey 2007). If employees at least partially respond to awards rationally and
strategically, agency theory would predict employees to manipulate rules to improve their chance of winning.
Prediction 2: Employees who respond to an award with increased performance will achieve some of this
increase by manipulating the rules of the system in ways costly to the employer.
Award ineligibility leads to reversion in motivation: Agency theory holds that rewards motivate only so long as
employees have the possibility of earning them (Prendergast 1999). For example, tournament-based
compensation systems can strongly demotivate low performers once their likelihood of winning approaches
zero (Carpenter et al. 2010; Casas-Arce and Martínez-Jerez, 2009; Boudreau et al. 2011), which contrasts with
recent literature on “nudges” that suggests small rewards sometimes lead to habituation of desired behavior
even when the reward is removed (Acland and Levy 2012; Allcott and Rogers 2014).
The awards literature is largely silent on motivation after eligibility loss, although some work speculates
that motivation from awards might endure due to increased organizational loyalty (Neckermann et al. 2014). If
instead awards act more like monetary rewards, as we argue, then the likely or certain loss of award eligibility
will cause a motivation reversion that returns employees to pre-award levels of motivation and performance. Even
in the many awards systems that instead of a tournament, grant the award to any qualifying worker (Garr 2012),
program rules may make employees ineligible to win long before the award period is over. Consequently,
motivation reversion is also expected in the many awards based on absolute performance such as the one in
7

our setting. The reward-motivated employee will revert to her pre-existing preference to avoid maximal effort
after losing the chance of winning the award, even if the award program is still in place.
Prediction 3: Reward-motivated employees who respond to an award with increased performance will revert to their
lower pre-award performance once ineligible for the award.
Awards crowd out internal motivation: Many psychologists and behavioral economists argue that the introduction of
extrinsic rewards can reduce—or crowd out—intrinsic motivation through a number of mechanisms (Deci and
Ryan 1985; Frey and Oberholzer-Gee 1997). Desire for competence on the job, for example, can be crowded
out as an external reward shifts a behavior from signaling competence to signaling reward responsiveness
(Gneezy and Rustichini 2000a; Deci and Ryan 2002). Later research has focused on the mechanism of image
(Ariely et al. 2009; Benabou and Tirole 2006; Grant and Mayer 2009; Lacetera and Macis 2010), where an
external reward such as an award can shift the external perception of a worker’s motives for prosocial behavior
from “a desire to be a ‘good’ employee” to “a desire to win the social recognition of an award.”
Laboratory and field evidence on crowding out abounds, yet only a few recent papers provide evidence
from firms (Holmas et al. 2010; Bareket-Bojmel et al. 2015; Hossain and Li 2014). In some ways, this is
unsurprising: firms more often track performance data for tasks that they reward than for nonrewarded tasks.
Also, previous research has not examined the introduction of a reward for an unrewarded activity and the
subsequent removal of it. Even if crowding out exists, the effect of the reward introduction on overall
motivation is ambiguous because it depends on the relative magnitudes of the gain in extrinsic motivation and
the drop in intrinsic motivation (Gneezy and Rustichini 2000b). While the award is in place, these employees
will have increased extrinsic but decreased intrinsic motivation, yielding an ambiguous overall effect.
However, crowding out theory unambiguously predicts reduced motivation and performance for
internally-motivated employees once a reward is introduced and then removed (Deci et al. 1999). Loss of award
eligibilty represents the removal of the reward opportunity, which crowding out theory would predict eligibility
loss to lead to lower motivation than existed before the award program for employees with previously high
levels of internal motivation. We therefore predict:
Prediction 4: Performance on the now-awarded task by internally-motivated employees will be lower than
8

pre-award performance after eligibility loss.
New Theory: Negative Motivational Spillovers
Although existing research on incentives yields predictions about how award programs can have both positive
and negative effects on the awarded task, the literature says almost nothing about the impact on other tasks.
Neckermann et al. (2014) is the only paper, to our knowledge, that considers such spillovers across tasks. In a
field study on an award for prosocial behavior among call center representatives, they find positive spillovers to
employee performance on the core task of answering calls. Their paper proposes several theories consistent
with the results, including peer effects, self image, and increased intrinsic motivation.
We hold that task-specific awards can also introduce negative motivational spillovers to other tasks that
cannot be explained by multitasking theory. Multitasking theory (Hölmstrom and Milgrom 1991) predicts
extrinsic rewards such as awards will reduce effort and performance on other tasks only when a tradeoff in
effort or attention exists across the two tasks, providing no prediction of spillovers in the absence of such
effort tradeoffs. Our theory of negative motivational spillovers focuses precisely on this case, proposing that
the internal motivation of employees is linked across tasks. Consequently, an award introduction for one task
will reduce motivation and performance on another task specifically for those employees who are
internally-motivated on the awarded task.
Why might internal motivations for two tasks be related? The theory of psychological contracts holds
that employees form an implicit exchange agreement with employers that governs their overall relationship and
influences their individual day-to-day actions (Rousseau 1990; Rousseau and Greller 1994). Notably, some
employee actions are governed by reward-based transactional considerations such as the exchange of
compensation for productive effort. However, employee actions are also often relational, and are governed not
only by explicit rewards, but by a more complex implicit contract involving loyalty, reciprocity, and shared
values (MacNeil 1985; Robinson and Rousseau 1994). An abrogation by the employer of a part of this implicit
contract can reduce overall job motivation for those employees who value the affected part of the contract.
The introduction of an extrinsic award may be seen as a violation of the contract, and in turn could affect the
performance of the awarded task as well as other tasks governed by the relational contract.
9

Perceptions of fairness and equity are critical to the maintenance of implicit contracts (Robinson and
Rousseau 1994). The crucial insight from equity theory (Adams 1965) is that individuals compare the ratio of
their rewards to their contributions with the ratios of others (Festinger 1954). Consequently, even if an award is
Pareto improving for all workers, it can generate perceptions of inequity and unfairness by changing the relative
reward-contribution ratios. If, as in Prediction 1, reward-motivated employees increase performance on the
awarded task and match the prior high performance of internally-motivated employees, this will equalize the
ratio of expected rewards and effort in that period across the two employee types. Yet internally-motivated
employees will be keenly aware of the inequity of contributions to rewards across periods. The implementation
of the award program creates feelings of inequity by failing to recognize and reward prior unrewarded
contributions by internally-motivated workers. Furthermore, the award introduction would reclassify high
performance as transactional rather than relational (Rousseau 1990), by introducing formal recognition for
strong performance. Taken together, this increase in rewards will violate the psychological contract of
employees who believed positive behavior in the awarded task to be part of the implicit contract.
Perceptions of inequity and unfairness have significant negative consequences for employee
performance, both through decreased productivity and increased counterproductive behavior such as cheating
and dishonesty (e.g., Greenberg 1990; Gino and Pierce 2009; John et al. 2014; Edelman and Larkin 2014).
These counterproductive behaviors often occur outside the task that directly causes the inequity; indeed, the
literature on psychological contracts suggests that contract breach leads to reductions in job attitudes such as
loyalty, commitment, and overall job motivation that broadly affect many work behaviors (Cullinane and
Dundon 2006). An employee’s relational contract with the employer is complex and governs all
nontransactional noncompensated portions of her work (Rousseau and Parks 1993).
Collectively, this implies that transactionalizing a task with an award will, in reducing loyalty,
commitment, and overall motivation, reduce an employee’s internal motivation for other tasks with relational
components. The impact of this breach on internal motivation—and thereby on task performance—will occur
only for internally-motivated employees who were highly motivated for the awarded task. This idea, which we
term negative motivational spillovers, presents the following prediction:
10

Prediction 5: Introducing an award for a task will cause employees who are internally motivated for that task to
perform other tasks less well than they did in the pre-award period, even absent a common effort or attention constraint.
Crucially, the non-awarded task to which a negative motivational spillover occurs need not be one for which
motivation is purely intrinsic. Social psychologists (e.g., Deci and Ryan 1985) and economists (e.g., Benabou
and Tirole 2003) have long recognized that employee task motivation is comprised of a mix of extrinsic and
intrinsic factors. Our theory holds that as long as the employee’s motivation stems at least in part from intrinsic
or other non-reward factors, overall task motivation may be reduced.
Our theory also provides one clear empirical test versus other alternative explanations: negative
motivational spillovers should happen immediately upon award introduction. This is because negative
motivational spillovers from an award do not depend on award ineligibility. The mere introduction of the
award will reduce motivation on the non-awarded task for internally-motivated employees, even when an
employee remains eligible. Empirically, we must distinguish this reduced performance from the more standard
multitasking argument; in the next section, we discuss how the two tasks in our study do not involve the effort
tradeoff necessary for a pure multitasking explanation. In contrast to our prediction for internally-motivated
employees, our theory does not propose negative spillovers for reward-motivated employees. This is because
the task-based award does not violate an existing relational contract between these employees and the firm.
Empirical Setting
Our setting is an industrial laundry cleaning company in the midwestern United States, which we will refer to as
LaundryCo. LaundryCo is a leading regional provider of work uniforms, professional work apparel, and
commercial laundry cleaning services. Their services primarily include the selling, cleaning, and repairing of
work uniforms and small workplace items such as mats, towels, and mop heads. Nearly all of the cleaning
services occur at five plants, which are similar in layout, machinery, staffing positions, and products.
The production process at LaundryCo is complex. Each day, route-service representatives return soiled
uniforms to go through a complex process with many interdependent tasks before returning them to
customers. The process involves sorting garments by type and soil level, washing with a specific temperature
and chemical mix, drying and pressing, inspecting to ensure that garments with missing buttons or other
11

problems are fixed, and sorting for the quick loading of clean garments to return to customers. Non-uniform
items undergo a similar process, but extra steps are often involved, such as rolling laundered floor mats or
folding and bundling hand towels. Workers are cross-trained on many tasks, but tend to specialize in a few,
amongst which they alternate throughout each day. As with most labor-intensive service operations, LaundryCo
is highly dependent on worker efficiency, which they measure as task-adjusted output per minute. Inefficiency
results both from mistakes, such as incorrect sorting, and when unproductive upstream workers leave
downstream workers idle.
Each plant of approximately 35 workers is supervised by two managers who focus on worker
efficiency and overall plant productivity. These managers enjoy substantial autonomy in policy implementation.
To facilitate garment transfer though each stage of the cleaning process, LaundryCo give each plant an open and
uncluttered layout. One consequence of this layout is that employees can clearly observe each other’s behavior.
They can see, for example, who is late or absent, and they interact frequently as they switch between tasks. In
addition to formal work interactions, LaundryCo also puts significant effort into building a “friendly” workplace
through programs such as birthday recognition, company barbeques, fundraisers, and “alumni” reunions.
LaundryCo measures individual efficiency by comparing worker garment processing output to the
expected amount given the precise time spent on each task. The company bases this expectation on each task’s
company-wide time-studied rate, and normalizes output such that a score of 100 exactly reflects expected
performance. For example, the time-studied rate for pressing dress shirts is 50.4 seconds, meaning an employee
would need to press 71 shirts per hour to earn a score of 100. For each worker, the system computes a metric
we term “overall daily efficiency,” equal to the weighted average (by time spent) of the worker’s efficiency
scores on each task that day. For example, a worker who spent two hours pressing dress shirts with an
efficiency score of 80, two hours rolling mats with a score of 140, and four hours sorting cleaned clothes with a
score of 160 would have a final daily efficiency score of 135. Employees had no way to track efficiency during
the day. A computer in a break room allowed workers to look up efficiency from previous days, but interviews
suggest they rarely did so and only observed daily efficiency totals when they received their biweekly paycheck.
LaundryCo workers are paid using a bonus system, with a guaranteed base hourly rate and hourly wage
12

bonuses for daily efficiency scores above 100, up to a maximum bonus at 140. The average employee received
about 25% of total pay from bonuses and 75% from base wages. The bonus system differs slightly across
plants. The study’s treatment plant uses a linear wage increase as efficiency increases from 100 to 140. The four
other plants give employees discrete wage increases at 120 and 140. Interviews with management suggest that
because workers do not know precise efficiency scores while working, the two systems are similar in their
incentive effects; employees are incentivized to work harder at the margin, but do not make detailed
effort-reward calculations on an hourly or even daily basis. Daily efficiency is normally distributed around a
mean of about 120, with high performers in the 130-150 range and low performers between 80 and 100 (see
appendix). Interestingly, over 50% of employee-days in the pre-treatment period involve productivity either
below 100 or well above 140, meaning that an efficiency reduction from the observed level would not reduce
the employee’s bonus or total pay.
Given the externalities generated by the plant’s upstream-downstream nature, arriving consistently and
on time is essential to plant productivity. Tardiness and unexpected absences both hinder plant productivity,
since one plant section may be understaffed. Even if the plant manager finds a substitute for that section, the
substitute must abandon another task and will likely be less productive in the job than the missing worker.
LaundryCo therefore has relatively detailed policies on tardiness and attendance. Repeated tardiness first
precipitates a written warning from the plant manager. The third warning in a year results in suspension from
work, and the fourth termination. However, LaundryCo leaves the administration of this policy to individual
plant managers, who are usually lenient towards slight or occasional tardiness. The difficulty and cost of finding
and training replacements discourages managers from terminating such employees.
Attendance policies allow workers to take excused absences for sickness or vacation. To be counted as
excused, an absence must be scheduled with the company. Sickness is considered excused if the employee
notifies the manager even a few minutes before the start of the shift. Each employee is given a fixed number of
paid time-off (PTO) days each year that can be used for any absence, excused or unexcused. Although the
nature of the absence does not affect the use of PTO days, LaundryCo does track unexcused absences and plant
managers may issue formal warnings and eventually terminate employees with many unexcused absences.
13

Interviews with management revealed that employees often call in right before their shift to excuse an absence.
Attendance Award Program
In an effort to encourage fewer unexcused absences and less tardiness, the general and plant managers at one
LaundryCo plant (hereafter referred to as “Plant 1” or “the treatment plant”) implemented an award program
that recognized employees with perfect attendance in a given month and awarded one of them, randomly
selected, a $75 gift card to a local restaurant or store. Perfect attendance was defined as having no unexcused
absences and no “tardies.” An unexcused absence was defined as an absence where the employee did not notify
the plant management in advance; A “tardy” was defined as being more than five minutes late for a shift. The
names of all award-eligible employees in a given month—those with perfect attendance according to the
rules—were announced at a monthly plant-wide meeting early in the following month. The previous winner of
the gift card randomly selected the new card winner by drawing a name out of a hat.
The plant manager announced the program in mid-February 2011 and it began on March 1. It lasted
10 months and was terminated by corporate headquarters, with the last award given for December 2011. In an
average month 20 employees were eligible, meaning that the expected value of the award was less than $4, the
equivalent of about 20 minutes of work. The expected monetary value of the award is therefore negligible.
As part of our research, we interviewed LaundryCo managers about the attendance award program.1
The managers at the treatment plant stated that they introduced the award because certain employees’
punctuality and attendance problems were affecting plant productivity, and because they “hadn’t really tried out
awards as incentives too much.” Crucially, the managers stated that they did not feel that their plant’s
punctuality, attendance, or performance problems differed from other plants. Interviews with managers at
other plants corroborate that the treatment plant did not differ on attendance and punctuality.
Treatment plant managers did not discuss their plan with the executive team at LaundryCo or with
managers of other plants. They believed the award would be a cost-effective way to improve attendance and
punctuality, expecting that the close-knit plant culture and the shared work history of many employees would
make the competition and the chance for any employee with perfect attendance to win motivational. In short,
1 The appendix contains more details from our interviews and managers’ interpretation of our study’s results.
14

the managers felt that even if the plan failed, $75 in gift cards per month was a small investment and the
maximum expected cost of the program (apart from the minimal managerial time needed to run the program).
Senior executives at LaundryCo told us that although they believe in the motivational benefits of
awards, they do not believe that “employees should be rewarded for something they are supposed to be doing
anyways [coming on time to work each day].” They therefore terminated the award program after hearing
about it in a company human resource meeting in early December 2011. The treatment plant managers were
disappointed when the program was ended, and while they understood top management’s objections, they also
felt that many employees liked the program and that it had improved attendance and punctuality. They did
admit that while they had heard some “grumblings” from employees about the fairness of the award program,
they hadn’t considered the negative impact this discontent might have on motivation or efficiency.
Methods
Empirical Strategy
The introduction of the award at one plant and the existence of several similar plants without awards represent
a type of quasi-experiment that is frequently used to estimate policy effects (Gertler et al. 2011). We use a
difference-in-differences (DiD) design to assess the impact of the attendance award on the punctuality,
attendance, and efficiency of Plant 1’s workers. The DiD design treats LaundryCo’s other four plants as a
quasi-control group. The DiD strategy “differences out” fixed differences between Plant 1 and the control
group plants and uses post-treatment changes at the control group plants as a counterfactual for what would
have happened at Plant 1 had it not introduced the award.
Data
We use a 21-month panel of daily worker-level data that spans two periods: the period before Plant 1
introduced the award, which we call the “pre-award” period (12 months), and the period when Plant 1 had the
award program in place, which we call the “award period” (9 months). These data include punctuality and
attendance measures, as well as daily worker efficiency measures for 218 workers in five plants between March
1, 2010 and November 30, 2011. The typical worker-day observation details clock-in and clock-out times, times
and efficiency ratings for each task, overall daily efficiency, whether the employee was absent or not, and
15

demographic variables such as tenure, age, gender, and marital status.
Employees generally had set shift times, but these sometimes changed slightly due to seasonal demand.
We did not have access to LaundryCo’s employee schedules and therefore inferred a worker’s shift from her
observed clock-in and clock-out times and the list of actual shift times. We shared our coding with the plant
manager at Plant 1, and he agreed that our manual coding was both appropriate and accurate for normal
weekday shifts. Since our manual coding was less accurate on days when the worker arranged to come in late,
switched shifts with other workers, or worked extra hours, we restricted our analysis to weekdays, dropped
observations in which an employee worked less than 7.5 hours of an 8.5 hour shift, and dropped observations
that indicated a worker was more than an hour early or late for a shift. This affected less than 1% of the
weekday observations, and our results are highly similar when including these observations.
Dependent Variables
We use five main dependent variables. The first three (tardy, minutes late, absent) are metrics that the plant
managers hoped to improve through the attendance award program. Tardy is a dummy variable indicating that a
given worker showed up more than five minutes late on a given day and is one metric for disqualification in the
award program; the other disqualifying event is an unexcused absence. Minutes late is a continuous measure of
the minutes and seconds late an employee showed up to work; it has a negative value if the employee clocked
in and started working early. Absent is a dummy variable indicating that the worker was absent from work for
reasons other than public holidays, worker compensation, suspension, family medical leave, or funerals.
However, we do not observe whether an absence was excused or unexcused. Single absence is a dummy variable
indicating that an employee was absent on a given day but not absent the previous or following workday. The
last dependent variable, overall daily efficiency (which we abbreviate as “efficiency”), is the worker’s average
efficiency across all tasks on a given day, as explained above. We winsorized this variable to two standard
deviations from the mean because managers suggested severe outliers were likely errors. Using nonwinsorized
data does not significantly change our results.
Validity of Difference-in-Differences Approach
DiD strategies do not require that treatment and control groups be the same, and are explicitly designed to
16

allow comparison of treatment and control groups differ in observable ways (Gertler et al. 2011). Any
difference in the two groups that does not change contemporaneously with the treatment event does not affect
the statistical estimates of treatment. In our case, however, the treatment and control plants are very similar on
most dimensions. All five plants work on the same range of tasks, use the same production technology, and
share a common floor layout. Also, two of the control group plants are geographically proximate to Plant 1 (32
and 34 miles), and therefore help control for local shocks, such as weather, that might affect tardiness. All five
plants had the same attendance policies and enforcement procedures.
The biggest difference between Plant 1 and the control plants is that Plant 1 is unionized. This creates
some differences between the two groups, as seen in Table 1 (see appendix for employee-level statistics).
Although employees in both groups have similar ages, those at Plant 1 have higher tenure and wages, and
include more males. However, Plant 1 employees had tardiness and attendance levels similar to those of control
plant workers. Since DiD studies “difference out” fixed differences between treatment and control groups,
only differences which change across time can bias results (Gertler et al. 2011). In our case, there is no evidence
of differential time trends in employee tenure, wages, human resource policies, or other key variables during
our sample period. Finally, there were no unusual instances of turnover in Plant 1 during the award period that
might impact our results. Although the treatment plant experienced lower turnover because of unionization,
this is unlikely to bias our results. Because we will use individual worker fixed effects in our model, bias would
occur only if higher turnover in the other plants disproportionately occurred among workers whose attendance
or efficiency trends were nonrepresentative – not if levels of attendance or efficiency were different. Our
interviews and the data reveal no such trends. Moreover, restricting our analysis to employees who are
employed for the full sample does not change the study’s results. Thus, any pre-existing differences in
treatment and control plants appear stable and do not bias our estimates.
For example, consider tardiness caused by exogenous personal issues such as a commute or family
concerns. Individual fixed effects mean that any identified tardiness change was relative to the same baseline set
of exogenous factors. An employee might improve attendance despite a long commute, but this improvement
represents a change in motivation, not the baseline factor itself. For improvement to be observed, the worker
17

must have been performing below her potential given her exogenous personal issues. We find it implausible
that an employee would react to the award by changing her exogenous constraints, such as moving closer to
the plant or changing her diet to improve health. Therefore, the use of individual fixed effects crucially
identifies changes to motivation, controlling for each employee’s personal situations that affect attendance.
-------------INSERT TABLE 1 HERE--------------
Empirical Specification
We use a standard DiD specification to estimate the impact of the award on the dependent variables:
Yit = αi +β1* TREAT_GRPi +β2* POSTTREATt +β3* TREAT_GRPi*POSTTREATt + ϒt +εit
where Yit is the dependent variable, TREAT_GRP is a dummy variable equal to 1 if the worker is in the
treatment group and 0 otherwise, POSTTREAT is a dummy variable equal to 1 for dates after the award
program went into effect and 0 otherwise, and TREAT_GRP*POSTTREAT is the interaction of the two
previous variables. The coefficient on this interaction (β3) estimates the treatment effect; to conserve space,
we simply label this variable as treatment in the results tables. Our specification takes advantage of the panel
nature of the data by introducing a full set of fixed effects, including worker fixed effects (αi), which account
for unobserved worker heterogeneity, and time fixed effects (ϒt), which account for time trends across months,
days in the month, and days of the week. In specifications with worker fixed effects, the variable TREAT_GRP
is absorbed. Similarly, POSTTREAT is absorbed by the time fixed effects.
All reported regressions were estimated using ordinary least squares (OLS). We block-bootstrapped
standard errors based on 218 workers to address concerns that DiD models underestimate standard errors
regardless of specification (Bertrand et al. 2004). In block bootstrapping, data are randomly sampled across
blocks (in our case workers) due to data interdependence within blocks (Lahiri 2003). Block bootstrapping is
commonly used in DiD and other panel models with repeat observations for individuals, since data are not
independent and indentically distributed (Hounkannounon 2011). While three of the five dependent variables
are binary, OLS is less computationally intensive to bootstrap and easier to interpret. Moreover, OLS
specifications result in unbiased coefficient estimates, even as events become rare (Stewart 2009). Our results
are robust to using logistic models. Table 2 presents correlations for the main variables used in our analyses.
18

-------------INSERT TABLE 2 HERE--------------
Results
Basic Treatment Effects
It is critical in DiD models to graphically investigate whether pre-trends in the data appear similar.
Figure 1 plots average tardiness for treatment and control plants during our data period. The two lines for each
group show a 4th-degree flexible spline for both pre- and post-treatment periods. While average tardiness is
higher in the treatment plant, consistent with summary statistics in Table 1, the pre-treatment tardiness
difference is largely constant. There is a slight uptick in tardiness near the March program start in the control
plants, which our interviews suggest come from the holiday season, but the DiD estimator considers the entire
pre-treatment period, not only the window just before treatment. After the award is introduced, there is an
immediate, discernable reduction in tardiness at the treatment plant, while the control plant tardiness appears
unchanged. The graph strongly suggests that the treatment event, and not different pre-treatment trends, led to
the observed tardiness reduction in the treatment group. Again, the higher pre-treatment tardiness in Plant 1 is
not in itself a concern, because the statistical estimator “differences out” this pre-existing difference.
We next provide regression results. Table 3 shows average treatment effects for the five dependent
variables. The award caused substantial improvement on two of the three performance metrics that the
managers attempted to influence (tardy, minutes late, and absent). There was a 1.5-percentage-point reduction in
tardiness at Plant 1, or a 45% reduction from the pre-award baseline of 3.3%. In addition, the average worker
clocked in nearly a minute earlier, a reduction in minutes late of about 39% from the pre-award baseline of
-2.03. We do not observe a statistically significant treatment effect on absences, although the use of single
absences increased by nearly 40% from a baseline of 1.5%, a result we discuss later. Finally, the award did not
lead to overall changes in laundry task efficiency, although additional time worked yields productivity gains.
-------------INSERT TABLE 3 HERE--------------
We dispel concerns of false positives due to serial correlation issues (Bertrand et al. 2004) through
placebo tests, which we present in Table A3 of the appendix. We address two other typical confounds in DiD
models in Figure 2, which shows monthly treatment effects from the award program. The large and precise
treatment effect in the first month casts doubt that either an unobserved contemporaneous change or simple
19

mean reversion led to the identified effects. While it is impossible in field studies to definitively disprove such
confounds, observing the plotted effect sizes over time helps alleviate concerns (Gertler et al. 2011). Finally, to
ensure that our results did not depend on changes at a specific control plant, we repeated each regression four
times, excluding one control plant from the analysis each time. All results remain highly consistent, with the
exception of the minutes late result when excluding Plant 3. We note that our theory provides no prediction for
this regression, since any change in minutes late would combine conflicting effects from improved tardiness and
potential gaming, and because the award program is only based on tardiness and attendance, not minutes late.
-------------INSERT FIGURE 2 HERE-------------- Heterogeneous Employee Response
Since our theoretical predictions all involve heterogeneous responses by employees based on their pre-award
motivation, we split all workers into groups based on their propensity for tardiness in the twelve months before
the award was put in place. Nearly 32% of workers had no tardies during that period, while 20% were tardy
once a month or more. Between these extremes, just over 10% were tardy once every six months or less, 12%
were tardy once every four to six months, and 26% were tardy every month to three months.
We split the sample into “low tardy” and “high tardy” groups at the median level of pre-award
tardiness—one tardy every four months. This yields 116 “low tardy” and 102 “high tardy” workers. The “low
tardy” group corresponds to our “internally-motivated” employee designation, since they exhibited high
punctuality performance before any formal reward for this task. The “high tardy” group corresponds to the
“reward-motivated” group that exhibited frequent tardiness pre-award. We also repeated our models using
alternative “low tardy” definitions that include every possible cutoff up to one tardy every four months as well
as only those employees with no pre-award tardies. Our results are also robust to splitting the sample into three
“no tardy,” “low tardy,” and “high tardy” groups.
The use of the tardy groupings to proxy for internally- and reward-motivated employees is admittedly
imperfect. Some “high tardy” employees may be performing at their highest possible level on the attendance
dimension, given constraints outside of work such as commute, family, and health. By our definition, since
these employees were performing as well as they could, they should be classified as “internally-motivated.”
However, lacking data on external constraints, we believe pre-award tardiness levels is the best available proxy
20

for pre-reward attendance motivation. We also note that should this proxy be invalid, the award should not
differentially affect high and low tardy workers, and the bias therefore goes against our predicted effect.
There are two equivalent methods for comparing heterogeneous treatment effects in DiD models
(Fink et al. 2012): interaction effects and subsample analysis. We report subsample analyses to avoid difficulty
in interpretation from triple interactions (Gelman and Pardoe 2007). These subsample analyses, like all models
in this paper, are relative to the relevant control group of employees. A subsample analysis focusing on, for
example, the effect on employees with perfect pre-award attendance compares the behavior of perfect
employees at the treatment plant with perfect ones at control plants.
The effect of the award on tardy and minutes late is shown in Table 4. The “high tardy” group decreases
its rate of tardiness by 2 percentage points, or about 36% from a baseline of 5.6%, supporting Prediction 1.
While there is no corresponding reduction in minutes late, this non-result does not contradict Prediction 1,
because minutes late was not part of the award program; only tardiness and absences were rewarded. In fact, the
significant result for tardiness and non-result for minutes late provides initial evidence for Proposition 2—that
reward-motivated employees game award eligiblity rules by clocking in less than five minutes late, rather than
by truly improving average punctuality. This effect can be seen clearly in Figure 3, which shows the percentage
change for “high tardy” workers in the treatment and control plants at all values of minutes late. The treatment
plant has a large reduction in employees clocking in seven or more minutes late, but nearly all of the change
appears in the mass of employees clocking in between four and five minutes late. Employees in the treatment
plant are over 50% more likely to clock-in just before this five minute cutoff compared to the control group
after award introduction. There are no other improvements in minutes late when compared to the control group.
-------------INSERT TABLE 4 AND FIGURE 3 HERE--------------
Table 5, which shows the treatment effect on the absence and single absence variables, contains further
evidence supporting Prediction 2. The positive and significant results on single absence for both “high tardy” and
“low tardy” employees suggests both groups were significantly more likely to take an isolated day off. Our
interviews suggest this result was caused by employees calling in sick on days they otherwise would have arrived
late. It is inconceivable that the award caused employees to become briefly sick more often, but is consistent
with agency theory predictions that employees would call in sick to maintain award eligibility.
21

-------------INSERT TABLE 5 HERE--------------
We note that our evidence of manipulation by the “low tardy” workers suggests that the award may
crowd out internal motivation, thereby supporting Prediction 4. While the overall performance for the “low
tardy” group on tardy and minutes late did not change, the award appears to shift internally-motivated employees
toward a reward-oriented lens that motivates gaming. Table 5 also suggests that low tardy employees are more
likely to be absent overall after the award is introduced. Although there are several potential mechanisms for
this result, our interviews suggest that the award caused “low tardy” workers to more carefully consider their
paid time off time for plannable events such as vacations and non-urgent medical and dental appointments.
We next test Prediction 3 from agency theory that eligibility loss would cause reward-motivated
employees to revert to their previous poor performance. To do so, we split the treatment dummy variable into
two separate indicators based on the employee’s status when clocking in on a given day: a pre-fail dummy
indicating that she was award-eligible and a post-fail dummy that she was already disqualified for the current
month. For each treatment day, one or the other of these variables equals 1.
The results for the tardy dependent variable are shown in Table 6. The “high tardy” group reduces its
level of tardiness while eligible for the award (as shown by the negative and significant coefficient on the pre-fail
dummy). However, because the post-fail coefficient is not significantly different from zero, it is also not
significantly different from the pre-fail coefficient (T-test p-value=0.64), so we cannot reject either the
possibility of habituation or of reversion to pre-award levels. The inconclusive evidence on motivation
reversion (Prediction 3) may simply reflect insufficient sample size, especially given the relatively low number
of workers who are disqualified from the award in a given month (approximately 1/3).
-------------INSERT TABLE 6 HERE--------------
In sum, the subsample analysis strongly supports Predictions 1 and 2, and provides inconclusive
evidence of Prediction 3. Reward-motivated employees improve on the awarded task, but also game program
rules through single absences and barely avoiding tardies. Our results therefore corroborate existing research
on the benefits of awards in motivating certain workers, but also suggest that awards generate gaming behavior
consistent with responses to monetary rewards.
Crowding Out Internal Motivation
22

Table 6 also provides direct evidence for Prediction 4—that the extrinsic award crowds out internal motivation.
The positive and significant coefficient on post-fail for the “low tardy” group suggests that once a “low tardy”
employee is disqualified for the month’s award, she is 5.5 times more likely than “low tardy” control employees
to have a second attendance or punctuality failure (p-value<0.05). The non-effect in the pre-fail period is also
consistent with our argument that extrinsic rewards provide an ambiguous prediction of an internally-motivated
employee’s performance so long as she is still eligible for the award. We note, however, that the already
high-performance of “low tardy” employees mechanically limits their potential for improvement.
Negative Motivational Spillovers on Nonawarded Tasks
We next examine the award’s effect on performance in a separate task domain: Efficiency. Since the
daily efficiency measure of LaundryCo employees is based on their precise working time, their performance
measure, and thus their hourly pay, is not affected by punctuality or attendance. This is especially true because
exact punctuality on a given day generally does not affect take-home pay; employees clocking in seven or less
minutes late are paid as if they started on time. In only 1.8% of observations do employees clock in eight or
more minutes late. Our results are not affected by using only the 98.2% of observations in which an employee
is no more than seven minutes late. Therefore, any increased effort or attention to punctuality will not in itself
reduce efficiency through an overall effort constraint. The two tasks are simply not linked in any way.
We first analyze whether the award introduction affected employees’ efficiency on their assigned
laundry tasks. The results, shown in columns 1 and 2 of Table 7, show that internally-motivated “low tardy”
employees suffer a drop in efficiency of over 9 points, a reduction of over 8%. In contrast, the efficiency of
“high tardy” employees does not change, consistent with our argument that reward-motivated employees
would not feel that the award violated their psychological contract. This result also suggests that alternative
explanations for the reduced efficiency, such as workers interpreting the award as a signal from managers about
the relative importance of tasks, are unlikely, since only the low tardy group was affected.
We next address another alternative explanation. If, as we argue, internally-motivated employees are
truly upset about the attendance award itself, then the negative emotional spillover on efficiency should occur
immediately. Alternatively, if they lose motivation for this second, unrelated task because of lost award
23

eligibility, we would not see the effect until eligibility is lost. Columns 3 and 4 of Table 7 show the same results
broken down by award eligibility. As expected from Prediction 5, the efficiency reduction appears larger while
the “low tardy” employee is still eligible for the award; the result on the post-fail dummy is also positive, but
with a p-value of only 0.17, likely because there are few employee-days for the “low tardy” group in the post-fail
cell. The coefficients for the pre- and post-fail dummies are nearly identical (T-test p-value=0.94). Consistent
with our theory, the reduced laundry task efficiency occurs immediately and is not from award eligibility loss.
A final alternative explanation is that the “low-tardy” workers, which we argue are
internally-motivated, are instead more reward-motivated to achieve bonus pay. Under this explanation, low
tardy employees should also have high efficiency. Yet Table 2 shows a very small negative correlation between
the two variables; in fact, “low tardy” and “high tardy” workers have similar average efficiency prior to the
award (121.16 vs. 121.76). Furthermore, when splitting the “low tardy” group into high- and low-efficiency
sub-samples, we see no distinguishable difference in response by the two groups; “low tardy” employees with
low efficiency appeared to have a similar response to the award as “low tardy” employees with high efficiency.
Considering all this evidence, we do not believe reward-based motivation can explain differences in
pre-award attendance behavior. Consistent with our theory of negative spillovers resulting from reduced
internal motivation, we see immediate, sustained decreases in efficiency only for the “low tardy” employees
who had high pre-award internal motivation toward attendance.
-------------INSERT TABLE 7 HERE--------------
Empirical Limitations
Like many similar studies, ours has limitations. First, worker assignment to treatment and control groups was
not random, and there were group differences such as the non-union status of the four control plants. These
fixed differences, along with others, are “differenced out” by the DiD methodology, but this approach does
assume common time trends across groups. We interviewed managers at the treatment and control plants and,
except for an annual health screening offered to control plant employees in April 2011,2 managers reported no
policy or management changes near the award introduction. We also note that the monthly treatment model
(Figure 2) shows the largest effects to occur in the month after treatment. This suggests that neither the health
2 See Gubler and Pierce (2014).
24

intervention nor any other unobserved change not exactly correlated with treatment could explain our results.
It could also be that our results are due to poor planning or program administration and not the
program itself. But interviews suggest that the managers carefully considered and administered the program.
Interviews with corporate management also reflected high confidence in the competence of the Plant 1
managers. Still, in studies like ours, it is impossible to completely separate the effect of the program design,
which has large external validity, from the effect of the management or implementation.
Finally, we cannot definitively prove the mechanism by which the attendance award negatively affected
some workers’ efficiency. Our explanation that the award crowded out intrinsic motivation is theoretically
appealing, especially given strong laboratory evidence on crowding out. Also, as discussed above, our empirical
results are inconsistent with at least two major alternative explanations. However, as in most field studies, this
interpretation is speculative, since we cannot directly measure intrinsic motivation nor what motivated high
pre-award attendance performance. Several other alternative explanations exist besides intrinsic motivation,
such as prosocial tendencies or individual differences in response to social pressure. Our results do show,
however, that whatever the motivational mechanism was, the award reduced it for some employees.
Discussion and Conclusion
This study shows awards can carry substantial costs stemming from three factors – gaming the award system’s
rules, crowding out motivation of those who were previously internally motivated towards the awarded task,
and most crucially the motivation reduction for other important yet independent tasks. Our results stand in
contrast to the burgeoning set of studies showing purely beneficial effects from awards and other programs
that promote social recognition of high performers. Although our results corroborate many award benefits,
these gains were driven entirely by the subset of reward-motivated workers who lack internal motivation for
consistent attendance and punctuality. In contrast, the costs of the award program came from all workers.
The negative motivational spillovers and other costs from the award program had large financial
implications for LaundryCo. The managers anticipated that the direct award cost of $75 per month (the gift
card) would easily “pay for itself” as better attendance reduced bottlenecks, thus improving productivity.
However, aggregating our coefficient estimates allows us to estimate a minimum monthly program cost of
25

between $1,497 and $3,302—at least 1.4% of total monthly labor costs. The majority of this cost came from
reduced overall worker efficiency of 1.4 to 3.1%, plus increased single absences that reduced overall worker
output by 0.6%. Although these absences may simply replace future PTO days, managers noted that any
absence without advance notice is costly. These costs dwarfed the $75 monthly cost of the gift card, as well as
the 0.12% increase in worker output from additional working minutes motivated by the award. At minimum,
the award was thus at least 20 times more costly than anticipated by management. Given that a 1% plant
efficiency decrease is equivalent to losing 1/3 of a worker, these results clearly indicate that awards can carry
significant costs for firms that fail to implement them wisely.
The significant award costs identified in this study were predicted by integrating theory from
economics and social psychology. Prior work has assumed that awards carry few if any of the costs of monetary
rewards. However, our results suggest that awards act more like monetary incentives than subtle nudges. The
fact that awards usually do not carry great monetary value does not mean they are only a subtle influence on
worker behavior. A corporate award is, after all, a formal program designed by management to provide
extrinsic rewards, and not simply a small difference in framing.
Our negative motivational spillover results complement Neckermann et al.’s (2014) important study
that shows positive spillovers from an award program. Comparing the two studies highlights why more
nuanced and comprehensive theory on awards is needed. The awards in their setting were for positive behavior
identified by managers, with criteria announced to workers only after the award was given. Thus,
reward-motivated employees could not change their behavior in order to win. Also, the positive spillovers they
document may simply have been employees inferring what behaviors managers would choose to reward next.
In our study, however, the criteria for winning were known in advance. As noted by Larkin (2010) and Garr
(2012), both types of awards—those that ex-post recognize undisclosed behavior and those governed by
established ex-ante rules—are widely used. As with monetary incentives, there are many dimensions on which
award programs vary. As these award types vary, so too will their costs and benefits. We therefore caution
readers in applying our results to all award types. The major takeaway of this paper is not that awards are
universally negative, just as we believe that the existing literature is wrong to imply that awards are universally
26

positive. Rather, our results point to the need to carefully consider the benefits and costs of awards programs.
One major contribution of this study is to combine the careful, cost-benefit approach of economics
with attention to non-monetary factors that affect motivation. Economists have only recently considered the
psychological effects of incentive programs. On the other hand, social psychologists have typically focused on
individual responses to incentive programs, rather than on how behavioral responses impact broader firm
policy (Nickerson and Zenger 2008; Larkin et al. 2012). This study provides further evidence that scholars must
incorporate the strengths of both approaches: the holistic, cost-benefit lens of economics and the realistic
model of human behavior, with biases and emotions, from social psychology.
We hope that another contribution of this paper is to help scholars and practitioners design award
programs more systematically. Many corporate award programs do not account for heterogeneity in employee
motivation or for multiple employee tasks. Nor do they consider that beginning to formally recognize future
performance on a specific task may seem unfair to employees who had previously performed it well. Our
results suggest future work must begin to define the critical award parameters that generate both benefits and
costs. It must also explore how the efficacy of award types depends on production technology and other
organizational design elements, important work recently begun by Gallus and Frey (2015).
Although our study does not directly show crowding out, it does suggest that employees who
previously performed well without explicit reward or compensation—showing up consistently on time for their
shift—reduced this behavior after award introduction. The notion of crowding out is usually applied to
monetary rewards, with recent work suggesting that nonmonetary rewards do not, for example, reduce
prosocial blood donations (Goette and Stutzer 2008; Lacetera et al. 2012). In contrast, our results suggest that
crowding out may also apply to extrinsic but nonmonetary rewards such as corporate awards. In addition,
crowding out is usually focused on reduced motivation for actions that are compensated. Our results suggest
that compensating one action can also lead to crowding out in a completely different realm, the first evidence
of such negative motivational spillovers of which we are aware.
Existing research further suggests that the long-term costs from demotivation, particularly following
program termination, may be even greater than the short-term gains that come from the introduction of an
27

award (Meier 2007). We obtained data from LaundryCo on attendance and efficiency after Plant 1 removed the
attendance award; however, because the plant managers responded to the award removal with both increased
emphasis on attendance and more strict application of existing disciplinary rules, we cannot unpack the effect
of the award removal from this shift in managerial attention. Interestingly, our analysis of the post-removal data
(results available on request) does show that the negative motivational spillovers to the efficiency of “low
tardy” workers persisted even after award removal. This is consistent with Gneezy and Rustichini’s (2000a)
study of Israeli daycare, where the introduction and then removal of a monetary fine led to long-term
reductions in parent punctuality.
Finally, our study suggests that the antecedents of negative motivational spillovers require further
research. Awards are rarely used for workers’ primary tasks, which are typically rewarded with monetary
compensation (Garr 2012). In our setting, the less-important awarded task was attendance, while the primary
efficiency task was financially compensated. Our theory and empirical results suggest that even without a
common effort or attention constraint, a reward introduced for a less important task may spill over to the
primary task. Future work must unpack the mechanisms underlying negative motivational spillovers because, as
our study shows, the economic costs to individual and organizational performance can be substantial.
28

References Acland, D., and M. Levy, 2012. “Naiveté, projection bias and habit formation in gym attendance.” Working paper, UC
Berkeley. Adams, J. S., 1965. Inequity in Social Exchange. New York: Academic Press. Allcott, H., and T. Rogers, 2014. “The short-run and long-run effects of behavioral interventions: Experimental evidence
from energy conservation.” American Economic Review, 104(10): 3003-37. Amabile, T. M., 1993. “Motivational synergy: Toward new conceptualizations of intrinsic and extrinsic motivation in the
workplace.” Human Resource Management Review, 3: 185–201. Amabile, T. M., K. G. Hill, B. A. Hennessey, and E. M. Tighe, 1994. “The work preference inventory: Assessing intrinsic
and extrinsic motivational orientations.” Journal of Personality and Social Psychology, 66: 950–967. Ariely, D., A. Bracha, and S. Meier, 2009. “Doing good or doing well? Image motivation and monetary incentives in
behaving prosocially.” American Economic Review, 99: 544–555. Ashraf, N., O. Bandiera, and S. S. Lee, 2014. “Awards unbundled: Evidence from a natural field experiment.” Journal of
Economic Behavior & Organization, 100: 44-63, Bareket-Bojmel, L., G. Hochman, and D. Ariely, 2015. “It’s (not) all about the Jacksons: Testing different types of
short-term bonuses in the field.” Journal of Management, forthcoming. Benabou, R., and J. Tirole, 2003. “Intrinsic and extrinsic motivation.” The Review of Economic Studies, 70(3): 489-520. Benabou, R., and J. Tirole, 2006. “Incentives and prosocial behavior.” American Economic Review, 96: 1652–1678. Bertrand, M., E. Duflo, and S. Mullainathan, 2004. “How much should we trust differences-in-differences estimates?”
Quarterly Journal of Economics, 119: 249–275. Besley, T., and M. Ghatak, 2008. “Status incentives.” American Economic Review, 98: 206–211. Blanes i Vidal, J., and M. Nossol, 2011. “Tournaments without prizes: Evidence from personnel records.” Management
Science, 57: 1721–1736. Boudreau, K.J., N. Lacetera, and K.R. Lakhani, 2011. Incentives and problem uncertainty in innovation contests: An
empirical analysis. Management Science, 57(5) 843–863. Bradler, C., R. Dur, S. Neckermann, and A. Non, 2014. “Employee recognition and performance: A field experiment.”
IZA DP No. 8311. Carpenter, J., P. Matthews, and J. Schirm, 2010. Tournaments and office politics: Evidence from a real effort experiment.
American Economic Review, 100(1) 504-517. Casas-Arce, P., and F. Martínez-Jerez, 2009. Relative performance compensation, contests, and dynamic incentives.
Management Science, 55(8): 1306-1320. Cullinane, N., and T. Dundon, 2006. “The psychological contract: A critical review.” International Journal of
Organisational Behavior, 18: 205–224. Davidson, L., 1999. “The power of personal recognition.” Workforce, 78: 44–49. Deci, E. L., 1971. “Effects of externally mediated rewards on intrinsic motivation.” Journal of Personality and Social
Psychology, 18: 105–115. Deci, E. L., R. Koestner, and R. M. Ryan, 1999. “A meta-analytic review of experiments examining the effects of extrinsic
rewards on intrinsic motivation.” Psychological Bulletin 125: 627–668. Deci, E. L., and R. M. Ryan, 1985. Intrinsic Motivation and Self-Determination in Human Behavior. New York: Plenum. Deci, E. L., and R. M. Ryan, 2002. “Overview of self-determination theory: An organismic dialectical perspective.” In
Deci, E.L. and R.M. Ryan (eds.), Handbook of Self-determination Research: 3–33. Rochester, NY: Rochester University Press.
Edelman, B. G., and I. Larkin, 2014. “Social comparisons and deception across workplace hierarchies: Field and experimental evidence.” Organization Science, 26(1): 78-98.
Eisenberger, R., L. Rhoades, and J. Cameron, 1999. “Does pay for performance increase or decrease perceived self-determination and intrinsic motivation?” Journal of Personality and Social Psychology, 77: 1026–1040.
Festinger, L., 1954. “A theory of social comparison processes.” Human Relations, 7: 117–140. Fink, G., M. McConnell, and S. Vollmer, 2012. “Testing for heterogeneous treatment effects in experimental data: False
discovery risks and correction procedures.” http://www3.wiwi.uni-hannover.de/Forschung/Diskussionspapiere/dp-477.pdf.
Fliessbach, K., B. Weber, P. Trautner, T. Dohmen, U. Sunde, C. E. Elger, and A. Falk, 2007. “Social comparison affects reward-related brain activity in the human ventral striatum” Science, 318(5854): 1305-1308.
Frank, D. H., and T Obloj, 2014. “Firm-specific human capital, organizational incentives, and agency costs: Evidence from retail banking.” Strategic Management Journal, 35(9): 1279-1301.
Frey, B., 2006. “Giving and receiving awards.” Perspectives in Psychological Science, 1: 377–388.
29

Frey, B., 2007. “Awards as compensation.” European Management Review, 4: 6–14. Frey, B., and S. Neckermann, 2008. “Awards: A view from psychological economics.” Journal of Psychology, 216: 198–
208. Frey, B., and F. Oberholzer-Gee, 1997. “The cost of price incentives: An empirical analysis of motivation crowding-out.”
American Economic Review, 87: 746–755. Gallus, J., and B. Frey, 2015. “Awards: A strategic management perspective.” Strategic Management Journal, forthcoming. Garr, S., 2012. The State of Employee Recognition in 2012. Oakland, CA: Bersin and Associates. Gelman, A., and P. Pardoe, 2007. “Average predictive comparisons for models with nonlinearity, interactions, and
variance components.” Sociological Methodology 37: 23–51. Gerhart, B., S. Rynes, and S. Fulmer, 2009. “Pay and performance: Individuals, groups, and executives.” Academy of
Management Annals, 3: 251–315. Gertler, P. J., S. Martinez, P. Permand, L. B. Rawlings, and C. M. J. Vermeersch, 2011. Impact Evaluation in Practice.
Washington DC: World Bank. Gino, F., and L. Pierce, 2009. “Dishonesty in the name of equity.” Psychological Science, 20: 1153–1160. Gneezy, U., S. Meier, and P. Rey-Biel, 2011. “When and why incentives (don’t) work to modify behavior.” Journal of
Economic Perspectives, 25: 191–210. Gneezy, U., and A. Rustichini, 2000a. “A fine is a price.” Journal of Legal Studies 29: 1–18. Gneezy, U., and A. Rustichini, 2000b. “Pay enough or don’t pay at all.” Quarterly Journal of Economics, 115: 791–810 Goette, L., and A. Stutzer, 2008. “Blood donations and incentives: Evidence from a field experiment.”
http://ssrn.com.libproxy.wustl.edu/abstract=1158977. Grant, A. M., 2007. “Relational job design and the motivation to make a prosocial difference.” Academy of Management
Review, 32: 393-417. Grant, A. M., and F. Gino, 2010. “A little thanks goes a long way: Explaining why gratitude expressions motivate prosocial
behavior.” Journal of Personality and Social Psychology, 98: 946–955. Grant, A. M., and D. M. Mayer, 2009. “Good soldiers and good actors: Prosocial and impression management motives as
interactive predictors of affiliative citizenship behaviors.” Journal of Applied Psychology, 94: 900–912. Greenberg, J., 1990. “Employee theft as a reaction to underpayment inequity: The hidden cost of pay cuts.” Journal of
Applied Psychology, 75: 561–568. Gubler, T., and L. Pierce, 2014. “Healthy, wealthy, and wise: Retirement planning predicts health improvements.”
Psychological Science, 25: 1822-1830. Holmas, T. H., E. Kjerstad, H. Luras, and O. R. Straume, 2010. “Does monetary punishment crowd out pro-social
motivation? A natural experiment on hospital length of stay” Journal of Economic Behavior & Organization, 75: 261–267.
Hölmstrom, B., and P. Milgrom, 1991. “Multitask principal-agent analyses: Incentive contracts, asset ownership, and job design.” Journal of Law, Economics, & Organization, 7: 24–52.
Hölmstrom, B., 1979. "Moral hazard and observability," Bell Journal of Economics, 10(1): 74-91. Hossain, R., and K. K. Li, 2014. “Crowding out in the labor market: A prosocial setting is necessary.” Management
Science, 60: 1148–1160. Hounkannounon, B., 2011. Bootstrapping Difference in Differences Estimates. Universite de Montreal Working Paper,
http://reservebank.govt.nz/research_and_publications/seminars_and_workshops/feb2012/4682249.pdf Huberman, B. A., C. H. Loch, and A. Önçüler, 2004. “Status as a valued resource.” Social Psychology Quarterly, 67: 103–
114. John, L., G. Loewenstein, and S. Rick, 2014. “Cheating more for less: Upward social comparisons motivate the poorly
compensated to cheat.” Organizational Behavior and Human Decision Processes, 123: 101-109. Kerr, S., 1975. “On the folly of rewarding A, while hoping for B.” Academy of Management Journal 18: 769–783. Kosfeld, M., and S. Neckermann, 2011. “Getting more work for nothing? Symbolic awards and worker performance.”
American Economic Journal: Microeconomics, 3: 86–99. Kosfeld, G., S. Neckermann, and X. Yang, 2014. “Knowing that you matter, matters! The interplay of meaning, monetary
incentives, and worker recognition.” IZA DP No. 8055: http://repec.iza.org/dp8055.pdf Kuhnen, C. M., and A. Tymula, 2010. “Feedback, self-esteem, and performance in organizations.” Management Science,
58: 94–113. Lacetera, N., and M. Macis, 2010. “Social concerns and prosocial behavior: Field evidence from a nonlinear incentive
scheme.” Journal of Economic Behavior & Organization, 76: 225–237. Lacetera, N., M. Macis, and R. Slonim, 2012. “Will there be blood? Incentives and displacement effects in pro-social
30

behavior.” American Economic Journal: Economic Policy, 4: 186–223. Lahiri S. N., 2003. Resampling Methods for Dependent Data, Springer Series in Statistics, Sinpring-Verlag, New York. Larkin, I., 2010. “Paying $30,000 for a gold star: An empirical investigation into the value of peer recognition to software
sales people.” Unpublished working paper. Larkin, I., 2014. “The cost of high-powered incentives: Employee gaming in enterprise software sales.” Journal of Labor
Economics, 32: 199–227. Larkin, I., L. Pierce, and F. Gino, 2012. “The psychological costs of pay-for-performance: Implications for the strategic
compensation of employees.” Strategic Management Journal, 33: 1194–1214. Lazear, E., 2000. “Performance Pay and Productivity.” American Economic Review, 90: 1346-1361 Lawler, E. E., 1996. “Competencies: A poor foundation for the new pay.” Compensation and Benefits Review, 28(6):
20-26. Lepper, M. R., and D. Green, 1978. The Hidden Costs of Reward: New Perspectives on the Psychology of Human
Behavior. Hillsdale, NY: Erlbaum. Lin, A., R. Adolphs, and A. Rangel. 2012. “Social and monetary reward learning engage overlapping neural substrates.”
Social Cognitive and Affective Neuroscience. 7(3): 274-281. Locke, E.A., K. N. Shaw, L. M. Saari, and G. P. Latham, 1981. “Goal setting and task performance: 1969-1980.”
Psychological Bulletin, 90: 125-152. MacNeil, I. R., 1985. “Relational contract: What we do and do not know.” Wisconsin Law Review, 99: 483–525. Markham, S. E., K. D. Scott, and G. H. McKee, 2002. “Recognizing good attendance: A longitudinal, quasi-experimental
field study.” Personnel Psychology, 55: 639–660. Mas, A., and E. Moretti, 2009. “Peers at work.” American Economic Review, 99: 112–145. Meier, S., 2007. “Do subsidies increase charitable giving in the long run? Matching donations in a field experiment.”
Journal of the European Economic Association, 5: 1203–1222. Milgrom, P., and J. Roberts, 1991. “Adaptive and sophisticated learning in normal form games.” Games and Economic
Behavior, 3: 82–100. Moldovanu, B., A. Sela, and X. Shi, 2007. “Contests for status.” Journal of Political Economy, 115: 338–363. Neckermann, S., and B. Frey, 2013. “The motivating power of employee awards.” The Journal of Socio-Economics, 46:
66-77. Neckermann, S., R. Cueni, and B. Frey, 2014. “Awards at work.” Labour Economics, 31: 205-217. Nickerson, J. A., and T. R. Zenger, 2008. “Envy, comparison costs, and the economic theory of the firm.” Strategic
Management Journal 29: 1429–1449. Obloj, T., and M. Sengul, 2012. “Incentive life-cycles: Learning and the division of value in firms.” Administrative Science
Quarterly, 57: 305–347. Oyer, P., 1998. “Fiscal year ends and nonlinear incentive contracts: The effect on business seasonality.” Quarterly Journal
of Economics, 113: 149–185. Prendergast, C., 1999. “The provision of incentives in firms.” Journal of Economic Literature, 37: 7–63. Robinson, S. L., and D. M. Rousseau, 1994. “Violating the psychological contract: Not the exception but the norm.”
Journal of Organizational Behavior, 15: 245–259. Rousseau, D. M., 1990. “New hire perceptions of their own and their employer’s obligations: A study of psychological
contracts.” Journal of Organizational Behavior, 11: 389-400. Rousseau, D. M., and M. M. Greller, 1994. “Human resource practices: Administrative contract makers.” Human
Resource Management, 33: 385–401. Rousseau, D. M., and J. M. Parks, 1993. “The contracts of individuals and organizations.” Research in Organizational
Behavior, 15: 1–43. Sauermann, H., and W. Cohen, 2010. “What makes them tick? Employee motives and firm innovation.” Management
Science, 56: 2134-2153. Scott, D., and S. Markham, 1982. “Absenteeism control methods: A survey of practices and results.” Personnel
Administrator 27: 73–84. Silverman, M., 2004. “Non-financial recognition: The most effective of rewards.” Institute for Employment Studies
Research Network. Stewart, J., 2009. “Tobit or not Tobit?” http://papers.ssrn.com/sol3/papers.cfm?abstract_id=1515135. Wrzesniewski, A., B. Schwartz, X. Cong, M. Kane, A. Omar, and T. Kolditz, 2014. “Multiple types of motives don’t
multiply the motivation of West Point cadets.” Proceedings of the National Academy of Sciences, 111(30): 10990-10995.
31

Table 1: Descriptive Statistics at Worker/Day Level TREATMENT Pre-Award Award Period Variable Obs Mean Sd Min Max Obs Mean Sd Min Max Tardy 7126 0.04 0.20 0.0 1.0 5742 0.03 0.16 0.0 1.0
Minutes late 7126 -1.73 5.37 -59.7 54.0 5737 -2.19 5.10 -49.0 58.2
Total absences 7846 0.04 0.19 0.0 1.0 6318 0.05 0.21 0.0 1.0 Single absences 7846 0.01 0.07 0.0 1.0 6318 0.01 0.11 0.0 1.0 Daily efficiency 6576 125.6 32.4 54.5 218.0 5669 124.7 36.2 54.5 218.0 Late 7126 0.15 0.35 0.0 1.0 5742 0.10 0.29 0.0 1.0 Monthly absences 7861 0.79 1.65 0.0 8.0 6339 1.03 1.80 0.0 10.0 Total hrs worked 7861 8.25 1.64 0.0 23.7 6339 8.17 1.69 0.0 13.1 Tenure 7861 3373 2681 176 9262 6339 3186 2708 176 9262
Age 7861 43.51 10.05 21.0 62.0 6339 43.63 9.84 21.0 62.0
Male 7861 0.43 0.50 0.0 1.0 6339 0.43 0.49 0.0 1.0 Base salary 7861 25695 845 19240 28600 6339 25495 1363 19240 28600 CONTROL Pre-Award Award Period
Variable Obs Mean Sd Min Max Obs Mean Sd Min Max
Tardy 23600 0.03 0.17 0.0 1.0 14081 0.02 0.15 0.0 1.0 Minutes late 23600 -2.12 4.73 -59.4 59 14081 -1.88 5.07 -59 59 Total absences 27449 0.05 0.22 0.0 1.0 16300 0.05 0.22 0.0 1.0 Single absences 27449 0.02 0.13 0.0 1.0 16300 0.02 0.12 0.0 1.0 Daily efficiency 22320 120.3 34.7 54.5 218.0 14148 125.3 35.6 54.5 218.0 Late 23600 0.17 0.38 0.0 1.0 14081 0.14 0.34 0.0 1.0 Monthly absences 27684 1.06 1.76 0.0 15.0 16474 1.13 1.78 0.0 12.0 Total hrs worked 27684 8.01 1.38 0.0 44.0 16474 8.09 1.25 0.0 16.37 Tenure 27684 1720 1920 4.0 8566 16474 1754 1992 60 8566 Age 27684 39.36 12.88 18.0 69.0 16474 39.87 12.79 19.0 69.0 Male 27684 0.34 0.47 0.0 1.0 16474 0.32 0.47 0.0 1.0 Base salary 27522 19850 4899 8320 48526 16474 197334 5167 8320 48526
Table 2: Correlations of Primary Variables
Tardy Minutes
late Absence Single
absence Efficiency Continuous
month Tardy 1
Minutes late 0.498 1
Absence 0.005 0.002 1
Single absence 0.007 0.002 0.845 1 Efficiency -0.015 -0.034 -0.003 -0.002 1 Continuous month -0.002 -0.002 -0.002 -0.001 0.027 1
Note: Correlations presented for primary variables at the daily worker level, using the efficiency sample. Individual fixed effects result in variables constant over time being dropped from the analyses. Correlations are similar to using the main attendance sample.
32

Table 3: Basic Treatment Effect
(1) (2) (3) (4) (5)
Dependent Variable: Tardy Minutes Late Absent
Single Absence Efficiency
Treatment -0.015*** -0.801** 0.007 0.006*** -1.992
(0.006) (0.343) (0.006) (0.002) (3.193)
Constant 0.020*** -2.057*** 0.051*** 0.023*** 117.353***
(0.006) (0.214) (0.009) (0.005) (9.036)
Time Controls Y Y Y Y Y Worker FE Y Y Y Y Y R2 0.053 0.127 0.019 0.013 0.513
# of employees 218 218 218 218 206
Observations 50,549 50,544 57,913 57,913 48,713 Note: Standard errors presented in parentheses are block bootstrapped with 400 repetitions. Significance levels: * p<0.10, ** p<0.05, *** p<0.01. The variable “Treatment” is the interaction of the treatment group and post award introduction dummies, and represents the estimated effect of the introduction of the award. The post award introduction dummy is coded as missing for observations after the award was removed.
Table 4: Sub-sample Analysis on “Tardy” and “Minutes Late”
(1) (2) (3) (4)
Dependent Variable: Tardy Tardy Minutes Late Minutes Late
Sample: Low Tardy High Tardy Low Tardy High Tardy Treatment 0.001 -0.020*** -1.144 -0.319
(0.004) (0.008) (0.730) (0.341)
Constant 0.002 0.035*** -2.872*** -1.348***
(0.004) (0.010) (0.301) (0.261)
Time controls Y Y Y Y Worker FE Y Y Y Y R2 0.015 0.046 0.184 0.089 # of employees 116 102 116 102 Observations 23,502 27,047 23,502 27,042
Note: Standard errors presented in parentheses are block bootstrapped with 400 repetitions. Significance levels: * p<0.10, ** p<0.05, *** p<0.01.
33

Table 5: Sub-sample Analysis on “Absence” and “Single Absence”
(1) (2) (3) (4)
Dependent Variable: Absence Absence Single Absence Single Absence Sample: Low Tardy High Tardy Low Tardy High Tardy Treatment 0.021*** 0.000 0.006** 0.006**
(0.008) (0.008) (0.003) (0.002)
Constant 0.050*** 0.051*** 0.026*** 0.020***
(0.013) (0.012) (0.007) (0.006)
Time controls Y Y Y Y Worker FE Y Y Y Y
R2 0.024 0.017 0.014 0.013 # of employees 116 102 116 102 Observations 27,114 30,799 27,114 30,799 Note: Standard errors presented in parentheses are block bootstrapped with 400 repetitions. Significance levels: * p<0.10, ** p<0.05, *** p<0.01.
Table 6: Effect of Losing Award Eligibility on Tardiness
(1) (2) (3) Dependent Variable: Tardy Tardy Tardy
Sample: ALL Low Tardy High Tardy Pre-fail treatment -0.017*** -0.002 -0.021**
(0.006) (0.003) (0.009)
Post-fail treatment -0.010 0.045** -0.016
(0.009) (0.021) (0.010)
Constant 0.020*** 0.002 0.035***
(0.006) (0.004) (0.010)
Time controls Y Y Y Worker FE Y Y Y R² 0.053 0.017 0.046 # of employees 218 116 102 Observations 50,549 23,502 27,047 Note: Standard errors presented in parentheses are block bootstrapped with 400 repetitions. Significance: * p<0.10, ** p<0.05, *** p<0.01.
34

Table 7: Treatment Effects on Efficiency by Employee Type (1) (2) (3) (4)
Dependent Variable: Efficiency Efficiency Efficiency Efficiency
Sample: Low Tardy High Tardy Low Tardy High Tardy
Treatment -9.551*** 2.052
(3.273) (4.415)
Pre-fail treatment -9.815*** 2.018 (3.431) (4.535) Post-fail treatment -9.327 3.152
(6.735) (4.011) Constant 97.725*** 125.307*** 118.871*** 127.393***
(22.685) (8.822) (3.016) (3.388)
Time controls Y Y Y Y
Worker FE Y Y Y Y
R2 0.547 0.495 0.549 0.506 # of employees 109 97 109 97 Observations 22,450 26,263 21,303 24,822 Note: Standard errors presented in parentheses are block bootstrapped with 400 repetitions. Significance: * p<0.10, ** p<0.05, *** p<0.01
Figure 1: Monthly Treatment Effect on Tardiness
0.0
5.1
.15
Tard
y %
0 20 40 60 80 100Week
Treatment ControlTreatment Fit Control Fit
Note: Fit lines estimated using 4th degree polynomials
35

Figure 2: Monthly Treatment Effect on Minutes Late
Figure 3: Change in Minutes Late After Award Implementation for “High Tardy” Group
Note: Percentage changes represent changes from the initial baseline clock-‐in frequency for each minute interval.
−2−1
01
Trea
tmen
t Effe
ct
0 2 4 6 8 10Month
Coefficient Estimate 95% Confidence Interval
-‐80%
-‐60%
-‐40%
-‐20%
0%
20%
40%
60%
<0 0-‐1 1-‐2 2-‐3 3-‐4 4-‐5 5-‐6 6-‐7 7-‐8 8-‐9 9-‐10 10
% Change In M
inutes Late Pre/Po
st
Minutes Late
Control Treatment
EARLY LATE, NOT TARDY LATE, TARDY
36
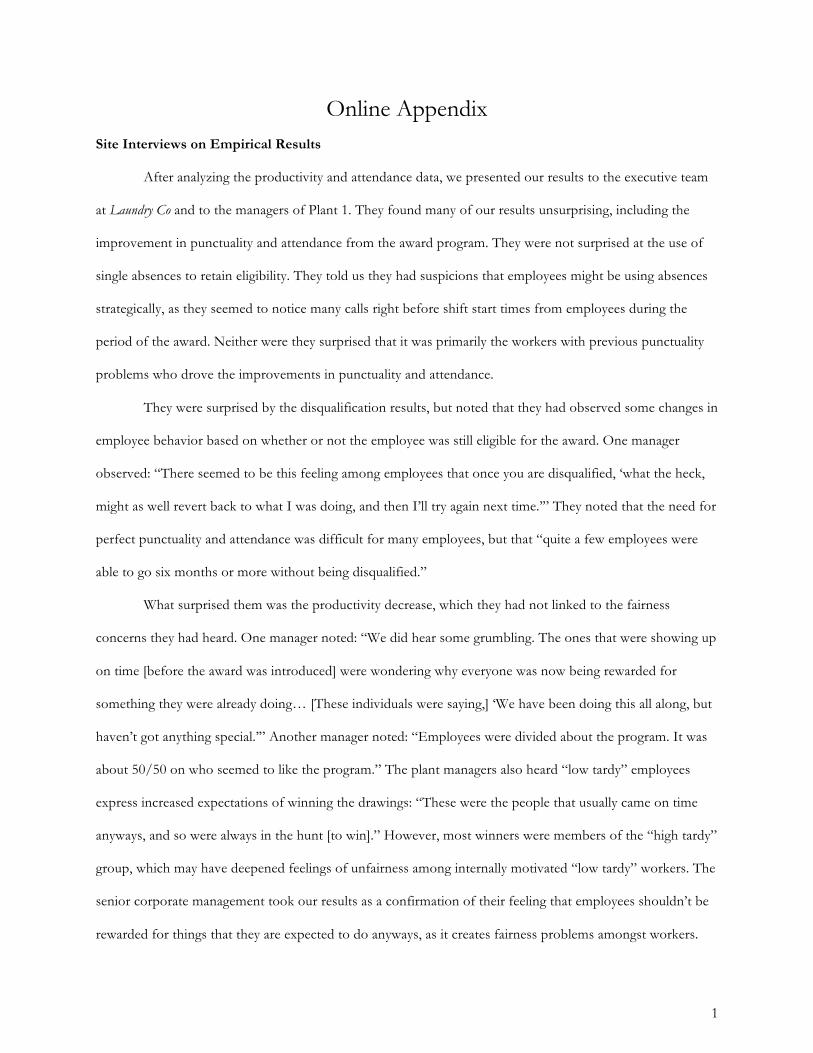
Online Appendix Site Interviews on Empirical Results
After analyzing the productivity and attendance data, we presented our results to the executive team
at Laundry Co and to the managers of Plant 1. They found many of our results unsurprising, including the
improvement in punctuality and attendance from the award program. They were not surprised at the use of
single absences to retain eligibility. They told us they had suspicions that employees might be using absences
strategically, as they seemed to notice many calls right before shift start times from employees during the
period of the award. Neither were they surprised that it was primarily the workers with previous punctuality
problems who drove the improvements in punctuality and attendance.
They were surprised by the disqualification results, but noted that they had observed some changes in
employee behavior based on whether or not the employee was still eligible for the award. One manager
observed: “There seemed to be this feeling among employees that once you are disqualified, ‘what the heck,
might as well revert back to what I was doing, and then I’ll try again next time.’” They noted that the need for
perfect punctuality and attendance was difficult for many employees, but that “quite a few employees were
able to go six months or more without being disqualified.”
What surprised them was the productivity decrease, which they had not linked to the fairness
concerns they had heard. One manager noted: “We did hear some grumbling. The ones that were showing up
on time [before the award was introduced] were wondering why everyone was now being rewarded for
something they were already doing… [These individuals were saying,] ‘We have been doing this all along, but
haven’t got anything special.’” Another manager noted: “Employees were divided about the program. It was
about 50/50 on who seemed to like the program.” The plant managers also heard “low tardy” employees
express increased expectations of winning the drawings: “These were the people that usually came on time
anyways, and so were always in the hunt [to win].” However, most winners were members of the “high tardy”
group, which may have deepened feelings of unfairness among internally motivated “low tardy” workers. The
senior corporate management took our results as a confirmation of their feeling that employees shouldn’t be
rewarded for things that they are expected to do anyways, as it creates fairness problems amongst workers.
1

Table A1: Descriptive Statistics at the Worker/Month Level
Table A2: Correlation Table for Dependent Variables
Tardy Minutes Late Absent Single Absence Efficiency Tardy 1.000
Minutes Late 0.498 1.000 Absent 0.005 0.002 1.000
Single Absence 0.007 0.002 0.845 1.000 Efficiency -0.015 -0.034 -0.003 -0.002 1.000
Table A3: Placebo Tests
Variable Random Treatment Group (50) Random Treatment Group and
Date (50)
Mean
Coefficient p < 0.1 p <0.05 Mean
Coefficient p < 0.1 p <0.05
Tardy -0.0006 6% 4% -0.0003 14% 6% Minutes late -0.1182 2% 2% -0.0969 12% 4%
Single absence 0.0015 6% 4% 0.0025 12% 8% Note: The average results of the placebo tests are shown above. For both types of placebos, the mean coefficient is both close to zero and significantly smaller than the corresponding coefficient from Table 3. Also, across the placebos the results are significant at close to the expected rate. We present the point estimate and 95% confidence intervals for each placebo regression of minutes late in Figure A1, which show that our point estimate has the smallest standard error of any of the individual placebos. Placebo regressions for our other models produced similar results. Overall, the placebo test results suggest that the treatment effects shown in Table 3 were actually a result of the treatment. The award program encouraged improved attendance behavior for workers in Plant 1, supporting Hypothesis 1. Standard errors in parentheses are clustered at the employee level. Significance levels: * p<0.10, ** p<0.05, *** p<0.01.
TREATMENT Pre-Award Award Period Variable Obs Mean Sd Min Max Obs Mean Sd Min Max % time tardy per month 33 0.07 0.08 0.0 0.37 33 0.06 0.06 0.0 0.19 # minutes late per month 33 -2.64 3.17 -11.4 3.74 33 -3.63 2.91 -9.67 0.21 % time late per month 33 0.20 0.17 0.0 0.59 33 0.16 0.15 0.0 0.47 % time absent per month 33 0.02 0.02 0.0 0.08 33 0.06 0.03 0.02 0.11 % time single absent per month 33 0.01 0.01 0.0 0.03 33 0.03 0.02 0.0 0.11
Average efficiency 32 122.1 22.4 87.5 168.0 32 122.9 25.8 75.0 169.4
CONTROL Pre-Award Award Period Variable Obs Mean Sd Min Max Obs Mean Sd Min Max % time tardy per month 185 0.04 0.06 0.0 0.33 106 0.05 0.11 0.0 1.0 # minutes late per month 185 -2.09 2.19 -13.33 5.4 106 -1.51 2.45 -10.5 8.31 % time late per month 185 0.20 0.22 0.0 0.95 106 0.24 0.20 0.0 1.0 % time absent per month 185 0.05 0.08 0.0 0.50 106 0.06 0.06 0.0 0.42 % time single absent per month 185 0.03 0.05 0.0 0.50 106 0.03 0.03 0.0 0.11
Average efficiency 174 110.0 30.3 54.5 217.8 99 122.3 29.5 66.9 218.0
2

Table A4: Pre- and Post-Fail Results for Minutes Late
(1) (2) (3)
Dependent Variable: Minutes late Minutes late Minutes late
Sample: ALL Low Tardy High Tardy
Pre-fail treatment -0.883** -1.165 -0.453
(0.357) (0.755) (0.327)
Post-fail treatment -0.469 -0.872 0.061
(0.357) (0.969) (0.422)
Constant -2.046*** -2.870*** -1.326***
(0.215) (0.303) (0.262)
Time controls Y Y Y
Worker FE Y Y Y
R² 0.127 0.185 0.089
# of employees 218 116 102
Observations 50,544 23,502 27,042 Note: Standard errors presented in parentheses are block bootstrapped with 400 repetitions. Significance: * p<0.10, ** p<0.05, *** p<0.01.
Figure A1: Histogram of Daily Efficiency for All Workers
3

Figure A2: Plant Process Flow Chart
Soil Dock- Truck Unloading
Mats Bulk Heavy Soil/Jeans Whites Regular Dress
Loaded into sling Sorted by type item Scanned into Plant Scanned into plant & loaded into cart Washed on Loaded into a sling & weighed Loaded into sling & weighed a specific wash formula Placed in small washer Washed on specific wash and washed on specific formula Washed on specific wash formula wash formula Water extracted in washer Loaded into clean sling Loaded into cart and taken to Taken by cart to dryer tunnel dryer Placed in cart Loaded into dryer & taken to roller Placed on hanger and set on tunnel dryer line marking repairs with a tag
Loaded into cart and taken to Mats are rolled bulk distribution area & placed into sorted area Placed on specific hooks and Specific dress clothes sent to (inspection: reject tower organizer folded bagged distributed to route line to press machine for pressing torn mats to scrap) final sort Organized on shelf Repair Station by mat type or if logo Repair damaged put into specific garments Final sort garments slotted organizer sorted by day, stop #, and man # Sort Process Inspection Decision Extraction
4

Figure A3: Eligible Months by Worker
Figure A4: Change in Minutes Late After Award Disqualification
Note: Percentage changes represent changes from the initial baseline clock-in frequency for each minute interval. Values above bars indicate the baseline frequency for prefail clock-ins.
-‐100%
0%
100%
200%
300%
400%
500%
600%
<0 0-‐1 1-‐2 2-‐3 3-‐4 4-‐5 5-‐6
% Change In Minutes Late Pre/Post
Minutes Late
EARLY LATE, NOT TARDY
TARDY
5