Motivating contributions to Commute Greener!
48
0 Motivating contributions to Commute Greener! Nature of motivation and motivation loss Ekaterina Matushkina Anna Nevalennaya Thesis work in Master in Communication Report No. 2010:117 ISSN: 1651-4769 University of Gothenburg Department of Applied Information Technology Gothenburg, Sweden, June 2010
Transcript of Motivating contributions to Commute Greener!
0
Motivating contributions to Commute Greener! Nature of motivation and motivation loss
Ekaterina Matushkina Anna Nevalennaya Thesis work in Master in Communication Report No. 2010:117 ISSN: 1651-4769
University of Gothenburg
Department of Applied Information Technology
Gothenburg, Sweden, June 2010

1
Abstract
This thesis is focused on the problem of users’ participation and contributions within Commute
Greener - a developing informal virtual organization. It aims to investigate the nature of
motivation to participate and contribute in order to understand why does the motivation loss
occur and suggest how it can be avoided.
The investigation is supported by theoretical model that states that users’ current motivation to
participate and contribute within informal virtual organization is influenced by (1) motives
including (a) initial motivation and (b) costs and benefits and (2) tools including (a) design of
technical features and (b) communication of specific influential information.
The data collection and data analysis are realized through quantitative research methods: a
representative sample of Commute Greener users is involved in a close-ended Web-based
survey; statistical analysis of data is then conducted with the help of SPSS 13.1.
Among the most important findings we state that:
First, higher level of motivation to use Commute Greener is predicted by lower costs from using
it, which means that: to actually make registered users of Commute Greener use it, the
developers should first of all improve the usability and lower the costs. Second, although
Commute Greener provides social networking and community services, i.e. a communicative
system for a virtual organization, there is a lack of communicational content circulating within it,
which means that a lot of motivating mechanisms (such as social learning, self-efficacy, etc.)
cannot be implemented. Considering the fact that 23% of registered Commute Greener users
never use online social communities or networks, we suggest that Commute Greener should
develop both as a relatively independent application and as a virtual organization.
2
Content
I. Introduction. 3
1.1 Commute Greener. The idea. 3
1.2 Commute Greener. The function. 4
1.3 The problem. 4
1.4 The research questions. 5
II. Theoretical background. 5
2.1 Organization and communication. What came first? 5
2.2 Communication in virtual organizations. 6
2.3 Communication as a content of an organization and as a tool for organizing.
Information good as public good . 6
2.4 Relevant theory and research. 7
2.5 Theoretical model. 10
III. Methodology 11
3.1 Research perspective: quantity vs. quality. 11
3.2 Sampling method. 12
3.3 Data collection: questionnaire development. 12
3.4 Ethical considerations. 13
3.5 The questions. 14
3.6 Actualization of data analysis. 17
IV. Results: Empirical data description. 18
V. Data analysis. 25
VI. Conclusions. 40
VII. References. 44

3
I. Introduction.
Modern globalizing world is a place where new global problems occur and become relevant.
These problems are complex and demand a complex approach. Preventing greenhouse effect, for
example, is a universally discussed issue. However to succeed joint actions of many individuals
all over the world are needed.
Fortunately, evolution of communication technologies made these actions possible. Computer
Supported Cooperative Work (CSCW), defined as “all contexts in which technology is used to
mediate human activities such as communication, coordination, cooperation, entertainment”
(CSCW 2004), etc. made interactions among individuals from different parts of the globe
accessible, cheap and effortless.
Among numerous CSCW tools social networking and community services became helpful and
popular means of building informal virtual organizations. People started gathering into virtual
organizations pursuing different aims: from maintaining contacts with former classmates to
saving the world from environmental collapse.
Virtual organizations are defined as “collections of geographically distributed, functionally
and/or culturally diverse entities that are linked by electronic forms of communication and rely
on lateral, dynamic relationships for coordination” (DeSanctis and Monge 1999, p. 693). This
thesis doesn’t have a specific interest in “coordination” part of the definition. However the term
virtual organization is referred to in order to describe the role of communication within its
context (which we find also relevant for a broader context of CSCW and a more precise context
of online social networks and communities). Actually the terms virtual organization, online
social network and online social community are used almost interchangeably because their
congruencies are interesting rather than the nuances that differentiate them.
Commute Greener (http://www.commutegreener.com/) is a developing CSCW providing
social networking and community services and aiming to make its members act in an
environment friendly way.
1.1 Commute Greener. The idea.
Goal: Commute Greener provides a tool for influencing individual contributions to a common
goal – saving planet’s environment. Creators claim that they aim to encourage individuals to
change their regular commuting patterns in order to reduce their CO2 footprint. They consider
their mission as a first step into positive climate change that can be achieved by joint individual
4
efforts made by everyone and especially by car owners who commute regularly and constitute
Commute Greener’s main target audience. In best case instead of driving alone in a car these
people should increase their usage of public transport (sub goal).
1.2 Commute Greener. The function.
Commute Greener’s main feature is CO2 emission calculator realized simultaneously on the basis
of two complementary technical platforms.
(1) Commute Greener web site allows users to set their Baseline – a periodic (weekly)
commuting schedule including points of departure and destination, time and type of
transportation. After setting a baseline users may also set a Reduction target – a desirable
level (percentage) of CO2 emission reduction. The website also allows to Start and stop
journey (i.e. calculate journey’s CO2 emission according to distance and type of
transportation and register the result) and generates CO2 saving performance information
(amount of CO2 emitted, dynamics, number of zero emission miles, the extent to which
reduction target is reached, etc.).
(2) Although, it is possible to access almost all Commute Greener services through the web site,
there is also a mobile phone client that allows more convenient, “on the go” CO2 emission
calculation. The advantages of using the phone client are even more evident when GPS
feature is available to track the exact route and calculate CO2 emission more precisely
according to the distance.
Social network/community features of Commute Greener are also important: it is possible to add
friends, update status. The possibility to “comment, compare & share” is emphasized by the
developers.
1.3 The problem:
Since November 2009 when Commute Greener was launched about 4500 people from more than
70 countries had registered (March 2010). But only about 30% of them had ever logged in at
least one more time after the registration. And only about 10-11% had visited the site 7 or more
times (i.e. had been using it on a regular basis). This data is evidence of nonparticipation and
under-contribution – two common informal virtual organizations and other CSCW
problems that Commute Greener suffers from.

5
Analysis of registration dynamics shows that there is a positive correlation between number of
registrations and occurrence of publicity activities. This may mean that people who register at
Commute Greener are influenced by the creators’ message and have some initial motivation to
use it. Yet, for most of them the level of motivation is not sufficient to grapple with the
system in order to start actually using it (first stage of motivation loss). Moreover, data
provided by Commute Greener creators shows that many “regular users” who had
probably managed to learn how the system works, had lost their motivation after about
three weeks of usage (second stage of motivation loss).
1.4 The research questions:
The aim of the study is: to investigate the nature of motivation to use Commute Greener and the
reasons why the motivation loss occurs. Additionally we aim to discuss what could be changed
or implemented by the developers in order to avoid motivation loss and increase motivation.
The general research questions of the thesis are: Why does the loss of motivation occur at
both stages? And how can it be avoided?
To answer these questions we provide a theoretical background (Chapter II) concerning the role
of communication in virtual organizations. We state that for virtual organizations communication
is crucial because it shapes both organizational structure and content. However in many informal
virtual organizations active communication (information sharing) is non-obligatory and
information good, which is basic for the existence of these organizations, is shared as a public
good. It brings in the effects of free-riding and social loafing and leads to a problem of
motivating participation and active contribution. The overview of relevant cases is provided.
Then a theoretical model is developed and research aims are formulated according to it.
II. Theoretical Background
2.1 Communication and organization. What came first?
As it is stated by Papa, Daniels and Spiker in “Organizational Communication: Perspectives and
Trends” (2008), organizations have traditionally been treated as “containers” in which human
interactions occur. This view fits the perception of organization as an institute with consistent
patterns of interaction which are preserved even if its members are replaced. But for
6
communication scholar it’s important to consider that organizations are at the same time
“constituted, are enacted and exist through interaction among the people who constitute them at
any point in time” (Papa, Daniels and Spiker, 2008, p. 2). From this perspective, as long as
communication is a basis for each concrete interaction, it becomes evident that “the process of
human communication is the central feature of organization” (Papa, Daniels and Spiker, 2008, p.
2). This communication-centered focus is especially relevant for studies of virtual organizations.
2.2 Communication in virtual organizations.
According to DeSanctic and Monge (1999), numerous studies of virtual organizations have
proved plausibility of the following key premises: (1) “technology, organizational structure, and
communication patterns are tightly coupled” and (2) “organizational form and communication
systems coevolve” (DeSanctic and Monge 1999, p. 693).
Since these statements are plausible, we may conclude that for virtual organizations
communication is almost everything. First, it constitutes organizational content. Second, if we
think of how communication systems are built, communication may be considered a strategic
tool to change content sharing in specific way in order to reach specific organizational goals.
Let’s look at these two sides of communication in informal virtual organizations.
2.3 Communication as a content of an organization and as a tool for
organizing. Information good as public good.
Usually for informal virtual organizations (especially online social networks and communities)
and other CSCW active communication (information sharing) is non-obligatory. But at the same
time information shared by users is crucial for these organizations because it constitutes an
information good by virtue of which these organizations develop and exist.
This information good is usually shared more or less as a public good: consumption of the good
by one user doesn’t reduce its availability for others and there are no effective means of
excluding some users’ from accessing the good (at least nothing more serious than registration is
usually implemented) (Albanese and van Fleet 1985).
When information good is shared as a public good, there are two inevitable consequences: (1)
freeriding – consuming public good without contributing to it (Albanese and van Fleet 1985),
7
and (2) social loafing – tendency to make less effort in a group work than in individual work
(Karau and Williams 1993).
Based on public good sharing, many informal virtual organizations suffer from under-
contribution and nonparticipation. Thus, their main goal is to increase number and quality of
contributions. As it is rephrased by Chen et al. (2008), “a key challenge to the online community
designer is to motivate the peripheral participants to become active contributors, and the core
participants to sustain and improve their contributions” (Chen, Harper, Konstan, Xin Li 2008,
p.3).
To succeed in this challenge a designer of virtual organization or CSCW has to take two steps:
(1) examine the nature of participants’ motivation in each specific case, (2) influence participants
by either (a) designing technical features that change communication system or (b)
communicating specific information that may make users reevaluate their behavior. Let’s take a
look at some relevant cases described in literature.
2.4 Relevant theory and research.
(1) Jonathan Grudin (1989) examines Computer Supported Cooperative Work failure.
Developing CSCW demands serious monetary and labor investments but sometimes results
in a waste. In illustration Grudin uses a corporative electronic calendar which main function
is supposed to be automatic meeting scheduling (example taken from Ehrlich 1987).
The main difference between electronic calendar and paper calendar is that the former is a
communicative system: employees put information on their agenda in the system and if there
is a need for meeting, the system analyses their schedules and suggests time, convenient for
all the participants. The main problem of the system is: “if a substantial number of people do
not maintain their calendars, the meeting scheduler is pointless” (Grudin 1989).
Unfortunately, this pointlessness happens due to lack of motivation among employees.
Grudin explains motivation in terms of costs and benefits. In case of corporative calendar,
costs are primarily associated with spending extra time on learning how to use the system
and constantly updating personal schedules. In order to make the system working, everyone
should bare these costs. But what benefits do they get in return? According to Grudin, there
is a disparity between those who do the work and those who get the benefits because
improvement of time management and facilitating of meeting arrangement are mostly
beneficial to managers, not to ordinary employees. The disparity results in lack of motivation
8
experienced by most employees and to CSCW failure. To prevent failure and get the
employees motivated Grudin suggest the following:
a) First, if there are any “collective benefits”, they should be demonstrated (i.e.
communicated): knowing about the benefits may cause justification of costs and increase
employees’ motivation.
b) Second and best solution “is to try to insure that everyone benefits directly from using the
application. This may mean building in additional features. It certainly means eliminating
or’ minimizing the extra work required of anyone, or rewarding them for doing it”
(Grudin 1989).
(2) Beenen et al. (2004) try to build a link between social science theories and CSCW design,
and practically solve the problem of under-contribution to MovieLens - an online movie
recommender community, which experiences some problems due to lack of ratings of rare
movies.
In order to study user’s motivation, the authors make two experimental attempts:
a) The first one tries to influence motivation of individual effort in a collective effort
situation. Collective effort model suggests that “people will socially loaf less when they
perceive that their contribution is important to the group” and that “people are more
motivated to contribute when they see the value that their contribution makes to an
individual or group outcome” (Beenen et al. 2004, Karau and Williams 1993). Thus,
members of MovieLens received e-mail letters reminding them of the uniqueness (i.e.
importance) of their contributions or both group and individual benefits that follow from
them.
The results confirmed that members reminded of importance of their contributions started
rating more movies (motivation increased). However reminding them of benefits in some
cases even had negative effect (motivation decreased). As it is suggested by Rashid et al.
(2006), “one possible explanation is that by explicitly giving people a rationale for
contributing, a psychological reactance was created”.
b) The second attempt examined influence of challenging goals which is “among most
robust psychological findings on human motivation” (Beenen et al. 2004). The study
within MovieLens online community shows that members can be motivated to greater
contributions using specific numeric goals (simple e-mail manipulation setting an
individual or a group goal - number of movies to rate - was implemented) (Beenen et al.
2004).

9
The authors suggest that “integrating these findings with usability design principles
should provide an even greater performance boost. For example, providing an interface
that facilitates elements of the Collective Effort Model and Goal-setting Theory such as
real time feedback, member identifiability, group cohesion, and so forth, could enhance
the effects observed in this field experiment” (Beenen et al. 2004).
(3) Burke, Marlow and Lento (2009) study the effects of news feed mechanism on Facebook
users. News (or content) feed is a result of implementation of findings of participation
theories. For such communities these theories distinguish three fundamental high level
categories: social learning, feedback and distribution. Social learning is a process of human
observation of social situations resulting in copying of observed actions (Burke, Marlow &
Lento 2009). Feedback is referred to as “effects that other users have on the newcomer” and
distribution is understood as “general structure of content and exposure achieved through
participation” (Burke, Marlow & Lento 2009).
The paper examined how “photo uploading behavior” of new coming users is influenced by
their friends’ “photo uploading behavior” which is reflected in news feed, and feedback their
friends leave on their photos. The authors suggested that “newcomers in social media
systems may be unwilling or unable to make contributions, either because they do not
understand the norms and values of the community, they do not fully understand how to use
the technology, or both” (Burke, Marlow &Lento 2009).
The study revealed that increased photo activity of friends resulted in increased newcomer
contribution (Burke, Marlow &Lento 2009). In addition, “initially engaged newcomers”
(who uploaded photos) were increasing their contributions if they received feedback
(comments) from other users. They also tended to upload more photos if they had bigger
active (giving feedback) audience (Burke, Marlow &Lento 2009).
These findings are conformable with a study by Jensen Schau and Gilly (2003) devoted to
personal web sites. The study suggests that these sites are created by individuals in order to
communicate with others and especially to express themselves (Jensen Schau and Gilly
2003). The concept of self-expression is congruent with the term impression management,
introduced by Goffman, but in case of computer- and internet-mediated communication it
takes place 24/7 and has no geographical limits.
The motive of self-expression can be mostly regarded as an intrinsic motivation for
individuals to contribute to virtual environment, as long as they are motivated by themselves
without any external incentives. However taking it into consideration is important for a
10
virtual community or network designer: whereas personal websites are developed by users
themselves, developing necessary communicative tools for users’ self-expression in networks
and communities is a great challenge.
(4) Although Sproull and Kiesler (1986) suggested that roles and statuses are less influential in
virtual organizations, possibility of self-expression in virtual communities and networks
allows users to behave “in ways which satisfy reference group members in order to satisfy
their own needs of affiliation and power”. Moreover, combination of self-identity, self-
presentation and self-efficacy theories, applied to motivation for contribution to online
community, states that users actually tend to do it. Wang and Fesenmaier (2003) used virtual
tourism community to investigate the list of possible motivations to contribute to online
community. Based on theoretical review they assumed that “in a virtual environment, high
quality information, impressive technical details in one’s answers, a willingness to help
others, and elegant writing can all work to increase one’s status and prestige in the
community” and that “making regular and high quality contribution to the group can help a
person believe he/she has the impact on the group and support his/her own self-image as an
efficacious person”. The study actually showed that efficacy (as “satisfying other member’s
needs”, “being helpful to others”, “sharing enjoyment”) effects mostly members’
contribution to online community (Wang and Fesenmaier 2003).
(5) Another mechanism used to increase contributions to online community is social
comparison. Chen, Harper, Konstan and Xin Lu (2008) distributed behavioral information
about the average user’s number of movie ratings within MovieLens network community to
observe the users behavior afterwards. Information about the average contribution turned out
to be significant for those users, who had a lower level but didn’t significantly affect those,
who already had the median level of ratings (Chen et all 2008). Authors demonstrated the
mechanism of social comparison as a natural and non-monetary tool for motivating
contribution to public good which was communicated in form of helpful public information
provided in this network community of movie ratings.
11
2.5 Theoretical model.
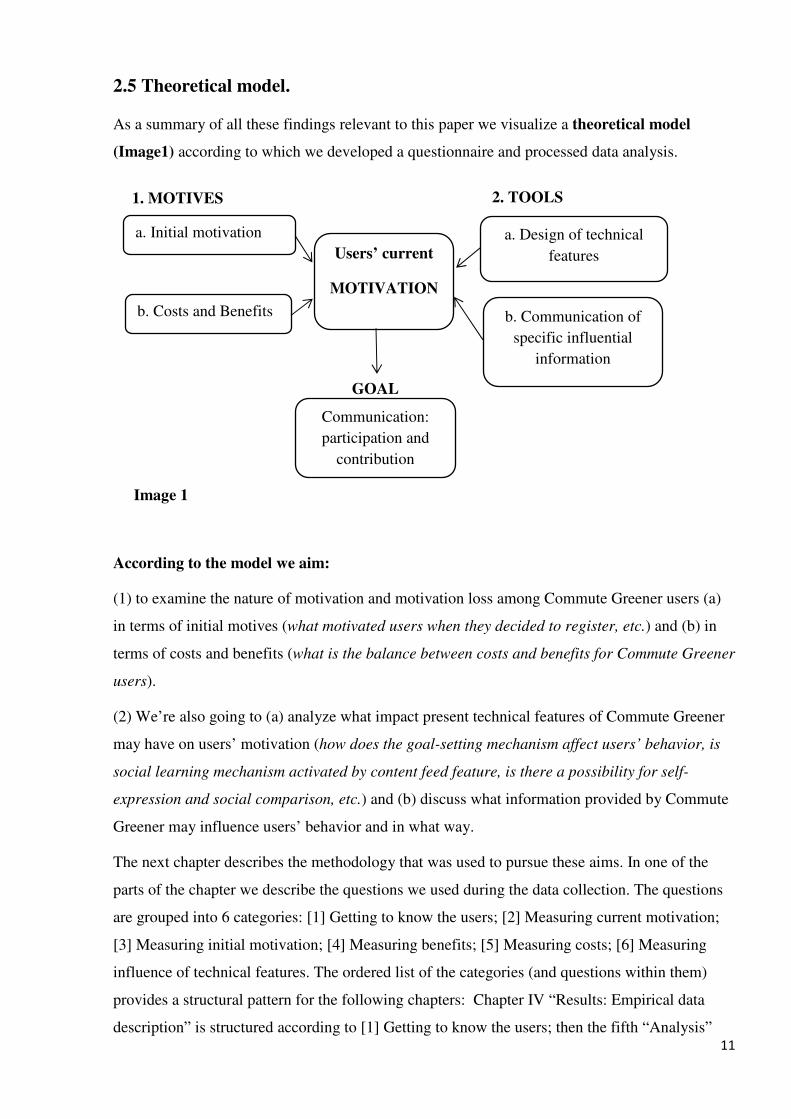
As a summary of all these findings relevant to this paper we visualize a theoretical model
(Image1) according to which we developed a questionnaire and processed data analysis.
According to the model we aim:
(1) to examine the nature of motivation and motivation loss among Commute Greener users (a)
in terms of initial motives (what motivated users when they decided to register, etc.) and (b) in
terms of costs and benefits (what is the balance between costs and benefits for Commute Greener
users).
(2) We’re also going to (a) analyze what impact present technical features of Commute Greener
may have on users’ motivation (how does the goal-setting mechanism affect users’ behavior, is
social learning mechanism activated by content feed feature, is there a possibility for self-
expression and social comparison, etc.) and (b) discuss what information provided by Commute
Greener may influence users’ behavior and in what way.
The next chapter describes the methodology that was used to pursue these aims. In one of the
parts of the chapter we describe the questions we used during the data collection. The questions
are grouped into 6 categories: [1] Getting to know the users; [2] Measuring current motivation;
[3] Measuring initial motivation; [4] Measuring benefits; [5] Measuring costs; [6] Measuring
influence of technical features. The ordered list of the categories (and questions within them)
provides a structural pattern for the following chapters: Chapter IV “Results: Empirical data
description” is structured according to [1] Getting to know the users; then the fifth “Analysis”
a. Initial motivation
b. Costs and Benefits
Users’ current
MOTIVATION
b. Communication of
specific influential
information
a. Design of technical
features
1. MOTIVES
Communication:
participation and
contribution
2. TOOLS
GOAL
Image 1
12
chapter is structured according to [2] Measuring current motivation; [3] Measuring initial
motivation; [4] Measuring benefits; [5] Measuring costs; [6] Measuring influence of technical
features.
III. Methodology.
3.1 Research perspective: quantity vs. quality.
In this thesis we rely on quantitative research methods. The limitations of these methods are
well-known: while meanings are derived from numeric and standardized data, the possibilities of
gaining deeper insights into the investigated issues are limited (Saunders, Lewis, Thornhil,
2009). Nevertheless for this thesis the benefits, provided by quantitative methods were very
relevant. While the respondents were spread all over the world and could be mainly accessed via
internet, quantitative methods allowed us to reach them in a fast and cheap way and ask them on
a great variety of topics. However some qualitative elements were also included in the research
to compensate for the lack of qualitative analysis within the survey (Geer 1988, 1991).
3.2 Sampling method.
Sampling was established by project’s coordinator from Volvo IT. The user database was
automatically divided into 4 categories:
(1) users who did only register at the website;
(2) users who registered and set a baseline;
(3) users who registered, set a baseline and stayed active for some period of time (one to three
weeks) but then stopped using Commute Greener;
(4) users who registered, set a baseline and were currently active (further referred to as “frequent
users”);
Then 601 contacts were randomly chosen among the users so that the share of each category
within the sample was the same as in general totality. Among the chosen 601 contacts we used
continuous sampling and delivered a link to our survey to everyone.

13
We assume that the sampling method was proper to guarantee the representativeness of results.
However the most inactive users could be less eager to participate in the survey, which could
lower the representativeness.
3.3 Data Collection: questionnaire development.
The survey mainly consisted of close-ended questions. However some limited number of open-
ended questions and boxes for optional comments were included.
The survey was realized as a Web-based survey and it provided a range of advantages: low costs
and time expenses, easily sent reminders, possibility of respondents’ guidance, etc. (Zanutto
2001; Couper, Traugott and Lamias 2001).
To access these advantages we placed and distributed the questionnaire with the help of special
Web-survey platform (www.WebMonkey.com). It contributed to easier processing of data: the
data was immediately accessible, was presented in electronic format and could be easily
converted into different file types and edited.
Links to the questionnaire were sent to participants by electronic mail together with welcoming
letter and general project description.
Though it was stated by Couper (2000) that Web-surveys showed a lower response level than
mail surveys, some important motivating features such as cover letter, welcoming, appropriate
instructions, progress screen within a survey, dividing questions into sections, were implemented
in design to make questionnaire comprehensible and increase response rate (Dillman, Tortora,
and Bowker 1998, Zanutto 2001).
As long as participation in the questionnaire wasn’t supported by any material incentives apart
from contribution to students’ scientific research, we tried to lower the costs for participants. So,
in order to increase response rate and elude possible drop-outs, the questionnaire was thoroughly
designed to be as less time-consuming as possible.
Thus, prior to sending out the questionnaire, piloting was conducted among the students in order
to elicit technical and design nuisances. In addition, on the stage of questionnaire development,
we included fewer open-ended questions and no graphically-complex options: as it was found
out by Knapp and Heidingsfelder (1999) and Dillman et al. (1998) that extensive use of these

14
tools is not beneficial for a survey. Besides that, we tried to reduce the overall number of
questions, though it became a serious challenge and had some consequences for the paper.
The questionnaire was developed jointly by 3 different research student groups with their own
independent research questions. First, it was challenging because (1) each party could only
include limited number of questions in the questionnaire and (2) some questions (apart from
those in socio-demographic part) overlapped and had to be merged and reformulated to
simultaneously accommodate different study purposes. Second, all these compromises had
certain consequences for the results we received, although it’s hard to tell what would be the
exact difference if we used another formulations and had an ability to include more questions.
Structure and position of sections within the questionnaire were also aimed at getting a higher
response rate. Joint socio-demographic section of the questionnaire was purposely situated in the
beginning of the questionnaire because it had no delicate or sensitive questions (like level of
income, etc.) in it and wasn’t expected to cause any drop-outs (Frick, Baechtinger and Reips
1999). However questions that could be perceived as delicate by respondents (e.g. marital status)
were made non-obligatory. The order of other sections was designed to allow respondents to skip
some sections if they answered to a filter question in a certain way.
3.4 Ethical considerations.
The study was carried out in accordance with existing ethics of applied social research:
(1) voluntary participation – we didn’t force the respondents to participate in our study;
(2) informed consent – the respondents were provided with the information concerning the
procedure and the purpose of the study; we assume that following the link to the survey
indicated that participants consciously consented to be involved into the study;
(3) confidentiality and anonymity – the questionnaire was anonymous; the anonymity was
stated in the cover letter for the questionnaire;
(4) no risk of harm – we didn’t expose our participants to any risk (Research Methods
Knowledge Base).
15
3.5 The questions.
The questionnaire consisted of 54 questions but only about 30 variables were then used in the
analysis.
- [1] Getting to know the users -
First, socio-demographic section included questions concerning respondents’ (1) gender, (2) age,
(3) level of education, (4) marital status, (5) country of residence. One of the student research
groups developed a section concerning (6) respondents’ relation and attitudes to Volvo. It also
contributed to the image of our respondents.
The second section consisted of questions aimed at discovering our respondents’ traits as
potential CSCW and Commute Greener users. The questions concerned: (7) frequency of
driving a car, (8) frequency of using the internet, (9) frequency of using online social
networks, (10) frequency of downloading mobile phone applications. To measure the duration
of users’ experience we asked the participants: (11) when did they register?
- [2] Measuring current motivation -
To measure the frequency of their experience, we asked (12) “How often do you use Commute
Greener to calculate your CO2 emission?” (i.e. how often do you actually use Commute
Greener’s main feature vs. how often do you log in, etc.). Within the survey this question was
used as a filter – users who answered “never” automatically skipped several pages without
having to answer specific questions regarding their user experience. The answer to this question
was very important as it measured a crucial aspect of users’ behavior – communication with the
system. The aspect that we believe is strongly influenced by motivation. The aspect that we
believe may be regarded as a measure of motivation (as it is motivation realized in action). The
aspect that becomes an evaluation of both idea- and technical developers’ efforts. Consequently
the question was used as a main dependent variable in the analysis (further referred to as
“How often do you use Commute Greener?” or motivation realized in action)
Additionally, there was a question about users’ future intentions concerning Commute Greener,
developed by another student research group: (13) “I am interested in continuously visiting this
Commute Greener community”. Answers to this question also helped to reflect on users’
motivation. However there was no guarantee that motivation indicated in it would ever cause any
action: that’s why we regarded this motivation as pure motivation.

16
- [3] Measuring initial motivation -
(14) The main question to examine users’ initial motives was formulated: “Why did you decide
to register at Commute Greener?” A list of alternatives was provided along with optional
textbox for not listed answer.
(16) As long as Commute Greener has a lot to do with “saving the environment”, we considered
environmental motives of the users to be an important part of their initial motivation to
participate. To measure users’ environmental motivation we adopted three questions from
“Environmental Participation and Environmental Motivation” (2008) by Torgler et al.
a. I would give part of my income if I were certain that the money would be used to prevent
environmental pollution.
b. I would agree to an increase in taxes if the extra money were used to prevent
environmental pollution.
c. The Government has to reduce environmental pollution but it should not cost me any
money.
(Answers presented in Likert scale: 1-strongly disagree, 2-disagree, 3-partly disagree, 4-partly agree, 5-agree, 6-strongly agree)
First two questions were designed to measure “pro-environmental attitudes”. The authors noted
that from the first sight questions could seem ambiguous because none of the terms was clarified.
However the usage of unspecified terms was considered appropriate to investigate moral values
like environmental motivation. The third question was also aimed at investigating
“environmental attitude”, but here possible tendency to free-riding was taken into account. The
authors predicted that this variable could give results that contradict to the results of the first two
questions: respondents might not bother to carry any costs and take a free-riding opportunity.
The decision to use three variables to measure the same issue was taken in order to guarantee
reliability of results (Torgler et al. 2008).
- [4] Measuring benefits -
(these questions were only answered by those who at least rarely used Commute Greener to calculate their CO2 emission)
It was quite hard to decide which questions to ask to measure the benefits of using Commute
Greener (as perceived by the users). Finally, we included three statements, describing in what
(possibly beneficial) way Commute Greener can be utilized.
(17) “Commute Greener makes me aware of my individual CO2 footprint”

17
(18) “Knowing my CO2 footprint helps me to correct my commuting behavior so it is less
harmful for the environment”
(19) “Through Commute Greener I can share my environmental friendly experience with
others”
(Answers presented in Likert scale: 1-strongly disagree, 2-disagree, 3-partly disagree, 4-partly agree, 5-agree, 6-strongly agree)
We assume that for those who agreed with either of these statements, there is a possibility of
related benefit. But we cannot really draw conclusions on whether “agree” means “yes, and I
perceive that for me it’s beneficial”. Considering this ambiguity and the chance that provided
statements are insufficient to describe all possible benefits, we came up with direct open
question: (20) “Please share you opinion: What are the benefits that Commute Greener gives
to you?”
- [5] Measuring costs -
(these questions were only answered by those who at least rarely used Commute Greener to calculate their CO2 emission)
Our main question concerning the costs of using Commute Greener was connected directly to
using Commute Greener’s main feature: (21) “It takes a lot of effort to regularly calculate CO2
(start and stop journeys)” (Answers presented in Likert scale: 1-strongly disagree, 2-disagree, 3-partly disagree, 4-
partly agree, 5-agree, 6-strongly agree)
Additionally, we used (22) “Have you experienced any problems accessing Commute
Greener?” (answer alternatives presented possible problems as well as an extra text box for
another answer) and (23) “Were the following features of Commute Greener easy to use?”
(respondents had to choose whether the features listed below were easy/quite easy/quite
complicate/complicate; the option “didn’t try” was also included).
Question (24) “Do you use both computer and mobile phone to access Commute Greener?”
was also considered to be relevant for measuring costs as it seems to be much more convenient
to calculate CO2 emission “on the go”. We assume that for those respondents who answered
“no” (i.e. they only use computer) costs should be higher.
- [6] Measuring influence of technical features -
(these questions were only answered by those who at least rarely used Commute Greener to calculate their CO2 emission)

18
There is a feature in Commute Greener representing a goal-setting mechanism that according to
Beenen et al. (2004) may increase motivation. The feature is called “Setting a reduction target”.
As long as we were not able to log users’ behavior (i.e. observe users’ actions within Commute
Greener), we had to ask them about the effect that using this feature has on their behavior. Three
statements were developed.
(25) “When I set a reduction target I have a goal that I try to achieve”
(26) “Setting a reduction target and seeing my results helps me to evaluate my commuting
behavior”
(27) “I think setting a reduction target does NOT affect my commuting behavior”
(Answers presented in Likert scale: 1-strongly disagree, 2-disagree, 3-partly disagree, 4-partly agree, 5-agree, 6-strongly agree)
3.6 Actualization of data analysis.
Statistical data analysis was conducted with the help of SPSS 13.1. The investigation was mainly
focused on relationships between pairs of variables measured on the same group. Conclusions
considering presence, direction and strength of interrelations were based on calculating
correlation coefficients.
As long as most of our variables and especially our main dependent variable (“How often do you
use Commute Greener to calculate your CO2 emission?”) provided ordinal scale data, we used
a non-parametric method: Kendall’s rank correlation (Abdi 2007).
To get joint relative frequencies of pairs of variables we used Crosstabs in SPSS.
To justify reliability of observed association we implemented Pearson Chi-Square Test (Howell
2010, chapter 6).
We regarded level of significance α < 0.05 as reliable: it is common for social sciences and it is
“conventionally accepted” (Howell, 2010, p.96).

19
IV. Results: Empirical data description.
After sending out the questionnaire we received 131 responds out of 601 (22%). But only 110 of
them were complete (18%). Although we are satisfied with the response rate, we think that it
might be higher if our mails were less often caught by spam filters: some respondents reported
that they found the invitation letter in their “junk mail” folders and some probably didn’t even
see it.
- [1] Getting to know the users -
(1) Gender distribution of our respondents is: 76% males and 24% females. It’s interesting to
compare this data (which is supposed to represent “general Commute Greener user”) with
data that we received from our coordinator from Volvo IT about an average “frequent user”.
As you can see on the Diagram №1, gender proportion among “frequent users” is different:
the percentage of males is 9% lower, while the proportion of females is sequentially 9%
higher.
Diagram №1
It’s interesting that in both cases there is an evident gender disproportion. It might be
caused by the fact that Volvo employees are mainly males or by some other factors that
caused males to constitute significantly bigger part of users. But it’s even more interesting
that among “frequent users” female share is bigger than among “general users”.
Supposedly gender is somehow associated with the motivation to use Commute
Greener.
20
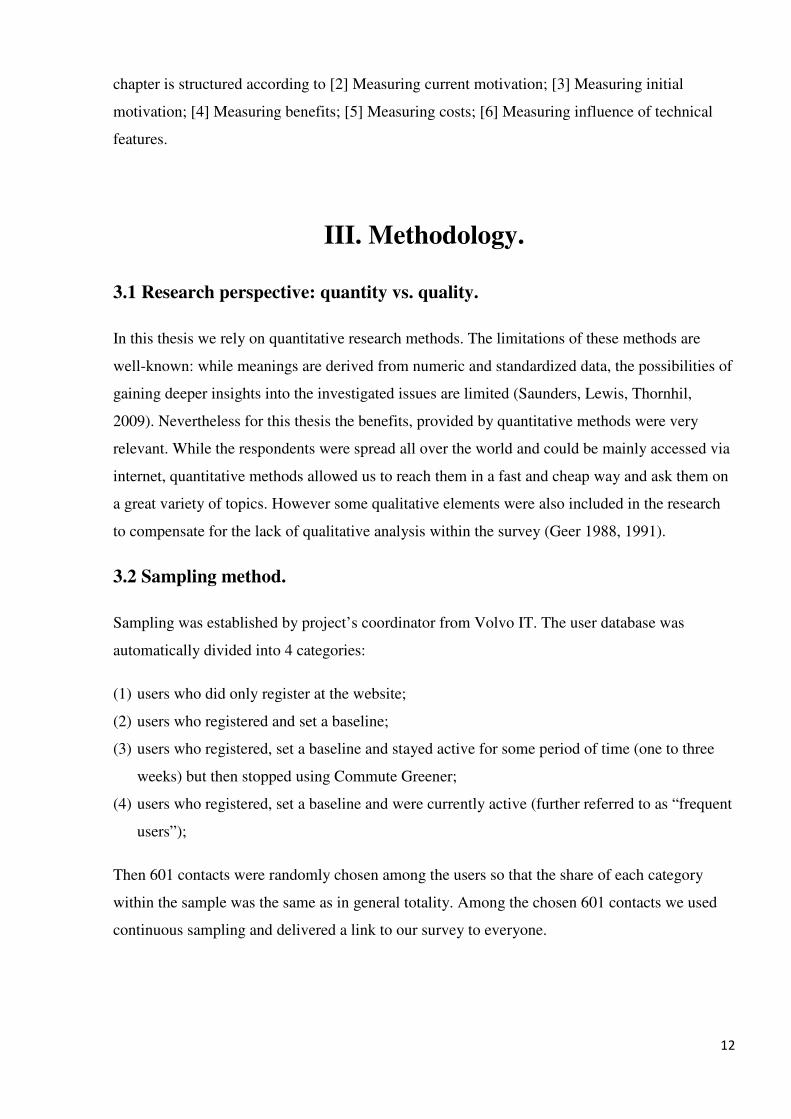
(2) As long as data provided about “frequent user” contained age distribution we found it
reasonable to compare it to our “general user” data. As it is illustrated by Diagram №2, there
are some notable differences.
Diagram №2
“Frequent users” are generally younger than “general users”. There are 14% less of
those younger than 25 and 9% more of those who are 46-55 in our sample. Moreover, a new
older age group of 56-65 years appears in our distribution with a share of 7%. Supposedly,
age is also associated with the motivation to use Commute Greener.
(3) According to our data, the level of education of “general user” is quite high. Answers to the
question “What is the highest level of education you have completed?” showed that our
respondents are quite educated (Diagram №3): Master degree (45%) and Bachelor Degree
(27%).

21
Diagram №3
(4) Concerning our respondents’ marital status: the data shows that almost 80% of them are
coupled (Diagram №4). This disproportion is interesting, but as long as we lack the same
type of data considering “frequent users” we can’t draw any conclusions here.
Diagram №4
(5) Country of residence. The respondents are mainly coming from Sweden (57%), followed by
USA (8.5 %), France (6%) and Brazil and India (3% from each). And the rest of them reside
in 20 other countries.
(6) The data showed that 72% from all the respondents are Volvo employees.

22
It seems logical because Commute Greener initiative originally came from Volvo IT and was
primarily spread within the company. It is possible that this fact has influenced other
characteristics of Commute Greener users like gender and age distribution, etc.
(7) Frequency of driving a car. Almost all of our respondents are car users – 96% drive it at
least “rarely” (Diagram №5). Kendall’s rank correlation showed a weak but significant
positive interrelation with the age variable.
� The older the respondent is, the more regularly s/he tends to drive a car.
Diagram №5
(8) Frequency of using the internet. 100% of our respondents are regular internet users
(Diagram №6). 82% use it every day.
Diagram №6

23
(9) Frequency of using online social networks. Despite 82% of respondents are everyday
internets users, only 29% of them are everyday online social networks’/communities’ users
(Facebook, MySpace, Twitter, Flickr etc., Diagram №7). Moreover, 23% of respondents
indicated that they were never using it.
Diagram №7.
Kendall’s correlation revealed that there is a weak however very significant negative correlation
between age and frequency of using online social networks.
� The older the respondent is the less frequently s/he uses online social networks/
communities.
Two distributions below are provided to illustrate the interrelation (Diagrams №7.1 -7.2). The
group of respondents who are younger than 25 years old was purposely excluded because there
were only few of them.

24
Diagram №7.1 Diagram №7.2
(10) Questions concerning frequency of downloading mobile phone applications revealed that
even greater part of users (38%) were never downloading mobile phone applications.
Diagram №8
(11) The results for the question “When did you register?” revealed that 77% of the respondents
had registered earlier than one month ago. Other alternatives (“about one week ago”, “about two
weeks ago”, “about three weeks ago” and “about one month ago”) were rarely used. We suppose
that we could get more differentiated results if we included other alternatives (like “about two
months ago”, etc.). However we think that knowing that a respondent have been registered in the
system for more than one month (without more precise information) is sufficient for this paper.

25
Summary:
Although respondents from 25 different countries are presented in the sample, it appears to be
quite homogeneous according to the following parameters:
� 76% of the respondents are males;
� 95% are older than 25 (45% are of 36-45 years old);
� 80% achieved different levels of higher education (45% - Master Degree);
� 78% are coupled (56% are married);
� 72% are Volvo employees;
� 95% drive car at least rarely (69% do it regularly);
� 100% are regular internet users (82% use it every day);
� 77% had registered more than one month ago;
These figures contribute to a portrait of “general registered Commute Greener user”. Taking
them into account in positioning and further improvement of Commute Greener is crucial for the
developers. As well as it is crucial to consider the parameters that differentiate the sample:
� 23% of the respondents never use online social networks/ communities;
� 38% never download mobile phone applications.
Forestalling we want to note that both these parameters positively correlate with motivation
realized in action (weak but significant interrelations). I.e. the less often the online social
networks/communities are used and the less often the phone applications are downloaded, the
lower level of motivation realized in action is indicated. So, does the system have to adapt to
the needs of these users or do they have to adapt to it? Here is an interesting question to think
about concerning the motivation strategies to be implemented at Commute Greener.
It’s also worth mentioning here that we found out that “frequent Commute Greener users” were
generally younger than “general users” and consisted of more females. Consequently we
expected age and gender to be factors, influencing users’ motivation to use Commute Greener.
We can already see a link here: the older the user is, the less often s/he uses online social
networks/ communities and the less often s/he does it, the lower her/his motivation to use
Commute Greener is. Direct interrelations between age and variables measuring motivation
were not found, but gender was found to have a weak though significant positive interrelation
with pure motivation (females were more often interested in continuously visiting Commute
26
Greener). However it’s hard to tell whether these findings can be practically implemented to
influence motivation of Commute Greener users.
In the following chapter empirical results concerning [2] Measuring current motivation; [3]
Measuring initial motivation; [4] Measuring benefits; [5] Measuring costs; and [6] Measuring
influence of technical features are going to be presented and analyzed.
V. Data Analysis.
- [2] Current motivation-
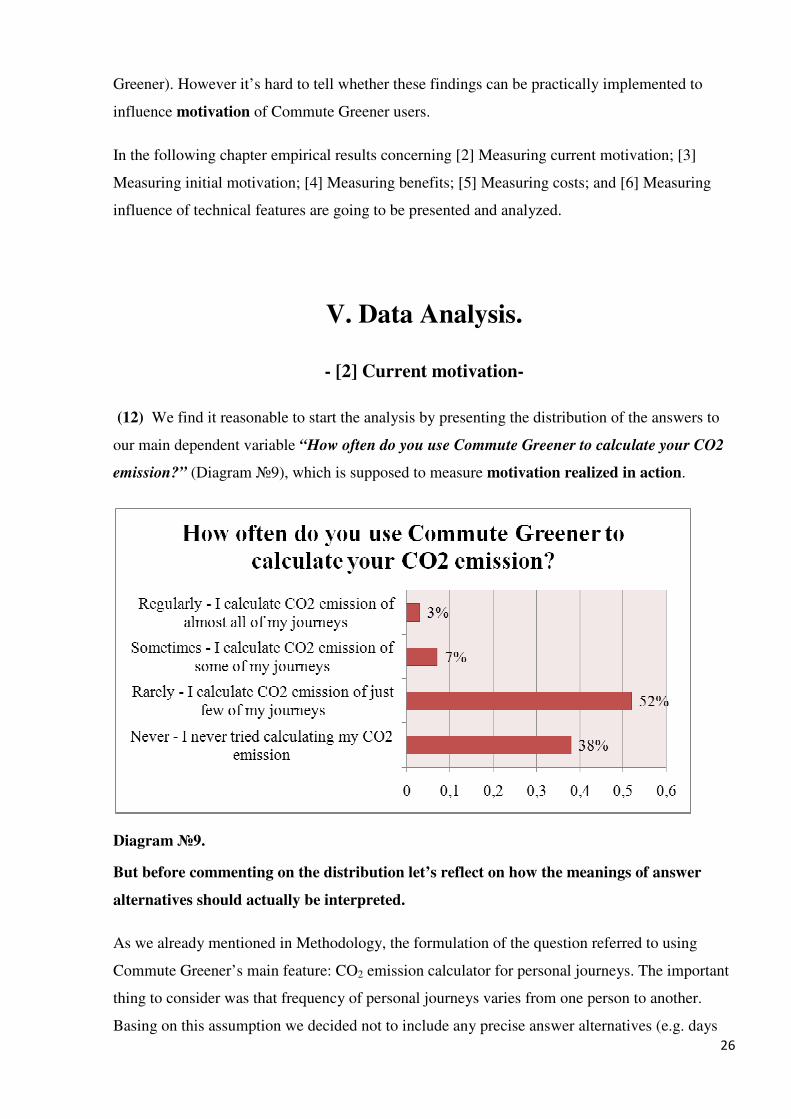
(12) We find it reasonable to start the analysis by presenting the distribution of the answers to
our main dependent variable “How often do you use Commute Greener to calculate your CO2
emission?” (Diagram №9), which is supposed to measure motivation realized in action.
Diagram №9.
But before commenting on the distribution let’s reflect on how the meanings of answer
alternatives should actually be interpreted.
As we already mentioned in Methodology, the formulation of the question referred to using
Commute Greener’s main feature: CO2 emission calculator for personal journeys. The important
thing to consider was that frequency of personal journeys varies from one person to another.
Basing on this assumption we decided not to include any precise answer alternatives (e.g. days

27
per week, etc.). Using precise answer alternatives would demand including one more precise
question measuring the frequency of commuting. Otherwise the data would be confusing. E.g.
person A uses Commute Greener once а week and person B uses it twice a week: first it seems
that B is more motivated, but if we know that A only commutes once a week (i.e. calculates
emission of 100% of journeys) and B – 6 days a week (i.e. calculates emission of 33% of
journeys), the interpretation may be the opposite.
However interpretation of the alternatives finally included in the questionnaire may still cause
some confusion. E.g. concerning the alternative “Never – I never tried calculating my CO2
emission”: even if the respondents didn’t currently use Commute Greener, but used it some time
ago in the past, they would not choose this option because it says “never tried”. We assume that
their answers concentrated in “Rarely – I calculate CO2 emission of just few of my journeys”.
Therefore we do not interpret alternative “Rarely” as a present time pattern but rather as a
verification of the fact that a user has had at least some experience in using Commute Greener’s
main feature.
After the meanings of answer alternatives have been clarified, let’s formulate the results.
� Almost 40% of registered users had never tried using Commute Greener’s main
feature.
I.e. they lost their motivation to use the system before they even tried its main feature
(first stage of motivation loss).
� About 50% of registered users had at least tried using Commute Greener’s main
feature (answered “Rarely - …”), but it’s hard to say for how many of them “rarely”
was a consistent present time pattern.
� Only 10% of users showed some consistent pattern of using Commute Greener’s main
feature (answered “Sometimes - …” and “Regularly - … ”). And only 3% of those 10%
were regular users.
� These results are congruent with the problem stated in the paper: Among registered
Commute Greener users there is an evident lack of motivation realized in action.
(13) However if we look at users’ current pure motivation (Diagram №10), unlike the previous
variable, it is characterized by much more balanced answer distribution with 59% of the
respondents “interested in continuously visiting Commute Greener community”.

28
Diagram №10
� Among registered Commute Greener users level of pure motivation is much higher
than of motivation realized in action.
Before we move to further analysis, it’s interesting to know: how are the two variables
(motivation realized in action and pure motivation) relate to each other. To get joint relative
frequencies of both variables we used Crosstabs in SPSS (Table №1).
� The tables clearly illustrate: there is a direct relationship between the variables
measuring motivation realized in action and pure motivation.
*- significance α < 0.05; **- higher significance α < 0.01
Pearson Chi-Square Test showed high level of significance of the observed association (α
=0,001). Kendall’s rank correlation coefficient is 0.373(**).
Although correlation coefficients below 0.5 are usually regarded to be showing weak
interdependence, these results are valuable for our research purposes. Moreover, they show
higher level of significance than the level we agreed to consider acceptable (<1% vs. <5%).

29
Table №1.
% within How often do you use Commute Greener to calculate your CO2 emission?
How often do you use Commute Greener to calculate your CO2 emission? Total
Never - … Rarely - … Sometimes - … Regularly - …
I am interested in
continuously visiting
this Commute Greener
community.
No
62,5% 33,3% 40,7%
Yes 37,5% 66,7% 100,0% 100,0% 59,3%
Total 100,0% 100,0% 100,0% 100,0% 100,0%
All the users that showed higher level of motivation realized in action (answered “Sometimes -
…” and “Regularly - …” to question “How often do you use Commute Greener” ) had 100%
pure motivation. However for those registered users who answered “Never - …” and “Rarely -
…” the percentage of positive answers (indicating pure motivation) was relatively high (37,5%-
66,7%).
� In at least 37.5% of cases, users who lack motivation realized in action, showed
presence of pure motivation.
� These users would probably like to use Commute Greener however something prevents
them from doing it.
Now let’s consider how initial motives of the registered users influence their current motivation.
- [3] Initial motivation-
(14) “Why did you decide to register at Commute Greener?” was designed as a multiple
response question (more than one alternative could be chosen). The answers were then coded
into 5 binominal variables.
The distribution illustrated by Diagram №11 shows how many percent of those who answered
the question had chosen each alternative.

30
Diagram №11
� For 74% of registered Commute Greener users plain curiosity was a motive to register
(for 54% of these 74% it was the only motive).
� 28% of registered Commute Greener users were driven by environmental motives such
as will to calculate individual CO2 emission and willingness to reduce it (for 14% of
respondents these two coincided).
Kendall’s rank correlation analysis showed that there is a weak though highly significant
statistical interrelation between the main dependent variable (“How often do you use Commute
Greener to calculate your CO2 emission?”) and variables, measuring initial motivation (“Why
did you decide to register at Commute Greener?”):
(1) Variables: “How often do you use Commute Greener?” and “I was willing to reduce my
CO2 emission.” Correlation coefficient: 0.262(**)
(2) Variables: “How often do you use Commute Greener?” and “I was curious: how much
CO2 do I produce?” Correlation coefficient: 0.263(**)
(3) Variables: “How often do you use Commute Greener?” and “I was curious: how it
works?” Correlation coefficient: -0.347(**)
If we assume that there is a causal relationship between “How often do you use Commute
Greener?” and these three variables, these correlations may be interpreted in the following way:

31
� Environment oriented initial motivation contributes to better motivation for using
Commute Greener, whereas plain curiosity predicts lower motivation for using it.
Variable that measures pure motivation correlates with these three variables in the same way
though the interrelation is weaker (correlation coefficients are 0,197(*), 0,220(*) and -0,247(*)
respectively) and the level of significance is lower.
(16) Kendall’s rank correlation analysis didn’t show any significant relationship between pure
motivation or motivation realized in action and variables directly measuring environmental
motivation. However another interesting interrelation was found out.
Environmental motivation was negatively interrelated with respondents’ age: correlation
coefficients -0,221(**) and -0,206(**) with “I would give part of my income if I were certain
that the money would be used to prevent environmental pollution” and “I would agree to an
increase in taxes if the extra money were used to prevent environmental pollution”
respectively.
� The older the user is, the lower level of environmental motivation is indicated.
This finding may also be interesting in relation to the fact that “frequent users” were found to be
younger than “general users”.
- [4] Benefits -
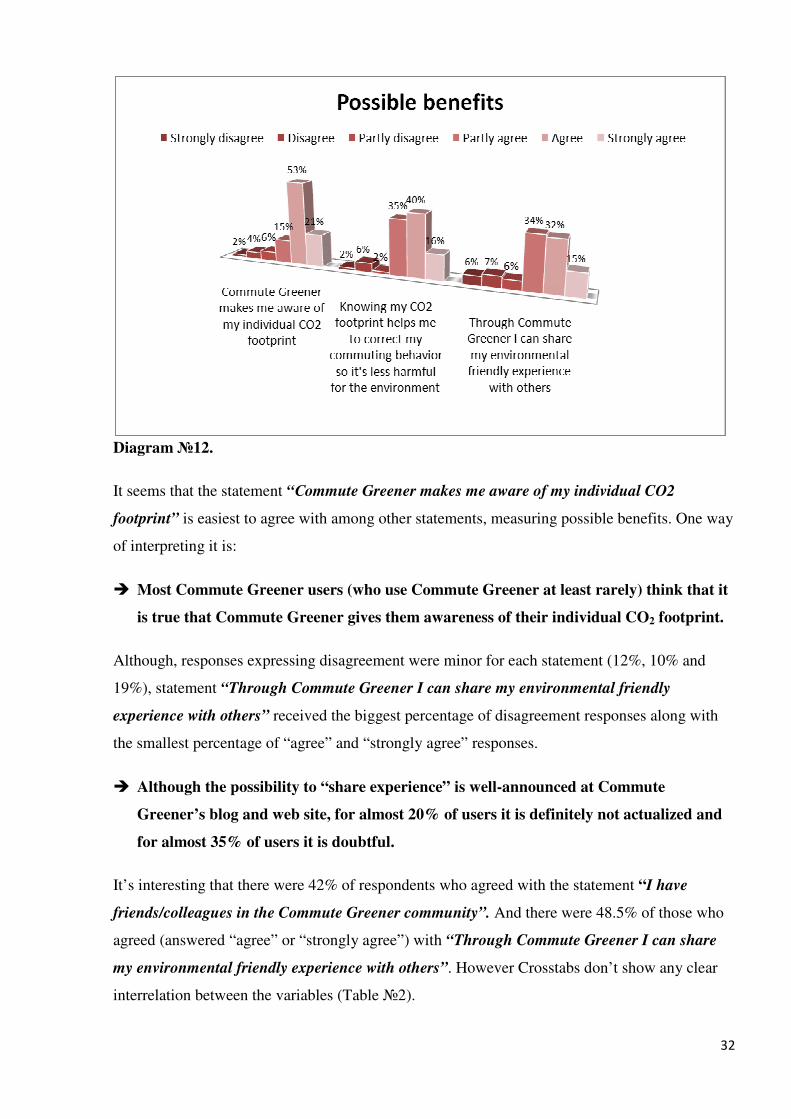
(17-19) Diagram №12 shows the distribution of responses for questions concerning possible
benefits of using Commute Greener. Responds expressing different levels of agreement are
dominant for each statement (89%, 91% and 81%). However statement “Commute Greener
makes me aware of my individual CO2 footprint” received less “partly agree” answers (15% vs.
35% and 34%) and more “agree” and “strongly agree answers” (total 74% vs. 56% and
47%).
32
Diagram №12.
It seems that the statement “Сommute Greener makes me aware of my individual CO2
footprint” is easiest to agree with among other statements, measuring possible benefits. One way
of interpreting it is:
� Most Commute Greener users (who use Commute Greener at least rarely) think that it
is true that Commute Greener gives them awareness of their individual CO2 footprint.
Although, responses expressing disagreement were minor for each statement (12%, 10% and
19%), statement “Through Commute Greener I can share my environmental friendly
experience with others” received the biggest percentage of disagreement responses along with
the smallest percentage of “agree” and “strongly agree” responses.
� Although the possibility to “share experience” is well-announced at Commute
Greener’s blog and web site, for almost 20% of users it is definitely not actualized and
for almost 35% of users it is doubtful.
It’s interesting that there were 42% of respondents who agreed with the statement “I have
friends/colleagues in the Commute Greener community”. And there were 48.5% of those who
agreed (answered “agree” or “strongly agree”) with “Through Commute Greener I can share
my environmental friendly experience with others”. However Crosstabs don’t show any clear
interrelation between the variables (Table №2).

33
Table №2.
% within Through Commute Greener I can share my environmental friendly experience with others.
Through Commute Greener I can share my environmental friendly experience
with others.
Strongly
disagree Disagree
Partly
disagree
Partly
agree Agree
Strongly
agree
I have friends/colleagues
in the Commute Greener
community.
No
50,0% 60,0% 100,0% 60,9% 40,9% 30,0%
Yes 50,0% 40,0% 39,1% 59,1% 70,0%
Total 100,0% 100,0% 100,0% 100,0% 100,0% 100,0%
� There is no statistical evidence that the inability to share experience is predetermined
by the unavailability of friends in the system.
Kendall’s rank correlation analysis showed that there is weak though highly significant direct
correlation between the variables representing possible benefits and pure motivation.
Correlation coefficients are 0.392(**), 0.395(**) and 0.373(**) respectively.
However only admitting the most environmental oriented possible benefit (“Knowing my CO2
footprint helps me to correct my commuting behavior so it is less harmful for the
environment”) correlates with motivation realized in action. Correlation coefficient is 0.272(*).
� The more the perceived possible benefits from using Commute Greener are, the higher
level of pure motivation is indicated and vice versa.
(20) Open question “Please share you opinion: What are the benefits that Commute Greener
gives to you?” was answered by 68 respondents of those 77 who used Commute Greener at least
rarely. We grouped their answers into 4 categories to present them:
1. Awareness. The answers confirmed that awareness was perceived as a benefit by many
respondents. However different aspects of awareness were emphasized.
a. General awareness. Many respondents mentioned awareness but they didn’t specify what
kind of awareness they meant: “I have not changed my commuting habits though it has made me
more aware”; “Hard to tell if it adds benefits apart from general awareness”; “Awareness is
always good”.
b. Environmental awareness. Also many respondents mentioned awareness of their
environmental impact as a benefit: “I know what strain i put on the environment”; “It helps me
to better understand the environmental impact of my choice of transport”; “Let me know the
impact I produced when I drive unnecessary”.

34
c. Awareness of habits. Some respondents mentioned awareness of their own regular behavior
as a benefit: “A tool to evaluate alternatives”; “Helpful journey planner”, “I always ask myself
if I should take the car or go by foot when I want to go somewhere”; “Makes me aware of what I
am doing on a daily basis”.
� In answers to the open question about benefits of using Commute Greener awareness
was quite often mentioned as a benefit. However this fact may have two possible
explanations:
(1) By many users awareness is perceived as a benefit.
(2) It was easy to think about awareness because it was suggested by the questions
measuring possible benefits that were placed just earlier in the questionnaire.
� Although, many users mentioned awareness, we found out that the meaning of
“awareness” varied from user to user and included general awareness, environmental
awareness and awareness of individual habits.
2. Occasional answers. There were some occasional benefits, mentioned by one or two
respondents. We only picked two of them because we thought that these benefits were intended
to be present in the system by its developers.
a. Entertainment. Two answers somehow mentioned entertainment aspect of Commute
Greener, however it was not emphasized : “Important and fun”; “Interesting way of effecting
people to save environment and make a change only by using a goal setup by application/tool
(game in a way)”.
b. Communication. One answer stated that user-system communication was a benefit: “Good to
see a pattern and also to be "rewarded" with some facts and figures of the changed behavior”.
� Entertainment and communication (benefits that are perceived as important by the
developers) were only mentioned occasionally by 1-2 respondents and their value was
not emphasized.
3. No benefits. Many respondents noted that they didn’t know any benefits or directly expressed
that there were no benefits for them from using Commute Greener. It’s interesting to look at the
explanations provided by some users, who answered “none”: “Don't have a car, and can't
change the way I travel to work in any way”; “I always commute by bike why I always get zero
emission in the program”; “I don't have many options, buy a new car?”; “Public Commute is
none-existing here in USA”; “Very few for me personally, as I work with environmental issues

35
including 'green' logistics. Personally, I am very much aware of these issues, their impact, what
“to do” vs. “not to do” anyway”.
According to Grudin (1989) when participation is found non-beneficial, motivation loss can
occur. The explanations provided by users can contribute to better understanding of motivation
loss (at both first and second stages).
� A lot of answers reported that there were no benefits of using Commute Greener.
� For many respondents motivation loss at both stages might have occurred due to their
inability to change something in their behavior/ attitudes.
4. No benefits but costs. Although it was asked about the benefits, a large group of respondents
stated that the possible benefits were neutralized by the costs. Let’s look at the explanations
provided within the answers. We included almost all of them because they may contribute to
better understanding of motivation loss (on the first stage mainly as the costs prevent the users
from getting started) and may be valuable for the developers.
• “Do not give me any benefits as I have not used it much. As stated earlier the registration
interface was too complicated so I didn’t have the time to finish and make it useful. Only
calculated one trip I think”;
• “Good idea, I really want applications that support changes in my behavior, but you
should not need to be a geek to handle it”;
• “I didn't really get going with using it, since it was too tedious to start and end journeys.
Also, it was complicated to do ad-hoc journeys, since they were not entered into the
system”;
• “I don't use it anymore - not user friendly”;
• “It's easy to forget about it as the instructions weren't very good and I couldn't really get
started. So I kind of lost interest”;
• “It would give me benefits if I had an idea of how to operate the baseline”;
• “Nothing, I stopped to use it as no software is delivered for my mobile”;
• “None really, too cumbersome to use – poor GUI kills the program for me”;
• “None, GUI is too bad”.
� Motivation loss at the first stage occurs due to high costs of using Commute Greener:
complexity of Graphical User Interface, effort requiring routine procedures, etc.
Let’s review the data we received when asked the questions aimed to measure the costs.

36
- [5] Costs -
(21) Diagram №13 shows an intriguing result: 84% of users who answered at least “Rarely - …”
to “How often do you use Commute Greener to calculate your CO2 emission?” agreed with
statement “It takes a lot of effort to regularly calculate CO2 emission”. And none of those 15%
of respondents who disagreed was “strongly
disagree”.
Diagram №13
� Almost 85% of those who at least tried using Commute Greener’s main feature think
that it takes a lot of effort to do it regularly.
Kendall’s rank correlation analysis shows that there is a weak though highly significant negative
interrelation between “It takes a lot of effort to regularly calculate CO2 emission” and
motivation realized in action. Correlation coefficient is -0,299(**). However there is no
evidence that pure motivation is affected.
� The more the perceived costs of using the main feature are, the lower level of
motivation realized in action is indicated and vice versa.
� Level of pure motivation is not affected by costs.

37
(22) Diagram №14 shows how many Commute Greener users indicated that they had
experienced one or another problem.
Diagram №14
These variables do not correlate with either pure motivation or motivation realized in action.
However it’s evident that forgetting password or username is quite common.
� Thus, until an effective password recovery system is established at Commute Greener,
it will continue losing some users just because they cannot log in.
� Generally, 30% of Commute Greener users indicated that they had experienced at least
one of the listed problems.
(23) Answers to the question “Were the following features of Commute Greener easy to use?”
revealed that “Setting a baseline” and “Starting and stopping a journey to calculate CO2
emission” are the most complicate features of Commute Greener: 40% and 46% answered
“Complicated” and “Quite complicated” respectively (Diagram №15). “Registration” and
“Inviting friends” seem to be the easiest ones however some users still find them complicated:
8% and 9% respectively.

38
Diagram №15
� Every listed feature of Commute Greener was judged as complicated by at least 8% of
its users.
� Basic and essential features of Commute Greener were judged as the most complicated.
� Most variables in this question had weak but significant positive interrelations with
motivation realized in action which means that:
� The more user friendly the features are perceived, the higher level of motivation
realized in action is indicated and vice versa.
� To increase the motivation to use Commute Greener the developers have to make its
features (especially the principal features) more user friendly.
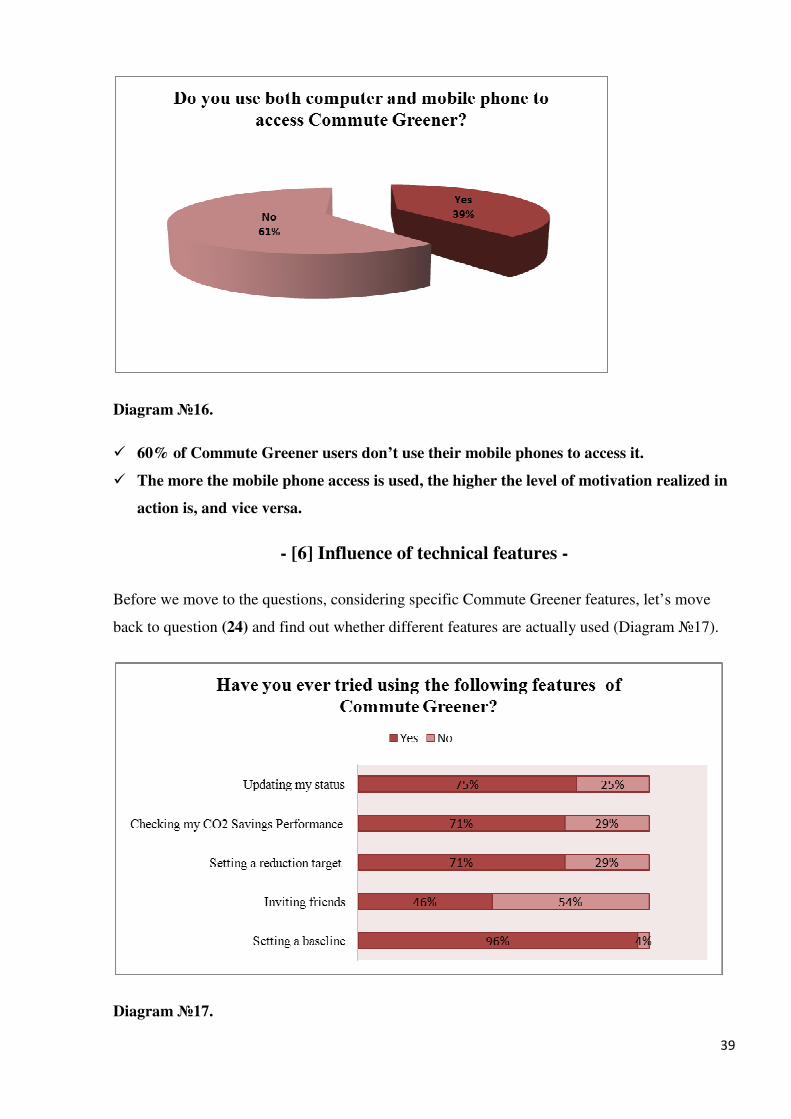
(24) Question “Do you use both computer and mobile phone to access Commute Greener?”
showed that 60% of Commute Greener users don’t access it through their mobile phones
(Diagram №16).
Kendall’s rank correlation analysis partly confirmed the assumption that not using mobile phone
to access Commute Greener is associated with greater costs: there is a significant direct weak
interrelation between motivation realized in action and “Do you use both computer and
mobile phone to access Commute Greener?” Correlation coefficient is 0,251(*).
39
Diagram №16.
� 60% of Commute Greener users don’t use their mobile phones to access it.
� The more the mobile phone access is used, the higher the level of motivation realized in
action is, and vice versa.
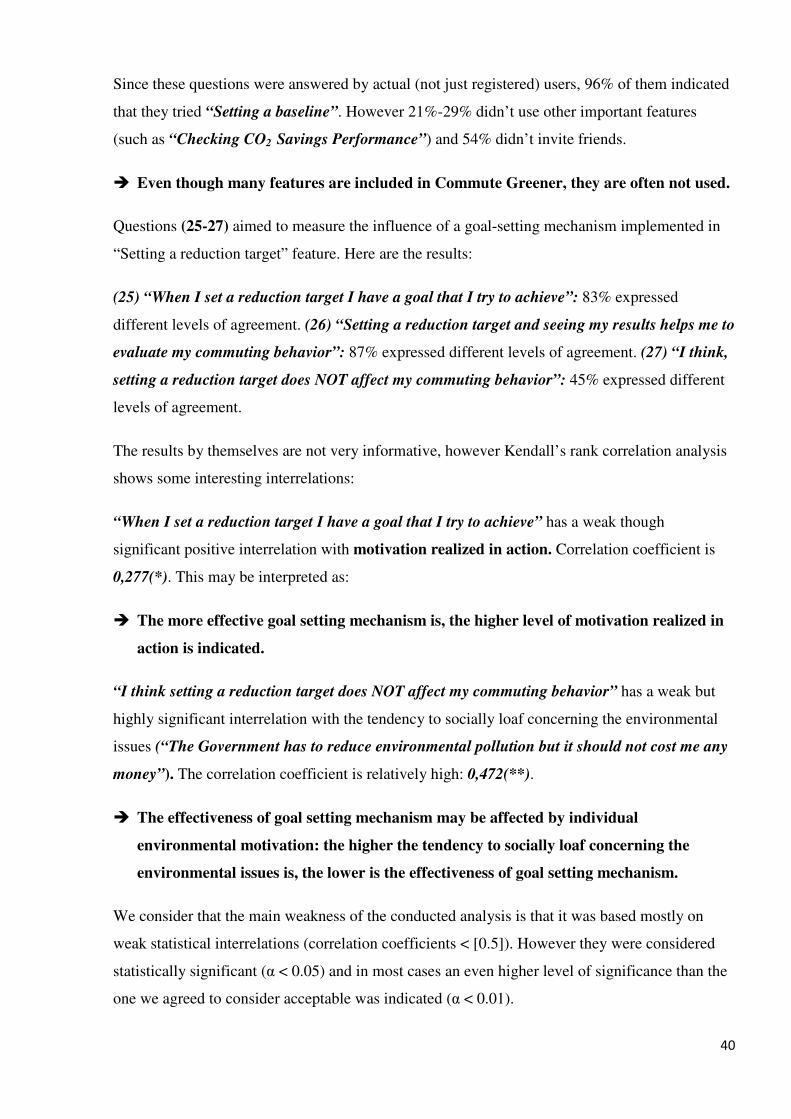
- [6] Influence of technical features -
Before we move to the questions, considering specific Commute Greener features, let’s move
back to question (24) and find out whether different features are actually used (Diagram №17).
Diagram №17.
40
Since these questions were answered by actual (not just registered) users, 96% of them indicated
that they tried “Setting a baseline”. However 21%-29% didn’t use other important features
(such as “Checking CO2 Savings Performance”) and 54% didn’t invite friends.
� Even though many features are included in Commute Greener, they are often not used.
Questions (25-27) aimed to measure the influence of a goal-setting mechanism implemented in
“Setting a reduction target” feature. Here are the results:
(25) “When I set a reduction target I have a goal that I try to achieve”: 83% expressed
different levels of agreement. (26) “Setting a reduction target and seeing my results helps me to
evaluate my commuting behavior”: 87% expressed different levels of agreement. (27) “I think,
setting a reduction target does NOT affect my commuting behavior”: 45% expressed different
levels of agreement.
The results by themselves are not very informative, however Kendall’s rank correlation analysis
shows some interesting interrelations:
“When I set a reduction target I have a goal that I try to achieve” has a weak though
significant positive interrelation with motivation realized in action. Correlation coefficient is
0,277(*). This may be interpreted as:
� The more effective goal setting mechanism is, the higher level of motivation realized in
action is indicated.
“I think setting a reduction target does NOT affect my commuting behavior” has a weak but
highly significant interrelation with the tendency to socially loaf concerning the environmental
issues (“The Government has to reduce environmental pollution but it should not cost me any
money”). The correlation coefficient is relatively high: 0,472(**).
� The effectiveness of goal setting mechanism may be affected by individual
environmental motivation: the higher the tendency to socially loaf concerning the
environmental issues is, the lower is the effectiveness of goal setting mechanism.
We consider that the main weakness of the conducted analysis is that it was based mostly on
weak statistical interrelations (correlation coefficients < [0.5]). However they were considered
statistically significant (α < 0.05) and in most cases an even higher level of significance than the
one we agreed to consider acceptable was indicated (α < 0.01).

41
VI. Conclusions
The data analysis confirmed the actuality of the problem described in the Introduction. Since it
was found out that only 10% of registered users indicated some consistent pattern of using
Commute Greener and almost 40% had never tried using its main feature, it is evident that it
actually suffers from nonparticipation and under-contribution.
To examine the reasons of motivation loss (which we consider a reason of nonparticipation and
under-contribution) we distinguished between pure motivation to use Commute Greener and
motivation realized in action. Statistically significant positive interrelation between the two
variables was found, however pure motivation was inherent for much more respondents: even
among those who didn’t show any motivation realized in action, pure motivation was
indicated in 37.5% of cases. It means that what we refer to as first stage of motivation loss is in
37.5% of cases characterized by persistence of interest to use Commute Greener but loss of its
activation.
To understand the nature of motivation and motivation loss we’ve investigated and analyzed
users’ “initial motivation” to use Commute Greener. Although we didn’t provide a broad
theoretical background concerning this issue (except maybe mentioning motives of self-
expression), we included it into our theoretical model because we assumed that initial
motivation to use Commute Greener was influential for current motivation to use it. The data
showed us that curiosity was a wide spread initial motive to register at Commute Greener: 74%
of respondents mentioned it and for 54% it was the only motive. Environmental-focused motives
were also popular although relatively small percentage of respondents mentioned them (28%).
The analysis of the interrelations between initial motives and current motivation (both pure
and realized in action) revealed that environment oriented initial motivation contributed to
better motivation for using Commute Greener, whereas plain curiosity predicted lower
motivation for using it. I.e. motivation loss (or in this case – just lack of motivation) for many
users was already predicted by improper initial motives (curiosity vs. environment).
� Although in this paper we aimed to find out how motivation loss can be avoided, we
think that there are no means by which initial motives and consequently related
motivation loss (or lack of motivation) can be influenced.
However there are many possible things to be done concerning the loss of motivation associated
with costs and benefits. Even for those users who came with “proper” initial motives,

42
motivation loss was determined by high costs and/or lack of benefits from using Commute
Greener.
Whereas different kinds of “awareness” were often mentioned among benefits, a lot of
respondents reported that for them there were no benefits from using Commute Greener. From
more precise explanations provided in the answers to the open question concerning the benefits,
we found out that for many respondents motivation loss at both stages might have occurred due
to their inability to change something in their behavior or attitudes (i.e. awareness could not
result in change of commuting pattern or awareness was already there). Meanwhile statistical
data analysis revealed that admitting possible benefits from using Commute Greener (i.e.
admitting that it “makes aware”, “helps to correct behavior” and gives possibility to “share
experience”) was positively correlated with pure motivation to use it.
At the same time costs from using Commute Greener seem to be really notable: complexity of
Graphical User Interface, effort requiring routine procedures, etc. are even mentioned in answers
to the open question concerning benefits. Whereas we previously assumed that high costs cause
motivation loss at the first stage (i.e. before even starting actually using Commute Greener),
the data analysis revealed that it’s also true for the second stage of motivation loss: users start
using it but then realize that doing the essential routine procedures requires too much of effort.
The respondents judged basic and essential features of Commute Greener (Starting and stopping
a journey and Setting a baseline) as the most complicated. Almost 85% of those who at least
tried using Commute Greener’s main feature think that it takes a lot of effort to do it regularly.
Meanwhile it was found out that the more the perceived costs of using the main feature are, the
lower level of motivation realized in action is indicated and vice versa.
� In sum, data analysis revealed that higher level of pure motivation was predicted by
admitting the possible benefits whereas higher level of motivation realized in action was
predicted by lower costs.
� It means that to actually make registered users use Commute Greener, the developers
should first of all lower the costs (especially those from using the main features) and
only then think about rewarding users for baring costs (Grudin 1989);
43
� Additionally, an effective password recovery system should be established at Commute
Greener, to avoid losing some users just because they cannot log in (experienced by
19% of actual users).
� And finally, considering that the more the mobile phone access is used, the higher the
level of motivation realized in action is, the developers may try promoting Commute
Greener among Iphone users (60% of Commute Greener users don’t use their mobile
phones to access it and for 37% the reason is that mobile phone is not suitable).
The analysis of the possible benefits from using Commute Greener revealed that possibility of
“sharing environmental friendly experience” (emphasized by the developers) was the hardest one
for the users to agree with and it was not even predetermined by absence of friends in the system.
At the same time only 46% of actual users have ever tried inviting friends and among the
answers to the open question concerning benefits, communication aspect was only mentioned
once. However it was described as a user-system communication, not user-user communication.
� Matching these two findings brought us to a critical conclusion: although Commute
Greener provides social networking and community services, i.e. a communicative
system for a virtual organization, there is a lack of communicational content circulating
within it, i.e. there is no shared information good and consequently a lack of public
good.
Whereas the provided theoretical background concerned the problems of motivating individual
contributions to information good shared as public good, it seems that at the moment another
research focus is relevant for Commute Greener. I.e. motivating to use the application by means
of which individual contribution to saving the environment can be achieved more effectively.
But anyway, if the creators intend to develop user-user communication features within Commute
Greener, what can we suggest them to do?
� From one point of view, as we found out from the data, 23% of registered Commute
Greener users never use online social network /communities, i.e. they don’t want
Commute Greener to develop these features/ connect to existing networks/communities
(90% among these 23%). It means that for some users Commute Greener still may be
helpful as just an independent application and it’s worth developing it in that way.
44
� From another point of view, abandoning user-user communication means losing
numerous possibilities for implementing motivating mechanisms (working both for
user-user and user-system communication). E.g. content feed feature exists but most of
users have no friends on Commute Greener -> nothing is on that feed -> social learning
mechanisms cannot be activated -> many registered users don’t know where to start
(Burke, Marlow & Lento 2009). E.g. users don’t have friends on Commute Greener (or
don’t communicate with them) -> they don’t have audience -> motives of self-
presentation and self-efficacy become irrelevant.
� Thus we suggest that Commute Greener should develop both as a relatively
independent application and as a virtual organization.
One of the aims of this paper was to analyze the impact that current technical features of
Commute Greener may have on users’ motivation. Although we have discussed some relevant
issues above, the analysis was mainly devoted to the goal setting mechanism realized in Setting a
reduction target feature. Our main finding concerning this feature was:
� The more effective goal setting mechanism is, the higher level of motivation realized in
action is indicated.
� However, the developers may consider that users currently set the reduction target by
themselves which is equivalent to “do your best goal” described by Beenen et al. 2004.
Meanwhile it is suggested that using specific numeric goals (externally determined) is
more effective (Beenen et al. 2004).
The paper was also aiming to discuss what information provided by Commute Greener may
influence users’ behavior and in what way.
� According to collective effort model we suggest that value of each individual
contribution should be emphasized in order to make the contributors motivated. E.g.
giving more efficient feedback from the system in case of user-system communication:
illustrating the effect of saving a certain amount of CO2 in a real world, giving
immediate real time feedback as suggested by Beenen et al. 2004 (really needed because
45
when you calculate your first journey nothing is shown right away and it’s ambiguous
where to look for it – from authors’ user experience).
References.
1. Abdi, H. (2007). Kendall rank correlation. In N.J. Salkind (Ed.): Encyclopedia of
Measurement and Statistics. Thousand Oaks (CA): Sage. pp. 508-510, at
http://www.utdallas.edu/~herve/Abdi-KendallCorrelation2007-pretty.pdf accessed 25 May
2010.
2. Ahuja, Manju K. and Kathleen M. Carley (1999). Network Structure in Virtual
Organizations. Organization Science, 10 (6), pp. 741-757.
3. Albanese, Robert, Van Fleet, David D. (1985). Rational Behavior in Groups: The Free-
Riding Tendency. The Academy of Management Review Vol 10(2), pp. 244-255.
4. Beenen, G., Ling, K., Wang, X., Chang, K., Frankowski, D., Resnick, P., et al. (2004). Using
social psychology to motivate contributions to online communities. In CSCW '04:
Proceedings of the ACM Conference On Computer Supported Cooperative Work. New
York: ACM Press.
5. Burke, Moira, Marlow C. and Lento T. (2009). Feed Me: Motivating Newcomer
Contribution in Social Network Sites. In Proc. CHI ‘09. ACM Press (2009), pp. 945-954.
6. Chen, Yan, Harper M., Konstan J., Xin Li S. (2008). Social Comparisons and Contributions
to Online Communities: A Field Experiment on MovieLens. American Economic Review
forthcoming, at http://excen.gsu.edu/docs/chen_seminar.pdf accessed 13 May 2010.
7. CSCW 2004, Chicago, Call for participation, at
http://www1.acm.org/cscw2004/call_intro.html accessed 26 May 2010.
8. Couper Mick P. (2000). Web Surveys a Review of Issues and Approaches." Public Opinion
Quarterly, volume 64, number 4 (Winter), pp. 464-481.
9. Couper Mick P., Traugott Michael W., Lamias Mark J. (2001) Web Survey Design and
Administration, The Public Opinion Quarterly, Vol. 65, No. 2 (Summer, 2001), pp. 230-253.
10. DeSanctis G., Monge P. (1999). Introduction to the Special Issue: Communication Processes
for Virtual Organizations. Organization Science, Vol. 10, No. 6, Special Issue:
Communication Processes for Virtual Organizations, INFORMS, pp. 693-703.

46
11. Dillman, D., Totora R. D., Conradt J. and Bowker D. (1998). Influence of plain versus fancy
design on response rates for web surveys. Paper presented at annual meeting of the American
Statistical Association, Dallas, TX.
12. Dillman D., Tortora R.D. and Bowker D. (1998). Principles for Constructing Web Surveys,
Pullman, Washington. SESRC Technical Report 98-50, at
http://survey.sesrc.wsu.edu/dillman/papers/websurveyppr.pdf, accessed 6 May 2010.
13. Geer John G. (1988). What Do Open-Ended Questions Measure?, The Public Opinion
Quarterly, Vol. 52, No. 3, pp. 365-371.
14. Geer John G. (1991). Do Open-Ended Questions Measure "Salient" Issues?, The Public
Opinion Quarterly, Vol. 55, No. 3 (Autumn, 1991), pp. 360-370.
15. Grudin, J. (1988). Why CSCW Applications Fail: Problems in the Design and Evaluation of
Organizational Interfaces. In Proceedings of the Conference on Computer Supported
Cooperative Work, Portland, OR, September 26-28 ACM, New York, pp. 85- 93.
16. Ehrlich, S.F. (1987). Strategies for encouraging successful adoption of office communication
systems. ACM TOOIS, 5, pp. 340-357.
17. Frick, A., Baechtinger, M. T., & Reips, U-D. (1999), Financial incentives, personal
information and drop-out rate in online studies. In U-D. Reips et al.(Eds.), Current Internet
science. Trends, techniques, results.
18. Howell, D.C. (2010). Statistical Methods for Psychology, 7th Edition, Wadsworth, Cengage
Learning, Chapter 4, 6.
19. Karau, S. and Williams K. (1993). Social loafing: A meta-analytic review and theoretical
integration. Journal of Personality and Social Psychology, 1993. 65(4): pp. 681-706.
20. Knapp, F., & Heidingsfelder, M. (1999). Drop-out analyse: Wirkungen des
untersuchungsdesigns [Drop-out analysis: The effect of research design]. In U-D. Reips et al.
(Eds.), Current Internet science. Trends, techniques, results.
21. Papa Michael J., Daniels Tom D., Spiker Barry K. (2008). Organizational Communication:
Perspectives and Trends, Revised Edition Publisher: SAGE Publications, Inc Copyright
Year: 2008.
22. Rashid, AI Mamunur, Ling K., Tassone D Regina, Resnick P., Kraut R., Riedl J. (2006).
Motivating Participation by Displaying the Value of Contribution. In Proceedings of ACM
CHI 2006, pp. 955-958.
23. Research Methods Knowledge Base, Ethics at Research at
http://www.socialresearchmethods.net/kb/ethics.php accessed 26 May 2010.

47
24. Schau, Hope Jensen and Mary C. Gilly (2003). We Are What We Post? The Presentation of
Self in Personal Webspace. Journal of Consumer Research, Vol. 30, No. 4 (December), pp.
385-404.
25. Torgler, Benno, Garcia-Valinas M. A., Macintyre A. (2008). Environmental Participation
and Environmental Motivation. CREMA Working Paper Series 2008-19, Center for
Research in Economics, Management and the Arts CREMA.
26. Saunders M., Lewis P., Thornhil A. (2009). Research Methods for Business Students. (5th
ed.) Harlow: FT/Prentice Hall.
27. Sproull, L., Kiesler S. (1986). Reducing social context cues: Electronic mail in organizational
communication. Management Science. 32 (11). pp.1492-1512.
28. Wang Youcheng and Fesenmaier D. R. (2003). Understanding the Motivation to Contribute
to Online Communities: An Empirical Study of an Online Travel Community, Electronic
Markets. 13(1). pp.33-45.
29. Zanutto, Elaine (2004). Web Based Surveys, at
http://www.bom.gov.au/inside/services_policy/disaster_mitigation/reports/WebBasedSurvey
s.pdf, accessed 13 May 2010.