Motilal Oswal MOSt Focused Midcap 30 Fund ‘Emergence to Endurance’ winners are products of large...
25
1
Transcript of Motilal Oswal MOSt Focused Midcap 30 Fund ‘Emergence to Endurance’ winners are products of large...

1

2
Motilal Oswal MOSt Focused Midcap 30 Fund (MOSt Focused Midcap 30)
An open-ended equity scheme
2

3
Product labeling
This product is suitable for investors who are seeking*
Long-term capital growth Investment in equity and equity related instruments in a maximum of 30 quality mid-cap companies
having long-term competitive advantages and potential for growth High risk (BROWN)
(BLUE) investors understand that their principal will be at low risk
(YELLOW) investors understand that their principal will be at medium risk
(BROWN) investors understand that their principal will be at high risk
*Investors should consult their financial advisers if in doubt about whether the product is suitable for them. Note: Risk is represented as:
3

4
Buy Right Stock Characteristics Sit Tight Approach
Our investment philosophy – ‘Buy Right: Sit Tight’
A philosophy distilled from over 25 years of wealth creation expertise of Motilal Oswal Securities Ltd (Our Sponsor)
4
QGLP
‘Q’uality : Quality of business and management
‘G’rowth : Growth in earnings and sustained RoE
‘L’ongevity : Longevity of the competitive advantage /economic moat of the business
‘P’rice : Buying a good business for a fair price rather than buying a fair business for a good price.
Buy and Hold: We are strictly buy and hold
investors and believe that picking the right business needs skill and holding onto these business to enable our investors to benefit from the entire growth cycle, needs even more skill.
Focus: Our portfolios are high conviction portfolios with 20 to 25 stocks being our ideal number. We believe in adequate diversification but over-diversification results in diluting returns for our investors and adding market risk.

5
The sweet spot of the Indian markets is replete with investment ideas in the midcap space Midcaps offer excellent balance between strong growth and a demonstrable history of
management success
Extensively researched Moderate Growth High institutional holding
Under-researched , Under-owned High growth Demonstrated management history
Many fail at pre-emergence stage Business models not established
MOSt Focused Midcap 30 targets an unique and relatively untapped opportunity
Source : Capitaline and Internal Analysis, Data as on 31st December 2014
Sweet spot of the equity
market
Market Cap No. of Companies
148
602 6 billion-110 billion
<6 billion 2,254
>110 billion
5

6
MOSt Focused Midcap 30 aims to capture ‘Emergence to Endurance’ winners
Motilal Oswal 18th Wealth Creation Study (WCS) maps the journey of Emergence* to Endurance
The study highlights how large investment gains were made by identifying players entering their virtuous growth cycle, a majority of such companies being midcaps
Enters the Virtuous growth cycle
Organic growth often flatten
* Emergence: A company is said to have emerged when it crosses the threshold ROE of 15% for the first time in its history
Source: 18th Motilal Oswal Wealth Creation Study (WCS)
6
7
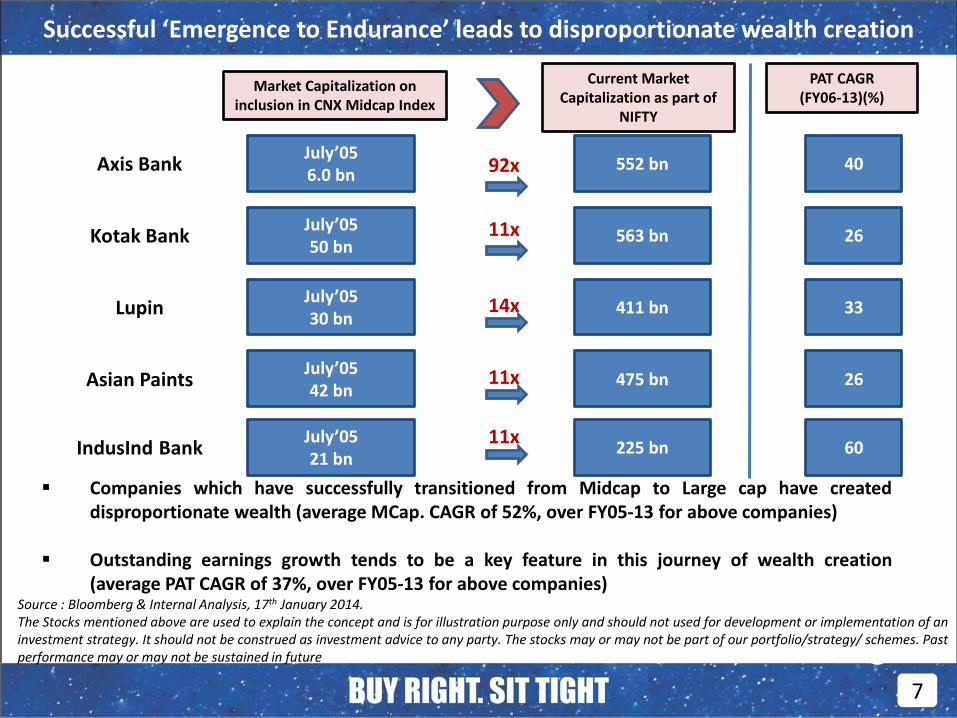
Kotak Bank
Lupin
Asian Paints
IndusInd Bank
Market Capitalization on inclusion in CNX Midcap Index
Current Market Capitalization as part of
NIFTY
July’05 50 bn
July’05 30 bn
July’05 42 bn
July’05 21 bn
563 bn
411 bn
475 bn
225 bn
11x
14x
11x
11x
Axis Bank July’05 6.0 bn
552 bn 92x
Companies which have successfully transitioned from Midcap to Large cap have created disproportionate wealth (average MCap. CAGR of 52%, over FY05-13 for above companies)
Outstanding earnings growth tends to be a key feature in this journey of wealth creation
(average PAT CAGR of 37%, over FY05-13 for above companies)
40
26
33
26
60
PAT CAGR (FY06-13)(%)
Source : Bloomberg & Internal Analysis, 17th January 2014. The Stocks mentioned above are used to explain the concept and is for illustration purpose only and should not used for development or implementation of an investment strategy. It should not be construed as investment advice to any party. The stocks may or may not be part of our portfolio/strategy/ schemes. Past performance may or may not be sustained in future
Successful ‘Emergence to Endurance’ leads to disproportionate wealth creation
7

8
‘Emergence to Endurance’ winners are products of large or expanding Industry Profit Pools
Source: 19th Motilal Oswal Wealth Creation Study (WCS) Data for FY2015. The sector mentioned herein are for general and comparison purpose only and not a complete disclosure of every material fact. It should not be construed as investment advice to any party. Past performance may or may not be sustained in future.
If an industry has a high profit pool, a company with the right value proposition/strategy can claim a rising share of this pool and emerge a Value Creator over time.
8

9
Source : Bloomberg & Internal Analysis, 19th Motilal Oswal Wealth Creation Study, Data as on 31st December 2014 Calendar Years The Stocks mentioned above are used to explain the concept and is for illustration purpose only and should not used for development or implementation of an investment strategy. It should not be construed as investment advice to any party. The stocks may or may not be part of our portfolio/strategy/ schemes. Past performance may or may not be sustained in future
Over the years, majority of the fastest wealth creators, in ‘Motilal Oswal Wealth Creation Study (WCS)’ have been Midcaps
Midcaps: High on Growth and Speed of Wealth Creation
Midcaps have typically grown higher than large caps over 5 and 7-year periods
Motilal Oswal Wealth Creation Study (over 2011-2013) Fastest Wealth Creators
5-Yr CAGR(%) 7- Yr CAGR(%)
NIFTY INDEX MIDCAP INDEX NIFTY INDEX MIDCAP INDEX
Revenue 15.0 19.0 15.8 20.9
EBITDA 11.4 20.4 14.1 20.0
EPS 6.4 8.6 10.1 16.1
Dividend 12.0 11.2 10.3 13.8
10

10
Under Researched: Fewer analysts cover midcap companies
Under owned: FII and MF ownership levels in midcaps are significantly lower than those in large caps
Midcaps: Under-Researched & Under-Owned
Source: Capitaline and MOAMC internal analysis, Data as on 30th September 2014
11
Source: Bloomberg & MOAMC Internal Analysis, Data as on 31th December 2014

11
Midcaps: Geared to the Indian Economy
Midcaps
Large Caps
Only 20% revenues of all companies and 30% revenues of non-
financial sector companies are international or influenced by
international factors
38% revenues of all companies and 50% revenues of
non-financial sector companies are international or influenced by
international factors
12
Source : IISL, Bloomberg & MOAMC Internal Analysis, Data as on 31st December 2014 The Stocks mentioned above are used to explain the concept and is for illustration purpose only and should not used for development or implementation of an investment strategy. It should not be construed as investment advice to any party. The stocks may or may not be part of our portfolio/strategy/ schemes. Past performance may or may not be sustained in future

12
In reality, midcaps have delivered better risk-adjusted returns v/s large caps
Midcaps trade at attractive valuations on a risk-adjusted basis
Source : Bloomberg & Internal Analysis, Data as on 31st December 2014, Note: Past performance may or may not be sustained in future
13

13
Motilal Oswal MOSt Focused Midcap 30 Fund (MOSt Focused Midcap 30)
14

14
MOSt Focused Midcap 30 – Key Features
Quality, Growth, Longevity and Price
(QGLP)
• Will invest in companies with:
• Enduring economic moats that ensure quality and longevity
• High growth potential
• Buying a good business at a fair price.
‘Buy and Hold’ Strategy
• Long term growth over economic cycles
• Enables compounding of growth
• Low Churn: Cost Efficient
• Portfolio churn driven by fundamentals over valuations
Focused, High Conviction Portfolio Construct
• Maximum 30 stocks
• Bottom-up stock picking
• Optimal Diversification
15

15
Why Quality?
Quality companies are those which have enduring economic moats (EMC’s)
0
250
500
750
1000
FY02 FY03 FY04 FY05 FY06 FY07 FY08 FY09 FY10 FY11 FY12
EMCs Non-EMCs Sensex
(All rebased to 100 in March 2002)
25%, 9.3x
12%, 3.1x
33% CAGR, 5.5x
20% CAGR, 3x
18%, 5.0x
Payoff profile of EMCs, Non-EMCs and Sensex
Source: 17th Motilal Oswal Wealth Creation Study (WCS) Data upto FY2012
16

16
Why “Buy and Hold”?
Source : MOAMC internal analysis, Data as on December 31, 2014; Period - January 1, 2001 to December 31, 2014 Note: Past performance may or may not be sustained in future . The above graph is only for illustration purpose and should not be construed as recommendation.
Improved Quality companies held for longer duration
CAGR
17
14.44%
11.29% 10.38%
12.94%
20.65%
19.03%
5%
8%
11%
14%
17%
20%
23%
Index < 3 yrs < 5 Yrs < 7 yrs 10 - 18 yrs Index Always
Nifty

17
Focus: Seeking Optimal Diversification
Diversifiable Risk Non-Diversifiable
Systemic Risk
Source: An Introduction to Risk and Return Concepts and Evidence by Franco Modigliani and Gerald A. Pogue
18

18
Investment Process – Stock Screening
Investment Universe
• Greater than min. market cap of CNX Midcap Index
Quantitative Screening
• Earnings growth, ROA and ROE etc.
Research
• ‘360 degree view’ of company
• Identify competitive advantages, barriers to entry
• Nature and sustainability of catalysts
Fund Portfolio
• High Conviction Ideas
• Improved risk-adjusted return characteristics
Top down analysis market views, thematic drivers, winner categories and categories winners
Max 30 Stocks 100-150 Stocks 75-100 Stocks ~500 Stocks Eg.
19

19
Investment Process (contd…) – Stock Evaluation
A business we
understand
Favorable long term economics
Able and trustworthy
management
Margin of Safety
20

20
Portfolio Construct
For Whom
Investment Horizon
Investors who like to invest with a Long-term wealth creation view and believe that wealth is created by ‘BUY RIGHT SIT TIGHT i.e. buying quality companies and riding their growth cycle .
Medium to Long Term
Number of Stocks
Maximum 30 Stocks
Allocation
•Minimum 65%:between Top 101st and 200th listed companies by market capitalization
•Maximum 25%: beyond the Top 200th listed company and with market capitalization not lower than INR 600 cr.
•Maximum 10% : Debt, Money Market Instruments, G-Sec, Bonds, Cash and cash equivalents, etc.
* subject to maximum of 30 companies
21

21
• Type of Scheme: An open ended equity scheme
• Investment Objective: The investment objective of the Scheme is to achieve long term capital appreciation by investing in a maximum of 30 quality mid-cap companies having long-term competitive advantages and potential for growth. However, there can be no assurance or guarantee that the investment objective of the Scheme would be achieved.
• Benchmark: CNX Midcap Index
• Entry Load: Nil
• Exit Load: Nil
• Plans: Regular Plan and Direct Plan
• Options (Under each plan): Dividend (Payout and Reinvestment) and Growth
• Minimum Application Amount : Rs. 5,000 /- and in multiples of Re. 1/- thereafter.
• Additional Application Amount: Rs. 1,000/- and in multiples of Re. 1/- thereafter.
• Systematic Investment Plan (SIP):Minimum installment amount - Rs. 1,000/-(weekly / fortnightly/monthly) and Rs. 2,000/- (quarterly) and in multiples of Re. 1/- thereafter with minimum of 6 installments for weekly /fortnightly/monthly frequency and minimum 3 installments for quarterly frequency. The dates for Auto Debit Facility shall be on the 1st, 7th,14th, 21st or 28th of every month. •Minimum Redemption Amount: Rs. 1,000/- and in multiples of Re. 1/- thereafter.
Fund Details
22

22
Sector allocations
Data as on 31st December 2014
• Finance, Pharmaceuticals, and Transportation are the top 3 sector exposures • Portfolio is well represented across a wide range of sectors
Industry classification as recommended by AMFI
23
1.33%
2.52%
3.08%
3.46%
4.13%
4.38%
4.55%
6.37%
7.47%
7.50%
7.66%
7.93%
7.96%
12.14%
19.50%
Cash & Equivalent
Industrial Capital Goods
Banks
Construction Project
Industrial Products
Software
Petroleum Products
Consumer Durables
Textile Products
Auto
Consumer Non Durables
Auto Ancillaries
Transportation
Pharmaceuticals
Finance
Industry Allocation

23
Portfolio holdings
Data as on 31st December 2014
•TOP 5 Stocks % to NAV=39.11% • TOP 10 Stocks % to NAV =64.08% •Currently we Hold 20 Stocks
24
Top Holdings
Name of Instrument % to Net Assets
Ajanta Pharma Limited 8.25
Gujarat Pipavav Port Limited 7.96
Amara Raja Batteries Limited 7.93
TVS Motor Company Limited 7.50
Page Industries Limited 7.47
Bajaj Finance Limited 7.09
CRISIL Limited 4.58
H P C Limited 4.55
Mindtree Limited 4.38
P & G Hygiene and Health Care Limited 4.38

24
Fund Manager Details
Taher Badshah is the Fund Manager of this Scheme and is responsible for managing investments in equity and equity related instruments of the Scheme. Mr. Badshah is a B.E. in Electronics from the University of Mumbai and has followed it up with a Masters in Management Studies (Finance) from the SP Jain Institute of Management, Mumbai. Taher Badshah brings with him 19 years of rich experience in fund management and investment research. He started his career as an automobiles analyst with Motilal Oswal and has been well-regarded in the industry for his work in this sector. He has also worked in different capacities with organizations like Kotak Investment Advisors, Alliance Capital Asset Management Pvt. Ltd., Kotak Institutional Equities Ltd., and Prudential ICICI Asset Management Company Ltd. He has spent the first 10 years of his career doing sell-side equity research and the past 9 years in active fund management. He is also Fund Manager of Motilal Oswal MOSt Focused Midcap 30 Fund. Mr. Abhiroop Mukherjee (For Debt Component) He is B.com (H), MBA with 4 years of experience in Trading Fixed Income Securities viz. G-sec, T-bills, Corporate Bonds CP, CD etc. He has earlier worked with PNB GILTS LTD. as a WDM Dealer for the period 2007-2011
26
Mr. Taher Badshah Senior Vice-President & Head of Equities

25
Disclaimer
This presentation has been prepared and issued on the basis of internal data, publicly available information and other sources believed to be reliable. The information contained in this document is for general purposes only and not a complete disclosure of every material fact and terms and conditions and features of Motilal Oswal MOSt Focused Midcap 30 Fund (MOSt Focused Midcap 30).The information / data herein alone is not sufficient and shouldn’t be used for the development or implementation of an investment strategy. It should not be construed as investment advice to any party. All opinions, figures, charts/graphs, estimates and data included in this presentation are as on date and are subject to change without notice. While utmost care has been exercised while preparing this document, Motilal Oswal Asset Management Company Limited does not warrant the completeness or accuracy of the information and disclaims all liabilities, losses and damages arising out of the use of this information. The statements contained herein may include statements of future expectations and other forward-looking statements that are based on our current views and assumptions and involve known and unknown risks and uncertainties that could cause actual results, performance or events to differ materially from those expressed or implied in such statements. Readers shall be fully responsible/liable for any decision taken on the basis of this presentation. No part of this document may be duplicated in whole or in part in any form and/or redistributed without prior written consent of the Motilal Oswal Mutual Fund/Motilal Oswal Asset Management Company Limited. Readers should before investing in the Scheme make their own investigation and seek appropriate professional advice. Please read Scheme Information Document (SID) and Statement of Additional Information (SAI) carefully before investing . Statutory Details: Constitution: Motilal Oswal Mutual Fund has been set up as a trust under the Indian Trust Act, 1882. Trustee: Motilal Oswal Trustee Company Limited. Investment Manager: Motilal Oswal Asset Management Company Ltd. Sponsor: Motilal Oswal Securities Ltd.
Mutual fund investments are subject to market risks, read all scheme related documents carefully. Past performance of the Sponsor/ AMC/ Mutual Fund and its affiliates does not indicate the future performance of the scheme and may not provide a basis of comparison with other investments.
27