Moser Baer (India) Ltd. · N.A. Current Assets 817.26 914.58 -10.64% ... Profit After Tax (PAT)...
8
Stakeholders’ Education | Corporate Governance Research | Corporate Governance Score | Proxy Advisory STAKEHOLDERS EMPOWERMENT SERVICES 1 | P AGE SECTOR: IT - HARDWARE REPORTING DATE: 14 TH AUGUST, 2017 MOSER BAER INDIA LTD. www.moserbaer.in Moser Baer (India) Ltd. NSE Code - MOSERBAER TABLE 1 - MARKET DATA (STANDALONE) (AS ON 11 TH AUGUST, 2017) Sector - IT - Hardware NSE Market Price (`) 4.35 NSE Market Cap. (₹ Cr.) 97.58 Face Value (`) 10.00 Equity (` Cr.) 221.77 Business Group – N.A. 52 week High/Low (₹) 8.80/4.10 Net worth (₹ Cr.)* -2,074.41 Year of Incorporation - 1983 TTM P/E (TTM) N.A. Traded Volume (Shares) 4,72,575 TTM P/BV N.A. Traded Volume (lacs) 20.56 Registered Office - Source - Capitaline, TTM - Trailing Twelve Month, N.A -Not Applicable *As on 30 th September, 2016 43-B, Okhla Industrial Estate, COMPANY BACKGROUND New Delhi – 110 020 Moser Baer (India) Limited (MBIL), headquartered in New Delhi, is one of India's leading technology companies. Incorporated in 21 st March of the year 1983 as a Time Recorder unit in technical collaboration with Maruzen Corporation, Japan and Moser Baer Sumiswald, Switzerland. The Company successfully developed cutting edge technologies to become the world's second largest manufacturer of Optical Storage media like CDs and DVDs. MBIL also emerged as a leading-edge player in next- generation of storage formats, especially Blu-ray discs. Recently, the company has also transformed itself from a single business into a multi-technology organisation, diversifying into exciting areas of Solar Energy, Home Entertainment and IT Peripherals and Consumer Electronics. Through its wholly owned subsidiaries, the company manufactures photovoltaic cells and modules by straddling multiple technologies including crystalline silicon, concentrator, nano technologies and thin films. Company Website: www.moserbaer.in Revenue and Profit Performance The revenue of the Company increased from ₹ 139.66 crores to ₹ 154.13 crores from quarter ending Sep’15 to quarter ending Sep’16. The Company made a loss of ₹ 223.63 crores in quarter ending Sep’16 vis-a-vis making a loss of ₹ 284.98 crores in quarter ending Sep’15. Source: Moneycontrol Performance vis-à-vis Market TABLE 2- Returns 1-m 3-m 6-m 12-m Moser Baer (I) Ltd -12.12% -42.53% -37.41% -44.59% Nifty -0.72% 3.00% 12.56% 13.63% NIFTY IT 2.12% 2.11% 2.25% -3.01% Source: Capitaline/ NSE 0.00 0.50 1.00 1.50 Aug 16 Oct 16 Dec 16 Feb 17 Apr 17 Jun 17 Moser Baer (India) Ltd NIFTY NIFTY IT 154.13 153.21 139.66 -223.63 -101.43 -284.98 -400 -200 0 200 Sep'16 Mar'16 Sep'15 Quarterly revenue and Profit (₹ crore) Revenue Profit
-
Upload
dangnguyet -
Category
Documents
-
view
216 -
download
0
Transcript of Moser Baer (India) Ltd. · N.A. Current Assets 817.26 914.58 -10.64% ... Profit After Tax (PAT)...

Stakeholders’ Education | Corporate Governance Research | Corporate Governance Score | Proxy Advisory
STAKEHOLDERS EMPOWERMENT SERVICES
1 | P A G E
SECTOR: IT - HARDWARE REPORTING DATE: 14TH AUGUST, 2017
MOSER BAER INDIA LTD. www.moserbaer.in
Moser Baer (India) Ltd. NSE Code - MOSERBAER TABLE 1 - MARKET DATA (STANDALONE) (AS ON 11TH AUGUST, 2017)
Sector - IT - Hardware NSE Market Price (`) 4.35 NSE Market Cap. (₹ Cr.) 97.58
Face Value (`) 10.00 Equity (` Cr.) 221.77
Business Group – N.A. 52 week High/Low (₹) 8.80/4.10 Net worth (₹ Cr.)* -2,074.41
Year of Incorporation - 1983 TTM P/E (TTM) N.A. Traded Volume (Shares) 4,72,575
TTM P/BV N.A. Traded Volume (lacs) 20.56
Registered Office - Source - Capitaline, TTM - Trailing Twelve Month, N.A -Not Applicable *As on 30th September, 2016
43-B, Okhla Industrial Estate, COMPANY BACKGROUND
New Delhi – 110 020 Moser Baer (India) Limited (MBIL), headquartered in New Delhi, is one of India's
leading technology companies. Incorporated in 21st March of the year 1983 as a Time
Recorder unit in technical collaboration with Maruzen Corporation, Japan and Moser
Baer Sumiswald, Switzerland. The Company successfully developed cutting edge
technologies to become the world's second largest manufacturer of Optical Storage
media like CDs and DVDs. MBIL also emerged as a leading-edge player in next-
generation of storage formats, especially Blu-ray discs. Recently, the company has also
transformed itself from a single business into a multi-technology organisation,
diversifying into exciting areas of Solar Energy, Home Entertainment and IT Peripherals
and Consumer Electronics. Through its wholly owned subsidiaries, the company
manufactures photovoltaic cells and modules by straddling multiple technologies
including crystalline silicon, concentrator, nano technologies and thin films.
Company Website:
www.moserbaer.in
Revenue and Profit Performance
The revenue of the Company increased from ₹ 139.66 crores to
₹ 154.13 crores from quarter ending Sep’15 to quarter ending
Sep’16. The Company made a loss of ₹ 223.63 crores in quarter
ending Sep’16 vis-a-vis making a loss of ₹ 284.98 crores in
quarter ending Sep’15.
Source: Moneycontrol
Performance vis-à-vis Market
TABLE 2- Returns
1-m 3-m 6-m 12-m
Moser Baer (I) Ltd -12.12% -42.53% -37.41% -44.59%
Nifty -0.72% 3.00% 12.56% 13.63%
NIFTY IT 2.12% 2.11% 2.25% -3.01%
Source: Capitaline/ NSE
0.00
0.50
1.00
1.50
Aug 16 Oct 16 Dec 16 Feb 17 Apr 17 Jun 17
Moser Baer (India) Ltd NIFTY NIFTY IT
154.13 153.21 139.66
-223.63-101.43
-284.98
-400
-200
0
200
Sep'16 Mar'16 Sep'15
Quarterly revenue and Profit (₹ crore)
Revenue Profit
Stakeholders’ Education | Corporate Governance Research | Corporate Governance Score | Proxy Advisory
STAKEHOLDERS EMPOWERMENT SERVICES
2 | P A G E
SECTOR: IT - HARDWARE REPORTING DATE: 14TH AUGUST, 2017
MOSER BAER INDIA LTD. www.moserbaer.in
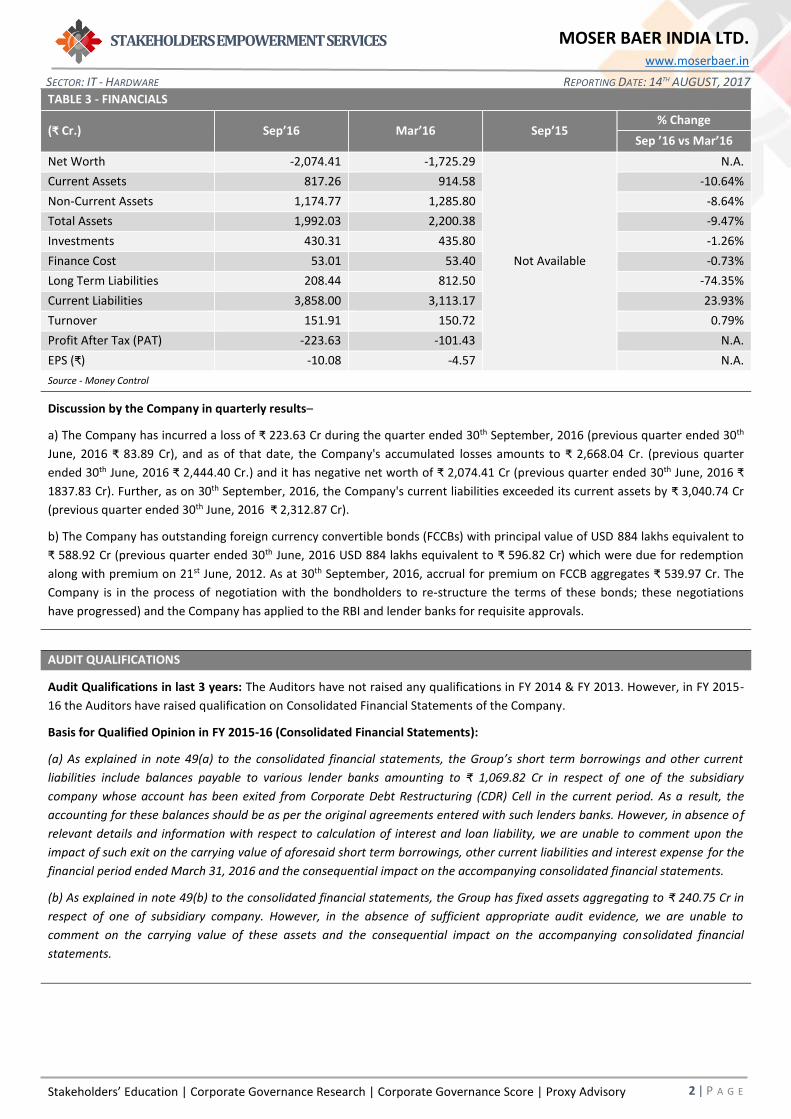
TABLE 3 - FINANCIALS
(₹ Cr.) Sep’16 Mar’16 Sep’15 % Change
Sep ’16 vs Mar’16
Net Worth -2,074.41 -1,725.29
Not Available
N.A.
Current Assets 817.26 914.58 -10.64%
Non-Current Assets 1,174.77 1,285.80 -8.64%
Total Assets 1,992.03 2,200.38 -9.47%
Investments 430.31 435.80 -1.26%
Finance Cost 53.01 53.40 -0.73%
Long Term Liabilities 208.44 812.50 -74.35%
Current Liabilities 3,858.00 3,113.17 23.93%
Turnover 151.91 150.72 0.79%
Profit After Tax (PAT) -223.63 -101.43 N.A.
EPS (₹) -10.08 -4.57 N.A.
Source - Money Control
Discussion by the Company in quarterly results–
a) The Company has incurred a loss of ₹ 223.63 Cr during the quarter ended 30th September, 2016 (previous quarter ended 30th
June, 2016 ₹ 83.89 Cr), and as of that date, the Company's accumulated losses amounts to ₹ 2,668.04 Cr. (previous quarter
ended 30th June, 2016 ₹ 2,444.40 Cr.) and it has negative net worth of ₹ 2,074.41 Cr (previous quarter ended 30th June, 2016 ₹
1837.83 Cr). Further, as on 30th September, 2016, the Company's current liabilities exceeded its current assets by ₹ 3,040.74 Cr
(previous quarter ended 30th June, 2016 ₹ 2,312.87 Cr).
b) The Company has outstanding foreign currency convertible bonds (FCCBs) with principal value of USD 884 lakhs equivalent to
₹ 588.92 Cr (previous quarter ended 30th June, 2016 USD 884 lakhs equivalent to ₹ 596.82 Cr) which were due for redemption
along with premium on 21st June, 2012. As at 30th September, 2016, accrual for premium on FCCB aggregates ₹ 539.97 Cr. The
Company is in the process of negotiation with the bondholders to re-structure the terms of these bonds; these negotiations
have progressed) and the Company has applied to the RBI and lender banks for requisite approvals.
AUDIT QUALIFICATIONS
Audit Qualifications in last 3 years: The Auditors have not raised any qualifications in FY 2014 & FY 2013. However, in FY 2015-
16 the Auditors have raised qualification on Consolidated Financial Statements of the Company.
Basis for Qualified Opinion in FY 2015-16 (Consolidated Financial Statements):
(a) As explained in note 49(a) to the consolidated financial statements, the Group’s short term borrowings and other current
liabilities include balances payable to various lender banks amounting to ₹ 1,069.82 Cr in respect of one of the subsidiary
company whose account has been exited from Corporate Debt Restructuring (CDR) Cell in the current period. As a result, the
accounting for these balances should be as per the original agreements entered with such lenders banks. However, in absence of
relevant details and information with respect to calculation of interest and loan liability, we are unable to comment upon the
impact of such exit on the carrying value of aforesaid short term borrowings, other current liabilities and interest expense for the
financial period ended March 31, 2016 and the consequential impact on the accompanying consolidated financial statements.
(b) As explained in note 49(b) to the consolidated financial statements, the Group has fixed assets aggregating to ₹ 240.75 Cr in
respect of one of subsidiary company. However, in the absence of sufficient appropriate audit evidence, we are unable to
comment on the carrying value of these assets and the consequential impact on the accompanying consolidated financial
statements.

Stakeholders’ Education | Corporate Governance Research | Corporate Governance Score | Proxy Advisory
STAKEHOLDERS EMPOWERMENT SERVICES
3 | P A G E
SECTOR: IT - HARDWARE REPORTING DATE: 14TH AUGUST, 2017
MOSER BAER INDIA LTD. www.moserbaer.in
Response Comment
Frequency of Qualifications Only in FY 2015-16
Have the Auditors made any adverse remark in last 3 years? No -
Are the material accounts audited by the Principal Auditors? Yes -
Do the financial statements include material unaudited financial statements? No -
TABLE 4: BOARD PROFILE (AS PER ANNUAL REPORT 2015-16)
Regulatory Norms Company
% of Independent Directors on the Board 50% 60%
% of Promoter Directors on the Board - 40%
Number of Women Directors on the Board At least 1 1
Classification of Chairman of the Board - Executive Promoter Director
Is the post of Chairman and MD/CEO held by the same person? - Yes
Average attendance of Directors in the Board meetings (%) - 85.71%
Composition of Board: As per Regulation 17(1)(b) of the Listing Regulations, 2015, the Company should have at least 50%
Independent Directors as the Chairman of the Board is a Promoter Executive Director. The Company has 60% of Independent
Directors and hence, it meets the regulatory requirements.
Board Diversity: The Company has 5 directors out of which 4 are male and 1 is female.
TABLE 5 - FINANCIAL RATIOS
Ratios Sep’16 Mar’16 Sep’15 % Change
Sep ’16 vs Mar’16
Turn
ove
r
Rat
ios
Inventory Turnover 1.01 0.76
Not Available
33.46%
Debtors Turnover 0.30 0.29 4.51%
Fixed asset Turnover 0.13 0.12 10.32%
Current Asset Turnover 0.19 0.16 12.79%
Ret
urn
Rat
ios
Operating Profit Margin -3.94% -4.49% N.A.
Net Profit Margin -147.21% -67.30% N.A.
Return on Assets (ROA) N.A. N.A. N.A.
Return on Equity (ROE) N.A. N.A. N.A.
Return on Capital Employed
(ROCE) N.A. N.A. N.A.
Liq
uid
ity
Rat
ios
Current Ratio 0.21 0.29 -27.89%
Quick Ratio 0.17 0.23 -24.78%
Cash Ratio 0.04 0.06 -31.88%
Working Capital Turnover ratio N.A. N.A. N.A.
Solv
ency
Rat
ios Debt to equity ratio N.A. N.A. N.A.
Interest Coverage Ratio N.A. N.A. N.A.
Trad
ing
Rat
ios
Market Cap / Sales 1.11 1.24 -10.23%
Market Cap/ Net Worth N.A. N.A. N.A.
Market Cap/PAT N.A. N.A. N.A.
Market Cap/EBITDA N.A. N.A. N.A.
Source - Money Control
Stakeholders’ Education | Corporate Governance Research | Corporate Governance Score | Proxy Advisory
STAKEHOLDERS EMPOWERMENT SERVICES
4 | P A G E
SECTOR: IT - HARDWARE REPORTING DATE: 14TH AUGUST, 2017
MOSER BAER INDIA LTD. www.moserbaer.in
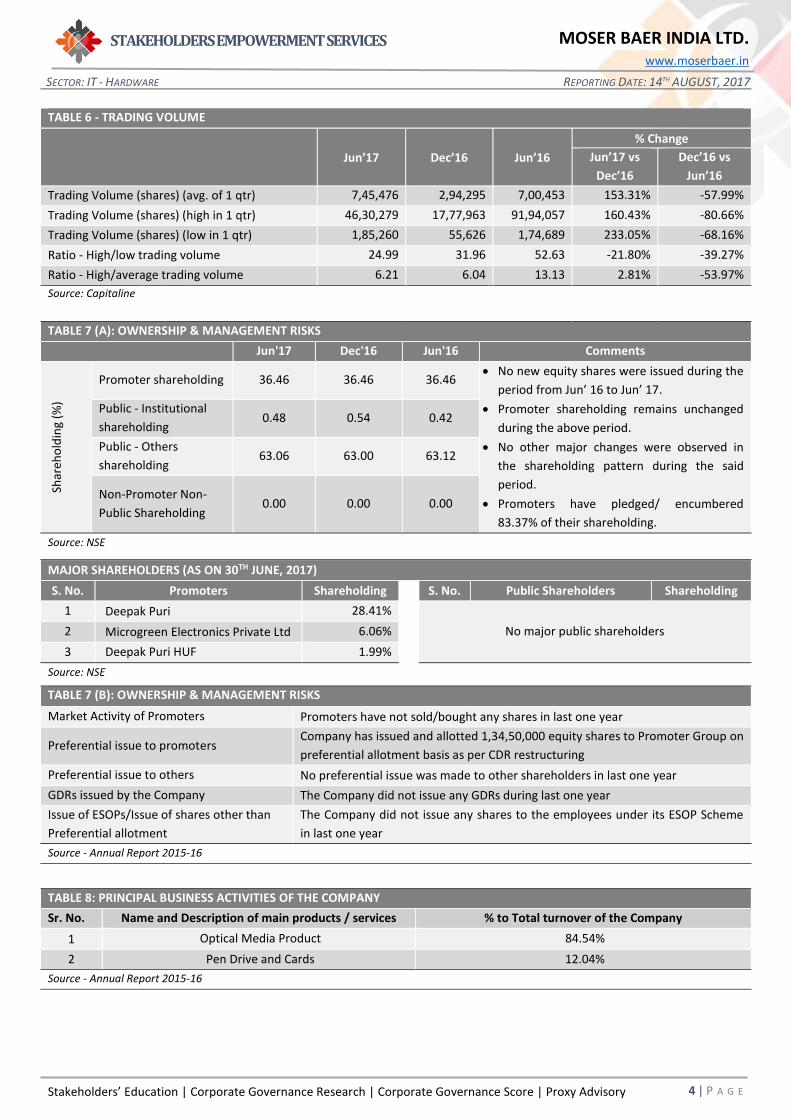
TABLE 6 - TRADING VOLUME
Jun’17 Dec’16 Jun’16
% Change
Jun’17 vs
Dec’16
Dec’16 vs
Jun’16
Trading Volume (shares) (avg. of 1 qtr) 7,45,476 2,94,295 7,00,453 153.31% -57.99%
Trading Volume (shares) (high in 1 qtr) 46,30,279 17,77,963 91,94,057 160.43% -80.66%
Trading Volume (shares) (low in 1 qtr) 1,85,260 55,626 1,74,689 233.05% -68.16%
Ratio - High/low trading volume 24.99 31.96 52.63 -21.80% -39.27%
Ratio - High/average trading volume 6.21 6.04 13.13 2.81% -53.97%
Source: Capitaline
TABLE 7 (A): OWNERSHIP & MANAGEMENT RISKS
Jun'17 Dec'16 Jun'16 Comments
Shar
eho
ldin
g (%
)
Promoter shareholding 36.46 36.46 36.46 • No new equity shares were issued during the
period from Jun’ 16 to Jun’ 17.
• Promoter shareholding remains unchanged
during the above period.
• No other major changes were observed in
the shareholding pattern during the said
period.
• Promoters have pledged/ encumbered
83.37% of their shareholding.
Public - Institutional
shareholding 0.48 0.54 0.42
Public - Others
shareholding 63.06 63.00 63.12
Non-Promoter Non-
Public Shareholding 0.00 0.00 0.00
Source: NSE
MAJOR SHAREHOLDERS (AS ON 30TH JUNE, 2017)
S. No. Promoters Shareholding S. No. Public Shareholders Shareholding
1 Deepak Puri 28.41%
No major public shareholders
2 Microgreen Electronics Private Ltd 6.06%
3 Deepak Puri HUF 1.99%
Source: NSE
TABLE 7 (B): OWNERSHIP & MANAGEMENT RISKS
Market Activity of Promoters Promoters have not sold/bought any shares in last one year
Preferential issue to promoters Company has issued and allotted 1,34,50,000 equity shares to Promoter Group on
preferential allotment basis as per CDR restructuring
Preferential issue to others No preferential issue was made to other shareholders in last one year
GDRs issued by the Company The Company did not issue any GDRs during last one year
Issue of ESOPs/Issue of shares other than
Preferential allotment
The Company did not issue any shares to the employees under its ESOP Scheme
in last one year
Source - Annual Report 2015-16
TABLE 8: PRINCIPAL BUSINESS ACTIVITIES OF THE COMPANY
Sr. No. Name and Description of main products / services % to Total turnover of the Company
1 Optical Media Product 84.54%
2 Pen Drive and Cards 12.04%
Source - Annual Report 2015-16
Stakeholders’ Education | Corporate Governance Research | Corporate Governance Score | Proxy Advisory
STAKEHOLDERS EMPOWERMENT SERVICES
5 | P A G E
SECTOR: IT - HARDWARE REPORTING DATE: 14TH AUGUST, 2017
MOSER BAER INDIA LTD. www.moserbaer.in
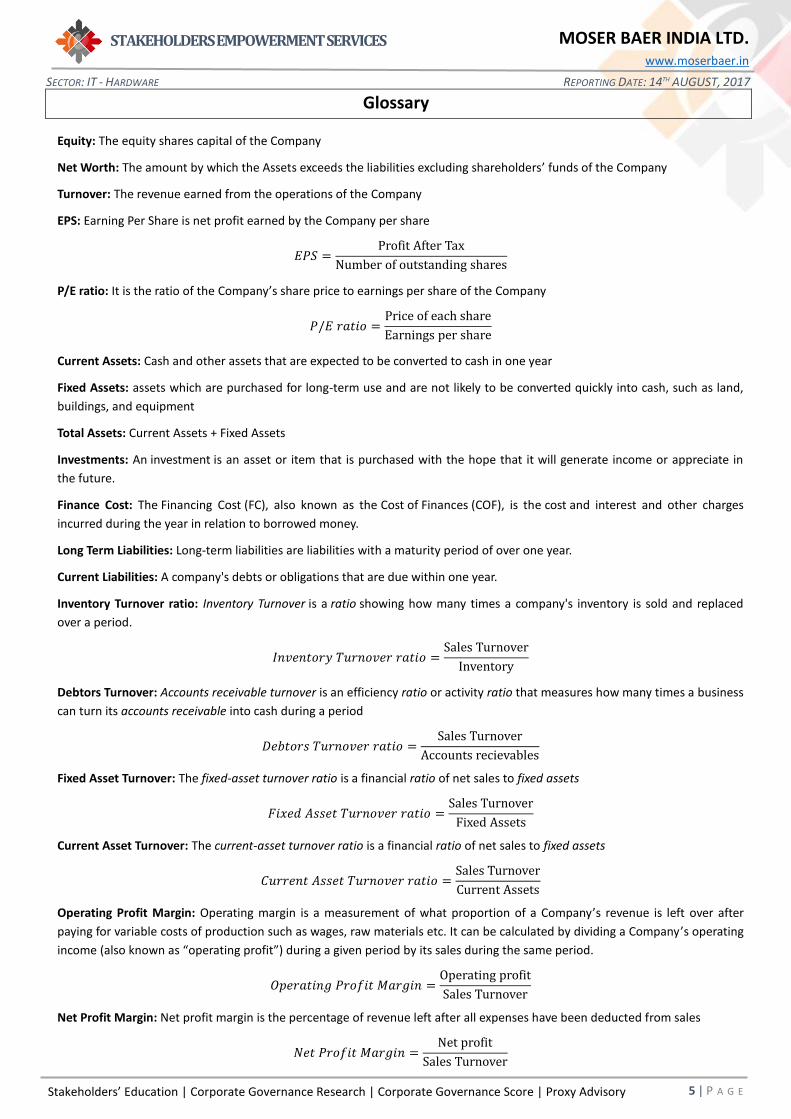
Glossary
Equity: The equity shares capital of the Company
Net Worth: The amount by which the Assets exceeds the liabilities excluding shareholders’ funds of the Company
Turnover: The revenue earned from the operations of the Company
EPS: Earning Per Share is net profit earned by the Company per share
𝐸𝑃𝑆 =Profit After Tax
Number of outstanding shares
P/E ratio: It is the ratio of the Company’s share price to earnings per share of the Company
𝑃/𝐸 𝑟𝑎𝑡𝑖𝑜 =Price of each share
Earnings per share
Current Assets: Cash and other assets that are expected to be converted to cash in one year
Fixed Assets: assets which are purchased for long-term use and are not likely to be converted quickly into cash, such as land,
buildings, and equipment
Total Assets: Current Assets + Fixed Assets
Investments: An investment is an asset or item that is purchased with the hope that it will generate income or appreciate in
the future.
Finance Cost: The Financing Cost (FC), also known as the Cost of Finances (COF), is the cost and interest and other charges
incurred during the year in relation to borrowed money.
Long Term Liabilities: Long-term liabilities are liabilities with a maturity period of over one year.
Current Liabilities: A company's debts or obligations that are due within one year.
Inventory Turnover ratio: Inventory Turnover is a ratio showing how many times a company's inventory is sold and replaced
over a period.
𝐼𝑛𝑣𝑒𝑛𝑡𝑜𝑟𝑦 𝑇𝑢𝑟𝑛𝑜𝑣𝑒𝑟 𝑟𝑎𝑡𝑖𝑜 =Sales Turnover
Inventory
Debtors Turnover: Accounts receivable turnover is an efficiency ratio or activity ratio that measures how many times a business
can turn its accounts receivable into cash during a period
𝐷𝑒𝑏𝑡𝑜𝑟𝑠 𝑇𝑢𝑟𝑛𝑜𝑣𝑒𝑟 𝑟𝑎𝑡𝑖𝑜 =Sales Turnover
Accounts recievables
Fixed Asset Turnover: The fixed-asset turnover ratio is a financial ratio of net sales to fixed assets
𝐹𝑖𝑥𝑒𝑑 𝐴𝑠𝑠𝑒𝑡 𝑇𝑢𝑟𝑛𝑜𝑣𝑒𝑟 𝑟𝑎𝑡𝑖𝑜 =Sales Turnover
Fixed Assets
Current Asset Turnover: The current-asset turnover ratio is a financial ratio of net sales to fixed assets
𝐶𝑢𝑟𝑟𝑒𝑛𝑡 𝐴𝑠𝑠𝑒𝑡 𝑇𝑢𝑟𝑛𝑜𝑣𝑒𝑟 𝑟𝑎𝑡𝑖𝑜 =Sales Turnover
Current Assets
Operating Profit Margin: Operating margin is a measurement of what proportion of a Company’s revenue is left over after
paying for variable costs of production such as wages, raw materials etc. It can be calculated by dividing a Company’s operating
income (also known as “operating profit”) during a given period by its sales during the same period.
𝑂𝑝𝑒𝑟𝑎𝑡𝑖𝑛𝑔 𝑃𝑟𝑜𝑓𝑖𝑡 𝑀𝑎𝑟𝑔𝑖𝑛 =Operating profit
Sales Turnover
Net Profit Margin: Net profit margin is the percentage of revenue left after all expenses have been deducted from sales
𝑁𝑒𝑡 𝑃𝑟𝑜𝑓𝑖𝑡 𝑀𝑎𝑟𝑔𝑖𝑛 =Net profit
Sales Turnover
Stakeholders’ Education | Corporate Governance Research | Corporate Governance Score | Proxy Advisory
STAKEHOLDERS EMPOWERMENT SERVICES
6 | P A G E
SECTOR: IT - HARDWARE REPORTING DATE: 14TH AUGUST, 2017
MOSER BAER INDIA LTD. www.moserbaer.in
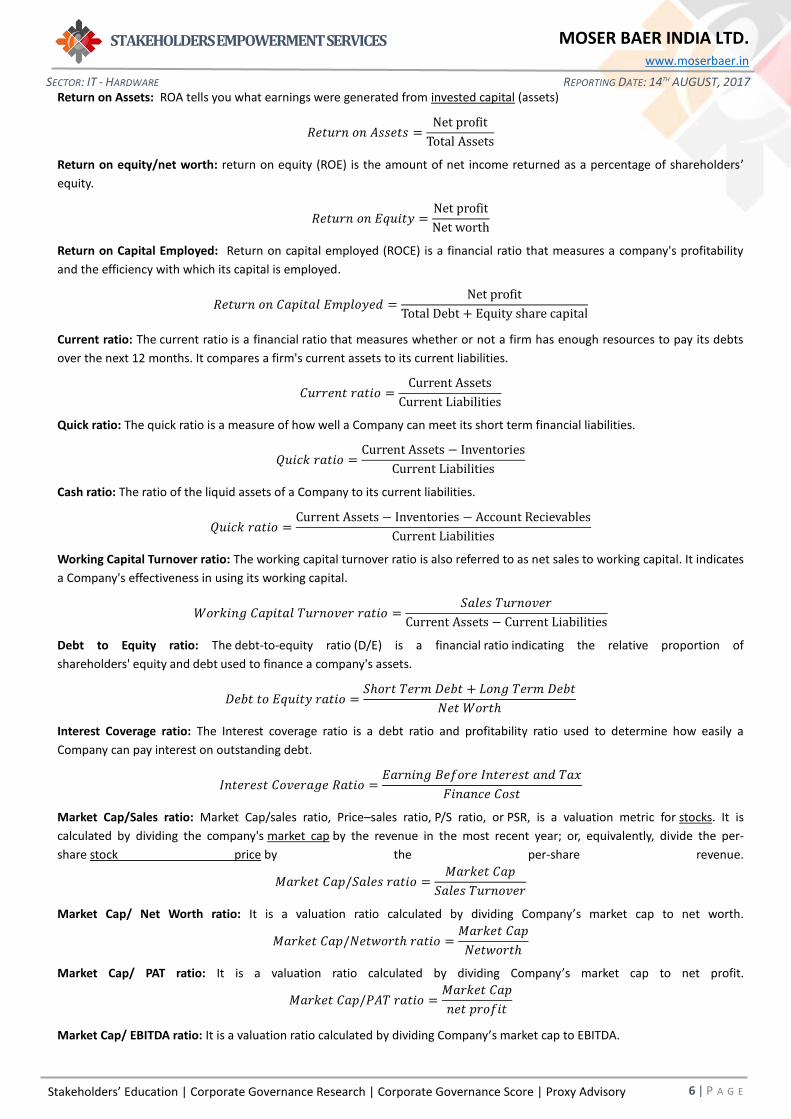
Return on Assets: ROA tells you what earnings were generated from invested capital (assets)
𝑅𝑒𝑡𝑢𝑟𝑛 𝑜𝑛 𝐴𝑠𝑠𝑒𝑡𝑠 =Net profit
Total Assets
Return on equity/net worth: return on equity (ROE) is the amount of net income returned as a percentage of shareholders’
equity.
𝑅𝑒𝑡𝑢𝑟𝑛 𝑜𝑛 𝐸𝑞𝑢𝑖𝑡𝑦 =Net profit
Net worth
Return on Capital Employed: Return on capital employed (ROCE) is a financial ratio that measures a company's profitability
and the efficiency with which its capital is employed.
𝑅𝑒𝑡𝑢𝑟𝑛 𝑜𝑛 𝐶𝑎𝑝𝑖𝑡𝑎𝑙 𝐸𝑚𝑝𝑙𝑜𝑦𝑒𝑑 =Net profit
Total Debt + Equity share capital
Current ratio: The current ratio is a financial ratio that measures whether or not a firm has enough resources to pay its debts
over the next 12 months. It compares a firm's current assets to its current liabilities.
𝐶𝑢𝑟𝑟𝑒𝑛𝑡 𝑟𝑎𝑡𝑖𝑜 =Current Assets
Current Liabilities
Quick ratio: The quick ratio is a measure of how well a Company can meet its short term financial liabilities.
𝑄𝑢𝑖𝑐𝑘 𝑟𝑎𝑡𝑖𝑜 =Current Assets − Inventories
Current Liabilities
Cash ratio: The ratio of the liquid assets of a Company to its current liabilities.
𝑄𝑢𝑖𝑐𝑘 𝑟𝑎𝑡𝑖𝑜 =Current Assets − Inventories − Account Recievables
Current Liabilities
Working Capital Turnover ratio: The working capital turnover ratio is also referred to as net sales to working capital. It indicates
a Company's effectiveness in using its working capital.
𝑊𝑜𝑟𝑘𝑖𝑛𝑔 𝐶𝑎𝑝𝑖𝑡𝑎𝑙 𝑇𝑢𝑟𝑛𝑜𝑣𝑒𝑟 𝑟𝑎𝑡𝑖𝑜 =𝑆𝑎𝑙𝑒𝑠 𝑇𝑢𝑟𝑛𝑜𝑣𝑒𝑟
Current Assets − Current Liabilities
Debt to Equity ratio: The debt-to-equity ratio (D/E) is a financial ratio indicating the relative proportion of
shareholders' equity and debt used to finance a company's assets.
𝐷𝑒𝑏𝑡 𝑡𝑜 𝐸𝑞𝑢𝑖𝑡𝑦 𝑟𝑎𝑡𝑖𝑜 =𝑆ℎ𝑜𝑟𝑡 𝑇𝑒𝑟𝑚 𝐷𝑒𝑏𝑡 + 𝐿𝑜𝑛𝑔 𝑇𝑒𝑟𝑚 𝐷𝑒𝑏𝑡
𝑁𝑒𝑡 𝑊𝑜𝑟𝑡ℎ
Interest Coverage ratio: The Interest coverage ratio is a debt ratio and profitability ratio used to determine how easily a
Company can pay interest on outstanding debt.
𝐼𝑛𝑡𝑒𝑟𝑒𝑠𝑡 𝐶𝑜𝑣𝑒𝑟𝑎𝑔𝑒 𝑅𝑎𝑡𝑖𝑜 =𝐸𝑎𝑟𝑛𝑖𝑛𝑔 𝐵𝑒𝑓𝑜𝑟𝑒 𝐼𝑛𝑡𝑒𝑟𝑒𝑠𝑡 𝑎𝑛𝑑 𝑇𝑎𝑥
𝐹𝑖𝑛𝑎𝑛𝑐𝑒 𝐶𝑜𝑠𝑡
Market Cap/Sales ratio: Market Cap/sales ratio, Price–sales ratio, P/S ratio, or PSR, is a valuation metric for stocks. It is
calculated by dividing the company's market cap by the revenue in the most recent year; or, equivalently, divide the per-
share stock price by the per-share revenue.
𝑀𝑎𝑟𝑘𝑒𝑡 𝐶𝑎𝑝/𝑆𝑎𝑙𝑒𝑠 𝑟𝑎𝑡𝑖𝑜 =𝑀𝑎𝑟𝑘𝑒𝑡 𝐶𝑎𝑝
𝑆𝑎𝑙𝑒𝑠 𝑇𝑢𝑟𝑛𝑜𝑣𝑒𝑟
Market Cap/ Net Worth ratio: It is a valuation ratio calculated by dividing Company’s market cap to net worth.
𝑀𝑎𝑟𝑘𝑒𝑡 𝐶𝑎𝑝/𝑁𝑒𝑡𝑤𝑜𝑟𝑡ℎ 𝑟𝑎𝑡𝑖𝑜 =𝑀𝑎𝑟𝑘𝑒𝑡 𝐶𝑎𝑝
𝑁𝑒𝑡𝑤𝑜𝑟𝑡ℎ
Market Cap/ PAT ratio: It is a valuation ratio calculated by dividing Company’s market cap to net profit.
𝑀𝑎𝑟𝑘𝑒𝑡 𝐶𝑎𝑝/𝑃𝐴𝑇 𝑟𝑎𝑡𝑖𝑜 =𝑀𝑎𝑟𝑘𝑒𝑡 𝐶𝑎𝑝
𝑛𝑒𝑡 𝑝𝑟𝑜𝑓𝑖𝑡
Market Cap/ EBITDA ratio: It is a valuation ratio calculated by dividing Company’s market cap to EBITDA.
Stakeholders’ Education | Corporate Governance Research | Corporate Governance Score | Proxy Advisory
STAKEHOLDERS EMPOWERMENT SERVICES
7 | P A G E
SECTOR: IT - HARDWARE REPORTING DATE: 14TH AUGUST, 2017
MOSER BAER INDIA LTD. www.moserbaer.in
𝑀𝑎𝑟𝑘𝑒𝑡 𝐶𝑎𝑝/𝐸𝐵𝐼𝑇𝐷𝐴 𝑟𝑎𝑡𝑖𝑜 =𝑀𝑎𝑟𝑘𝑒𝑡 𝐶𝑎𝑝
𝐸𝐵𝐼𝑇𝐷𝐴
Trading Volume (shares) (avg. of 1 year): Average number of shares/day traded in 1 year
Trading volume (shares) (high in 1 year): Highest number of shares/day traded in 1 year
Trading volume (shares) (minimum in 1 year): Lowest number of shares traded on any one day in 1 year

Stakeholders’ Education | Corporate Governance Research | Corporate Governance Score | Proxy Advisory
STAKEHOLDERS EMPOWERMENT SERVICES
8 | P A G E
SECTOR: IT - HARDWARE REPORTING DATE: 14TH AUGUST, 2017
MOSER BAER INDIA LTD. www.moserbaer.in
DISCLAIMER
Sources Company Information
Only publicly available data has been used while making the factsheet. Our data sources include: BSE, NSE, SEBI, Capitaline, Moneycontrol, Businessweek, Reuters, Annual Reports, IPO Documents and Company Website.
Analyst Certification
The analysts involved in development of this factsheet certify that no part of any of the research analyst’s compensation was, is, or will be directly or indirectly related to the contents of this factsheet.
Disclaimer
While SES has made every effort and has exercised due skill, care and diligence in compiling this factsheet based on publicly available information, it neither guarantees its accuracy, completeness or usefulness, nor assumes any liability whatsoever for any consequence from its use. This factsheet does not have any approval, express or implied, from any authority, nor is it required to have such approval. The users are strongly advised to exercise due diligence while using this factsheet. This factsheet in no manner constitutes an offer, solicitation or advice to buy or sell securities, nor solicits votes or proxies on behalf of any party. SES, which is a not-for-profit Initiative or its staff, has no financial interest in the companies covered in this factsheet except what is disclosed on its website. The factsheet is released in India and SES has ensured that it is in accordance with Indian laws. Person resident outside India shall ensure that laws in their country are not violated while using this factsheet; SES shall not be responsible for any such violation. All disputes subject to jurisdiction of High Court of Bombay, Mumbai.
SEBI Reg. No. INH000000016
This factsheet or any portion hereof may not be reprinted, sold, reproduced or redistributed without the written consent of Stakeholders Empowerment Services
Contact Information
Stakeholders Empowerment Services
A 202, Muktangan, Upper Govind Nagar,
Malad East, Mumbai – 400 097
Tel +91 22 4022 0322
www.sesgovernance.com
Research Analyst: Waheed Shaikh