Mortgage Markets and Mortgage Backed Securities Finance 119.

Mortgage-Backed Securities and the FinancialCrisis of 2008: a Post Mortem
Juan Ospina1 Harald Uhlig1
1Department of EconomicsUniversity of Chicago
October 2017

Outline

Post Mortem
post mortem: an examination of a dead body todetermine the cause of death.

What we do
Questions:
I What were the losses and returns on non-agency RMBS, inparticular those rated AAA?
I How did the ex-ante rating compare to their ex-postperformance?
I Role of house price boom and bust for RMBS performance?
Approach:
I Create new data set of 143 thousand RMBS bonds.
I Obtain their ratings, their characteristics, their payoff stream.
I Calculate losses, returns.
I Compare to ratings.
I Compare to house price booms and busts, state-by-state.

Data Collection
I We needed to find a source that had some information about theuniverse of securities
I Mortgage Market Statistical Annual
I 2013 Edition had information on all non-agency MBS deals issuedbetween 2006 and 2012
I About 50 pages of tables. 2824 deals.

A sample table from the Stats Annual

Data Collection on Bloomberg
I Searched for the 2824 deals from the Stats Annual
I Searched also for related deals (for example by name offinancial institution) Deal Example
I Once we find a deal, we look back at all deals with similarname. Goal: get the universe of deals. Total: 8615 deals
Old Deal Example
I For each deal, get tranches (securities, bonds) Tranches Example
I Total: 143232 bonds. Principal: 5.7 trillion $.
I Per bond: obtain 93 variables plus losses and cash flowsSecurity
I Challenge: Bloomberg places a limit on how muchinformation can be downloaded per month:
I Max out below 15 thousand securities per month.I We have more than 140 thousand securities
⇒ It took more than a year to collect all the data

Bloomberg Deal Search I
Back

Bloomberg Deal Search II
Back

Bloomberg List of Securities (Tranches)
Back

Bloomberg Security Example
Back

Data specs: ( Distr.:min, max, mean, 25th, 50th,75th )Security Identification Credit RatingCusip ID Current and Original Ratings (5 ag.)Deal Name Other Security CharacteristicsDeal Manager Credit Support at IssuanceIssuer Company Original Principal AmountSecurity Classification Collateral DescriptionDeal Type (eg. CMBS, RMBS) Mortg.Purp.(% Equ. Takeout, Refin.)Collateral Type (Home, Auto, Student) LTV Distr..Collateral Type (ARM vs FRM) Credit Score Distr.Agency Backed (yes, no) Mortgage Size Distr.Agency (Fannie Mae, Freddie Mac) MBS metrics 1: w. av. couponDates MBS metrics 2: w. av. LifeIssue Date MBS metrics 3:w. av. maturityPricing Date Fraction of ARM and FRMMaturity Date Occup. (% own, inv., vac.)Security Description Geographic InformationBond type (e.g. Floater, i Only) Fraction of mortg. in top 5 statesTranche Subordination Description Cash Flow and LossesCoupon Type (e.g. Fixed, Floating) Monthly Interest, Principal Paym.Coupon Frequency (e.g. Monthly) Monthly Outstanding balanceCoupon Index Rate (e.g. 3M-libor) Monthly Losses

What we findSeven facts:
1. The bulk of these securities was rated AAA.
2. AAA securities did ok: on average, their total cumulatedlosses up to 2013 are under six percent. Their rate of returnwas above 2 percent.
3. The subprime AAA-rated RMBS did particularly well.
4. The bulk of the losses were concentrated on a small share ofall securities.
5. Later vintages did worse than earlier vintages, but notsubprime-AAA.
6. Mis-ratings modest for AAA.
7. Controlling for home price bust, a home price boom was goodfor repayments.
Together, these facts call into question the conventional narrative,that improper ratings of RMBS were a major factor in the financialcrisis of 2008.

Fact 1: The bulk of these securities was rated AAA.
MBS Bonds Principal AmountRating No. Pct. ($ Billion) Pct.
AAA 65,590.0 56.8 4,535.1 86.9AA 13,298.0 11.5 297.0 5.7A 13,355.0 11.6 212.3 4.1BBB 13,062.0 11.3 118.4 2.3BB 6,096.0 5.3 40.1 0.8B 3,865.0 3.3 13.6 0.3CCC 66.0 0.1 0.3 0.0CC 22.0 0.0 0.6 0.0C 51.0 0.0 3.3 0.1
Rated 115,405.0 81.2 5,220.5 91.7Not Rated 26,774.0 18.8 472.1 8.3

FICO scores vs Prime, Alt-A, Subprime
Mean FICO Score500 550 600 650 700 750 800 850
Fre
quen
cy
0
0.05
0.1
0.15
0.2
0.25
SubprimeAlt-APrime
Mean Mortgage Loan Size0 1000 2000 3000
Fre
quen
cy
0
0.05
0.1
0.15
0.2
0.25
0.3
SubprimeAlt-APrime
Mean LTV0 20 40 60 80 100
Fre
quen
cy
0
0.1
0.2
0.3
0.4
0.5
0.6
0.7
SubprimeAlt-APrime
Losses on AAA securitiesFact 2: AAA securities did ok: on average, their total cumulated losses up to 2013 areunder six percent. Their rate of return was above 2 percent.Fact 3: The subprime AAA-rated RMBS did particularly well
Time2000 2002 2004 2006 2008 2010 2012 2014
Loss
Rat
e
0
0.01
0.02
0.03
0.04
0.05
0.06
0.07
35.3%
32.9%
31.8%
PrimeAltASubprimeAll AAA

Losses on all RMBS
2000 2002 2004 2006 2008 2010 2012 2014
Loss
0
0.1
0.2
0.3
0.4
0.5
0.6Panel A: Value-Weighted Loss as Fraction of Principal
All RatingsAAAInvestment Grade Ex-AAANon-InvestmentGrade
Time2000 2002 2004 2006 2008 2010 2012 2014
Pro
babi
lity
0
0.2
0.4
0.6
0.8Panel B: Unweighted Probability of Loss
All RatingsAAAInvestment Grade Ex-AAANon-InvestmentGrade

Dollar Amount of Losses in Non-Agency RMBS
All RMBS AAA-rated Inv. Grade Ex-AAA Non-Inv. Grade
Loss
($
billi
on)
0
50
100
150
200
250
300
350

Cash flow example
ExampleDeal JPALT2006-S1SecurityName JPALT2006-S2A7MtgeSecurityID 46627MEX1OriginalRating AAA
Year 2006 2007 2008 2009 2010 2011 2012 2013CouponRate 6.17 6.17 6.17 6.17 6.17 6.17 6.17 6.17InterestPayments 1,421 2,131 2,131 2,108 1,989 1,212 524 61PrincipalPayment - - - 1,247 1,365 1,174 430 96Loss - - - - 4,844 14,039 7,550 3,802Balance 34,547 34,547 34,547 33,300 27,091 11,878 3,898 -
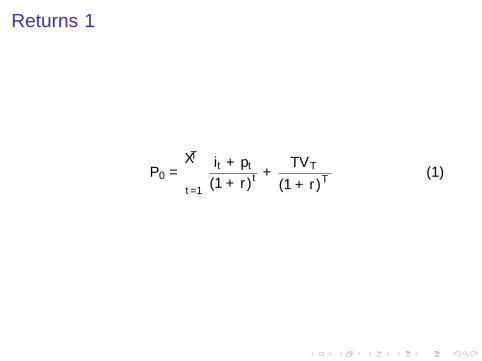
Returns 1
P0 =T∑t=1
it + pt
(1 + r)t+
TVT
(1 + r)T(1)

Returns 2
Return Statistic 80% TV 90% TV 100% TV
By Credit Rating
AAA 2.44 2.89 3.31AA -7.90 -7.01 -6.21A -10.92 -10.10 -9.35BBB -13.56 -12.80 -12.11Inv. Grade Ex AAA -9.01 -8.15 -7.38
By Type of Mortgage
AAA Prime 3.61 3.98 4.33AAA SubPrime 1.61 2.14 2.62AAA AltA 1.37 2.01 2.61

Returns 3
Return Statistic 80% TV 90% TV 100% TV
Fixed Rate MBS
AAA Prime Fixed 4.25 4.56 4.84AAA SubPrime Fixed 4.86 4.96 5.04AAA AltA Fixed 3.64 4.13 4.58
Floating Rate MBS
AAA Prime Floating 3.03 3.45 3.83AAA SubPrime Floating 1.45 1.97 2.44AAA AltA Floating 0.42 1.12 1.76

Fact 4: The bulk of the losses were concentrated on asmall share of all securities.
Loss as a Fraction of Principal0 0.2 0.4 0.6 0.8 1
Fre
quen
cy
0
0.1
0.2
0.3
0.4
0.5
0.6
0.7Panel A: All RMBS
Loss as a Fraction of Principal0 0.2 0.4 0.6 0.8 1
Fra
ctio
n W
ith L
oss
< 5
%
0
1Panel B: By Credit Rating
Fra
ctio
n W
ith L
oss
> 5
%
0
0.5
AAA Loss < 5%IG Ex-AAA Loss < 5%Non-IG Loss < 5%AAAInvestment Grade Ex-AAANon-InvestmentGrade

Fact 5: Later vintages did worse than earlier vintages.
Principal-Weighted Losses in RMBS and Credit Ratings:
Rating Full Sample Before 2003 2003 - 2005 2006-2008
AAA 0.0218*** 0.0002 0.0034*** 0.0483***AA 0.3096*** 0.001 0.1180*** 0.5091***A 0.3620*** 0.0055*** 0.2000*** 0.6572***BBB 0.4480*** 0.0334*** 0.3152*** 0.6655***BB 0.4923*** 0.0653*** 0.4886*** 0.5136***B 0.5812*** 0.0938*** 0.6989*** 0.5619***CCC 0.7360*** 0.4125*** 0.4102*** 0.9465***CC 0.2036*** 0.1364 0.0251 0.2005***C or Below 0.3863*** 0.0661*** 0.6607*** 0.3604***
Observations 93,902 19,230 38,381 36,291R-squared 0.3217 0.0852 0.2972 0.485
Standard errors in parentheses∗p < 0.10, ∗ ∗ p < 0.05, ∗ ∗ ∗p < 0.01

Fact 5: Vintage FE for Weighted Losses increased ...
Year of Issuance2001 2002 2003 2004 2005 2006 2007
Vin
tage
FE
-0.05
0
0.05
0.1
0.15All RMBS
2001 2002 2003 2004 2005 2006 2007
Vin
tage
FE
-0.05
0
0.05
0.1AAA
2001 2002 2003 2004 2005 2006 2007-0.5
0
0.5
1AA
Year of Issuance2001 2002 2003 2004 2005 2006 2007
Vin
tage
FE
-0.5
0
0.5
1
1.5A
Year of Issuance2001 2002 2003 2004 2005 2006 2007
-0.5
0
0.5
1BBB

... though AAA-Subprime did not do worse over time.
Year of Issuance2001 2002 2003 2004 2005 2006 2007
Vin
tage
FE
0
0.05
0.1
0.15
0.2All RMBS
PrimeAlt-ASubprime
2001 2002 2003 2004 2005 2006 2007
Vin
tage
FE
-0.05
0
0.05
0.1
0.15AAA
2001 2002 2003 2004 2005 2006 20070
0.5
1AA
Year of Issuance2001 2002 2003 2004 2005 2006 2007
Vin
tage
FE
0
0.5
1A
Year of Issuance2001 2002 2003 2004 2005 2006 2007
-0.5
0
0.5
1BBB

Fact 6: “Misratings”
Compare actual loss rate
lossratei ,T = Li ,T/Principali ,T
to expected loss rate in table by Moody’s.

Moody’s Table

Ex-Ante vs Ex-Post Rating Based on Moodys Ideal Table
Credit Rating LevelAAA AA A BBB BB B CCC CCC below
Fra
ctio
n of
Sec
uriti
es (
%)
0
10
20
30
40
50
60
70
80
90
Ex-Ante RatingEx-Post Ideal Rating

Ex-Ante vs Ex-Post Rating: Unweighted
Credit Rating LevelAAA AA A BBB BB B CCC CCC below
Fra
ctio
n of
Sec
uriti
es (
%)
0
10
20
30
40
50
60
Ex-Ante RatingEx-Post Ideal Rating

Ex-Ante vs Ex-Post Rating Based on Moodys Ideal Table
Credit Rating LevelAAA AA A BBB BB B CCC CCC below
Fra
ctio
n of
Sec
uriti
es (
%)
0
10
20
30
40
50
60
70
80
90
Correct RatingInflated RatingDeflated Rating

“Misratings”

Fact 7: Loss-Rates and House Price Boom/Busts
I
lossratei ,T = βMAωi ,MA + βILωi ,IL + . . .+ βXXi + εi
where ωi ,MA is the fraction of principal invested in the stateMA, etc.. (with only five of these weights nonzero), andwhere Xi are controls.
I
lossratei ,T = = βboom(ωi ,MA∆boomPMA + ωi ,IL∆boomPIL + ...) +
βbust(ωi ,MA∆bustPMA + ωi ,IL∆bustPIL + ...) + . . .+ εi
where ∆boomPMA is the percent change of house prices duringthe boom, 2000-2006, ∆bustPMA is the percent change duringthe bust 2006-2009, etc..
State-Level Dummies for Loss Rates
with Controls without Controls
0.3 / 1.40.1 / 0.3-0.1 / 0.1-0.3 / -0.1-4.2 / -0.3
0.2 / 0.8-0.1 / 0.2-0.2 / -0.1-0.4 / -0.2-1.1 / -0.4

State-Level House Price Boom and Bust
Boom: 2000-Q1 to 2006-Q4 Bust: 2006-Q4 to 2009-Q4
23.2% / 38%38% / 44.6%44.6% / 72.1%72.1% / 94.1%94.1% / 165.2%
-43.2% / -14.4%-14.4% / -9.6%-9.6% / -2.9%-2.9% / 0.2%0.2% / 9.1%

House Prices and Loss Rates
(1) (2) (3) (4) (5)
∆HP 2000-2006 0.073*** -0.218*** -0.178***(0.003) (0.010) (0.012)
∆HP 2006-2009 -0.203*** -0.63*** -0.532***(0.006) (0.021) (0.020)
Price Reversal -0.238***
Controls No No No No YesObservations 93,902 93,902 93,902 93,902 71,316R-squared 0.0059 0.0107 0.0156 0.0128 0.4345Standard errors in parentheses∗p < 0.10, ∗ ∗ p < 0.05, ∗ ∗ ∗p < 0.01“Price Reversal” = ∆HP 2006-2009/∆HP 2000-2006
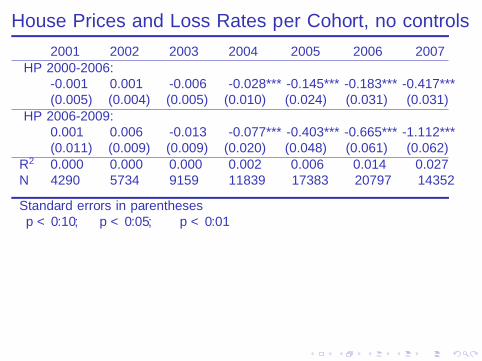
House Prices and Loss Rates per Cohort, no controls
2001 2002 2003 2004 2005 2006 2007∆ HP 2000-2006:
-0.001 0.001 -0.006 -0.028*** -0.145*** -0.183*** -0.417***(0.005) (0.004) (0.005) (0.010) (0.024) (0.031) (0.031)
∆ HP 2006-2009:0.001 0.006 -0.013 -0.077*** -0.403*** -0.665*** -1.112***(0.011) (0.009) (0.009) (0.020) (0.048) (0.061) (0.062)
R2 0.000 0.000 0.000 0.002 0.006 0.014 0.027N 4290 5734 9159 11839 17383 20797 14352
Standard errors in parentheses∗p < 0.10, ∗ ∗ p < 0.05, ∗ ∗ ∗p < 0.01

House Prices and Loss Rates per Cohort, with controls
2001 2002 2003 2004 2005 2006 2007∆ HP 2000-2006
-0.000 -0.009 -0.015*** -0.029** -0.067** -0.151*** -0.392***(0.006) (0.006) (0.006) (0.011) (0.029) (0.021) (0.029)
∆ HP 2006-20090.005 -0.004 -0.019** -0.042** -0.286*** -0.479*** -1.016***(0.011) (0.010) (0.009) (0.018) (0.042) (0.037) (0.051)
AA 0.000 0.003 0.000 0.014*** 0.218*** 0.676*** 0.647***A 0.017*** 0.011*** 0.007*** 0.072*** 0.407*** 0.841*** 0.514***BBB 0.054*** 0.051*** 0.048*** 0.163*** 0.598*** 0.834*** 0.511***BB 0.040*** 0.035*** 0.221*** 0.378*** 0.520*** 0.536*** 0.534***B 0.051*** 0.092*** 0.351*** 0.541*** 0.878*** 0.520*** 0.875***CCC 0.000 0.000 0.154** 0.269*** 0.520*** 0.980* 0.943***CC 0.000 0.000 0.004 0.001 0.051 0.939 0.585***Alt-A -0.002* -0.000 0.002** 0.010*** 0.036*** 0.064*** 0.050***Prime -0.002* -0.001 0.001 0.011*** 0.017*** 0.005 -0.007*R2 0.112 0.125 0.366 0.404 0.456 0.693 0.496N 2445 3128 6252 8321 13047 20394 14076
∗p < 0.10, ∗ ∗ p < 0.05, ∗ ∗ ∗p < 0.01
Prices? Markit ABX-indices for Subprime RMBS ...
Jan-06 Jan-08 Jan-10 Jan-12 Jan-1420
40
60
80
100
120AAA
Jan-06 Jan-08 Jan-10 Jan-12 Jan-140
20
40
60
80
100
120AA
Jan-06 Jan-08 Jan-10 Jan-12 Jan-140
20
40
60
80
100
120A
Jan-06 Jan-08 Jan-10 Jan-12 Jan-140
20
40
60
80
100
120BBB
2006-12006-22007-12007-2
ABX.HE indexes by Markit. Each line represents a vintage of subprime RMBS and the Index. Each panel shows the
evolution of prices over time by credit rating. These indexes are constructed based on 20 deals.

... vs FINRA Survey
2011 2012 2013 2014 2015 2016 2017
Pric
e
85
90
95
100
105Investment Grade
Weighted Mean25th Pctile75th Pctile
2011 2012 2013 2014 2015 2016 201740
50
60
70
80
90
100Non-Investment Grade
2011 2012 2013 2014 2015 2016 2017
Pric
e
80
85
90
95
100
105Investment Grade Pre-2005
2011 2012 2013 2014 2015 2016 201780
85
90
95
100
105Investment Grade 2005-2007
Summary statistics of daily transaction prices collected by the Financial Industry Regulatory Authority from May
2011 through May 2016 on Non-Agency MBS. Top: Investment Grade vs Non-Investment Grade. Bottom:
vintages for Investment Grade. 22-day moving averages, principal weighted average and 25th and 75th percentiles.

ConclusionsSeven facts:
1. The bulk of these securities was rated AAA.
2. AAA securities did ok: on average, their total cumulatedlosses up to 2013 are under six percent. Their rate of returnwas above 2 percent.
3. The subprime AAA-rated RMBS did particularly well.
4. The bulk of the losses were concentrated on a small share ofall securities.
5. Later vintages did worse than earlier vintages, but notsubprime-AAA.
6. Mis-ratings modest for AAA.
7. Controlling for home price bust, a home price boom was goodfor repayments.
Together, these facts call into question the conventional narrative,that improper ratings of RMBS were a major factor in the financialcrisis of 2008.