Mortality in Local Jails and State Prisons, 2000-2013 ... · have been the top two causes of death...
41
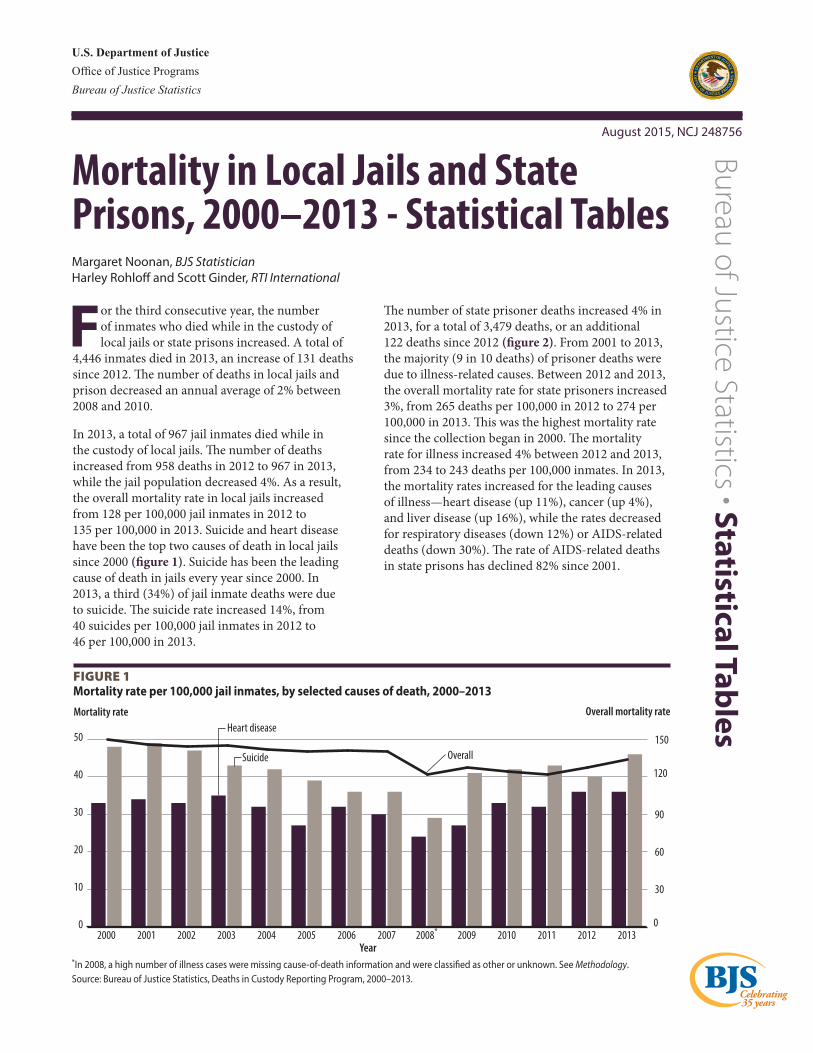
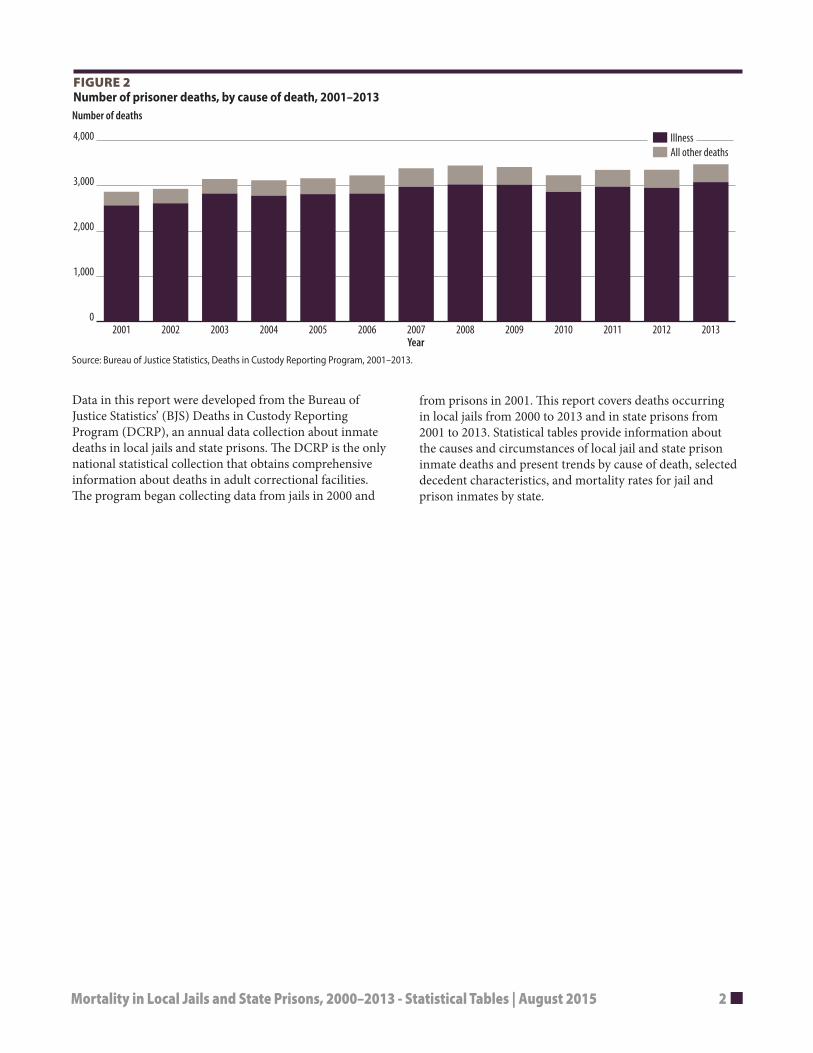
U.S. Department of Justice Office of Justice Programs Bureau of Justice Statistics Bureau of Justice Statistics · Statistical Tables Celebrating 35 years August 2015, NCJ 248756 F or the third consecutive year, the number of inmates who died while in the custody of local jails or state prisons increased. A total of 4,446 inmates died in 2013, an increase of 131 deaths since 2012. e number of deaths in local jails and prison decreased an annual average of 2% between 2008 and 2010. In 2013, a total of 967 jail inmates died while in the custody of local jails. e number of deaths increased from 958 deaths in 2012 to 967 in 2013, while the jail population decreased 4%. As a result, the overall mortality rate in local jails increased from 128 per 100,000 jail inmates in 2012 to 135 per 100,000 in 2013. Suicide and heart disease have been the top two causes of death in local jails since 2000 (figure 1). Suicide has been the leading cause of death in jails every year since 2000. In 2013, a third (34%) of jail inmate deaths were due to suicide. e suicide rate increased 14%, from 40 suicides per 100,000 jail inmates in 2012 to 46 per 100,000 in 2013. e number of state prisoner deaths increased 4% in 2013, for a total of 3,479 deaths, or an additional 122 deaths since 2012 (figure 2). From 2001 to 2013, the majority (9 in 10 deaths) of prisoner deaths were due to illness-related causes. Between 2012 and 2013, the overall mortality rate for state prisoners increased 3%, from 265 deaths per 100,000 in 2012 to 274 per 100,000 in 2013. is was the highest mortality rate since the collection began in 2000. e mortality rate for illness increased 4% between 2012 and 2013, from 234 to 243 deaths per 100,000 inmates. In 2013, the mortality rates increased for the leading causes of illness—heart disease (up 11%), cancer (up 4%), and liver disease (up 16%), while the rates decreased for respiratory diseases (down 12%) or AIDS-related deaths (down 30%). e rate of AIDS-related deaths in state prisons has declined 82% since 2001. FIGURE 1 Mortality rate per 100,000 jail inmates, by selected causes of death, 2000–2013 * In 2008, a high number of illness cases were missing cause-of-death information and were classified as other or unknown. See Methodology. Source: Bureau of Justice Statistics, Deaths in Custody Reporting Program, 2000–2013. 0 10 20 30 40 50 Suicide Heart disease 2013 2012 2011 2010 2009 2008 * 2007 2006 2005 2004 2003 2002 2001 2000 Mortality rate 0 30 60 90 120 150 Overall mortality rate Overall Year Mortality in Local Jails and State Prisons, 2000–2013 - Statistical Tables Margaret Noonan, BJS Statistician Harley Rohloff and Scott Ginder, RTI International
Transcript of Mortality in Local Jails and State Prisons, 2000-2013 ... · have been the top two causes of death...
U.S. Department of Justice Office of Justice Programs Bureau of Justice Statistics
Bureau of Justice Statistics · Statistical Tables
Celebrating 35 years
August 2015, NCJ 248756
For the third consecutive year, the number of inmates who died while in the custody of local jails or state prisons increased. A total of
4,446 inmates died in 2013, an increase of 131 deaths since 2012. The number of deaths in local jails and prison decreased an annual average of 2% between 2008 and 2010.
In 2013, a total of 967 jail inmates died while in the custody of local jails. The number of deaths increased from 958 deaths in 2012 to 967 in 2013, while the jail population decreased 4%. As a result, the overall mortality rate in local jails increased from 128 per 100,000 jail inmates in 2012 to 135 per 100,000 in 2013. Suicide and heart disease have been the top two causes of death in local jails since 2000 (figure 1). Suicide has been the leading cause of death in jails every year since 2000. In 2013, a third (34%) of jail inmate deaths were due to suicide. The suicide rate increased 14%, from 40 suicides per 100,000 jail inmates in 2012 to 46 per 100,000 in 2013.
The number of state prisoner deaths increased 4% in 2013, for a total of 3,479 deaths, or an additional 122 deaths since 2012 (figure 2). From 2001 to 2013, the majority (9 in 10 deaths) of prisoner deaths were due to illness-related causes. Between 2012 and 2013, the overall mortality rate for state prisoners increased 3%, from 265 deaths per 100,000 in 2012 to 274 per 100,000 in 2013. This was the highest mortality rate since the collection began in 2000. The mortality rate for illness increased 4% between 2012 and 2013, from 234 to 243 deaths per 100,000 inmates. In 2013, the mortality rates increased for the leading causes of illness—heart disease (up 11%), cancer (up 4%), and liver disease (up 16%), while the rates decreased for respiratory diseases (down 12%) or AIDS-related deaths (down 30%). The rate of AIDS-related deaths in state prisons has declined 82% since 2001.
Figure 1Mortality rate per 100,000 jail inmates, by selected causes of death, 2000–2013
*In 2008, a high number of illness cases were missing cause-of-death information and were classified as other or unknown. See Methodology.Source: Bureau of Justice Statistics, Deaths in Custody Reporting Program, 2000–2013.
0
10
20
30
40
50
Suicide
Heart disease
201320122011201020092008*20072006200520042003200220012000
Mortality rate
0
30
60
90
120
150
Overall mortality rate
Overall
Year
Mortality in Local Jails and State Prisons, 2000–2013 - Statistical TablesMargaret Noonan, BJS Statistician Harley Rohloff and Scott Ginder, RTI International
Mortality in Local Jails and State Prisons, 2000–2013 - Statistical Tables | August 2015 2
Data in this report were developed from the Bureau of Justice Statistics’ (BJS) Deaths in Custody Reporting Program (DCRP), an annual data collection about inmate deaths in local jails and state prisons. The DCRP is the only national statistical collection that obtains comprehensive information about deaths in adult correctional facilities. The program began collecting data from jails in 2000 and
from prisons in 2001. This report covers deaths occurring in local jails from 2000 to 2013 and in state prisons from 2001 to 2013. Statistical tables provide information about the causes and circumstances of local jail and state prison inmate deaths and present trends by cause of death, selected decedent characteristics, and mortality rates for jail and prison inmates by state.
Figure 2Number of prisoner deaths, by cause of death, 2001–2013
Source: Bureau of Justice Statistics, Deaths in Custody Reporting Program, 2001–2013.
0
1,000
2,000
3,000
4,000All other deathsIllness
2013201220112010200920082007200620052004200320022001
Number of deaths
Year
Mortality in Local Jails and State Prisons, 2000–2013 - Statistical Tables | August 2015 3
Mortality in local jailsCause of death
�� Local jail inmate deaths increased 1%, from 958 deaths in 2012 to 967 deaths in 2013 (table 1).
�� Suicides in local jails increased 9%, from 300 suicides in 2012 to 327 in 2013.
�� Jail inmate deaths due to liver disease decreased 35%, from 29 deaths in 2012 to 19 in 2013.
�� Drug or alcohol intoxication deaths in local jails increased 23%, from 57 deaths in 2012 to 70 in 2013.
�� Illness-related deaths accounted for 50% of all inmate deaths in local jails in 2013. Heart disease continued to be the leading cause of illness-related inmate deaths in local jails in 2013 (table 2).
�� Suicide was the leading cause of death in local jails in 2013 (34% of all jail deaths) and has been the leading cause of death in local jails each year since 2000.
�� The suicide rate increased from 40 suicides per 100,000 local jail inmates in 2012 to 46 suicides per 100,000 local jail inmates in 2013 (table 3).
Decedent characteristics
�� In 2013, a total of 843 male and 124 female inmates died in local jails (table 4).
�� The typical jail inmate who died in 2013 was male (87%), white (54%), age 35 or older (70%), and in custody for fewer than 7 days (40%) (table 5).
�� The mortality rate for Hispanics was 135 per 100,000 local jail inmates in 2013. Due to changes in measurement, this rate should not be compared to rates in previous years (table 6). (See Methodology.)
Cause of death and demographics
�� More than half (60%) of all suicides in jails from 2000 to 2013 involved inmates who were age 25 to 44 (table 7).
�� From 2000 to 2013, the number of male jail inmate deaths (12,092) was nearly 8 times the number of female inmate deaths (1,630).
�� From 2000 to 2013, the average annual mortality rate for male (137 per 100,000) and female (133 per 100,000) jail inmates were nearly equal (table 8).
�� The mortality rate for suicide among male jail inmates (43) was 1.5 times the rate for female inmates (28) from 2000 to 2013.
�� The mortality rate for drug or alcohol intoxication for black non-Hispanic (5 per 100,000) and Hispanic (6 per 100,000) jail inmates was nearly equal from 2000 to 2013, but was nearly three times higher for white non-Hispanic jail inmates (16 per 100,000).
Facility characteristics
�� Most jails (80%) reported no deaths in 2013. Twice as many jails reported a single death (12%) as those reporting multiple deaths (6%) (table 9).
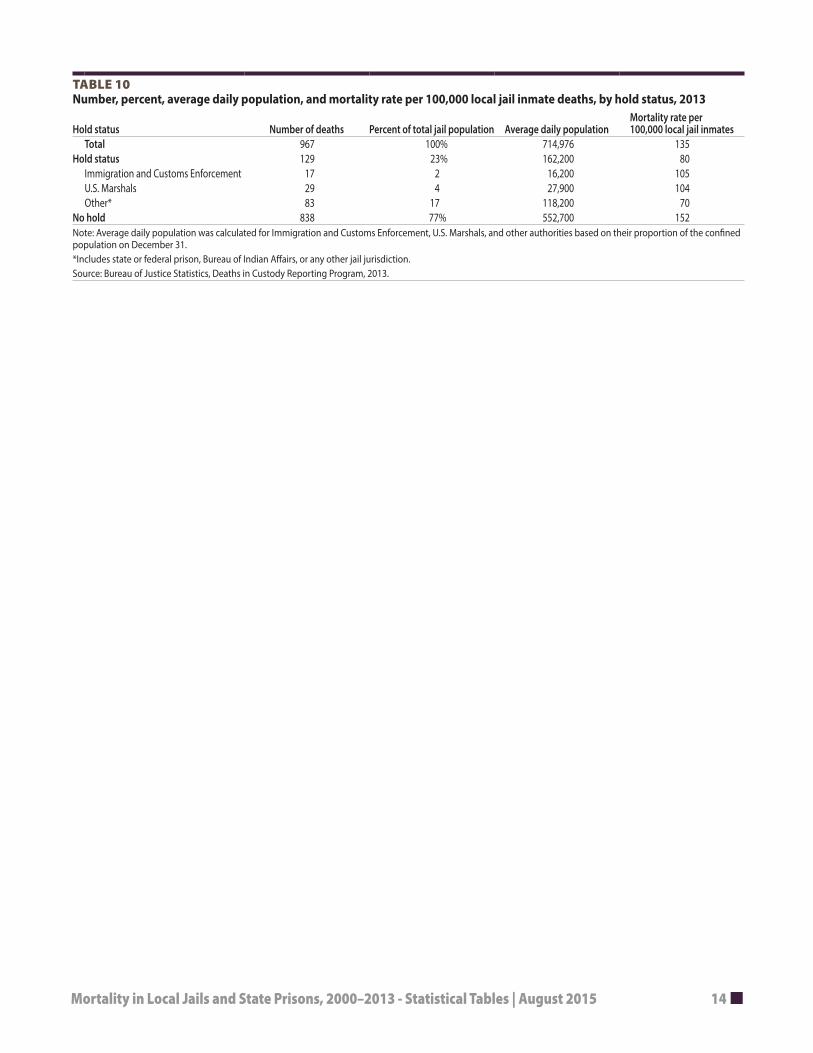
�� In 2013, approximately a quarter (23%) of the average daily jail population was a hold for another jurisdiction (table 10).
�� The mortality rate for jail inmates held for another correctional authority (80 per 100,000) was lower than the rate for other jail inmates (152 per 100,000).
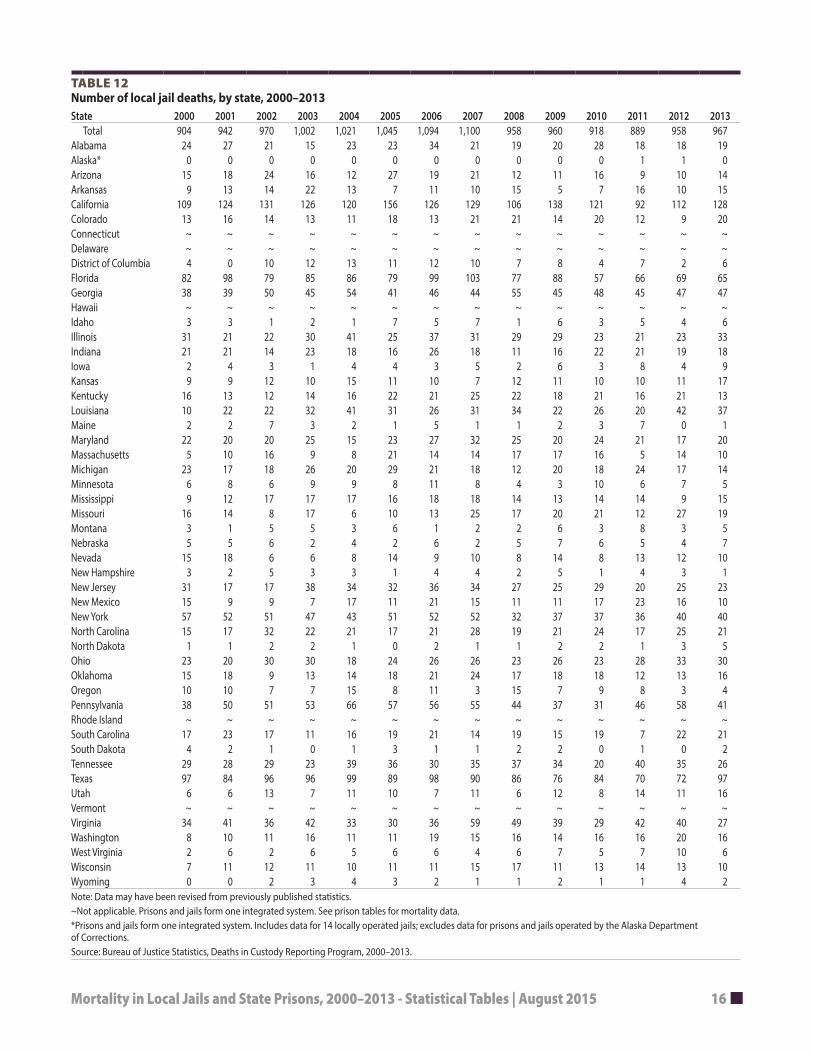
�� In 2013, 23% of all jail inmate deaths occurred in California and Texas (table 12).
�� The median state-level jail death rate was 140 deaths per 100,000 local jail inmates in 2013 (table 13).
Rates by cause and decedent characteristics
�� The mortality rates for illness among females were higher than the rates for males from 2004 to 2012 (appendix table 2).
�� The mortality rates for heart disease among males were higher than the rates for females every year from 2010 to 2013 (appendix table 3).
�� From 2009 to 2013, the suicide rate increased 23% from 35 per 100,000 jail inmates to 43 per 100,000 (appendix table 4).
Mortality in Local Jails and State Prisons, 2000–2013 - Statistical Tables | August 2015 4
Mortality in state prisonsCause of death
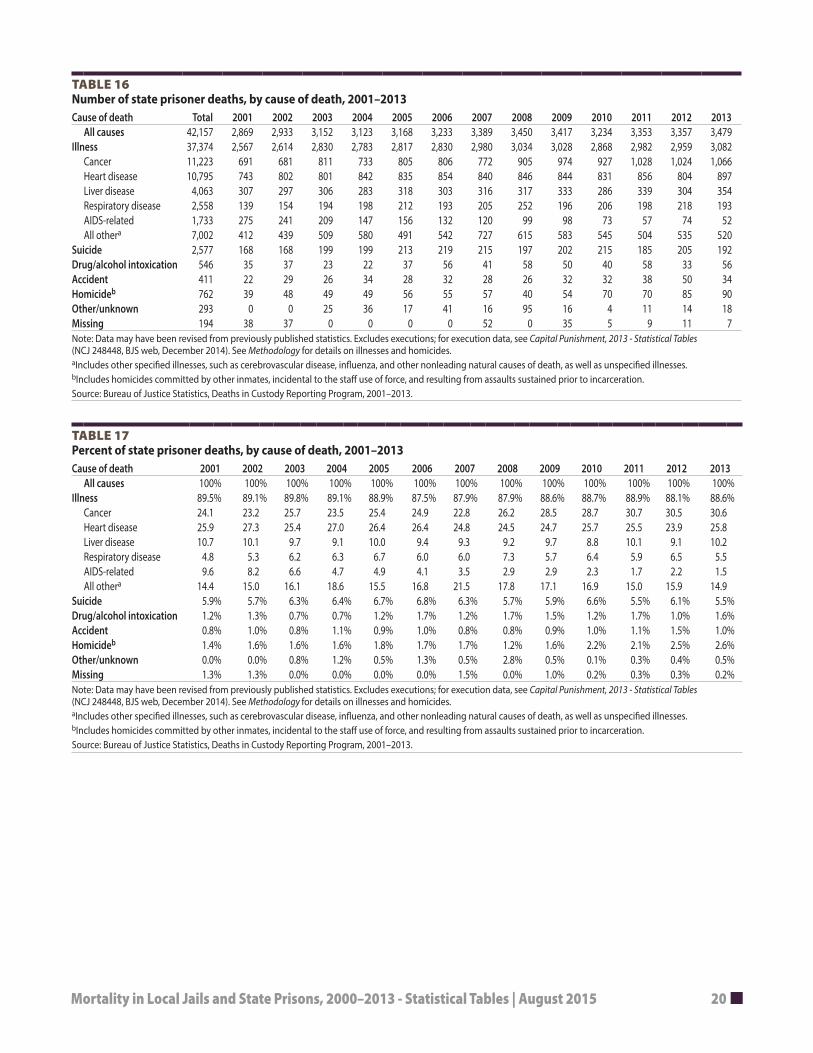
�� Deaths in prison increased from 3,357 in 2012 to 3,479 in 2013, reaching the highest number since the prison data collection began in 2001. The total number of deaths increased 4% between 2012 and 2013 (table 16).
�� Illness-related deaths accounted for 89% of all deaths in prison in 2013.
�� Deaths from liver disease increased 16%, from 304 deaths in 2012 to 354 deaths in 2013. This was the largest percent change observed among illness deaths in prison in 2013.
�� Cancer (31%) and heart disease (26%) accounted for more than half of all prisoner deaths (table 17).
�� The mortality rate increased 3%, from 265 deaths per 100,000 state prisoners in 2012 to 274 per 100,000 in 2013. Although there were some fluctuations in the rates for unnatural deaths (e.g., accidents increased while suicides declined), the change in the rate for illness (up 4%) accounted for the increase in the overall rate (table 18).
Decedent characteristics
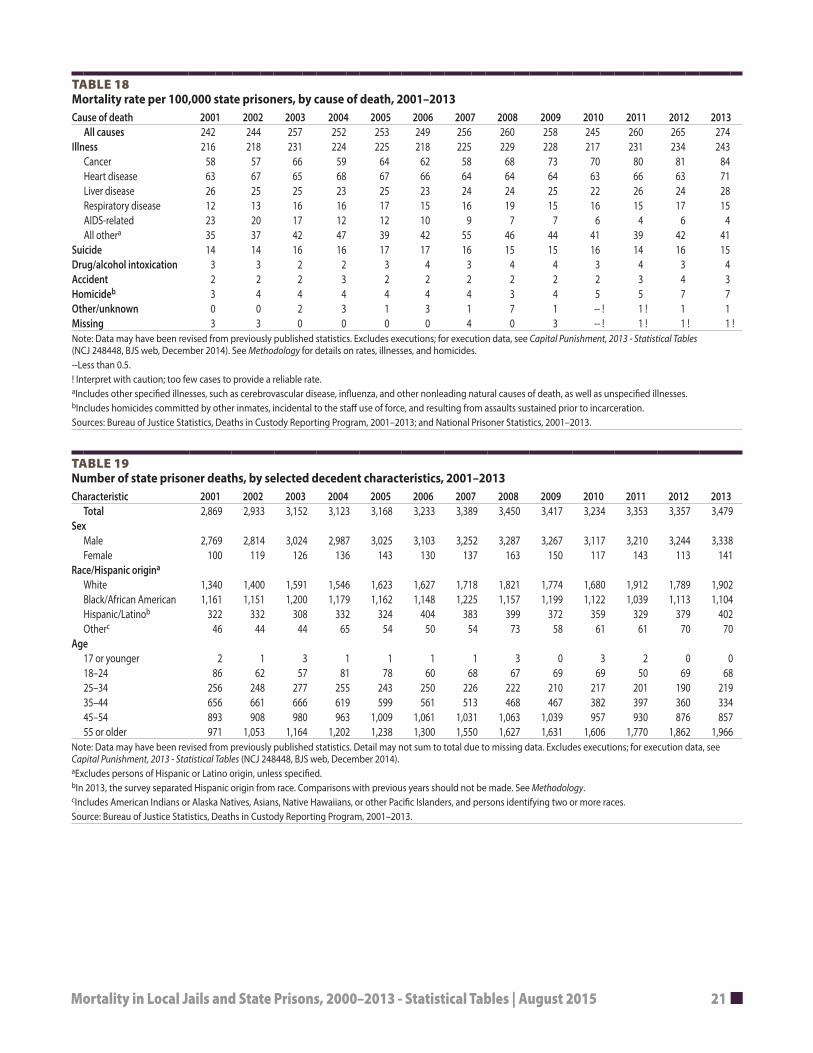
�� The 1,966 prisoners age 55 or older made up more than half (57%) of all deaths in state prisons in 2013 (table 19).
�� In state prisons, the percentage of decedents age 55 or older increased by an average of 8% annually since 2001 (table 20).
�� White inmates accounted for more than half (55%) of deaths in state prisons, and nearly all (96%) were male (table 21).
�� In 2013, an estimated 117,805 (9%) of state prisoners were age 55 or older, up from 47,900 (4%) in 2001.
�� Combined, deaths due to suicide, drug or alcohol intoxication, accidents, and homicide accounted for fewer than 200 female prisoner deaths between 2001 and 2013 (table 23).
�� A third of homicides in state prisons involved prisoners age 45 or older between 2001 and 2013.
�� From 2001 to 2013, male prisoners were twice as likely as female prisoners to die of cancer, heart disease, and liver disease, which were the leading causes of death in state prisons (table 24).
�� Regardless of race or Hispanic origin, there was little variation in the average annual homicide rate (4 to 6 homicides per 100,000 state prisoners) for state prisoners between 2001 and 2013.
�� From 2001 to 2013, prisoners age 55 or older were 3 to 9 times more likely to die of an accident than younger prisoners.
Deaths by jurisdiction
�� Every state department of corrections reported at least one prisoner death in 2013 (table 25).
�� The prisoner death rate by state varied from 115 deaths per 100,000 to 628 deaths per 100,000 prisoners. The median state-level death rate among prisoners was 273 deaths per 100,000 state prisoners (table 26).
Cause of death by state
�� California’s 4,790 prisoner deaths from 2001 to 2013 represent more than 11% of the total deaths (42,157). During this period, almost a third of all state prisoner deaths from drug or alcohol intoxication were in California (174 of 546 deaths) (table 27).
�� Overall mortality rates and mortality rates by state and by cause of death may not be directly compared between states due to differences in age, sex, race or Hispanic origin, and other decedent characteristics (table 28).
Rates by cause and decedent characteristics
�� The illness mortality rate increased to 269 per 100,000 prisoners in 2013, up from 262 per 100,000 in 2012 (appendix table 6).
�� The prisoner cancer mortality rate has increased every year between 2008 and 2013 (appendix table 7).
�� The prisoner heart disease mortality rate was relatively stable between 2003 and 2013, fluctuating between 64 and 67 deaths per 100,000 prisoner deaths each year (appendix table 8).
Mortality in Local Jails and State Prisons, 2000–2013 - Statistical Tables | August 2015 5
List of tablesTABLe 1 Number of local jail inmate deaths, by cause of death, 2000–2013 � � � � � � � � � � � � � � � � � � � � � � � � � � � � � � � � � � � � � � � � � � � � �7
TABLe 2 Percent of local jail inmate deaths, by cause of death, 2000–2013 � � � � � � � � � � � � � � � � � � � � � � � � � � � � � � � � � � � � � � � � � � � � �7
TABLe 3 Mortality rate per 100,000 local jail inmates, by cause of death, 2000–2013 � � � � � � � � � � � � � � � � � � � � � � � � � � � � � � � � � � � � � �8
TABLe 4 Number of local jail inmate deaths, by selected decedent characteristics, 2000–2013 � � � � � � � � � � � � � � � � � � � � � � � � � � � � � �9
TABLe 5 Percent of local jail inmate deaths, by selected decedent characteristics, 2000–2013 � � � � � � � � � � � � � � � � � � � � � � � � � � � � 10
TABLe 6 Mortality rate per 100,000 local jail inmates, by selected decedent characteristics, 2000–2013 � � � � � � � � � � � � � � � � � � 11
TABLe 7Number of local jail inmate deaths, by cause of death and selected decedent characteristics, 2000–2013 � � � � � � � � � � 12
TABLe 8Average annual mortality rate per 100,000 local jail inmates, by cause of death and selected decedent characteristics, 2000–2013 � � � � � � � � � � � � � � � � � � � � � � � � � � � � 13
TABLe 9Number and percent of local jail jurisdictions reporting to the Deaths in Custody Program, by number of deaths reported each year, 2000–2013 � � � � � � � � � � � � � � � � � � � � � � � � 13
TABLe 10Number, percent, average daily population, and mortality rate per 100,000 local jail inmate deaths, by hold status, 2013 � � � � � � � � � � � � � � � � � � � � � � � � � � � � � � � � � � � � � � � � � � � � � � � � � 14
TABLe 11Number of local jail inmates held on an average day, by state, 2000–2013 � � � � � � � � � � � � � � � � � � � � � � � � � � � � � � � � � � � � � 15
TABLe 12Number of local jail deaths, by state, 2000–2013 � � � � � � � � 16
TABLe 13Mortality rate per 100,000 local jail inmates, by state, 2000–2013 � � � � � � � � � � � � � � � � � � � � � � � � � � � � � � � � � � � � � � � � � � � 17
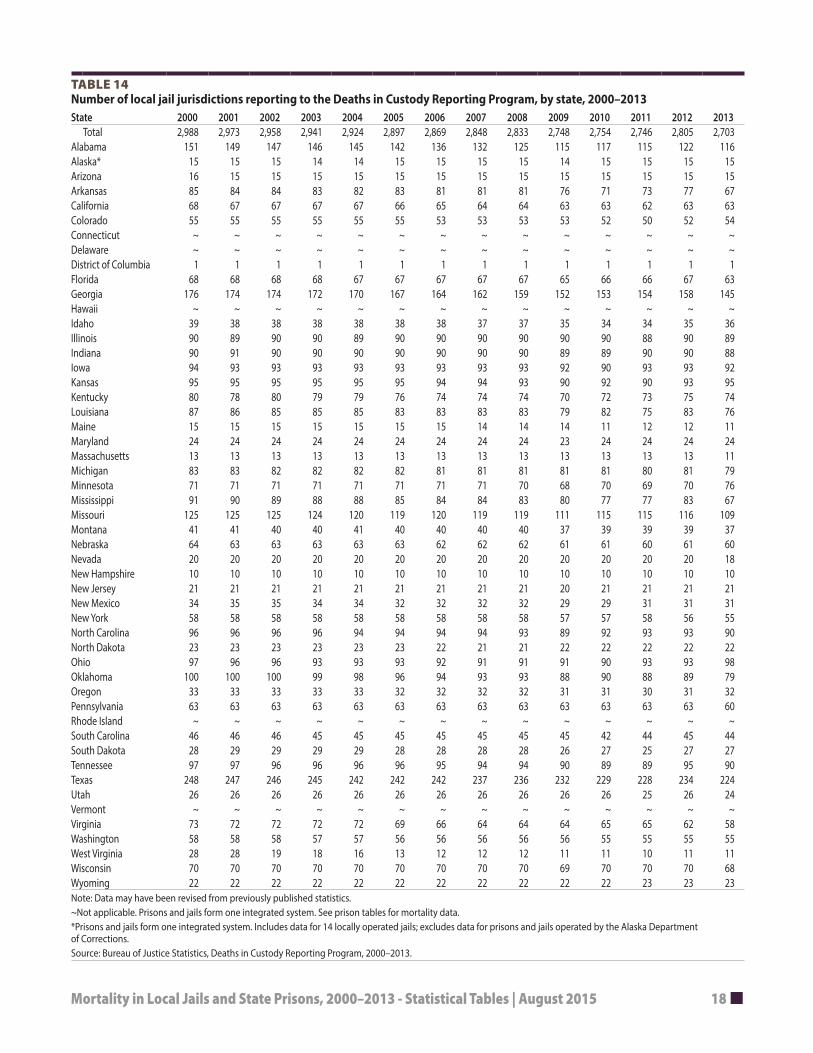
TABLe 14Number of local jail jurisdictions reporting to the Deaths in Custody Reporting Program, by state, 2000–2013 � � � � � � 18
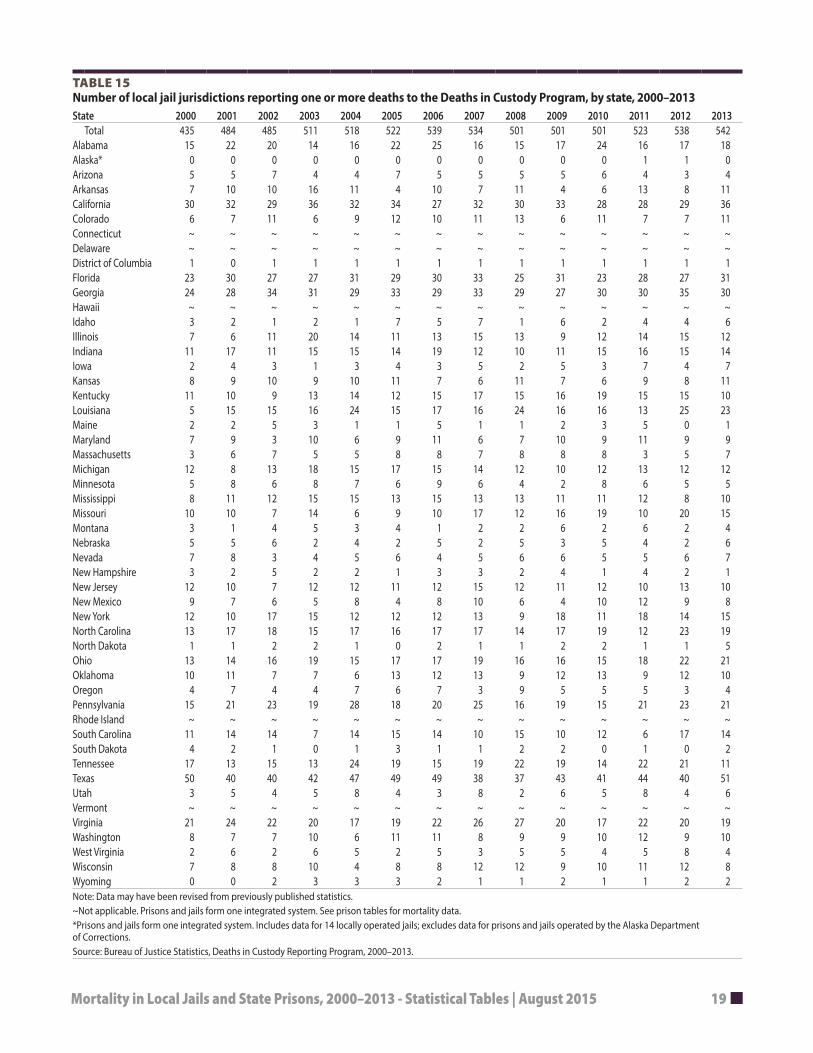
TABLe 15Number of local jail jurisdictions reporting one or more deaths to the Deaths in Custody Program, by state, 2000–2013 � � � � � � � � � � � � � � � � � � � � � � � � � � � � � � � � � � � � � � � � � � � � � � � � � � � � 19
TABLe 16 Number of state prisoner deaths, by cause of death, 2001–2013 � � � � � � � � � � � � � � � � � � � � � � � � � � � � � � � � � � � � � � � � � � � 20
TABLe 17 Percent of state prisoner deaths, by cause of death, 2001–2013 � � � � � � � � � � � � � � � � � � � � � � � � � � � � � � � � � � � � � � � � � � � 20
TABLe 18 Mortality rate per 100,000 state prisoners, by cause of death, 2001–2013 � � � � � � � � � � � � � � � � � � � � � � � � � � � � � � � � � � � � 21
TABLe 19 Number of state prisoner deaths, by selected decedent characteristics, 2001–2013 � � � � � � � � � � � � � � � � � � � � � � � � � � � � 21
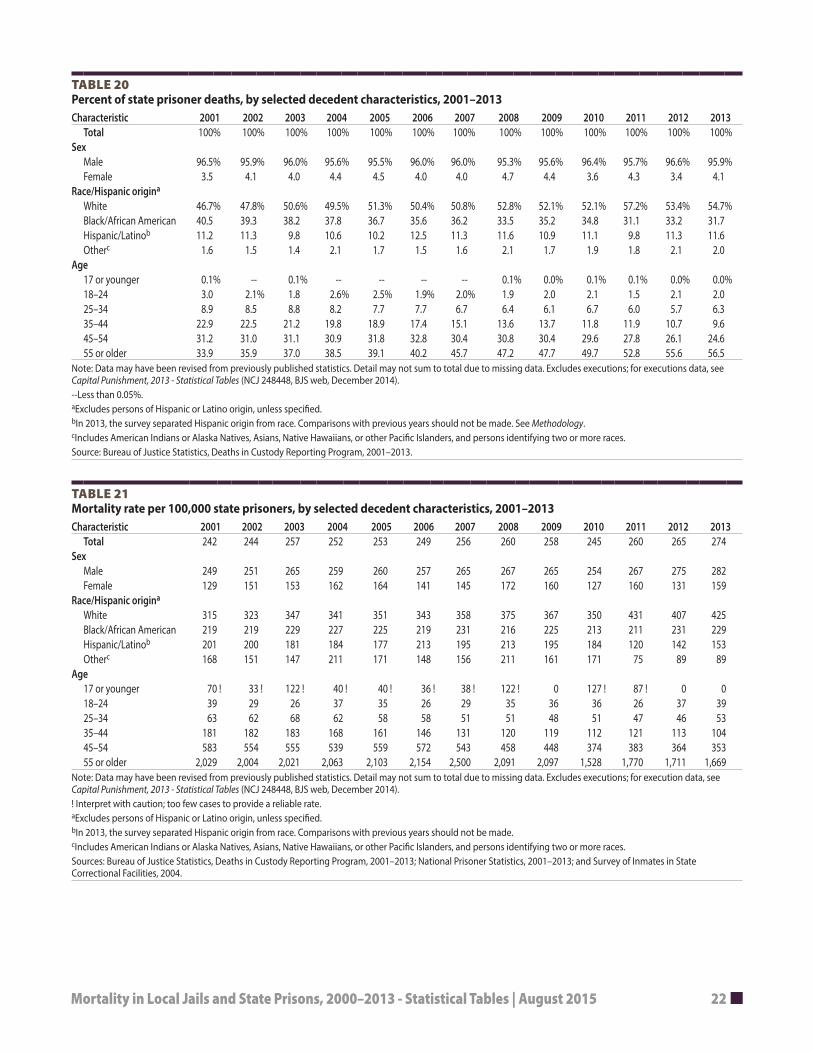
TABLe 20 Percent of state prisoner deaths, by selected decedent characteristics, 2001–2013 � � � � � � � � � � � � � � � � � � � � � � � � � � � � 22
TABLe 21Mortality rate per 100,000 state prisoners, by selected decedent characteristics, 2001–2013 � � � � � � � � � � � � � � � � � � 22
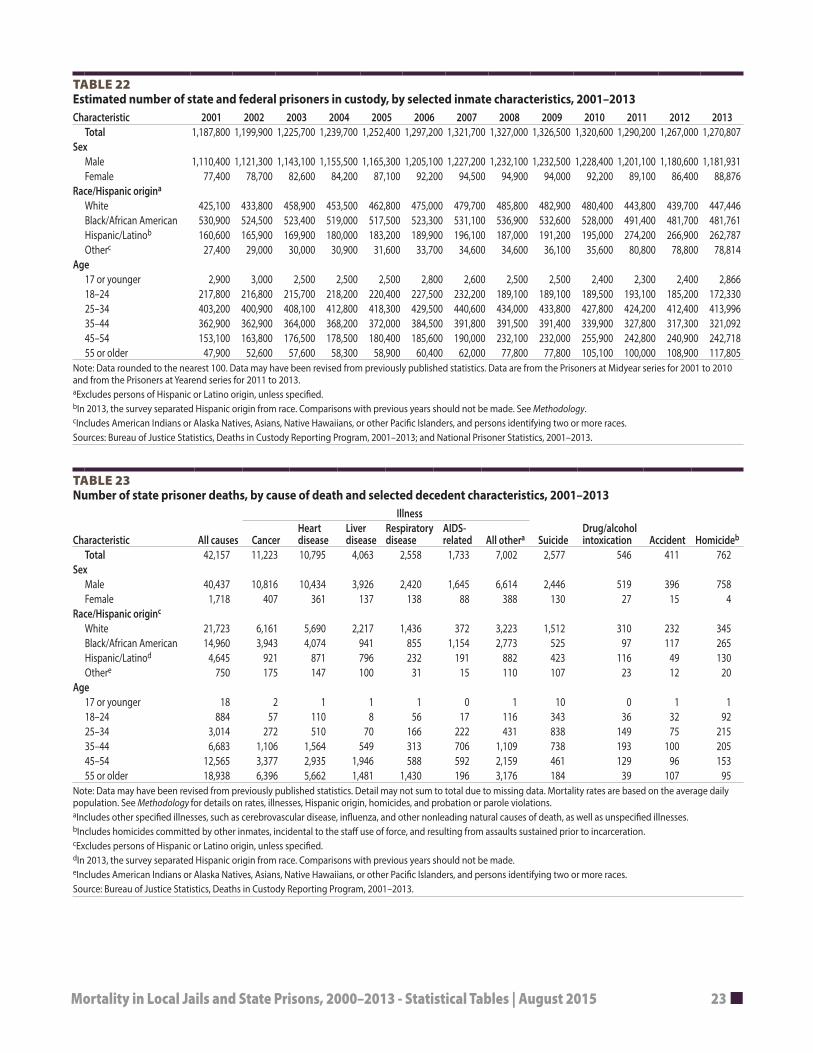
TABLe 22Estimated number of state and federal prisoners in custody, by selected inmate characteristics, 2001–2013 � 23
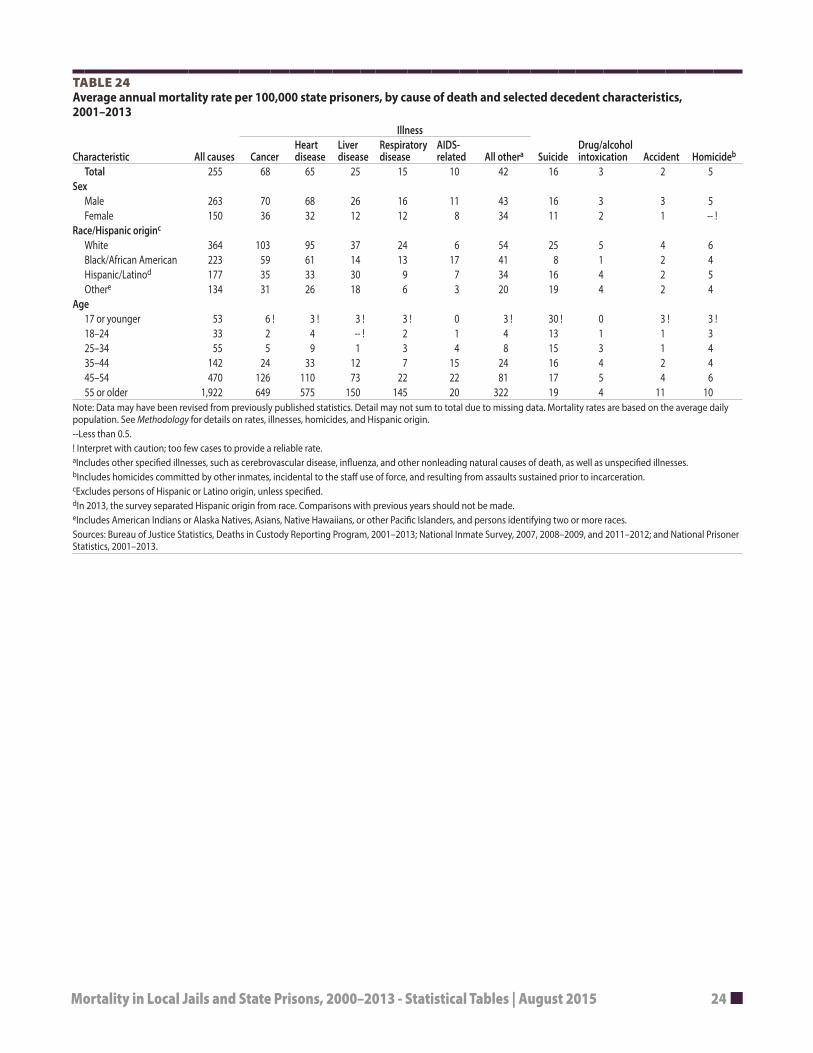
TABLe 23 Number of state prisoner deaths, by cause of death and selected decedent characteristics, 2001–2013 � � � � � � � � � � 23
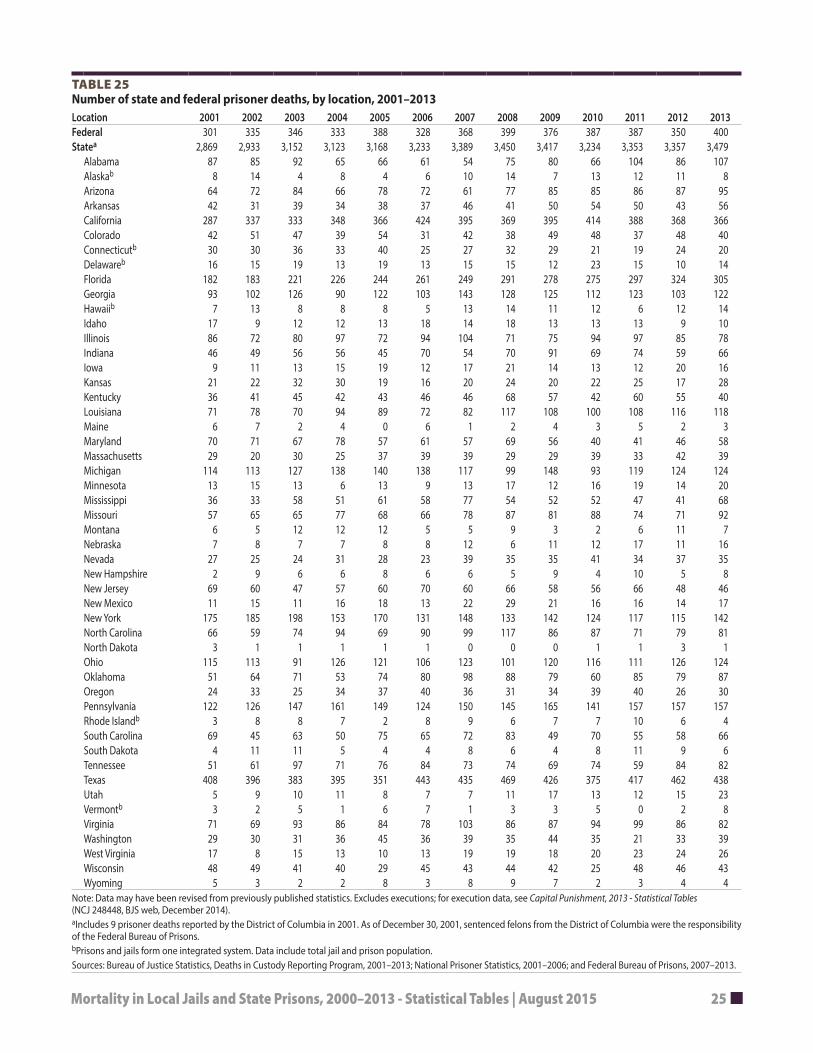
TABLe 24 Average annual mortality rate per 100,000 state prisoners, by cause of death and selected decedent characteristics, 2001–2013 � � � � � � � � � � � � � � � � � � � � � � � � � � � � � � � � � � � � � � � � � � � 24
TABLe 25 Number of state and federal prisoner deaths, by location, 2001–2013 � � � � � � � � � � � � � � � � � � � � � � � � � � � � � � � � � � � � � � � � � � � 25
TABLe 26 Mortality rate per 100,000 state and federal prisoners, by location, 2001–2013 � � � � � � � � � � � � � � � � � � � � � � � � � � � � � � � � � � 26
TABLe 27 Number of state and federal prisoner deaths, by cause of death and location, 2001–2013 � � � � � � � � � � � � � � � � � � � � � � � � 27
TABLe 28 Average annual mortality rate per 100,000 state and federal prisoners, by cause of death and location, 2001–2013 � � � � � � � � � � � � � � � � � � � � � � � � � � � � � � � � � � � � � � � � � � � � � � � � � 28

Mortality in Local Jails and State Prisons, 2000–2013 - Statistical Tables | August 2015 6
List of appendix tablesAPPeNDiX TABLe 1Estimated number of local jail inmates in custody on an average day, by selected inmate characteristics, 2000–2013� � � � � � � � � � � � � � � � � � � � � � � � � � � � � � � � � � � � � � � � � � � � � � � � � � � � � � �34
APPeNDiX TABLe 2 Illness mortality rate per 100,000 local jail inmates, by selected decedent characteristics, 2001–2013 � � � � � � � � � � �35
APPeNDiX TABLe 3 Heart disease mortality rate per 100,000 local jail inmates, by selected decendent characteristics, 2001–2013 � � � � � � �35
APPeNDiX TABLe 4 Suicide mortality rate per 100,000 local jail inmates, by selected decedent characteristics, 2001–2013 � � � � � � � � � � �36
APPeNDiX TABLe 5 Mortality rate for all other unnatural deaths per 100,000 local jail inmates, by selected decedent characteristics, 2000–2013 � � � � � � � � � � � � � � � � � � � � � � � � � � � � � � � � � � � � � � � � � � � �36
APPeNDiX TABLe 6 Illness mortality rate per 100,000 state prisoners, by selected decedent characteristics, 2002–2013 � � � � � � � � � � �37
APPeNDiX TABLe 7 Cancer mortality rate per 100,000 state prisoners, by selected decedent characteristics, 2002–2013 � � � � � � � � � � �37
APPeNDiX TABLe 8 Heart disease mortality rate per 100,000 state prisoners, by selected decedent characteristics, 2002–2013 � � � � � � � � � � �38
APPeNDiX TABLe 9 Liver disease mortality rate per 100,000 state prisoners, by selected decedent characteristics, 2002–2013 � � � � � � � � � � �38
APPeNDiX TABLe 10 Respiratory disease mortality rate per 100,000 state prisoners, by selected decedent characteristics, 2002–2013� � � � � � � � � � � � � � � � � � � � � � � � � � � � � � � � � � � � � � � � � � � � � � � � � � � � � � �39
APPeNDiX TABLe 11 Mortality rate for all other illnesses per 100,000 state prisoners, by selected decedent characteristics, 2002–2013� � � � � � � � � � � � � � � � � � � � � � � � � � � � � � � � � � � � � � � � � � � � � � � � � � � � � � �39
APPeNDiX TABLe 12 Mortality rate for unnatural deaths per 100,000 state prisoners, by selected decedent characteristics, 2002–2013� � � � � � � � � � � � � � � � � � � � � � � � � � � � � � � � � � � � � � � � � � � � � � � � � � � � � � �40
Mortality in Local Jails and State Prisons, 2000–2013 - Statistical Tables | August 2015 7
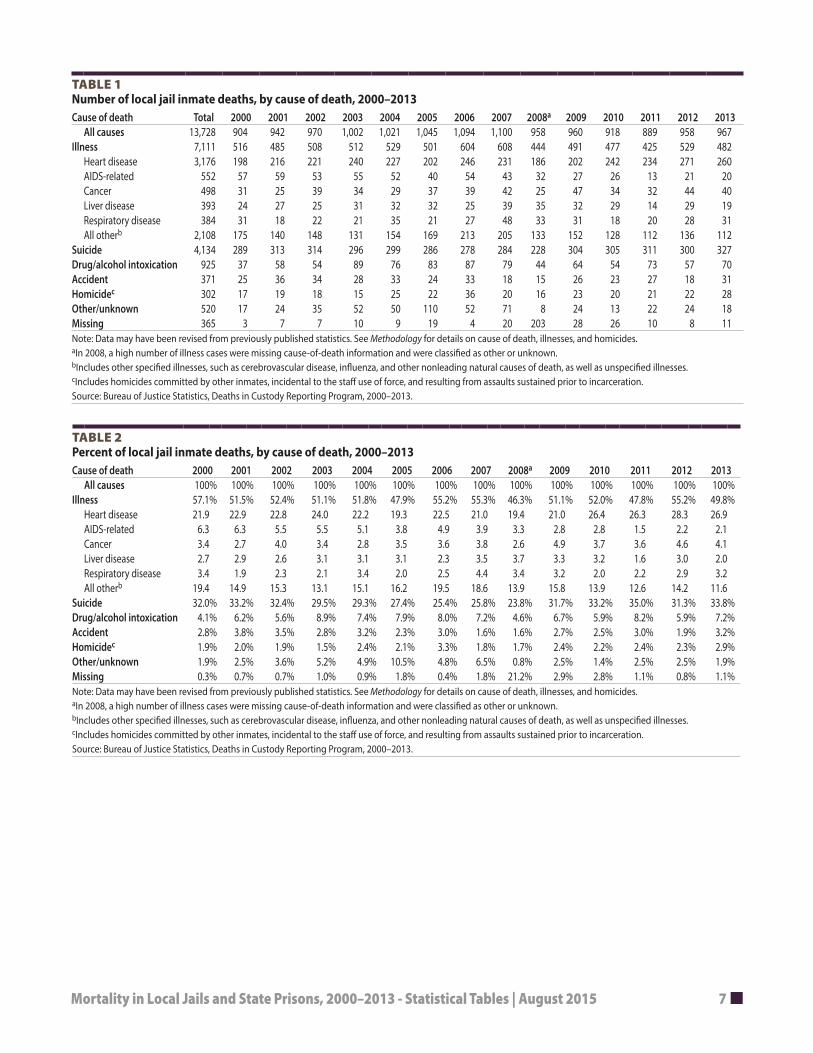
TABLe 1 Number of local jail inmate deaths, by cause of death, 2000–2013Cause of death Total 2000 2001 2002 2003 2004 2005 2006 2007 2008a 2009 2010 2011 2012 2013
All causes 13,728 904 942 970 1,002 1,021 1,045 1,094 1,100 958 960 918 889 958 967Illness 7,111 516 485 508 512 529 501 604 608 444 491 477 425 529 482
Heart disease 3,176 198 216 221 240 227 202 246 231 186 202 242 234 271 260AIDS-related 552 57 59 53 55 52 40 54 43 32 27 26 13 21 20Cancer 498 31 25 39 34 29 37 39 42 25 47 34 32 44 40Liver disease 393 24 27 25 31 32 32 25 39 35 32 29 14 29 19Respiratory disease 384 31 18 22 21 35 21 27 48 33 31 18 20 28 31All otherb 2,108 175 140 148 131 154 169 213 205 133 152 128 112 136 112
Suicide 4,134 289 313 314 296 299 286 278 284 228 304 305 311 300 327Drug/alcohol intoxication 925 37 58 54 89 76 83 87 79 44 64 54 73 57 70Accident 371 25 36 34 28 33 24 33 18 15 26 23 27 18 31Homicidec 302 17 19 18 15 25 22 36 20 16 23 20 21 22 28Other/unknown 520 17 24 35 52 50 110 52 71 8 24 13 22 24 18Missing 365 3 7 7 10 9 19 4 20 203 28 26 10 8 11Note: Data may have been revised from previously published statistics. See Methodology for details on cause of death, illnesses, and homicides.aIn 2008, a high number of illness cases were missing cause-of-death information and were classified as other or unknown.bIncludes other specified illnesses, such as cerebrovascular disease, influenza, and other nonleading natural causes of death, as well as unspecified illnesses. cIncludes homicides committed by other inmates, incidental to the staff use of force, and resulting from assaults sustained prior to incarceration.Source: Bureau of Justice Statistics, Deaths in Custody Reporting Program, 2000–2013.
TABLe 2 Percent of local jail inmate deaths, by cause of death, 2000–2013Cause of death 2000 2001 2002 2003 2004 2005 2006 2007 2008a 2009 2010 2011 2012 2013
All causes 100% 100% 100% 100% 100% 100% 100% 100% 100% 100% 100% 100% 100% 100%Illness 57.1% 51.5% 52.4% 51.1% 51.8% 47.9% 55.2% 55.3% 46.3% 51.1% 52.0% 47.8% 55.2% 49.8%
Heart disease 21.9 22.9 22.8 24.0 22.2 19.3 22.5 21.0 19.4 21.0 26.4 26.3 28.3 26.9AIDS-related 6.3 6.3 5.5 5.5 5.1 3.8 4.9 3.9 3.3 2.8 2.8 1.5 2.2 2.1Cancer 3.4 2.7 4.0 3.4 2.8 3.5 3.6 3.8 2.6 4.9 3.7 3.6 4.6 4.1Liver disease 2.7 2.9 2.6 3.1 3.1 3.1 2.3 3.5 3.7 3.3 3.2 1.6 3.0 2.0Respiratory disease 3.4 1.9 2.3 2.1 3.4 2.0 2.5 4.4 3.4 3.2 2.0 2.2 2.9 3.2All otherb 19.4 14.9 15.3 13.1 15.1 16.2 19.5 18.6 13.9 15.8 13.9 12.6 14.2 11.6
Suicide 32.0% 33.2% 32.4% 29.5% 29.3% 27.4% 25.4% 25.8% 23.8% 31.7% 33.2% 35.0% 31.3% 33.8%Drug/alcohol intoxication 4.1% 6.2% 5.6% 8.9% 7.4% 7.9% 8.0% 7.2% 4.6% 6.7% 5.9% 8.2% 5.9% 7.2%Accident 2.8% 3.8% 3.5% 2.8% 3.2% 2.3% 3.0% 1.6% 1.6% 2.7% 2.5% 3.0% 1.9% 3.2%Homicidec 1.9% 2.0% 1.9% 1.5% 2.4% 2.1% 3.3% 1.8% 1.7% 2.4% 2.2% 2.4% 2.3% 2.9%Other/unknown 1.9% 2.5% 3.6% 5.2% 4.9% 10.5% 4.8% 6.5% 0.8% 2.5% 1.4% 2.5% 2.5% 1.9%Missing 0.3% 0.7% 0.7% 1.0% 0.9% 1.8% 0.4% 1.8% 21.2% 2.9% 2.8% 1.1% 0.8% 1.1%Note: Data may have been revised from previously published statistics. See Methodology for details on cause of death, illnesses, and homicides. aIn 2008, a high number of illness cases were missing cause-of-death information and were classified as other or unknown.bIncludes other specified illnesses, such as cerebrovascular disease, influenza, and other nonleading natural causes of death, as well as unspecified illnesses.cIncludes homicides committed by other inmates, incidental to the staff use of force, and resulting from assaults sustained prior to incarceration.Source: Bureau of Justice Statistics, Deaths in Custody Reporting Program, 2000–2013.
Mortality in Local Jails and State Prisons, 2000–2013 - Statistical Tables | August 2015 8
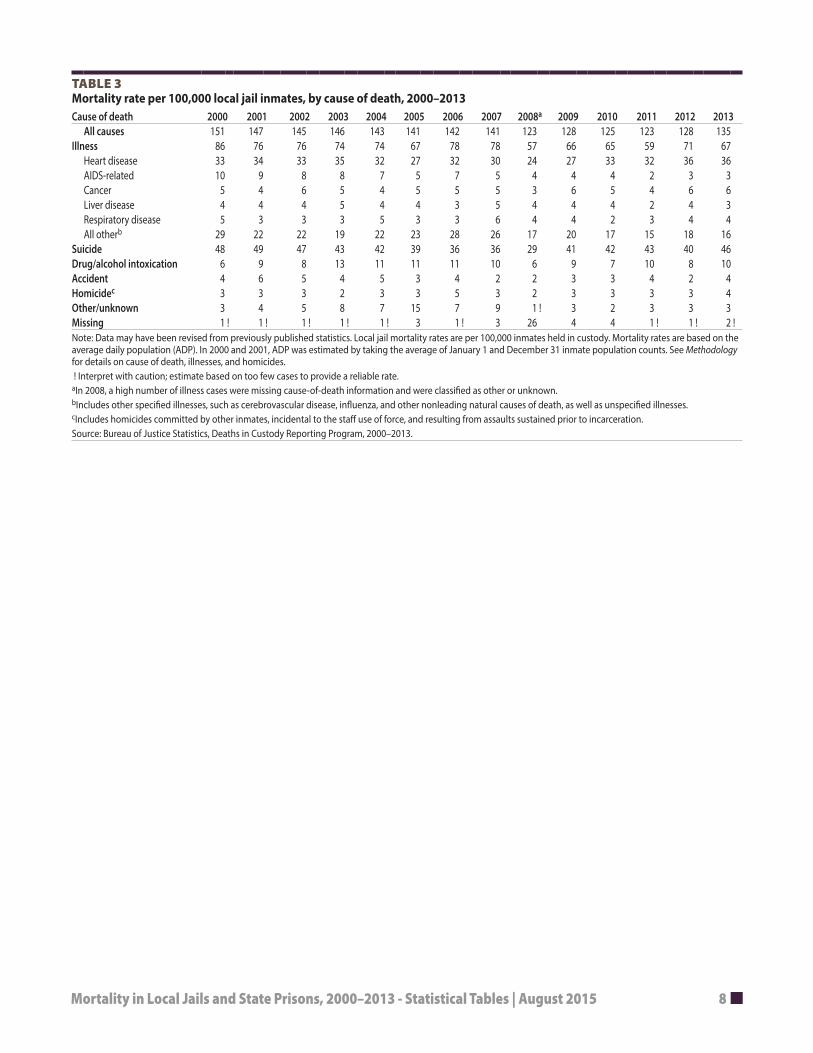
TABLe 3 Mortality rate per 100,000 local jail inmates, by cause of death, 2000–2013Cause of death 2000 2001 2002 2003 2004 2005 2006 2007 2008a 2009 2010 2011 2012 2013
All causes 151 147 145 146 143 141 142 141 123 128 125 123 128 135Illness 86 76 76 74 74 67 78 78 57 66 65 59 71 67
Heart disease 33 34 33 35 32 27 32 30 24 27 33 32 36 36AIDS-related 10 9 8 8 7 5 7 5 4 4 4 2 3 3Cancer 5 4 6 5 4 5 5 5 3 6 5 4 6 6Liver disease 4 4 4 5 4 4 3 5 4 4 4 2 4 3Respiratory disease 5 3 3 3 5 3 3 6 4 4 2 3 4 4All otherb 29 22 22 19 22 23 28 26 17 20 17 15 18 16
Suicide 48 49 47 43 42 39 36 36 29 41 42 43 40 46Drug/alcohol intoxication 6 9 8 13 11 11 11 10 6 9 7 10 8 10Accident 4 6 5 4 5 3 4 2 2 3 3 4 2 4Homicidec 3 3 3 2 3 3 5 3 2 3 3 3 3 4Other/unknown 3 4 5 8 7 15 7 9 1 ! 3 2 3 3 3Missing 1 ! 1 ! 1 ! 1 ! 1 ! 3 1 ! 3 26 4 4 1 ! 1 ! 2 !Note: Data may have been revised from previously published statistics. Local jail mortality rates are per 100,000 inmates held in custody. Mortality rates are based on the average daily population (ADP). In 2000 and 2001, ADP was estimated by taking the average of January 1 and December 31 inmate population counts. See Methodology for details on cause of death, illnesses, and homicides. ! Interpret with caution; estimate based on too few cases to provide a reliable rate.aIn 2008, a high number of illness cases were missing cause-of-death information and were classified as other or unknown.bIncludes other specified illnesses, such as cerebrovascular disease, influenza, and other nonleading natural causes of death, as well as unspecified illnesses. cIncludes homicides committed by other inmates, incidental to the staff use of force, and resulting from assaults sustained prior to incarceration. Source: Bureau of Justice Statistics, Deaths in Custody Reporting Program, 2000–2013.
Mortality in Local Jails and State Prisons, 2000–2013 - Statistical Tables | August 2015 9
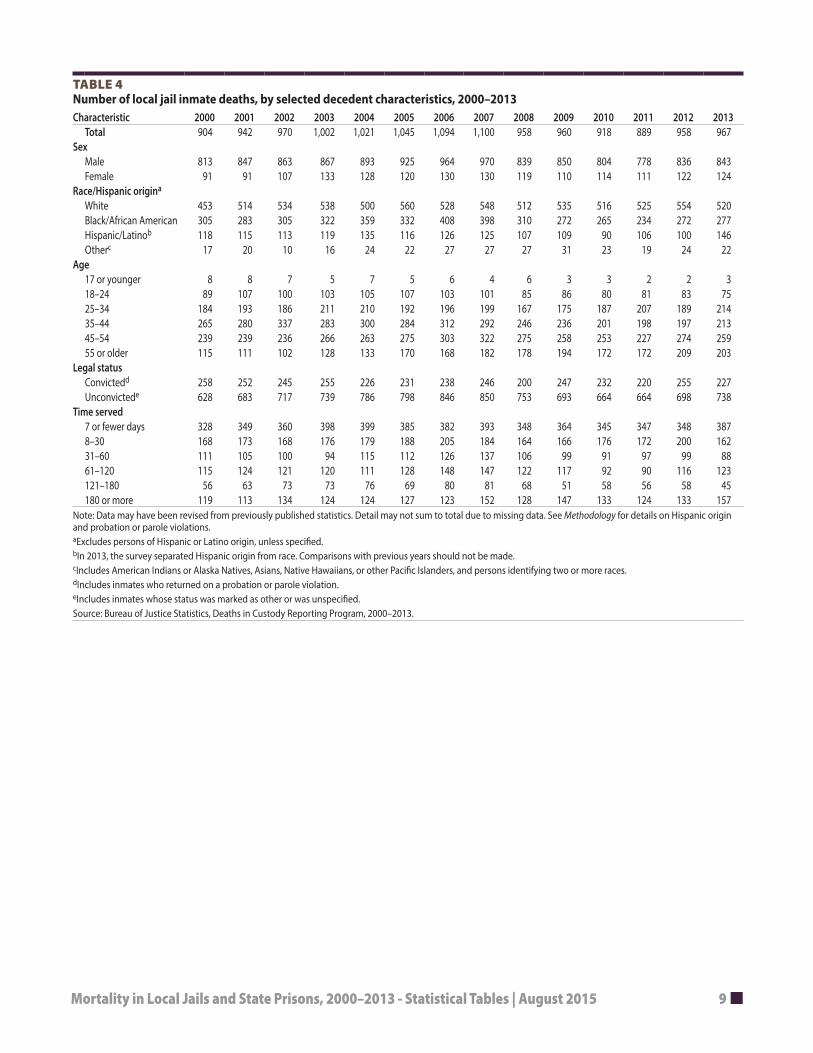
TABLe 4 Number of local jail inmate deaths, by selected decedent characteristics, 2000–2013Characteristic 2000 2001 2002 2003 2004 2005 2006 2007 2008 2009 2010 2011 2012 2013
Total 904 942 970 1,002 1,021 1,045 1,094 1,100 958 960 918 889 958 967Sex
Male 813 847 863 867 893 925 964 970 839 850 804 778 836 843Female 91 91 107 133 128 120 130 130 119 110 114 111 122 124
Race/Hispanic origina
White 453 514 534 538 500 560 528 548 512 535 516 525 554 520Black/African American 305 283 305 322 359 332 408 398 310 272 265 234 272 277Hispanic/Latinob 118 115 113 119 135 116 126 125 107 109 90 106 100 146Otherc 17 20 10 16 24 22 27 27 27 31 23 19 24 22
Age17 or younger 8 8 7 5 7 5 6 4 6 3 3 2 2 318–24 89 107 100 103 105 107 103 101 85 86 80 81 83 7525–34 184 193 186 211 210 192 196 199 167 175 187 207 189 21435–44 265 280 337 283 300 284 312 292 246 236 201 198 197 21345–54 239 239 236 266 263 275 303 322 275 258 253 227 274 25955 or older 115 111 102 128 133 170 168 182 178 194 172 172 209 203
Legal statusConvictedd 258 252 245 255 226 231 238 246 200 247 232 220 255 227Unconvictede 628 683 717 739 786 798 846 850 753 693 664 664 698 738
Time served7 or fewer days 328 349 360 398 399 385 382 393 348 364 345 347 348 3878–30 168 173 168 176 179 188 205 184 164 166 176 172 200 16231–60 111 105 100 94 115 112 126 137 106 99 91 97 99 8861–120 115 124 121 120 111 128 148 147 122 117 92 90 116 123121–180 56 63 73 73 76 69 80 81 68 51 58 56 58 45180 or more 119 113 134 124 124 127 123 152 128 147 133 124 133 157
Note: Data may have been revised from previously published statistics. Detail may not sum to total due to missing data. See Methodology for details on Hispanic origin and probation or parole violations.aExcludes persons of Hispanic or Latino origin, unless specified.bIn 2013, the survey separated Hispanic origin from race. Comparisons with previous years should not be made.cIncludes American Indians or Alaska Natives, Asians, Native Hawaiians, or other Pacific Islanders, and persons identifying two or more races.dIncludes inmates who returned on a probation or parole violation. eIncludes inmates whose status was marked as other or was unspecified.Source: Bureau of Justice Statistics, Deaths in Custody Reporting Program, 2000–2013.
Mortality in Local Jails and State Prisons, 2000–2013 - Statistical Tables | August 2015 10
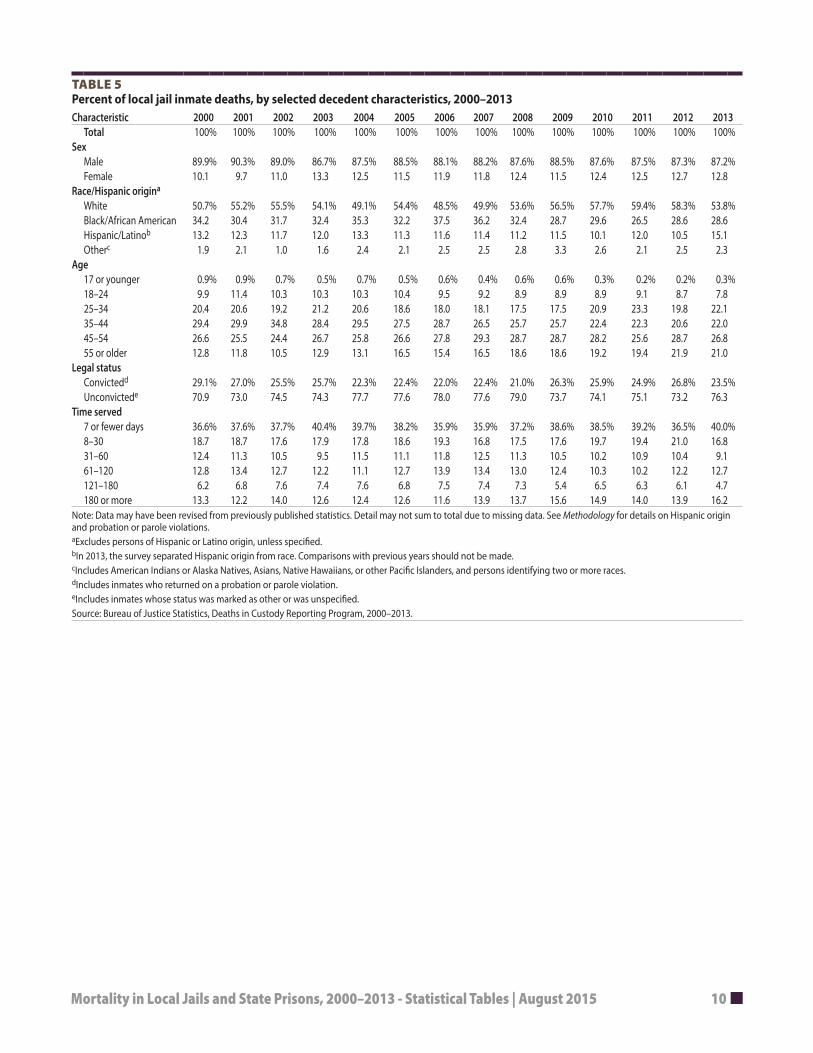
TABLe 5 Percent of local jail inmate deaths, by selected decedent characteristics, 2000–2013Characteristic 2000 2001 2002 2003 2004 2005 2006 2007 2008 2009 2010 2011 2012 2013
Total 100% 100% 100% 100% 100% 100% 100% 100% 100% 100% 100% 100% 100% 100%Sex
Male 89.9% 90.3% 89.0% 86.7% 87.5% 88.5% 88.1% 88.2% 87.6% 88.5% 87.6% 87.5% 87.3% 87.2%Female 10.1 9.7 11.0 13.3 12.5 11.5 11.9 11.8 12.4 11.5 12.4 12.5 12.7 12.8
Race/Hispanic origina
White 50.7% 55.2% 55.5% 54.1% 49.1% 54.4% 48.5% 49.9% 53.6% 56.5% 57.7% 59.4% 58.3% 53.8%Black/African American 34.2 30.4 31.7 32.4 35.3 32.2 37.5 36.2 32.4 28.7 29.6 26.5 28.6 28.6Hispanic/Latinob 13.2 12.3 11.7 12.0 13.3 11.3 11.6 11.4 11.2 11.5 10.1 12.0 10.5 15.1Otherc 1.9 2.1 1.0 1.6 2.4 2.1 2.5 2.5 2.8 3.3 2.6 2.1 2.5 2.3
Age17 or younger 0.9% 0.9% 0.7% 0.5% 0.7% 0.5% 0.6% 0.4% 0.6% 0.6% 0.3% 0.2% 0.2% 0.3%18–24 9.9 11.4 10.3 10.3 10.3 10.4 9.5 9.2 8.9 8.9 8.9 9.1 8.7 7.825–34 20.4 20.6 19.2 21.2 20.6 18.6 18.0 18.1 17.5 17.5 20.9 23.3 19.8 22.135–44 29.4 29.9 34.8 28.4 29.5 27.5 28.7 26.5 25.7 25.7 22.4 22.3 20.6 22.045–54 26.6 25.5 24.4 26.7 25.8 26.6 27.8 29.3 28.7 28.7 28.2 25.6 28.7 26.855 or older 12.8 11.8 10.5 12.9 13.1 16.5 15.4 16.5 18.6 18.6 19.2 19.4 21.9 21.0
Legal statusConvictedd 29.1% 27.0% 25.5% 25.7% 22.3% 22.4% 22.0% 22.4% 21.0% 26.3% 25.9% 24.9% 26.8% 23.5%Unconvictede 70.9 73.0 74.5 74.3 77.7 77.6 78.0 77.6 79.0 73.7 74.1 75.1 73.2 76.3
Time served7 or fewer days 36.6% 37.6% 37.7% 40.4% 39.7% 38.2% 35.9% 35.9% 37.2% 38.6% 38.5% 39.2% 36.5% 40.0%8–30 18.7 18.7 17.6 17.9 17.8 18.6 19.3 16.8 17.5 17.6 19.7 19.4 21.0 16.831–60 12.4 11.3 10.5 9.5 11.5 11.1 11.8 12.5 11.3 10.5 10.2 10.9 10.4 9.161–120 12.8 13.4 12.7 12.2 11.1 12.7 13.9 13.4 13.0 12.4 10.3 10.2 12.2 12.7121–180 6.2 6.8 7.6 7.4 7.6 6.8 7.5 7.4 7.3 5.4 6.5 6.3 6.1 4.7180 or more 13.3 12.2 14.0 12.6 12.4 12.6 11.6 13.9 13.7 15.6 14.9 14.0 13.9 16.2
Note: Data may have been revised from previously published statistics. Detail may not sum to total due to missing data. See Methodology for details on Hispanic origin and probation or parole violations.aExcludes persons of Hispanic or Latino origin, unless specified. bIn 2013, the survey separated Hispanic origin from race. Comparisons with previous years should not be made.cIncludes American Indians or Alaska Natives, Asians, Native Hawaiians, or other Pacific Islanders, and persons identifying two or more races.dIncludes inmates who returned on a probation or parole violation.eIncludes inmates whose status was marked as other or was unspecified.Source: Bureau of Justice Statistics, Deaths in Custody Reporting Program, 2000–2013.
Mortality in Local Jails and State Prisons, 2000–2013 - Statistical Tables | August 2015 11
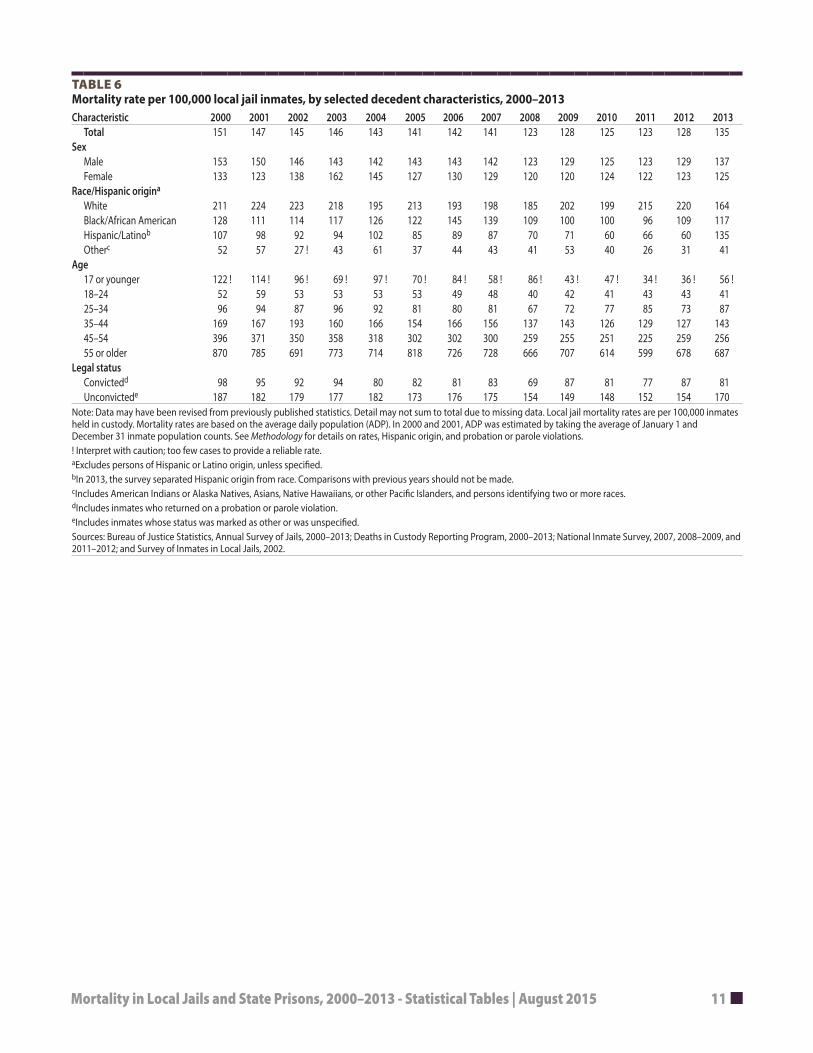
TABLe 6 Mortality rate per 100,000 local jail inmates, by selected decedent characteristics, 2000–2013Characteristic 2000 2001 2002 2003 2004 2005 2006 2007 2008 2009 2010 2011 2012 2013
Total 151 147 145 146 143 141 142 141 123 128 125 123 128 135Sex
Male 153 150 146 143 142 143 143 142 123 129 125 123 129 137Female 133 123 138 162 145 127 130 129 120 120 124 122 123 125
Race/Hispanic origina
White 211 224 223 218 195 213 193 198 185 202 199 215 220 164Black/African American 128 111 114 117 126 122 145 139 109 100 100 96 109 117Hispanic/Latinob 107 98 92 94 102 85 89 87 70 71 60 66 60 135Otherc 52 57 27 ! 43 61 37 44 43 41 53 40 26 31 41
Age17 or younger 122 ! 114 ! 96 ! 69 ! 97 ! 70 ! 84 ! 58 ! 86 ! 43 ! 47 ! 34 ! 36 ! 56 !18–24 52 59 53 53 53 53 49 48 40 42 41 43 43 4125–34 96 94 87 96 92 81 80 81 67 72 77 85 73 8735–44 169 167 193 160 166 154 166 156 137 143 126 129 127 14345–54 396 371 350 358 318 302 302 300 259 255 251 225 259 25655 or older 870 785 691 773 714 818 726 728 666 707 614 599 678 687
Legal statusConvictedd 98 95 92 94 80 82 81 83 69 87 81 77 87 81Unconvictede 187 182 179 177 182 173 176 175 154 149 148 152 154 170
Note: Data may have been revised from previously published statistics. Detail may not sum to total due to missing data. Local jail mortality rates are per 100,000 inmates held in custody. Mortality rates are based on the average daily population (ADP). In 2000 and 2001, ADP was estimated by taking the average of January 1 and December 31 inmate population counts. See Methodology for details on rates, Hispanic origin, and probation or parole violations.! Interpret with caution; too few cases to provide a reliable rate. aExcludes persons of Hispanic or Latino origin, unless specified. bIn 2013, the survey separated Hispanic origin from race. Comparisons with previous years should not be made. cIncludes American Indians or Alaska Natives, Asians, Native Hawaiians, or other Pacific Islanders, and persons identifying two or more races.dIncludes inmates who returned on a probation or parole violation. eIncludes inmates whose status was marked as other or was unspecified.Sources: Bureau of Justice Statistics, Annual Survey of Jails, 2000–2013; Deaths in Custody Reporting Program, 2000–2013; National Inmate Survey, 2007, 2008–2009, and 2011–2012; and Survey of Inmates in Local Jails, 2002.
Mortality in Local Jails and State Prisons, 2000–2013 - Statistical Tables | August 2015 12
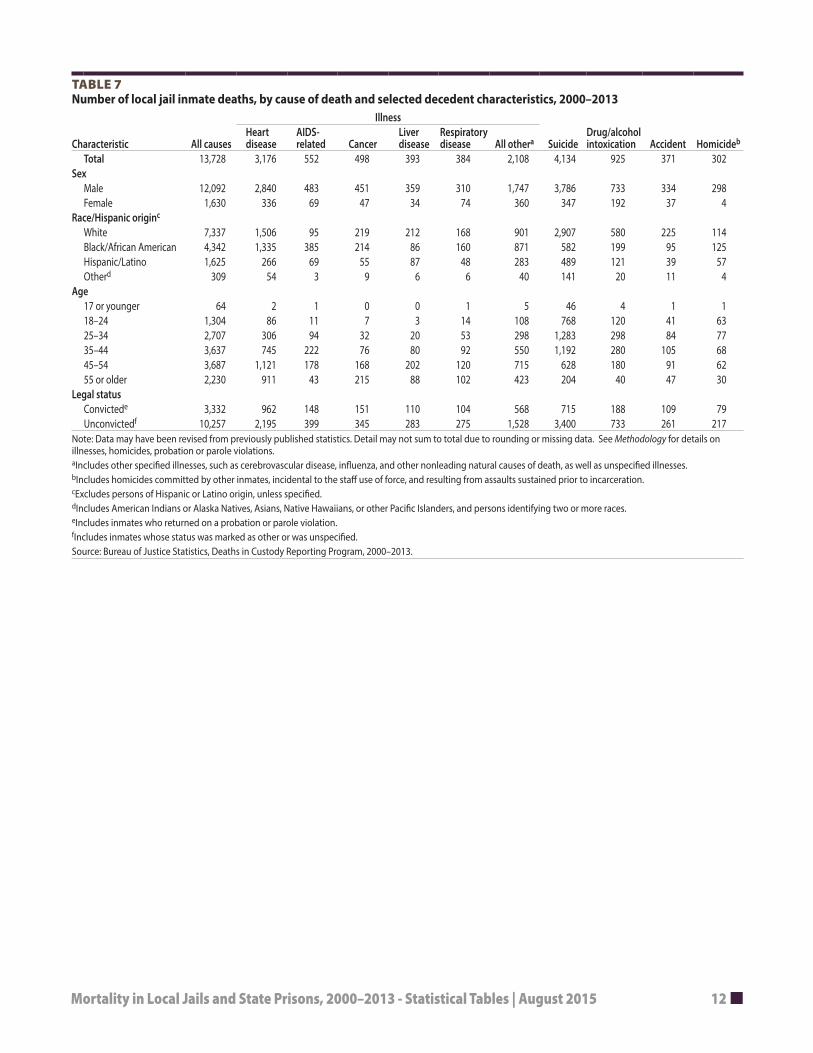
TABLe 7Number of local jail inmate deaths, by cause of death and selected decedent characteristics, 2000–2013
Illness
Characteristic All causesHeart disease
AIDS-related Cancer
Liver disease
Respiratory disease All othera Suicide
Drug/alcohol intoxication Accident Homicideb
Total 13,728 3,176 552 498 393 384 2,108 4,134 925 371 302Sex
Male 12,092 2,840 483 451 359 310 1,747 3,786 733 334 298Female 1,630 336 69 47 34 74 360 347 192 37 4
Race/Hispanic originc
White 7,337 1,506 95 219 212 168 901 2,907 580 225 114Black/African American 4,342 1,335 385 214 86 160 871 582 199 95 125Hispanic/Latino 1,625 266 69 55 87 48 283 489 121 39 57Otherd 309 54 3 9 6 6 40 141 20 11 4
Age17 or younger 64 2 1 0 0 1 5 46 4 1 118–24 1,304 86 11 7 3 14 108 768 120 41 6325–34 2,707 306 94 32 20 53 298 1,283 298 84 7735–44 3,637 745 222 76 80 92 550 1,192 280 105 6845–54 3,687 1,121 178 168 202 120 715 628 180 91 6255 or older 2,230 911 43 215 88 102 423 204 40 47 30
Legal statusConvictede 3,332 962 148 151 110 104 568 715 188 109 79Unconvictedf 10,257 2,195 399 345 283 275 1,528 3,400 733 261 217
Note: Data may have been revised from previously published statistics. Detail may not sum to total due to rounding or missing data. See Methodology for details on illnesses, homicides, probation or parole violations.aIncludes other specified illnesses, such as cerebrovascular disease, influenza, and other nonleading natural causes of death, as well as unspecified illnesses. bIncludes homicides committed by other inmates, incidental to the staff use of force, and resulting from assaults sustained prior to incarceration. cExcludes persons of Hispanic or Latino origin, unless specified. dIncludes American Indians or Alaska Natives, Asians, Native Hawaiians, or other Pacific Islanders, and persons identifying two or more races.eIncludes inmates who returned on a probation or parole violation. fIncludes inmates whose status was marked as other or was unspecified.Source: Bureau of Justice Statistics, Deaths in Custody Reporting Program, 2000–2013.
Mortality in Local Jails and State Prisons, 2000–2013 - Statistical Tables | August 2015 13
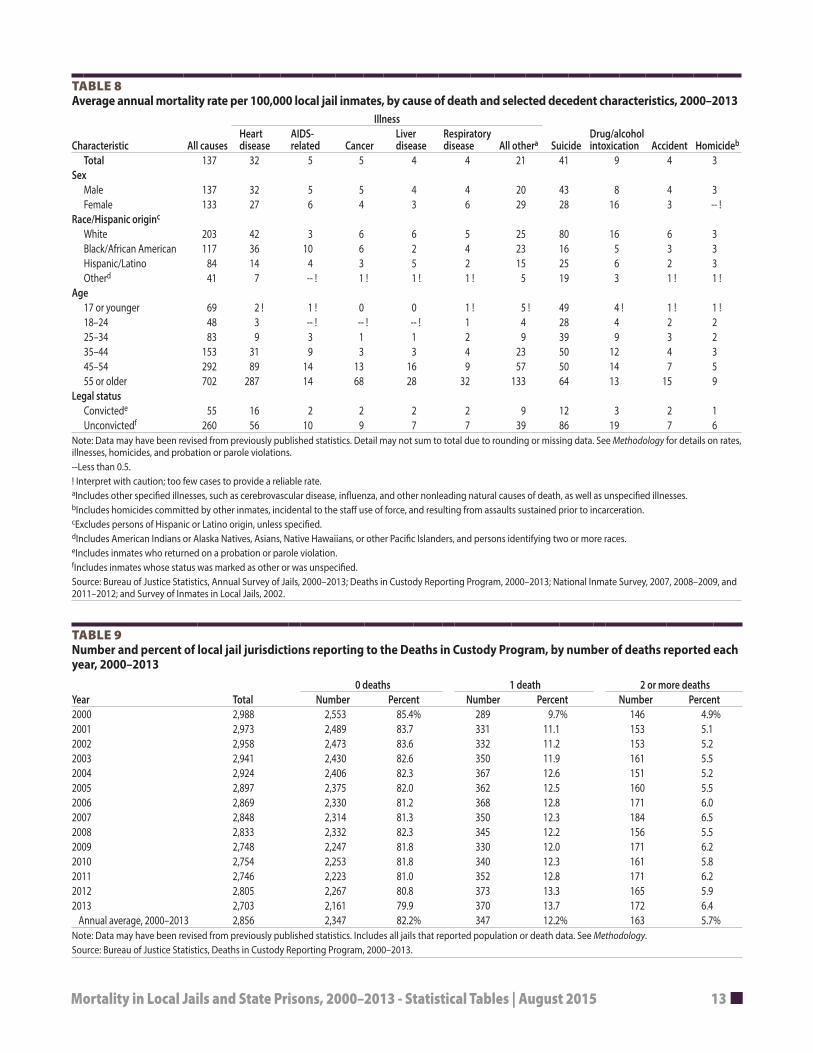
TABLe 8Average annual mortality rate per 100,000 local jail inmates, by cause of death and selected decedent characteristics, 2000–2013
Illness
Characteristic All causesHeart disease
AIDS- related Cancer
Liver disease
Respiratory disease All othera Suicide
Drug/alcohol intoxication Accident Homicideb
Total 137 32 5 5 4 4 21 41 9 4 3Sex
Male 137 32 5 5 4 4 20 43 8 4 3Female 133 27 6 4 3 6 29 28 16 3 -- !
Race/Hispanic originc White 203 42 3 6 6 5 25 80 16 6 3Black/African American 117 36 10 6 2 4 23 16 5 3 3Hispanic/Latino 84 14 4 3 5 2 15 25 6 2 3Otherd 41 7 -- ! 1 ! 1 ! 1 ! 5 19 3 1 ! 1 !
Age 17 or younger 69 2 ! 1 ! 0 0 1 ! 5 ! 49 4 ! 1 ! 1 !18–24 48 3 -- ! -- ! -- ! 1 4 28 4 2 225–34 83 9 3 1 1 2 9 39 9 3 235–44 153 31 9 3 3 4 23 50 12 4 345–54 292 89 14 13 16 9 57 50 14 7 555 or older 702 287 14 68 28 32 133 64 13 15 9
Legal statusConvictede 55 16 2 2 2 2 9 12 3 2 1Unconvictedf 260 56 10 9 7 7 39 86 19 7 6
Note: Data may have been revised from previously published statistics. Detail may not sum to total due to rounding or missing data. See Methodology for details on rates, illnesses, homicides, and probation or parole violations.--Less than 0.5.! Interpret with caution; too few cases to provide a reliable rate. aIncludes other specified illnesses, such as cerebrovascular disease, influenza, and other nonleading natural causes of death, as well as unspecified illnesses. bIncludes homicides committed by other inmates, incidental to the staff use of force, and resulting from assaults sustained prior to incarceration. cExcludes persons of Hispanic or Latino origin, unless specified. dIncludes American Indians or Alaska Natives, Asians, Native Hawaiians, or other Pacific Islanders, and persons identifying two or more races.eIncludes inmates who returned on a probation or parole violation. fIncludes inmates whose status was marked as other or was unspecified.Source: Bureau of Justice Statistics, Annual Survey of Jails, 2000–2013; Deaths in Custody Reporting Program, 2000–2013; National Inmate Survey, 2007, 2008–2009, and 2011–2012; and Survey of Inmates in Local Jails, 2002.
TABLe 9Number and percent of local jail jurisdictions reporting to the Deaths in Custody Program, by number of deaths reported each year, 2000–2013
0 deaths 1 death 2 or more deathsYear Total Number Percent Number Percent Number Percent 2000 2,988 2,553 85.4% 289 9.7% 146 4.9%2001 2,973 2,489 83.7 331 11.1 153 5.12002 2,958 2,473 83.6 332 11.2 153 5.22003 2,941 2,430 82.6 350 11.9 161 5.52004 2,924 2,406 82.3 367 12.6 151 5.22005 2,897 2,375 82.0 362 12.5 160 5.52006 2,869 2,330 81.2 368 12.8 171 6.02007 2,848 2,314 81.3 350 12.3 184 6.52008 2,833 2,332 82.3 345 12.2 156 5.52009 2,748 2,247 81.8 330 12.0 171 6.22010 2,754 2,253 81.8 340 12.3 161 5.82011 2,746 2,223 81.0 352 12.8 171 6.22012 2,805 2,267 80.8 373 13.3 165 5.92013 2,703 2,161 79.9 370 13.7 172 6.4
Annual average, 2000–2013 2,856 2,347 82.2% 347 12.2% 163 5.7%Note: Data may have been revised from previously published statistics. Includes all jails that reported population or death data. See Methodology.Source: Bureau of Justice Statistics, Deaths in Custody Reporting Program, 2000–2013.
Mortality in Local Jails and State Prisons, 2000–2013 - Statistical Tables | August 2015 14
TABLe 10Number, percent, average daily population, and mortality rate per 100,000 local jail inmate deaths, by hold status, 2013
Hold status Number of deaths Percent of total jail population Average daily populationMortality rate per 100,000 local jail inmates
Total 967 100% 714,976 135Hold status 129 23% 162,200 80 Immigration and Customs Enforcement 17 2 16,200 105 U.S. Marshals 29 4 27,900 104 Other* 83 17 118,200 70No hold 838 77% 552,700 152Note: Average daily population was calculated for Immigration and Customs Enforcement, U.S. Marshals, and other authorities based on their proportion of the confined population on December 31.*Includes state or federal prison, Bureau of Indian Affairs, or any other jail jurisdiction.Source: Bureau of Justice Statistics, Deaths in Custody Reporting Program, 2013.
Mortality in Local Jails and State Prisons, 2000–2013 - Statistical Tables | August 2015 15
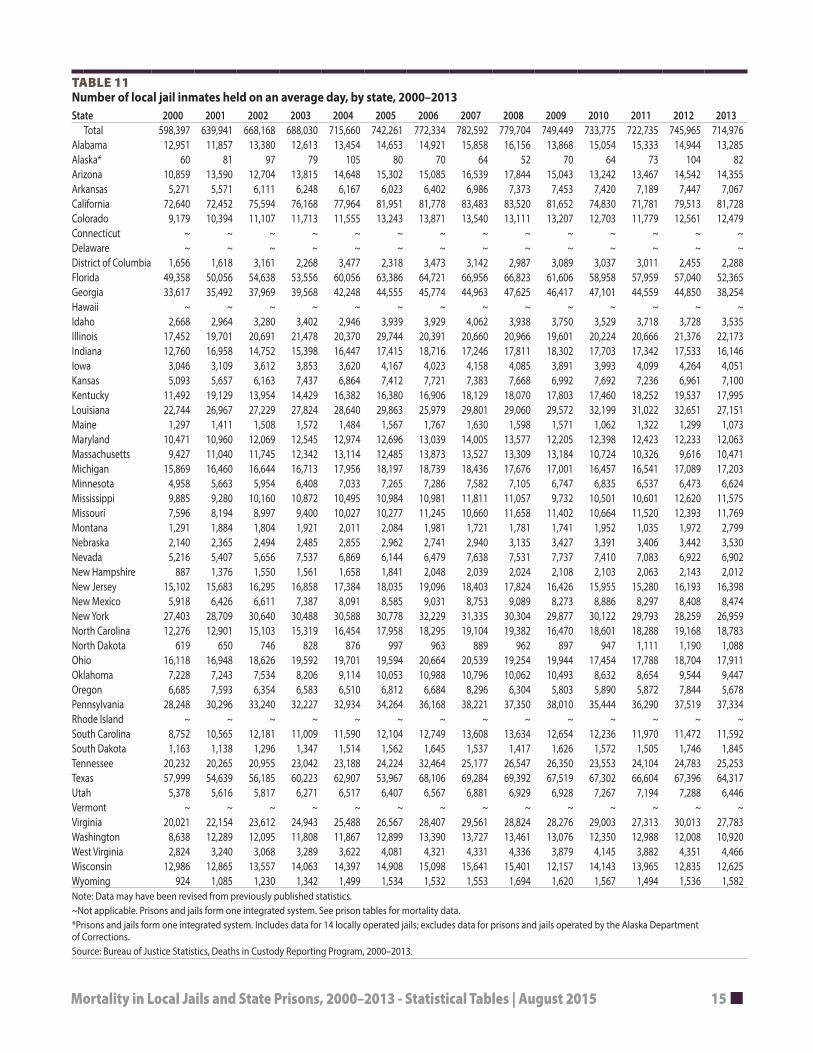
TABLe 11Number of local jail inmates held on an average day, by state, 2000–2013State 2000 2001 2002 2003 2004 2005 2006 2007 2008 2009 2010 2011 2012 2013
Total 598,397 639,941 668,168 688,030 715,660 742,261 772,334 782,592 779,704 749,449 733,775 722,735 745,965 714,976 Alabama 12,951 11,857 13,380 12,613 13,454 14,653 14,921 15,858 16,156 13,868 15,054 15,333 14,944 13,285 Alaska* 60 81 97 79 105 80 70 64 52 70 64 73 104 82 Arizona 10,859 13,590 12,704 13,815 14,648 15,302 15,085 16,539 17,844 15,043 13,242 13,467 14,542 14,355 Arkansas 5,271 5,571 6,111 6,248 6,167 6,023 6,402 6,986 7,373 7,453 7,420 7,189 7,447 7,067 California 72,640 72,452 75,594 76,168 77,964 81,951 81,778 83,483 83,520 81,652 74,830 71,781 79,513 81,728 Colorado 9,179 10,394 11,107 11,713 11,555 13,243 13,871 13,540 13,111 13,207 12,703 11,779 12,561 12,479 Connecticut ~ ~ ~ ~ ~ ~ ~ ~ ~ ~ ~ ~ ~ ~ Delaware ~ ~ ~ ~ ~ ~ ~ ~ ~ ~ ~ ~ ~ ~ District of Columbia 1,656 1,618 3,161 2,268 3,477 2,318 3,473 3,142 2,987 3,089 3,037 3,011 2,455 2,288 Florida 49,358 50,056 54,638 53,556 60,056 63,386 64,721 66,956 66,823 61,606 58,958 57,959 57,040 52,365 Georgia 33,617 35,492 37,969 39,568 42,248 44,555 45,774 44,963 47,625 46,417 47,101 44,559 44,850 38,254 Hawaii ~ ~ ~ ~ ~ ~ ~ ~ ~ ~ ~ ~ ~ ~ Idaho 2,668 2,964 3,280 3,402 2,946 3,939 3,929 4,062 3,938 3,750 3,529 3,718 3,728 3,535 Illinois 17,452 19,701 20,691 21,478 20,370 29,744 20,391 20,660 20,966 19,601 20,224 20,666 21,376 22,173 Indiana 12,760 16,958 14,752 15,398 16,447 17,415 18,716 17,246 17,811 18,302 17,703 17,342 17,533 16,146 Iowa 3,046 3,109 3,612 3,853 3,620 4,167 4,023 4,158 4,085 3,891 3,993 4,099 4,264 4,051 Kansas 5,093 5,657 6,163 7,437 6,864 7,412 7,721 7,383 7,668 6,992 7,692 7,236 6,961 7,100 Kentucky 11,492 19,129 13,954 14,429 16,382 16,380 16,906 18,129 18,070 17,803 17,460 18,252 19,537 17,995 Louisiana 22,744 26,967 27,229 27,824 28,640 29,863 25,979 29,801 29,060 29,572 32,199 31,022 32,651 27,151 Maine 1,297 1,411 1,508 1,572 1,484 1,567 1,767 1,630 1,598 1,571 1,062 1,322 1,299 1,073 Maryland 10,471 10,960 12,069 12,545 12,974 12,696 13,039 14,005 13,577 12,205 12,398 12,423 12,233 12,063 Massachusetts 9,427 11,040 11,745 12,342 13,114 12,485 13,873 13,527 13,309 13,184 10,724 10,326 9,616 10,471 Michigan 15,869 16,460 16,644 16,713 17,956 18,197 18,739 18,436 17,676 17,001 16,457 16,541 17,089 17,203 Minnesota 4,958 5,663 5,954 6,408 7,033 7,265 7,286 7,582 7,105 6,747 6,835 6,537 6,473 6,624 Mississippi 9,885 9,280 10,160 10,872 10,495 10,984 10,981 11,811 11,057 9,732 10,501 10,601 12,620 11,575 Missouri 7,596 8,194 8,997 9,400 10,027 10,277 11,245 10,660 11,658 11,402 10,664 11,520 12,393 11,769 Montana 1,291 1,884 1,804 1,921 2,011 2,084 1,981 1,721 1,781 1,741 1,952 1,035 1,972 2,799 Nebraska 2,140 2,365 2,494 2,485 2,855 2,962 2,741 2,940 3,135 3,427 3,391 3,406 3,442 3,530 Nevada 5,216 5,407 5,656 7,537 6,869 6,144 6,479 7,638 7,531 7,737 7,410 7,083 6,922 6,902 New Hampshire 887 1,376 1,550 1,561 1,658 1,841 2,048 2,039 2,024 2,108 2,103 2,063 2,143 2,012 New Jersey 15,102 15,683 16,295 16,858 17,384 18,035 19,096 18,403 17,824 16,426 15,955 15,280 16,193 16,398 New Mexico 5,918 6,426 6,611 7,387 8,091 8,585 9,031 8,753 9,089 8,273 8,886 8,297 8,408 8,474 New York 27,403 28,709 30,640 30,488 30,588 30,778 32,229 31,335 30,304 29,877 30,122 29,793 28,259 26,959 North Carolina 12,276 12,901 15,103 15,319 16,454 17,958 18,295 19,104 19,382 16,470 18,601 18,288 19,168 18,783 North Dakota 619 650 746 828 876 997 963 889 962 897 947 1,111 1,190 1,088 Ohio 16,118 16,948 18,626 19,592 19,701 19,594 20,664 20,539 19,254 19,944 17,454 17,788 18,704 17,911 Oklahoma 7,228 7,243 7,534 8,206 9,114 10,053 10,988 10,796 10,062 10,493 8,632 8,654 9,544 9,447 Oregon 6,685 7,593 6,354 6,583 6,510 6,812 6,684 8,296 6,304 5,803 5,890 5,872 7,844 5,678 Pennsylvania 28,248 30,296 33,240 32,227 32,934 34,264 36,168 38,221 37,350 38,010 35,444 36,290 37,519 37,334 Rhode Island ~ ~ ~ ~ ~ ~ ~ ~ ~ ~ ~ ~ ~ ~ South Carolina 8,752 10,565 12,181 11,009 11,590 12,104 12,749 13,608 13,634 12,654 12,236 11,970 11,472 11,592 South Dakota 1,163 1,138 1,296 1,347 1,514 1,562 1,645 1,537 1,417 1,626 1,572 1,505 1,746 1,845 Tennessee 20,232 20,265 20,955 23,042 23,188 24,224 32,464 25,177 26,547 26,350 23,553 24,104 24,783 25,253 Texas 57,999 54,639 56,185 60,223 62,907 53,967 68,106 69,284 69,392 67,519 67,302 66,604 67,396 64,317 Utah 5,378 5,616 5,817 6,271 6,517 6,407 6,567 6,881 6,929 6,928 7,267 7,194 7,288 6,446 Vermont ~ ~ ~ ~ ~ ~ ~ ~ ~ ~ ~ ~ ~ ~ Virginia 20,021 22,154 23,612 24,943 25,488 26,567 28,407 29,561 28,824 28,276 29,003 27,313 30,013 27,783 Washington 8,638 12,289 12,095 11,808 11,867 12,899 13,390 13,727 13,461 13,076 12,350 12,988 12,008 10,920 West Virginia 2,824 3,240 3,068 3,289 3,622 4,081 4,321 4,331 4,336 3,879 4,145 3,882 4,351 4,466 Wisconsin 12,986 12,865 13,557 14,063 14,397 14,908 15,098 15,641 15,401 12,157 14,143 13,965 12,835 12,625 Wyoming 924 1,085 1,230 1,342 1,499 1,534 1,532 1,553 1,694 1,620 1,567 1,494 1,536 1,582 Note: Data may have been revised from previously published statistics. ~Not applicable. Prisons and jails form one integrated system. See prison tables for mortality data.*Prisons and jails form one integrated system. Includes data for 14 locally operated jails; excludes data for prisons and jails operated by the Alaska Department of Corrections.Source: Bureau of Justice Statistics, Deaths in Custody Reporting Program, 2000–2013.
Mortality in Local Jails and State Prisons, 2000–2013 - Statistical Tables | August 2015 16
TABLe 12Number of local jail deaths, by state, 2000–2013State 2000 2001 2002 2003 2004 2005 2006 2007 2008 2009 2010 2011 2012 2013 Total 904 942 970 1,002 1,021 1,045 1,094 1,100 958 960 918 889 958 967Alabama 24 27 21 15 23 23 34 21 19 20 28 18 18 19Alaska* 0 0 0 0 0 0 0 0 0 0 0 1 1 0Arizona 15 18 24 16 12 27 19 21 12 11 16 9 10 14Arkansas 9 13 14 22 13 7 11 10 15 5 7 16 10 15California 109 124 131 126 120 156 126 129 106 138 121 92 112 128Colorado 13 16 14 13 11 18 13 21 21 14 20 12 9 20Connecticut ~ ~ ~ ~ ~ ~ ~ ~ ~ ~ ~ ~ ~ ~Delaware ~ ~ ~ ~ ~ ~ ~ ~ ~ ~ ~ ~ ~ ~District of Columbia 4 0 10 12 13 11 12 10 7 8 4 7 2 6Florida 82 98 79 85 86 79 99 103 77 88 57 66 69 65Georgia 38 39 50 45 54 41 46 44 55 45 48 45 47 47Hawaii ~ ~ ~ ~ ~ ~ ~ ~ ~ ~ ~ ~ ~ ~Idaho 3 3 1 2 1 7 5 7 1 6 3 5 4 6Illinois 31 21 22 30 41 25 37 31 29 29 23 21 23 33Indiana 21 21 14 23 18 16 26 18 11 16 22 21 19 18Iowa 2 4 3 1 4 4 3 5 2 6 3 8 4 9Kansas 9 9 12 10 15 11 10 7 12 11 10 10 11 17Kentucky 16 13 12 14 16 22 21 25 22 18 21 16 21 13Louisiana 10 22 22 32 41 31 26 31 34 22 26 20 42 37Maine 2 2 7 3 2 1 5 1 1 2 3 7 0 1Maryland 22 20 20 25 15 23 27 32 25 20 24 21 17 20Massachusetts 5 10 16 9 8 21 14 14 17 17 16 5 14 10Michigan 23 17 18 26 20 29 21 18 12 20 18 24 17 14Minnesota 6 8 6 9 9 8 11 8 4 3 10 6 7 5Mississippi 9 12 17 17 17 16 18 18 14 13 14 14 9 15Missouri 16 14 8 17 6 10 13 25 17 20 21 12 27 19Montana 3 1 5 5 3 6 1 2 2 6 3 8 3 5Nebraska 5 5 6 2 4 2 6 2 5 7 6 5 4 7Nevada 15 18 6 6 8 14 9 10 8 14 8 13 12 10New Hampshire 3 2 5 3 3 1 4 4 2 5 1 4 3 1New Jersey 31 17 17 38 34 32 36 34 27 25 29 20 25 23New Mexico 15 9 9 7 17 11 21 15 11 11 17 23 16 10New York 57 52 51 47 43 51 52 52 32 37 37 36 40 40North Carolina 15 17 32 22 21 17 21 28 19 21 24 17 25 21North Dakota 1 1 2 2 1 0 2 1 1 2 2 1 3 5Ohio 23 20 30 30 18 24 26 26 23 26 23 28 33 30Oklahoma 15 18 9 13 14 18 21 24 17 18 18 12 13 16Oregon 10 10 7 7 15 8 11 3 15 7 9 8 3 4Pennsylvania 38 50 51 53 66 57 56 55 44 37 31 46 58 41Rhode Island ~ ~ ~ ~ ~ ~ ~ ~ ~ ~ ~ ~ ~ ~South Carolina 17 23 17 11 16 19 21 14 19 15 19 7 22 21South Dakota 4 2 1 0 1 3 1 1 2 2 0 1 0 2Tennessee 29 28 29 23 39 36 30 35 37 34 20 40 35 26Texas 97 84 96 96 99 89 98 90 86 76 84 70 72 97Utah 6 6 13 7 11 10 7 11 6 12 8 14 11 16Vermont ~ ~ ~ ~ ~ ~ ~ ~ ~ ~ ~ ~ ~ ~Virginia 34 41 36 42 33 30 36 59 49 39 29 42 40 27Washington 8 10 11 16 11 11 19 15 16 14 16 16 20 16West Virginia 2 6 2 6 5 6 6 4 6 7 5 7 10 6Wisconsin 7 11 12 11 10 11 11 15 17 11 13 14 13 10Wyoming 0 0 2 3 4 3 2 1 1 2 1 1 4 2Note: Data may have been revised from previously published statistics.~Not applicable. Prisons and jails form one integrated system. See prison tables for mortality data.*Prisons and jails form one integrated system. Includes data for 14 locally operated jails; excludes data for prisons and jails operated by the Alaska Department of Corrections.Source: Bureau of Justice Statistics, Deaths in Custody Reporting Program, 2000–2013.
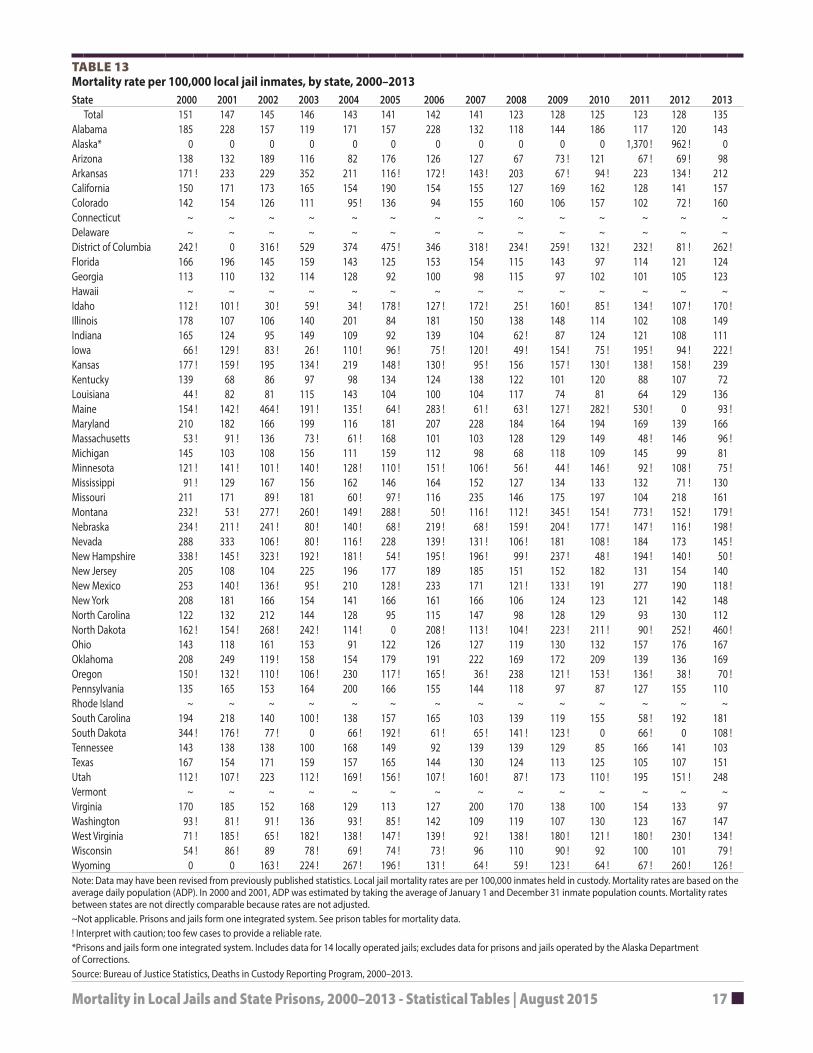
TABLe 13Mortality rate per 100,000 local jail inmates, by state, 2000–2013State 2000 2001 2002 2003 2004 2005 2006 2007 2008 2009 2010 2011 2012 2013
Total 151 147 145 146 143 141 142 141 123 128 125 123 128 135Alabama 185 228 157 119 171 157 228 132 118 144 186 117 120 143Alaska* 0 0 0 0 0 0 0 0 0 0 0 1,370 ! 962 ! 0Arizona 138 132 189 116 82 176 126 127 67 73 ! 121 67 ! 69 ! 98Arkansas 171 ! 233 229 352 211 116 ! 172 ! 143 ! 203 67 ! 94 ! 223 134 ! 212California 150 171 173 165 154 190 154 155 127 169 162 128 141 157Colorado 142 154 126 111 95 ! 136 94 155 160 106 157 102 72 ! 160Connecticut ~ ~ ~ ~ ~ ~ ~ ~ ~ ~ ~ ~ ~ ~Delaware ~ ~ ~ ~ ~ ~ ~ ~ ~ ~ ~ ~ ~ ~District of Columbia 242 ! 0 316 ! 529 374 475 ! 346 318 ! 234 ! 259 ! 132 ! 232 ! 81 ! 262 !Florida 166 196 145 159 143 125 153 154 115 143 97 114 121 124Georgia 113 110 132 114 128 92 100 98 115 97 102 101 105 123Hawaii ~ ~ ~ ~ ~ ~ ~ ~ ~ ~ ~ ~ ~ ~Idaho 112 ! 101 ! 30 ! 59 ! 34 ! 178 ! 127 ! 172 ! 25 ! 160 ! 85 ! 134 ! 107 ! 170 !Illinois 178 107 106 140 201 84 181 150 138 148 114 102 108 149Indiana 165 124 95 149 109 92 139 104 62 ! 87 124 121 108 111Iowa 66 ! 129 ! 83 ! 26 ! 110 ! 96 ! 75 ! 120 ! 49 ! 154 ! 75 ! 195 ! 94 ! 222 !Kansas 177 ! 159 ! 195 134 ! 219 148 ! 130 ! 95 ! 156 157 ! 130 ! 138 ! 158 ! 239Kentucky 139 68 86 97 98 134 124 138 122 101 120 88 107 72Louisiana 44 ! 82 81 115 143 104 100 104 117 74 81 64 129 136Maine 154 ! 142 ! 464 ! 191 ! 135 ! 64 ! 283 ! 61 ! 63 ! 127 ! 282 ! 530 ! 0 93 !Maryland 210 182 166 199 116 181 207 228 184 164 194 169 139 166Massachusetts 53 ! 91 ! 136 73 ! 61 ! 168 101 103 128 129 149 48 ! 146 96 !Michigan 145 103 108 156 111 159 112 98 68 118 109 145 99 81Minnesota 121 ! 141 ! 101 ! 140 ! 128 ! 110 ! 151 ! 106 ! 56 ! 44 ! 146 ! 92 ! 108 ! 75 !Mississippi 91 ! 129 167 156 162 146 164 152 127 134 133 132 71 ! 130Missouri 211 171 89 ! 181 60 ! 97 ! 116 235 146 175 197 104 218 161Montana 232 ! 53 ! 277 ! 260 ! 149 ! 288 ! 50 ! 116 ! 112 ! 345 ! 154 ! 773 ! 152 ! 179 !Nebraska 234 ! 211 ! 241 ! 80 ! 140 ! 68 ! 219 ! 68 ! 159 ! 204 ! 177 ! 147 ! 116 ! 198 !Nevada 288 333 106 ! 80 ! 116 ! 228 139 ! 131 ! 106 ! 181 108 ! 184 173 145 !New Hampshire 338 ! 145 ! 323 ! 192 ! 181 ! 54 ! 195 ! 196 ! 99 ! 237 ! 48 ! 194 ! 140 ! 50 !New Jersey 205 108 104 225 196 177 189 185 151 152 182 131 154 140New Mexico 253 140 ! 136 ! 95 ! 210 128 ! 233 171 121 ! 133 ! 191 277 190 118 !New York 208 181 166 154 141 166 161 166 106 124 123 121 142 148North Carolina 122 132 212 144 128 95 115 147 98 128 129 93 130 112North Dakota 162 ! 154 ! 268 ! 242 ! 114 ! 0 208 ! 113 ! 104 ! 223 ! 211 ! 90 ! 252 ! 460 !Ohio 143 118 161 153 91 122 126 127 119 130 132 157 176 167Oklahoma 208 249 119 ! 158 154 179 191 222 169 172 209 139 136 169Oregon 150 ! 132 ! 110 ! 106 ! 230 117 ! 165 ! 36 ! 238 121 ! 153 ! 136 ! 38 ! 70 !Pennsylvania 135 165 153 164 200 166 155 144 118 97 87 127 155 110Rhode Island ~ ~ ~ ~ ~ ~ ~ ~ ~ ~ ~ ~ ~ ~South Carolina 194 218 140 100 ! 138 157 165 103 139 119 155 58 ! 192 181South Dakota 344 ! 176 ! 77 ! 0 66 ! 192 ! 61 ! 65 ! 141 ! 123 ! 0 66 ! 0 108 !Tennessee 143 138 138 100 168 149 92 139 139 129 85 166 141 103Texas 167 154 171 159 157 165 144 130 124 113 125 105 107 151Utah 112 ! 107 ! 223 112 ! 169 ! 156 ! 107 ! 160 ! 87 ! 173 110 ! 195 151 ! 248Vermont ~ ~ ~ ~ ~ ~ ~ ~ ~ ~ ~ ~ ~ ~Virginia 170 185 152 168 129 113 127 200 170 138 100 154 133 97Washington 93 ! 81 ! 91 ! 136 93 ! 85 ! 142 109 119 107 130 123 167 147West Virginia 71 ! 185 ! 65 ! 182 ! 138 ! 147 ! 139 ! 92 ! 138 ! 180 ! 121 ! 180 ! 230 ! 134 !Wisconsin 54 ! 86 ! 89 78 ! 69 ! 74 ! 73 ! 96 110 90 ! 92 100 101 79 !Wyoming 0 0 163 ! 224 ! 267 ! 196 ! 131 ! 64 ! 59 ! 123 ! 64 ! 67 ! 260 ! 126 !Note: Data may have been revised from previously published statistics. Local jail mortality rates are per 100,000 inmates held in custody. Mortality rates are based on the average daily population (ADP). In 2000 and 2001, ADP was estimated by taking the average of January 1 and December 31 inmate population counts. Mortality rates between states are not directly comparable because rates are not adjusted.~Not applicable. Prisons and jails form one integrated system. See prison tables for mortality data.! Interpret with caution; too few cases to provide a reliable rate.*Prisons and jails form one integrated system. Includes data for 14 locally operated jails; excludes data for prisons and jails operated by the Alaska Department of Corrections.Source: Bureau of Justice Statistics, Deaths in Custody Reporting Program, 2000–2013.
Mortality in Local Jails and State Prisons, 2000–2013 - Statistical Tables | August 2015 17
Mortality in Local Jails and State Prisons, 2000–2013 - Statistical Tables | August 2015 18
TABLe 14Number of local jail jurisdictions reporting to the Deaths in Custody Reporting Program, by state, 2000–2013State 2000 2001 2002 2003 2004 2005 2006 2007 2008 2009 2010 2011 2012 2013
Total 2,988 2,973 2,958 2,941 2,924 2,897 2,869 2,848 2,833 2,748 2,754 2,746 2,805 2,703Alabama 151 149 147 146 145 142 136 132 125 115 117 115 122 116Alaska* 15 15 15 14 14 15 15 15 15 14 15 15 15 15Arizona 16 15 15 15 15 15 15 15 15 15 15 15 15 15Arkansas 85 84 84 83 82 83 81 81 81 76 71 73 77 67California 68 67 67 67 67 66 65 64 64 63 63 62 63 63Colorado 55 55 55 55 55 55 53 53 53 53 52 50 52 54Connecticut ~ ~ ~ ~ ~ ~ ~ ~ ~ ~ ~ ~ ~ ~Delaware ~ ~ ~ ~ ~ ~ ~ ~ ~ ~ ~ ~ ~ ~District of Columbia 1 1 1 1 1 1 1 1 1 1 1 1 1 1Florida 68 68 68 68 67 67 67 67 67 65 66 66 67 63Georgia 176 174 174 172 170 167 164 162 159 152 153 154 158 145Hawaii ~ ~ ~ ~ ~ ~ ~ ~ ~ ~ ~ ~ ~ ~Idaho 39 38 38 38 38 38 38 37 37 35 34 34 35 36Illinois 90 89 90 90 89 90 90 90 90 90 90 88 90 89Indiana 90 91 90 90 90 90 90 90 90 89 89 90 90 88Iowa 94 93 93 93 93 93 93 93 93 92 90 93 93 92Kansas 95 95 95 95 95 95 94 94 93 90 92 90 93 95Kentucky 80 78 80 79 79 76 74 74 74 70 72 73 75 74Louisiana 87 86 85 85 85 83 83 83 83 79 82 75 83 76Maine 15 15 15 15 15 15 15 14 14 14 11 12 12 11Maryland 24 24 24 24 24 24 24 24 24 23 24 24 24 24Massachusetts 13 13 13 13 13 13 13 13 13 13 13 13 13 11Michigan 83 83 82 82 82 82 81 81 81 81 81 80 81 79Minnesota 71 71 71 71 71 71 71 71 70 68 70 69 70 76Mississippi 91 90 89 88 88 85 84 84 83 80 77 77 83 67Missouri 125 125 125 124 120 119 120 119 119 111 115 115 116 109Montana 41 41 40 40 41 40 40 40 40 37 39 39 39 37Nebraska 64 63 63 63 63 63 62 62 62 61 61 60 61 60Nevada 20 20 20 20 20 20 20 20 20 20 20 20 20 18New Hampshire 10 10 10 10 10 10 10 10 10 10 10 10 10 10New Jersey 21 21 21 21 21 21 21 21 21 20 21 21 21 21New Mexico 34 35 35 34 34 32 32 32 32 29 29 31 31 31New York 58 58 58 58 58 58 58 58 58 57 57 58 56 55North Carolina 96 96 96 96 94 94 94 94 93 89 92 93 93 90North Dakota 23 23 23 23 23 23 22 21 21 22 22 22 22 22Ohio 97 96 96 93 93 93 92 91 91 91 90 93 93 98Oklahoma 100 100 100 99 98 96 94 93 93 88 90 88 89 79Oregon 33 33 33 33 33 32 32 32 32 31 31 30 31 32Pennsylvania 63 63 63 63 63 63 63 63 63 63 63 63 63 60Rhode Island ~ ~ ~ ~ ~ ~ ~ ~ ~ ~ ~ ~ ~ ~South Carolina 46 46 46 45 45 45 45 45 45 45 42 44 45 44South Dakota 28 29 29 29 29 28 28 28 28 26 27 25 27 27Tennessee 97 97 96 96 96 96 95 94 94 90 89 89 95 90Texas 248 247 246 245 242 242 242 237 236 232 229 228 234 224Utah 26 26 26 26 26 26 26 26 26 26 26 25 26 24Vermont ~ ~ ~ ~ ~ ~ ~ ~ ~ ~ ~ ~ ~ ~Virginia 73 72 72 72 72 69 66 64 64 64 65 65 62 58Washington 58 58 58 57 57 56 56 56 56 56 55 55 55 55West Virginia 28 28 19 18 16 13 12 12 12 11 11 10 11 11Wisconsin 70 70 70 70 70 70 70 70 70 69 70 70 70 68Wyoming 22 22 22 22 22 22 22 22 22 22 22 23 23 23Note: Data may have been revised from previously published statistics. ~Not applicable. Prisons and jails form one integrated system. See prison tables for mortality data.*Prisons and jails form one integrated system. Includes data for 14 locally operated jails; excludes data for prisons and jails operated by the Alaska Department of Corrections.Source: Bureau of Justice Statistics, Deaths in Custody Reporting Program, 2000–2013.
Mortality in Local Jails and State Prisons, 2000–2013 - Statistical Tables | August 2015 19
TABLe 15Number of local jail jurisdictions reporting one or more deaths to the Deaths in Custody Program, by state, 2000–2013State 2000 2001 2002 2003 2004 2005 2006 2007 2008 2009 2010 2011 2012 2013
Total 435 484 485 511 518 522 539 534 501 501 501 523 538 542Alabama 15 22 20 14 16 22 25 16 15 17 24 16 17 18Alaska* 0 0 0 0 0 0 0 0 0 0 0 1 1 0Arizona 5 5 7 4 4 7 5 5 5 5 6 4 3 4Arkansas 7 10 10 16 11 4 10 7 11 4 6 13 8 11California 30 32 29 36 32 34 27 32 30 33 28 28 29 36Colorado 6 7 11 6 9 12 10 11 13 6 11 7 7 11Connecticut ~ ~ ~ ~ ~ ~ ~ ~ ~ ~ ~ ~ ~ ~Delaware ~ ~ ~ ~ ~ ~ ~ ~ ~ ~ ~ ~ ~ ~District of Columbia 1 0 1 1 1 1 1 1 1 1 1 1 1 1Florida 23 30 27 27 31 29 30 33 25 31 23 28 27 31Georgia 24 28 34 31 29 33 29 33 29 27 30 30 35 30Hawaii ~ ~ ~ ~ ~ ~ ~ ~ ~ ~ ~ ~ ~ ~Idaho 3 2 1 2 1 7 5 7 1 6 2 4 4 6Illinois 7 6 11 20 14 11 13 15 13 9 12 14 15 12Indiana 11 17 11 15 15 14 19 12 10 11 15 16 15 14Iowa 2 4 3 1 3 4 3 5 2 5 3 7 4 7Kansas 8 9 10 9 10 11 7 6 11 7 6 9 8 11Kentucky 11 10 9 13 14 12 15 17 15 16 19 15 15 10Louisiana 5 15 15 16 24 15 17 16 24 16 16 13 25 23Maine 2 2 5 3 1 1 5 1 1 2 3 5 0 1Maryland 7 9 3 10 6 9 11 6 7 10 9 11 9 9Massachusetts 3 6 7 5 5 8 8 7 8 8 8 3 5 7Michigan 12 8 13 18 15 17 15 14 12 10 12 13 12 12Minnesota 5 8 6 8 7 6 9 6 4 2 8 6 5 5Mississippi 8 11 12 15 15 13 15 13 13 11 11 12 8 10Missouri 10 10 7 14 6 9 10 17 12 16 19 10 20 15Montana 3 1 4 5 3 4 1 2 2 6 2 6 2 4Nebraska 5 5 6 2 4 2 5 2 5 3 5 4 2 6Nevada 7 8 3 4 5 6 4 5 6 6 5 5 6 7New Hampshire 3 2 5 2 2 1 3 3 2 4 1 4 2 1New Jersey 12 10 7 12 12 11 12 15 12 11 12 10 13 10New Mexico 9 7 6 5 8 4 8 10 6 4 10 12 9 8New York 12 10 17 15 12 12 12 13 9 18 11 18 14 15North Carolina 13 17 18 15 17 16 17 17 14 17 19 12 23 19North Dakota 1 1 2 2 1 0 2 1 1 2 2 1 1 5Ohio 13 14 16 19 15 17 17 19 16 16 15 18 22 21Oklahoma 10 11 7 7 6 13 12 13 9 12 13 9 12 10Oregon 4 7 4 4 7 6 7 3 9 5 5 5 3 4Pennsylvania 15 21 23 19 28 18 20 25 16 19 15 21 23 21Rhode Island ~ ~ ~ ~ ~ ~ ~ ~ ~ ~ ~ ~ ~ ~South Carolina 11 14 14 7 14 15 14 10 15 10 12 6 17 14South Dakota 4 2 1 0 1 3 1 1 2 2 0 1 0 2Tennessee 17 13 15 13 24 19 15 19 22 19 14 22 21 11Texas 50 40 40 42 47 49 49 38 37 43 41 44 40 51Utah 3 5 4 5 8 4 3 8 2 6 5 8 4 6Vermont ~ ~ ~ ~ ~ ~ ~ ~ ~ ~ ~ ~ ~ ~Virginia 21 24 22 20 17 19 22 26 27 20 17 22 20 19Washington 8 7 7 10 6 11 11 8 9 9 10 12 9 10West Virginia 2 6 2 6 5 2 5 3 5 5 4 5 8 4Wisconsin 7 8 8 10 4 8 8 12 12 9 10 11 12 8Wyoming 0 0 2 3 3 3 2 1 1 2 1 1 2 2Note: Data may have been revised from previously published statistics.~Not applicable. Prisons and jails form one integrated system. See prison tables for mortality data.*Prisons and jails form one integrated system. Includes data for 14 locally operated jails; excludes data for prisons and jails operated by the Alaska Department of Corrections.Source: Bureau of Justice Statistics, Deaths in Custody Reporting Program, 2000–2013.
Mortality in Local Jails and State Prisons, 2000–2013 - Statistical Tables | August 2015 20
TABLe 16 Number of state prisoner deaths, by cause of death, 2001–2013Cause of death Total 2001 2002 2003 2004 2005 2006 2007 2008 2009 2010 2011 2012 2013
All causes 42,157 2,869 2,933 3,152 3,123 3,168 3,233 3,389 3,450 3,417 3,234 3,353 3,357 3,479Illness 37,374 2,567 2,614 2,830 2,783 2,817 2,830 2,980 3,034 3,028 2,868 2,982 2,959 3,082
Cancer 11,223 691 681 811 733 805 806 772 905 974 927 1,028 1,024 1,066Heart disease 10,795 743 802 801 842 835 854 840 846 844 831 856 804 897Liver disease 4,063 307 297 306 283 318 303 316 317 333 286 339 304 354Respiratory disease 2,558 139 154 194 198 212 193 205 252 196 206 198 218 193AIDS-related 1,733 275 241 209 147 156 132 120 99 98 73 57 74 52All othera 7,002 412 439 509 580 491 542 727 615 583 545 504 535 520
Suicide 2,577 168 168 199 199 213 219 215 197 202 215 185 205 192Drug/alcohol intoxication 546 35 37 23 22 37 56 41 58 50 40 58 33 56Accident 411 22 29 26 34 28 32 28 26 32 32 38 50 34Homicideb 762 39 48 49 49 56 55 57 40 54 70 70 85 90Other/unknown 293 0 0 25 36 17 41 16 95 16 4 11 14 18Missing 194 38 37 0 0 0 0 52 0 35 5 9 11 7Note: Data may have been revised from previously published statistics. Excludes executions; for execution data, see Capital Punishment, 2013 - Statistical Tables (NCJ 248448, BJS web, December 2014). See Methodology for details on illnesses and homicides.aIncludes other specified illnesses, such as cerebrovascular disease, influenza, and other nonleading natural causes of death, as well as unspecified illnesses. bIncludes homicides committed by other inmates, incidental to the staff use of force, and resulting from assaults sustained prior to incarceration. Source: Bureau of Justice Statistics, Deaths in Custody Reporting Program, 2001–2013.
TABLe 17 Percent of state prisoner deaths, by cause of death, 2001–2013Cause of death 2001 2002 2003 2004 2005 2006 2007 2008 2009 2010 2011 2012 2013
All causes 100% 100% 100% 100% 100% 100% 100% 100% 100% 100% 100% 100% 100%Illness 89.5% 89.1% 89.8% 89.1% 88.9% 87.5% 87.9% 87.9% 88.6% 88.7% 88.9% 88.1% 88.6%
Cancer 24.1 23.2 25.7 23.5 25.4 24.9 22.8 26.2 28.5 28.7 30.7 30.5 30.6Heart disease 25.9 27.3 25.4 27.0 26.4 26.4 24.8 24.5 24.7 25.7 25.5 23.9 25.8Liver disease 10.7 10.1 9.7 9.1 10.0 9.4 9.3 9.2 9.7 8.8 10.1 9.1 10.2Respiratory disease 4.8 5.3 6.2 6.3 6.7 6.0 6.0 7.3 5.7 6.4 5.9 6.5 5.5AIDS-related 9.6 8.2 6.6 4.7 4.9 4.1 3.5 2.9 2.9 2.3 1.7 2.2 1.5All othera 14.4 15.0 16.1 18.6 15.5 16.8 21.5 17.8 17.1 16.9 15.0 15.9 14.9
Suicide 5.9% 5.7% 6.3% 6.4% 6.7% 6.8% 6.3% 5.7% 5.9% 6.6% 5.5% 6.1% 5.5%Drug/alcohol intoxication 1.2% 1.3% 0.7% 0.7% 1.2% 1.7% 1.2% 1.7% 1.5% 1.2% 1.7% 1.0% 1.6%Accident 0.8% 1.0% 0.8% 1.1% 0.9% 1.0% 0.8% 0.8% 0.9% 1.0% 1.1% 1.5% 1.0%Homicideb 1.4% 1.6% 1.6% 1.6% 1.8% 1.7% 1.7% 1.2% 1.6% 2.2% 2.1% 2.5% 2.6%Other/unknown 0.0% 0.0% 0.8% 1.2% 0.5% 1.3% 0.5% 2.8% 0.5% 0.1% 0.3% 0.4% 0.5%Missing 1.3% 1.3% 0.0% 0.0% 0.0% 0.0% 1.5% 0.0% 1.0% 0.2% 0.3% 0.3% 0.2%Note: Data may have been revised from previously published statistics. Excludes executions; for execution data, see Capital Punishment, 2013 - Statistical Tables (NCJ 248448, BJS web, December 2014). See Methodology for details on illnesses and homicides.aIncludes other specified illnesses, such as cerebrovascular disease, influenza, and other nonleading natural causes of death, as well as unspecified illnesses. bIncludes homicides committed by other inmates, incidental to the staff use of force, and resulting from assaults sustained prior to incarceration. Source: Bureau of Justice Statistics, Deaths in Custody Reporting Program, 2001–2013.
Mortality in Local Jails and State Prisons, 2000–2013 - Statistical Tables | August 2015 21
TABLe 18 Mortality rate per 100,000 state prisoners, by cause of death, 2001–2013Cause of death 2001 2002 2003 2004 2005 2006 2007 2008 2009 2010 2011 2012 2013
All causes 242 244 257 252 253 249 256 260 258 245 260 265 274Illness 216 218 231 224 225 218 225 229 228 217 231 234 243
Cancer 58 57 66 59 64 62 58 68 73 70 80 81 84Heart disease 63 67 65 68 67 66 64 64 64 63 66 63 71Liver disease 26 25 25 23 25 23 24 24 25 22 26 24 28Respiratory disease 12 13 16 16 17 15 16 19 15 16 15 17 15AIDS-related 23 20 17 12 12 10 9 7 7 6 4 6 4All othera 35 37 42 47 39 42 55 46 44 41 39 42 41
Suicide 14 14 16 16 17 17 16 15 15 16 14 16 15Drug/alcohol intoxication 3 3 2 2 3 4 3 4 4 3 4 3 4Accident 2 2 2 3 2 2 2 2 2 2 3 4 3Homicideb 3 4 4 4 4 4 4 3 4 5 5 7 7Other/unknown 0 0 2 3 1 3 1 7 1 -- ! 1 ! 1 1Missing 3 3 0 0 0 0 4 0 3 -- ! 1 ! 1 ! 1 !Note: Data may have been revised from previously published statistics. Excludes executions; for execution data, see Capital Punishment, 2013 - Statistical Tables (NCJ 248448, BJS web, December 2014). See Methodology for details on rates, illnesses, and homicides.--Less than 0.5.! Interpret with caution; too few cases to provide a reliable rate. aIncludes other specified illnesses, such as cerebrovascular disease, influenza, and other nonleading natural causes of death, as well as unspecified illnesses.bIncludes homicides committed by other inmates, incidental to the staff use of force, and resulting from assaults sustained prior to incarceration. Sources: Bureau of Justice Statistics, Deaths in Custody Reporting Program, 2001–2013; and National Prisoner Statistics, 2001–2013.
TABLe 19 Number of state prisoner deaths, by selected decedent characteristics, 2001–2013Characteristic 2001 2002 2003 2004 2005 2006 2007 2008 2009 2010 2011 2012 2013
Total 2,869 2,933 3,152 3,123 3,168 3,233 3,389 3,450 3,417 3,234 3,353 3,357 3,479Sex
Male 2,769 2,814 3,024 2,987 3,025 3,103 3,252 3,287 3,267 3,117 3,210 3,244 3,338Female 100 119 126 136 143 130 137 163 150 117 143 113 141
Race/Hispanic origina
White 1,340 1,400 1,591 1,546 1,623 1,627 1,718 1,821 1,774 1,680 1,912 1,789 1,902Black/African American 1,161 1,151 1,200 1,179 1,162 1,148 1,225 1,157 1,199 1,122 1,039 1,113 1,104Hispanic/Latinob 322 332 308 332 324 404 383 399 372 359 329 379 402Otherc 46 44 44 65 54 50 54 73 58 61 61 70 70
Age17 or younger 2 1 3 1 1 1 1 3 0 3 2 0 018–24 86 62 57 81 78 60 68 67 69 69 50 69 6825–34 256 248 277 255 243 250 226 222 210 217 201 190 21935–44 656 661 666 619 599 561 513 468 467 382 397 360 33445–54 893 908 980 963 1,009 1,061 1,031 1,063 1,039 957 930 876 85755 or older 971 1,053 1,164 1,202 1,238 1,300 1,550 1,627 1,631 1,606 1,770 1,862 1,966
Note: Data may have been revised from previously published statistics. Detail may not sum to total due to missing data. Excludes executions; for execution data, see Capital Punishment, 2013 - Statistical Tables (NCJ 248448, BJS web, December 2014). aExcludes persons of Hispanic or Latino origin, unless specified. bIn 2013, the survey separated Hispanic origin from race. Comparisons with previous years should not be made. See Methodology.cIncludes American Indians or Alaska Natives, Asians, Native Hawaiians, or other Pacific Islanders, and persons identifying two or more races.Source: Bureau of Justice Statistics, Deaths in Custody Reporting Program, 2001–2013.
Mortality in Local Jails and State Prisons, 2000–2013 - Statistical Tables | August 2015 22
TABLe 20 Percent of state prisoner deaths, by selected decedent characteristics, 2001–2013Characteristic 2001 2002 2003 2004 2005 2006 2007 2008 2009 2010 2011 2012 2013
Total 100% 100% 100% 100% 100% 100% 100% 100% 100% 100% 100% 100% 100%Sex
Male 96.5% 95.9% 96.0% 95.6% 95.5% 96.0% 96.0% 95.3% 95.6% 96.4% 95.7% 96.6% 95.9%Female 3.5 4.1 4.0 4.4 4.5 4.0 4.0 4.7 4.4 3.6 4.3 3.4 4.1
Race/Hispanic origina
White 46.7% 47.8% 50.6% 49.5% 51.3% 50.4% 50.8% 52.8% 52.1% 52.1% 57.2% 53.4% 54.7%Black/African American 40.5 39.3 38.2 37.8 36.7 35.6 36.2 33.5 35.2 34.8 31.1 33.2 31.7Hispanic/Latinob 11.2 11.3 9.8 10.6 10.2 12.5 11.3 11.6 10.9 11.1 9.8 11.3 11.6Otherc 1.6 1.5 1.4 2.1 1.7 1.5 1.6 2.1 1.7 1.9 1.8 2.1 2.0
Age17 or younger 0.1% -- 0.1% -- -- -- -- 0.1% 0.0% 0.1% 0.1% 0.0% 0.0%18–24 3.0 2.1% 1.8 2.6% 2.5% 1.9% 2.0% 1.9 2.0 2.1 1.5 2.1 2.025–34 8.9 8.5 8.8 8.2 7.7 7.7 6.7 6.4 6.1 6.7 6.0 5.7 6.335–44 22.9 22.5 21.2 19.8 18.9 17.4 15.1 13.6 13.7 11.8 11.9 10.7 9.645–54 31.2 31.0 31.1 30.9 31.8 32.8 30.4 30.8 30.4 29.6 27.8 26.1 24.655 or older 33.9 35.9 37.0 38.5 39.1 40.2 45.7 47.2 47.7 49.7 52.8 55.6 56.5
Note: Data may have been revised from previously published statistics. Detail may not sum to total due to missing data. Excludes executions; for executions data, see Capital Punishment, 2013 - Statistical Tables (NCJ 248448, BJS web, December 2014). --Less than 0.05%.aExcludes persons of Hispanic or Latino origin, unless specified. bIn 2013, the survey separated Hispanic origin from race. Comparisons with previous years should not be made. See Methodology.cIncludes American Indians or Alaska Natives, Asians, Native Hawaiians, or other Pacific Islanders, and persons identifying two or more races.Source: Bureau of Justice Statistics, Deaths in Custody Reporting Program, 2001–2013.
TABLe 21Mortality rate per 100,000 state prisoners, by selected decedent characteristics, 2001–2013Characteristic 2001 2002 2003 2004 2005 2006 2007 2008 2009 2010 2011 2012 2013
Total 242 244 257 252 253 249 256 260 258 245 260 265 274Sex
Male 249 251 265 259 260 257 265 267 265 254 267 275 282Female 129 151 153 162 164 141 145 172 160 127 160 131 159
Race/Hispanic origina
White 315 323 347 341 351 343 358 375 367 350 431 407 425Black/African American 219 219 229 227 225 219 231 216 225 213 211 231 229Hispanic/Latinob 201 200 181 184 177 213 195 213 195 184 120 142 153Otherc 168 151 147 211 171 148 156 211 161 171 75 89 89
Age17 or younger 70 ! 33 ! 122 ! 40 ! 40 ! 36 ! 38 ! 122 ! 0 127 ! 87 ! 0 018–24 39 29 26 37 35 26 29 35 36 36 26 37 3925–34 63 62 68 62 58 58 51 51 48 51 47 46 5335–44 181 182 183 168 161 146 131 120 119 112 121 113 10445–54 583 554 555 539 559 572 543 458 448 374 383 364 35355 or older 2,029 2,004 2,021 2,063 2,103 2,154 2,500 2,091 2,097 1,528 1,770 1,711 1,669
Note: Data may have been revised from previously published statistics. Detail may not sum to total due to missing data. Excludes executions; for execution data, see Capital Punishment, 2013 - Statistical Tables (NCJ 248448, BJS web, December 2014). ! Interpret with caution; too few cases to provide a reliable rate. aExcludes persons of Hispanic or Latino origin, unless specified.bIn 2013, the survey separated Hispanic origin from race. Comparisons with previous years should not be made.cIncludes American Indians or Alaska Natives, Asians, Native Hawaiians, or other Pacific Islanders, and persons identifying two or more races.Sources: Bureau of Justice Statistics, Deaths in Custody Reporting Program, 2001–2013; National Prisoner Statistics, 2001–2013; and Survey of Inmates in State Correctional Facilities, 2004.
Mortality in Local Jails and State Prisons, 2000–2013 - Statistical Tables | August 2015 23
TABLe 22Estimated number of state and federal prisoners in custody, by selected inmate characteristics, 2001–2013Characteristic 2001 2002 2003 2004 2005 2006 2007 2008 2009 2010 2011 2012 2013
Total 1,187,800 1,199,900 1,225,700 1,239,700 1,252,400 1,297,200 1,321,700 1,327,000 1,326,500 1,320,600 1,290,200 1,267,000 1,270,807Sex
Male 1,110,400 1,121,300 1,143,100 1,155,500 1,165,300 1,205,100 1,227,200 1,232,100 1,232,500 1,228,400 1,201,100 1,180,600 1,181,931Female 77,400 78,700 82,600 84,200 87,100 92,200 94,500 94,900 94,000 92,200 89,100 86,400 88,876
Race/Hispanic origina
White 425,100 433,800 458,900 453,500 462,800 475,000 479,700 485,800 482,900 480,400 443,800 439,700 447,446Black/African American 530,900 524,500 523,400 519,000 517,500 523,300 531,100 536,900 532,600 528,000 491,400 481,700 481,761Hispanic/Latinob 160,600 165,900 169,900 180,000 183,200 189,900 196,100 187,000 191,200 195,000 274,200 266,900 262,787Otherc 27,400 29,000 30,000 30,900 31,600 33,700 34,600 34,600 36,100 35,600 80,800 78,800 78,814
Age17 or younger 2,900 3,000 2,500 2,500 2,500 2,800 2,600 2,500 2,500 2,400 2,300 2,400 2,86618–24 217,800 216,800 215,700 218,200 220,400 227,500 232,200 189,100 189,100 189,500 193,100 185,200 172,33025–34 403,200 400,900 408,100 412,800 418,300 429,500 440,600 434,000 433,800 427,800 424,200 412,400 413,99635–44 362,900 362,900 364,000 368,200 372,000 384,500 391,800 391,500 391,400 339,900 327,800 317,300 321,09245–54 153,100 163,800 176,500 178,500 180,400 185,600 190,000 232,100 232,000 255,900 242,800 240,900 242,71855 or older 47,900 52,600 57,600 58,300 58,900 60,400 62,000 77,800 77,800 105,100 100,000 108,900 117,805
Note: Data rounded to the nearest 100. Data may have been revised from previously published statistics. Data are from the Prisoners at Midyear series for 2001 to 2010 and from the Prisoners at Yearend series for 2011 to 2013. aExcludes persons of Hispanic or Latino origin, unless specified. bIn 2013, the survey separated Hispanic origin from race. Comparisons with previous years should not be made. See Methodology.cIncludes American Indians or Alaska Natives, Asians, Native Hawaiians, or other Pacific Islanders, and persons identifying two or more races.Sources: Bureau of Justice Statistics, Deaths in Custody Reporting Program, 2001–2013; and National Prisoner Statistics, 2001–2013.
TABLe 23 Number of state prisoner deaths, by cause of death and selected decedent characteristics, 2001–2013
Illness
Characteristic All causes CancerHeart disease
Liver disease
Respiratory disease
AIDS-related All othera Suicide
Drug/alcohol intoxication Accident Homicideb
Total 42,157 11,223 10,795 4,063 2,558 1,733 7,002 2,577 546 411 762Sex
Male 40,437 10,816 10,434 3,926 2,420 1,645 6,614 2,446 519 396 758Female 1,718 407 361 137 138 88 388 130 27 15 4
Race/Hispanic originc
White 21,723 6,161 5,690 2,217 1,436 372 3,223 1,512 310 232 345Black/African American 14,960 3,943 4,074 941 855 1,154 2,773 525 97 117 265Hispanic/Latinod 4,645 921 871 796 232 191 882 423 116 49 130Othere 750 175 147 100 31 15 110 107 23 12 20
Age17 or younger 18 2 1 1 1 0 1 10 0 1 118–24 884 57 110 8 56 17 116 343 36 32 9225–34 3,014 272 510 70 166 222 431 838 149 75 21535–44 6,683 1,106 1,564 549 313 706 1,109 738 193 100 20545–54 12,565 3,377 2,935 1,946 588 592 2,159 461 129 96 15355 or older 18,938 6,396 5,662 1,481 1,430 196 3,176 184 39 107 95
Note: Data may have been revised from previously published statistics. Detail may not sum to total due to missing data. Mortality rates are based on the average daily population. See Methodology for details on rates, illnesses, Hispanic origin, homicides, and probation or parole violations.aIncludes other specified illnesses, such as cerebrovascular disease, influenza, and other nonleading natural causes of death, as well as unspecified illnesses.bIncludes homicides committed by other inmates, incidental to the staff use of force, and resulting from assaults sustained prior to incarceration. cExcludes persons of Hispanic or Latino origin, unless specified. dIn 2013, the survey separated Hispanic origin from race. Comparisons with previous years should not be made. eIncludes American Indians or Alaska Natives, Asians, Native Hawaiians, or other Pacific Islanders, and persons identifying two or more races.Source: Bureau of Justice Statistics, Deaths in Custody Reporting Program, 2001–2013.
Mortality in Local Jails and State Prisons, 2000–2013 - Statistical Tables | August 2015 24
TABLe 24 Average annual mortality rate per 100,000 state prisoners, by cause of death and selected decedent characteristics, 2001–2013
Illness
Characteristic All causes CancerHeart disease
Liver disease
Respiratory disease
AIDS-related All othera Suicide
Drug/alcohol intoxication Accident Homicideb
Total 255 68 65 25 15 10 42 16 3 2 5 Sex
Male 263 70 68 26 16 11 43 16 3 3 5 Female 150 36 32 12 12 8 34 11 2 1 -- !
Race/Hispanic originc White 364 103 95 37 24 6 54 25 5 4 6 Black/African American 223 59 61 14 13 17 41 8 1 2 4 Hispanic/Latinod 177 35 33 30 9 7 34 16 4 2 5 Othere 134 31 26 18 6 3 20 19 4 2 4
Age 17 or younger 53 6 ! 3 ! 3 ! 3 ! 0 3 ! 30 ! 0 3 ! 3 !18–24 33 2 4 -- ! 2 1 4 13 1 1 3 25–34 55 5 9 1 3 4 8 15 3 1 4 35–44 142 24 33 12 7 15 24 16 4 2 4 45–54 470 126 110 73 22 22 81 17 5 4 6 55 or older 1,922 649 575 150 145 20 322 19 4 11 10
Note: Data may have been revised from previously published statistics. Detail may not sum to total due to missing data. Mortality rates are based on the average daily population. See Methodology for details on rates, illnesses, homicides, and Hispanic origin.--Less than 0.5.! Interpret with caution; too few cases to provide a reliable rate. aIncludes other specified illnesses, such as cerebrovascular disease, influenza, and other nonleading natural causes of death, as well as unspecified illnesses. bIncludes homicides committed by other inmates, incidental to the staff use of force, and resulting from assaults sustained prior to incarceration.cExcludes persons of Hispanic or Latino origin, unless specified. dIn 2013, the survey separated Hispanic origin from race. Comparisons with previous years should not be made. eIncludes American Indians or Alaska Natives, Asians, Native Hawaiians, or other Pacific Islanders, and persons identifying two or more races.Sources: Bureau of Justice Statistics, Deaths in Custody Reporting Program, 2001–2013; National Inmate Survey, 2007, 2008–2009, and 2011–2012; and National Prisoner Statistics, 2001–2013.
Mortality in Local Jails and State Prisons, 2000–2013 - Statistical Tables | August 2015 25
TABLe 25 Number of state and federal prisoner deaths, by location, 2001–2013Location 2001 2002 2003 2004 2005 2006 2007 2008 2009 2010 2011 2012 2013Federal 301 335 346 333 388 328 368 399 376 387 387 350 400Statea 2,869 2,933 3,152 3,123 3,168 3,233 3,389 3,450 3,417 3,234 3,353 3,357 3,479
Alabama 87 85 92 65 66 61 54 75 80 66 104 86 107Alaskab 8 14 4 8 4 6 10 14 7 13 12 11 8Arizona 64 72 84 66 78 72 61 77 85 85 86 87 95Arkansas 42 31 39 34 38 37 46 41 50 54 50 43 56California 287 337 333 348 366 424 395 369 395 414 388 368 366Colorado 42 51 47 39 54 31 42 38 49 48 37 48 40Connecticutb 30 30 36 33 40 25 27 32 29 21 19 24 20Delawareb 16 15 19 13 19 13 15 15 12 23 15 10 14Florida 182 183 221 226 244 261 249 291 278 275 297 324 305Georgia 93 102 126 90 122 103 143 128 125 112 123 103 122Hawaiib 7 13 8 8 8 5 13 14 11 12 6 12 14Idaho 17 9 12 12 13 18 14 18 13 13 13 9 10Illinois 86 72 80 97 72 94 104 71 75 94 97 85 78Indiana 46 49 56 56 45 70 54 70 91 69 74 59 66Iowa 9 11 13 15 19 12 17 21 14 13 12 20 16Kansas 21 22 32 30 19 16 20 24 20 22 25 17 28Kentucky 36 41 45 42 43 46 46 68 57 42 60 55 40Louisiana 71 78 70 94 89 72 82 117 108 100 108 116 118Maine 6 7 2 4 0 6 1 2 4 3 5 2 3Maryland 70 71 67 78 57 61 57 69 56 40 41 46 58Massachusetts 29 20 30 25 37 39 39 29 29 39 33 42 39Michigan 114 113 127 138 140 138 117 99 148 93 119 124 124Minnesota 13 15 13 6 13 9 13 17 12 16 19 14 20Mississippi 36 33 58 51 61 58 77 54 52 52 47 41 68Missouri 57 65 65 77 68 66 78 87 81 88 74 71 92Montana 6 5 12 12 12 5 5 9 3 2 6 11 7Nebraska 7 8 7 7 8 8 12 6 11 12 17 11 16Nevada 27 25 24 31 28 23 39 35 35 41 34 37 35New Hampshire 2 9 6 6 8 6 6 5 9 4 10 5 8New Jersey 69 60 47 57 60 70 60 66 58 56 66 48 46New Mexico 11 15 11 16 18 13 22 29 21 16 16 14 17New York 175 185 198 153 170 131 148 133 142 124 117 115 142North Carolina 66 59 74 94 69 90 99 117 86 87 71 79 81North Dakota 3 1 1 1 1 1 0 0 0 1 1 3 1Ohio 115 113 91 126 121 106 123 101 120 116 111 126 124Oklahoma 51 64 71 53 74 80 98 88 79 60 85 79 87Oregon 24 33 25 34 37 40 36 31 34 39 40 26 30Pennsylvania 122 126 147 161 149 124 150 145 165 141 157 157 157Rhode Islandb 3 8 8 7 2 8 9 6 7 7 10 6 4South Carolina 69 45 63 50 75 65 72 83 49 70 55 58 66South Dakota 4 11 11 5 4 4 8 6 4 8 11 9 6Tennessee 51 61 97 71 76 84 73 74 69 74 59 84 82Texas 408 396 383 395 351 443 435 469 426 375 417 462 438Utah 5 9 10 11 8 7 7 11 17 13 12 15 23Vermontb 3 2 5 1 6 7 1 3 3 5 0 2 8Virginia 71 69 93 86 84 78 103 86 87 94 99 86 82Washington 29 30 31 36 45 36 39 35 44 35 21 33 39West Virginia 17 8 15 13 10 13 19 19 18 20 23 24 26Wisconsin 48 49 41 40 29 45 43 44 42 25 48 46 43Wyoming 5 3 2 2 8 3 8 9 7 2 3 4 4
Note: Data may have been revised from previously published statistics. Excludes executions; for execution data, see Capital Punishment, 2013 - Statistical Tables (NCJ 248448, BJS web, December 2014). aIncludes 9 prisoner deaths reported by the District of Columbia in 2001. As of December 30, 2001, sentenced felons from the District of Columbia were the responsibility of the Federal Bureau of Prisons. bPrisons and jails form one integrated system. Data include total jail and prison population.Sources: Bureau of Justice Statistics, Deaths in Custody Reporting Program, 2001–2013; National Prisoner Statistics, 2001–2006; and Federal Bureau of Prisons, 2007–2013.
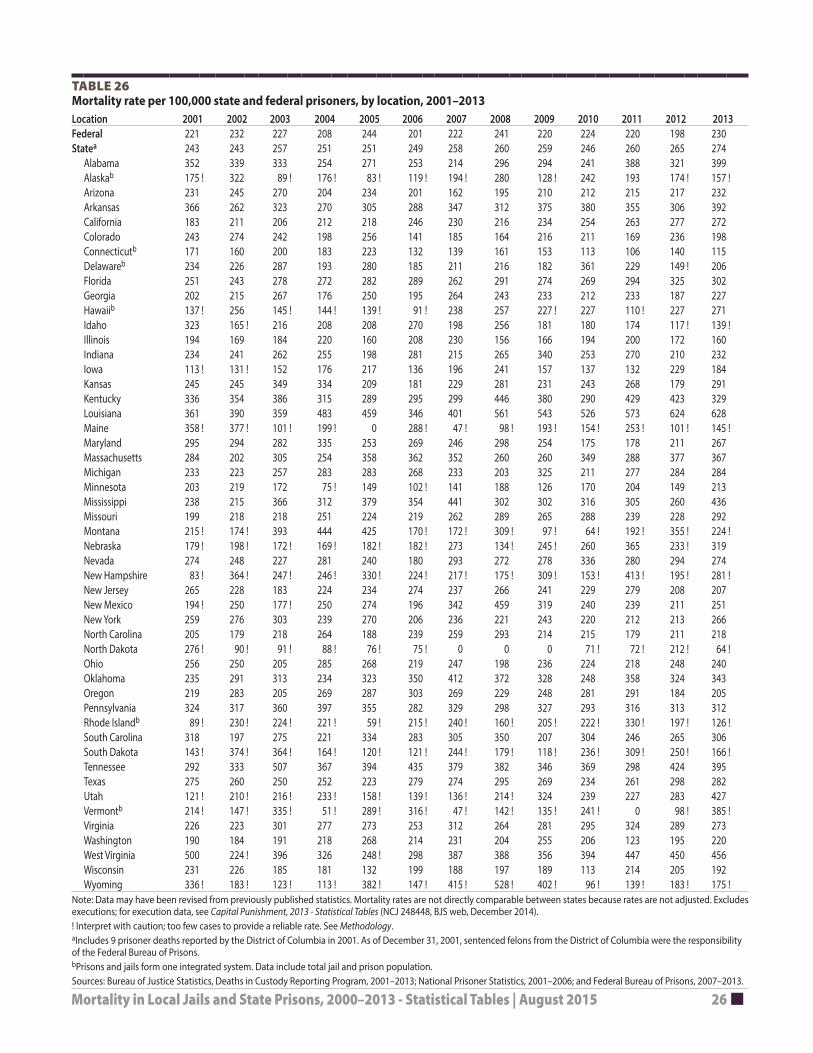
TABLe 26 Mortality rate per 100,000 state and federal prisoners, by location, 2001–2013Location 2001 2002 2003 2004 2005 2006 2007 2008 2009 2010 2011 2012 2013Federal 221 232 227 208 244 201 222 241 220 224 220 198 230Statea 243 243 257 251 251 249 258 260 259 246 260 265 274
Alabama 352 339 333 254 271 253 214 296 294 241 388 321 399Alaskab 175 ! 322 89 ! 176 ! 83 ! 119 ! 194 ! 280 128 ! 242 193 174 ! 157 !Arizona 231 245 270 204 234 201 162 195 210 212 215 217 232Arkansas 366 262 323 270 305 288 347 312 375 380 355 306 392California 183 211 206 212 218 246 230 216 234 254 263 277 272Colorado 243 274 242 198 256 141 185 164 216 211 169 236 198Connecticutb 171 160 200 183 223 132 139 161 153 113 106 140 115Delawareb 234 226 287 193 280 185 211 216 182 361 229 149 ! 206Florida 251 243 278 272 282 289 262 291 274 269 294 325 302Georgia 202 215 267 176 250 195 264 243 233 212 233 187 227Hawaiib 137 ! 256 145 ! 144 ! 139 ! 91 ! 238 257 227 ! 227 110 ! 227 271Idaho 323 165 ! 216 208 208 270 198 256 181 180 174 117 ! 139 !Illinois 194 169 184 220 160 208 230 156 166 194 200 172 160Indiana 234 241 262 255 198 281 215 265 340 253 270 210 232Iowa 113 ! 131 ! 152 176 217 136 196 241 157 137 132 229 184Kansas 245 245 349 334 209 181 229 281 231 243 268 179 291Kentucky 336 354 386 315 289 295 299 446 380 290 429 423 329Louisiana 361 390 359 483 459 346 401 561 543 526 573 624 628Maine 358 ! 377 ! 101 ! 199 ! 0 288 ! 47 ! 98 ! 193 ! 154 ! 253 ! 101 ! 145 !Maryland 295 294 282 335 253 269 246 298 254 175 178 211 267Massachusetts 284 202 305 254 358 362 352 260 260 349 288 377 367Michigan 233 223 257 283 283 268 233 203 325 211 277 284 284Minnesota 203 219 172 75 ! 149 102 ! 141 188 126 170 204 149 213Mississippi 238 215 366 312 379 354 441 302 302 316 305 260 436Missouri 199 218 218 251 224 219 262 289 265 288 239 228 292Montana 215 ! 174 ! 393 444 425 170 ! 172 ! 309 ! 97 ! 64 ! 192 ! 355 ! 224 !Nebraska 179 ! 198 ! 172 ! 169 ! 182 ! 182 ! 273 134 ! 245 ! 260 365 233 ! 319Nevada 274 248 227 281 240 180 293 272 278 336 280 294 274New Hampshire 83 ! 364 ! 247 ! 246 ! 330 ! 224 ! 217 ! 175 ! 309 ! 153 ! 413 ! 195 ! 281 !New Jersey 265 228 183 224 234 274 237 266 241 229 279 208 207New Mexico 194 ! 250 177 ! 250 274 196 342 459 319 240 239 211 251New York 259 276 303 239 270 206 236 221 243 220 212 213 266North Carolina 205 179 218 264 188 239 259 293 214 215 179 211 218North Dakota 276 ! 90 ! 91 ! 88 ! 76 ! 75 ! 0 0 0 71 ! 72 ! 212 ! 64 !Ohio 256 250 205 285 268 219 247 198 236 224 218 248 240Oklahoma 235 291 313 234 323 350 412 372 328 248 358 324 343Oregon 219 283 205 269 287 303 269 229 248 281 291 184 205Pennsylvania 324 317 360 397 355 282 329 298 327 293 316 313 312Rhode Islandb 89 ! 230 ! 224 ! 221 ! 59 ! 215 ! 240 ! 160 ! 205 ! 222 ! 330 ! 197 ! 126 !South Carolina 318 197 275 221 334 283 305 350 207 304 246 265 306South Dakota 143 ! 374 ! 364 ! 164 ! 120 ! 121 ! 244 ! 179 ! 118 ! 236 ! 309 ! 250 ! 166 !Tennessee 292 333 507 367 394 435 379 382 346 369 298 424 395Texas 275 260 250 252 223 279 274 295 269 234 261 298 282Utah 121 ! 210 ! 216 ! 233 ! 158 ! 139 ! 136 ! 214 ! 324 239 227 283 427Vermontb 214 ! 147 ! 335 ! 51 ! 289 ! 316 ! 47 ! 142 ! 135 ! 241 ! 0 98 ! 385 !Virginia 226 223 301 277 273 253 312 264 281 295 324 289 273Washington 190 184 191 218 268 214 231 204 255 206 123 195 220West Virginia 500 224 ! 396 326 248 ! 298 387 388 356 394 447 450 456Wisconsin 231 226 185 181 132 199 188 197 189 113 214 205 192Wyoming 336 ! 183 ! 123 ! 113 ! 382 ! 147 ! 415 ! 528 ! 402 ! 96 ! 139 ! 183 ! 175 !
Note: Data may have been revised from previously published statistics. Mortality rates are not directly comparable between states because rates are not adjusted. Excludes executions; for execution data, see Capital Punishment, 2013 - Statistical Tables (NCJ 248448, BJS web, December 2014). ! Interpret with caution; too few cases to provide a reliable rate. See Methodology. aIncludes 9 prisoner deaths reported by the District of Columbia in 2001. As of December 31, 2001, sentenced felons from the District of Columbia were the responsibility of the Federal Bureau of Prisons. bPrisons and jails form one integrated system. Data include total jail and prison population.Sources: Bureau of Justice Statistics, Deaths in Custody Reporting Program, 2001–2013; National Prisoner Statistics, 2001–2006; and Federal Bureau of Prisons, 2007–2013.
Mortality in Local Jails and State Prisons, 2000–2013 - Statistical Tables | August 2015 26
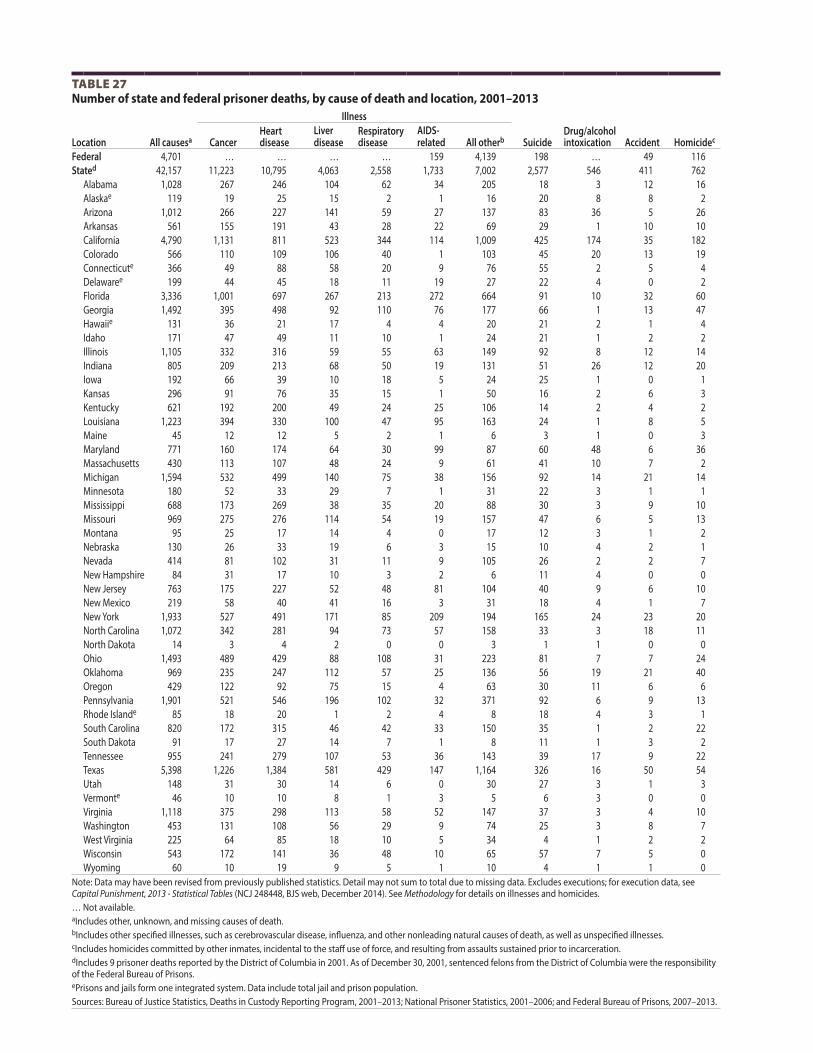
TABLe 27 Number of state and federal prisoner deaths, by cause of death and location, 2001–2013
Illness
Location All causesa CancerHeart disease
Liver disease
Respiratory disease
AIDS- related All otherb Suicide
Drug/alcohol intoxication Accident Homicidec
Federal 4,701 … … … … 159 4,139 198 … 49 116Stated 42,157 11,223 10,795 4,063 2,558 1,733 7,002 2,577 546 411 762
Alabama 1,028 267 246 104 62 34 205 18 3 12 16Alaskae 119 19 25 15 2 1 16 20 8 8 2Arizona 1,012 266 227 141 59 27 137 83 36 5 26Arkansas 561 155 191 43 28 22 69 29 1 10 10California 4,790 1,131 811 523 344 114 1,009 425 174 35 182Colorado 566 110 109 106 40 1 103 45 20 13 19Connecticute 366 49 88 58 20 9 76 55 2 5 4Delawaree 199 44 45 18 11 19 27 22 4 0 2Florida 3,336 1,001 697 267 213 272 664 91 10 32 60Georgia 1,492 395 498 92 110 76 177 66 1 13 47Hawaiie 131 36 21 17 4 4 20 21 2 1 4Idaho 171 47 49 11 10 1 24 21 1 2 2Illinois 1,105 332 316 59 55 63 149 92 8 12 14Indiana 805 209 213 68 50 19 131 51 26 12 20Iowa 192 66 39 10 18 5 24 25 1 0 1Kansas 296 91 76 35 15 1 50 16 2 6 3Kentucky 621 192 200 49 24 25 106 14 2 4 2Louisiana 1,223 394 330 100 47 95 163 24 1 8 5Maine 45 12 12 5 2 1 6 3 1 0 3Maryland 771 160 174 64 30 99 87 60 48 6 36Massachusetts 430 113 107 48 24 9 61 41 10 7 2Michigan 1,594 532 499 140 75 38 156 92 14 21 14Minnesota 180 52 33 29 7 1 31 22 3 1 1Mississippi 688 173 269 38 35 20 88 30 3 9 10Missouri 969 275 276 114 54 19 157 47 6 5 13Montana 95 25 17 14 4 0 17 12 3 1 2Nebraska 130 26 33 19 6 3 15 10 4 2 1Nevada 414 81 102 31 11 9 105 26 2 2 7New Hampshire 84 31 17 10 3 2 6 11 4 0 0New Jersey 763 175 227 52 48 81 104 40 9 6 10New Mexico 219 58 40 41 16 3 31 18 4 1 7New York 1,933 527 491 171 85 209 194 165 24 23 20North Carolina 1,072 342 281 94 73 57 158 33 3 18 11North Dakota 14 3 4 2 0 0 3 1 1 0 0Ohio 1,493 489 429 88 108 31 223 81 7 7 24Oklahoma 969 235 247 112 57 25 136 56 19 21 40Oregon 429 122 92 75 15 4 63 30 11 6 6Pennsylvania 1,901 521 546 196 102 32 371 92 6 9 13Rhode Islande 85 18 20 1 2 4 8 18 4 3 1South Carolina 820 172 315 46 42 33 150 35 1 2 22South Dakota 91 17 27 14 7 1 8 11 1 3 2Tennessee 955 241 279 107 53 36 143 39 17 9 22Texas 5,398 1,226 1,384 581 429 147 1,164 326 16 50 54Utah 148 31 30 14 6 0 30 27 3 1 3Vermonte 46 10 10 8 1 3 5 6 3 0 0Virginia 1,118 375 298 113 58 52 147 37 3 4 10Washington 453 131 108 56 29 9 74 25 3 8 7West Virginia 225 64 85 18 10 5 34 4 1 2 2Wisconsin 543 172 141 36 48 10 65 57 7 5 0Wyoming 60 10 19 9 5 1 10 4 1 1 0
Note: Data may have been revised from previously published statistics. Detail may not sum to total due to missing data. Excludes executions; for execution data, see Capital Punishment, 2013 - Statistical Tables (NCJ 248448, BJS web, December 2014). See Methodology for details on illnesses and homicides.… Not available.aIncludes other, unknown, and missing causes of death.bIncludes other specified illnesses, such as cerebrovascular disease, influenza, and other nonleading natural causes of death, as well as unspecified illnesses. cIncludes homicides committed by other inmates, incidental to the staff use of force, and resulting from assaults sustained prior to incarceration.dIncludes 9 prisoner deaths reported by the District of Columbia in 2001. As of December 30, 2001, sentenced felons from the District of Columbia were the responsibility of the Federal Bureau of Prisons.ePrisons and jails form one integrated system. Data include total jail and prison population.Sources: Bureau of Justice Statistics, Deaths in Custody Reporting Program, 2001–2013; National Prisoner Statistics, 2001–2006; and Federal Bureau of Prisons, 2007–2013.
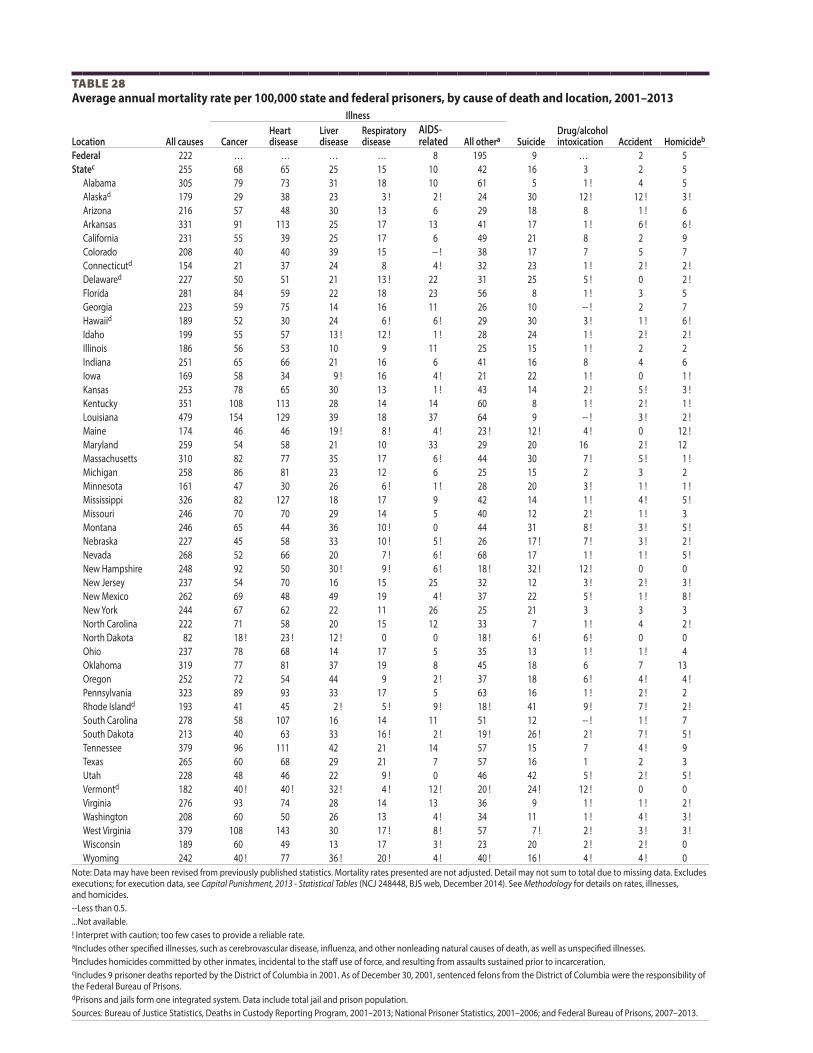
TABLe 28 Average annual mortality rate per 100,000 state and federal prisoners, by cause of death and location, 2001–2013
Illness
Location All causes CancerHeart disease
Liver disease
Respiratory disease
AIDS- related All othera Suicide
Drug/alcohol intoxication Accident Homicideb
Federal 222 … … … … 8 195 9 … 2 5Statec 255 68 65 25 15 10 42 16 3 2 5
Alabama 305 79 73 31 18 10 61 5 1 ! 4 5Alaskad 179 29 38 23 3 ! 2 ! 24 30 12 ! 12 ! 3 !Arizona 216 57 48 30 13 6 29 18 8 1 ! 6Arkansas 331 91 113 25 17 13 41 17 1 ! 6 ! 6 !California 231 55 39 25 17 6 49 21 8 2 9Colorado 208 40 40 39 15 -- ! 38 17 7 5 7Connecticutd 154 21 37 24 8 4 ! 32 23 1 ! 2 ! 2 !Delawared 227 50 51 21 13 ! 22 31 25 5 ! 0 2 !Florida 281 84 59 22 18 23 56 8 1 ! 3 5Georgia 223 59 75 14 16 11 26 10 -- ! 2 7Hawaiid 189 52 30 24 6 ! 6 ! 29 30 3 ! 1 ! 6 !Idaho 199 55 57 13 ! 12 ! 1 ! 28 24 1 ! 2 ! 2 !Illinois 186 56 53 10 9 11 25 15 1 ! 2 2Indiana 251 65 66 21 16 6 41 16 8 4 6Iowa 169 58 34 9 ! 16 4 ! 21 22 1 ! 0 1 !Kansas 253 78 65 30 13 1 ! 43 14 2 ! 5 ! 3 !Kentucky 351 108 113 28 14 14 60 8 1 ! 2 ! 1 !Louisiana 479 154 129 39 18 37 64 9 -- ! 3 ! 2 !Maine 174 46 46 19 ! 8 ! 4 ! 23 ! 12 ! 4 ! 0 12 !Maryland 259 54 58 21 10 33 29 20 16 2 ! 12Massachusetts 310 82 77 35 17 6 ! 44 30 7 ! 5 ! 1 !Michigan 258 86 81 23 12 6 25 15 2 3 2Minnesota 161 47 30 26 6 ! 1 ! 28 20 3 ! 1 ! 1 !Mississippi 326 82 127 18 17 9 42 14 1 ! 4 ! 5 !Missouri 246 70 70 29 14 5 40 12 2 ! 1 ! 3Montana 246 65 44 36 10 ! 0 44 31 8 ! 3 ! 5 !Nebraska 227 45 58 33 10 ! 5 ! 26 17 ! 7 ! 3 ! 2 !Nevada 268 52 66 20 7 ! 6 ! 68 17 1 ! 1 ! 5 !New Hampshire 248 92 50 30 ! 9 ! 6 ! 18 ! 32 ! 12 ! 0 0New Jersey 237 54 70 16 15 25 32 12 3 ! 2 ! 3 !New Mexico 262 69 48 49 19 4 ! 37 22 5 ! 1 ! 8 !New York 244 67 62 22 11 26 25 21 3 3 3North Carolina 222 71 58 20 15 12 33 7 1 ! 4 2 !North Dakota 82 18 ! 23 ! 12 ! 0 0 18 ! 6 ! 6 ! 0 0Ohio 237 78 68 14 17 5 35 13 1 ! 1 ! 4Oklahoma 319 77 81 37 19 8 45 18 6 7 13Oregon 252 72 54 44 9 2 ! 37 18 6 ! 4 ! 4 !Pennsylvania 323 89 93 33 17 5 63 16 1 ! 2 ! 2Rhode Islandd 193 41 45 2 ! 5 ! 9 ! 18 ! 41 9 ! 7 ! 2 !South Carolina 278 58 107 16 14 11 51 12 -- ! 1 ! 7South Dakota 213 40 63 33 16 ! 2 ! 19 ! 26 ! 2 ! 7 ! 5 !Tennessee 379 96 111 42 21 14 57 15 7 4 ! 9Texas 265 60 68 29 21 7 57 16 1 2 3Utah 228 48 46 22 9 ! 0 46 42 5 ! 2 ! 5 !Vermontd 182 40 ! 40 ! 32 ! 4 ! 12 ! 20 ! 24 ! 12 ! 0 0Virginia 276 93 74 28 14 13 36 9 1 ! 1 ! 2 !Washington 208 60 50 26 13 4 ! 34 11 1 ! 4 ! 3 !West Virginia 379 108 143 30 17 ! 8 ! 57 7 ! 2 ! 3 ! 3 !Wisconsin 189 60 49 13 17 3 ! 23 20 2 ! 2 ! 0Wyoming 242 40 ! 77 36 ! 20 ! 4 ! 40 ! 16 ! 4 ! 4 ! 0
Note: Data may have been revised from previously published statistics. Mortality rates presented are not adjusted. Detail may not sum to total due to missing data. Excludes executions; for execution data, see Capital Punishment, 2013 - Statistical Tables (NCJ 248448, BJS web, December 2014). See Methodology for details on rates, illnesses, and homicides.--Less than 0.5....Not available. ! Interpret with caution; too few cases to provide a reliable rate. aIncludes other specified illnesses, such as cerebrovascular disease, influenza, and other nonleading natural causes of death, as well as unspecified illnesses.bIncludes homicides committed by other inmates, incidental to the staff use of force, and resulting from assaults sustained prior to incarceration.cIncludes 9 prisoner deaths reported by the District of Columbia in 2001. As of December 30, 2001, sentenced felons from the District of Columbia were the responsibility of the Federal Bureau of Prisons.dPrisons and jails form one integrated system. Data include total jail and prison population.Sources: Bureau of Justice Statistics, Deaths in Custody Reporting Program, 2001–2013; National Prisoner Statistics, 2001–2006; and Federal Bureau of Prisons, 2007–2013.
Mortality in Local Jails and State Prisons, 2000–2013 - Statistical Tables | August 2015 29
MethodologyData collection coverage
The Deaths in Custody Reporting Program (DCRP) is an annual Bureau of Justice Statistics (BJS) data collection. The DCRP collects national, state, and incident-level data on persons who died while in the physical custody of the 50 state departments of corrections or the approximately 2,800 local adult jail jurisdictions nationwide. The DCRP began in 2000 under the Death in Custody Reporting Act of 2000 (P.L. 106-297), and it is the only national statistical collection to obtain comprehensive information about deaths in adult correctional facilities. BJS uses DCRP data to track national trends in the number and causes (or manners) of deaths occurring in state prison or local jail custody.Mortality data measured by the DCRP include decedent characteristics, such as age, sex, race or Hispanic origin, date of admission, conviction status, admission offense, and the location and type of facility (prison or jail) where the inmate died. The DCRP also collects data about circumstances surrounding the death, including the cause, time and location where the death occurred, and information on whether an autopsy was conducted and the availability of results to the respondent. Data on executions are excluded from this report but are accessible on the BJS website along with the DCRP mortality data. Statistics presented in this report are current as of March 1, 2015. For more information on mortality in correctional settings, see Mortality in Local Jails, 2000–2007 (NCJ 222988, BJS web, July 2010); Medical Causes of Death in State Prisons, 2001–2004 (NCJ 216340, BJS web, January 2007); and Suicide and Homicide in State Prisons and Local Jails (NCJ 210036, BJS web, August 2005).
The DCRP data collection instruments are administered annually to both state prisons and local jails. Respondents provide an aggregate count of the number of deaths that occurred during the referenced calendar year. The jail (CJ-9) and prison (NPS-4A) survey instruments used to obtain data on each prison and jail death are available on the BJS website at www.bjs.gov.
In addition to the death count, BJS requests that jails provide summary statistics about their population and admissions. All jails, including those with no deaths to report (which includes about 80% of jails in any given year) are asked to complete the annual summary survey form. The 2013 DCRP jail annual summary form was combined with the Census of Jails data collection, which gathered facility-level data on the jail reporting units. Items such as each facility’s count of inmates confined at yearend by race, operating expenditures, rated capacity, and number of employed staff were new for respondents this year. The instrument used for the Census of Jails included 18 questions, which was a significant increase compared to the 5-question instrument used in the past.
BJS obtains a separate report describing the decedent’s characteristics and the circumstances surrounding the death for each death that occurred in a state prison or local jail. State prison and local jail respondents can submit individual records on decedents at any time during a collection cycle through a BJS web-based collection system.
BJS has modified the survey instruments slightly over time, including changes to clarify questions and ease the burden on respondents. Several questions were added to capture information on any medical treatment that the inmate received prior to death. Changes also allowed respondents to elaborate on cause of death by adding text boxes to the intoxication, suicide, and inmate-involved homicide death questions. Previously, these fields had only been available for deaths due to illness, accident, homicides not caused by other inmates, and other unspecified causes. In addition, BJS clarified respondent instructions on the prison forms and removed a question collecting the conviction status of an inmate after an analysis showed that more than 99% of prison inmates were convicted at the time of death. BJS also streamlined the survey layout to simplify the progression through questions related to autopsies. Rather than initially submitting an incomplete instrument that indicated pending autopsy results, respondents were only permitted to complete the entire survey after autopsy results were available. This change reduced follow-up contact and the burden on respondents.
Starting in 2001 and annually thereafter, BJS has collected DCRP data directly from state prison systems, maintaining a 100% response rate.
Nonresponse
The jail universe includes all jails currently operating and jails that have been contacted for the DCRP but have closed, consolidated, or otherwise eliminated operations. This universe allows BJS to determine jail participation in the DCRP. The most recent jail universe, constructed in January 2015, identified 2,870 jurisdictions representing 3,170 jail facilities. Of these, 2,703 jurisdictions (94.2%) participated in the DCRP.
A jail jurisdiction is a legal entity that has responsibility for managing jail facilities. Jail jurisdictions typically operate at the county level, in which a sheriff ’s office or jail administrator manages the local facilities. The DCRP data identify the jail facility in which a jail inmate dies, but the data are arrayed at the jail jurisdiction level. BJS defines a jail as a locally operated correctional facility that confines persons before or after adjudication for more than 72 hours, excluding temporary lockups. Typically, there is one facility per jail jurisdiction, but the 2013 Census
Mortality in Local Jails and State Prisons, 2000–2013 - Statistical Tables | August 2015 30
of Jails found that 6.7% of jail jurisdictions had multiple facilities under a central authority.1 (See the BJS website for more information.)
Determining eligibility for reporting to the DCRP
In the DCRP, custody refers to the holding of an inmate in a facility or to the period during which a correctional authority maintains a chain of custody over an inmate. For instance, if a jail transports an ill inmate to a hospital for medical services and that inmate dies while in the chain of custody of the jail, then that death is counted as a death in custody. A death that occurs when an inmate is not in the custody of a correctional authority is considered beyond the scope of the DCRP. Out-of-scope deaths include inmates on escape status or under the supervision of community corrections on probation, parole, or home-electronic monitoring. BJS instructs both state prison and local jail officials to determine whether the inmate was in the physical custody of the jurisdiction at the time of death, regardless of the reason an inmate was being held. For state prisons responding to the survey, inmates in physical custody include those held in any private prison facility under contract to the responding state’s department of corrections or in any of their state-operated facilities, including halfway houses, prison camps or farms, training or treatment centers, and prison hospitals.
BJS instructs state prison officials to exclude deaths of inmates who were transferred to local jails while still serving a prison term because the DCRP obtains information about such deaths through the jail reports. Jail inmate custody includes inmates who are temporarily out of the jail facility but are within the chain of custody of the jail. For example, a death in custody would include a jail inmate who died after being transferred to an offsite facility that cares for critically ill persons. From 2000 to 2013, the DCRP data have shown that about 84% of jail deaths occurring in medical facilities have occurred outside of the jail facility.
Custody is further complicated by the dual law enforcement and jail administration functions of some sheriffs’ offices. As a result, some deaths reported as jail deaths actually occurred before the jail had custody of the decedent. BJS identifies and excludes from the DCRP these deaths that occurred in the process of arrest by using information about the circumstances surrounding the death.
1 Approximately 15% of all facilities were part of a multifacility jurisdiction.
Identifying and excluding duplicate records
Duplicate death records may occur in the DCRP due to overlapping correctional populations and overlapping duties within correctional facilities. For example, a jail jurisdiction may have more than one unit responsible for reporting data to BJS, a jail may be holding a state prison inmate, or state prison systems may report the death of an inmate who was transferred to a local jail but was serving a prison sentence at the time.
To identify duplicate death records, BJS reconciles the aggregate summary counts of deaths occurring during a calendar year with the number of individual death records obtained from a reporting jurisdiction. When discrepancies are identified, BJS contacts reporting jurisdictions to clarify matters. However, even if summary counts and individual reports are reconciled, duplicate death records may exist if multiple reporting units within a jurisdiction provide reconciled data.
Duplicate records occur primarily in reports from jail jurisdictions that have multiple reporting entities. To identify duplicate records, BJS performs record-matching based on inmate name and date of birth, date of death, and date of admission into a correctional facility. After the aggregate count review, BJS searches for deaths reported to both the jail and prison DCRP collections, which most commonly occur when a local jail is housing an inmate for the state department of corrections. The death is considered part of the count of the facility that had custody of the inmate at the time of death, and the duplicate record is deleted.
Duplicate and out-of-scope records are excluded from the analyses.
Cause-of-death information
The instructions for completing the DCRP tell respondents to report death information as determined by an autopsy or other official medical death investigation. For this collection, intoxication deaths, accidents, suicides, and homicides are considered discrete causes of death. Although there is a distinction between manner and cause of death from a medico-legal standpoint, no such distinction is made in the DCRP. When reporting a death due to illness, accident, suicide, intoxication, or homicide, BJS requests that respondents describe the events surrounding these deaths.
Mortality in Local Jails and State Prisons, 2000–2013 - Statistical Tables | August 2015 31
Clinical data specialists convert illness-related death text entries into standard medical codes according to the World Health Organization’s International Statistical Classification of Diseases and Related Health Problems, Tenth Revision (ICD-10).
Homicides include all types of intentional homicide and involuntary manslaughter as ruled by a medical examiner or pathologist at autopsy. For example, an inmate may die of positional asphyxia (suffocation caused by the position of the inmate’s body) while the inmate is being removed from a cell. A legal-intervention homicide committed while the inmate is trying to escape would also be included. In addition, homicides include cases that are ruled a homicide at autopsy when events that led to the death occurred prior to incarceration. For example, an inmate who was shot in the community years prior to incarceration died from complications of the gunshot wound while incarcerated.
Other BJS sources of correctional mortality data
BJS collects other data reported to the DCRP on correctional mortality. These other collections include—
�� Capital Punishment, which provides data on legal executions. Further discussion on executions is available on the BJS website.
�� The National Prisoner Statistics (NPS), which annually collected aggregate counts of deaths in state and federal prisons prior to the establishment of the DCRP. Prior to 2007, the NPS also collected counts of deaths by cause of death, including deaths due to execution, illness, AIDS, suicide, accident, homicide, and other causes. After 2006, the Federal Bureau of Prisons continued to submit the counts of deaths by cause of death using the DCRP, but no longer provided counts of deaths using the NPS. Further discussion of the NPS is available on the BJS website.
�� The Census of Jails, conducted every 5 to 6 years, provides counts of inmate deaths in local jails. Further discussion of the Census of Jails is available on the BJS website.
�� The Survey of Jails in Indian Country (SJIC), which provides aggregate counts of the number of deaths occurring in all known Indian country correctional facilities operated by tribal authorities or the U.S. Department of the Interior’s Bureau of Indian Affairs. Further discussion of the SJIC is available on the BJS website.
Reported statistics
Mortality data are shown in statistical tables by type of correctional institution (state prisons and local jails) and include the number of deaths and mortality rates by year, cause of death, selected decedent characteristics, and state.
Mortality rates are calculated per 100,000 inmates, with the denominators providing estimates of the number of person-years of exposure in custody in institutional corrections. Until 2010, the mortality rate for state prisons was calculated as the number of deaths per year divided by the midyear state prison population in custody multiplied by 100,000. Starting in 2011, the rate was calculated using yearend custody counts because midyear populations were no longer available. Custody counts for state prisons provide estimates of person-years for prison populations. BJS uses data from the NPS to provide midyear and yearend custody counts of prisoners. For more information on the NPS, see the BJS website.
The mortality rate in local jails is calculated as the number of deaths per year divided by the jail inmate average daily population (ADP) multiplied by 100,000. The ADP for local jails is defined as the average daily number of jail inmates held in a jail jurisdiction during a calendar year, from January 1 through December 31.
The ADP is used as the denominator for jail mortality rates to accommodate the high turnover and daily fluctuation in local jail populations. Also, the ADP better reflects the number of inmate days per year than a 1-day count. Jail populations have a higher turnover than prison populations; mean length of stay in local jails is about 21 days, compared to 2 years in state prisons.
The jail ADP also reflects the annual number of admissions and mean length of stay, and can be expressed as the product of these two values. When mean length of stay is expressed in years, the ADP is equivalent to the number of person-years spent by jail inmates during a given year. BJS obtains the jail ADP data directly from jails through the DCRP using the summary form CJ-9A. Starting in 2002, BJS collected the ADP directly from respondents. Prior to 2002, BJS calculated the jail ADP by taking the average of the January 1 count from the prior year and the December 31 count from the reference year, which is an appropriate proxy measure for the ADP.
Both denominators provide for annualizing mortality rates, which are calculated separately by group or by characteristic. The annualized mortality rates in state prisons and local jails are comparable to annual crude mortality rates reported by the National Center for Health Statistics (NCHS).
The NCHS calculates crude mortality rates as the number of events for a period (e.g., a year) divided by the population estimate at the midpoint of the period. For general population mortality statistics, the NCHS employs the midyear population as an approximation to the average population exposed to risk of death during any given year.2
2 See Siegal, J. & Swanson, D. (2004). The Methods and Materials of Demography, Second Edition. San Diego, CA: Elsevier Academic Press, 269.
Mortality in Local Jails and State Prisons, 2000–2013 - Statistical Tables | August 2015 32
The crude mortality rates reported in the DCRP annual statistical tables are not directly comparable to the crude mortality rates within the (nonincarcerated) general population, and the crude mortality rates in state prisons are not directly comparable to those of local jails. The composition of the general population (i.e., age, sex, and race or Hispanic origin) differs from the population in state prisons and local jails. Because mortality is correlated with age, sex, and race or Hispanic origin, the crude mortality rates in state prisons, local jails, and the general population should not be compared.
Individual inmate death records collected annually in the death file are included in the national death count. Independent jail-specific summary death counts are collected in the annual summary form (CJ-9A or CJ-10A) and serve as control death totals. If the death count in the summary form file is greater than the count in the individual inmate death file, the summary file count is used as the total in calculating a jail mortality rate. For 2013, individual records for jail inmate deaths were adjusted to match independent counts of deaths occurring in each jail, and the mortality rates were adjusted accordingly.
Estimating inmate population characteristics to calculate mortality rates by demographic subgroups
BJS does not obtain annual data for all demographic characteristics of prison and jail inmates in all jurisdictions. BJS uses data from sources other than the DCRP to estimate the nationwide composition of state prison and local jail inmate populations by age, sex, and race or Hispanic origin. These data sources consist primarily of periodic surveys of inmates in custody in prisons and jails. The inmate characteristic distributions obtained from these surveys are applied to denominators (i.e., counts of inmates or ADP) to estimate the number of inmates in each demographic subgroup.
BJS estimated the demographic distribution of the state prison population data from the NPS and National Corrections Reporting Program (NCRP) collections. For a discussion on the methodology for obtaining state prisoner distribution estimates by age, sex, and race or Hispanic origin, see Prisoners in 2012 (NCJ 243920, BJS web, December 2013).
Prior to using the NPS and NCRP to estimate demographic distributions, reports of mortality rates for state prison inmates used demographic distributions derived from BJS’s 2004 Survey of Inmates in State and Federal Correctional Facilities (SISFCF). As a result, the state prison mortality rates shown in these tables may differ from previously published rates. A rate comparison between the two sources showed very little difference in the resultant mortality rates. In most instances, the rates either matched or nearly matched. The rates differed in only three instances: Hispanics in 2001, and females and inmates age 55 or
older in 2002. In each instance, the rates calculated using population data from the NCRP and NPS were slightly higher (less than a 1% increase) than rates calculated using population data from the SISFCF.
To estimate inmate demographic characteristic distributions of the ADP, BJS used data from several surveys to generate distributions of age, sex, and race or Hispanic origin and applied these distributions to the ADP. BJS’s Annual Survey of Jails (ASJ) provided estimates of the sex distribution of inmates for each year of the DCRP collection and applied these to each year’s ADP from the DCRP to estimate the ADP of male and female jail inmates. Jail Inmates at Midyear 2010 - Statistical Tables (NCJ 233431, BJS web, April 2011) documents that the distributions of inmate characteristics have changed slowly over time. For the most recent information on the ASJ, see the BJS website.
To estimate the distribution of race and Hispanic origin of adult jail inmates, BJS used data from the Survey of Inmates in Local Jails (SILJ), the National Inmate Survey (NIS), and the Census of Jails to estimate the relative distribution of adults by race and Hispanic origin for different periods. Because the SILJ (2002), the NIS (2007 to 2009), and the Census of Jails (2013) are not fielded annually, the population estimates were smoothed before being applied to DCRP data. BJS used the SILJ estimates to cover the period from 2000 to 2004, the NIS estimates to cover the period from 2005 to 2012, and the Census of Jails to cover 2013. In all cases, the percentages associated with the distribution of race and Hispanic origin were applied to the adult jail ADP. For more information about jail inmates in 2002, see Profile of Jail Inmates, 2002 (NCJ 201932, BJS web, July 2004).
To estimate the age distribution of the jail inmate population, BJS first obtained an estimate of the number of jail inmates age 17 or younger from the 2013 Census of Jails data collection. By applying the annual percentage of jail inmates age 17 or younger to the annual ADP, BJS obtained an estimate of the ADP of jail inmates age 17 or younger.
To estimate the age distribution of adult jail inmates, BJS used data from the SILJ for 2000 to 2006 and the NIS for 2007 to 2013 to estimate the relative distribution of adults by age category for different periods. The age estimates were smoothed to account for gaps in reference years when age estimates were available, specifically for 2003, 2006, 2010, and 2011.
Moving averages
Moving averages were used to smooth short-term irregularities and to estimate long-term trends. For instance, moving averages were computed to examine data trends for certain causes of death in jails and prisons while smoothing short-term fluctuations. The data were cut into several 3-year overlapping periods spanning 13 years of prison data and 14 years of jail data.
Mortality in Local Jails and State Prisons, 2000–2013 - Statistical Tables | August 2015 33
The moving averages in this report describe some changes in cause-specific mortality rates over time (e.g., whether the overall decline in the AIDS-related mortality rate was steady, or whether the increase of suicides in jails was recent). Moving averages were not computed for all causes of death in custody because the resultant rates would have been unstable and therefore statistically meaningless due to small cell sizes.
Random error and suppression
The DCRP data on deaths in state prisons and local jails are not subject to sampling error. However, mortality data from a complete or near-complete enumeration may be subject to random error. Following the methodology of Brillinger3 and NCHS, “the number of deaths that actually occurred may be considered as one of a large series of possible results that could have arisen under the same set of circumstances.4 The random variation can be large when the number of deaths is small. Therefore, caution is warranted when interpreting statistics based on small numbers of deaths. According to NCHS standards, mortality rates based on fewer than 100 deaths per year should be interpreted with caution.
Continuing to use the NCHS and Brillinger methods, BJS quantified random variation by assuming that the appropriate underlying probability distribution for the number of deaths is a Poisson distribution. This provides a computationally simple and reasonable approach for estimating variances in mortality statistics when the probability of dying is low. BJS calculated variances based on the assumption of a Poisson process. From these variances, BJS calculated relative random error estimates, which are comparable to relative standard error in that the relative random error is the ratio of random error derived from the Poisson variance to the number of deaths. Following NCHS, when the relative random error exceeded 30%, BJS flagged estimated mortality rates due to the instability of the rate with a “!” symbol (Interpret with caution; too few sample cases to provide a reliable rate).
3 See Brillinger, D.R. (1986). The Natural Variability of Vital Rates and Associated Statistics. Biometrics, 42, 693–734.4 See Xu, J. et al. (2010). Deaths: Final Data for 2007. National Vital Statistics Report, 58(19). Retrieved from http://www.cdc.gov/nchs/data/nvsr/nvsr58/nvsr58_19.pdf.
Survey performance issues
Survey administration and modifications to the survey form generated data from 2007 to 2009 that may not be wholly compatible with prior DCRP data. In 2012, BJS identified a previously undetected data error that mischaracterized more than 600 illness-related deaths as illness-related deaths missing detailed cause-of-death information. The data error led to an inflated frequency of prison deaths in reference year 2007 being characterized as all other illnesses while simultaneously depressing frequencies of known illnesses (e.g., heart disease, cancer, and liver disease). The error was identified and resolved, correcting the distributions. In 2008, local jail officials were unable to provide causes of death for 21.4% of jail inmate deaths. During 2009, BJS made modifications to the collection instruments to improve reporting and reduce burden.
�� Item nonresponse in 2008 jail data and unknown cause of death: An abnormally large number of cases were missing a response for cause of death in the 2008 jail file (n = 203; 21.4% of all jail deaths in 2008). This coincided with the final year the U.S. Census Bureau acted as the data collection agent for the DCRP. In prior years of the DCRP jail data collection, an average of 6% of all causes of death were classified as other or unknown. For this report, BJS categorized all 203 jail deaths from 2008 as missing data about cause of death.
�� 2009 data collection: Prior to fielding the 2009 DCRP collection, BJS reviewed the data collection instrument and data submission procedures and assessed the communications with DCRP respondents to reduce the burden on respondents. The survey was modified to facilitate navigation and to encourage online response. The modifications led to delays in implementing data collection. As a result, death reports were not collected in the year the deaths occurred, but were instead collected retrospectively during 2010 for the first time. Data collection for subsequent years resumed on a normal schedule.
�� Hispanic origin: In 2013, the death record form was altered to collect a two-question format regarding ethnicity and race. If Hispanic was selected, the decedent was classified as Hispanic regardless of what was selected for race.
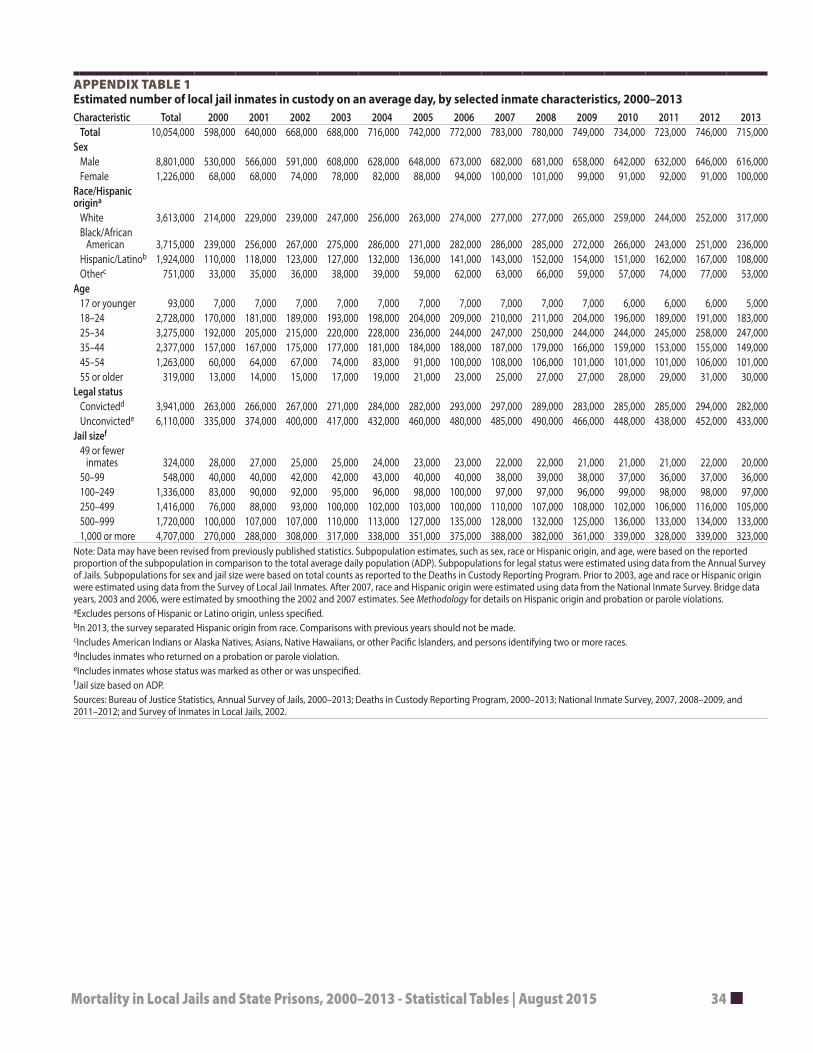
Mortality in Local Jails and State Prisons, 2000–2013 - Statistical Tables | August 2015 34
APPeNDiX TABLe 1Estimated number of local jail inmates in custody on an average day, by selected inmate characteristics, 2000–2013Characteristic Total 2000 2001 2002 2003 2004 2005 2006 2007 2008 2009 2010 2011 2012 2013
Total 10,054,000 598,000 640,000 668,000 688,000 716,000 742,000 772,000 783,000 780,000 749,000 734,000 723,000 746,000 715,000 Sex
Male 8,801,000 530,000 566,000 591,000 608,000 628,000 648,000 673,000 682,000 681,000 658,000 642,000 632,000 646,000 616,000 Female 1,226,000 68,000 68,000 74,000 78,000 82,000 88,000 94,000 100,000 101,000 99,000 91,000 92,000 91,000 100,000
Race/Hispanic origina
White 3,613,000 214,000 229,000 239,000 247,000 256,000 263,000 274,000 277,000 277,000 265,000 259,000 244,000 252,000 317,000 Black/African American 3,715,000 239,000 256,000 267,000 275,000 286,000 271,000 282,000 286,000 285,000 272,000 266,000 243,000 251,000 236,000 Hispanic/Latinob 1,924,000 110,000 118,000 123,000 127,000 132,000 136,000 141,000 143,000 152,000 154,000 151,000 162,000 167,000 108,000 Otherc 751,000 33,000 35,000 36,000 38,000 39,000 59,000 62,000 63,000 66,000 59,000 57,000 74,000 77,000 53,000
Age17 or younger 93,000 7,000 7,000 7,000 7,000 7,000 7,000 7,000 7,000 7,000 7,000 6,000 6,000 6,000 5,000 18–24 2,728,000 170,000 181,000 189,000 193,000 198,000 204,000 209,000 210,000 211,000 204,000 196,000 189,000 191,000 183,000 25–34 3,275,000 192,000 205,000 215,000 220,000 228,000 236,000 244,000 247,000 250,000 244,000 244,000 245,000 258,000 247,000 35–44 2,377,000 157,000 167,000 175,000 177,000 181,000 184,000 188,000 187,000 179,000 166,000 159,000 153,000 155,000 149,000 45–54 1,263,000 60,000 64,000 67,000 74,000 83,000 91,000 100,000 108,000 106,000 101,000 101,000 101,000 106,000 101,000 55 or older 319,000 13,000 14,000 15,000 17,000 19,000 21,000 23,000 25,000 27,000 27,000 28,000 29,000 31,000 30,000
Legal statusConvictedd 3,941,000 263,000 266,000 267,000 271,000 284,000 282,000 293,000 297,000 289,000 283,000 285,000 285,000 294,000 282,000 Unconvictede 6,110,000 335,000 374,000 400,000 417,000 432,000 460,000 480,000 485,000 490,000 466,000 448,000 438,000 452,000 433,000
Jail sizef
49 or fewer inmates 324,000 28,000 27,000 25,000 25,000 24,000 23,000 23,000 22,000 22,000 21,000 21,000 21,000 22,000 20,000 50–99 548,000 40,000 40,000 42,000 42,000 43,000 40,000 40,000 38,000 39,000 38,000 37,000 36,000 37,000 36,000 100–249 1,336,000 83,000 90,000 92,000 95,000 96,000 98,000 100,000 97,000 97,000 96,000 99,000 98,000 98,000 97,000 250–499 1,416,000 76,000 88,000 93,000 100,000 102,000 103,000 100,000 110,000 107,000 108,000 102,000 106,000 116,000 105,000 500–999 1,720,000 100,000 107,000 107,000 110,000 113,000 127,000 135,000 128,000 132,000 125,000 136,000 133,000 134,000 133,000 1,000 or more 4,707,000 270,000 288,000 308,000 317,000 338,000 351,000 375,000 388,000 382,000 361,000 339,000 328,000 339,000 323,000
Note: Data may have been revised from previously published statistics. Subpopulation estimates, such as sex, race or Hispanic origin, and age, were based on the reported proportion of the subpopulation in comparison to the total average daily population (ADP). Subpopulations for legal status were estimated using data from the Annual Survey of Jails. Subpopulations for sex and jail size were based on total counts as reported to the Deaths in Custody Reporting Program. Prior to 2003, age and race or Hispanic origin were estimated using data from the Survey of Local Jail Inmates. After 2007, race and Hispanic origin were estimated using data from the National Inmate Survey. Bridge data years, 2003 and 2006, were estimated by smoothing the 2002 and 2007 estimates. See Methodology for details on Hispanic origin and probation or parole violations.aExcludes persons of Hispanic or Latino origin, unless specified. bIn 2013, the survey separated Hispanic origin from race. Comparisons with previous years should not be made.cIncludes American Indians or Alaska Natives, Asians, Native Hawaiians, or other Pacific Islanders, and persons identifying two or more races.dIncludes inmates who returned on a probation or parole violation. eIncludes inmates whose status was marked as other or was unspecified.fJail size based on ADP.Sources: Bureau of Justice Statistics, Annual Survey of Jails, 2000–2013; Deaths in Custody Reporting Program, 2000–2013; National Inmate Survey, 2007, 2008–2009, and 2011–2012; and Survey of Inmates in Local Jails, 2002.
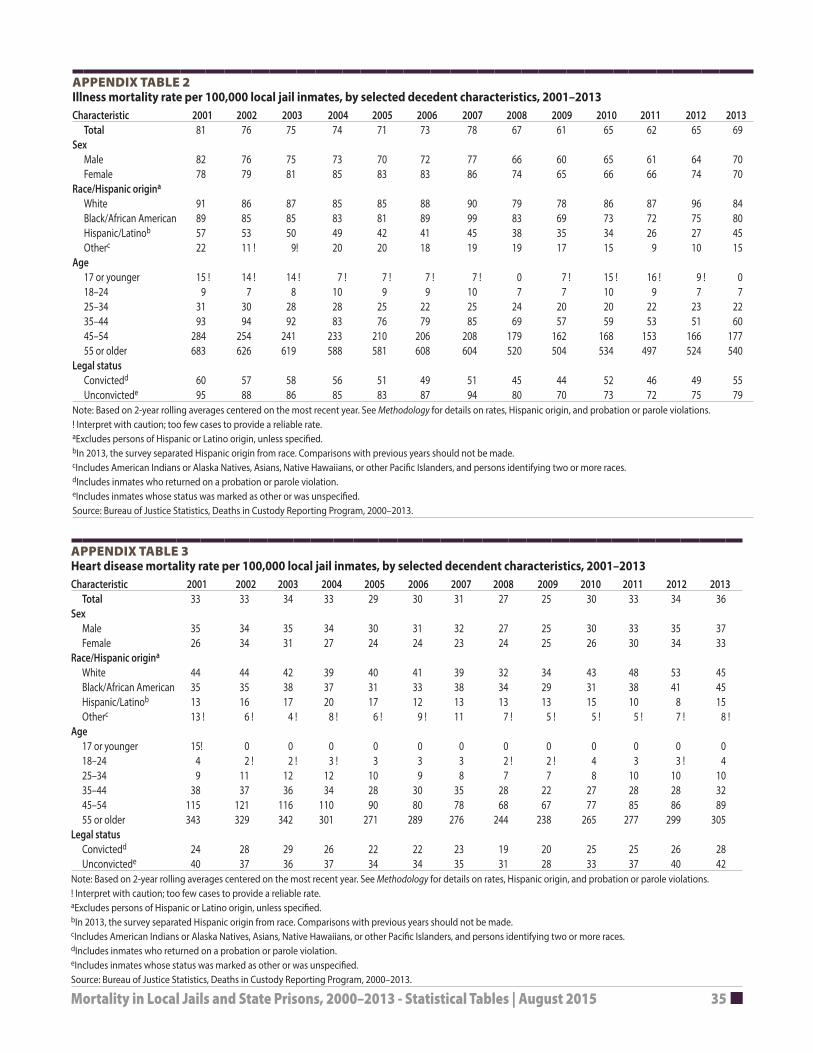
Mortality in Local Jails and State Prisons, 2000–2013 - Statistical Tables | August 2015 35
APPeNDiX TABLe 2 Illness mortality rate per 100,000 local jail inmates, by selected decedent characteristics, 2001–2013Characteristic 2001 2002 2003 2004 2005 2006 2007 2008 2009 2010 2011 2012 2013
Total 81 76 75 74 71 73 78 67 61 65 62 65 69Sex
Male 82 76 75 73 70 72 77 66 60 65 61 64 70Female 78 79 81 85 83 83 86 74 65 66 66 74 70
Race/Hispanic origina White 91 86 87 85 85 88 90 79 78 86 87 96 84Black/African American 89 85 85 83 81 89 99 83 69 73 72 75 80Hispanic/Latinob 57 53 50 49 42 41 45 38 35 34 26 27 45Otherc 22 11 ! 9! 20 20 18 19 19 17 15 9 10 15
Age 17 or younger 15 ! 14 ! 14 ! 7 ! 7 ! 7 ! 7 ! 0 7 ! 15 ! 16 ! 9 ! 018–24 9 7 8 10 9 9 10 7 7 10 9 7 725–34 31 30 28 28 25 22 25 24 20 20 22 23 2235–44 93 94 92 83 76 79 85 69 57 59 53 51 6045–54 284 254 241 233 210 206 208 179 162 168 153 166 17755 or older 683 626 619 588 581 608 604 520 504 534 497 524 540
Legal status Convictedd 60 57 58 56 51 49 51 45 44 52 46 49 55Unconvictede 95 88 86 85 83 87 94 80 70 73 72 75 79
Note: Based on 2-year rolling averages centered on the most recent year. See Methodology for details on rates, Hispanic origin, and probation or parole violations.! Interpret with caution; too few cases to provide a reliable rate.aExcludes persons of Hispanic or Latino origin, unless specified. bIn 2013, the survey separated Hispanic origin from race. Comparisons with previous years should not be made.cIncludes American Indians or Alaska Natives, Asians, Native Hawaiians, or other Pacific Islanders, and persons identifying two or more races.dIncludes inmates who returned on a probation or parole violation.eIncludes inmates whose status was marked as other or was unspecified.Source: Bureau of Justice Statistics, Deaths in Custody Reporting Program, 2000–2013.
APPeNDiX TABLe 3 Heart disease mortality rate per 100,000 local jail inmates, by selected decendent characteristics, 2001–2013Characteristic 2001 2002 2003 2004 2005 2006 2007 2008 2009 2010 2011 2012 2013
Total 33 33 34 33 29 30 31 27 25 30 33 34 36Sex
Male 35 34 35 34 30 31 32 27 25 30 33 35 37Female 26 34 31 27 24 24 23 24 25 26 30 34 33
Race/Hispanic origina
White 44 44 42 39 40 41 39 32 34 43 48 53 45Black/African American 35 35 38 37 31 33 38 34 29 31 38 41 45Hispanic/Latinob 13 16 17 20 17 12 13 13 13 15 10 8 15Otherc 13 ! 6 ! 4 ! 8 ! 6 ! 9 ! 11 7 ! 5 ! 5 ! 5 ! 7 ! 8 !
Age17 or younger 15! 0 0 0 0 0 0 0 0 0 0 0 018–24 4 2 ! 2 ! 3 ! 3 3 3 2 ! 2 ! 4 3 3 ! 425–34 9 11 12 12 10 9 8 7 7 8 10 10 1035–44 38 37 36 34 28 30 35 28 22 27 28 28 3245–54 115 121 116 110 90 80 78 68 67 77 85 86 8955 or older 343 329 342 301 271 289 276 244 238 265 277 299 305
Legal statusConvictedd 24 28 29 26 22 22 23 19 20 25 25 26 28Unconvictede 40 37 36 37 34 34 35 31 28 33 37 40 42
Note: Based on 2-year rolling averages centered on the most recent year. See Methodology for details on rates, Hispanic origin, and probation or parole violations.! Interpret with caution; too few cases to provide a reliable rate.aExcludes persons of Hispanic or Latino origin, unless specified. bIn 2013, the survey separated Hispanic origin from race. Comparisons with previous years should not be made.cIncludes American Indians or Alaska Natives, Asians, Native Hawaiians, or other Pacific Islanders, and persons identifying two or more races.dIncludes inmates who returned on a probation or parole violation.eIncludes inmates whose status was marked as other or was unspecified.Source: Bureau of Justice Statistics, Deaths in Custody Reporting Program, 2000–2013.
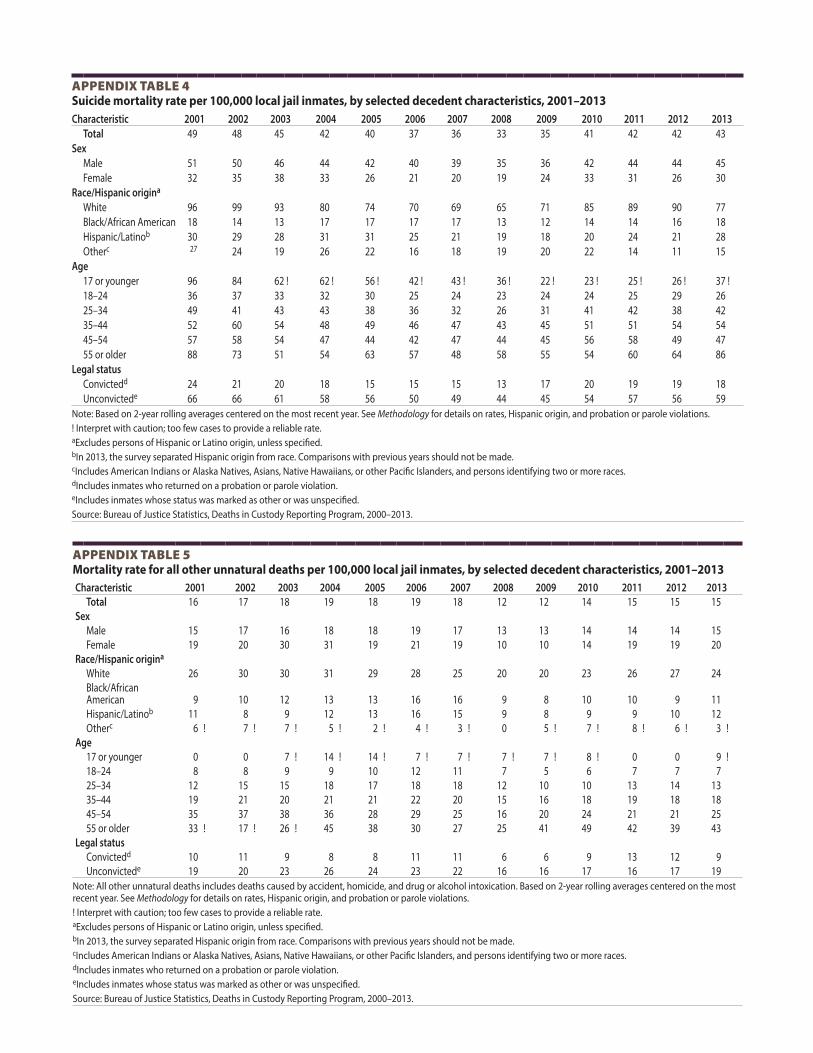
APPeNDiX TABLe 4 Suicide mortality rate per 100,000 local jail inmates, by selected decedent characteristics, 2001–2013Characteristic 2001 2002 2003 2004 2005 2006 2007 2008 2009 2010 2011 2012 2013
Total 49 48 45 42 40 37 36 33 35 41 42 42 43 Sex
Male 51 50 46 44 42 40 39 35 36 42 44 44 45 Female 32 35 38 33 26 21 20 19 24 33 31 26 30
Race/Hispanic origina White 96 99 93 80 74 70 69 65 71 85 89 90 77 Black/African American 18 14 13 17 17 17 17 13 12 14 14 16 18 Hispanic/Latinob 30 29 28 31 31 25 21 19 18 20 24 21 28 Otherc 27 24 19 26 22 16 18 19 20 22 14 11 15
Age 17 or younger 96 84 62 ! 62 ! 56 ! 42 ! 43 ! 36 ! 22 ! 23 ! 25 ! 26 ! 37 !18–24 36 37 33 32 30 25 24 23 24 24 25 29 26 25–34 49 41 43 43 38 36 32 26 31 41 42 38 42 35–44 52 60 54 48 49 46 47 43 45 51 51 54 54 45–54 57 58 54 47 44 42 47 44 45 56 58 49 47 55 or older 88 73 51 54 63 57 48 58 55 54 60 64 86
Legal status Convictedd 24 21 20 18 15 15 15 13 17 20 19 19 18 Unconvictede 66 66 61 58 56 50 49 44 45 54 57 56 59
Note: Based on 2-year rolling averages centered on the most recent year. See Methodology for details on rates, Hispanic origin, and probation or parole violations.! Interpret with caution; too few cases to provide a reliable rate.aExcludes persons of Hispanic or Latino origin, unless specified. bIn 2013, the survey separated Hispanic origin from race. Comparisons with previous years should not be made.cIncludes American Indians or Alaska Natives, Asians, Native Hawaiians, or other Pacific Islanders, and persons identifying two or more races.dIncludes inmates who returned on a probation or parole violation. eIncludes inmates whose status was marked as other or was unspecified.Source: Bureau of Justice Statistics, Deaths in Custody Reporting Program, 2000–2013.
APPeNDiX TABLe 5 Mortality rate for all other unnatural deaths per 100,000 local jail inmates, by selected decedent characteristics, 2001–2013Characteristic 2001 2002 2003 2004 2005 2006 2007 2008 2009 2010 2011 2012 2013
Total 16 17 18 19 18 19 18 12 12 14 15 15 15Sex
Male 15 17 16 18 18 19 17 13 13 14 14 14 15Female 19 20 30 31 19 21 19 10 10 14 19 19 20
Race/Hispanic origina
White 26 30 30 31 29 28 25 20 20 23 26 27 24Black/African American 9 10 12 13 13 16 16 9 8 10 10 9 11Hispanic/Latinob 11 8 9 12 13 16 15 9 8 9 9 10 12Otherc 6 ! 7 ! 7 ! 5 ! 2 ! 4 ! 3 ! 0 5 ! 7 ! 8 ! 6 ! 3 !
Age17 or younger 0 0 7 ! 14 ! 14 ! 7 ! 7 ! 7 ! 7 ! 8 ! 0 0 9 !18–24 8 8 9 9 10 12 11 7 5 6 7 7 725–34 12 15 15 18 17 18 18 12 10 10 13 14 1335–44 19 21 20 21 21 22 20 15 16 18 19 18 1845–54 35 37 38 36 28 29 25 16 20 24 21 21 2555 or older 33 ! 17 ! 26 ! 45 38 30 27 25 41 49 42 39 43
Legal statusConvictedd 10 11 9 8 8 11 11 6 6 9 13 12 9Unconvictede 19 20 23 26 24 23 22 16 16 17 16 17 19
Note: All other unnatural deaths includes deaths caused by accident, homicide, and drug or alcohol intoxication. Based on 2-year rolling averages centered on the most recent year. See Methodology for details on rates, Hispanic origin, and probation or parole violations.! Interpret with caution; too few cases to provide a reliable rate. aExcludes persons of Hispanic or Latino origin, unless specified. bIn 2013, the survey separated Hispanic origin from race. Comparisons with previous years should not be made. cIncludes American Indians or Alaska Natives, Asians, Native Hawaiians, or other Pacific Islanders, and persons identifying two or more races.dIncludes inmates who returned on a probation or parole violation. eIncludes inmates whose status was marked as other or was unspecified.Source: Bureau of Justice Statistics, Deaths in Custody Reporting Program, 2000–2013.
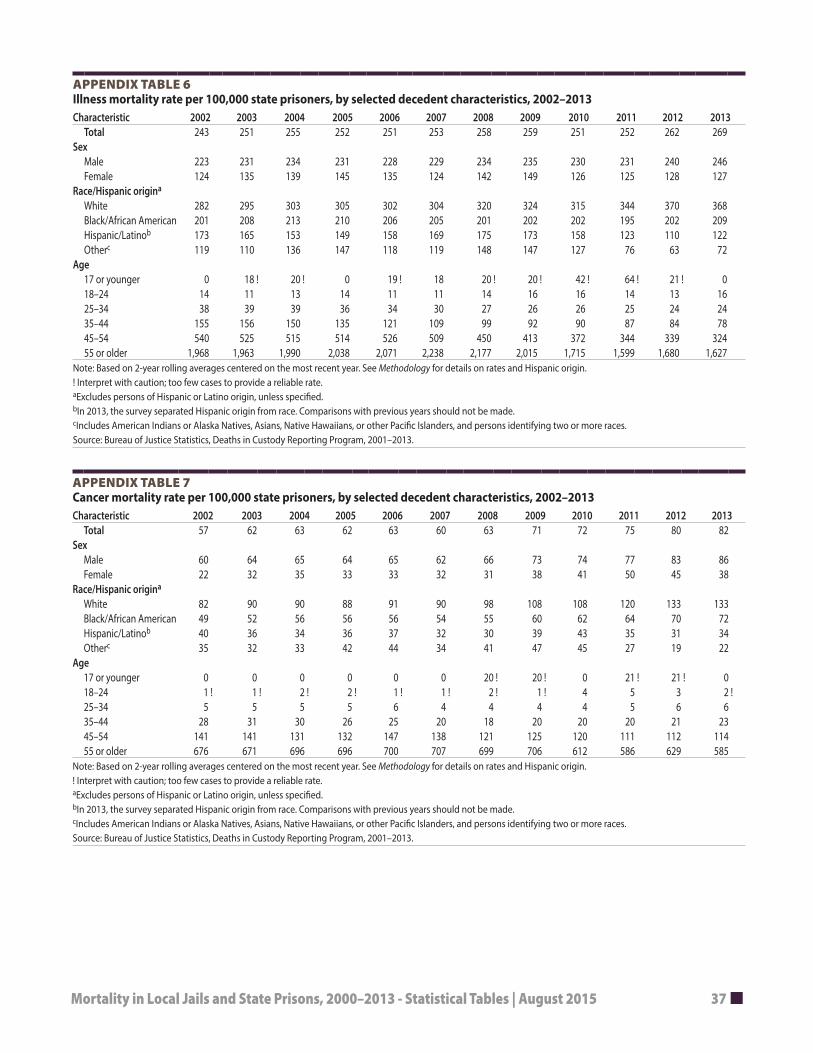
Mortality in Local Jails and State Prisons, 2000–2013 - Statistical Tables | August 2015 37
APPeNDiX TABLe 6 Illness mortality rate per 100,000 state prisoners, by selected decedent characteristics, 2002–2013Characteristic 2002 2003 2004 2005 2006 2007 2008 2009 2010 2011 2012 2013
Total 243 251 255 252 251 253 258 259 251 252 262 269Sex
Male 223 231 234 231 228 229 234 235 230 231 240 246Female 124 135 139 145 135 124 142 149 126 125 128 127
Race/Hispanic origina
White 282 295 303 305 302 304 320 324 315 344 370 368Black/African American 201 208 213 210 206 205 201 202 202 195 202 209Hispanic/Latinob 173 165 153 149 158 169 175 173 158 123 110 122Otherc 119 110 136 147 118 119 148 147 127 76 63 72
Age17 or younger 0 18 ! 20 ! 0 19 ! 18 20 ! 20 ! 42 ! 64 ! 21 ! 018–24 14 11 13 14 11 11 14 16 16 14 13 1625–34 38 39 39 36 34 30 27 26 26 25 24 2435–44 155 156 150 135 121 109 99 92 90 87 84 7845–54 540 525 515 514 526 509 450 413 372 344 339 32455 or older 1,968 1,963 1,990 2,038 2,071 2,238 2,177 2,015 1,715 1,599 1,680 1,627
Note: Based on 2-year rolling averages centered on the most recent year. See Methodology for details on rates and Hispanic origin.! Interpret with caution; too few cases to provide a reliable rate. aExcludes persons of Hispanic or Latino origin, unless specified. bIn 2013, the survey separated Hispanic origin from race. Comparisons with previous years should not be made. cIncludes American Indians or Alaska Natives, Asians, Native Hawaiians, or other Pacific Islanders, and persons identifying two or more races.Source: Bureau of Justice Statistics, Deaths in Custody Reporting Program, 2001–2013.
APPeNDiX TABLe 7 Cancer mortality rate per 100,000 state prisoners, by selected decedent characteristics, 2002–2013Characteristic 2002 2003 2004 2005 2006 2007 2008 2009 2010 2011 2012 2013
Total 57 62 63 62 63 60 63 71 72 75 80 82Sex
Male 60 64 65 64 65 62 66 73 74 77 83 86Female 22 32 35 33 33 32 31 38 41 50 45 38
Race/Hispanic origina
White 82 90 90 88 91 90 98 108 108 120 133 133Black/African American 49 52 56 56 56 54 55 60 62 64 70 72Hispanic/Latinob 40 36 34 36 37 32 30 39 43 35 31 34Otherc 35 32 33 42 44 34 41 47 45 27 19 22
Age17 or younger 0 0 0 0 0 0 20 ! 20 ! 0 21 ! 21 ! 018–24 1 ! 1 ! 2 ! 2 ! 1 ! 1 ! 2 ! 1 ! 4 5 3 2 !25–34 5 5 5 5 6 4 4 4 4 5 6 635–44 28 31 30 26 25 20 18 20 20 20 21 2345–54 141 141 131 132 147 138 121 125 120 111 112 11455 or older 676 671 696 696 700 707 699 706 612 586 629 585
Note: Based on 2-year rolling averages centered on the most recent year. See Methodology for details on rates and Hispanic origin.! Interpret with caution; too few cases to provide a reliable rate.aExcludes persons of Hispanic or Latino origin, unless specified. bIn 2013, the survey separated Hispanic origin from race. Comparisons with previous years should not be made.cIncludes American Indians or Alaska Natives, Asians, Native Hawaiians, or other Pacific Islanders, and persons identifying two or more races.Source: Bureau of Justice Statistics, Deaths in Custody Reporting Program, 2001–2013.
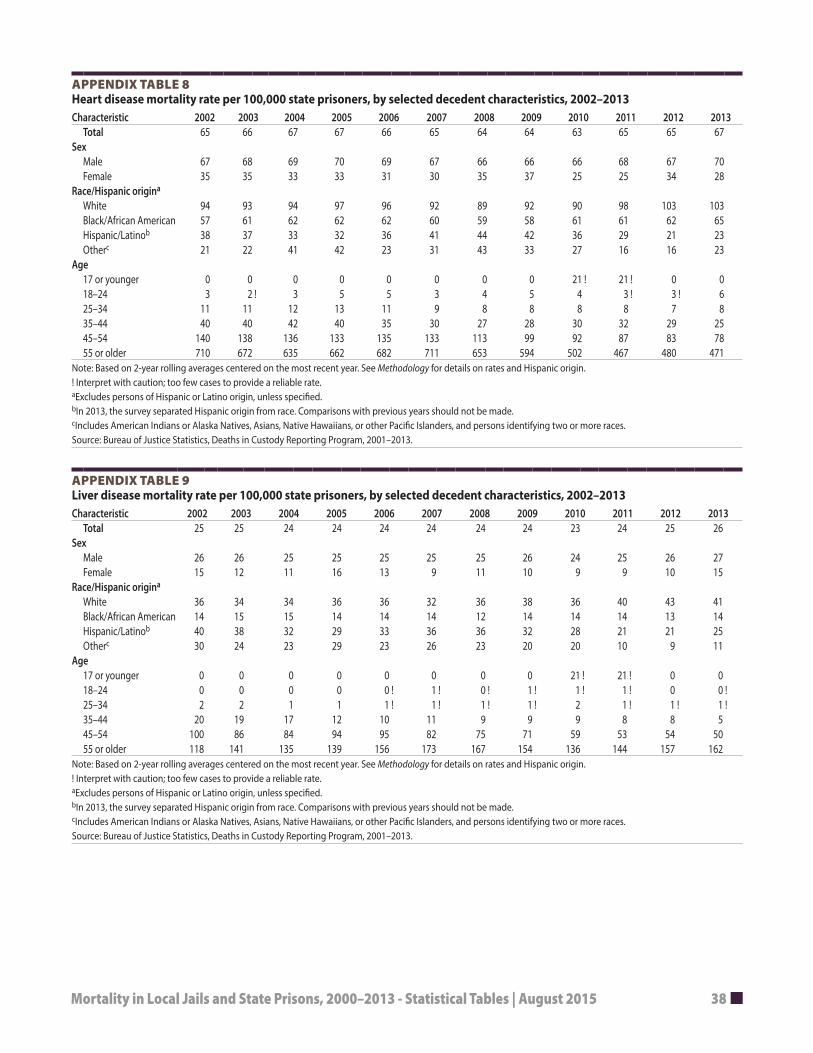
Mortality in Local Jails and State Prisons, 2000–2013 - Statistical Tables | August 2015 38
APPeNDiX TABLe 8 Heart disease mortality rate per 100,000 state prisoners, by selected decedent characteristics, 2002–2013Characteristic 2002 2003 2004 2005 2006 2007 2008 2009 2010 2011 2012 2013
Total 65 66 67 67 66 65 64 64 63 65 65 67Sex
Male 67 68 69 70 69 67 66 66 66 68 67 70Female 35 35 33 33 31 30 35 37 25 25 34 28
Race/Hispanic origina
White 94 93 94 97 96 92 89 92 90 98 103 103Black/African American 57 61 62 62 62 60 59 58 61 61 62 65Hispanic/Latinob 38 37 33 32 36 41 44 42 36 29 21 23Otherc 21 22 41 42 23 31 43 33 27 16 16 23
Age17 or younger 0 0 0 0 0 0 0 0 21 ! 21 ! 0 018–24 3 2 ! 3 5 5 3 4 5 4 3 ! 3 ! 625–34 11 11 12 13 11 9 8 8 8 8 7 835–44 40 40 42 40 35 30 27 28 30 32 29 2545–54 140 138 136 133 135 133 113 99 92 87 83 7855 or older 710 672 635 662 682 711 653 594 502 467 480 471
Note: Based on 2-year rolling averages centered on the most recent year. See Methodology for details on rates and Hispanic origin.! Interpret with caution; too few cases to provide a reliable rate. aExcludes persons of Hispanic or Latino origin, unless specified. bIn 2013, the survey separated Hispanic origin from race. Comparisons with previous years should not be made. cIncludes American Indians or Alaska Natives, Asians, Native Hawaiians, or other Pacific Islanders, and persons identifying two or more races.Source: Bureau of Justice Statistics, Deaths in Custody Reporting Program, 2001–2013.
APPeNDiX TABLe 9 Liver disease mortality rate per 100,000 state prisoners, by selected decedent characteristics, 2002–2013Characteristic 2002 2003 2004 2005 2006 2007 2008 2009 2010 2011 2012 2013
Total 25 25 24 24 24 24 24 24 23 24 25 26Sex
Male 26 26 25 25 25 25 25 26 24 25 26 27Female 15 12 11 16 13 9 11 10 9 9 10 15
Race/Hispanic origina
White 36 34 34 36 36 32 36 38 36 40 43 41Black/African American 14 15 15 14 14 14 12 14 14 14 13 14Hispanic/Latinob 40 38 32 29 33 36 36 32 28 21 21 25Otherc 30 24 23 29 23 26 23 20 20 10 9 11
Age17 or younger 0 0 0 0 0 0 0 0 21 ! 21 ! 0 018–24 0 0 0 0 0 ! 1 ! 0 ! 1 ! 1 ! 1 ! 0 0 !25–34 2 2 1 1 1 ! 1 ! 1 ! 1 ! 2 1 ! 1 ! 1 !35–44 20 19 17 12 10 11 9 9 9 8 8 545–54 100 86 84 94 95 82 75 71 59 53 54 5055 or older 118 141 135 139 156 173 167 154 136 144 157 162
Note: Based on 2-year rolling averages centered on the most recent year. See Methodology for details on rates and Hispanic origin.! Interpret with caution; too few cases to provide a reliable rate. aExcludes persons of Hispanic or Latino origin, unless specified. bIn 2013, the survey separated Hispanic origin from race. Comparisons with previous years should not be made.cIncludes American Indians or Alaska Natives, Asians, Native Hawaiians, or other Pacific Islanders, and persons identifying two or more races.Source: Bureau of Justice Statistics, Deaths in Custody Reporting Program, 2001–2013.
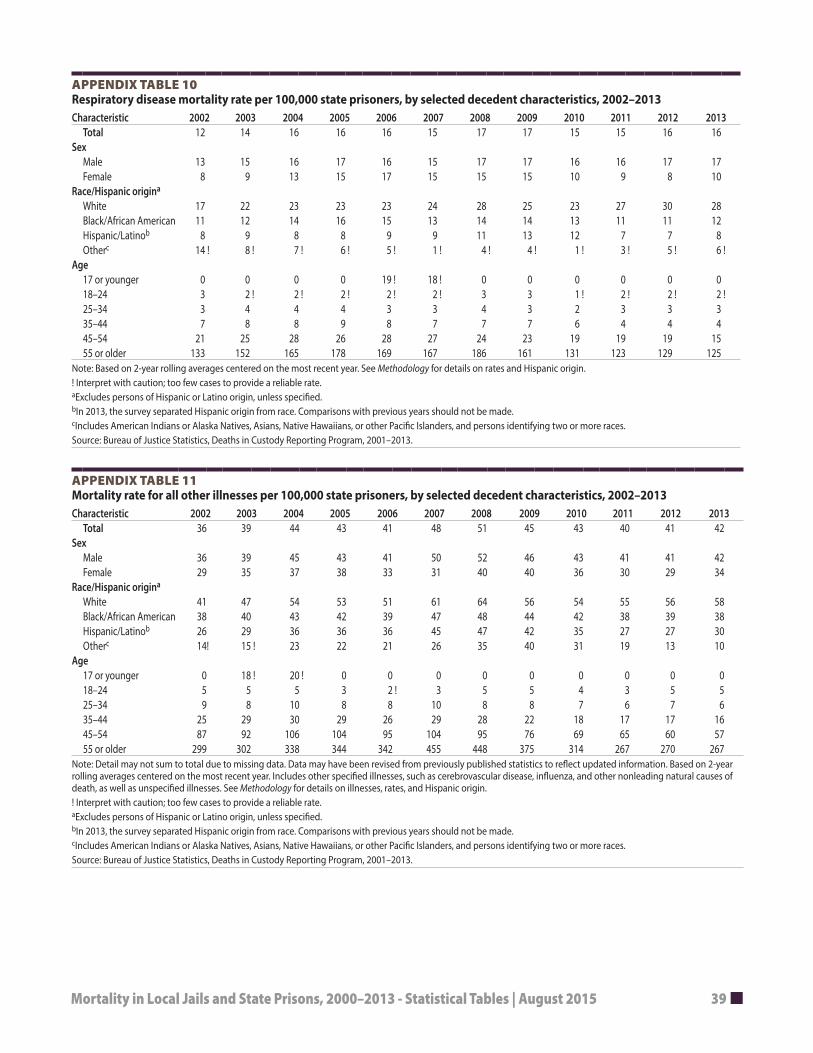
Mortality in Local Jails and State Prisons, 2000–2013 - Statistical Tables | August 2015 39
APPeNDiX TABLe 10 Respiratory disease mortality rate per 100,000 state prisoners, by selected decedent characteristics, 2002–2013Characteristic 2002 2003 2004 2005 2006 2007 2008 2009 2010 2011 2012 2013
Total 12 14 16 16 16 15 17 17 15 15 16 16Sex
Male 13 15 16 17 16 15 17 17 16 16 17 17Female 8 9 13 15 17 15 15 15 10 9 8 10
Race/Hispanic origina
White 17 22 23 23 23 24 28 25 23 27 30 28Black/African American 11 12 14 16 15 13 14 14 13 11 11 12Hispanic/Latinob 8 9 8 8 9 9 11 13 12 7 7 8Otherc 14 ! 8 ! 7 ! 6 ! 5 ! 1 ! 4 ! 4 ! 1 ! 3 ! 5 ! 6 !
Age17 or younger 0 0 0 0 19 ! 18 ! 0 0 0 0 0 018–24 3 2 ! 2 ! 2 ! 2 ! 2 ! 3 3 1 ! 2 ! 2 ! 2 !25–34 3 4 4 4 3 3 4 3 2 3 3 335–44 7 8 8 9 8 7 7 7 6 4 4 445–54 21 25 28 26 28 27 24 23 19 19 19 1555 or older 133 152 165 178 169 167 186 161 131 123 129 125
Note: Based on 2-year rolling averages centered on the most recent year. See Methodology for details on rates and Hispanic origin.! Interpret with caution; too few cases to provide a reliable rate. aExcludes persons of Hispanic or Latino origin, unless specified. bIn 2013, the survey separated Hispanic origin from race. Comparisons with previous years should not be made.cIncludes American Indians or Alaska Natives, Asians, Native Hawaiians, or other Pacific Islanders, and persons identifying two or more races.Source: Bureau of Justice Statistics, Deaths in Custody Reporting Program, 2001–2013.
APPeNDiX TABLe 11 Mortality rate for all other illnesses per 100,000 state prisoners, by selected decedent characteristics, 2002–2013Characteristic 2002 2003 2004 2005 2006 2007 2008 2009 2010 2011 2012 2013
Total 36 39 44 43 41 48 51 45 43 40 41 42Sex
Male 36 39 45 43 41 50 52 46 43 41 41 42Female 29 35 37 38 33 31 40 40 36 30 29 34
Race/Hispanic origina
White 41 47 54 53 51 61 64 56 54 55 56 58Black/African American 38 40 43 42 39 47 48 44 42 38 39 38Hispanic/Latinob 26 29 36 36 36 45 47 42 35 27 27 30Otherc 14 ! 15 ! 23 22 21 26 35 40 31 19 13 10
Age17 or younger 0 18 ! 20 ! 0 0 0 0 0 0 0 0 018–24 5 5 5 3 2 ! 3 5 5 4 3 5 525–34 9 8 10 8 8 10 8 8 7 6 7 635–44 25 29 30 29 26 29 28 22 18 17 17 1645–54 87 92 106 104 95 104 95 76 69 65 60 5755 or older 299 302 338 344 342 455 448 375 314 267 270 267
Note: Detail may not sum to total due to missing data. Data may have been revised from previously published statistics to reflect updated information. Based on 2-year rolling averages centered on the most recent year. Includes other specified illnesses, such as cerebrovascular disease, influenza, and other nonleading natural causes of death, as well as unspecified illnesses. See Methodology for details on illnesses, rates, and Hispanic origin. ! Interpret with caution; too few cases to provide a reliable rate. aExcludes persons of Hispanic or Latino origin, unless specified. bIn 2013, the survey separated Hispanic origin from race. Comparisons with previous years should not be made. cIncludes American Indians or Alaska Natives, Asians, Native Hawaiians, or other Pacific Islanders, and persons identifying two or more races.Source: Bureau of Justice Statistics, Deaths in Custody Reporting Program, 2001–2013.
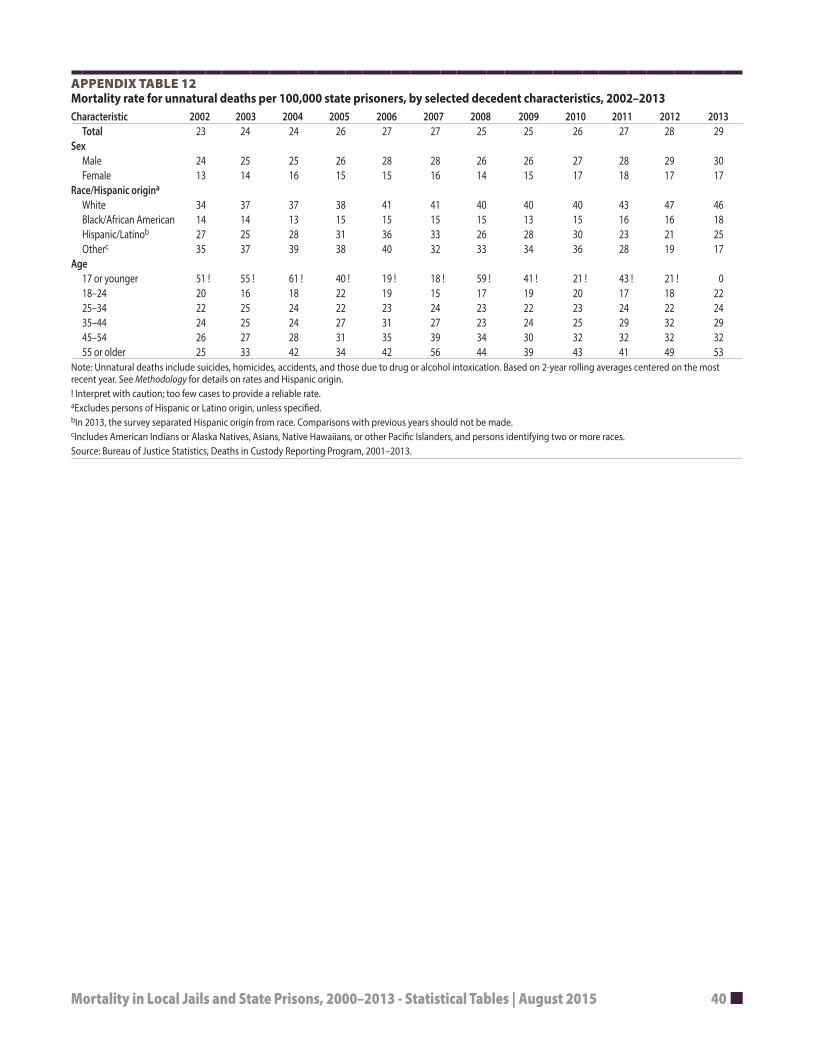
Mortality in Local Jails and State Prisons, 2000–2013 - Statistical Tables | August 2015 40
APPeNDiX TABLe 12 Mortality rate for unnatural deaths per 100,000 state prisoners, by selected decedent characteristics, 2002–2013Characteristic 2002 2003 2004 2005 2006 2007 2008 2009 2010 2011 2012 2013
Total 23 24 24 26 27 27 25 25 26 27 28 29Sex
Male 24 25 25 26 28 28 26 26 27 28 29 30Female 13 14 16 15 15 16 14 15 17 18 17 17
Race/Hispanic origina
White 34 37 37 38 41 41 40 40 40 43 47 46Black/African American 14 14 13 15 15 15 15 13 15 16 16 18Hispanic/Latinob 27 25 28 31 36 33 26 28 30 23 21 25Otherc 35 37 39 38 40 32 33 34 36 28 19 17
Age17 or younger 51 ! 55 ! 61 ! 40 ! 19 ! 18 ! 59 ! 41 ! 21 ! 43 ! 21 ! 018–24 20 16 18 22 19 15 17 19 20 17 18 2225–34 22 25 24 22 23 24 23 22 23 24 22 2435–44 24 25 24 27 31 27 23 24 25 29 32 2945–54 26 27 28 31 35 39 34 30 32 32 32 3255 or older 25 33 42 34 42 56 44 39 43 41 49 53
Note: Unnatural deaths include suicides, homicides, accidents, and those due to drug or alcohol intoxication. Based on 2-year rolling averages centered on the most recent year. See Methodology for details on rates and Hispanic origin.! Interpret with caution; too few cases to provide a reliable rate.aExcludes persons of Hispanic or Latino origin, unless specified.bIn 2013, the survey separated Hispanic origin from race. Comparisons with previous years should not be made. cIncludes American Indians or Alaska Natives, Asians, Native Hawaiians, or other Pacific Islanders, and persons identifying two or more races.Source: Bureau of Justice Statistics, Deaths in Custody Reporting Program, 2001–2013.
Office of Justice ProgramsInnovation • Partnerships • Safer Neighborhoods
www.ojp.usdoj.gov
Celebrating 35 years
NCJ248756
The Bureau of Justice Statistics of the U.S. Department of Justice is the principal federal agency responsible for measuring crime, criminal victimization, criminal offenders, victims of crime, correlates of crime, and the operation of criminal and civil justice systems at the federal, state, tribal, and local levels. BJS collects, analyzes, and disseminates reliable and valid statistics on crime and justice systems in the United States; supports improvements to state and local criminal justice information systems; and participates with national and international organizations to develop and recommend national standards for justice statistics. William J. Sabol is director.
This report was written by Margaret Noonan, Harley Rohloff, and Scott Ginder. Danielle Kaeble, Tracy Snell, and Margaret Noonan verified the report. Kim Aspinwall carried out data collection and processing with assistance from Alissa Chambers, under the supervision of Chris Ellis, RTI International. Scott Ginder provided statistical assistance, and Elizabeth Robbins provided technical assistance.
Irene Cooperman and Jill Thomas edited the report. Tina Dorsey and Barbara Quinn produced the report.
August 2015, NCJ 248756