Morphology of the primate optic nerve - IOVS | ARVO...
15
Morphology of the primate optic nerve II. Total fiber size distribution and fiber density distribution Albert M. Potts, Donald Hodges, C. B. Shelman, Karl J. Fritz, Norman S. Levy, and Yvonne Mangnall With the help of automation we have been able to determine cross-section area for each fiber in a thin section of primate optic nerve. Size histograms (for axis cylinder) show unimodal distribution for both human and rhesus monkey with the largest number of fibers between % and Vz ii in diameter. By our technique we can make numerical maps of fiber concentration and per cent small fibers in an optic nerve cross-section. Our maps show a high concentration of optic nerve fibers in the areas known to carry the macular fibers. In some cases this high concentration is reflected in a preponderance of small fibers. However, there is much individual variation in both measurements. Key words: optic nerve fibers, optic nerve fiber diameter, optic nerve fiber area, optic nerve fiber density, Rhesus, human. .lthough estimates of the number of optic nerve fibers date back a hundred years, attempts at determining fiber size distribution are only a fourth that old and most of those reports deal with sub-pri- mates. Knowledge of fiber size has implications for information processing capacity. For a From the Department of Ophthalmology, The Eye Research Laboratories, University of Chicago, 950 E. 59th St., Chicago, 111. 60637, and the Argonne National Laboratory, Applied Mathe- matics Division, where work was performed under the auspices of the United States Atomic Energy Commission. Supported in part by United States Public Health Service Research Grants Numbers EY 00212 and EY 00416 from the National Eye Institute, National Institutes of Health, Bethesda, Md., and by the L. L. Sinton Trust Research Grant. discussion of conduction velocity versus fiber diameter see Tasaki. 1 A discussion in relation to optic nerve conduction is given by Ogden and Miller. 2 Furthermore, some of the message carried by sensory fibers must depend on frequency modulation. This in turn must be a function of fiber size, but little definitive publication exists on that subject. The logistic difficulties of enumerating the more than one million fibers of the optic nerve are multiplied when a property such as fiber diameter or fiber area is to be studied as well. Thus all figures to date deal with samples of the fiber population which represent at best a few per cent of the total. The problems of sampling error can be reduced but not eliminated by ran- dom sampling. Complete size information on every fiber on the other hand, eliminates sampling error and allows for the first-time 989 Downloaded From: http://iovs.arvojournals.org/pdfaccess.ashx?url=/data/journals/iovs/933707/ on 06/09/2018
Transcript of Morphology of the primate optic nerve - IOVS | ARVO...

Morphology of the primate optic nerveII. Total fiber size distribution and fiber
density distribution
Albert M. Potts, Donald Hodges, C. B. Shelman, Karl J. Fritz,Norman S. Levy, and Yvonne Mangnall
With the help of automation we have been able to determine cross-section area for each fiberin a thin section of primate optic nerve. Size histograms (for axis cylinder) show unimodaldistribution for both human and rhesus monkey with the largest number of fibers between %and Vz ii in diameter. By our technique we can make numerical maps of fiber concentrationand per cent small fibers in an optic nerve cross-section. Our maps show a high concentrationof optic nerve fibers in the areas known to carry the macular fibers. In some cases this highconcentration is reflected in a preponderance of small fibers. However, there is much individualvariation in both measurements.
Key words: optic nerve fibers, optic nerve fiber diameter, optic nerve fiberarea, optic nerve fiber density, Rhesus, human.
.lthough estimates of the number ofoptic nerve fibers date back a hundredyears, attempts at determining fiber sizedistribution are only a fourth that old andmost of those reports deal with sub-pri-mates.
Knowledge of fiber size has implicationsfor information processing capacity. For a
From the Department of Ophthalmology, The EyeResearch Laboratories, University of Chicago,950 E. 59th St., Chicago, 111. 60637, and theArgonne National Laboratory, Applied Mathe-matics Division, where work was performedunder the auspices of the United States AtomicEnergy Commission.
Supported in part by United States Public HealthService Research Grants Numbers EY 00212and EY 00416 from the National Eye Institute,National Institutes of Health, Bethesda, Md.,and by the L. L. Sinton Trust Research Grant.
discussion of conduction velocity versusfiber diameter see Tasaki.1 A discussion inrelation to optic nerve conduction is givenby Ogden and Miller.2 Furthermore, someof the message carried by sensory fibersmust depend on frequency modulation.This in turn must be a function of fibersize, but little definitive publication existson that subject.
The logistic difficulties of enumeratingthe more than one million fibers of the opticnerve are multiplied when a property suchas fiber diameter or fiber area is to bestudied as well. Thus all figures to datedeal with samples of the fiber populationwhich represent at best a few per cent ofthe total. The problems of sampling errorcan be reduced but not eliminated by ran-dom sampling. Complete size informationon every fiber on the other hand, eliminatessampling error and allows for the first-time
989
Downloaded From: http://iovs.arvojournals.org/pdfaccess.ashx?url=/data/journals/iovs/933707/ on 06/09/2018

990 Potts et al. Investigative OphthalmologyDecember 1972
Th-^-n1 3 5 7 9 > 10
2 4 6 8 10I 3 5 7 9 >IO
2 4 6 8 10AREA IN ONITS OF .48 {I2
I 3 5 7 9 > 10\ 2 4 6 8 10
^ A R E A . N 0 N . T S 0 F . 4 8 f 2 AR E A IN ON ITS OF .48 {. AR£A IN ON.TS OF . 48 fl
Fig. 1. Histograms of optic nerve fiber area distribution in the rhesus monkey. A. Histogramof section made central to entrance of retinal vessels (Lab. No. 109 U). B. Histogram of sectionfrom second monkey made central to entry of retinal vessels (Lab. No. I l l M). C. Histogramof section from same monkey as Fig. 1, B but from section made distal to entry of retinal vessels(Lab. No. I l l S).
mapping of the entire cross-section in termsof fiber size and fiber concentration. Thisreport presents complete size informationfor several cross-sections of human opticnerve and several rhesus monkey nerves.
ExperimentalThe material used here was identical with that
reported on in the first paper of this series.3 Torecapitulate, optic nerve slices with orientationmaintained were fixed, embedded in epoxy resin,sectioned with a glass knife, and stained andphotographed as described in our previous publica-tion. The source of the material was the same asdescribed in that paper. Just as before the 600 to700 frames of 35 mm. film negatives were pro-cessed in the ALICE system at the Argonne Na-tional Laboratory.
Calibration was obtained by photographing astage micrometer with 10 n markings using thesame conditions under which the optic nerve sec-tions were photographed.
Area was calculated for each fiber in the cross-section after application of the simple object
filter described previously.3 At the end of the filter-fitting process the filter with its eight arms (seeAppendix) is positioned at the center of the fiberin question. Area is calculated by multiplyingtogether the lengths of adjacent arms, summingthe products and dividing by 2:
8Area = Vz % Arm (i) x Arm (i + 1)
i = 1Note that Arm (8 + 1) = Arm (1)
This formula is based on the fact that the filterarms divide the circular fiber into eight sectors andthese can be approximated by eight triangles madeby drawing the chords where the arms intersectthe circles. The area of each triangle is Vz theproduct of its base and its altitude. Because ofthe way the filter is constructed the units alongthe diagonal arms are longer by a factor of 1.4( V2) than those along the orthogonal arms. Thusalthough the actual arm length is the same fororthogonal and diagonal anns the number of unitsis less for the diagonal. This smaller value is exactlyequivalent to the value for the altitude of thetriangle in question. Thus when one is computingthe area of each triangle by multiplying adjacent
Downloaded From: http://iovs.arvojournals.org/pdfaccess.ashx?url=/data/journals/iovs/933707/ on 06/09/2018

Volume 11Number 12
Primate optic nerve morphology. II. 991
I 3 5 7 9 > 102 4 6 8 10
AREA IN UNITS OF .48 HS
I 3 5 7 9 >IO2 4 6 8 10
AREA IN UNITS OF .48 M 2
Fig. 2. Histograms of optic nerve fiber area distribution in man. A. Histogram of section madejust central to globe (Lab. No. 112 B). B. Histogram from a second human optic nerve justbehind the globe (Lab. No. 123 A).
arms one is always multiplying an orthogonal armby a diagonal arm. This is numerically exactly theproduct of the base times the altitude. When theseproducts are summed and divided by 2 one arrivesat the area of the fiber as precisely as it can beapproximated by the triangles. For a detailedexposition of this approximation see Appendix.
It should be noted that the area calculated byus is the area of the axon cylinder and does notinclude the annulus of myelin. This is because thecutoff point for the filter is the density change ataxoplasm-myelin boundary.
Results
Size distribution. The fiber size distribu-tions are presented as histograms. It shouldbe re-emphasized that these histograms arebased, not on samples, but on measurementof each of the more than a million fibers inthe optic nerve.
Figs 1, A and 1, B represent the distribu-tion of fibers in the optic nerve of two dif-ferent rhesus monkeys, each measured cen-tral to the entrance of the retinal vessels.
Fig. 1, C represents the distribution offibers in the same nerve as Fig. 1, B but in
a section distal to the entrance of theretinal vessels.
The ordinate represents actual numbersof nerve fibers in each area category. Theabscissa is expressed in multiples of thearea unit of 0.48 fi2. This unit reflects themagnification of our photographs and aninteger multiple of the unit interval of theflying spot scanner in the ALICE system.The area above corresponds to a diameterof 0.247 ii. Thus one can consider the unitson the abscissa as being in diameter stepsof y* fx each.
Each of the histograms of Fig. 1 has anumber of elements in common. The dis-tribution is unimodal, it is skewed towardthe small fiber end, and the maximum ineach case is at 2 x 0.48 fx2 (0.5 p. diameter).In each case a million fibers are representedby bars 2 and 3 (x 0.48 p?) (1.0 and 1.25 /*diameter).
The differences between the distal andthe central portions of the histograms formonkey No. 2. (Figs. 1, B and 1, C) are not
Downloaded From: http://iovs.arvojournals.org/pdfaccess.ashx?url=/data/journals/iovs/933707/ on 06/09/2018
992 Potts et al Investigative OphthalmologyDecember 1972
1 U
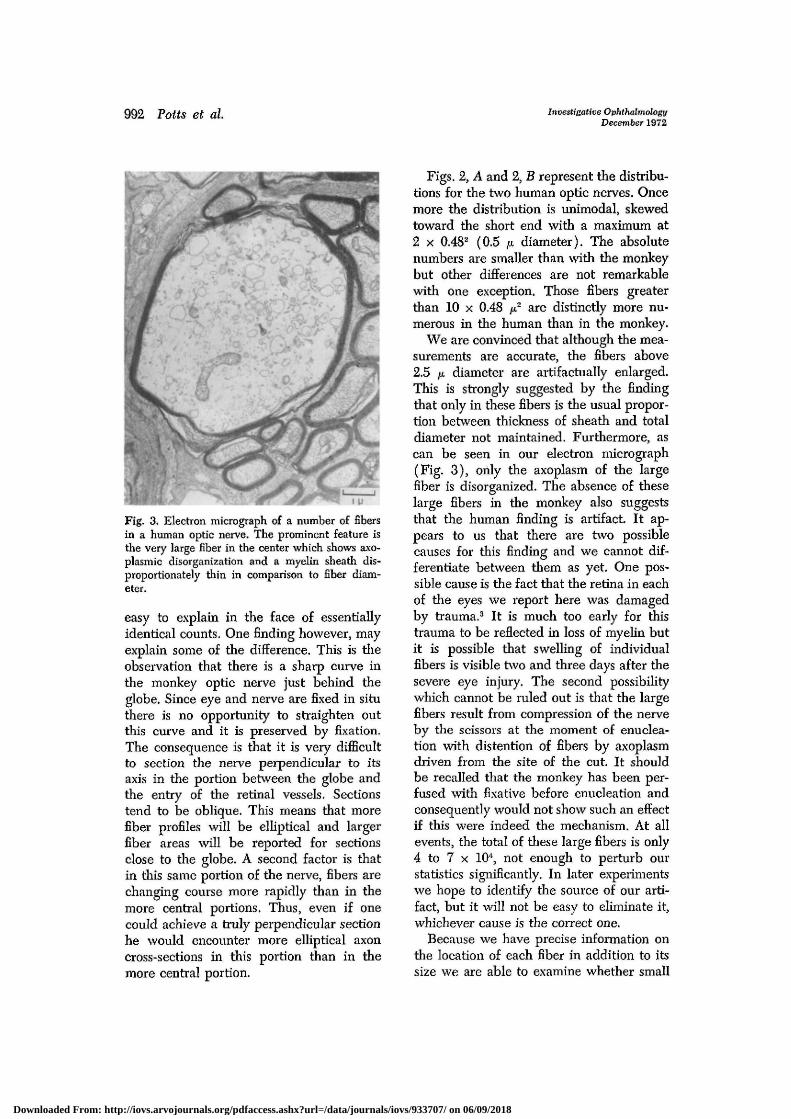
Fig. 3. Electron micrograph of a number of fibersin a human optic nerve. The prominent feature isthe very large fiber in the center which shows axo-plasmic disorganization and a myelin sheath dis-proportionately thin in comparison to fiber diam-eter.
easy to explain in the face of essentiallyidentical counts. One finding however, mayexplain some of the difference. This is theobservation that there is a sharp curve inthe monkey optic nerve just behind theglobe. Since eye and nerve are fixed in situthere is no opportunity to straighten outthis curve and it is preserved by fixation.The consequence is that it is very difficultto section the nerve perpendicular to itsaxis in the portion between the globe andthe entry of the retinal vessels. Sectionstend to be oblique. This means that morefiber profiles will be elliptical and largerfiber areas will be reported for sectionsclose to the globe. A second factor is thatin this same portion of the nerve, fibers arechanging course more rapidly than in themore central portions. Thus, even if onecould achieve a truly perpendicular sectionhe would encounter more elliptical axoncross-sections in this portion than in themore central portion.
Figs. 2, A and 2, B represent the distribu-tions for the two human optic nerves. Oncemore the distribution is unimodal, skewedtoward the short end with a maximum at2 x 0.482 (0.5 p diameter). The absolutenumbers are smaller than with the monkeybut other differences are not remarkablewith one exception. Those fibers greaterthan 10 x 0.48 ju,2 are distinctly more nu-merous in the human than in the monkey.
We are convinced that although the mea-surements are accurate, the fibers above2.5 /A diameter are artifactually enlarged.This is strongly suggested by the findingthat only in these fibers is the usual propor-tion between thickness of sheath and totaldiameter not maintained. Furthermore, ascan be seen in our electron micrograph(Fig. 3), only the axoplasm of the largefiber is disorganized. The absence of theselarge fibers in the monkey also suggeststhat the human finding is artifact. It ap-pears to us that there are two possiblecauses for this finding and we cannot dif-ferentiate between them as yet. One pos-sible cause is the fact that the retina in eachof the eyes we report here was damagedby trauma.3 It is much too early for thistrauma to be reflected in loss of myelin butit is possible that swelling of individualfibers is visible two and three days after thesevere eye injury. The second possibilitywhich cannot be ruled out is that the largefibers result from compression of the nerveby the scissors at the moment of enuclea-tion with distention of fibers by axoplasmdriven from the site of the cut. It shouldbe recalled that the monkey has been per-fused with fixative before enucleation andconsequently would not show such an effectif this were indeed the mechanism. At allevents, the total of these large fibers is only4 to 7 x 10⁴, not enough to perturb ourstatistics significantly. In later experimentswe hope to identify the source of our arti-fact, but it will not be easy to eliminate it,whichever cause is the correct one.
Because we have precise information onthe location of each fiber in addition to itssize we are able to examine whether small
Downloaded From: http://iovs.arvojournals.org/pdfaccess.ashx?url=/data/journals/iovs/933707/ on 06/09/2018

Volume 11Number 12
Primate optic nerve morphology. II. 993
TILE NAME F109U3» SI B
DAT*C.
7-JUN-720 e B
35 H tj I! 0 C B ? 0 784 151B 2^25 2885 2988 3073 2238 518 0 0 S 1 0 H 0 B 0
34 3 0 (? 0 0 fl 465 2t»21 2665 2796 2944 2964 2812 3811 2885 2435 1318 156 W 0 E B 0 B
33 a B a a a 494 2269 2657 2«24 2845 2053 3123 2992 2932 2BCa 297B 3345 2211 254 B 0 B 0 0
32 pi B B C 135 2149 2513 2711 2742 3Btl4 3H40 34B2 3338 2914 J256 3688 3371 3735 2378 a 0 0 B B
31 0 a a 0 1449 2602 25V1 2826 2945 3121 3134 3223 2979 3090 3271 3425 3458 3505 3295 2114 196 0 B B
30 B 0 «l 733 271J5 26C9 3134 3123 3130 3f»37 3272 3227 3105 3181 3552 287B 3764 3760 3416 3H78 1532 a B 0
29 PI M B 2PI84 2635 2921 2659 3S53 3729 3134 3148 3257 3BJB 3097 3078 3B81 3278 3199 3197 2897 2382 501 B B
28 H 0 31)1 2433 2867 2491 2622 3258 2696 2948 29?9 3357 3164 3235 3tf24 335? 36B9 3374 3057 2765 2514 1375 0 8
27 0 0 16V9 2-596 2403 3084 2843 3207 3056 2642 3071 3 H 0 3077 3298 3i»43 3488 3158 2739 3066 2677 2619 22l3 352 0
26 0 239 2578 2727 2497 3096 2754 2928 2873 3045 2830 3272 2750 3215 3317 3324 34?7 3454 3167 2959 2726 2350 1039 B
25 a 993 2813 2760 3 H 6 2885 2392 2857 2998 2956 2814 3032 2967 3B82 3394 3428.3490 3446 2932 2865 2727 2297 1657 B
24 a 1623 27B9 2715 3050 3209 2897 2765 3182 2959 29B6 3339 3373 2983 3.485 3647 3147 3453 2158 176B 1782 1619 0 199
23 a 1/77 2950 2917 2935 2976 35/1 3P54 3352 3170 3032 3237 3(103 2992 3613 3415 3670 3348 3263 2920 2731 2759 2391 B59
22 0 2489 2888 2789 35M9 3039 2*H6 304B 3189 1923 2762 3387 3114 3087 2789 3390 3195 3183 3325 2833 2489 2660 231B 1094
21 0 2/09 2873 3*24 2714 26H2 2822 3136 2778 2536 3290 30B7 3589 3435 3521 3254 2526 2755 2992 2740 2705 2847 2533 1381
20 147 2931 3B55 2964 3244 3359 3394 2665 3BH1 2961 3327 3138 3416 3232 32SJ4 6566 2581 3506 3151 2954 3173 2329 2331 1865
19 0 2/01 2718 2888 2914 2445 2355 2763 2649 2374 2126 3596 3536 3514 3319 3562 2651 3233 3419 3153 31B7 2759 2229 1786
18 239 2509 2760 2188 2919 3145 301)9 2885 2B81 3118 3395 3224 4073 3636 3192 3568 3432 3825 3718 3331 2620 3000 2515 192B
17 448 3B82 2949 3CI03 2928 284PJ 1612 2272 2425 2882 3277 34B5 3649 3185 2929 3289 3366 3356 3274 3211 2597 2811 2869 172B
16 369 2949 2951 2731 28P8 2897 2993 3023 2725 3055 2843 3094 1375 3733 3218 2896 32B5 3124 3367 3292 29B9 2392 2196 1886
15 114 2413 2851 2510 2902 2655 2695 2809 2297 3B72 2frl6 2979 2540 3340 3331 3313 3787 3029 3149 3257 3B56 2421 2281 1366
14 52 2107 J131 3008 3467 2905 31/8 2517 2767 3B27 2931 2179 3292 3377 35)42 33BK 342B 2739 2718 3526 3253 24B6 2449 1168
13 0 1908 2843 2696 2775 2850 3165 2619 2694 2961 3018 2520 3207 2988 3006 2992 2945 2444 2857 2788 2668 27B5 1992 1076
12 0 1255 2962 2393 2738 3094 3217 2923 2952 2602 3B93 2848 2939 288B 2979 2883 2791 2924 2797 2589 299B 2556 2257 452
11 0 492 J015 3189 2900 2790 2804 3203 2603 2590 2687 2920 3234 2819 3043 2942 2552 2882 3565 2BB8 2671.2695 222B B
10 a 49 2.J95 3163 3237 3205 3047 2940 2599 2647 2969 2813 2975 3B51 3149 3162 2777 2389 3398 2743 2596 27B3 1175 B
9 0 0 11/2 2873 3147 3175 3371 2859 3009 2759 2537 2683 2510 2724 2490 2914 2554 2343 2477 2157 2339 1924 325 B
8 0 a B 2472 2953 2835 3053 2847 2757 2684 2740 2649 2704 2877 2853 2518 2501 2526 2386 2294 2125 1642 0 0
7 3 a 0 1015 2985 2925 2958 3016 2993 2722 2646 2295 2974 2655 231? 2687 2431 2529 2379 2205 18B6 491 0 B
6 0 0 0 56 1975 3012 3272 3083 3064 667 1527 2639 2/98 2844 2673 3026 2276 226B 2084 2085 1B68 B B B
5 0 0 0 0 1*0 2049 2971 2875 2657 2303 3 U 0 2604 2754 2866 2619 3038 2392 2468 2B78 1502 0 0 0 B
4 0 B 0 0 0 0 1957 2911 2709 2794 3UP-6 2626 2725 2681 263B 264B 2288 ?289 177B 349 8 (I B 8
3 0 0 0 0 0 0 0 860 1959 2826 2733 2231 2778 2358 2292 2373 2312 1681 B 8 a B 8 B
2 0 0 0 0 0 : i ( ! . 0 P ! 56B 1822 1631 2569 2530 2260 1588 493 8 0 8 0 0 8 8
1 0 B 0 3 0 B H 0 0 U 0 3 143 311 3 'd 3 0 8 8 8 B B- 8
Fig. 4. Computer print-out of total fibers per frame with each number in the proper positionfor its corresponding frame in the optic nerve cross section. Compare with actual photographin Potts and co-workers (Fig. 3, Lab. No. 109 U).
fibers tend to favor a particular location inthe optic nerve at a given level. For themoment, considering the data for each 35mm. frame gives enough accuracy for ourpurposes. It is relatively easy to have thespatial data printed out by the high-speedprinter in a format such that the figure forany given 35 mm. frame is in the same rela-tive location as the frame itself. The resultis a numerical picture which correspondsto the optic nerve cross-section (Fig. 4).The numbers correspond to actual framesas shown in the first paper of this series(Ret 3, Fig. 3).
Fiber density. In estimation of fiber den-sity some convention must be establishedto eliminate the large areas of connectivetissue from consideration. The computa-tional system we used was as follows: Each24 by 36 mm. frame was subdivided into100 rectangles 2.4 by 3.6 mm. in size. Thecount for each area was examined and itwas decided arbitrarily that if the tinyrectangle contained 8 fibers or less it wouldbe considered empty. Above 8 fibers thecount per unit area would be calculatedand the mean density of fibers per unitarea (translated back to the actual optic
Downloaded From: http://iovs.arvojournals.org/pdfaccess.ashx?url=/data/journals/iovs/933707/ on 06/09/2018
994 Potts et al. Investigative OphthalmologyDecember 1972
I I I I II I I II I I II I I I I
^3800
3300-3700
2800-3200
2300-2700
1800-2200
*s;l700
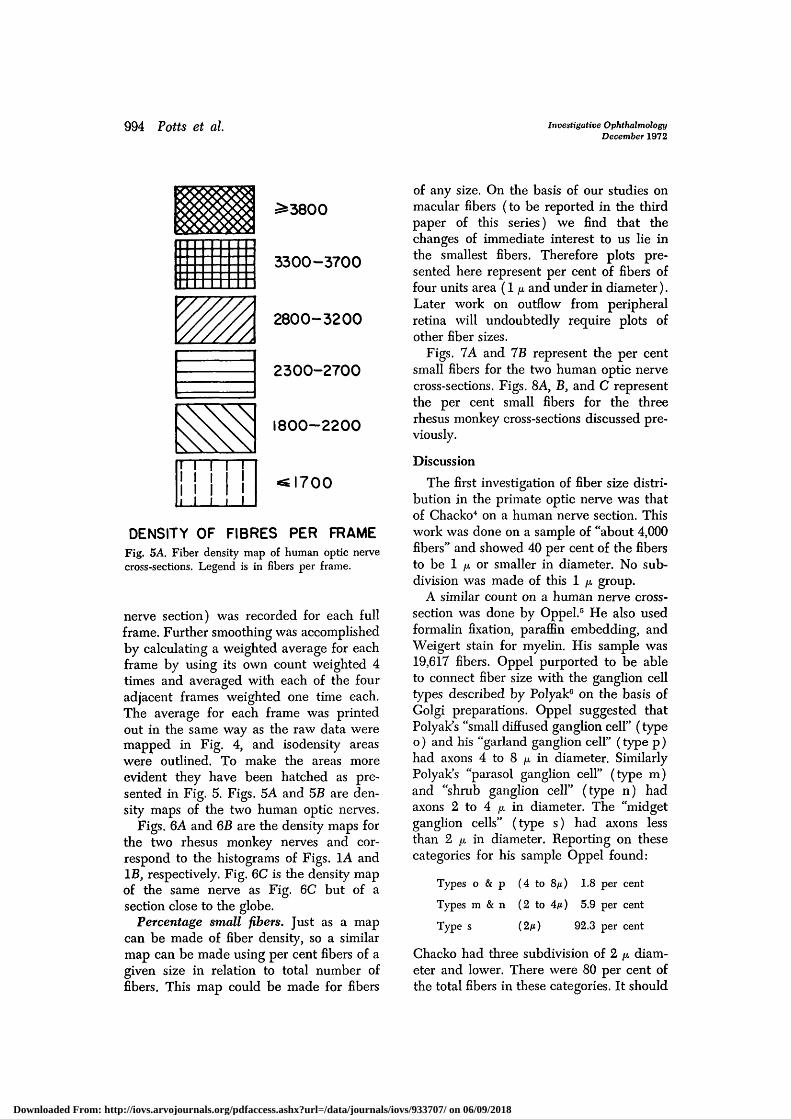
DENSITY OF FIBRES PER FRAMEFig. 5A. Fiber density map of human optic nervecross-sections. Legend is in fibers per frame.
nerve section) was recorded for each fullframe. Further smoothing was accomplishedby calculating a weighted average for eachframe by using its own count weighted 4times and averaged with each of the fouradjacent frames weighted one time each.The average for each frame was printedout in the same way as the raw data weremapped in Fig. 4, and isodensity areaswere outlined. To make the areas moreevident they have been hatched as pre-sented in Fig. 5. Figs. 5A and 5B are den-sity maps of the two human optic nerves.
Figs. 6A and 6B are the density maps forthe two rhesus monkey nerves and cor-respond to the histograms of Figs. 1A andIB, respectively. Fig. 6C is the density mapof the same nerve as Fig. 6C but of asection close to the globe.
Percentage small fibers. Just as a mapcan be made of fiber density, so a similarmap can be made using per cent fibers of agiven size in relation to total number offibers. This map could be made for fibers
of any size. On the basis of our studies onmacular fibers (to be reported in the thirdpaper of this series) we find that thechanges of immediate interest to us lie inthe smallest fibers. Therefore plots pre-sented here represent per cent of fibers offour units area (1 p and under in diameter).Later work on outflow from peripheralretina will undoubtedly require plots ofother fiber sizes.
Figs. 7 A and IB represent the per centsmall fibers for the two human optic nervecross-sections. Figs. 8A, B, and C representthe per cent small fibers for the threerhesus monkey cross-sections discussed pre-viously.
Discussion
The first investigation of fiber size distri-bution in the primate optic nerve was thatof Chacko4 on a human nerve section. Thiswork was done on a sample of "about 4,000fibers" and showed 40 per cent of the fibersto be 1 fi or smaller in diameter. No sub-division was made of this 1 ;u, group.
A similar count on a human nerve cross-section was done by Oppel.5 He also usedformalin fixation, paraffin embedding, andWeigert stain for myelin. His sample was19,617 fibers. Oppel purported to be ableto connect fiber size with the ganglion celltypes described by Polyak6 on the basis ofGolgi preparations. Oppel suggested thatPolyak's "small diffused ganglion cell" (typeo) and his "garland ganglion cell" (type p)had axons 4 to 8 fx in diameter. SimilarlyPolyak's "parasol ganglion cell" (type m)and "shrub ganglion cell" (type n) hadaxons 2 to 4 jn in diameter. The "midgetganglion cells" (type s) had axons lessthan 2 /A in diameter. Reporting on thesecategories for his sample Oppel found:
Types o & p (4 to 8fi) 1.8 per cent
Types m & n (2 to 4M) 5.9 per cent
Type s (2/t) 92.3 per cent
Chacko had three subdivision of 2 fi diam-eter and lower. There were 80 per cent ofthe total fibers in these categories. It should
Downloaded From: http://iovs.arvojournals.org/pdfaccess.ashx?url=/data/journals/iovs/933707/ on 06/09/2018

Volume 11Number 12 Primate optic nerve morphology. II. 995
SUPERIOR
TEMPORAL
Fig. 5B. Represents Lab. No. 112 B.
SUPERIOR
TEMPORAL
Fig. 5C. Represents Lab. No. 123 A.
Downloaded From: http://iovs.arvojournals.org/pdfaccess.ashx?url=/data/journals/iovs/933707/ on 06/09/2018
996 Potts et al. Investigative OphthalmologyDecember 1972
n rn r1 ! ! ' !' i l l !
4000-4400
3500-3900
3000-3400
2500-2900
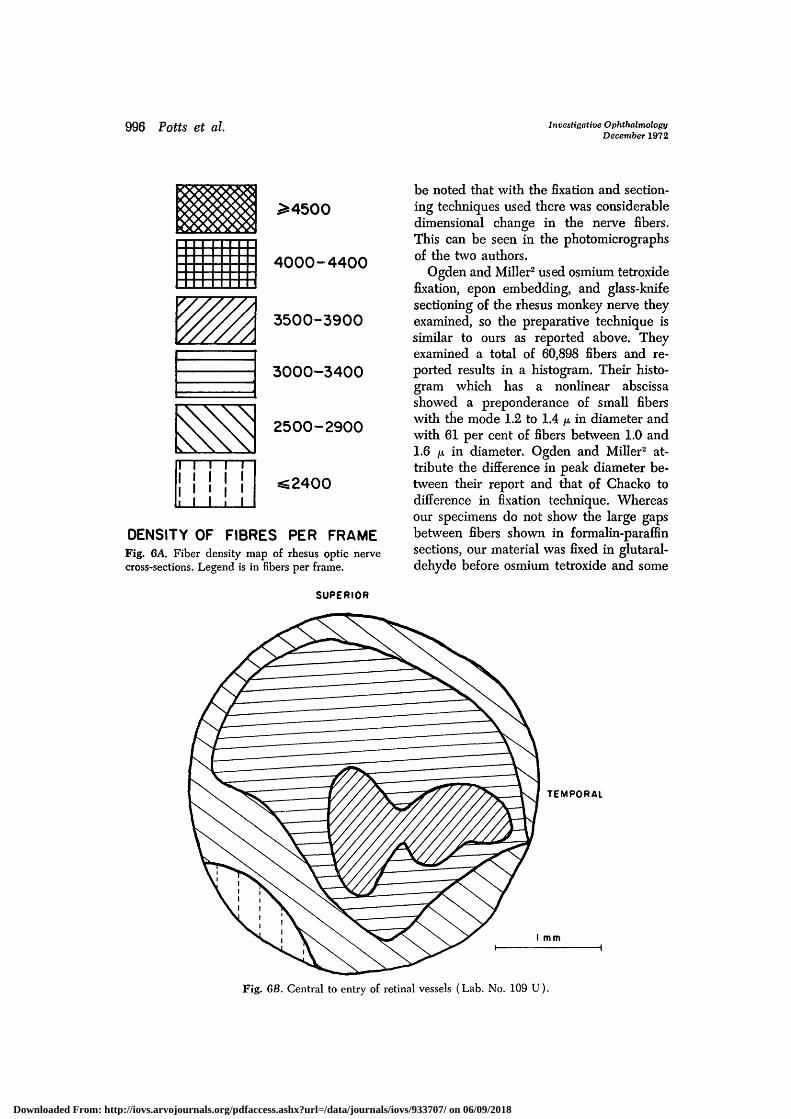
DENSITY OF FIBRES PER FRAMEFig. 6A. Fiber density map of rhesus optic nervecross-sections. Legend is in fibers per frame.
be noted that with the fixation and section-ing techniques used there was considerabledimensional change in the nerve fibers.This can be seen in the photomicrographsof the two authors.
Ogden and Miller2 used osmium tetroxidefixation, epon embedding, and glass-knifesectioning of the rhesus monkey nerve theyexamined, so the preparative technique issimilar to ours as reported above. Theyexamined a total of 60,898 fibers and re-ported results in a histogram. Their histo-gram which has a nonlinear abscissashowed a preponderance of small fiberswith the mode 1.2 to 1.4 fx in diameter andwith 61 per cent of fibers between 1.0 and1.6 p. in diameter. Ogden and Miller2 at-tribute the difference in peak diameter be-tween their report and that of Chacko todifference in fixation technique. Whereasour specimens do not show the large gapsbetween fibers shown in formalin-paraffinsections, our material was fixed in glutaral-dehyde before osmium tetroxide and some
SUPERIOR
TEMPORAL
Fig. 6B. Central to entry of retinal vessels (Lab. No. 109 U).
Downloaded From: http://iovs.arvojournals.org/pdfaccess.ashx?url=/data/journals/iovs/933707/ on 06/09/2018
Volume 11Number 12
Primate optic nerve morphology. II. 997
SUPERIOR
TEMPORAL
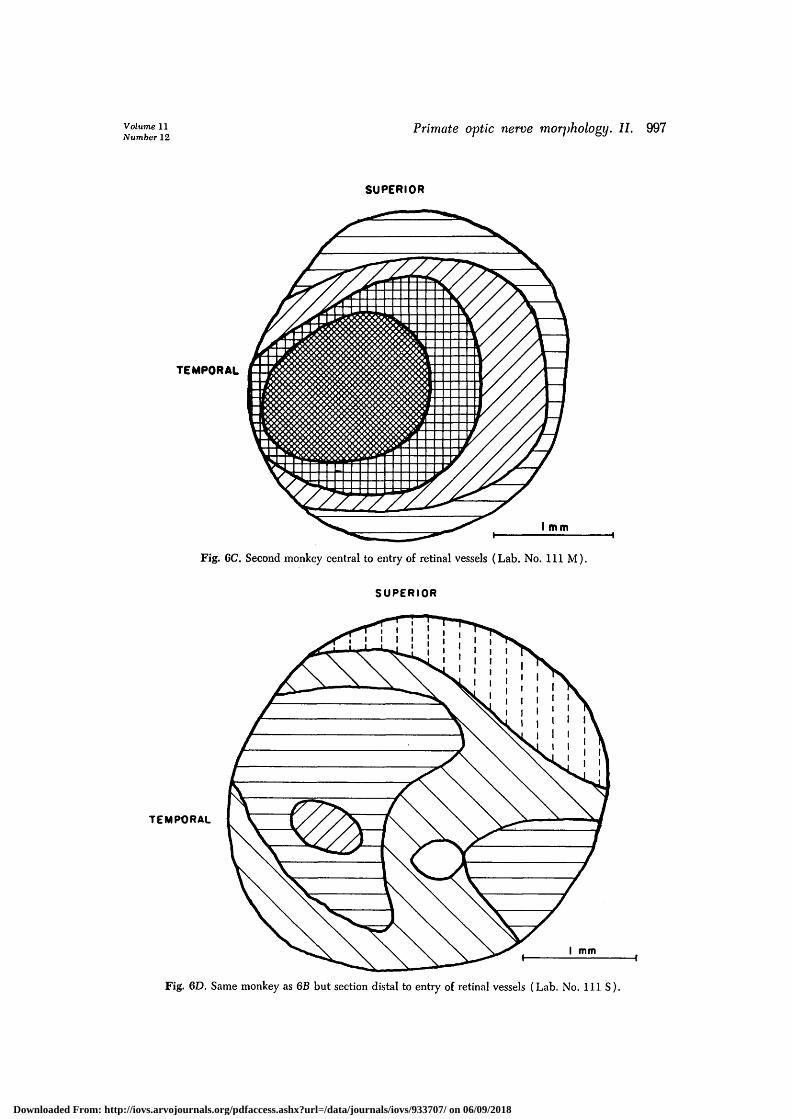
Fig. 6C. Second monkey central to entry of retinal vessels (Lab. No. I l l M).
SUPERIOR
TEMPORAL
Fig. 6D. Same monkey as 6B but section distal to entry of retinal vessels (Lab. No. I l l S ) .
Downloaded From: http://iovs.arvojournals.org/pdfaccess.ashx?url=/data/journals/iovs/933707/ on 06/09/2018
998 Potts et al Investigative OphthalmologyDecember 1972
80-100%
60-79%
40-59%
20-39%
0 -19%
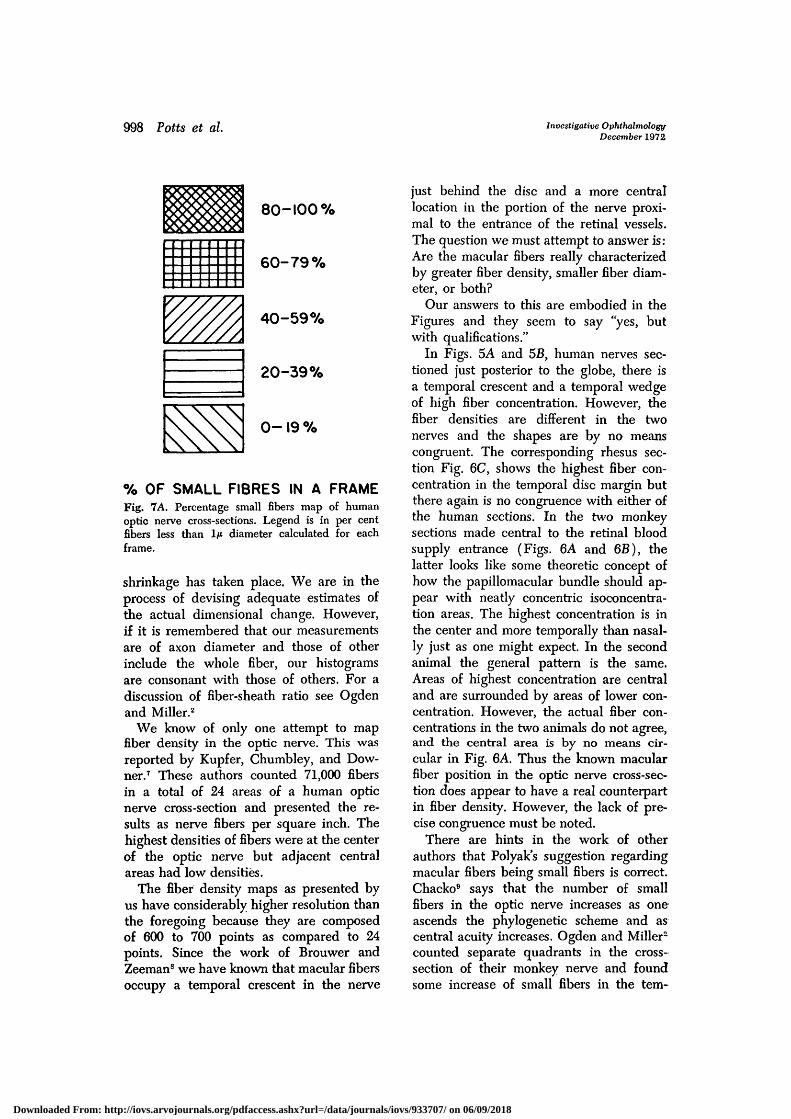
% OF SMALL FIBRES IN A FRAMEFig. 7A. Percentage small fibers map of humanoptic nerve cross-sections. Legend is in per centfibers less than 1M diameter calculated for eachframe.
shrinkage has taken place. We are in theprocess of devising adequate estimates ofthe actual dimensional change. However,if it is remembered that our measurementsare of axon diameter and those of otherinclude the whole fiber, our histogramsare consonant with those of others. For adiscussion of fiber-sheath ratio see Ogdenand Miller.2
We know of only one attempt to mapfiber density in the optic nerve. This wasreported by Kupfer, Chumbley, and Dow-ner.7 These authors counted 71,000 fibersin a total of 24 areas of a human opticnerve cross-section and presented the re-sults as nerve fibers per square inch. Thehighest densities of fibers were at the centerof the optic nerve but adjacent centralareas had low densities.
The fiber density maps as presented byus have considerably higher resolution thanthe foregoing because they are composedof 600 to 700 points as compared to 24points. Since the work of Brouwer andZeeman8 we have known that macular fibersoccupy a temporal crescent in the nerve
just behind the disc and a more centrallocation in the portion of the nerve proxi-mal to the entrance of the retinal vessels.The question we must attempt to answer is:Are the macular fibers really characterizedby greater fiber density, smaller fiber diam-eter, or both?
Our answers to this are embodied in theFigures and they seem to say "yes, butwith qualifications."
In Figs. 5 A and 5B, human nerves sec-tioned just posterior to the globe, there isa temporal crescent and a temporal wedgeof high fiber concentration. However, thefiber densities are different in the twonerves and the shapes are by no meanscongruent. The corresponding rhesus sec-tion Fig. 6C, shows the highest fiber con-centration in the temporal disc margin butthere again is no congruence with either ofthe human sections. In the two monkeysections made central to the retinal bloodsupply entrance (Figs. 6A and 6B), thelatter looks like some theoretic concept ofhow the papillomacular bundle should ap-pear with neatly concentric isoconcentra-tion areas. The highest concentration is inthe center and more temporally than nasal-ly just as one might expect. In the secondanimal the general pattern is the same.Areas of highest concentration are centraland are surrounded by areas of lower con-centration. However, the actual fiber con-centrations in the two animals do not agree,and the central area is by no means cir-cular in Fig. 6A. Thus the known macularfiber position in the optic nerve cross-sec-tion does appear to have a real counterpartin fiber density. However, the lack of pre-cise congruence must be noted.
There are hints in the work of otherauthors that Polyak's suggestion regardingmacular fibers being small fibers is correct.Chacko9 says that the number of smallfibers in the optic nerve increases as oneascends the phylogenetdc scheme and ascentral acuity increases. Ogden and Miller2
counted separate quadrants in the cross-section of their monkey nerve and foundsome increase of small fibers in the tern-
Downloaded From: http://iovs.arvojournals.org/pdfaccess.ashx?url=/data/journals/iovs/933707/ on 06/09/2018

Volume 11Number 12
Primate optic nerve morphology. II. 999
SUPERIOR
TEMPORAL
Fig. IB. Represents Lab. No. 112 B.
SUPERIOR
TEMPORAL
Fig. 7C. Represents Lab. No. 123 A.
Downloaded From: http://iovs.arvojournals.org/pdfaccess.ashx?url=/data/journals/iovs/933707/ on 06/09/2018
1000 Potts et al. Investigative OphthalmologyDecember 1972
80-100%
60-79%
40-59%
20-39%
0 - 19 %
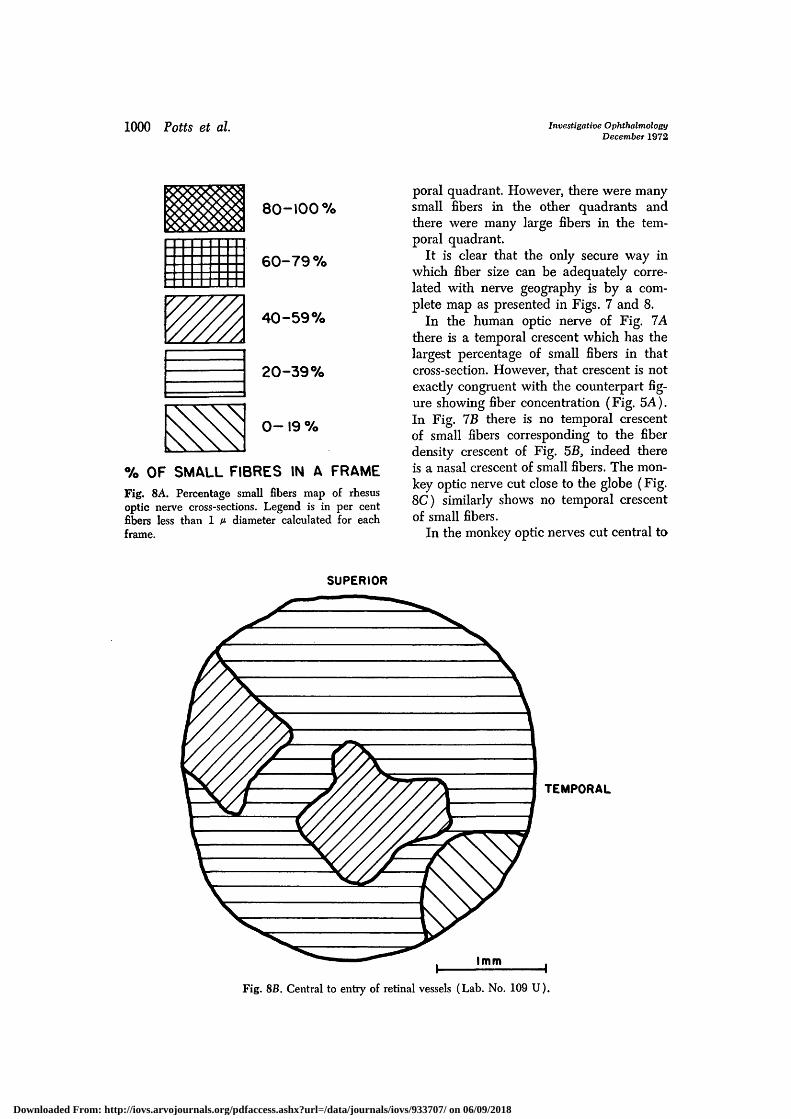
% OF SMALL FIBRES IN A FRAMEFig. 8A. Percentage small fibers map of rhesusoptic nerve cross-sections. Legend is in per centfibers less than 1 M diameter calculated for eachframe.
poral quadrant. However, there were manysmall fibers in the other quadrants andthere were many large fibers in the tem-poral quadrant.
It is clear that the only secure way inwhich fiber size can be adequately corre-lated with nerve geography is by a com-plete map as presented in Figs. 7 and 8.
In the human optic nerve of Fig. 7Athere is a temporal crescent which has thelargest percentage of small fibers in thatcross-section. However, that crescent is notexactly congruent with the counterpart fig-ure showing fiber concentration (Fig. 5A).In Fig. IB there is no temporal crescentof small fibers corresponding to the fiberdensity crescent of Fig. 5B, indeed thereis a nasal crescent of small fibers. The mon-key optic nerve cut close to the globe (Fig.8C) similarly shows no temporal crescentof small fibers.
In the monkey optic nerves cut central to
SUPERIOR
TEMPORAL
Fig. 8B. Central to entry of retinal vessels (Lab. No. 109 U).
Downloaded From: http://iovs.arvojournals.org/pdfaccess.ashx?url=/data/journals/iovs/933707/ on 06/09/2018

Volume 11Number 12 Primate optic nerve morphology. II. 1001
SUPERIOR
TEMPORAL
Fig. 8C. Second monkey central to entry of retinal vessels (Lab. No. I l l M).
SUPERIOR
TEMPORAL
Fig. 8D. Same animal as 8B but distal to entry of retinal vessels (Lab. No. I l l S).
Downloaded From: http://iovs.arvojournals.org/pdfaccess.ashx?url=/data/journals/iovs/933707/ on 06/09/2018
1002 Potts et al. Investigative OphthalmologyDecember 1972
ARM 4 ARM 3 ARM 2
ARM6 ARM 8ARM7
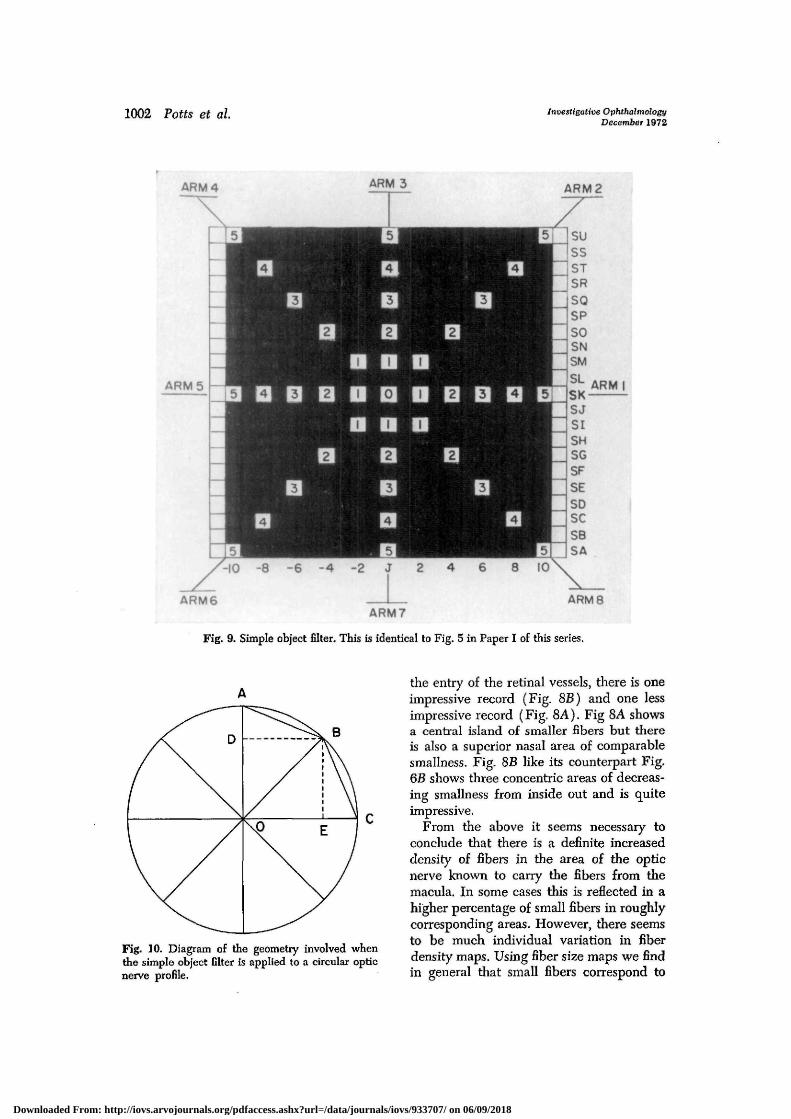
Fig. 9. Simple object filter. This is identical to Fig. 5 in Paper I of this series.
B
Fig. 10. Diagram of the geometry involved whenthe simple object filter is applied to a circular opticnerve profile.
the entry of the retinal vessels, there is oneimpressive record (Fig. 8B) and one lessimpressive record (Fig. 8A). Fig 8A showsa central island of smaller fibers but thereis also a superior nasal area of comparablesmallness. Fig. SB like its counterpart Fig.6B shows three concentric areas of decreas-ing smallness from inside out and is quiteimpressive.
From the above it seems necessary toconclude that there is a definite increaseddensity of fibers in the area of the opticnerve known to carry the fibers from themacula. In some cases this is reflected in ahigher percentage of small fibers in roughlycorresponding areas. However, there seemsto be much individual variation in fiberdensity maps. Using fiber size maps we findin general that small fibers correspond to
Downloaded From: http://iovs.arvojournals.org/pdfaccess.ashx?url=/data/journals/iovs/933707/ on 06/09/2018

Volume 11Number 12
Primate optic nerve morphology. II. 1003
high density. However there are exceptionsto this generalization.
REFERENCES1. Tasaki, I.: Conduction of the nerve impulse, In
Field, J., ed.: Handbook of Physiology, SectionI, Neurophysiology, 1: 75, 1959.
2. Ogden, T. E., and Miller, R. F.: Studies of theoptic nerve of the rhesus monkey: nerve fiberspectrum and physiological properties, Vis. Res.6: 485, 1966.
3. Potts, A. M., Hodges, D., Shelman, C. B., etal.: Morphology of the primate optic nerve. I.Method and total fiber count. INVEST. OPH-THALMOL. 80: 980, 1972.
4. Chacko, L. W.: An analysis of fibre-size in thehuman optic nerve, Br. J. Ophthalmol. 32: 457,1948.
5. Oppel, O.: Mikroskopische Untersuchungeniiber die Anzahl und Kaliber der markhaltigenNervenfasern im Fasciculus opticus des Men-schen, Graefes, Arch. Ophthalmol. 166: 19,1963.
6. Polyak, S.: The Retina, Chicago, 1941, Uni-versity of Chicago Press.
7. Kupfer, C, Chumbley, L., and Downer, J. DeC : Quantitative histology of optic nerve, optictract and lateral geniculate nucleus of man, J.Anat. 101: 483, 1967.
8. Brouwer, B., and Zeeman, W. P. C : The pro-tection of the retina in the primary opticneuron in monkeys, Brain 49: 1, 1926.
9. Chacko, L. W.: A comparative study of thedistribution of the fibre-size in the optic nerveof mammals, J. Anat. Soc. India 3: 11, 1954.
Appendix
In Fig. 9, arms 1 and 3 define two sides of asquare of which arm 2 is the diagonal. The nu-merical value of each arm is the same but theactual length of diagonal arm 2 is 1.41 times(i.e. V2 times) that of arms 1 and 3. (Arms 1and 3 are the sides and arm 2 is the hypotenuseof equilateral right triangles.
a2 + a2 = c2 c = a V2).In Fig. 10, the arms of the filter are placed over
the circular outline of a nerve fiber. One may drawthe triangles OAB and OAC which approximatethe sectors OAB and OAC. If one drops the per-pendiculars BD and BE on sides OA and OCthese can be considered the bases.
As was shown above, units along OB are largeror values are smaller by V2 times those along OAand OC. Considering the 45° right triangles OBEand OBD it can be seen that
but
and
BE and BD
(OB)2 =
OE = BE
OB
(OE)2
• \ OB2
= BE
OB
~ V2+ (BE)2
= 2(BE)2
Thus the value for OB is exactly equal to BE orBD. Thus, when one multiplies the value for OAby that for OB one is multiplying a number equalto the base by a number equal to the altitude andhalf of this product is the true area of the triangleOAB. The sum of the areas of the eight triangles isa good approximation of the area of the circle.
Downloaded From: http://iovs.arvojournals.org/pdfaccess.ashx?url=/data/journals/iovs/933707/ on 06/09/2018