Morphological and histological placental characteristics in relation … · Table 2.3 Checklist for...
239
Morphological and histological placental characteristics in relation to pregnancy outcome in an unselected population. Sangeeta Pathak MB BS MMed MRCOG Submitted for the Degree of Doctor of Medicine University of East Anglia, Norwich September 2010 ©"This copy of the thesis has been supplied on condition that anyone who consults it is understood to recognise that its copyright rests with the author and that no quotation from the thesis, nor any information derived there from, may be published without the author's prior, written consent."
Transcript of Morphological and histological placental characteristics in relation … · Table 2.3 Checklist for...

Morphological and histological placental
characteristics in relation to pregnancy outcome
in an unselected population.
Sangeeta Pathak MB BS MMed MRCOG
Submitted for the Degree of Doctor of Medicine
University of East Anglia, Norwich
September 2010
©"This copy of the thesis has been supplied on condition that anyone who consults it is
understood to recognise that its copyright rests with the author and that no quotation from the
thesis, nor any information derived there from, may be published without the author's prior, written consent."

Page | ii
ABSTRACT
Macroscopic and histological characteristics of the placenta and umbilical cord are
thought to be associated with the perinatal outcome. However, a lack of appropriate
quantitative data on placental morphology makes it difficult to study its effects on the
pregnancy and neonatal outcome. The umbilical cord coiling, its insertion onto the
chorionic plate and the placental shape varies from one pregnancy to another. There
has been very little attempt at quantifying placental and umbilical cord morphology.
Widespread use of digital measurement techniques in biomedical science has
superseded manual measurements. Though this technique has been applied to the
placental measurements, no standardized methodology has been used. This study
formally compares manually and digitally obtained placental measurements using
proprietary software.
This study derives indices describing the cord coiling (cord coiling index), the
relationship of cord insertion to the placental centre (cord centrality index) and the
shape of the placenta (eccentricity) in placentas from unselected pregnancies and
common obstetric outcome groups. This study establishes a quantitative relationship
of birth weight to the placental weight and circumference. It demonstrates that these
indices in pregnancies are affected by common obstetric outcome groups such as;
pre-eclampsia (PET), pregnancy induced hypertension (PIH), gestational diabetes
mellitus (GDM) and delivery of a small for gestational age (SGA) baby.
This study defines the various histological abnormalities of the placenta using strict
criteria. It further investigates the incidence of these predefined histological
abnormalities of the placenta in an unselected population and common obstetric
outcome groups.

Page | iii
The guidelines published on placental examination recommend a detailed
histopathological examination of the placenta in cases of adverse perinatal outcome.
However, there seems to be some degree of uncertainty whether any association
exists between histopathological findings and perinatal outcome. This study
examines the morphological indices and histology of the placenta in infants admitted
to the Neonatal Unit.
This study attempts to identify the relationship between the pregnancy outcome,
neonatal characteristics and placental pathology by examining the pregnancy and
neonatal outcome in all cases with abnormal placental pathology.
This study shows significant correlation between manual and digital measurements
of the placenta. Digital measurement is a reproducible and relatively simple method
and can be of potential importance in the future studies in this field. The quantitative
analysis performed shows that the cord insertion is most commonly “off centre” and
the shape of the placenta is “elliptical”, this finding is contrary to the traditional
belief that the cord insertion is central and the placental shape is round. The study
demonstrates that the morphological indices in common obstetric outcome groups
are not different from the non-affected cases. It also reveals a significant positive
correlation between birth weight to placental weight and circumference.

Page | iv
TABLE OF CONTENTS
TITLE PAGE i
ABSTRACT ii
CONTENTS iv
LIST OF TABLES vii
LIST OF FIGURES x
ACKNOWLEDGEMENTS xiii
CONTRIBUTION OF THE CANDIDATE xiv
PUBLICATIONS xv
PRESENTATIONS xvii
ABBREVIATIONS xix
DEDICATION xxii
CHAPTER 1: INTRODUCTION 2
1.1 Background of the study 2
1.2 Placenta 6
1.2.1 Overview of placental anatomy 6
1.2.2 Placental shape 10
1.3 Umbilical cord 12
1.3.1 Embryology and development of the umbilical cord 12
1.3.2 Overview of umbilical cord anatomy 13

Page | v
Umbilical cord length 14
Umbilical cord diameter 15
Umbilical cord coiling 16
1.3.3 Umbilical cord coiling index 18
1.3.4 Clinical significance of abnormal cord coiling 21
1.3.5 Umbilical cord insertion 23
Velamentous cord insertion 25
1.4 Aims and objectives of the study 27
CHAPTER 2: METHODS 28
CHAPTER 3: A COMPARISON OF MANUAL AND DIGITAL 48
PLACENTAL MEASUREMENTS
CHAPTER 4: MORPHOLOGY: UMBILICAL CORD COILING, 58
UMBILICAL CORD INSERTION AND PLACENTAL
SHAPE IN UNSELECTED PREGNANCIES
CHAPTER 5: MORPHOLOGY: UMBILICAL CORD COILING, 70
UMBILICAL CORD INSERTIONS AND PLACENTAL
SHAPE IN PREGNANCIES WITH COMMON
OBSTETRIC OUTCOME
CHAPTER 6: MORPHOLOGY: PLACENTAL WEIGHT AND 86
CIRCUMFERENCE-SIGNIFICANCE AND
CORRELATION WITH BIRTH WEIGHT IN
UNSELECTED PREGNANCIES AND COMMON
OBSTETRIC OUTCOME GROUPS

Page | vi
CHAPTER 7: HISTOLOGY AND ITS RELATIONSHIP WITH 105
PLACENTAL MORPHOLOGY
CHAPTER 8: MORPHOLOGY AND HISTOLOGY OF THE 134
PLACENTA IN INFANTS ADMITTED TO
THE NEONATAL UNIT COMPARED TO
UNSELECTED PREGNANCIES
CHAPTER 9: CLINICAL OUTCOMES IN RELATION TO 148
PLACENTAL HISTOLOGY
CHAPTER 10: DISCUSSION 159
REFERENCES 175
APPENDICES
Appendix 1: Gestational age at delivery in the study population I
Appendix 2: Study approval letter from research ethics committee III
Appendix 3: Study information form VI
Appendix 4: Consent form IX
Appendix 5: Study poster XI
Appendix 6: Instructions to midwives XIII
Appendix 7: Pathology form defining study inclusions XV
Appendix 8: Communication letters to LREC XVIII

Page | vii
LIST OF TABLES
Table 1.1 Umbilical cord length as per gestation 14
Table 2.1 Obstetrics variables of the study 43
Table 2.2 Protocols for examination of the placenta and umbilical cord 44
Table 2.3 Checklist for histological examination of the placenta and umbilical cord 44
Table 3.1 Baseline demographics of the population studied 51
Table 3.2 Manual and digital measurements of the placenta 51
Table 3.3 Digital placental measurements reported by two recent comparable studies 57
Table 4.1 Qualitative description of cord insertion in different studies 64
Table 4.2 Percentile ranges of morphological indices at 33-43 weeks 67
Table 5.1 Baseline demographics of the reference population with common obstetric
outcome groups 74
Table 5.2 Placental measurements in reference and outcome groups 75
Table 5.3 Direction of cord coiling in reference and outcome groups 76
Table 5.4 Description of Cord Coiling Index in reference and outcome groups 76
Table 5.5 Qualitative description of cord insertion in reference and common obstetric
outcome groups 79
Table 5.6 Description of Centrality index in reference and outcome groups 80
Table 5.7 Description of Eccentricity in reference and outcome groups 82
Table 6.1 Baseline demographics of the reference population 92
Table 6.2 Birth weight, placental weight and circumference in reference and
obstetric outcome groups 92

Page | viii
Table 6.3 Birth weight and placenta weight ratio in reference and common
obstetric outcome groups 94
Table 6.4 Birth weight and placenta circumference ratio in Reference and
common obstetric outcome groups 94
Table 6.5(a-d) Birth weight and placental weight ratios in common obstetric
outcome groups 95
Table 6.6 (a-d) Birth weight and placental circumference ratios in common
obstetric outcome groups 96
Table 7.1 Summary of the diagnostic criteria for predefined histological categories 122
Table 7.2 Demographics of the reference population 124
Table 7.3 Major morphological indices in the reference population 125
Table 7.4 Incidence of predefined histological categories in the reference population and
common obstetrics outcome groups 125
Table 7.5 Comparative analysis of the morphological indices of the placenta in
reference population and abnormal histology groups. 127
Table 8.1 Demographic population of infants admitted tothe Neonatal Unit 139
Table 8.2 Manual and digital measurements of placental and cord in infants
admitted toNeonatal Unit 140
Table 8.3 Qualitatively described cord insertions in infants admitted, non admitted
to theNeonatal Unit and reference population 141
Table 8.4 Morphological indices in the infants admitted versus not admitted to the
Neonatal Unit 141
Table 8.5 Incidence of predefined histological categories in admitted, non-admitted
and reference population 145
Table 9.1 Frequency of predefined histological categories in abnormal placental
histology. 151

Page | ix
Table 9.2 Maternal and neonatal characteristics in cases with normal and abnormal
placental histology 152
Table 9.3 Neonatal resuscitation in abnormal versus normal placental histology groups 153
Table 9.4 Neonatal outcome in abnormal versus normal placental histology 154
Table 9.5 (a) Pregnancy and neonatal outcomes in cases with abnormal and normal
histology 155
Table 9.5 (b) Pregnancy and neonatal outcomes in cases with abnormal and
normal histology 156

Page | x
LIST OF FIGURES
Figure 1.1 Maternal surface of a normal term placenta with cotyledons 6
Figure 1.2 Microscopic view of basal plate of the placenta 7
Figure 1.3 Macroscopic view of chorionic plate of the placenta 8
Figure1.4 Microscopic view of the chorionic plate of the placenta 9
Figure 1.5 Shape variants of the placenta 11
Figure 1.6 (a-b) Macroscopic and histological view (H & E stain) of a normal 3 vessel
view of the umbilical cord 13
Figure 1.7 Coiling of the umbilical cord (a) Normal coiling (b) Hypercoiling (c)
Hypocoiling 17
Figure 1.8 Antenatal ultrasound of cord coiling in 2nd and 3rd trimester of same patient 20
Figure 1.9 (a-d) Qualitatively described cord insertions (a) Central, (b) Eccentric,
(c) Marginal, (d)Velamentous 23
Figure 1.10 Illustration of qualitatively described cord insertions onto the chorionic plate 25
Figure 2.1 Instruments used for gross examination of placenta and cutting sections 32
Figure 2.2 (a) Image J tool bar for placental measurements 35
Figure 2.2 (b-c) Image J scale setting for placental measurements 36
Figure 2.3 Depiction of the placental measurements 37
Figure 2.4 Machines used in tissue preparation 41
Figure 3.1 Scatter plot showing correlation coefficient for manual versus digital
measurements of long axis of the placenta 53
Figure 3.2 Bland Altman plot for long axis of the placenta: manual versus digital
measurements 53

Page | xi
Figure 3.3 Scatter plot showing correlation coefficient for manual versus digital
measurements of short axis of the placenta 54
Figure 3.4 Bland Altman plot for short axis of the placenta: manual versus digital
measurements 54
Figure 3.5 Scatter plot showing correlation coefficient for manual versus digital
measurements of circumference of the placenta 55
Figure 3.6 Bland Altman plot for circumference of the placenta: manual versus
digital measurements 55
Figure 4.1 Frequency histogram of Coiling Index at 33-43 weeks 63
Figure 4.2 Q-Q plot for Coiling Index at gestation 33-43 weeks 63
Figure 4.3 Frequency histogram of Cord Centrality Index at 33-43 weeks 65
Figure 4.4 Explanatory photograph of a placenta showing Cord Centrality Index of 0.36 65
Figure 4.5 Q-Q plot for Cord Centrality Index at 33-43 weeks 65
Figure 4.6 Frequency histogram of placental Eccentricity at 33-43 wks 66
Figure 4.7 Explanatory photograph of a placenta showing Eccentricity of 0.49 66
Figure 4.8 Q-Q plot for Eccentricity at 33-43 weeks 67
Figure 5.1(a-d) Frequency histograms of coiling index of obstetric outcome groups
at 33-43 weeks 78
Figure 5.2 (a-d) Frequency histograms of Cord Centrality Index in outcome groups
at 33-43 weeks 81
Figure 5.3 (a-d) Frequency histograms of placental Eccentricity in obstetric outcome
groups at 33-43 weeks 83
Figure 6.1 (a-c) Frequency histograms of birth weight, placenta weight and circumference
in reference population 93

Page | xii
Figure 6.2 (a-b) z score of birth weight versus placental weight and circumference
in reference population 98
Figure 6.3 (a-b) z score of birth weight versus placental weight in PET 99
Figure 6.4 (a-b) z score of birth weight versus placental weight in PIH 99
Figure 6.5 (a-b) z score of birth weight versus placental weight in GDM 100
Figure 6.6 (a-b) z score of birth weight versus placental weight in SGA 100
Figure 6.7 (a-b) z score of birth weight versus placental circumference in PET 101
Figure 6.8 (a-b) z score of birth weight versus placental circumference in PIH 101
Figure 6.9 (a-b) z score of birth weight versus placental circumference in GDM 102
Figure 6.10 (a-b) z score of birth weight versus placental circumference in SGA 102
Figures 7.1 Microscopic view of chorioamnionitis (a) low power (b) high power 110
Figure 7.2 Microscopic view of VUE (a) low power (b) high power 114
Figure 7.3 Microscopic view of fetal thrombotic vasculopathy 116
Figure 7.4 Microscopic view of massive perivillous fibrin deposition 118
Figure 7.5 Microscopic view of Chorangiosis 120
Figure 7.6 Microscopic view of Chorangioma 120
Figure 7.7 Microscopic view of chronic histiocytic intervillousitis 121
Figure 7.8 Microscopic view of retroplacental haemorrhage 121
Figure 8.1 (a-c) Frequency histograms of macroscopic indices in infants admitted to
Neonatal unit 143

Page | xiii
ACKNOWLEDGEMENTS
First of all, I am heartily thankful to my primary supervisor Mr Christoph Lees of
Cambridge University Hospitals NHS Trust, whose encouragement, guidance and
enthusiasm over past few years in carrying out this research project from the initial to
the final level enabled me to develop an understanding of the subject. Mr Lees was
always available for advice, without his excellent supervision and support writing up
of this thesis would not have been possible.
I am grateful to my other supervisor Prof. Neil Sebire of Great Ormond Street
Hospital, London, who has been a source of constant advice for this research project,
writing thesis and papers.
I am deeply indebted to my supervisor Dr John Winpenny of University of East
Anglia for his constant support during entire study period and up to final writing of
the thesis.
I would like to thank Dr Flora Jessop for guiding me and providing help on the
pathology aspects of the project.
I would also like to thank all the staff in the Department of pathology for their
valuable support and contribution throughout the period of the study.
Finally, I would like to show my gratitude to all those pregnant women, who
participated in the study, without their help this work, would not have been possible.

Page | xiv
CONTRIBUTION OF THE CANDIDATE
The current study was conducted at Addenbrookes Hospital, Departments of Fetal
Medicine and Pathology. The candidate prepared the protocol and submitted the
study to the ethical committee. The candidate prepared the study posters and
designed the pathology form defining the study inclusions.
She displayed the study posters in the Department and informed all the midwives in
the delivery unit. The candidate prepared clear instructions and a flow chart for the
delivery unit staff for this study.
The candidate was responsible for the recruitment of the patients and counselling
them for participation in the study. The candidate made her available to all
participating patients to discuss any queries of the study.
The candidate learnt and personally performed most macroscopic examination and
imaging of the placenta. All histological examinations were performed by
pathologists; Dr Flora Jessop, Addenbrookes Hospital, Cambridge and Prof. Neil
Sebire, Great Ormond Street Hospital, London. The candidate played an active role
in liaising with the Department of Fetal Medicine and Pathology at Addenbrookes‟
and Great Ormond Street Hospital, London.
The candidate prepared the obstetrics and neonatal part of the study database and
established it on the perinatal server of the Addenbrookes Hospital. She was
responsible for entries of all participating patients in the database. She collected all
the data, mostly from the obstetric and neonatal database and remaining from the
patients‟ case notes.
The candidate performed all statistical analyses of the study. She prepared the
manuscripts and submitted the papers to scientific journals under the auspices of her
supervisors.

Page | xv
PUBLICATIONS
Published in peer-reviewed journals
Pathak S, Jessop F, Hook L, Sebire NJ, and Lees C. Placental weight, digitally
derived placental dimensions at term and their relationship to birth weight. J
Maternal Fetal Neonatal Med. 2010 Oct; 23(10):1176-82
Pathak S, Hook E, Hackett G, Murdoch E, Sebire NJ, Jessop F, Lees C. Cord
coiling, umbilical cord insertion and placental shape in an unselected cohort
delivering at term: Relationship with common obstetric outcomes. Placenta. 2010;
31: 963-8.
Pathak S, Sebire NJ, Jessop F, Hackett G, Murdoch E, Hook E, Lees C. Relationship
between placental morphology and histological findings in an unselected population
near term- accepted Virchows Archiv, March 2011
Submitted Papers
Pathak S, Sebire NJ, Jessop F, Hackett G, Murdoch E, Hook E, Lees C.
Macroscopic and Histological Features of Placentas at 34-43 weeks‟ Gestation and
their association with infant admission to the Neonatal Unit- short communication,
BJOG April 2011
Pathak S, Sebire NJ, Jessop F, Hackett G, Murdoch E, Hook E, Lees C. Placental
histology at or near term in relationship to obstetric outcome- Virchows Archiv
April 2011

Page | xvi
Papers in preparation
Placental morphological and histological features: relevance to fetal distress.
Specific placental histology in relation to the obstetrics and Neonatal outcome.

Page | xvii
PRESENTATIONS
Oral Presentation
20.03.2009 Digitalising the placenta
East Anglian Obstetric and Gynaecological
Society (EAOGS), Cambridge.
Oral Poster
17.09.2009 The relationship between cord centrality index,
eccentricity and cord coiling in the term placenta.
19th World Congress on Ultrasound in Obstetrics and
Gynaecology (ISUOG), Hamburg, Germany, 13-17th
September, 2009.
17.09.2009 The Relationship between placental circumference,
placental weight and birth weight at term.
19th World Congress on Ultrasound in Obstetrics and
Gynaecology, Hamburg, Germany, 13-17th September,
2009.

Page | xviii
12.10.2010 Placental weight, cord insertion, shape and cord coiling in
hypertensive disorders of pregnancy.
20th World Congress of International Society of Ultrasound in
Obstetrics and Gynaecology, 10-14th October, 2010. Prague,
Czech Republic.
12.10.2010 Placental weight, cord insertion, shape and cord coiling in
pregnancies with gestational diabetes mellitus (GDM).
20th World Congress of International Society of Ultrasound in
Obstetrics and Gynaecology, 10-14th October, 2010. Prague,
Czech Republic.
13.10.2010 Placental weight, cord insertion, shape and cord coiling in
pregnancies with birth weight less than the 10th percentile.
20th World Congress of International Society of Ultrasound in
Obstetrics and Gynaecology, 10-14th October, 2010. Prague,
Czech Republic.

Page | xix
ABBREVIATIONS
AC Abdominal circumference
aCL Anti cardiolipin antibodies
AFI Amniotic fluid index
aPL Anti phospholipid antibodies
APS Anti phospholipid syndrome
BPD Bi parietal diameter
CCI Cord centrality index
COREC Central office of research and ethics committee
CLD Chronic lung disease
CRL Crown rump length
CRP C-reactive protein
CTG Cardiotocography
DCDA Dichorionic diamniotic
DLC Differential leucocyte count
FL Femur length
GDM Gestational diabetes
HC Head circumference
ITP Idiopathic thrombocytopenic purpura
IUD Intra uterine death

Page | xx
IUGR Intra uterine growth restriction
IVT Intervillous thrombus
LA Lupus anticoagulant antibodies
MCA Middle cerebral artery
MCDA Monochorionic diamniotic
MPFD Massive perivillous fibrin deposition
NEC Necrotizing enterocolitis
NGA Normal for gestational age
NICU Neonatal intensive care unit
OGTT Oral glucose tolerance test
PDA Patent ductus arteriosus
PET Pre-eclampsia
PI Pulsatility index
PIH Pregnancy induced hypertension
PMNs Polymorphonuclear leucocytes
PPROM Preterm premature rupture of membranes
PROM Premature rupture of membranes
RDS Respiratory distress syndrome
ROP Retinopathy of prematurity
SCBU Special care baby unit
SGA Small for gestational age

Page | xxi
SLE Systemic lupus erythematosus
SUA Single umbilical artery
TLC Total leucocyte count
TORCH Toxoplasma, Rubella, Cytomegalovirus and Herpes
UCI Umbilical coiling index
VUE Villitis of unknown etiology

Page | xxii
DEDICATION
I dedicate this work to Rahul, Akanksha, Akshita and my parents who have been a
source of inspiration in everything I do

CHAPTER 1 : INTRODUCTION

CHAPTER 1: INTRODUCTION
Page | 2
1.1 BACKGROUND OF THE STUDY
The placenta is a neglected human organ. Pathological assessment of the placenta may
provide considerable information which may have significant clinical impact on
mother and the neonate. According to the guidelines of the Royal College of
Pathologists, any sample of diagnostic value removed from the human body should be
histologically examined, with only a few exceptions.1 One of the exceptions is the
healthy human placenta, but even with valid indications the human placenta is one of
the most under-examined specimens.2 There are no gold standards for placental
examination for clinical indications. There is also evidence that the quality of reports
on the investigation of the placenta is very variable.3 There is no consistency in the
gross and histological reporting of the placenta. There is also a considerable
discrepancy rate in the diagnosis of placental disease, and it is common for general
surgical pathologists not to recognise placental lesions that may have clinical
relevance.4 It has been suggested that the standards of placental surgical reporting can
be improved, possibly by the use of templates and checklists for reporting of
placentas.3
The placental and umbilical cord measurements vary greatly from one pregnancy to
another. There has been an increasingly growing interest in the morphometry of the
placenta and the umbilical cord. We do not know if umbilical cord coiling, abnormal
insertion of umbilical cord onto the chorionic plate and chorionic plate shape are
linked with perinatal outcome. As per normal practice, morphology of the placenta
and umbilical cord are defined qualitatively. Traditionally coiling of the cord, cord
insertion and the placenta shape has been described qualitatively by almost all studies.
These indices may have clinical associations with pregnancy outcome though there is
a need to derive quantitative morphological indices, describing the above parameters
in order to improve the accuracy of diagnosis. In recent years many researchers have
emphasised an importance of hyper or hypo coiling of the cord.5-8 These studies have
suggested adverse perinatal outcome with abnormal (hyper/hypo) insertion. However,
there is still uncertainty with regards to the exact association of abnormal coiling to

CHAPTER 1: INTRODUCTION
Page | 3
the perinatal morbidity and mortality. It is believed that peripheral insertions of the
umbilical cord are linked to poor pregnancy and neonatal outcome. There is confusion
with the paracentral (eccentric) cord insertion type, as most studies conducted in the
past have explained the paracentral insertion qualitatively. Central and paracentral
insertions have no clinical significance; however, an extreme eccentric insertion may
be associated with poor pregnancy and neonatal outcome.9 Shapes of the placenta
have been described as round, oval, irregular, star shaped, multi-lobate.10 Irregular
chorionic plate shape may have an association with altered placental function
resulting into adverse outcomes such as low birth weight and placenta weight ratio.10
To avoid the subjective bias in placental morphological analysis, we derived
quantitative indices describing umbilical cord insertion, as “Cord Centrality Index”
and chorionic plate shape as “Eccentricity”. The coiling of the umbilical cord has
been defined by an already established method as “Cord Coiling Index”.11
A common practice of examination of the placenta, following an adverse perinatal
outcome, such as pre term labour, severe intra uterine growth restriction (IUGR), still
birth or poor neonatal outcome is to perform a manual measurement of the placenta
and the umbilical cord. Digital imaging is being used in many sub disciplines of
medicine including digital measurements of the placenta. 12-13 In the current study,
digital measurements of the placenta were performed using an image processing
programme, Image J. This java image processing software has been used in various
studies and compared with other advanced routinely used investigative techniques
such as CT and MRI.14
There are certain potentially treatable maternal conditions, recurrent placental or
inherited fetal conditions that can be identified by placental examination. Therefore,
there is a need to standardise the method and reporting of placental examination. In
order to advance and promote better understanding of placental pathology, the
College of American Pathologists have encouraged clinicians to perform studies on
the placenta and umbilical cord.

CHAPTER 1: INTRODUCTION
Page | 4
The American college of Pathologists published guidelines in 1991 to encourage
properly designed placenta studies with appropriate outcome parameters necessary to
draw conclusions.15
Tragedies such as perinatal death or severe neurological impairment are increasingly
recognised as being associated with pathological conditions of the placenta and the
umbilical cord. These frequently develop long before labour and delivery and cannot
be prevented by even the most attentive obstetric care. Under these circumstances,
examination of placenta and umbilical cord in the delivery room as well as in the
pathology laboratory can make a crucial contribution to the investigation of instances
of pregnancy failure.
The placenta is a functional unit between the mother and the fetus. Therefore, any
pathological event concerning the mother or the fetus may influence the normal
function of the placenta, occasionally resulting in morphological changes. Severe
abnormalities of the placenta may lead to adverse fetal outcome. However, placental
lesions are not necessarily the cause of unfavourable obstetric outcome, and some
structural changes may be the consequences of poor fetal condition.16
Placental examination can be helpful in identifying the etiology of stillbirth, preterm
delivery, intrauterine growth restriction, and neurodevelopment impairment. It may be
possible to determine whether the pathological condition that endangered the well
being of the fetus was an acute or a chronic process.17-18 Conditions with the risk of
recurrence can be recognised, resulting in adequate treatment and preventive measures
during subsequent pregnancies. There has been study performed to determine whether
placental investigations assist in determining the cause of still birth and found some
placental lesions were associated with clinical causes of still birth such as placental
infarction, leukocyte infiltration and chorioamnionitis. Assessment of placenta can aid
classification of still birth, even when full infant post-mortem is declined.19

CHAPTER 1: INTRODUCTION
Page | 5
Placental examination may have medico legal implications for example, concerning
the aetiogy of long term neurodevelopment sequelae or the approximate timing of an
intrauterine death.20-21
The placenta is one of the important means of establishing that the fetal damage may
cause adverse pregnancy outcome independent of clinical care.
The entire literature is dominated by small case series of placental abnormalities
rather than defining incidence of histological pathologies of the placenta in a general
population. Previous studies on placental pathology have been largely confined to the
association of particular outcomes in relation to specific abnormalities, usually in a
small number of selected cases. The majority of studies are retrospective and notable
also is the minimal consideration in published studies given to the combined effects of
multiple placental lesions.
Another major concern is that most studies of the placenta are based on abnormal
placentas, which makes it difficult to differentiate between the “pathologically
abnormal” versus “normal variant”. There are few studies that analyse normal
placentas statistically and identify the normal variants of histological lesions during
the course of pregnancy.
Recent advances such as more advanced ultrasound techniques, MRI in fetal medicine
and placental pathology are now such that the opportunity exists to establish clearly
which placental lesions represent the greatest threat to a healthy pregnancy and to a
positive neonatal outcome. It is believed from that certain placental lesions are
associated with poor neonatal outcome; conversely, there are relatively recently
described placental lesions such as abnormal cord coiling, Villitis of unknown
aetiology and thrombotic vasculopathy where the precise clinical implications are still
not well understood.
This study will unite antenatal observations and neonatal outcomes with macroscopic
and microscopic examination of a cohort of unselected pregnancies delivered in a
single unit. We expect through this research to propose quantitative indices and
establish a rationale for identifying both normal and pathological appearances of
placental histology, by linking the findings with pregnancy and neonatal outcome.

CHAPTER 1: INTRODUCTION
Page | 6
1.2 PLACENTA
1.2.1 Overview of placental anatomy
The placenta is the most important and the only organ between mother and fetus,
serving multiple functions. It acts as an endocrine organ producing several types of
hormones e.g. lactogen, chorionic gonadotrophins etc. It allows the exchange of
oxygen and CO2, whereby transfer of oxygen takes place from maternal blood to the
fetus, and carbon dioxide goes out from fetus to mother. It allows the transfer of
carbohydrates, protein, amino acid, polypeptides, lipids, vitamins, water, electrolytes
and pharmacological agents from the mother to the fetus.
A placenta has a maternal surface (basal plate) and a fetal surface (chorionic plate).
The basal plate and chorionic plate meets at the placental margin and form the smooth
fetal membranes. The space between chorionic and basal plate is filled with the
intervillous lakes of maternal blood.
Basal plate
Figure1.1 Maternal surface of a normal term placenta with cotyledons (study photograph)

CHAPTER 1: INTRODUCTION
Page | 7
The basal plate is the placental surface, attached to the uterine wall during pregnancy,
once separated called basal plate or maternal surface. Therefore the basal plate would
have both fetal as well as maternal component to it, seen microscopically. The
maternal surface is opaque, dark red in colour, consists of protuberant growths called
cotyledons, usually 10-40 in a healthy normal term placenta, these cotyledons are
separated by grooves, occupied by placental septa in situ (fig 1.1). These septas can
extend even up to the fetal surface.
Microscopic view
Figure 1.2 shows the microscopic view of the basal plate. The basal plate has fetal
extravillous trophoblasts and all types of maternal cells from uterine deciduas and
deciduas basalis. The villi are surrounded by the maternal endometrium. The
trophoblast cells, lining the endometrial side of the villi, synthesize extracellular
matrix, fibronectin. In microscopic examination of the basal plate, dilated maternal
spiral arteries lined by fibrinoid matrix together with endovascular trophoblasts can be
seen.
Figure 1.2 Microscopic view of basal plate of the placenta (study photograph)

CHAPTER 1: INTRODUCTION
Page | 8
Chorionic plate
This is the fetal surface of the placenta; a variable amount of whitish-yellow
subchorionic fibrin can be seen under the chorion (fig 1.3). There is no clinical
importance of subchorionic fibrin unless it is massive and extensive. Amnion is
composed of epithelium and amniotic mesenchyme. Amniotic mesenchyme is
attached to the chorionic mesenchyme loosely, which can be very easily separated.
The umbilical cord is attached onto the fetal surface. Chorionic vessels run in the
chorionic mesenchyme, which are then continuous with the vessels of the umbilical
cord that eventually supplies the villous tree. The chorionic veins give rise to one
single umbilical vein. Umbilical vessels give rise to multiple branches, which spread
all over the fetal surface, up to the peripheral margin of the placental disc.
Figure 1.3 Macroscopic view of chorionic plate of the placenta (study photograph)

CHAPTER 1: INTRODUCTION
Page | 9
Stem villi are composed of dense connective tissue, which are surrounded by arteries
and vein. The arteries are thick walled compared to the veins. Peripheral extension of
the stem villi gives rise to immature intermediate villi, which i mplant in the basal
plate and mature intermediate villi. Immature intermediate villi are predominant form
of villous tree in immature placentas, between 8-20 weeks of pregnancy.22 Mature
intermediate villi develop early in third trimester and this type makes up to quarter of
villi in a mature placenta.
The lateral expansion of the chorionic plate of the placenta plateaus by the middle of
third trimester.23 At 30-32 weeks gestation, growth of the placenta is mainly by
arborisation of the villous tree, resulting into the growth of its thickness.24
Figure 1.4 Microscopic view of the chorionic plate of the placenta (study photograph)

CHAPTER 1: INTRODUCTION
Page | 10
1.2.2 Placental Shape
Normal development of a placenta is the one of the important requirements for a
healthy pregnancy, regulating fetal growth and fetal health. The placental shape is
evidence of a normal development of the placenta. The placenta is normally
considered to be a round discoid shape; however the shape has been described in
various ways such as round, oval, irregular, star shaped, bi-lobate, multi-lobate,
circumvallate, circummarginate and many more (figure 1.5). The placenta is the
primary source of nutrients and oxygen to the fetus. A variable maternal utero
placental environment affects macroscopic placental structure as a change in shape.10
Therefore, the shape of the chorionic plate is a reflection of the function of the
placenta and an abnormal placental shape could indicate abnormalities in utero-
placental environment.
The clinical significance of abnormal placental shape has led to mixed opinions. One
view is that irregular shapes are associated with lower birth weight for placental
weight, suggesting variable shaped placentas have altered function.10 Some believe
that abnormal shapes (circumvallate and circummarginate) are simply variants of
normal shape and has no clinical significance25 while one of the large studies of 7666
cases has shown association of circumvallate placenta to the higher incidence of
preterm labour, placental abruption and intra uterine fetal death.26 Another study
showed higher odds of intra uterine fetal death (OR 4.7; 95% CI 1.4-15.1), preterm
delivery at < 32 weeks (OR 4.7; 95% CI 1.6-14.1) and intrauterine growth restriction
(OR 4.7; 95% CI 1.4-15.1) with abnormal shape of placenta than did the women with
a normal placental shape.25 27
A placenta with accessory lobes (succenturiate lobes) can potentially be detected
antenatally by ultrasound; most have no clinical significance but may be associated
with retained accessory lobe after delivery leading to either post partum haemorrhage
or uterine sub involution. Multilobate placenta may be associated with velamentous
insertion or blood vessels traversing in between the lobes, covering cervix, causing
vasa previa.

CHAPTER 1: INTRODUCTION
Page | 11
Traditionally placental shape is described qualitatively but recently a study emerged
with quantitative analysis of the shape of the placenta. 10 The same group related the
variability in the chorionic plate shape to the structure of the underlying vascular
tree. Figure 1.5 shows the different variants of placental shapes. First column shows
the normal round to oval shape, while 2nd column with star shaped placenta and 3rd
column has placentas with accessory lobes.
Figure1.5 Shape variants of the placenta
(Source- Yampolsky M, Salafia CM, Shlakhter O, Haas D, Eucker B, Thorp J. Modeling the variability of
shapes of a human placenta. Placenta 2008;29(9):790-7).10

CHAPTER 1: INTRODUCTION
Page | 12
1.3 UMBILICAL CORD
1.3.1 Embryology & Development of the Umbilical Cord
The primitive umbilical ring is the junction between amnion and embryonic ectoderm.
At the fifth week of development, structures passing through this ring are the
connecting stalk containing allantois and umbilical vessels, yolk sac (vitelline duct)
with vitelline vessels and the canal connecting intra and extra embryonic cavities.
Extra-embryonic mesoderm grows towards the centre to form the chorionic cavity, a
place which is occupied by the proper yolk sac. During the development, the yolk sac
rotates towards the implantation site. The embryo then folds into the amniotic cavity.
Subsequent expansion of the amniotic cavity occurs at the expense of chorionic
cavity. Later amnion envelops the connecting stalk and yolk sac stalk together and
that forms the primitive umbilical cord. During early development, 13-40 days post
conception umbilical cord forms at the site of the connecting stalk, which joins the
extra embryonic mesoderm to the embryonic disc. Proximally the primitive umbilical
cord also contains some intestinal loops. By the end of the third month amnion has
expanded in such a way that it comes in contact with chorion, obliterating chorionic
cavity. The yolk sac shrinks and gets obliterated. As the development progresses, the
connecting stalk containing allantois, vitelline duct and the umbilical vessels gets
smaller in diameter and increases in length. Later allantois and vitelline duct are
obliterated. Umbilical vessels remain at the end of the development, which is
surrounded by the Wharton‟s jelly. There are two umbilical arteries, formed from two
embryonic allantoic arteries. Initially there are two allantoic veins but as the
development progresses, within first two months, the right allantoic vein disappears
and only left forms the umbilical vein.

CHAPTER 1: INTRODUCTION
Page | 13
1.3.2 Overview of Umbilical cord anatomy
In a typical three vessel umbilical cord there are two umbilical arteries and one
umbilical vein, suspended in a mesodermal mucoid matrix stroma, called Wharton‟s
jelly. There are no nerves or lymphatic vessels in the umbilical cord. Wharton‟s jelly
consists of myofibroblasts and ground substance.28-29 This combination of loose gel
and contractile cells gives the umbilical cord tensile strength and umbilical vessels are
protected against any pressure or compression. The umbilical arteries do not have an
internal elastic lamina and the media of the artery is composed of peripherally
arranged spiral muscles. The umbilical vein does have an elastic lamina and the
smooth muscle layer is thinner than the umbilical artery. Therefore, during the
antenatal period, the protective elements for any umbilical cord are amniotic fluid,
Wharton‟s jelly and the helical coiling of the umbilical vessels.
a
b
Figure 1.6 Macroscopic and histological view (H & E stain) of a normal 3 vessel view of the umbilical
cord (a)study photograph (b) Websource-http://library.med.utah.edu/WebPath/PLACHTML/PLACIDX.html#5)
CHAPTER 1: INTRODUCTION
Page | 14
Umbilical cord length
It is still not well understood, what factors exactly decide the length of the umbilical
cord. However, the evidence so far available suggests fetal movement producing the
tensile force on the umbilical cord and genetic factors play an important role in
deciding the length of cord. Most studies on the placenta and umbilical cord to date
have measured cord which is attached with the placenta. Ideally the measured length
of the cord should also include the measurement of the cord attached to the baby. As
that length can be variable depending on the condition of the baby on delivery, its
length taken only on the part attached to the placenta will not be a true measurement
of the cord.
It is believed that the tensile strength produced from the fetal movements is an
important deciding factor for the length of the cord; conditions which affect the fetal
movements‟ in-utero will affect the length of the cord too. Conditions restricting fetal
movements such as skeletal dysplasia, amniotic bands, oligohydramnios, multiple
pregnancies, uterine malformation usually have a short cord.30-32
Boyd and Hamilton (1970)33 reported on lengths at various gestation as outlined
below in the table. This table reflects the increasing length with increasing gestation.
Table 1.1 Umbilical cord length as per gestation (Source-Boyd and Hamilton-1970)33
Gestation (month) Length of fetus (mm) Average cord length (cm) Range (cm)
Third 31-60 6 2.3 – 10.5
Fourth 61-100 15 5 – 25
Fifth 101-150 25 14.5 – 45
Sixth 151-200 28 21 – 48
Seventh to term 200-340 35 22 – 48 (or more)

CHAPTER 1: INTRODUCTION
Page | 15
Though the umbilical cord is extremely variable in length, an average normal length
of umbilical cord is 55-60 cm.9 The minimum cord length which allows the normal
vertex delivery is 32cm.34. Since this study, most authors have accepted this length as
a minimum length, anything less than this is considered to be a short cord.
Considering this definition of short cord, the incidence of short cord has been reported
as 0.4-0.9% 35-37, while in one study incidence of cord less than 35 cm was 2%.38
A short cord has been associated with intrauterine fetal distress and neonatal
asphyxia.39 It is believed that a possible cause of fetal hypoxia with short cord is
excessive traction on the cord during descent of the fetus, which results into occlusion
of the cord vessels. However, this remains speculative as the pH and base deficit of
the umbilical blood were the same for neonates with normal umbilical cord length. 38
There is no agreed definition, as to what should be termed as excessive long cord.
Some studies have defined cord length more than 80 cm as long cords38, while others
have taken 100 cm as the upper limit of the cord length.36 These studies have defined
incidence of long cords as 3.7%12 and 0.5%10 respectively. Long cords have been
associated with increased knotting (true knots), torsion and cord prolapsed.40
Umbilical cord diameter
The umbilical cord diameter depends upon the number of vessels present, size of the
umbilical vein and the fluid content of Wharton‟s jelly. By what, factors determining
the amount of water content in Wharton‟s jelly are not clearly understood. The normal
cord diameter is 1-2 cm and the cord can be oedematous in clinical situations such as
maternal diabetes mellitus. Fetal outcomes are better with increased jelly in the cord,
while cords with reduced Wharton‟s jelly are more prone to compression and
abnormal fetal heart rate pattern, an absence of Wharton‟s jelly around umbilical
vessels have been reported to be associated with perinatal death. 41

CHAPTER 1: INTRODUCTION
Page | 16
Umbilical cord coiling
The umbilical cord is protected by Wharton‟s jelly, coiling of the umbilical vessels
and the amniotic fluid. The umbilical cord is a coiled, helical structure but the origin
of coiling remains unknown. Possible explanations of the origin of coiling have been
given as torsion by active or passive movements, causing the embryo to rotate around
its umbilical cord axis42, presence of Roach muscle, which is a small bundle of
muscles lying just beside the umbilical artery, contributing to the coiling43, and
hemodynamic forces of the fetus.44
Umbilical cord coiling is well established by 9 weeks of gestation. It is unknown
whether there are genetic factors involved in coiling or if it is only acquired but the
degree, tensile stress and the number of coils seems to be affected by in-utero fetal
movements.45 Considering the fetal movements as a theory for coiling of the umbilical
cord, hypocoiling is seen in cases of fetal anomalies affecting fetal movement such as
amniotic bands, oligohydramnios, uterine malformations, twins and pregnancy
affected by chromosomal anomalies46 whereas hypercoiling is more common in
parous women, male fetus (presumed to be more active) have longer cord than female
fetus, maternal cocaine use and longer umbilical cords.47 The hypocoiled cord is
more prone to kinking, compression and stasis.
Frequency of noncoiled cord is reported as 4.3-4.9%5 48 while hypercoiling has been
reported as high as 20% in unselected placentas.6

CHAPTER 1: INTRODUCTION
Page | 17
a
b
c
Coiling is either anti-clockwise (left) or clockwise (right). Anti clockwise coiling is
more common. To define the direction of coils, the umbilical cord is placed vertically
and vessels on the anterior surface of the cord are noted; if the direction is towards the
left hand of the observer, it is noted as left sided coiling and right sided if it directed
towards observer‟s right hand. Studies have observed the direction of coiling either
from placental end49 or from the fetal end 50, however the direction of the coiling
would not in fact alter whether viewed from the placental or the fetal end.51 The
prevalence of anti-clockwise coiling varies from 65 to 76%.8 49 It is not very well
understood why anti-clockwise pattern is more common, few researchers have
proposed a possible explanation to this, as cranial arteries also have a spiral form,
there may be a relationship between the direction of umbilical arteries spirals and left
or right sided cerebral dominance.
Figure 1.7 Coiling of the umbilical cord (a) Normal coiling (b) Hypercoiling (c) Hypocoiling
(study photographs)

CHAPTER 1: INTRODUCTION
Page | 18
1.3.3 Umbilical Cord Coiling Index
Umbilical cord coiling was first described in terms of the number of coils in 1954 42
as “The index of Twist”, which was calculated by dividing the total number of coils
by the umbilical cord length in centimetres. The coiling pattern was described as
negative for anti-clockwise and positive for clockwise coiling. Later studies11 defined
coiling as the term “The Umbilical coiling Index” (UCI). UCI was determined by so
called Strong‟s formula by dividing the total number of complete umbilical vascular
coils by the umbilical cord length (in centimetres), UCI was reported as 0.21 ± 0.07
coils/cm, there being at least one coil in every 5 centimetres of the cord. Therefore
hypocoiling of the umbilical cord will be defined for UCI smaller than 10 th percentile
(i.e. less than or equal to 0.1), while hypercoiling as UCI above 90th percentile (i.e.
equal to or more than 0.3).
Antenatal Assessment of Cord Coiling Index
The umbilical cord can be studied sonographically for various prenatal abnormalities
or possible pathologies. Apart from traditional antenatal assessment of the umbilical
cord, which includes only the number of blood vessels in the umbilical cord and
Doppler assessment of the umbilical arteries, further detailed assessment can be done
prenatally, such as the amount of Wharton‟s jelly, diameter of umbilical vessels7,
coiling pattern and coiling index.49 52
Though the reproducibility of these measurements is not yet at a level where they can
be put to widespread use.
UCI can be calculated for the cord either at fetal end, placental end or the central part.
There is more coiling towards the fetal end as compared to the placental end 53,
therefore UCI will be increasing as we move from the placental end to the fetal end.
In studies the UCI has been measured at the placental end at the umbilical cord
insertion, or the fetal end near the umbilical cord entrance into the fetal abdomen and
in the middle of these two49 to obtain the true UCI.
CHAPTER 1: INTRODUCTION
Page | 19
To assess the UCI prenatally, in a longitudinal image of the umbilical cord, a pair of
coils is identified and the distance between the coils is measured and UCI is
calculated. However it is not clear as to which section of the umbilical cord should be
chosen and how many intercoil distances should be measured to obtain the true UCI
(postnatal UCI).
Coiling of the umbilical cord is fully developed by end of the first trimester and it
does not change after this except that the length of the cord keeps getting bigger in
between the coils.42 54 In the second trimester, the entire umbilical cord can be
visualised better in its entirety as compared to the examination in third trimester,
where with relatively reduced liquor volume and the growing fetus, obtaining full
view of the longitudinal section of the umbilical cord can be challenging especially of
the fetal end of the umbilical cord. Therefore the most appropriate time to assess
prenatal UCI should be second trimester with relatively greater amount of the
amniotic fluid as compared to the fetal size, which allows the visualization of the most
part of the cord. Studies have shown that sonographic evaluation of umbilical cord
coiling in the second trimester correlates with the true UCI at birth.55

CHAPTER 1: INTRODUCTION
Page | 20
a b
Postnatal Assessment of Cord Coiling Index
The true UCI is the one which is assessed after birth. At delivery, the direction and the
number of coiling are noted and umbilical cord coiling index is calculated by the
standard Strong‟s formula that is defined as dividing the total number of completed
coils by the length of the umbilical cord.
Antenatal versus Postnatal Assessment of Cord Coiling Index
The sensitivity of second trimester sonographic measurement for predicting
hypocoiling or hypercoiling ranged from 9-40%49 52 as compared to the postnatal
measurement of UCI. The distension of the umbilical vessels with the fetal blood
resulting into tighter coiling of the vessels and therefore increased UCI could be the
possible explanation for this low sensitivity56, or more coiling being towards the fetal
end as compared to the placental end, or limited visualisation of the umbilical cord
after the second trimester due to the relative fetal size and the amount of liquor
volume, making it difficult to measure UCI.
Most studies are not able to examine the umbilical cord which remains attached to the
baby and the cord attached to the neonate could be of any length. Whether that makes
any difference in the calculation of post-partum UCI, considering that umbilical cord
is more coiled on the fetal end, is not clear.
Figure 1.8 Antenatal ultrasound of cord coiling in (a) 2nd and (b) 3rd trimester of the same
patient

CHAPTER 1: INTRODUCTION
Page | 21
1.3.4 Clinical significance of abnormal cord coiling
Maternal risk factors for abnormal vascular coiling have been proposed as extremes of
maternal ages, obesity, gestational diabetes mellitus and pre-eclampsia57, while others
did not find any association between UCI and maternal age.58-59
Hypocoiling and hypercoiling of the cord whether detected prenatally or postnatally,
have been correlated with adverse perinatal outcome. Researchers have related
different variables to the abnormal coiling of the umbilical cord. Hypocoiling has
been associated with trisomies, preterm delivery, fetal death, increased intrapartum
complications and interventional deliveries for fetal distress, Apgar score less than 7
at 5 minutes, velamentous cord insertion and single umbilical artery, while
hypercoiling of the umbilical cord has been linked with trisomies, small for gestation
age, fetal asphyxia and single umbilical artery.5 8 Abnormal cord coiling is also
associated with the thrombosis of the chorionic plate vessels, umbilical venous
thrombosis and umbilical cord stenosis.6
There is still controversy regarding the association of hypocoiling and adverse
pregnancy outcome. A possible explanation for hypocoiling and adverse perinatal
outcome has been attempted by showing a significant correlation between umbilical
coiling index and umbilical venous blood flow7 60, which further suggest that
quantitative analysis of umbilical venous blood flow may be a useful tool in
conditions such as intra uterine growth restrictions.60-61 Umbilical cord is considered
as a pumping system, the coiling of the cord is believed to contribute to the fetal
venous return by creating a umbilical venous pressure.62 Increased coiling would
perhaps make this pumping system more efficient and therefore increase umbilical
blood flow while the hypocoiling of the cord would lead to reduced blood flow and
eventually affects the growth of the fetus causing intrauterine growth restriction.62 It is
also thought that overcoiling makes a cord less flexible and undercoiling makes a cord
floppy, making an undercoiled cord more prone to entanglement.63

CHAPTER 1: INTRODUCTION
Page | 22
Complicated pregnancies and UCI
Studies have investigated those placentas and umbilical cord, which needed a
histological examination of the placenta for various indications such as fetal demise,
intrauterine growth restriction, preterm delivery, pre-eclampsia, diabetes mellitus,
macroscopic abnormalities of placenta, fetal asphyxia, and intra uterine infection.
Fetal death, preterm delivery, umbilical artery pH<7.05, fetal structural and
chromosomal anomalies, fetal placental vessel thrombosis, fetal hypoxia and low birth
weight were associated with hypercoiling while chorioamnionitis, lower Apgar score
at 5 minutes were associated with hypocoiling. Fetal demise and structural or
chromosomal fetal congenital anomaly cases were associated with hyper and
hypocoiling of the cord.63
As the umbilical cord coiling index can be assessed prenatally, the association of
abnormal cord coiling index with perinatal outcome can be a predictive measure of
adverse antenatal and perinatal outcomes. However, considering the low sensitivity of
prenatal detection, larger studies are needed to assess the prenatal ultrasound findings
to the perinatal outcome.
In summary there is still controversy and the significance of abnormal UCI
(hypercoiling and hypocoiling), its association with adverse perinatal outcome
remains unclear. However, it is a very simple but significant examination in assessing
cases particularly with unexplained adverse outcome such as fetal death.
CHAPTER 1: INTRODUCTION
Page | 23
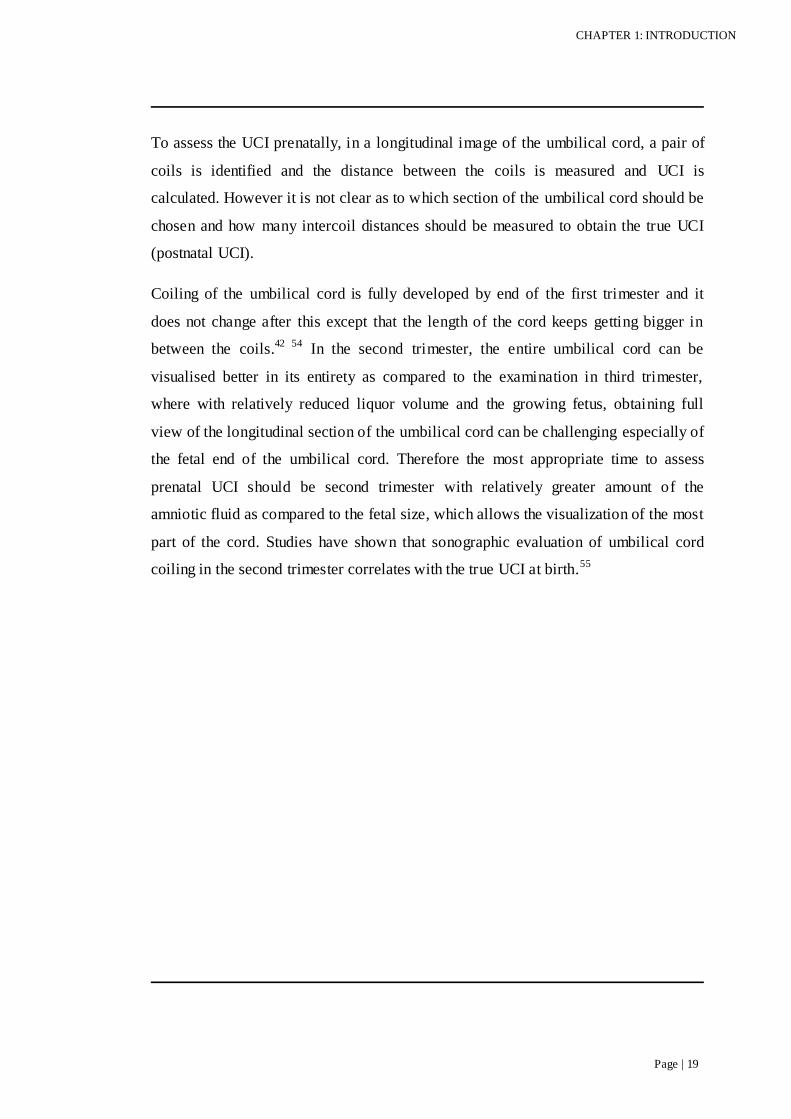
1.3.5 Umbilical cord insertion
Different ways in which the umbilical cord can be attached onto the fetal surface i.e.
chorionic plate of the placenta have been defined qualitatively as central, eccentric,
marginal (Battledore) and velamentous (membranous).
a b
c d
Central and eccentric insertions account for more than 90% of cord insertions and
have no clinical importance, while marginal insertion may be more susceptible to
vessel rupture and has been associated with intra uterine growth restriction, still birth
and neonatal death.9
Figure 1.9 Qualitatively described cord insertions (a) Central, (b) Eccentric, (c) Marginal,
(d) Velamentous (study photographs)

CHAPTER 1: INTRODUCTION
Page | 24
The incidence of velamentous insertion increases with maternal smoking, advanced
age or diabetes mellitus and among multiple births, congenital malformation and in
vitro fertilisation pregnancies.9
Central insertion is defined as where the umbilical cord is inserted onto the centre of
chorionic plate. The cord is inserted at the margin of the chorionic plate in marginal
insertion and membranous insertion where the umbilical cord is not inserted into the
placenta, but into the membranes. However, eccentric (also called paracentral) cord
insertion has not been clearly defined. Though it is understood that the insertion
anywhere between central and marginal insertion is eccentric insertion, eccentric
insertion can be near to the centre or it can be near to the chorionic plate margin. It
depends on the precision of the observer as well, an insertion exactly at the centre is
called central, but slightly off the centre, is defined as central or eccentric. It is not
clear whether an extreme eccentric insertion (eccentric insertions near the chorionic
plate margin) should be defined as an eccentric insertion or marginal. Although the
difference between extreme eccentric umbilical cord insertion and marginal cord
insertion may be small, this differentiation is important as eccentric umbilical cord
insertion is the most common type of umbilical cord insertion in pregnancies with
normal outcome while some studies have shown an increased incidence of marginal
umbilical cord insertion in pregnancies with adverse outcomes such as miscarriage,
fetal congenital anomalies, preterm labour and intrauterine growth restriction.64-66
It has been suggested that pathological variations (marginal and velamentous) result
from disturbance of implantation or faulty implantation of fertilised ovum, which
eventually prevent central insertion of umbilical cord from taking place.66-67
The incidence of marginal insertion varies widely possibly due to the different
interpretation of “extremely eccentric” and marginal insertion. Different studies have
quoted the incidence between 2-9%.36 68-70 Researchers have different views on the
outcomes related to marginal umbilical cord insertion.

CHAPTER 1: INTRODUCTION
Page | 25
Studies have shown an association between marginal cord insertion and increased
incidence of congenital malformation66, neonatal asphyxia71, and preterm labour64,
while others did not find an increased incidence of above complications with marginal
cord insertion.72
Placenta
cc
c
Membranes Membranes
Velamentous insertion
Velamentous insertion is where the umbilical cord is inserted in between the fetal
membranes, amnion and chorion and runs in the membranes unsupported by the
placenta before the cord becomes inserted onto the placental fetal surface. Therefore
the unprotected umbilical vessels will travel a certain distance before passing onto the
placental surface. These membranous vessels are prone to compression, thrombosis,
rupture, and haemorrhage especially if vessels are traversing across the cervical os
and are ruptured with membranes during delivery, resulting into fetal morbidity and
mortality (vasa praevia). The incidence of velamentous insertion is generally agreed
as around 1%, with a range of 0.5-1.6%.68 73-74
a b1 b2
a. 3 d
d
d
Figure 1.10 Illustration of qualitatively described cord insertions onto the chorionic plate
a b1
b. 3
d
d
d
a. Central
b1.Paracentral
b2.Paracentral
c. Marginal
d. Velamentous

CHAPTER 1: INTRODUCTION
Page | 26
The incidence of velamentous insertion is higher in multiple pregnancies68, in cases
with single umbilical artery75, congenital fetal malformation and miscarriage66, while
other researchers69 did not find the association between velamentous insertion and
malformation. One of the largest and most detailed studies revealed higher association
of velamentous insertion with intrauterine growth restriction, preterm delivery,
abnormalities in the fetal heart rate patterns during labour and low Apgar score at
birth.74
The pathogenesis and etiology of velamentous insertion is not yet clear.66 68 One
theory is that the yolk sac adheres to the chorion far from where it should have been
and this causes abnormal implantation of the umbilical vessels on to the membranes.
Another theory suggests that the body stalk does not migrate towards usual decidua
basalis, rather umbilical cord arises from chorion which is most vascularised. With the
progress of pregnancy vascularity of deciduas capsularis reduces while it increases for
deciduas basalis. Therefore part of chorion closer to deciduas basalis, the one which is
the site for the definite placenta becomes the most vascularised. That results into cord
inserted into the membranes. Another view of velamentous insertion was due to the
abnormal implantation. Blastocyst implanting obliquely (rather than facing) in the
endometrium, will result into abnormal implantation of the cord. Some favour the
theory of “trophotropism”, explaining that initially umbilical cord is inserted as
normal but later with the growth of placental tissue more laterally leaving central part
atrophic and that process leaves the umbilical cord in the membranes.
Prenatal diagnosis of velamentous cord insertion has been successfully made using
conventional ultrasound and more so by using colour Doppler ultrasound. 74
Velamentous cord insertion has also been associated with raised maternal serum hCG
levels during the second trimester76 though there is no explanation for this association.
Despite all the possible complications associated with velamentous cord insertion,
most pregnancies with velamentous cord insertion pass through antenatal period as
well as intrapartum phase without having any complications.
CHAPTER 1: INTRODUCTION
Page | 27
1.4 AIMS AND OBJECTIVES OF THE STUDY
To compare manual and digital measurements of different axes of the placenta
in unselected pregnancies.
To derive indices for placental morphology from digitally derived
measurements.
To establish criteria and normal ranges for objective determination of
macroscopic placental features, including shape and umbilical cord insertion
site.
To establish the quantitative relationships of birth weight to the placental
weight and circumference.
To define the incidence of predefined placental histopathological
abnormalities in an unselected cohort of 1159 women with singleton
pregnancy delivering in a single unit in relation to macroscopic features.
To determine the relationship between the predefined placental morphology
and predefined abnormalities in relation to specific obstetric and neonatal
outcomes of pregnancy.

CHAPTER 2 : METHODS

CHAPTER 2: METHODS
Page | 29
2.1 DESIGN
This was a prospective study of unselected mixed risk women with singleton
pregnancy booking for delivery at the Rosie Hospital. This unit delivers both high
and low risk care to women in Cambridge and the Eastern Region of England, and
has approximately 6000 deliveries per annum. The study received ethical approval
from The Peterborough and Fenland Research Ethics Committee, Cambridges hire
(LREC Ref.no:07/Q0106/51). Recruitment was achieved over 13 months in 2007-
2008. Written maternal consent was obtained for placental examination. The study
was undertaken in the Department of Fetal Medicine, Obstetrics and Gynaecology,
Rosie Hospital and the Department of Pathology, Addenbrookes Hospital,
Cambridge.
2.2 MATERIALS AND METHODS
2.2.1 Recruitment of patients
A total of 1159 women with a singleton pregnancy, booking at Rosie were recruited
for the study. Study posters, explaining the study were produced to make pregnant
women and staff involved aware of the study. Posters were displayed in the antenatal
clinics, ultrasound Department, antenatal wards and various places in the delivery
unit. The study aims/objectives and methodology were also discussed in
Departmental meetings. Subjects were recruited prospectively on an ad-hoc, case-by-
case basis. All women presenting to the Rosie Hospital with a viable singleton intra-
uterine pregnancy, and booking for delivery at the Rosie during the recruitment
period, were invited to join the study. Subjects excluded from the study were those
who were unable to give adequate informed consent to participate in the study (for
example language difficulty, learning disability), subject with twins or higher order
multiple pregnancies and subjects who had a non-viable fetus on booking.
The gestational age at which patients delivered is shown in appendix 1.

CHAPTER 2: METHODS
Page | 30
The patient information sheet and consent form were designed according to the
guidance on COREC (Central Office of Research Ethics Committee). Patient
information sheets included information explaining in a non-scientific manner, the
purpose of the study, consenting for the study, advantages and disadvantages of
taking part in the study, issues related to confidentiality of data, and the people
involved in the research. (Appendix 2)
Generally speaking, there was a separation in time between the patient information
sheets being given to patients and consent being sought (often at the time of
admission to the delivery unit in labour), as per the instructions of the Research
Ethics Committee. This meant that consent was a „two stage‟ process; not all women
given patient information sheets subsequently consented. This tended to bias
recruitment away from severe preterm deliveries as women admitted to the delivery
unit in this situation, and those looking after them, were less willing to consider
discussing and consenting to this study.
Antenatal clinic
Antenatal clinics in the Rosie Hospital, Addenbrookes run from Monday to Thursday
every afternoon. All women in the antenatal clinics were approached individually.
All women had gestational age assigned from a first trimester ultrasound at 10-14
weeks using either crown rump length (CRL) or bi-parietal diameter (BPD)
measurement. No selection was made based on any maternal characteristics. The
study was explained to them and an information sheet about the study was given to
them. They were asked to read the information sheet, encouraged to ask questions if
unsure about anything and then to sign the written informed consent form, if they
agreed to take part in the study. The research participants were only required to sign
the consent form. There were no extra treatments or procedures during the
participant's pregnancy because of this study. Women received ante-natal care as
normal from the obstetric and community teams. This study did not affect the care
they received, their appointments or delivery. Research participants were not
contacted after the study and all records were anonymised.

CHAPTER 2: METHODS
Page | 31
A consent form was attached to the antenatal hand held notes (normally carried by
the pregnant woman each time she attends antenatal clinic at the Hospital or to her
midwife), to make it easier for the midwives at the delivery unit to confirm that
woman had consented for the study.
Delivery Unit
Midwives and other delivery unit staff were informed about the study. Study posters
were displayed. Flow charts of how to collect the placentas after the delivery were
also displayed for the midwives. Midwives were reminded of the study especially at
the hand over times so that it was made sure that each and every midwife in the
delivery unit was aware of the study and the placentas were kept for the study. A
special folder was made for the placental study which had study‟s information sheets,
consent forms, flow charts of placental collection methods and the lab forms for the
study. Every delivering woman was asked again if she agreed to participate in the
study. Midwife delivering the women were asked to confirm the written consent of
the women for the study. Placenta was examined grossly by the midwife as per
routine and a microbiological swab was taken if required clinically. Placenta was
placed in a double bag with the woman‟s addressograph on it, which was kept in a
dry clean 1-2 litre bucket with a wide top air tight lid within 20 minutes of delivery.
The placental bucket was kept in the fridge with the temperature maintained at 4-
6C. 2 fridges were procured in the delivery unit to keep the placentas before
placentas were collected to the pathology Department. Midwives and other staff were
regularly updated about the progress of study by regular presentations in the
Departmental meetings.

CHAPTER 2: METHODS
Page | 32
2.2.2 Transportation of placenta
A medical laboratory assistant was employed solely for the study who collected
placentas from the delivery unit each morning Monday to Friday to the dedicated
research section in the Department of pathology.
Each placenta was accompanied by the dedicated pathology form with the brief
information of the patient on it. (Pink form in appendix 6) Each placenta was
registered on the Hospital server and assigned a pathology number, for example
PF07 or PF08...Once the database was complete, all identifiable information of the
patients was deleted for example name of the patient, Hospital number and the
pathology number. A study number was given to each placenta included in the study.
All macroscopic examinations findings were recorded on the back of the pathology
form in a predefined section.
2.2.3 Examination of Placenta
Manual Measurements
Placentas were examined at a dedicated perinatal lab in the pathology Department.
Each day placentas were examined grossly, photographed and sections cut for
microscopic examination.
Figure 2.1 Instruments used for gross examination of placenta and cutting sections.

CHAPTER 2: METHODS
Page | 33
Instruments used were (fig 2.1)
1. Toothed holding forceps.
2. Fixed measuring scale (cm)
3. Heavy cutting Mayo‟s scissors
4. Swan Morton surgical steel sterile skin graft blade.
5. 12 inch (300mm), disposable macro knife with a non slip integral handle with the
double honed edge.
6. Cassettes with covers
7. A & D GF-3000 top-loader digital fixed weighing scale (grams)
8. Camera- Canon Power shot G5, 5mega pixel camera. (picture not shown)
For each placenta the identity was confirmed and a study number was given and it
was anonymised so that once cut it can only be identified with the study number. A
Pathology form was designed specifically for the study where gross and microscopic
findings of each placenta were reported. Fresh placentas placed in labelled clean
plastic buckets with a labelled request form were received in the Histopathology
Department, Addenbrookes Hospital.
The placenta was first examined grossly for the presence of any macroscopic lesions
such as thrombosis, fibrin, infarcts and haematoma.
The placentas were then photographed. Photographs were taken of maternal surface
with trimmed membranes and trimmed cord, fetal surface and cross sections of the
placenta.
The point of insertion of the umbilical cord into the chorionic plate was noted and
recorded as central, paracentral, marginal or velamentous. For the qualitative
comparisons, we used the most frequently used terminology for cord insertion.33

CHAPTER 2: METHODS
Page | 34
Central insertion is defined as any part of the umbilical cord inserting within 2cm of
the centre of the chorionic plate; paracentral greater than 2 cm from the centre and
within the margin of the chorionic plate; marginal at the placental margin and
velamentous insertion as being outside the chorionic margin into the membranes.
The cord was then excised from the point of insertion into the chorionic plate; blood
was drained from placenta as much as possible, adherent blood clots from the
maternal surface of placenta were removed. All membranes were trimmed off and
the placenta was then weighed on a fixed scale. Weight was noted in grams. The
placentas were weighed in over 90% of cases within 24 hours but in all cases within
72 hours in accordance with published guidance for handling the placenta.17 68
The Umbilical cord length was measured in centimetres using an accurate, non
stretchable fixed measuring scale. The diameter of the umbilical cord was noted in
centimetres using a fixed scale from the fetal end of the cord.
The direction and the number of coiling of the umbilical cord were also noted.
Direction of the cord was noted as left, if the direction of coils directed towards the
examiners left hand, right sided coiling if directed towards right hand.
Cord Coiling Index: The cord coiling index was calculated using an established
method by dividing the number of coils by the length of the umbilical cord in
centimetre.11 Therefore the coiling index is the total number of completed vascular
coils per centimetre length of the cord. A complete vascular coil is defined as a 3600
round coiling.
Placentas were cut and sampled for histological examination. 3 standard blocks were
taken from the cord which included maternal end, fetal end and one from the central
area. 3 full thickness central parenchyma blocks and one full thickness peripheral
block were taken. One block from the maternal surface was taken. Additional blocks
were taken from the macroscopic lesion areas.

CHAPTER 2: METHODS
Page | 35
Small samples from few unselected placentas were also archived in “RNA later” for
possible future molecular analysis.
Digital Measurements
The placentas were photographed using Canon Power shot G5, 5-mega pixel camera.
Though the tripod was not used, but a uniform vertical distance and angle was kept
for each photograph taken. Each fresh placenta was placed with the fetal surface
uppermost, membranes were trimmed and all blood clots were removed from the
fetal surface. A 15-centimetre ruler was placed in every placental picture for
calibration purposes. A line was drawn between two points of known distance on the
ruler in every picture with the placenta. The length of the line was calculated
automatically in pixels by the software and that pixel was converted into centimetre
by setting the scale on the software. This scale was adjusted for each picture
separately. Each picture was uploaded on the Hospital server and identified by a
study number; the details were entered into a secure database. Images were analysed
using Image J software. Image J is a freely available public domain Java based image
processing program developed by the National Institute of Health. In the current
study, digital analysis of the placenta was performed using version 1.38e which was
downloaded from website (http://rsb.info.nih.gov/ij) and the dimensions measured
and shown in Figure below.
a
Figure 2.2 (a) Image J tool bar for placental measurements.

CHAPTER 2: METHODS
Page | 36
b
c
Figure 2.2 (b-c) Image J scale setting for placental measurements.

CHAPTER 2: METHODS
Page | 37
The point of umbilical cord insertion was noted on image.
The widest measurement of the placenta on an X-axis (A) and Y-axis (B); both
measurements being perpendicular to each other.
Measurements on X-axis(C) and Y-axis (D); perpendicular to each other passing
through the umbilical cord insertion.
Shortest distance of umbilical cord insertion to the chorionic plate margin on X-axis
(e) and Y-axis (d)
Figure 2.3 Depiction of the placental measurements.
a = (½ C) – e
b = (½ D) – d
dc = Distance of cord insertion from centre

CHAPTER 2: METHODS
Page | 38
Derivation of digital parameters
Distance of umbilical cord insertion from placental centre was calculated
mathematically according to the Pythagorean Theory. „a‟ was calculated by
subtracting „e‟ (shortest distance of umbilical cord insertion to the chorionic plate
margin on X-axis) from the half of „C‟ (X-axis passing through the insertion of
umbilical cord). „b‟ was calculated by subtracting „d‟ (shortest distance of umbilical
cord insertion to the chorionic plate margin on Y-axis) from half of „D‟ (Y-axis
passing through the insertion of umbilical cord). Since dc2=a2 + b2, where dc is the
distance of umbilical cord insertion from the centre. The formula for calculating the
distance of the cord insertion from the centre is:
22 badc
22 d)-(1/2D )2/1( eCdc
Cord Centrality Index (CI) – a ratio that describes the distance of the umbilical
cord insertion from the chorionic plate margin. It will range between 0 and 1 (except
in cases of velamentous cord insertion, where the value may be greater than 1 as the
insertion may be further from the centre than half the longest diameter).The smaller
the CI, the closer the umbilical cord insertion to the placental centre; the greater the
CI, the further away the cord insertion:
placenta theofdiameter longest theof
centre from insertion cord umb of istance
Half
DCI
Placental shape; eccentricity- Eccentricity is derived from the mathematical formula
describing eccentricity for an ellipse/oval. This is the ratio of the distance between the
foci to the length of the major axis 77. In this present study, this term; “eccentricity”
therefore has been referred in a manner consistent with its common and established

CHAPTER 2: METHODS
Page | 39
usage in applied mathematics, engineering and astronomy, to describe the features of an
ellipse. The term is therefore used here to describe the shape of placenta in relation to
how circular or ovoid it is. The value of an eccentricity should fall between 0 and 1, 0
indicates that the shape of placenta is circular while values towards 1 indicate an
elliptical shape of the placenta.
Eccentricity =
2
axismajor
axisminor 1
Circumference of the placenta was calculated by the following formula, assuming
the placenta is an ellipse;
Circumference = axis)minor of half axismajor of (half
Circumference was calculated for both digital as well as manual images. The mean
of both circumferences (manual and digital) was calculated. The mean percentage
difference was also calculated between the two measurements.
Intra-observer digital measurements
To assess the reliability and accuracy of the digital measurements, one observer (SP)
re-measured the randomly selected 20 placentas and compared the results with the
measurements of the same placentas performed previously by same observer.
Inter-observer digital measurements
Two observers (SP, CCL) performed the digital measurements on 20 randomly
selected placentas simultaneously and the two observer‟s measurements were
compared.

CHAPTER 2: METHODS
Page | 40
Fixation of placental tissues
To preserve placental tissues, all blocks were placed in the 10% neutral buffered
formalin solution for overnight. Tissues are fixed by cross-linkages formed in
between the proteins, by which the antigenicity of the tissue is maintained. Buffered
part of formalin prevents acidity that would promote autolysis. Formalin fixes the
tissues slowly but penetrates well into the tissues.
Tissue Processing
Placental tissue processing involves the process by which tissues can be made into
thin microscopic sections. Placental tissues samples taken in our study were
processed in the histology laboratory in the Department of Histopathology at
Addenbrookes Hospital, by the dedicated and trained medical laboratory assistant for
the study, who then prepared the slides for the examination by the pathologists‟
member of the team.
Tissue processing involved embedding of the tissues in the paraffin first followed by
cutting the thin sections of the tissues with the help of microtome shown in figures
2.4 (a-d).
Once prepared in thin sections, tissues were stained with Haematoxylin and Eosin.
The stained tissue section was covered with the cover slip and ready to be examined
by the pathologist team members.

CHAPTER 2: METHODS
Page | 41
Figure 2.4 Machines used in tissue preparation.
The placental pathology findings were linked to the pregnancy and neonatal
outcome. The histological, obstetric and neonatal variables were recorded on a
password secured Access database using Microsoft access version 2003; the entry
fields are outlined below. Gestation age at delivery was calculated by early dating
ultrasound for each patient. Term pregnancy defined by completed 37 weeks of
gestation and preterm is delivery before 37 completed weeks.

CHAPTER 2: METHODS
Page | 42
2.3 DEFINITIONS OF CLINICAL GROUPS
Pre-eclampsia (PET)
PET was defined after 24 weeks as blood pressure ≥ 140/90 on 2 or more occasions,
at least 6 hours apart with significant proteinuria of either more than 300 mg/l in 24
hours collection in a previously normotensive woman.78-79 Women with ≥ 2+ in a
urine sample in absence of a demonstrable urinary tract infection were also included
in this group.
Pregnancy induced hypertension (PIH)
PIH was defined as blood pressure ≥ 140/90 on 2 or more occasions, at least 6 hours
apart in pregnancy after 20 weeks without any evidence of proteinuria.
Gestational Diabetes Mellitus (GDM)
According to WHO criteria, gestational diabetes is carbohydrate intolerance resulting
in hyperglycaemia of variable severity with onset or first recognition during
pregnancy. The definition applies irrespective of whether or not insulin is used for
treatment or the condition persists after pregnancy. We defined the gestational
diabetes (GDM) in our study according to the WHO criteria: fasting blood glucose
level ≥ 7 m.mol/L or 2 hours post 75mg of oral glucose load ≥ 7.8 m.mol/L. 80
Small for Gestational Age (SGA)
Birth weight percentile less than the 10th for gestational age defined the SGA group.
To calculate these we used the standard UK 4-in-1 charts (girls and boys), which are
the growth charts designed principally for Hospital use for preterm and term babies and
their follow up.81

CHAPTER 2: METHODS
Page | 43
2.4 OBSTETRIC FIELDS - recorded for each participant of the study are shown in
table 2.1.
General Pregnancy Ultrasound details Delivery/Neonata
l outcome Admitted to Neonatal
Unit
Maternal age Diabetes GA when uterine
artery Doppler performed
Live birth/still
birth/neonatal death
Duration of admission in Neonatal Unit
Parity Pre-eclampsia Right/left uterine PI Birth
weight/centile RDS
Pregnancy loss PIH Right/left uterine
notch Neonatal gender CLD
USS EDD Essential
hypertension GA at scan prior to
delivery Neonatal
resuscitation
Ventilation/CPAP/ respiratory support
(days)
Smoking status Thrombophelia Umbilical artery PI Neonatal outcome Post natal steroids
Drug abuse APS Ductus venosus PI NICU admission USS
Medications SGA≤ 10 centile MCA PI Seizures
Ethnicity Clinical
chorioamnionitis AFI ROP
Abruption CTG-STV NEC
GA at delivery Inotrops
Onset of labour PDA
Mode of delivery Thrombocytopenia
Anaemia
Coagulopathy
Proven infection
Renal impairment
Survival to discharge
Age at death
Table 2.1 Obstetric variables of the study.

CHAPTER 2: METHODS
Page | 44
2.5 PROTOCOL FOR EXAMINATION OF PLACENTA
2.5.1 Macroscopic examination: A specifically designed form for the study which
included gross and microscopic findings was used.
2.5.2 Microscopic examination: Checklist for reporting cord and membranes are
described in table 2.3.
Umbilical cord and membranes Placental parenchyma
Funisitis Chorionic plate-inflammation, infection, FTV
Chorioamnionitis Stem villi-inflammation, infection, FTV, mesenchymal
dysplasia, storage disease
Maternal vascular disease in any adherent deciduas
Distal villi-hypoplasia, Chorangiosis, villitis, infection, storage disease
Meconium staining/necrosis Intervillous space-inflammation, infection,
haemorrhage, fibrin (massive)
Amnion nodosum Maternal vessels-mural fibrin deposition, atherosis
Table 2.3 Checklist for histological examination of the placenta and umbilical cord.
Table 2.2 Protocols for examination of the placenta and umbilical cord.
Umbilical cord examination Placental examination Standard blocks taken
Length (cm)
Diameter (cm)
Coiling index (turns/length)
Direction of cord spiral
Cord insertion site
True knots
Trimmed weight (g)
Measurements in 3
dimensions (cm)
Present/absence of any
macroscopic lesions
including infarct (s),
haematoma, fibrin, maternal
surface thrombus
Cord x 3 (maternal, fetal end and
central)
Membranes
Central parenchyma blocks (full-
thickness) x 3
Peripheral parenchyma block
(full-thickness) x 1
Maternal surface x 1 block

CHAPTER 2: METHODS
Page | 45
2.6 DATA ANALYSIS
The database of the study initially was divided into two parts and was set up on two
different servers of the Hospital, for the sake of convenience and ease for the
research team. One database included Obstetrics and Neonatal outcome information,
set up on the perinatal server.
The second part of the database was set up onto the histology server, which included
all macroscopic and microscopic findings of histopathology of placenta.
Both databases were held on a secure server with password access to members of the
research team only within Addenbrookes Hospital. Every placenta recruited for the
study was given a pathology number. The pathology database had all the
macroscopic and microscopic features of each placenta by its pathology number and
Hospital number.
Once all the information, Obstetrics, neonatal outcome, macroscopic and
microscopic examinations findings of each placenta were entered onto the databases,
the two database were merged matching with the Hospital number of the patients.
Once merged, a study number (1, 2, 3.......) was given to each placenta. Hospital
numbers and pathology numbers were deleted to make the database completely
anonymised. Once anonymised, it was not possible to link the outcome data to any
patient‟s identifiable information.
Multivariate analyses of a range of clinical and histological parameters were done.
Correlation of pregnancy and neonatal outcome to placental and umbilical pathology
was performed with statistical advice from the research team with, where
appropriate, specialist advice from the University of Cambridge and University of
East Anglia.
The data analysis was performed using SPSS (Statistical Package for Social Science)
software, window version 15and 18; SPSS, Chicago IL, USA.

CHAPTER 2: METHODS
Page | 46
Descriptive statistics for nominal data were expressed in absolute numbers and
percentages. Mean value and SD are presented for normally distributed continuous
variables. For non-normally distributed variables, median and ranges are presented.
A test of normality was performed by using frequency histograms, Q-Q plots and
Kolmogorov-Smirnov test. Frequency histograms and Q-Q plots the observed data
against expected data. Kolmogorov-Smirnov test quantifies the discrepancy between
observed and expected distribution.
To explore the association between the variables, Pearson correlation coefficient (r)
was analysed. The value of “r” varies between -1 to +1. The sign of –ve and +ve
shows whether there is negative or positive correlation between the variables and the
number value signifies the strength of correlation; 1 being the strongest and 0 being
no correlation between the variable. A linear relationship between the variables was
plotted on a scatter plot. Coefficient of determination was calculated as r2. This
enables us to know how much variance is shared by two variables.
T-test was used to compare means of continuous data, if normally distributed. If data
did not follow a normal distribution, not even after logarithmic transformation, in
those data to compare means, Mann-Whitney-U test was performed. Non parametric
test was also performed if the sample size was small. A p-value of ≤ 0.05 was
considered statistically significant.
Z- Score
Z-score or the standard score allows us to calculate the probability of a score
occurring within the normal distribution and also helps to compare two scores of
different normal distributions.
In the current study, to establish the relationship between different continuous
variables (birth weight, placenta weight, placenta circumference), z scores for the
variables were calculated to normalise the data for the gestational age within the
gestation range 33-43 weeks, using the means and SD derived from this population.

CHAPTER 2: METHODS
Page | 47
Bland Altman Plot82-83
Bland Altman is a statistical method of data plotting used in analysing the agreement
between two different methods. This plot analyses the correlation between two
methods that are designed to measure the same variable or parameter. Bland Altman
plot can also be used to compare a new measurements technique against an available
standard method.
The mean of the two measurements is plotted on the x-axis and y-axis contains the
difference between the two values.
The limits of agreement (95% confidence interval of the difference between the two
methods, specified as average difference +/- 1.96 SD of the difference) were also
computed on the Bland Altman Plot.
In this study, Bland-Altman Plot was used to analyse the agreement between manual
and digital measurements of the placenta.

CHAPTER 3 : A COMPARISON OF MANUAL AND DIGITAL
PLACENTAL MEASUREMENTS
Summary Points:
This study compared manual and digital placental dimensions in 888
placentas.
The key findings were significant positive correlation between manual and
digital measurements.
This chapter concludes that the digital measurement of the placenta is a
simple and reproducible method of measurement compared to the traditional
methods.
This chapter is based on:
Pathak S, Jessop F, Hook L, Sebire NJ, and Lees C. Placental weight, digitally derived
placental dimensions at term and their relationship to birth weight. J Maternal Fetal
Neonatal Med. 2010 Oct; 23(10):1176-82

CHAPTER 3: MANUAL VERSUS DIGITAL PLACENTAL MEASUREMENTS
Page | 49
3.1 INTRODUCTION
Placental measurements have traditionally been performed manually following
delivery with a ruler and little is known about the correlation between the manual
and digitally derived placental measurements following the widespread introduction
of digital photography for recording of pathological specimens. 12 84
Digital imaging and subsequently derived measurements are now commonplace in
many other areas of medicine, for example in MRI organ volume estimation85 and
for 2D distance measurements in biology, astronomy, nuclear medicine, laboratory
medicine, immune-histochemistry and Histopathology and physics, image analysis
using Image J software (a semi-automated web based freeware image analysis
programme) has been widely applied. Similar imaging software has been used for
quantification of bone metastases in prostatic cancer in which results were closely
correlated with manual counting of lesions86 and for quantifying erythema and
pigmentation in skin diseases.87 In hepatic CT volumetry, volumes of virtual liver
resection specimens measured with Image J were compared with specimen weights
and calculated volumes during pathology examination after resection; the two
methods of measurement were closely correlated (r2 = 0.98 p<0.0001).88
Image J has also been compared with computed tomography (CT) imaging software
to quantify soft tissue cross-sectional areas obtained from abdominal and mid thigh
areas with correlation coefficient (r2) of 0.99 and the two methods were comparable
(95% confidence interval +2.5cm2 or +1.4cm2) using the Bland-Altman method.14
Correlation coefficients have been used to compare manual and digital
measurements, whereas a more appropriate approach would be a Bland-Altman plot
to analyse agreement between two methods which are designed to measure the same
parameter82 and shows the relationship between the two methods of measurements.
This information is important to establish validity of digital measurement for future
studies where image analysis based measurements will be increasingly used.
CHAPTER 3: MANUAL VERSUS DIGITAL PLACENTAL MEASUREMENTS
Page | 50
The aims of the study are to compare manually and digitally obtained long and short
axes placental measurements and the derived placental circumference using both
correlation coefficients and the Bland-Altman plot.
3.2 METHODS
Detail of methodology is described in chapter 2. Briefly, for the purposes of this
chapter, 888 placentas were analysed, where the digital measurements were
available.
3.3 STATISTICAL ANALYSIS
Details of the statistical methods are described in chapter 2. The limits of agreement
(95% confidence interval of the difference between the two methods, specified as
average difference +/- 1.96 SD of the difference) were also computed on the Bland
Altman Plot. The Bland-Altman Plot was used to analyse the agreement between
manual and digital measurements of the placenta for:
-maximum diameter (long axis of the placenta)
-minimum diameter (short axis of the placenta)
-circumference.
Pearson correlation coefficients (r) were derived using bivariate relationships for
both manual and digital measurements; and r2 was calculated. One observer (SP)
performed all the measurements.
In order to determine the reliability of digital measurements, 20 randomly selected
placentas were re-measured by same observer (SP) after 6 months. Another
randomly selected 20 placentas were measured by 2 observers (SP, CCL)
simultaneously.

CHAPTER 3: MANUAL VERSUS DIGITAL PLACENTAL MEASUREMENTS
Page | 51
3.4 RESULTS
Analysis of this study includes 888 placentas. In all placentas, all manual and digital
measurements were obtained. Table 3.1 shows the demographics of the population
studied.
n=888
Maternal age ± SD (years) 30.8 ± 5.6
% Caucasian (n) 89.8 (797)
% nulliparity (n) 48.2 (428)
% Smokers >5 cigarettes per day (n) 9.6 (85)
Birth weight ± SD (gms) 3470 ± 496
Mean gestation at delivery ± SD (weeks) 39.4 ± 1.4
Mean Placenta weight ± SD (gms) 478.44 ± 96.7
Table 3.1 Baseline demographics of the population studied.
Table 3.2 details the comparison of the manual and digital measurements.
Minimum Maximum Mean SD
Long axis of placenta (cm)
Manual 14.00 36.00 20.77 2.66
Digital 12.70 30.70 18.96 2.47
Short axis of placenta (cm)
Manual 7.00 24.00 17.83 2.07
Digital 8.90 22.00 15.91 1.87
Circumference (cm)
Manual 36.11 89.49 60.60 6.24
Digital 38.31 77.56 54.76 5.71
Table 3.2 Manual and digital measurements of the placenta.

CHAPTER 3: MANUAL VERSUS DIGITAL PLACENTAL MEASUREMENTS
Page | 52
Intra-observer variability
In 20 randomly selected placentas; one observer (SP) re-measured the same placentas
digitally at an interval of 6 months. The intra-observer correlation coefficient and
coefficient of variation were 0.99 and 1.8% respectively for long axis, 0.98 and 2.1%
for short axis measurements.
Inter-observer variability
These measurements are based on 20 randomly selected placentas, measured by two
observers (CCL, SP) simultaneously. The inter-observer correlation coefficient and
coefficient of variation were 0.98 and 3.3% respectively for long axis, 0.97 and 2.6%
for short axis measurements.
Outliers
The outliers were noted while comparing long, short axes and the circumference of
the placenta. These numbers were re-checked on the manual as well as digital
measurements. However these numbers of outliers were very small to have made any
significant effect on the result.

CHAPTER 3: MANUAL VERSUS DIGITAL PLACENTAL MEASUREMENTS
Page | 53
Comparison of manual versus digital measurements:
Long axis of placenta:
Manual versus digital measurements showed a Pearson correlation coefficient (r) of
0.74 (p<0.0001); linear correlation r2 0.54 and coefficient of variation 9.2%. The
Bland–Altman plot mean difference between manual and digital measurements was
1.80 cm with 95% CI (+/-1.96SD) -1.86 and 5.46 cm.
Figure 3.1 Scatter plot showing correlation coefficient for manual versus digital measurements
of long axis of the placenta
Figure 3.2 Bland Altman plot for long axis of the placenta: manual versus digital measurements.

CHAPTER 3: MANUAL VERSUS DIGITAL PLACENTAL MEASUREMENTS
Page | 54
Short axis of placenta:
The Pearson correlation coefficient (r) was 0.70 (p<0.0001); r2 0.49 with coefficient
of variation of 10.3%. The Bland–Altman plot mean difference between the long
axes measurements taken manually and digitally was 1.91 cm with 95%CI (+/-
1.96SD) -1.1 and 4.92 cm.
Figure 3.3 Scatter plot showing correlation coefficient for manual versus digital measurements
of short axis of the placenta.
Figure 3.4 Bland Altman plot for short axis of the placenta: manual versus digital
measurements.

CHAPTER 3: MANUAL VERSUS DIGITAL PLACENTAL MEASUREMENTS
Page | 55
Circumference of placenta:
The Pearson correlation coefficient (r) was 0.77 (p<0.0001), r2 0.59 with coefficient
of variation 7%. The Bland–Altman plot mean difference between the measurements
taken manually and digitally was 5.83 cm with 95% CI -2.19 and 13.85 cm.
Figure 3.5 Scatter plot showing correlation coefficient for manual versus digital measurements
of circumference of the placenta.
Figure 3.6 Bland Altman plot for circumference of the placenta: manual versus digital
measurements.

CHAPTER 3: MANUAL VERSUS DIGITAL PLACENTAL MEASUREMENTS
Page | 56
3.5 DISCUSSION
We report manually and digitally derived measurements following delivery at
gestation from 33-43 weeks. This data shows significant positive correlation between
manual and digital measurements.
Previous descriptions of manual versus digital measurements including those on the
placenta84 have reported good correlation between the two measurements. However, the
most appropriate method for comparing two different methods of deriving the same
measurement is not a correlation coefficient, since one measurement technique may lead
to systematically larger or smaller measurements than the other but still have a
correlation coefficient close to 1. Moreover the correlation coefficient also depends on
the way the sample is chosen, and it has meaning only for the population from which the
study subjects can be regarded as a random sample.83 Comparison of digital
measurements with those from previous studies using manual measurements should
therefore be approached with caution. The problem of interpretation and comparison is
to a large extent overcome by use of the Bland-Altman plot,82 which was used in this
study. This plot compares two methods of measurement. For example, in the current
study, digital measurements appear systematically shorter for both long and short axes
of the placenta, as evidenced by the crude comparisons (Table 3.2) and Bland-Altman
plots; the 95% limits agreements of the mean difference between the manually and
digitally derived placental circumferences were -2.19 and 13.85 cm though the inter and
intra observer coefficients of variation are <5% (Figure 3.6).
The reason for this difference in measurement is not clear, and as comparative data has
not been presented in this format before, it is not clear if the finding is unique to this
study or others. Other studies reporting digital placental measurements did not use a
Bland-Altman analysis for the two types of measurement, so although the correlation
between the two types of measurement is high, it is not possible to ascertain whether
there was a systematic over or under measurement from digital recordings.12 84 This
finding does however sound a potential note of caution that deserves to be investigated
in future studies.

CHAPTER 3: MANUAL VERSUS DIGITAL PLACENTAL MEASUREMENTS
Page | 57
The digital measurements of placenta of the current study are however comparable to
those reported in two recent studies (Table 3.3). It must be noted that one included
placentas from women delivering after 24 weeks; however 86% were from deliveries
after 37 weeks.12 So with this proviso, the results can be compared accepting that the
minimum range might be lower in that study as a result of some placentas being from
earlier gestation deliveries.
Present Study Coall et al 13
Salafia et al 12
Measurements (cm)
N Mean Range n Mean Range n Mean Range
Long axis of Placenta
888 18.9 12.7-30.7 482 22 14-35 628 21 12-43
Short axis of Placenta
888 15.9 8.9-22.0 482 18 8-26 628 18 9-29
Circumference of placenta
888 54.7 38.3-77.5 482 71.8 49-111 - - -
Distance-centre to cord insertion
888 3.3 0.1-10.0 482 4.0 0.2-11.5 628 3.6 0.1-23.7
Table 3.3 Digital placental measurements reported by two recent comparable studies.
In summary, digital measurement of the placenta is reproducible and a relatively
simple of method measurement compared to traditional manual measurement as it is
very easy to perform, does not require much training and digital method also allows
the measurements to be done at a later stage. Image J software is also freely available
at no cost making it accessible to researchers in countries where financial resources
may be limited. The measurements derived are comparable to the other studies
though the digital measurements in our study appear to be systematically smaller
than those derived by conventional manual measurements. Whether this is a feature
of this study-for example Image J software- or is more likely to occur with digital
measurements in general is not clear, neither are data available that would resolve
this from otherwise comprehensively reported studies of this type.12 84

CHAPTER 4 : MORPHOLOGY: UMBILICAL CORD COILING,
UMBILICAL CORD INSERTION AND PLACENTAL SHAPE
IN UNSELECTED PREGNANCIES
Summary Points:
This study derived the morphological indices for coiling of the cord (cord
coiling index), insertion of the cord (cord centrality index), and shape of the
placenta (eccentricity) in unselected 888 pregnancies at 33-43 weeks.
The key findings were suggestive that cord is inserted off the centre and
shape of the placenta is oval or elliptical, not round.
This chapter is based on
Pathak S, Hook E, Hackett G, Murdoch E, Sebire NJ, Jessop F, Lees C. Cord coiling,
umbilical cord insertion and placental shape in an unselected cohort delivering at term:
Relationship with common obstetric outcomes. Placenta. 2010; 31: 963-8.
Pathak S, Sebire NJ, Jessop F, Hackett G, Murdoch E, Hook E, Lees C. Morphological
features of placenta in relation to common obstetric outcomes: Paper in progress.

CHAPTER 4: PLACENTAL MORPHOLOGICAL INDICES IN REFERENCE POPULATION
Page | 59
4.1 INTRODUCTION
It has been known for many centuries that the placental shape, size, cord insertion
and pattern of cord coiling varies widely between pregnancies. In current obstetric
and perinatal pathology practice, qualitative terms are generally used to describe the
placenta, for example, “velamentous”, “central” and “marginal” cord insertions,
“round” or “oval” placental shape, among many others.
There has been little attempt at quantifying or describing the relationship between
measurements, including the size of the placenta, the shape of the chorionic plate
(fetal surface), distance of the umbilical cord insertion from the centre of the placenta
and the deviation in placental shape from the suggested normal circular appearance.
Little is known about these variables and their association with pregnancy and
neonatal outcome. Though several studies on umbilical cord coiling index have
emerged in the last few years 5-8 52, there remains uncertainty in relation to the
significance of abnormal umbilical cord coiling detected ante or postnatally.
Umbilical cord coiling is either anti-clockwise (left) or clockwise (right). Anti
clockwise coiling is more common. The prevalence of anti-clockwise coiling varies
from 65-76%. 8 49 It is not well-understood why the anti-clockwise pattern is more
common. The umbilical cord coiling index has been defined as the number of
completed coils per centimetre of the umbilical cord; a cord coiling index mean value
of 0.21 (+/-0.07) is defined as normal in the delivered placenta 11. Though some
studies have defined „hypocoiling‟ if the cord coiling index is less than 10th centile
and „hypercoiling‟ if more than 90th centile for gestation, the frequency of non-coiled
cord is reported as 4.3-4.9% 5 48 while hypercoiling has been reported as high as
20% in unselected placentas in other studies.6
Different types of cord insertions have been explained qualitatively in most of the
studies in the past. An insertion anywhere between central and marginal insertion is
generally considered to be eccentric, but none of these terms have been quantitatively
described, making comparative studies of outcome difficult.

CHAPTER 4: PLACENTAL MORPHOLOGICAL INDICES IN REFERENCE POPULATION
Page | 60
The type of cord insertion may also be described as how far the insertion point is
located from the centre of the placenta, or alternatively, how close the umbilical cord
insertion is to the chorionic plate margin. The distance of the umbilical cord insertion
from the placental centre has been proposed as a clinically useful marker of placental
insufficiency.89-90 Rath and colleagues 91 calculated a measure of relative insertion
eccentricity by dividing the minimum distance from the umbilical cord insertion to
the margin of the placenta by the radius of the placenta; however this is a poor
measure of eccentricity in irregularly shaped placentas. Others have defined the
relative insertion eccentricity by dividing the minimum distance between the centre
of the placenta and the insertion of the umbilical cord by the average radius of the
placenta.13
The placenta is normally described as either round or oval; however it can be
described as irregular, bilobate or multilobate, among others. Irregular placental
shapes have been associated with lower birth weight: placenta weight ratio,
suggesting they may be associated with altered placental function.10
The aim of this study is to derive ratios for the shape of the placenta, relationship of
cord insertion to its centre and cord coiling in singleton pregnancy placentas from an
unselected reference population of gestation age ranging from 33-43 weeks.
For placental shape and cord insertion we utilized reproducible, rapidly obtained digital
measurements in placentas to morphometrically define the cord insertion and placental
shape10 using Image J, a freely available public domain Java based image processing
program developed at National Institute of Health. Details have been explained in
chapter 2 (section 2.2.3).
Cord coiling was measured manually in the same placentas.

CHAPTER 4: PLACENTAL MORPHOLOGICAL INDICES IN REFERENCE POPULATION
Page | 61
4.2 METHODS
In this chapter, analysis is based on digital measurements of 888 placentas at 33-43
weeks gestation without making any attempt at selection by any maternal
characteristic.
Details of manual, digital measurements and derivation of the morphological indices
are described in chapter 2. Briefly cord coiling index was derived using established
method by dividing the number of coils by the length of the umbilical cord.11
Digital analysis was performed using image J software and analysed the
morphological indices; cord centrality index and eccentricity.
4.3 STATISTICAL ANALYSIS
Categorical data are presented as the number and the percentage. Continuous data is
presented as mean with the SD. Descriptive statistics was analysed for manual and
digital placenta and umbilical cord measurements used in this study.
Approximate normality was checked for cord coiling Index, centrality index, and
eccentricity index for the population, using the frequency histograms for each
category. Q-Q plots for the same variables were also plotted between observed and
expected distribution.

CHAPTER 4: PLACENTAL MORPHOLOGICAL INDICES IN REFERENCE POPULATION
Page | 62
4.4 RESULTS
888 placentas from singleton pregnancies, 33 to 43 weeks were examined; in all
placentas, digital measurements were obtained. Demographics for this chapter are
outlined in chapter 3 (Table 3.1)
Table 3.2 outlines the manual and/or digital measurements used in the study.
4.4.1 Umbilical cord coiling and coiling index
For umbilical cord coiling, in 704 out of 888 cases (79.3%), the cord was left coiled
and 145 out of 888 cases (16.3%) right coiled. There was no coiling in 19 umbilical
cords (2.1%). Direction of coiling was bi directional in 5 (0.6%) cases. In these cases
the number of the completed coiling were counted as explained in methods. In the
remaining 02 cords, cord was too short to calculate the coiling index. Data were not
available for 13 cases as the cords had been removed before the placenta reached the
research team. Cord coiling index ranged from a minimum value of 0.00 to a
maximum of 1.0 with a mean value of 0.20 ± 0.09. Frequency histograms and Q-Q
plot revealed an approximate normal distribution for coiling index. Figures below
shows the frequency histogram and Q-Q plot of coiling index in reference
population.

CHAPTER 4: PLACENTAL MORPHOLOGICAL INDICES IN REFERENCE POPULATION
Page | 63
Figure 4.1 Frequency histogram of Coiling Index at 33-43 weeks.
Figure 4.2 Q-Q plot for Coiling Index at gestation 33-43 weeks.

CHAPTER 4: PLACENTAL MORPHOLOGICAL INDICES IN REFERENCE POPULATION
Page | 64
4.4.2 Umbilical cord insertion
Qualitative description of the type of umbilical cord insertion in relation to previous
standards showed that the frequency of umbilical cord insertion was „central‟ in
245/888 (27.6%), „paracentral‟ in 567/888(63.9%), „marginal‟ in 74/888(8.3%) and
„velamentous‟ in 2/888(0.2%).Table below shows the different types of umbilical
cord insertion documented in previous studies and in the current study.
4.4.3 Cord centrality index
The minimum distance of the cord insertion from the centre of the placenta was 0.15
cm and maximum distance 10.05 cm with the mean of 3.35 cm ± 1.9, irrespective of
the direction of umbilical cord coiling.
The Cord centrality index ranged from 0.02 to 1.0 with the mean of 0.36 ± 0.21.
Frequency histograms and Q-Q plot of cord centrality index indicated an
approximate normal distribution. Figure 4.3 shows the frequency histograms of cord
centrality index in unselected population and fig 4.4 is an explanatory picture of
placenta denoting mean centrality index as 0.36. Fig 4.5 is Q-Q plot for the cord
centrality index in reference population.
Author (Year) Krone (1961)
Gerlach (1962)
Krone (1965)
Dorste (1971)
Agboola (1978)
Present Study (2010) (n)
Central % 25 28 14.9 22.8 26.5 27.6 (245/888)
Paracentral % 64 62.5 65.4 62.2 62.5 63.9 ( 567/888)
Marginal % 10 8 7.9 14.7 9.2 8.3 ( 74/888)
Velamentous % 1 1.5 1.8 - 1.8 0.2 ( 2/888)
Table 4.1 Qualitative description of cord insertion in different studies.

CHAPTER 4: PLACENTAL MORPHOLOGICAL INDICES IN REFERENCE POPULATION
Page | 65
Figure 4.3 Frequency histogram of Cord Centrality Index at 33-43 weeks.
Figure 4.4 Explanatory photograph of a placenta showing Cord Centrality Index of 0.36.
Figure 4.5 Q-Q plot for Cord Centrality Index.

CHAPTER 4: PLACENTAL MORPHOLOGICAL INDICES IN REFERENCE POPULATION
Page | 66
4.4.4 Eccentricity
The placental eccentricity index ranged from 0.00 (circular shape of placenta) to
0.91(highly elliptical shape) with a mean of 0.49 ± 0.18. The frequency histograms
and Q-Q plot indicated a normal distribution (Fig 4.6, 4.8). Figure 4.7 shows the
explanatory placental picture with mean eccentricity of 0.49.
Figure 4.6 Frequency histogram of placental Eccentricity at 33-43 wks.
.
Figure 4.7 Explanatory photograph of a placenta showing Eccentricity of 0.49.

CHAPTER 4: PLACENTAL MORPHOLOGICAL INDICES IN REFERENCE POPULATION
Page | 67
Figure 4.8 Q-Q plot for Eccentricity at 33-43 weeks.
Table 4.4 shows the 5th, 50th and 95th percentile ranges for cord centrality,
eccentricity and cord coiling index for placentas at 33-43 weeks. Within this
gestation range, there was no effect of gestation on any of these ratios.
5th 50th 95th
Eccentricity 0.16 0.49 0.76
Cord centrality index 0.08 0.36 0.79
Cord coiling index 0.06 0.20 0.37
Table 4.2 Percentile ranges of morphological indices at 33-43 weeks.

CHAPTER 4: PLACENTAL MORPHOLOGICAL INDICES IN REFERENCE POPULATION
Page | 68
4.5 DISCUSSION
Most studies done on placenta and umbilical cord are based either in high risk
population or histology in adverse perinatal outcome. Very few studies have focused
on the morphology of placenta in unselected reference population. Out of those few
studies only handful studies have quantified the morphology of placenta.12-13
Therefore there is no established baseline quantified morphological characteristics of
placenta in an unselected population.
Although not clearly understood, abnormal coiling of the cord (Hypo/hypercoiling)
has been shown association with perinatal morbidity such as trisomies, preterm
delivery, fetal death, increased intrapartum complications and interventional
deliveries for fetal distress, low Apgar score, velamentous cord insertion and single
umbilical artery, small for gestation age, fetal asphyxia and single umbilical artery.5 8
56 Abnormal cord coiling has also been found with thrombosis of the chorionic plate
vessels, umbilical venous thrombosis and umbilical cord stenosis.6
The umbilical cord coiling index in this study was 0.20 coils/cm ± 0.09 with a
preponderance of left sided coiling (79.3%). The cord coiling index in this study is in
accordance with the published data.11 and so does the left sided preponderance of the
coiling.8 45 49
Quantitatively degree of deviations from central insertion into the chorionic plate has
been defined as cord centrality index. In this study the data from unselected
population of pregnancies delivering at gestation of 33-43 weeks, shows the mean
value of cord centrality as 0.36, which signifies a markedly „off centre‟ insertion
(Figure 4.4).
In recent years shape of the chorionic plate has been the area of interest. Studies have
linked the irregular and abnormal shape to the perinatal morbidities such as low birth
weight, suggesting variably shaped placentas have altered function.10 The mean
eccentricity index in this study is 0.49 indicating the shape of the chorionic disc more
ellipse than round (Figure 4.7).
CHAPTER 4: PLACENTAL MORPHOLOGICAL INDICES IN REFERENCE POPULATION
Page | 69
Though subjective and qualitative description of the placenta has a role
predominantly in clinical reporting, deriving these morphological indices will allow
entirely objective analysis of the particular index and other continuous variables in
relation to outcomes and other placental findings.
In summary, this study showed in the unselected reference population, mean of the
coiling index (0.20) was similar to that shown by previous studies, centrality index as
0.36 i.e. cord insertion off the centre and eccentricity as 0.49 i.e. chorionic disc is
elliptical or oval, not round.
These data are sufficiently robust to enable them to be used as a basis for future
studies both descriptive and of outcome in pregnancy. It is, therefore, appropriate to
dispel the widely held beliefs that the placenta is, in its natural and normal state,
circular and that the cord normally inserts into its centre.

CHAPTER 5 : MORPHOLOGY: UMBILICAL CORD COILING,
UMBILICAL CORD INSERTION AND PLACENTAL SHAPE
IN PREGNANCIES WITH COMMON OBSTETRIC
OUTCOME.
Summary Points:
This study derived the morphological indices for the placenta and the
umbilical cord in the pregnancies with common obstetric outcomes; PET,
PIH, GDM and SGA and compared the indices with reference population.
Key findings: The morphological indices; cord coiling index, cord centrality
index and eccentricity were not different in pregnancies with outcome groups.
This chapter is based on:
Pathak S, Hook E, Hackett G, Murdoch E, Sebire NJ, Jessop F, Lees C. Cord coiling,
umbilical cord insertion and placental shape in an unselected cohort delivering at term:
Relationship with common obstetric outcomes. Placenta. 2010; 31: 963-8.
Pathak S, Sebire NJ, Jessop F, Hackett G, Murdoch E, Hook E, Lees C. Morphological
features of placenta in relation to common obstetric outcomes: Paper in progress.

CHAPTER 5: PLACENTAL MORPHOLOGICAL INDICES IN OUTCOME GROUPS
Page | 71
5.1 INTRODUCTION
There have been recent studies on placental shape, cord coiling and umbilical cord
insertion.10 92 Studies have made attempts to correlate perinatal outcome with
abnormal placenta shape, coiling and umbilical cord insertion. Various studies have
attempted to explain possible causes and features in respective common obstetric
outcome group pregnancies however these have almost exclusively defined placental
and umbilical cord features qualitatively by using descriptive terms, making direct
comparison between groups problematic.
Attempts at quantitative investigation have involved calculating placental shape from
using a 3D model of placental vascular growth. This suggested that an irregular
placental outline is an indication of sub-optimal branching structure of the vascular
tree, accounting for the lower birth weight observed in non round/oval placentas.10
There is also a renewed interest in the placental shape and developmental
programming. Analysis of the relationship between placental surface area and
hypertension in later life has been described in subgroups defined by the mother‟s
height and socio-economic status; the risk of developing hypertension was associated
with reduced placental weight and area.93 Furthermore, pregnancies complicated by
pre-eclampsia had reduced placental surface area and more oval placentas; the short
diameter strongly associated with the severity of the pre-eclampsia.94
Chapter 4 defines the cord coiling, insertion and shape (eccentricity) in unselected
reference population. In this chapter, same placental indices have been investigated
in pregnancies affected by pre-eclampsia (PET), pregnancy induced hypertension
(PIH), gestational diabetes mellitus (GDM) and delivery of a small for gestational
age (SGA) baby.
The aim of this study is to derive indices describing the cord coiling, relationship of
cord insertion to its centre and the shape of placenta, at gestational age 33-43 weeks
placentas from women who developed pre-eclampsia, pregnancy induced
hypertension, gestational diabetes or small for gestational age with birth weight less

CHAPTER 5: PLACENTAL MORPHOLOGICAL INDICES IN OUTCOME GROUPS
Page | 72
than 10th centile. This study also aims to compare these morphological indices in
women with and without pre-eclampsia, PIH, GDM or delivered SGA babies.
Cord coiling was measured manually in the placentas. For cord insertion and
placental shape, we utilized digital measurements in placentas to morphometrically
define the cord insertion and placental shape using image J.
5.2 METHODS
All measurements of the placenta were derived from image J software following
standard photography using a common protocol and scale for calibration.95
This chapter includes the digital measurements in 888 women delivered at 33-43
weeks. Macroscopic indices derived were coiling index, cord centrality index,
eccentricity and the placental circumference. Frequency of these indices was noted in
common obstetric outcome groups of PET, PIH, GDM and SGA.
Circumference was calculated both for manual as well as digital measurements. For
this chapter, all analysis on the circumference is taken for digital measurements only.
Definitions of the common obstetric outcome categories are described in chapter 2.
We compared data in a specific outcome group to the reference group excluding
those particular cases with that outcome. We did not seek to compare data for
common obstetric outcome groups with a normal population.

CHAPTER 5: PLACENTAL MORPHOLOGICAL INDICES IN OUTCOME GROUPS
Page | 73
5.3 STATISTICAL ANALYSIS
Descriptive statistics of manual and digital measurements were analysed. A test of
normality (the Kolmogorov-Smirnov test) was performed on the cord coiling Index,
cord centrality index, and eccentricity index. Kolmogorov-Smirnov tests the
normality of the data distribution, and quantifies the discrepancy between observed
and expected distribution. A p value greater than 0.05 indicates normality of the
distribution; however considering the small numbers of common obstetric outcome
groups, the frequency histograms and Q-Q plots were also plotted for each variable
to test the normality of the distribution.
Considering the small number for common obstetric outcome group cases, as a
precaution, the non parametric Mann-Whitney U test was performed to test the
significant difference of coiling Index, cord centrality index, and eccentricity in the
specific common obstetric outcome groups and non affected population.
A Mann-Whitney U test 2 tailed significant values (p) was significant if value was
≤0.05.
5.4 RESULTS
888 placentas from singleton pregnancies, 33 to 43 weeks were examined; in all
placentas, digital measurements were obtained. Common obstetric outcome groups
were; Pre-eclampsia (PET=2.3%), Pregnancy induced hypertension (PIH=2.9%),
Gestational diabetes (GDM=4.3%) and small for gestational age of ≤ 10 th percentile
(SGA=9.2%). Table 5.1 describes the baseline maternal demographics of the study
population including the common obstetric outcome groups in the population.

CHAPTER 5: PLACENTAL MORPHOLOGICAL INDICES IN OUTCOME GROUPS
Page | 74
N=888 Mean ± SD
Maternal age ± SD 30.8 ± 5.6
% Caucasian (n) 89.8 (797)
% nulliparity (n) 48.2 (428)
% Smokers >5 cigarettes per day (n) 9.6 (85)
% Gestational Diabetes (n) 4.4 (39)
% Pre-eclampsia (n) 2.3 (20)
% Pregnancy induced hypertension (n) 2.9 (26)
% SGA ≤ 10th birth weight percentile (n) 9.2 (82)
Birth weight ± SD 3470 ± 496
Mean gestation at delivery ± SD 39.4 ± 1.4
Table 5.1 Baseline demographics of the reference population with common obstetric outcome
groups.
CHAPTER 5: PLACENTAL MORPHOLOGICAL INDICES IN OUTCOME GROUPS
Page | 75
Table 5.2 outlines the specific manual and digital measurements used in this chapter
for reference population, PET, PIH, GDM, and SGA.
*Reference
Population (n=888)
*PET (n=20)
*PIH (n=26)
*GDM (n=39)
*SGA (n=82)
Long axis 18.9(12.7-30.7)
18(15-23.2)
± 2.2
18.9(12.9-25.6)
± 2.7
19.1(12.7-25.8)
± 2.5
17.7(12.7-25.9)
± 2.5
Short axis 15.9(8.9-22)
1.8 15.2(8.9-18.9)
± 2.3
15.9(12.1-21.3) ±2.1
15.9(10.6-20.4) ±2.4
14.4(8.9-18.2) ±1.8
Distance of cord insertion
3.3(0.2-10.1) 1.9
3.6 (1.1-7.5) ±1.9
3.6(0.4-9.6) ±2.4
3.0(.2-7.7) ±1.7
3.5(0.2-8.3) ±1.9
41.5 (0-104)
14.1 43.5 (26-71)
±14.3
43.5(21-103) ±16.9
37.7(14-77) ± 14.2
35.7(0-64) ±12.4
Cord coils 8.4 (0-34)
4.9 8.4 (2-16)
±3.9
9.0(0-20) ±5.8
7.2(0-20) ±4
7.4(0-19) ±4.1
*All values are mean (range) ± SD Table 5.2 Placental measurements in reference and outcome groups.
5.4.1 Umbilical cord coiling and coiling index
Table 5.3 is the comparative table describing the directions of cord coiling in
reference and common obstetric outcome groups. In all groups left sided coiling was
in preponderance ranging from 70-92%. There was no coiling in 3.8% in PIH and
1.7% in SGA. There was no non- coiling observed in the cords in the GDM and SGA
groups.
Table 5.4 describes the statistics of cord coiling index in all common obstetric
outcome groups. The mean coiling index ranged from 0.19-0.22.
Kolmogorov-Smirnov test of normality revealed a p value of 0.82, 0.71, 0.80 and
0.18 for PET, PIH, GDM and SGA respectively indicating a normal distribution of
data in all common obstetric outcome cases, however considering the small number
of cases, frequency histograms Figures 5.1 (a-d) and Q-Q plots were also plotted,
which showed normal distribution.

CHAPTER 5: PLACENTAL MORPHOLOGICAL INDICES IN OUTCOME GROUPS
Page | 76
Direction of
cord coiling (%)
Left Right Bi-directional No coiling Missing data or cord too short to measure
Reference 79.3 16.3 0.6 2.1 1.7
PET 70 25 - - 5
PIH 73.1 23.1 - 3.8 -
GDM 92.1 5.3 - - 2.6
SGA 78 18.4 - 2.4 1.2
Table 5.3 Direction of cord coiling in reference and outcome groups.
Coiling Index N Mean (range)±SD
Reference 875 0.20 (0-1) ± 0.09
PET 19 0.20 (0.06-0.5) ± 0.10
PIH 26 0.20 (0-0.38) ± 0.09
GDM 39 0.20 (0-0.43) ± 0.09
SGA 81 0.21(0-0.55) ± 0.11
Table 5.4 Description of Cord Coiling Index in reference and outcome groups.

CHAPTER 5: PLACENTAL MORPHOLOGICAL INDICES IN OUTCOME GROUPS
Page | 77
Mann-Whitney U test was performed to test the difference in coiling index in
common obstetric outcome groups and it was compared to the non-affected cases.
A Mann-Whitney U test revealed no significant difference in the coiling index for
pre-eclampsia; (n=19), U=7891, z=-0.22, p=0.82, affected cases (mean=0.20,
median=0.15) versus non affected cases (mean=0.20, median=0.19). Results for PIH;
(n=26), U=10778, z=-0.20, p=0.83, affected (mean=0.20, median=0.18) versus non
affected group (mean=0.20, median=0.19). Cases of GDM (n=39), U=15475,
z=-0.49, p=0.63, affected cases (mean=0.20, median=0.18) versus non affected cases
(mean=0.20, median=0.19). Non parametric test showed a non significant difference
(p=0.54) in SGA (n=81), U=30814, z=-0.62, (mean=0.21, median=0.20) versus non
affected cases (mean=0.20, median=0.19).
In each category above, p value was ≥ 0.05, no significant difference in the coiling
index of the groups with or without the conditions defined.

CHAPTER 5: PLACENTAL MORPHOLOGICAL INDICES IN OUTCOME GROUPS
Page | 78
a b
c d
Figure 5.1(a-d) Frequency histograms of coiling index of obstetric outcome groups at 33-43
weeks.

CHAPTER 5: PLACENTAL MORPHOLOGICAL INDICES IN OUTCOME GROUPS
Page | 79
5.4.2 Umbilical cord insertion
Qualitative description of the type of umbilical cord insertion in relation to previous
standards showed that the frequency of central and paracentral umbilical cord
insertion remains highest even in common obstetric outcome groups.
Table 5.5 shows the different types of umbilical cord insertion in reference and
outcome groups. Comparing within the groups, incidence of central and paracentral
insertion was similar to the unselected reference population. Though the incidence of
marginal and velamentous appeared higher in pregnancy induced hypertension;
19.3% and 3.8% respectively, but statistically it was a non significant difference
(p≥0.05).
Cord Insertion
Central (%)
Paracentral (%)
Marginal (%)
Velamentous (%)
Not known (%)
Reference 27.6 63.9 8.3 0.2 -
PET 25 65 5 - 5
PIH 23.1 53.8 19.3 3.8 -
GDM 34.2 57.9 7.9 - -
SGA 25.6 61 12.2 - 1.2
Table 5.5 Qualitative description of cord insertion in reference and common obstetric outcome
groups.

CHAPTER 5: PLACENTAL MORPHOLOGICAL INDICES IN OUTCOME GROUPS
Page | 80
5.4.3 Cord centrality index
The mean distance of cord insertion from the centre ranged from 2.99 -3.63 cm in all
common obstetric outcome groups, irrespective of the direction of umbilical cord
coiling.
Table 5.6 describes the statistics of Centrality index in all common obstetric outcome
groups. The mean centrality index ranged from 0.31-0.40. Kolmogorov-Smirnov test
of normality revealed a 2 tailed p value of 0.97, 0.52, 0.78 and 0.06 for PET, PIH,
GDM and SGA respectively indicating a normal distribution of data in all common
obstetric outcome cases, however considering the small number of cases, frequency
histograms Figures 5.2 (a-d) and Q-Q plots were also calculated, showing normal
distribution.
Mann-Whitney U test revealed no significant difference in the centrality index of
PET (n=20), U=7370, z=-1.15, p=0.24; affected (mean=0.41, median=0.38) versus
non affected (mean=0.36, median=0.32); PIH (n=26), U=10742, z=-0.36, p=0.71,
affected (mean=0.40, median=0.31) versus non affected (mean=0.36, median=0.32);
GDM (n=39), U=14804, z=-1.07, p=0.28; affected (mean=0.32, median=0.31) versus
non affected (mean=0.36, median=032); SGA (n=82), U=29627, z=-1.55, p=0.12
affected (mean=0.40, median=0.35) versus non affected (mean=0.35, median=0.32).
Centrality Index N Mean (range) ± SD
Reference 888 0.35 (0.02-1.01) ± 0.21
PET 20 0.40 (0.12-0.89) ± 0.20
PIH 26 0.39 (0.04-0.99) ± 0.27
GDM 39 0.31 (0.02-0.93) ± 0.18
SGA 82 0.40 (0.02-0.99) ± 0.24
Table 5.6 Description of Centrality index in reference and outcome groups.

CHAPTER 5: PLACENTAL MORPHOLOGICAL INDICES IN OUTCOME GROUPS
Page | 81
a b
c d
Figure 5.2 (a-d) Frequency histograms of Cord Centrality Index in outcome groups at 33-43
weeks.

CHAPTER 5: PLACENTAL MORPHOLOGICAL INDICES IN OUTCOME GROUPS
Page | 82
5.4.4 Eccentricity
Table 5.7 describes the eccentricity in all common obstetric outcome groups. The
mean eccentricity ranged from 0.47-0.52 in all common obstetric outcome groups.
Kolmogorov-Smirnov test of normality revealed a 2 tailed p value of 0.98, 0.73, 0.43
and 0.99 for PET, PIH, GDM and SGA respectively indicating a normal distribution
of data in all common obstetric outcome cases, however considering the small
number of cases, frequency histograms Figures 5.3 (a-d) and Q-Q plots were also
displayed, showing a normal distribution.
Eccentricity N Mean (range) ±SD
Reference 888 0.49 (0-0.91) ± 0.18
PET 20 0.47 (0.11-0.91) ± 0.19
PIH 26 0.50 (0.25-0.79) ± 0.14
GDM 39 0.49 (0-0.85) ± 0.20
SGA 82 0.52 (0.20-0.91) ± 0.18
Table 5.7 Description of Eccentricity in reference and outcome groups.
Mann-Whitney U test revealed no significant difference in the eccentricity of PET
(n=20), U=8095, z=-0.51, p=0.60; affected (mean=0.47 , median=0.50) versus non
affected (mean=0.49, median=0.51); PIH (n=26), U=109812, z=-0.17, p=0.86,
affected (mean=0.50 , median=0.52)versus non affected (mean=0.49, median=0.51);
GDM (n=39), U=15718, z=-0.49, p=0.63; affected (mean=0.50 , median=0.50)
versus non affected (mean=0.49, median=0.51); SGA (n=82), U=29920, z=-1.41,
p=0.16, affected (mean=0.52, median=0.52) versus non affected (mean=0.48,
median=0.51).

CHAPTER 5: PLACENTAL MORPHOLOGICAL INDICES IN OUTCOME GROUPS
Page | 83
a b
c d
Figure 5.3 (a-d) Frequency histograms of placental Eccentricity in obstetric outcome groups at
33-43 weeks.

CHAPTER 5: PLACENTAL MORPHOLOGICAL INDICES IN OUTCOME GROUPS
Page | 84
5.5 DISCUSSION
This data highlight the morphological indices of the placenta and umbilical cord in
common obstetric outcome pregnancies and compare these indices in the non-affected
cases.
The coiling index is one of the most studied umbilical cord related parameters in high
risk pregnancies. Pre-eclampsia and gestational diabetes have been linked to the
abnormal coiling, both non coiling as well as hyper coiling.57 96 Hypercoiling has been
associated with SGA (OR 2.10).8 This study however showed no significant difference
in umbilical cord coiling index with pre-eclampsia, PIH, GDM or SGA compared to that
of population without these common obstetric outcome groups.
Qualitatively marginal cord insertion are associated with intra uterine growth
restriction, stillbirth and neonatal death9, and velamentous insertion with low birth
weight, IUGR, diabetes mellitus.9 74 In the current study, there was no significant
difference in the incidence of central, paracentral, marginal or velamentous cord
insertions in common obstetric outcome groups as compared to the non-affected
groups.
There are no studies quantitatively comparing the difference between abnormal insertion
of the umbilical cord in common obstetric outcome groups and a reference population.
The distance of umbilical cord insertion from the centre (or from the chorionic plate
margin) has been considered a marker of placental insufficiency.90 97 Despite there
being association of peripheral cord insertion with common obstetric outcome groups,
shown in the various above studies, quantitatively defined, in the current study there was
no significant difference in cord centrality index for pre-eclampsia, PIH, GDM and SGA
groups compared to the reference population.

CHAPTER 5: PLACENTAL MORPHOLOGICAL INDICES IN OUTCOME GROUPS
Page | 85
There are no studies describing the shape of placenta quantitatively in the common
obstetric outcome groups of hypertensive disorders of pregnancy, GDM or SGA.
Further, none have compared the shapes of the placenta quantitatively between common
obstetric outcome groups and a reference population, though a recent study has shown a
correlation between the short axis of the placenta and the severity of the pre-eclampsia.94
This study did not find any statistically significant difference in eccentricity between the
populations affected with the common obstetric outcome groups to that of un-affected
rest of population.
To summarise, coiling index, cord centrality index and eccentricity in this study was not
different in the adverse pregnancy outcomes that has been defined previously, compared
to the data without the disease from unselected reference population.

CHAPTER 6 : MORPHOLOGY: PLACENTAL WEIGHT AND
CIRCUMFERENCE-SIGNIFICANCE AND CORRELATION
WITH BIRTH WEIGHT IN UNSELECTED PREGNANCIES
AND COMMON OBSTETRIC OUTCOME GROUPS.
Summary points:
This study described the baseline data for the ratio of birth weight to the
placental weight and placental circumference in the reference population of
1159 at 33-43 weeks of gestation.
Key findings: Study analysed the relationship of birth weight to the placental
weight and circumference and showed a strong positive correlation of birth
weight to the placental weight and circumference.
This means that bigger the placenta in weight and size, heavier is the baby
and vice versa, which may sound obvious, but has not been shown
quantitatively before.
In cases with PET, these ratios were significantly smaller compared to cases
not affected by PET.
This chapter is based on:
Pathak S, Jessop F, Hook L, Sebire NJ, and Lees C. Placental weight, digitally derived
placental dimensions at term and their relationship to birth weight. J Maternal Fetal
Neonatal Med. 2010 Oct; 23(10):1176-82

CHAPTER 6: PLACENTAL WEIGHT, CIRCUMFERENCE AND BIRTH WEIGHT
Page | 87
6.1 INTRODUCTION
The weight of the placental is an important reflection of the placental function. The
placenta weight is one of the important characteristics of the placental size. Two
important constituents of the placenta size are chorionic plate surface area, and the
disc thickness. The area of the uterus which is covered by the placenta is the surface
area of the chorionic plate 98, on the other hand thickness of the chorionic disc shows
the extent of the arborisation of the villous.33 The placenta weight can be a 'sentinel'
indicator of nutritional and/or environmental problems. However, it is not clear,
whether weighing the placenta reflects the “true” weight as it is extremely difficult to
evaluate the exact amount of fetal and maternal blood present in the placenta at the
time of weighing? It is difficult to assess the amount of blood remained in the
intervillous space. The amount of fetal blood trapped in the placenta will depend to
some degree upon the timing of cord clamping after delivery of the baby.
Moreover there are no standard techniques as to how a placenta should be weighed,
some weigh the placenta with attached membranes and the cord and also without
removing the adherent maternal clots, whilst other will weigh placenta with
membranes trimmed off and with or without cutting the cord and with or without
removing any adherent maternal clots.
More importantly, one has to consider the fact that a placenta loses a variable but
progressive weight while kept in the refrigerator, if not weighed soon after delivery. The
placenta stored in the lab to be weighed later, loses weight over a period of time, one
study showed that stored placenta loses 4% of its weight in 12 hours, 6% in 24 hours and
10% in 48 hours.99 This problem perhaps could be avoided by keeping the placenta in
the low temperature or fix in formalin; however it is not advisable to freeze or fix the
placenta before examination as both these procedures can obliterate the most useful
microscopic characteristics and make even the macroscopic examination more difficult.
Fixation of the placenta also produces variable changes in the weight which then further
makes difficult to weigh the placenta accurately.

CHAPTER 6: PLACENTAL WEIGHT, CIRCUMFERENCE AND BIRTH WEIGHT
Page | 88
There are different factors which may affect the placental weight for that given
pregnancy. Placental weight varies with ethnicity 100, gestation age, maternal socio-
economic status, smoking, maternal age, sex of the infant and birth weight.
Feto-placental weight ratio represents the balance between fetal and placenta growth.
Any alteration in any of them will suggest disturbance in the intrauterine status and
would warrant further investigation. Birth weights, placental weights, and birth weight
/placental weight ratios have been correlated with perinatal morbidity and mortality.
Less than 10th centile of the placenta weight has been associated with Intrauterine
growth restriction, pre-eclampsia, increased intervillous fibrin deposition, villitis of
unknown origin and trisomy whilst high placental weight has been linked with maternal
diseases such as diabetes mellitus, anaemia, and fetal disorders such as fetal anaemia,
hydrops, congenital syphilis and nephritic syndrome.101-102 As few studies have shown
the importance of the weight of the placenta, it has encouraged the researchers to explore
more about the clinical significance of placental weight. The placental weight percentile
curves according to the gestation age and gender for that population have been
described.103 These percentile curves are specific for that population but if one consider
the ratio of birth weight to the placenta weight, probably that should not vary much
between the different sets of populations and it has long been argued if this ratio is likely
to yield useful information rather than the weight of the placenta alone.
A positive correlation has been seen between the placental weight and the infant
weight at birth. Birth weight of the infant is said to be directly proportional to the
placental weight.104-105 Studies have even suggested that small for gestational age
infants have smaller placentas than the placentas for appropriate weight for gestation
infants, suggesting that fetal growth depends on the actual weight of the placenta.
The placenta weight/ fetal birth weight ratio is 1:2.9 at 24 weeks which increases to
1:6.8 at 40 weeks106, any change in this ratio will simply reflect the altered
relationship of fetal-placental unit. In the recent literature it has been emphasised
more onto the placental and fetal weight ratio, which was said to be more accurate
rather than taking the weight of the placenta alone and correlating it to the neonatal
outcome.

CHAPTER 6: PLACENTAL WEIGHT, CIRCUMFERENCE AND BIRTH WEIGHT
Page | 89
Higher placental/fetal weight ratio has been correlated with high perinatal morbidity
and mortality.107 Even in these cases one could argue, placenta gets bigger as a
compensatory mechanism in high risk pregnancies such as pre-eclampsia, severe
anaemia, heavy smoking in pregnancy and it won‟t be surprising to get the higher
placental /fetal weight ratio associated with higher perinatal morbidity and mortality.
Studies are reported showing that anaemia during pregnancy is associated with large
placental weight and a high ratio of placental weight to birth weight. 108 109
Placenta weight/fetal weight ratio has been well known as an predictor of developing
disease later in adult life as intrauterine environment has an important effect on blood
pressure and hypertension in adults. Large British cohort studies have suggested that
having a discordance of larger placenta with a small baby may lead to circulatory
adaptation in the fetus, altered arterial structure in the child, and hypertension in the
adult.110 This may have important implications for the prevention of adult
hypertension, which appears to have its origin in fetal life. Higher placenta weight in
the most recent pregnancy has also been correlated significantly to the reduced
survival with the breast cancer, if diagnosed during pregnancy or within 2 years
thereafter.111
However placenta weight only, per se should have no clinical importance unless
considered along with gestational age and clinical picture.
Further, a few recent studies establish the nature of the relationship between birth
weight and placental weight and circumference; positive correlations between
placental and infant weight are reported105 112-113, but these data do not refer to an
unselected population. Moreover, the available data on the birth weight/placenta
circumference is qualitative. There is no available data on quantitative analysis on
placental circumference and its correlation with birth weight.

CHAPTER 6: PLACENTAL WEIGHT, CIRCUMFERENCE AND BIRTH WEIGHT
Page | 90
The aims of this chapter:-
Analysis of mean placenta weight, placenta circumference and birth weight in an
unselected reference population.
Analysis of mean placenta weight, placenta circumference and birth weight in
common obstetrics outcome groups e.g. Pre-eclampsia (PET), pregnancy induced
hypertension (PIH), gestational diabetes (GDM) and small for gestational age (SGA).
Defining the relationship between placental weight and placental circumference
(manual) to birth weight in the common obstetric outcome population and compare
the ratios to the similar ratios derived for non affected cases in unselected reference
population.
6.2 METHODS
Details of the methods are described in chapter 2.
1159 placentas from singleton pregnancies, 33 to 43 weeks were examined. Placental
circumference taken in this chapter is manual circumference. Definitions of the
common obstetric outcome pregnancies have been defined in chapter 2.
6.3 STATISTICAL ANALYSIS
Descriptive analysis of birth weight, placenta weight, and placenta circumference
was performed in reference population, pre-eclampsia (PET), pregnancy induced
hypertension (PIH), Gestational diabetes (GDM) and Small for gestational age at
birth (SGA).
Normality was checked for birth weight, placenta weight and placenta circumference
for reference population, using the frequency histograms and Q-Q plots.

CHAPTER 6: PLACENTAL WEIGHT, CIRCUMFERENCE AND BIRTH WEIGHT
Page | 91
Descriptive analysis was performed for ratio of birth weight to placenta weight and
placental circumference in reference population, PET, PIH, GDM and SGA.
To establish the relationship of birth weight to the placental weight and
circumference, Z score of all the three was calculated to normalise the data for the
gestational age within the gestation range 33-43 weeks, using the means and SDs
derived from this population. A linear relationship was analysed on a scattered plot
for birth weight versus placenta weight and birth weight versus placenta
circumference. Pearson correlation coefficient (r) was derived and r2 was calculated
for both comparisons. As multiple comparisons were made, p value of ≤ 0.01 was
considered significant.
T test was performed to test if there is any significant difference of ratio of birth
weight to placenta weight and placenta circumference in the non-affected group
compared to the group affected with PET, PIH, GDM or SGA. A T test 2 tailed
significant values (p) was significant if value was ≤0.05.
6.4 RESULTS
In the study data of 1159 placentas, specific common obstetric outcome pregnancy
categories were chosen; Pre-eclampsia, Pregnancy induced hypertension, Gestational
diabetes and small for gestational age of ≤ 10th percentile. Table 6.1 describes the
baseline maternal demographics of the study population including the common
obstetric outcome groups in the population.

CHAPTER 6: PLACENTAL WEIGHT, CIRCUMFERENCE AND BIRTH WEIGHT
Page | 92
N 1159
Maternal Age ± SD 30.9 ± 5.73
% Nulliparity (n) 47.6 (552)
% Smokers (n) 9.3 (108)
% Caucasians (n) 90.7 (1051)
% PET (n) 2.5 (29)
% PIH (n) 2.6 (30)
% GDM (n) 4 (46)
% SGA <10 Centile (n) 9.4 (109)
Mean gestation age at delivery ± SD 39.5 ± 1.49
% Female (n) 46.7 (541)
% Male (n) 53.3 (618)
Table 6.1 Baseline demographics of the reference population.
Table 6.2 describes the statistics of mean ± SD of birth weight, placenta weight and
placenta circumference (manual) in reference population and all common obstetric
outcome groups. Table shows the crude comparison of the means of birth weight,
placenta weight and placenta circumference in different groups.
Mean ± SD Gestation age range (Weeks)
Birth weight (gms) Placenta weight (gms) Placenta circumference
(cm)
Reference 33-43 3480 ± 511 483 ± 100 60.30 ± 6.28
PET 33-41 3076 ± 823 495 ± 117 59.42 ± 7.27
PIH 36-42 3451 ± 510 464 ± 102 61.81 ± 8.75
GDM 37-41 3511 ± 462 506 ± 92 61.26 ± 7.55
SGA 33-42 2671 ± 341 377 ± 68 55.95 ± 5.49
Table 6.2 Birth weight, placental weight and circumference in reference and obstetric outcome groups.

CHAPTER 6: PLACENTAL WEIGHT, CIRCUMFERENCE AND BIRTH WEIGHT
Page | 93
Figure 6.1(a-c) represent the frequency histograms of birth weight, placenta weight
and circumference in reference unselected population. There was data missing for 1
birth weight, 10 placental weights and 9 placental circumferences in the reference
population.
a
b
c
Figure 6.1(a-c) Frequency histograms of birth weight, placenta weight and circumference in
reference population.

CHAPTER 6: PLACENTAL WEIGHT, CIRCUMFERENCE AND BIRTH WEIGHT
Page | 94
Table 6.3 and 6.4 describes the statistics for the ratio of birth weight to placenta
weight and placenta circumference.
Birth Wt / Placenta Wt
Coefficient of Variation
Mean Median SD Mean centred Median centred
Reference 7.38 7.32 1.20 16.2% 16.4%
PET 6.60 6.49 1.03 15.6% 15.9%
PIH 7.69 7.63 1.67 21.5% 21.7%
GDM 7.07 6.94 1.08 15.3% 15.7%
SGA 7.27 7.29 1.30 17.2% 17.2%
Table 6.3 Birth weight and placenta weight ratio in reference and common obstetric outcome
groups.
Birth
Wt/placenta circumference
Coefficient of Variation
Mean Median SD Mean centred Median
Reference 58.05 58.12 8.07 13.9% 13.9%
PET 54.14 53.42 10.00 18.5% 18.8%
PIH 56.47 55.47 8.60 15.2% 15.6%
GDM 57.70 57.71 7.39 12.8% 12.8%
SGA 48.27 48.66 6.14 12.7% 12.6%
Table 6.4 Birth weight and placenta circumference ratio in Reference and common obstetric
outcome groups.

CHAPTER 6: PLACENTAL WEIGHT, CIRCUMFERENCE AND BIRTH WEIGHT
Page | 95
Tables 6.5 (a-d) illustrates the direct comparisons of birth weight and placenta weight
in cases with common obstetric outcome versus cases not affected by the outcome
groups.
a
Birth Wt /
Placenta Wt Mean Median SD
Coefficient of Variation
Mean Median
No PET 7.40 7.34 1.19 16.1% 16.3%
Present PET 6.60 6.49 1.03 15.6% 15.9%
Overall 7.38 7.32 1.20 16.2% 16.4%
b
Birth Wt /
Placenta Wt Mean Median SD
Coefficient of Variation
Mean Median
No PIH 7.38 7.31 1.18 16.0% 16.2%
Present PIH 7.68 7.63 1.66 21.5% 21.7%
Overall 7.38 7.32 1.20 16.2% 16.4%
c
Birth Wt /
Placenta Wt Mean Median SD
Coefficient of Variation
Mean Median
No Diabetes 7.40 7.34 1.20 16.2% 16.4%
GDM 7.07 6.94 1.08 15.3% 15.7%
Overall 7.38 7.32 1.20 16.2% 16.4%
d
Birth Wt /
Placenta Wt Mean Median SD
Coefficient of Variation
Mean Median
NGA 7.39 7.32 1.19 16.1% 16.3%
SGA 7.27 7.29 1.30 17.2% 17.2%
Overall 7.38 7.32 1.20 16.2% 16.4%
Table 6.5 (a-d) Birth weight and placental weight ratios in common obstetric outcome groups

CHAPTER 6: PLACENTAL WEIGHT, CIRCUMFERENCE AND BIRTH WEIGHT
Page | 96
Tables 6.6 (a-d) illustrates the direct comparison of birth weight and placental
circumference ratio in cases with and without obstetric outcome groups.
a
Birth Wt / Placental
Circumference Mean Median SD
Coefficient of Variation
Mean Median
No PET 58.14 58.16 8.00 13.8% 13.8%
Present PET 54.14 53.42 10.00 18.5% 18.8%
Overall 58.05 58.12 8.07 13.9% 13.9%
b
Birth Wt / Placental
Circumference Mean Median SD
Coefficient of Variation
Mean Median
No PIH 58.09 58.14 8.06 13.9% 13.9%
Present PIH 56.47 55.47 8.60 15.2% 15.6%
Overall 58.05 58.12 8.07 13.9% 13.9%
c
Birth Wt/ Placental
Circumference Mean Median SD
Coefficient of Variation
Mean Median
No Diabetes 58.08 58.16 8.10 14.0% 13.9%
GDM 57.70 57.71 7.39 12.8% 12.8%
Overall 58.05 58.12 8.07 13.9% 13.9%
d
Birth Wt / Placental
Circumference Mean Median SD
Coefficient of Variation
Mean Median
NGA 59.05 58.86 7.56 12.8% 12.8%
SGA 48.27 48.66 6.14 12.7% 12.6%
Overall 58.05 58.12 8.07 13.9% 13.9%
Table 6.6 (a-d) Birth weight and placental circumference ratios in common obstetric outcome
groups

CHAPTER 6: PLACENTAL WEIGHT, CIRCUMFERENCE AND BIRTH WEIGHT
Page | 97
T test was conducted to compare the birth weight ratios to placenta weight and
circumference for all common obstetric outcome groups and the reference
population.
Results of test in the birth weight: placenta weight is as follows: - (affected versus
non-affected cases)
PET (n=26), Mean=6.60 ± 1.03, p=0.001 (two tailed). The mean difference of the
two means was 0.79 with 95% confidence interval of 0.34 to 1.27.
PIH (n=30), Mean=7.68 ± 1.66, p= 0.16, GDM (n=46), Mean = 7.07 ± 1.08, p= 0.07,
SGA (n=107), Mean=7.28 ± 1.25, p= 0.32, and unselected reference population,
Mean = 7.39 ± 1.20.
T test results for birth weight: placenta circumference is as follows: - (affected versus
non-affected cases)
PET (n=26), Mean=54.14 ±10, p=0.01 (two tailed), the mean difference of the means
was 3.99 with 95% Confidence interval of 0.86 to 7.13.
PIH (n=30), Mean =56.47 ± 8.60, p= 0.28, GDM (n=46), Mean=57.70 ± 7.39,
p=0.76. In cases with SGA-(n=108) Mean=48.27± 6.14, p=0.00. The mean
difference of the means was 10.79 with 95% CI of 9.53 to 12.04. Unselected
reference population had mean value of 58.05 ± 8.07.
Figures 6.2 (a-b) shows the scatter plots and the linear relationship with significant
Pearson‟s correlation coefficient for z: birth weight to z: placenta weight and z: birth
weight to z: placenta circumference for reference population, r as 0.638 and 0.417
respectively.
For common obstetric outcome groups, z- score of birth weight and placental weight
(figures 6.3-6.6), the Pearson‟s correlation coefficient (r) was 0.78, 0.49, 0.59, 0.45
with p values 0.001, 0.006, 0.001 and 0.001 for PET, PIH, GDM and SGA
respectively, showing high positive correlation.

CHAPTER 6: PLACENTAL WEIGHT, CIRCUMFERENCE AND BIRTH WEIGHT
Page | 98
Similarly significant results were obtained for z-score of birth weight and placenta
circumference are shown in figures 6.7- 6.10, with Pearson‟s correlation coefficient
(r) as 0.54, 0.39, 0.50 and 0.35 with p values 0.004, 0.034, 0.001 and 0.001 for PET,
PIH, GDM and SGA respectively. These figures also compare the relationship in the
ratios with and without the disease.
a
b
Figure 6.2 (a-b) z score of birth weight versus placental weight and circumference in reference
population.

CHAPTER 6: PLACENTAL WEIGHT, CIRCUMFERENCE AND BIRTH WEIGHT
Page | 99
a b
Figure 6.3 (a-b) z score of birth weight versus placental weight in PET.
a b
Figure 6.4 (a-b) z score of birth weight versus placental weight in PIH.

CHAPTER 6: PLACENTAL WEIGHT, CIRCUMFERENCE AND BIRTH WEIGHT
Page | 100
a b
Figure 6.5 (a-b) z score of birth weight versus placental weight in GDM.
a b
Figure 6.6 (a-b) z score of birth weight versus placental weight in SGA.
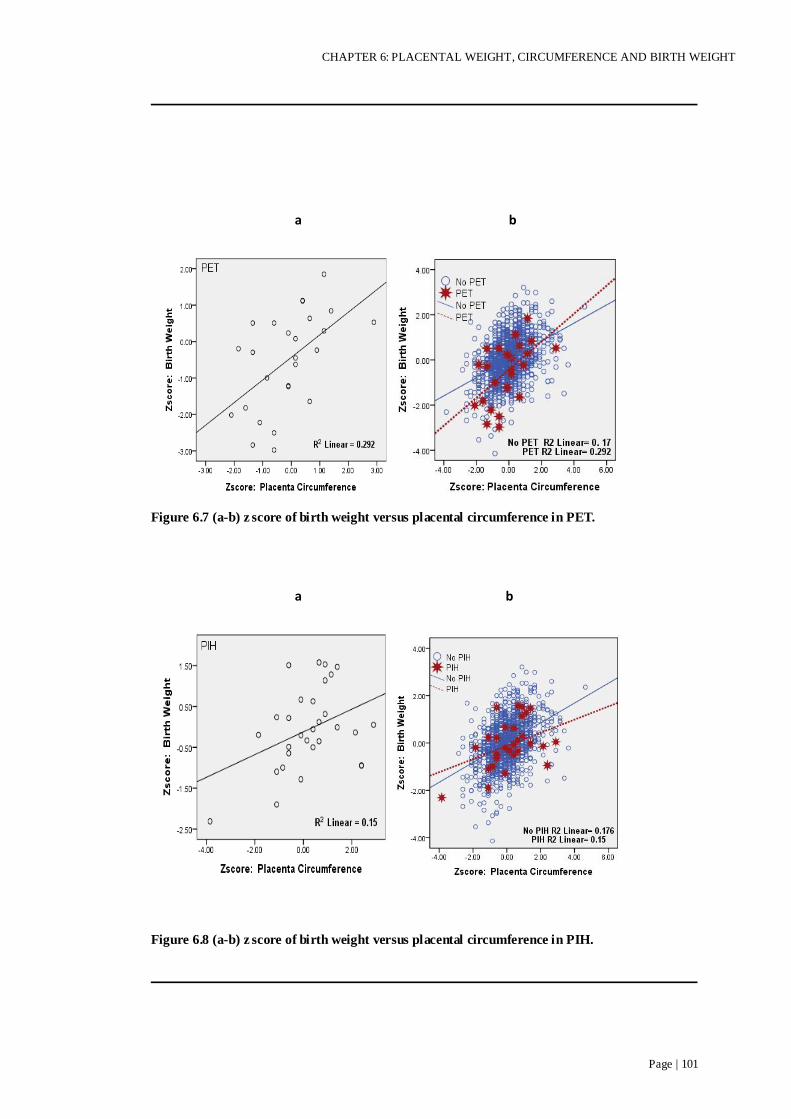
CHAPTER 6: PLACENTAL WEIGHT, CIRCUMFERENCE AND BIRTH WEIGHT
Page | 101
a b
Figure 6.7 (a-b) z score of birth weight versus placental circumference in PET.
a b
Figure 6.8 (a-b) z score of birth weight versus placental circumference in PIH.

CHAPTER 6: PLACENTAL WEIGHT, CIRCUMFERENCE AND BIRTH WEIGHT
Page | 102
a b
Figure 6.9 (a-b) z score of birth weight versus placental circumference in GDM.
a b
Figure 6.10 (a-b) z score of birth weight versus placental circumference in SGA.

CHAPTER 6: PLACENTAL WEIGHT, CIRCUMFERENCE AND BIRTH WEIGHT
Page | 103
6.5 DISCUSSION
The normal birth: placental weight ratio has been shown to range between 6.5 to 7.1
at term 37-42 weeks gestation114-115 Another study showed the birth weight: placental
weight ratio ranging from 6.3 to 8.46 at 34-43 weeks study.116 The birth weight:
placental weight ratio of 7.39 ± 1.20 in reference population from 33-43 weeks that
was derived, is therefore within the limits of these ranges. This ratio does have
relevance as the ratio of birth weight: placental weight has been considered to be
more important than placental weight alone when considering adverse perinatal
outcome such as fetal and neonatal demise.107 117
In the common obstetric outcome population, birth weight: placental weight has been
compared with non affected population. In cases with PET, this ratio has been found
significantly (p=0.001) smaller as compared to non PET cases (6.60 versus 7.40).
Mean difference between the groups was 0.79 with 95% confidence interval of 0.34-
1.27, Studies have shown that often infants are small for gestational age for a small
placenta in pre-eclampsia and large for large for gestational age.118 In the current
study, cases with PIH, GDM and SGA did not show this ratio any significantly
different from that of non-affected groups.
The other ratio, this study has looked at is birth weight: placenta circumference,
which has not been shown before in previous studies. Whether it is a useful ratio or
not, it is not clear yet but this can be used as a baseline for the future studies on the
same area.
This study showed significant difference in birth weight/placental circumference ratio in
cases with PET and SGA. In cases of PET, mean difference of this ratio was 3.9 from
non-affected population with confidence interval of 0.86-7.13 and p value was 0.01. For
SGA, mean difference was 10.79 (48.27 versus 59.05) with 95% CI as 9.53-12.04

CHAPTER 6: PLACENTAL WEIGHT, CIRCUMFERENCE AND BIRTH WEIGHT
Page | 104
with p value of <0.01. Though it would seem obvious that for a low birth weight, size or
circumference of placenta should also be smaller, but the current study did not notice
this ratio any different in cases with PIH and GDM as compared to the non-affected
population values.
This study also showed strong correlation between placental weight and
circumference to the birth weight in all common obstetric outcome groups and
reference group (scatter plots with positive correlation with significant Pearson‟s
correlation coefficient‟s value; figures 6.2-6.10), which also confers that higher the
birth weight, higher is the placental weight and the circumference and vice versa.
Although this may sound obvious but these relationships have not been shown before
in this manner, quantitatively.
The values of placental weight and birth weight/placental weight ratio in reference
population will provide a baseline for future studies based on the similar subjects.

CHAPTER 7 : HISTOLOGY AND ITS RELATIONSHIP WITH
PLACENTAL MORPHOLOGY
Summary points:
This study has described the baseline data of predefined histological lesions
of the placenta in common obstetric outcome groups of PET, PIH, GDM and
SGA and in reference population and its relationship with its morphology.
Key points: are as follows-
There was no significant difference in the incidence of predefined
histological lesions in the pregnancy outcome groups.
Most placentas from an unselected population (72%) or common pregnancy
outcome groups (66-80%) are histologically normal.
Placental morphological indices were not different in predefined
histological lesions.
Macroscopic abnormalities of the placental shape and cord insertion cannot
predict presence or absence of histological features and are of limited clinical
significance.
This chapter is based on:
Pathak S, Sebire NJ, Jessop F, Hackett G, Murdoch E, Hook E, Lees C. Relationship
between placental morphology and histological findings in an unselected population
near term- accepted Virchows Archiv, March 2011
Pathak S, Sebire NJ, Jessop F, Hackett G, Murdoch E, Hook E, Lees C. Placental
histology at or near term in relationship to obstetric outcome- Virchows Archiv.
April 2011

CHAPTER 7: HISTOLOGY AND ITS RELATIONSHIP WITH PLACENTAL MORPHOLOGY
Page | 106
7.1 INTRODUCTION
Though there have been some agreed standards for the placental histological
examinations16-17, still there are no uniformly defined standards and guidelines for
placental examinations. Not only that, there are not even agreed definitions for most
histological pathologies. Very few Obstetricians truly understand these pathological
lesions and their implications for the past and the future pregnancy. Frequently,
pathologists report the placenta examination as either “NAD” or small area of
marginal infarction, which may not have any bearing onto the clinical outcome while
Obstetricians “blame” the only available pathology of placenta, as the possible cause
of adverse perinatal outcome.
Another major concern is that most of the placenta literature is based on abnormal
placentas, which makes it difficult to differentiate for many features between the
“pathologically abnormal” versus “normal variant”. There is a definite need for
studies to analyse normal placentas statistically and to identify the normal variants of
histological lesions during the course of pregnancy. In best of my knowledge the
pattern of histopathological abnormalities of the placenta from unselected population
has not been described before.
Complications such as pre-eclampsia, pregnancy induced hypertension, gestational
diabetes, and small for gestational age are associated with higher perinatal morbidity
and mortality. Since the placenta and umbilical cord is the functional unit between
the mother and the fetus, the placenta may be expected to reflect in some way the
health of both the baby and the mother. One might therefore hypothesize that certain
obstetric outcomes might exhibit specific effects or histological lesions on the
placenta. Numerous studies have been performed on placentas in these obstetric
outcomes, in an attempt to explain the possible effects of these on the pregnancy and
histology of placenta. However none of the studies highlights any of the lesions as
characteristic of any one particular obstetric outcome category, which then makes the
whole picture very confusing. Moreover, incidence of these histological lesions
present in obstetric outcomes has not been studied in unselected cohort.

CHAPTER 7: HISTOLOGY AND ITS RELATIONSHIP WITH PLACENTAL MORPHOLOGY
Page | 107
PET/PIH
Due to the incomplete invasion of trophoblast, spiral arteries remains less elastic
leading to maternal vasospasm, this eventually causes high resistance to blood flow
passing through these vessels and reduced utero-placental blood flow. The placenta
in cases of pre-eclampsia and PIH may exhibit many pathological features suggestive
of the disease but there may be completely normal placental findings
macroscopically as well as microscopically even in cases of severe disease.
Therefore the absence of these features should not exclude the pathology, as these
pathological features may be characteristic but not the universal finding.
Pathological findings of the placenta in PET and PIH depend largely on the severity
and the duration of the disease. Pathological features described in association with
pre-eclampsia and pregnancy induced hypertension are villous maturation, decidua
arthropathy, retroplacental haematomas, intervillous thrombosis, fetal artery
thrombosis, varying degree of perivillous fibrin deposition and chorioamnionitis.
GDM
According to the UK diabetes statistics, about 1.8 million people are diagnosed with
the diabetes by 2004 and by 2010, this will increase to 3 million. With the increasing
incidence of diabetes, the incidence of gestational diabetes is growing. 2-5 % of
women delivering in England and Wales per year have diabetes during pregnancy.
Approximately 87.5% of these have gestational diabetes.
There are many structural and functional changes in placenta in diabetes depending
upon the gestational period affected of the pregnancy. Microscopic features reported
in diabetes are so varied that at times they seem to contradict each other. These
differences could either be due to the different methodologies or may be due to the
difference in degree of severity of diabetes and difference in gestational age at
delivery. Histological lesions documented in diabetes are villous immaturity,
oedema, Chorangiosis and proliferative endarteritis.

CHAPTER 7: HISTOLOGY AND ITS RELATIONSHIP WITH PLACENTAL MORPHOLOGY
Page | 108
Small for Gestational Age
Small for gestational age (SGA) infant has been defined in this study as the birth
weight less than 10th percentile of the gestational age. SGA infants may or may not
be growth restricted (IUGR). IUGR is associated with 6-10 times higher perinatal
morbidity and mortality compared to normal weight neonates.
Microscopic examination of the placenta in small for gestational age infants varies
from case to case. Some placentas will exhibit entirely normal histology while others
may show various histological abnormalities. Some of the common histological
features which can be found in SGA are hypovasculariy of terminal villi, abnormal
maternal spiral arterioles, increased fibrin deposition, villitis of unknown aetiology.
Further, there is no data whether there is any relationship of histological lesions with
placental morphological characteristics such as cord coiling, umbilical cord insertion
site and placental shape.
The aim of this chapter is to establish the incidence of predefined placental
pathological abnormalities in the common obstetric outcome pregnancy outcomes
groups of pre-eclampsia, pregnancy induced hypertension, gestational diabetes and
small for gestational age infants compared to non-affected pregnancies and the rest
of the unselected reference population. This chapter also aim to describe the
relationship between morphological parameters of the placenta, as previously defined
in chapter 4 and the common categories of histological lesions.

CHAPTER 7: HISTOLOGY AND ITS RELATIONSHIP WITH PLACENTAL MORPHOLOGY
Page | 109
7.2 METHODS
Details of the methods are described elsewhere (chapter 2). Briefly; analysis of this
chapter is based on all cases with available histology analysis report. The population
of the study was an unselected population irrespective of the risk status of the
pregnancy.
Histological findings of the placenta from the unselected population were compared
with the common obstetric outcome group. Common outcome groups considered
were pre-eclampsia (PET), pregnancy induced hypertension (PIH), gestational
diabetes (GDM) and small for gestational age (SGA).
Definitions of the common obstetric outcome groups of PET, PIH, GDM and SGA
are described in Chapter 2.
There were certain placentas where more than one histological lesion was present.
Each placental lesion has been counted separately. Similarly, in the clinical groups,
certain cases had more than one clinical obstetric outcome group and each group has
been counted separately.
Digital measurements (Cord centrality and eccentricity indices) were available on
888 placentas. Manual measurements (Coiling index) were performed on 1141 cases,
as in 18 cases either the umbilical cord was missing or was too short to measure.

CHAPTER 7: HISTOLOGY AND ITS RELATIONSHIP WITH PLACENTAL MORPHOLOGY
Page | 110
MAJOR PATHOLOGICAL GROUPS
Chorioamnionitis
a b
Figures 7.1 Microscopic view of chorioamnionitis (a) low power (original magnification x 40)
(b) high power (original magnification x 100) (study photograph).
Histologic chorioamnionitis is inflammatory changes (not infective process) in
placenta, umbilical cord, decidua, chorion and amnion. Chorioamnionitis is most of
the time is an acute process but cases of chronic chorioamnionitis has also been
described in literature, where placental membranes are infiltrated with chronic
inflammatory cells.119 In one large study of chronic chorioamnionitis, it was noted to
have lymphocytic inflammation of the fetal membranes. Villitis of unknown
aetiology was also noted in 70% of these cases examined, though the severity of
villitis did not seem to have any correlation with the severity of lymphocytic
infiltration of the membranes.120
Traditionally acute inflammation of chorion and amnion membranes and amniotic
fluid infection has been taken together.121-122 Studies done in 1980s have shown the
recovery of the organisms in acute inflammatory lesions of the placenta from
subchorionic plate123-124 and chorioamniotic space.121

CHAPTER 7: HISTOLOGY AND ITS RELATIONSHIP WITH PLACENTAL MORPHOLOGY
Page | 111
Clinical chorioamnionitis is suspected when there is presence of fever, uterine
tenderness, and foul smelling vaginal discharge, maternal and or fetal tachycardia,
leucocytosis, however none of these symptoms per se are not specific for
chorioamnionitis and therefore clinical diagnosis is unreliable for the diagnosis
histologically.
There is a poor correlation between clinical and histological chorioamnionitis.
However there are many important questions to consider before judging the
relationship between clinical and histologic chorioamnionitis; such as diagnostic
criteria for clinical chorioamnionitis in the given set up; bacterial culture of
placenta/amniotic fluid in support of diagnosis of chorioamnionitis; and if the
diagnoses of clinical chorioamnionitis have features suggestive of histologic
chorioamnionitis?
Most studies suggest that there is a poor correlation between clinical and histologic
chorioamnionitis. In cases with confirmed histological chorioamnionitis, there may
be no signs or symptoms suggestive of clinical chorioamnionitis at all.125
Studies have examined cases diagnosed with clinical chorioamnionitis to confirm the
diagnosis histologically as well and also examined the effect of chorioamnionitis on
neonates, neonatal sepsis at less than 7 days and found poor correlation between
clinical and histologic chorioamnionitis and neonatal sepsis.126 Another large study
involving 6,294 singleton deliveries, there was no histological evidence of
chorioamnionitis in 38% cases diagnosed clinically as chorioamnionitis (3%).
Neonatal sepsis was also found only in 36% of neonates without histologic evidence
of chorioamnionitis as compared to the 60% of neonates with confirmed histologic
chorioamnionitis.127
Studies have also reported positive placental bacterial culture in absence of histologic
chorioamnionitis128 while other studies could only isolate bacteria in 70% cases of
histologic chorioamnionitis.129

CHAPTER 7: HISTOLOGY AND ITS RELATIONSHIP WITH PLACENTAL MORPHOLOGY
Page | 112
Therefore histologic chorioamnionitis is considered more sensitive and specific and
is a gold standard for the diagnosis of chorioamnionitis as compared to the clinical
diagnosis.122 130 131
For this study, following have been grouped together as “Ascending genital tract
infection”.
-Neutrophils in the fetal membranes- Chorioamnionitis
-Neutrophils at the choriodecidual junction- Choriodecidual junction syndrome
-Inflammation of umbilical cord- Funisitis
-Neutrophils in subchorion fibrin
- Subacute or chronic chorioamnionitis
Chronic placental underperfusion
We defined as villous changes small, hypovascular chorionic villi with increased
syncytial knots, placental infarction >1cm (non-peripheral) and/or atherosis.
Presences of any or all of the features were classified in this category.
Intervillous Thrombus (IVT)
These are localised, nodular and circumscribed, old or recent thrombi within the
intervillous space. Some authors have described these lesions as intraplacental
haematomas as well114 but others view was to consider these as thrombi only as the
lesions are entirely within the part of vascular system, intervillous space.117 Incidence
of IVT varies from 3-50% in full term uncomplicated pregnancies.132, 133
Macroscopically, intervillous thrombus can look dark red or brown, greyish or
whitish depending upon the age of the lesion, usually round or oval lesion.

CHAPTER 7: HISTOLOGY AND ITS RELATIONSHIP WITH PLACENTAL MORPHOLOGY
Page | 113
Thrombus could be single or multiple thrombi anywhere within placenta, varying in
size, from few mms up to many centimetres. While histologically, erythrocytes can
be seen with fibrin strands in fresh thrombus representing mainly red blood cells, and
as the thrombus degenerate, depending on the size, it can displace the intervillous
space. Infarction of the surrounding villi can also be seen.
IVT can also be revealed on antenatal ultrasound as echo-poor placental “cavities”.134
Small thrombi are common and have no clinical significance on the placental function.
Presence of fetal cells in the intervillous space and therefore in the maternal circulation
is common especially in third trimester; it is estimated around 15-30% of women will
have some degree of slow leakage of fetal cells into the maternal circulation.135 It
becomes significant in cases with either extremely big or multiple intervillous thrombi
causing significant fetomaternal haemorrhage. Significant fetomaternal haemorrhage
will have its consequences such as fetal anaemia, hydrops, end organ damage and fetal
death.

CHAPTER 7: HISTOLOGY AND ITS RELATIONSHIP WITH PLACENTAL MORPHOLOGY
Page | 114
Villitis of unknown aetiology (VUE)
a b
Figures 7.2 Microscopic view of VUE (a) low power (original magnification x 40) (b) high power
(original magnification x 100) (study photographs).
Presence of morphologically increased chronic inflammatory mononuclear cells and
fibrinoid necrosis affecting groups of chorionic villi in absence of known clinical or
histological aetiological factor/organisms (such as TORCH group, enterovirus,
varicella, syphilis, syphilitic spirochetosis, and other bacterial and protozoal
infections) is called as villitis of unknown etiology.
Incidence of chronic Villitis varies in different studies; probably due to the different
population studied and/or different histological criteria in different units. Ethnic,
environmental and socio-economic factors play an important role in the incidence of
Villitis of unknown etiology. Incidence reported in United Kingdom is 13.6%136,
while it is 7% in United States137, 14.2% in New Zealand138 and 33.8% in
Argentina.139
VUE could be focal or diffuse or low grade (involving less than 10 villi) or high
grade (involvement of more than 10 villi). High and low grade classification is
clinically helpful as it correlates more specifically to the clinical complications e.g.

CHAPTER 7: HISTOLOGY AND ITS RELATIONSHIP WITH PLACENTAL MORPHOLOGY
Page | 115
High grade villitis is associated with adverse neurologic outcome.140
Macroscopically there may be no obvious features.
In cases of severe villitis, placenta is often pale in colour and also has an irregular
consolidation of the villous parenchyma.
Histologically features of VUE vary widely. There could be focal or multiple lesions.
Focal or low grade patterns are usually seen in clinically asymptomatic cases while
microscopic findings suggestive of severe villitis usually represents clinically
significant; e.g. IUGR, fetal demise and other clinical complications. Some
pathologists suggest that diagnosis of chronic villitis should not be made based on a
single focus of VUE involving less than 5 villi.141 Other histological features
associated with villitis of unknown aetiology can be fetal villous thrombosis,
haemorrhagic endovasculopathy, villous stromal sclerosis, Chorangiosis, decidual
plasma cells, chronic chorioamnionitis, perivillous fibrin deposition and occasional
presence of granulomatous focus with giant cells.
VUE may not have any clinical effects, but if severe, increase the risk of recurrent
reproductive failure142, IUGR, 138 143-144 perinatal asphyxia145 and adverse fetal
neurological outcomes.140

CHAPTER 7: HISTOLOGY AND ITS RELATIONSHIP WITH PLACENTAL MORPHOLOGY
Page | 116
Fetal thrombotic vasculopathy
Figure 7.3 Microscopic view of fetal thrombotic vasculopathy (original magnification x 40)
(study photograph).
Fetal thrombotic vasculopathy is a placental lesion due to the disturbances of fetal
blood flow where there is occlusion of the chorionic or major fetal villous stem
artery by a thrombus, which cuts the vascular supply of the area, causing avascular
villi and resulting into the macroscopically detectable lesions.
Macroscopic appearance depends upon the age of the lesion. New lesions will be
evident in the chorionic plate vessels. Vessels will be engorged; at times even the
thrombi can be seen in the large vessels of chorionic plate. Once organised, lesion
will be firm to palpate and later gets calcified and hard to touch. Lesions in placental
parenchyma are discrete firm and pale patchy regions.
It is very easy to confuse these lesions with infarction. These pale areas are easier to
identify on a fixed specimen as compared to a fresh placenta.

CHAPTER 7: HISTOLOGY AND ITS RELATIONSHIP WITH PLACENTAL MORPHOLOGY
Page | 117
Microscopically appearance will depend upon the age of the lesion; early lesion will
be represented by presence of thrombus in the chorionic vessels, reactive endothelial
swelling in parenchyma followed by endothelial disruption with erythrocyte
extravasations. Older lesion will be evident as intramural fibrin thrombus, fibroblast
growth, erythrocyte fragmentation and later calcification in chorionic vessels and
parenchyma.
Therefore fetal thrombotic vasculopathy is a thrombotic lesion in the fetal
circulation; associated with hypercoagulable states and if extensive, can lead to high
perinatal morbidity such as perinatal liver disease146-147, Neonatal thrombosis and
neonatal neurological abnormalities leading to neonatal stroke, seizures, chronic
neurodevelopment deficits148-150, IUGR, oligohydramnios, perinatal asphyxia,
hydrops fetalis as well as neonatal mortality.
In this study diagnosis of this histopathological condition is made with the presence
of –Downstream changes and no thrombus
Thrombus but no downstream effects
Abnormal vessel architecture with fibrin, recanalisation with multiple channels.

CHAPTER 7: HISTOLOGY AND ITS RELATIONSHIP WITH PLACENTAL MORPHOLOGY
Page | 118
Massive Perivillous Fibrin Deposition
Figure 7.4 Microscopic view of massive perivillous fibrin deposition (original magnification x
40) (study photograph).
Massive perivillous fibrin deposition is an important clinical entity, which is poorly
understood but has clinically significant impact on the current pregnancy as well as
effects onto the future pregnancy, particularly with its recurrence tendency.
Massive perivillous fibrin deposition (MPFD) is significant deposition of fibrin
material in the villous parenchyma, which is present as macroscopically extensive
lesion, extending from basal to chorionic plate with trophoblast proliferation or
involving more than 30% of the villous parenchyma.117 Some degree of fibrin in the
intervillous space is seen normally in nearly all term placentas as a result of turbulent
intervillous blood flow.117 This will not have any clinical significance and therefore
are not pathological lesions. Authors have described it as significant if; its
macroscopically large lesion and obviously extensive, extending from basal to
chorionic plate with trophoblast proliferation or involving more than 30% of the
villous parenchyma.117 Others have defined it as MPFD only if the full thickness of
the placenta is involved with the fibrin deposition with at least 50% villi involved as
seen at least on one slide.151Another study has defined massive perivillous fibrin
deposition in their own way that they considered significant perivillous fibrin only

CHAPTER 7: HISTOLOGY AND ITS RELATIONSHIP WITH PLACENTAL MORPHOLOGY
Page | 119
where at least 20-30% of villi in the central basal part of placental parenchyma were
entrapped in fibrin.143
It is believed that fibrin deposition entrapping up to the 30% of the villi will have no
detrimental effects onto the overall function of the placenta i.e. fetus growth and its
oxygenation, therefore anything affecting over 30% of villi, theoretically should be
called massive or extensive, which will have clinical effects and that is the amount
Pathologists and Obstetricians should take as significant and should be called as
“massive” fibrin deposition.
In current study, we defined MPFD as perivillous fibrin extending from basal to
chorionic plate with trophoblast proliferation. Placental pictures of these cases were
then analysed macroscopically to ensure that at least 30% of total volume was
involved in order to make the diagnosis.
On gross examination massive perivillous fibrin deposition are visible as irregular
strands and areas of pale, greyish/yellowish coloured indurations on cut sections and
clearly demarcated by the surrounding normal placental tissue. Mostly fibrin
deposition is seen in the peripheral areas of the placenta. However fibrin deposition
can be centrally located in the placenta. If the fibrin is mainly involving the maternal
floor as in maternal floor infarct, basal plate is thick, pale and fibrin deposition will
be localised to basal plate.
On histology, villi are entrapped within the fibrin material with eosinophilic
infiltration and obliterate the intervillous space. Depending upon the severity and the
duration of the fibrin deposition, syncytiotrophoblast and capillary endothelium of
the affected villi undergo necrosis and completely disappear. Trophoblastic basement
membrane is thickened. With progressive lesion, fibrosis of the stroma is seen and
ultimately obliteration of the villous vessel is seen. In the process
syncytiotrophoblast disappears but cytotrophoblastic cells proliferates and grow into
the surrounding fibrin and such cells sometimes detach from the parent villus and
appear as isolated cell mass in the fibrin.
Clinical implications of massive MPFD has been observed in cases of miscarriages152,
recurrent miscarriages153, pre term labour, IUGR151 154-156, IUFD.154-156

CHAPTER 7: HISTOLOGY AND ITS RELATIONSHIP WITH PLACENTAL MORPHOLOGY
Page | 120
Chorangiosis
Figure 7.5 Microscopic view of Chorangiosis (original magnification x 100) (study photograph).
Defined as a vascular lesion where there is vascular hyperplasia of the chorionic villi ,
defined as the occurrence of 10 or more villi with 10 or more capillaries in 10 or
lower power microscopic fields.
Chorangioma
Figure 7.6 Microscopic view of chorangioma (original magnification x 40) (study photograph).
Chorangioma is defined as well circumscribed, nodular lesion composed of vascular
channels, stromal cells and surrounded by trophoblasts.

CHAPTER 7: HISTOLOGY AND ITS RELATIONSHIP WITH PLACENTAL MORPHOLOGY
Page | 121
Features of maternal pre-eclampsia
Included cases with fully developed atherosis only.
Chronic histiocytic intervillousitis
Figure 7.7 Microscopic view of chronic histiocytic intervillousitis (original magnification x 100)
(study photograph).
Marked mononuclear inflammatory cell infiltrate with associated fibrin deposition in
the intervillous space without associated villitis or chorioamnionitis.117
Features of acute abruption
Figure 7.8 Microscopic view of retroplacental haemorrhage (original magnification x 40) (study
photograph).

CHAPTER 7: HISTOLOGY AND ITS RELATIONSHIP WITH PLACENTAL MORPHOLOGY
Page | 122
Features of acute abruption include the presence of significant retroplacental
haematoma or haemorrhage or clot with signs of compression of the basal plate and
congestion.
Table 7.1 summarises the diagnostic criteria for all predefined histological categories
in the study.
Table 7.1 summary of the diagnostic criteria for predefined histological categories.
Diagnosis Diagnostic criteria
Ascending genital tract
infection
Any combination of: neutrophils in the fetal membranes, accumulating at the
choriodecidual junction or umbilical cord.
Chronic placental
underperfusion
Small, hypovascular chorionic villi with increased syncytial knots, placental
infarction >1cm (non-peripheral) and/or atherosis.
Intervillous Thrombus Localised, nodular and circumscribed old or recent thrombi within the
intervillous space.
Villitis of unknown
aetiology
Morphologically increased chronic inflammatory cells affecting groups of
chorionic villi in the absence of known clinical or histological aetiological
factor/organisms (such as TORCH group, enterovirus, varicella, syphilis,
syphilitic spirochetosis, and other bacterial and protozoal infections)
Fetal thrombotic
vasculopathy
Lesions of the placenta due to occlusion of the chorionic or major fetal villous
stem artery by a thrombus, causing avascular distal villi
Chorangiosis 10 or more villi with 10 or more capillaries / villous cross section in 10 or lower
power microscopic fields.
Maternal Pre-eclampsia Included cases with fully developed atherosis only
Massive perivillous
fibrin deposition
Significant deposition of perivillous fibrin involving more than 50% of the
villous parenchyma
Chorangioma A well circumscribed, nodular lesion composed of vascular channels, stromal
cells and surrounded by trophoblasts.
Chronic histiocytic
intervillositis
Marked mononuclear histiocytic inflammatory cell infiltrate with associated
fibrin deposition in the intervillous space without associated villitis or
chorioamnionitis
Acute abruption The presence of significant retroplacental haematoma or haemorrhage or clot
with features of compression of the overlying parenchyma.

CHAPTER 7: HISTOLOGY AND ITS RELATIONSHIP WITH PLACENTAL MORPHOLOGY
Page | 123
7.3 STATISTICAL ANALYSIS
Prevalence of the predefined histological abnormalities was noted in the unselected
population. Comparison of incidence of common histological groups was performed
between the groups non-affected and affected with PET, PIH, GDM and SGA, using
chi square test. A p value of ≤ 0.05 was considered significant.
Normality of distribution was checked for cord coiling index, centrality index and
eccentricity index for the reference population, ascending genital tract infection,
chronic placental underperfusion, intervillous thrombus and villitis of unknown
aetiology groups, by analysing the spread of the distribution in each frequency
histogram. As the variables coiling index, cord centrality index and eccentricity
showed an approximate normal distribution, a parametric test (T-test) was performed
to compare the means of affected with non-affected cases. A p value of <0.05 was
considered significant.

CHAPTER 7: HISTOLOGY AND ITS RELATIONSHIP WITH PLACENTAL MORPHOLOGY
Page | 124
7.4 RESULTS
Table 7.2 describes the baseline maternal demographics of the study population
including the common obstetric outcome groups in the population.
N 1159
Maternal Age ± SD 30.9 ± 5.73
% Nulliparity (n) 47.6 (552)
% Smokers (n) 9.3 (108)
% Caucasians (n) 90.7 (1051)
% PET (n) 2.5 (29)
% PIH (n) 2.6 (30)
% Essential Hypertension (n) 0.4 (5)
% GDM (n) 4 (46)
% IDDM (n) 0.3 (3)
% SGA <10 Centile (n) 9.4 (109)
Mean gestation age at delivery ± SD 39.5 ± 1.49
% Female (n) 46.7 (541)
% Male (n) 53.3 (618)
Table 7.2 Demographics of the reference population.
The placenta and umbilical cord morphology in unselected population is described in
chapter 4. Briefly; table 7.3 describes the statistics of the major macroscopic indices
analysed in the study. Manual measurements were available for 1141 cases and
digital for 888 cases.
N Mean (range) ± SD
Coiling Index 1141 0.20 (0-1) ± 0.10
Cord Centrality Index 888 0.36 (0.02-1.01) ± 0.21
Eccentricity 888 0.49 (0-0.91) ± 0.18
Table 7.3 Major morphological indices in the reference population.
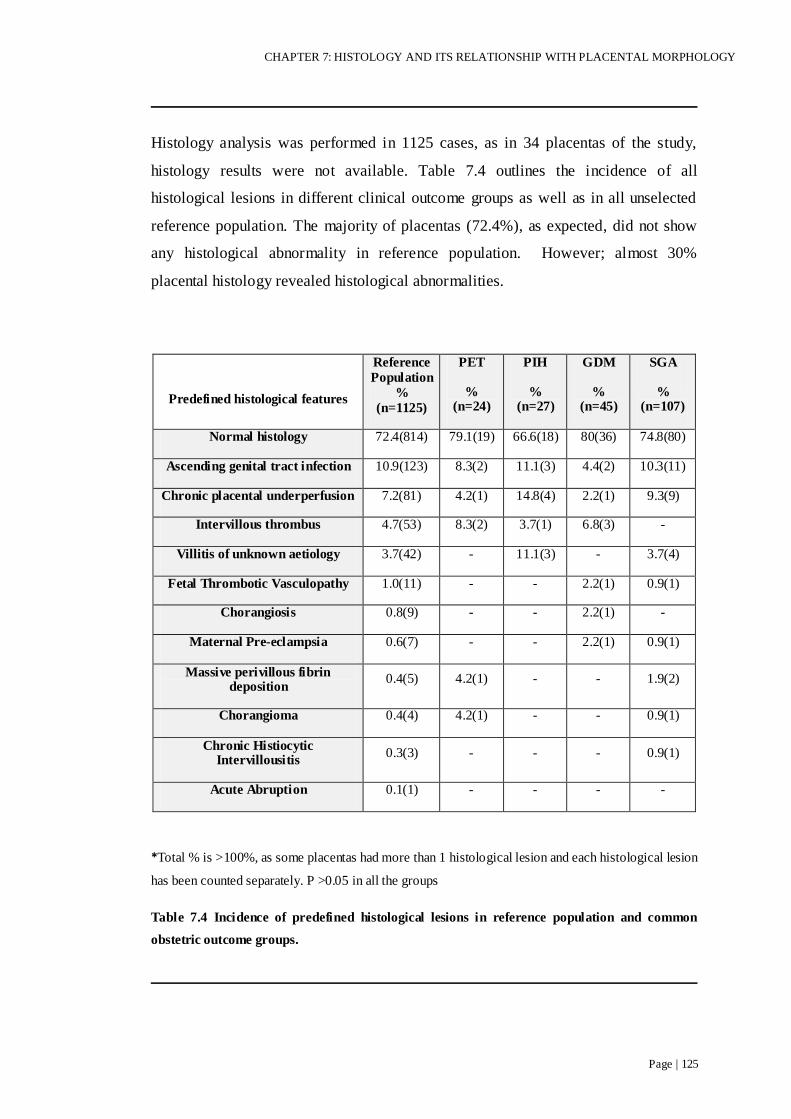
CHAPTER 7: HISTOLOGY AND ITS RELATIONSHIP WITH PLACENTAL MORPHOLOGY
Page | 125
Histology analysis was performed in 1125 cases, as in 34 placentas of the study,
histology results were not available. Table 7.4 outlines the incidence of all
histological lesions in different clinical outcome groups as well as in all unselected
reference population. The majority of placentas (72.4%), as expected, did not show
any histological abnormality in reference population. However; almost 30%
placental histology revealed histological abnormalities.
Predefined histological features
Reference
Population
%
(n=1125)
PET
% (n=24)
PIH
% (n=27)
GDM
% (n=45)
SGA
% (n=107)
Normal histology 72.4(814) 79.1(19) 66.6(18) 80(36) 74.8(80)
Ascending genital tract infection 10.9(123) 8.3(2) 11.1(3) 4.4(2) 10.3(11)
Chronic placental underperfusion 7.2(81) 4.2(1) 14.8(4) 2.2(1) 9.3(9)
Intervillous thrombus 4.7(53) 8.3(2) 3.7(1) 6.8(3) -
Villitis of unknown aetiology 3.7(42) - 11.1(3) - 3.7(4)
Fetal Thrombotic Vasculopathy 1.0(11) - - 2.2(1) 0.9(1)
Chorangiosis 0.8(9) - - 2.2(1) -
Maternal Pre-eclampsia 0.6(7) - - 2.2(1) 0.9(1)
Massive perivillous fibrin deposition
0.4(5) 4.2(1) - - 1.9(2)
Chorangioma 0.4(4) 4.2(1) - - 0.9(1)
Chronic Histiocytic Intervillousitis
0.3(3) - - - 0.9(1)
Acute Abruption 0.1(1) - - - -
*Total % is >100%, as some placentas had more than 1 histological lesion and each histological lesion
has been counted separately. P >0.05 in all the groups
Table 7.4 Incidence of predefined histological lesions in reference population and common
obstetric outcome groups.
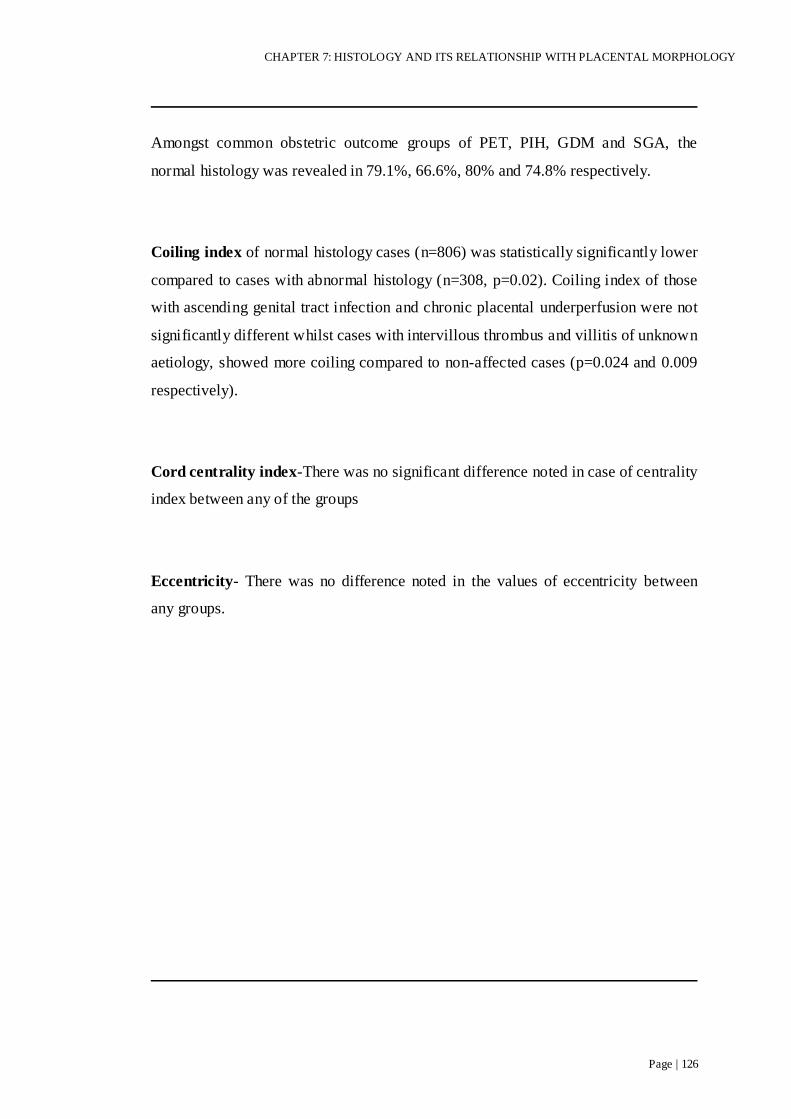
CHAPTER 7: HISTOLOGY AND ITS RELATIONSHIP WITH PLACENTAL MORPHOLOGY
Page | 126
Amongst common obstetric outcome groups of PET, PIH, GDM and SGA, the
normal histology was revealed in 79.1%, 66.6%, 80% and 74.8% respectively.
Coiling index of normal histology cases (n=806) was statistically significantly lower
compared to cases with abnormal histology (n=308, p=0.02). Coiling index of those
with ascending genital tract infection and chronic placental underperfusion were not
significantly different whilst cases with intervillous thrombus and villitis of unknown
aetiology, showed more coiling compared to non-affected cases (p=0.024 and 0.009
respectively).
Cord centrality index-There was no significant difference noted in case of centrality
index between any of the groups
Eccentricity- There was no difference noted in the values of eccentricity between
any groups.

CHAPTER 7: HISTOLOGY AND ITS RELATIONSHIP WITH PLACENTAL MORPHOLOGY
Page | 127
Table 7.5 describes the comparative morphological indices in the reference
population and in the most common histological lesions of the study versus non-
affected cases in each category.
Coiling
Index (SD)
p value
(comparison
with non-affected cases)
Centrality Index (SD)
p value
(comparison
with non-affected cases)
Eccentricity
(SD)
p value
(comparison
with non-affected cases)
Reference population
0.20±0.10
(n=1141) NA
0.36±0.21
(n=888) NA
0.49±0.18
(n=888) NA
Normal histology
0.20±0.10
(n=806) NA
0.36±0.21
(n=615) NA
0.48±0.18
(n=615) NA
Ascending genital
tract infection
0.20±0.09
(n=122) NS
0.37±0.23
(n=98) NS
0.52±0.17
(n=98) 0.07
Chronic placental underperfusion
0.21±0.11
(n=80)
NS 0.32±0.21
(n=68)
NS 0.48±0.19
(n=68))
NS
IVT
0.23±0.10
(n=53)
0.02 0.34±0.20
(n=33)
NS 0.54± 0.16
(n=33)
0.08
VUE
0.24±0.10
(n=39) 0.009
0.35±0.23
(n=33) NS
0.47±0.15
(n=33) NS
Table 7.5 Comparative analysis of the morphological indices of the placenta in reference
population and abnormal histology groups.
NA-Not applicable NS-Non significant.

CHAPTER 7: HISTOLOGY AND ITS RELATIONSHIP WITH PLACENTAL MORPHOLOGY
Page | 128
7.5 DISCUSSION
This chapter has described the pattern of histology in common obstetric outcome
groups and unselected population. Strict criteria were followed for the diagnosis of
histological abnormalities. Incidence of various histological pathologies varies
widely in literature; one of the reasons being lack of standard definitions for these
lesions and every researcher has defined the lesions with their definitions and
therefore literature lacks uniformity on the subject.
There have always been a debate whether the detailed examination of every placenta
by the pathologists should be a routine component of obstetric-neonatal care; group
in favour of this option believe that this helps identifying placental pathology
especially in cases of adverse perinatal outcome, which further helps in the
management of the pregnancy and more so for the future pregnancy 18, however, the
histological examination and perinatal outcome in most pregnancies is normal, for
example in the current study, the frequency of histologically normal examination was
observed in over 70% of cases. Therefore this decision should be left on to the
individual unit to decide their own protocol of routine examination of each placenta
by the pathologists, based on their manpower and financial resources.
For the diagnosis of chorioamnionitis, clinical picture is not a reliable tool and it has
been proven by many studies that histological diagnosis of chorioamnionitis is a gold
standard. In the current study interestingly there were no cases of clinically
diagnosed chorioamnionitis or any other antenatal sepsis and yet there were
significant number (123-10.9%) of cases of ascending genital tract infection. That
further enforces that there is very poor correlation between clinical and histological
infection. However, the limitation of this study is that the information for clinical
suspension of chorioamnionitis was collected only from the protos database of the
department, not a note trawl. We don‟t have separate data on clinical markers such as
WCC, CRP, prolonged rupture of membranes, use of antibiotics in labour.

CHAPTER 7: HISTOLOGY AND ITS RELATIONSHIP WITH PLACENTAL MORPHOLOGY
Page | 129
Incidence of Inter villous thrombus in this study was 4.7% in unselected pregnancies,
while literature has reported incidence varying from 3-50% in full term
uncomplicated pregnancies.132-133 This wide variation in the incidence may well
again be due to the lack of standard definition and protocols as well as the population
studied.
Villitis of unknown etiology is another major histopathological entity with high
degree of inter-observer variation.157 As there is no standard criteria for its diagnosis,
which makes it even more difficult to understand. It is important to understand VUE
in a better way, as it has been associated with IUGR and with its tendency of
recurrence in the following pregnancy and that too with increasing severity.
Incidence of VUE in this study was much lower (3.7%), this is even lower than the
incidence noted in one of the historic study with British population (13.6%)136
The incidence of fetal thrombotic vasculopathy in the current study was only 1% of
all the histology cases, which was significantly lower than reported in other series.150
158
Incidence of massive perivillous fibrin deposition is relatively low, quoted as low as
0.028%155 to 0.09%.154 Incidence of MPFD was very low to draw any meaningful
conclusion. However it is important to understand as it has important clinical effects
and also has a recurrence rate of 10-50% in subsequent pregnancies.151 155
It has not been clear if the histological lesions present in the placentas from obstetric
outcome groups are any different from the rest of the unselected population. Many
histological lesions are documented in pregnancies with these obstetric outcome
groups but most, if not all of them, are not specific to any of the outcome group of
the pregnancy.
This chapter aimed to identify if the frequency and type of predefined histological
lesions observed in placentas from the common obstetric outcome group are any
different from unselected reference population.

CHAPTER 7: HISTOLOGY AND ITS RELATIONSHIP WITH PLACENTAL MORPHOLOGY
Page | 130
Pre-eclampsia/Pregnancy induced hypertension
The macroscopic and histological changes in the placenta from cases with PET and
PIH may be characteristic but may not be there even in severely affected cases.
Frequency of ascending genital tract infection features in PIH, were similar to that
found in a recent study159, however the frequency of IVT (3.7% versus 18.9%) and
Chorangiosis (0% versus 10.9%) was much less than observed in the similar study. A
slightly higher proportion of IVT cases were observed in pre-eclampsia (8.3%).
Features suggestive of chronic placental underperfusion were also important feature
noted in cases of both pre-eclampsia (4.2%) as well as PIH (14.8%).
Villitis of unknown aetiology is one of the most common histological lesions
identified in term placentas and is associated with adverse perinatal outcome
especially with IUGR143-144. The incidence of VUE has been reported in up to 17% in
term cases of pre-eclampsia160, though we did not observe any cases of VUE in pre-
eclampsia subset, however VUE was noted in 11.1% cases of pregnancy induced
hypertension. Whether it has anything to do with the pathophysiology in PIH or not,
probably needs further exploration. This difference could either be due to the high
degree of inter-observer variation or due to the population studied. Most studies have
been based on the adverse outcome of the pregnancy.
Retroplacental haematoma can be seen in up to 12-15% cases of pre-eclampsia but
we did not notice any case in our series. Pre-eclampsia is a hypercoagulable state,
where there is intravascular coagulation and micro thrombosis affecting multiple
organs. Utero-placental impairment occurs in cases of pre-eclampsia. There is
increased antifibrinolytic activity in hypertensive disorders of pregnancy. Total effect
of increased hypercoagulation and antifibrinolytic activity is believed to contribute
toward the increased deposition of fibrin. Therefore one might expect to see
significant perivillous fibrin deposition with all the cases of severe pre-eclampsia but
that doesn‟t seems to be the case. Only a few studies have shown this association161
while most authors did not find this finding any different from normal population.

CHAPTER 7: HISTOLOGY AND ITS RELATIONSHIP WITH PLACENTAL MORPHOLOGY
Page | 131
In the current series, only one case of MPFD (4.2%) was found in PET but none in
PIH. There were no cases of fetal thrombotic vasculopathy in either pre-eclampsia or
PIH, although some studies have documented its incidence in term pre-eclampsia as
5%.160
Gestational Diabetes Mellitus
It is thought that the histological features in gestational diabetes are similar to those
of pre existing diabetes, however less pronounced and reduced in frequency in cases
of GDM as compared to that of overt diabetes.162 163 The pathological findings of the
placenta do not predict the severity of the disease, neither relate to the duration of the
disease especially with pre existing diabetes.163 Placentas from diabetic pregnancies
show increased incidence of vascular pathological changes. Chorangiosis is an
example of such findings, reported to be 40% in GDM. 164 This study examined the
histological lesions specifically in placentas from known diabetic group while our
study has quoted the incidence in an unselected population. The incidence of fetal
thrombotic vasculopathy was noted in GDM subset as 2.2%, again indicating the
hypercoagulable state in diabetes.
Small for Gestational Age
Histological lesions found in SGA were features of ascending genital tract infection
(10.3%), chronic placental underperfusion (9.3%), VUE (3.7%), features of maternal
pre-eclampsia (0.9%), MPFD (1.9%), Chorangioma (0.9%), fetal thrombotic
vasculopathy (0.9%) and chronic histiocytic intervillousitis (0.9%). These are the
expected histological features secondary to the maternal vascular compromise
leading to placental ischemia, which one would expect in cases of IUGR. A recent
study found the most common histological lesions in IUGR (birth weight<10 th
percentile clinically) was Chorangiosis (39%)160, however this study did not show
any case of Chorangiosis in SGA group.

CHAPTER 7: HISTOLOGY AND ITS RELATIONSHIP WITH PLACENTAL MORPHOLOGY
Page | 132
Comparing the histological lesions in the above obstetric outcome groups to that of
the unselected reference group, results were as follows-
Most placentas, as expected, showed normal histology in PET (79.1%), PIH (66.6%),
GDM (80%) and SGA (74.8 %). These results were not different from the non-
affected cases and unselected reference population (72.4%). There was no difference
in the frequency of ascending genital tract infection in the common obstetric
outcome groups as compared to the unselected population.
In the current study there were no IVT observed in SGA, while in cases with PET,
PIH and GDM, difference was not significant.
Reports on the frequency of villitis of unknown aetiology in cases of pre-eclampsia
and other hypertensive disorders of pregnancy compared to the normotensive
pregnancies have been mixed; some studies found the incidence higher 165-166, while
others did not find any difference.167 Frequency of VUE was higher (11.1%) in cases
with PIH but interestingly there were no cases observed in PET.
Small for gestational age group placentas also showed similar frequency of VUE (3.7
%) to that of unselected reference population (3.7%).
The other abnormal histology cases were observed in very small number to perform
any meaningful comparison to the reference population
In summary most cases of placentas from unselected population and even common
obstetric outcome groups are histologically normal. There was no significant
difference in the frequency of the predefined histological lesions in obstetric outcome
groups as compared to that of the reference population. In the common obstetric
outcome groups, histological examination may be normal even in the presence of a
severe disease.

CHAPTER 7: HISTOLOGY AND ITS RELATIONSHIP WITH PLACENTAL MORPHOLOGY
Page | 133
Further, this chapter also reports a statistically significant, but small, difference in the
cord coiling index in cases with normal compared to abnormal histology (p=0.02), in
particular, cases with IVT and VUE show relative hypercoiling. The clinical
significance of this finding remains uncertain and it is difficult to postulate a
plausible mechanism whereby both of these unrelated histological features are
related to cord coiling.
There was no difference in cord centrality index and eccentricity between the
common histological groups. We therefore propose that cord centrality and placental
shape have no significant effect on these histological lesions.
Certain common histological lesions are possibly associated with increased umbilical
cord coiling but placental macroscopic features such as shape, and cord insertion
have no association with histological abnormalities.
Macroscopic abnormalities of placental shape and cord insertion cannot predict the
presence or absence of histological features and are of limited clinical significance.
Most histological abnormalities are either studied in uncomplicated pregnancies or in
complicated pregnancies but in best of my knowledge, no one has presented the
baseline histologic profile in unselected reference population. This reference range of
histological conditions can be used as a baseline for future studies based on the same
principals.

CHAPTER 8 : MORPHOLOGY AND HISTOLOGY OF THE
PLACENTA IN INFANTS ADMITTED TO THE NEONATAL
UNIT COMPARED TO UNSELECTED PREGNANCIES.
Summary Points:
This study described the placental morphological indices and incidence of
predefined histological lesions in cases where infants were admitted to the
Neonatal Unit.
Morphological indices were not different in the placentas from infants
admitted to the Neonatal Unit.
Histological features of ascending genital tract infection were more frequent
in the placentas from infants admitted to the Neonatal Unit.
There was no difference in the incidence of all other predefined histological
lesions of the placenta in infants admitted to the Neonatal Unit.
This chapter is based on:
Pathak S, Sebire NJ, Jessop F, Hackett G, Murdoch E, Hook E, Lees C. Macroscopic and
Histological Features of Placentas at 34-43 weeks‟ Gestation and their association
with infant admission to the Neonatal Unit- submitted as short communication,
BJOG. April 2011.
Pathak S, Sebire NJ, Jessop F, Hackett G, Murdoch E, Hook E, Lees C. Placental
morphological and histological features: relevance to fetal distress. Paper in
preparation.

CHAPTER 8: PLACENTA IN INFANTS ADMITTED TO THE NEONATAL UNIT
Page | 135
8.1 INTRODUCTON
Examination of the placenta may be useful investigation to the clinician to determine
the underlying mechanism which has possibly resulted in perinatal morbidity and
even mortality. If any placental or umbilical cord lesion is found, it could guide the
clinicians for the future pregnancy in terms of further investigations required, pre-
pregnancy counselling and care for the future pregnancy.168-169
Despite growing interest in the morphology and histology of placentas, no large
studies exist, which have specifically investigated placental features in infants
particularly those admitted to the Neonatal Unit. Therefore it is not clear if the
placenta from infants who were admitted to the Neonatal Unit is any different from
that of the reference population.
Guidelines suggest that placentas from pre tem deliveries and adverse perinatal
outcome should be sent for the detailed histological examination.16-17 However, it is
not clear whether these placental examinations can predict specific neonatal
complications, or provides information useful for the management of the admitted
neonates.
This chapter aimed to define the macroscopic indices and frequency of histological
lesions in the admitted cohort and compare those to that of the non admitted group.
Therefore we aimed to address the question as to whether it is important to perform
detailed macroscopic examination and histology of the placentas for all neonates
admitted to the Neonatal intensive care unit.

CHAPTER 8: PLACENTA IN INFANTS ADMITTED TO THE NEONATAL UNIT
Page | 136
8.2 METHODS
For this study, cohorts of neonates admitted in the Neonatal Unit from the
prospectively recruited cohort of 1159 women (chapter 2) have been studied.
Neonates were admitted either directly from delivery unit or from the post natal
wards, while the women were still admitted in the unit after delivery. 71 neonates
were admitted to the Neonatal Unit in Rosie Hospital, Cambridge during the study
period 2007-2008.
Placentas from those neonates admitted to the Neonatal Unit (includes
NICU+SCBU) is referred to as “admitted cohort”, while the remainder of the
population is referred to as “non admitted cohort”. The reference or unselected
population included both admitted as well as non admitted groups.
Manual Measurements
Recorded variables from umbilical cord examinations included Umbilical cord
length, number of coiling, direction of coiling, number of vessels and the insertion of
umbilical cord onto the chorionic plate.
Manual measurements and the indices derived from them were placental weight,
length of axes of placenta, cord coiling index, placental circumference.
Manual measurements were available in 68 cases of infants admitted to the Neonatal
Unit.
Digital measurements
Digital analysis of the placenta is described in chapter 2. Measurements and indices
derived digitally were length of axes of placenta, distance of cord insertion from the
centre, cord centrality index, eccentricity, and placental circumference.

CHAPTER 8: PLACENTA IN INFANTS ADMITTED TO THE NEONATAL UNIT
Page | 137
Digital measurements were available in 51 cases of neonates admitted to the
Neonatal Unit.
Main macroscopic indices studied in admitted cohort and compared to that of
reference population are coiling index, cord centrality index and eccentricity.
Derivation of these indices is described in chapter 2.
Histology of the placenta
Predefined histological lesions were examined; the criteria and definitions of these
histological lesions are detailed in chapter 7. Briefly; the histological categories
were, no significant histological abnormality, features of ascending genital tract
infection, features of chronic placental underperfusion, intervillous thrombus, villitis
of unknown aetiology, fetal thrombotic vasculopathy, Chorangiosis, features of
maternal pre-eclampsia, massive perivillous fibrin deposition, chorangioma, chronic
histiocytic intervillousitis, and features of acute abruption.
Out of 71 placentas from infants admitted to the Neonatal Unit, 4 histological
examinations findings were not available, therefore histology for 67 placentas were
analysed and compared to the 1058 placentas from non admitted cohort. The
frequency of each lesion was individually assessed in the admitted cohort and
compared to the same lesion present in non admitted group.

CHAPTER 8: PLACENTA IN INFANTS ADMITTED TO THE NEONATAL UNIT
Page | 138
8.3 STATISTICAL ANALYSIS
Descriptive statistics of manual and digital measurements of the umbilical cord and
placenta was performed. Frequency histograms were plotted for coiling index, cord
centrality index and eccentricity, showing normal distribution. Normality was also
confirmed with Q-Q plots to see the difference between observed and expected
values of each variable.
Though the macroscopic variables showed normal distribution, still due to the
smaller sample size, we used a non parametric test; the Mann Whitney U test to
compare the difference of means (medians) of coiling index, centrality index and
eccentricity to that of rest of the non admitted population. A p value of ≤ 0.05 was
considered significant.
Histological lesions were defined in cases, where infants were admitted to the
Neonatal Unit and the frequency of each histological lesion was compared to that of
the non admitted cohort.

CHAPTER 8: PLACENTA IN INFANTS ADMITTED TO THE NEONATAL UNIT
Page | 139
8.4 RESULTS
Table 8.1 describes maternal and fetal characteristics for those babies admitted to the
Neonatal Unit. The obstetric outcome groups considered were pre-eclampsia,
pregnancy induced hypertension, gestational diabetes and small for gestational age.
Mean (range) ± SD
or % (n)
Neonates admitted to Neonatal Unit (n=71)
Non admitted
(n=1088)
Maternal age 31 ± 5.64 30.8 ± 5.74
% Caucasian (n) 91.4 (64) 90.7 (987)
% nulliparity (n) 54.9 (39) 47.2 (513)
% Smokers >5 cigarettes per day (n) 12.7 (9) 9.1 (99)
% Pre-eclampsia (n) 8.5 (6) 2.1 (23)
% Pregnancy induced hypertension (n) 1.4 (1) 2.7 (29)
% GDM (n) 5.6 (4) 3.9 (42)
% SGA (n) 19.7 (14) 8.7 (95)
% Induced onset of labour (n) 26.8 (19) 19 (207)
% Emergency Caesarean Section (n) 21.1 (15) 10.9 (119)
Mean gestation at delivery (Weeks) 38.3 ± 2.78 39.5 ± 1.33
Birth weight 3192 ± 812 3498 ± 479
% Males (n) 47.9 (34) 53.7 (584)
% Females (n) 52.1 (37) 46.3 (504)
% Neonates requiring immediate resuscitation (n)
31 (22) 1.5 (16)
Table 8.1 Demographic population of infants admitted to the Neonatal Unit.

CHAPTER 8: PLACENTA IN INFANTS ADMITTED TO THE NEONATAL UNIT
Page | 140
22 neonates (31%) required resuscitation immediately after they were born. 4 (5.6%)
of the neonates were resuscitated with facial oxygen and stimulus only, while 13
(18.3%) required face mask ventilation, 4 neonates (5.6%) were intubated and 1
needed cardiac massage. Table 9.2 describes the measurements of placenta and
umbilical cord taken manually and digitally and the indices derived from these.
Manual (n=68) Mean ±
SD Digital (n=51) Mean ± SD
Cord length 40.40 ± 14.19
Cord coils 8.09 ± .59 Distance of cord
insertion from centre 3.24 ± 1.87
Coiling index 0.20 ± 0.09 Cord centrality index 0.35 ± 0.21
Placenta weight 478 ± 116 Eccentricity 0.50 ± 0.16
Long axis 20.37 ± 2.70 Long axis 18.91 ± 2.46
Short axis 17.22 ± 2.63 Short axis 15.88 ±1.74
Circumference 59.01 ± 7.38 Circumference 54.61 ± 5.84
Table 8.2 Manual and digital measurements of placenta and cord and in infants admitted to the
Neonatal Unit.
Table 8.3 describes qualitatively different types of umbilical cord insertion onto the
chorionic plate. Frequency of each type of insertion was compared to that of the non
admitted neonatal and unselected population. Of the clinical importance: marginal
and velamentous cord insertion were not any different in admitted cohort compared
to that of non admitted cohort (Marginal-7 versus 6.3%, velamentous-1 versus 0.6%).

CHAPTER 8: PLACENTA IN INFANTS ADMITTED TO THE NEONATAL UNIT
Page | 141
Admitted group%
(n=71) Non admitted%
(n=1088) Ref Population%
(n=1159)
Central 23.9 22.6 22.7
Paracentral 56.3 61 60.4
Marginal 9.9 6.3 7.0
Velamentous 1.4 0.6 0.6
Missing 8.5 9.4 9.3
Table 8.3 Qualitatively described cord insertions in infants admitted, non admitted to the
Neonatal Unit and reference population.
Table 8.4 compares the macroscopic indices in the Neonatal Unit admitted cohort
versus non admitted group.
Admitted to
Neonatal Unit n Mean ± SD p value
Coiling Index
Yes 68 0.20 ± .09
NS No 1073 0.20 ± .10
Cord Centrality Index
Yes 51 0.35 ± .21
NS No 837 0.36 ± .21
Eccentricity
Yes 51 0.50 ± .16
NS No 837 0.49 ± .18
*NS-Non Significant
Table 8.4 Morphological indices in the infants admitted versus not admitted to the Neonatal
Unit.

CHAPTER 8: PLACENTA IN INFANTS ADMITTED TO THE NEONATAL UNIT
Page | 142
78.9% of cords showed left coiling, similar to the reference population (77.9%).
Cord coiling index ranged from a minimum value of 0.00 to a maximum of 0.50 with
a mean value of 0.20 ± 0.09. Frequency histograms and Q-Q plot revealed an
approximate normal distribution for coiling index. Figure 8.1 shows the frequency
histogram of coiling index in admitted cohort. A Mann-Whitney U test revealed no
significant difference in the coiling index for admitted (n=68, mean=0.20,
median=0.18) versus non admitted group (n=1073, mean=0.20, median=0.19) with 2
tailed p value of 0.82.
The Cord centrality index ranged from 0.05 to 0.9 with the mean of 0.35 ± 0.21.
Frequency histograms and Q-Q plot of cord centrality index indicated an
approximate normal distribution. Figure 8.1 shows the frequency histograms of cord
centrality index in the admitted group. A Mann-Whitney U test revealed no
significant difference in the cord centrality index for admitted cohort (n= 51,
mean=0.35, median=0.31) versus non admitted cohort (n=837, mean=0.36,
median=0.32) with 2 tailed p value of 0.67.
The placental eccentricity index ranged from 0.00 (circular shape) to 0.79 (Highly
elliptical shape) with a mean value of 0.50 ± 0.16. The frequency histograms and Q-
Q plot indicated a normal distribution. Figure 8.1 shows the frequency histograms of
eccentricity in admitted group. A Mann-Whitney U test revealed no significant
difference in the eccentricity of admitted cohort (n=51, mean=0.50, median=0.51)
versus non admitted group (n=837, mean=0.49, median=0.51) with p value of 0.61.

CHAPTER 8: PLACENTA IN INFANTS ADMITTED TO THE NEONATAL UNIT
Page | 143
a
b
c
Figure 8.1 (a-c) Frequency histograms of morphological indices in infants admitted to the
Neonatal Unit.

CHAPTER 8: PLACENTA IN INFANTS ADMITTED TO THE NEONATAL UNIT
Page | 144
Table 8.5 illustrates the frequency of predefined abnormal histology in placentas of
admitted infants and compared to the non admitted population. 65.7% cases of
placentas from admitted cohort showed normal histology of placenta, which was
slightly less than that of non admitted population (72.8%). Features of ascending
genital tract infection were more frequent in admitted infants (17.9%) as compared to
the non admitted group (17.9% versus 10.5%, p=0.04) but the frequency of other
lesions was not significantly different between the groups. There was no significant
difference in the incidence of chronic placental underperfusion (6 vs 7.3%),
intervillous thrombus (6% versus 4.6%), fetal thrombotic vasculopathy (1.5 versus
0.9%) and VUE (4.5% vs 3.7%). Chorangiosis was noted only in 1 case of admitted
group. There were no cases of MPFD, chorangioma, chronic histiocytic
intervillousitis, and acute abruption observed in the admitted neonate‟s placentas.

CHAPTER 8: PLACENTA IN INFANTS ADMITTED TO THE NEONATAL UNIT
Page | 145
Histological features %Infants admitted to
NICU (n=67)* %Non-admitted group (n=1058)*
%Reference
population
(n=1125)*
Normal histology 65.7 (44) 72.8 (770) 72.4 (814)
Ascending genital tract
infection 17.9 (12) 10.5 (111) 10.9 (123)
Chronic placental
underperfusion 6 (4) 7.3 (77) 7.2 (81)
Intervillous thrombus 6 (4) 4.6 (49) 4.7 (53)
Villitis of unknown aetiology 4.5 (3) 3.7 (39) 3.7 (42)
Fetal thrombotic vasculopathy 1.5 (1) 0.9 (10) 1.0 (11)
Chorangiosis 1.5 (1) 0.8 (8) 0.8 (9)
Maternal Pre-eclampsia - 0.7 (7) 0.6 (7)
Massive perivillous fibrin deposition
- 0.5 (5) 0.4 (5)
Chorangioma - 0.4 (4) 0.4 (4)
Chronic histiocytic intervillousitis
- 0.3 (3) 0.3 (3)
Acute abruption - 0.1 (1) 0.1 (1)
*Total number is > n (>100%), as some placentas had more than 1 histological lesion and each
histological lesion has been counted separately.
Table 8.5 Incidence of predefined histological categories in admitted, non-admitted and
reference population.

CHAPTER 8: PLACENTA IN INFANTS ADMITTED TO THE NEONATAL UNIT
Page | 146
8.5 DISCUSSSION
The studies detailed in this chapter to evaluate whether there was any difference in
placental morphologic and histologic characteristics in neonates admitted to the
Neonatal Unit as compared to those where neonates were not admitted to the
Neonatal Unit.
Several studies have emerged in recent years on umbilical cord coiling index in
normal as well as in complicated pregnancies and these studies have made an attempt
to link cord coiling to the pregnancy outcome.5-8 52 However, there still remains the
uncertainty as regards the significance of abnormal cord coiling. In this study
umbilical cord coiling and the coiling index did not show any significant difference
in the admitted group as opposed to that of the non-admitted group (0.20 versus 0.20,
p=0.82).
Abnormal cord insertion (in particular marginal and velamentous) has been linked to
the adverse perinatal outcome. To avoid subjective bias, results of this study were
based on quantitative analysis of cord insertion, using the index; cord centrality
index, indicating how far the cord insertion was from the centre or the chorionic plate
margin. In this study there was no significant different between the cord centrality
index of admitted versus non admitted group (0.35 versus 0.36, p= 0.67)
The placental surface area has been linked to the development of hypertension in
later life.93 Few studies have even analysed the chorionic plate shape quantitatively. 10
In the current study, there was no difference in the quantitatively defined placental
shape, eccentricity index in the admitted group to that of non admitted group (0.50
versus 0.49, p=0.61)
Therefore all macroscopic indices, coiling index, centrality and eccentricity index
showed no difference in two groups. 34.3% of newborns admitted to the Neonatal
Unit showed abnormal histology of the placentas compared to 27.6% of those not
admitted.

CHAPTER 8: PLACENTA IN INFANTS ADMITTED TO THE NEONATAL UNIT
Page | 147
Amongst the histological categories, the incidence of ascending genital tract
infection was significantly greater in admitted group as compared to the non
admitted group (17.9% versus 10.5%, p=0.04). Apart from an excess of histological
evidence of ascending genital tract infection, there were also no significant
differences in other placental histological findings between these groups. This is not
entirely surprising; half of the infants admitted to the Neonatal Unit were for
indications such as grunting/mild respiratory distress, hypoglycaemia and poor
feeding. These clinical observations are almost always unrelated to fetal pathology,
hence would not be expected to be associated with placental abnormalities.
To summarise, this study did not find any major morphological or histological
differences in the examination of the placentas of Neonates admitted to the Neonatal
Unit. Therefore we would not support the recommendation that every placenta from
the admitted cases should have a detailed pathological examina tion in term or near
term cases, however medico-legal aspect of these cases cannot be ignored where it
may well be one of the legal requirements to have thorough examination of the
placenta.

CHAPTER 9 : CLINICAL OUTCOMES IN RELATION TO
PLACENTAL HISTOLOGY
Summary Points:
This study describes pregnancy and neonatal outcome in cases with abnormal
placental histology.
Specific clinical outcomes are compared.
The key findings were that there was no difference in the clinical outcome
between the histological groups.
CHAPTER 9: CLINICAL OUTCOMES IN RELATION TO PLACENTAL HISTOLOGY
Page | 149
9.1 INTRODUCTION
In the previous chapter (chapter 8), gross and histological characteristics of placenta
in infants admitted to the Neonatal unit were compared to those placenta where
infants were not admitted to the Neonatal unit. In this chapter a different relationship
is explored i.e. whether abnormal histology of the placenta has any bearing on the
clinical and neonatal outcome? This area is dominated with many controversies,
partly due to the relatively deficit in communication between the pathologist and
obstetricians and also due to high degree of inter-observer variability among
pathologists in defining histological groups.
The placental pathology has been associated with adverse neonatal outcome
especially neurodevelopment outcome, even in normally grown term infants.140 170
For example; chorioamnionitis has been linked to the cerebral palsy as its one of the
major predisposing factor, only about 10% cases of cerebral palsy have been
attributed to intra partum events, the majority of the cases thought to be linked to
events earlier on in the pregnancy.
Placental injury or abnormal histology may be present in the form of intra uterine
growth restriction, abnormal fetal weight, and low birth weight placenta weight ratio
during antenatal and neonatal period.
The aim of the studies in this chapter was to identify specific pregnancy and neonatal
outcome in the most common placental histological categories observed in the
study). This compared the pregnancy and neonatal outcome in all abnormal histology
cases to that of normal histology cases. Clinical outcome were examined in most
common placenta pathology categories of: ascending genital tract infection, chronic
placental underperfusion, intervillous thrombus, villitis of unknown aetiology and
fetal thrombotic vasculopathy.

CHAPTER 9: CLINICAL OUTCOMES IN RELATION TO PLACENTAL HISTOLOGY
Page | 150
9.2 METHODS
As previously described (chapter 2 &7), of 1159 cases, histology was available in
1125 cases. Abnormal placenta histology was noted in 313 cases while remaining
812 cases showed normal placenta histology. Individual placenta pathology was
noted in 313 pathology cases. How these pathological categories are defined, is
explained in chapter 7.
For this chapter specifically following information were observed.
Maternal factors recorded were maternal age, parity, gestational age, incidence of
common obstetric outcome pregnancies, onset of labour, CTG abnormalities, mode
of delivery especially incidence of emergency caesarean sections.
Neonatal factors recorded were neonatal outcome, birth weight, gender of the
neonate, number of admissions to the neonatal unit, Apgar score and cord blood pH
(arterial and venous with base excess). Neonates requiring resuscitation was also
observed. Neonates, admitted to the neonatal unit, were observed for number of
admission days in the neonatal and especial care unit, findings of cranial ultrasound,
presence of hydrocephalus, seizures, retinopathy of prematurity, necrotising
enterocolitis, patent ductus arteriosus, thrombocytopenia, anaemia, infection proven
by laboratory findings, any evidence of renal impairment and finally if the baby was
discharged home or transferred out to another unit for longer stay in the Hospital.
9.3 STATISTICS
Data from all abnormal placental histology cases was compared to the data from
normal histology. Individual placental pathology cases were also compared to that of
the normal histology. To explore the relationship between two categorical variables,
Chi-square test for independence was used. Means were compared of the continuous
variables using t-test. 2 tailed significance value ≤ 0.05 was used as statistically
significant. Numerical variables were expressed as mean ± SD.

CHAPTER 9: CLINICAL OUTCOMES IN RELATION TO PLACENTAL HISTOLOGY
Page | 151
9.4 RESULTS
Out of total 1159 histology cases, data was available for 1125 cases. Normal
histology was observed in a majority of cases 812cases (72.2%), while 313 cases
(27.8%) showed abnormal placenta histology.
Table 9.1 represents the predefined histologic categories in cases with abnormal
placenta histology.
Abnormal histology % (n-313)*
Ascending genital tract infection 39.3 (123)
Chronic placental underperfusion 25.9 (81)
IVT 16.9 (53)
VUE 13.4 (42)
Fetal thrombotic vasculopathy 3.5 (11)
Chorangiosis 2.9 (9)
Maternal PET 2.2 (7)
MPFD 1.6 (5)
Chorangioma 1.3 (4)
Chronic histiocytic intervillousitis 0.9 (3)
Acute abruption 0.3 (1)
*Total number is > 313 (>100%), as some placentas had more than 1 histological lesion and each
histological lesion has been counted separately.
Table 9.1 Frequency of predefined histological categories in abnormal placental histology.

CHAPTER 9: CLINICAL OUTCOMES IN RELATION TO PLACENTAL HISTOLOGY
Page | 152
Table 9.2 presents the maternal and neonatal characteristic data in cases with
placental pathology versus placentas with normal histological findings.
Total n=1125 Abnormal histology(n=313) Normal histology(n=812)
Maternal age years ± SD 30.5 ± 5.6 31 ± 5.8
Mean Gestational age ± SD 39.8 ± 1.3 39.4 ± 1.5
% Nulliparity (n) 57.8 (181) 44.3 (359)
% Smoker (n) 10.5 (33) 8.9 (72)
% Maternal PET (n) 1.6 (5) 2.3 (19)
% Maternal PIH (n) 2.9 (9) 2.2 (18)
% Maternal GDM (n) 2.9 (9) 4.4 (36)
% SGA≤10th
percentile (n) 8.6 (27) 9.8 (80)
% Induced labour (n) 17.3 (54) 20.1 (164)
%Emergency caesarean delivery (n)
12.5 (39) 10.9 (89)
Mean Birth Weight ± SD 3523 ± 497 3466 ± 504
%Males (n) 53.7 (168) 52.9 (430)
% admitted to Neonatal unit (n)
7.3 (23) 5.4 (44)
Apgar score (at 5 min) ± SD 9.85 ± 0.4 9.83 ± SD 0.6
Cord Blood pH (Arterial) ± SD
7.25 ± 0.07 7.25 ± 0.08
BE (Arterial) ± SD -4.50 ± 2.6 -4.35 ± 2.7
Cord Blood pH (Venous) ± SD 7.31 ± 0.07 7.31 ± 0.07
BE (Venous) ± SD -4.22 ± 2.19 -4.17 ± 2.51
Table 9.2 Maternal and neonatal characteristics in cases with normal and abnormal placental
histology.

CHAPTER 9: CLINICAL OUTCOMES IN RELATION TO PLACENTAL HISTOLOGY
Page | 153
Table 9.3 compares the different resuscitation measures required immediately after
delivery in the group with and without placental pathology. Majority of the cases,
over 90% in both groups did not require any resuscitation. None of the neonates
required intubation or cardiac massage in the placenta pathology group.
Abnormal histology
% (n=313) Normal histology
% (n=812)
None 95.8 (300) 97.1 (788)
Facial oxygen + Stimulus 2.3 (7) 1.5 (12)
Face mask ventilation 1.9 (6) 1.1 (9)
Intubation - 0.2 (2)
Intubation + Cardiac massage - 0.1 (1)
Table 9.3 Neonatal resuscitation in abnormal versus normal placental histology groups.
Table 9.4 compares the neonatal outcome in the admitted neonates in abnormal
versus normal histology group. The incidence of respiratory distress syndrome
(RDS) was higher in the placental pathology group (26% versus 15.9%), however,
this difference was not statistically significant (p>0.05). There was no statistically
significant difference in the mean ventilation, CPAP, total respiratory support days in
the group with and without placental pathology. There was no significant difference
in the admission days to NICU, SCBU or total admission days in the unit in either of
the group.

CHAPTER 9: CLINICAL OUTCOMES IN RELATION TO PLACENTAL HISTOLOGY
Page | 154
NS-Non significant
Table 9.4 Neonatal outcome in abnormal versus normal placental histology.
Abnormal histology Normal histology P value
No. of neonates admitted N=23 N=44
% RDS (n) 26 (6) 15.9 (7) NS
% CLD 0 0
Ventilation days (Mean ± SD) 0.09 ± 0.4 0.10 ± 0.37 NS
CPAP days (Mean ± SD) 0 0.30 ± 1.17 NS
Mean total days respiratory
support ± SD 0.13 ± 0.46 0.33 ± 1.14 NS
Hydrocephalus (n) 0 0
Seizures (n) 0 0
ROP (n) 0 0
Feed Intolerance (n) 2 9 NS
PDA (n) 0 1
Thrombocytopenia n) 0 0
Anaemia (n) 0 0
Coagulopathy (n) 0 0
Proven infection (n) 0 0
NEC (n) 0 0
Renal Impairment (n) 0 1
NICU admission days (Mean ± SD)
0.17 ± 0.7 1.86 ± 4.8 NS
SCBU admission days (Mean ± SD)
5.65 ± 1.7 6.53 ± 3.5 NS
Total Hospital stay days (Mean ± SD)
5.83 ± 1.9 8.21 ± 6.2 0.07
Survival to discharge (n) 23 43 NS
Discharged home from Rosie
Hospital (n) 23 40 NS
Transferred out to different
unit (n) 0 3

CHAPTER 9: CLINICAL OUTCOMES IN RELATION TO PLACENTAL HISTOLOGY
Page | 155
Tables 9.5 (a-b) shows the pregnancy and neonatal outcomes in placentas with
abnormal histology groups and the comparison to the normal histology data.
All values in %
(n) or Mean ± SD
Ascending
genital tract
infection (n=123)
Chronic
placental
underperfusion (n=81)
IVT
(n=53) VUE (n=42)
Fetal
thrombotic
vasculopathy (n=11)
Normal
histology (n=812)
Induced labour 18.7 (23) 12.3 (10) 15.1(8) 16.7(7) 27.3(3) 20.1(163)
Emergency c/section
14.6(18) 11.1(9) 17(9) 0 9.1(1) 10.9(89)
Males 56.1(69) 58(47) 60.4(32) 31(13) 9.1(1) 52.9(429)
Maternal PET 1.6(2) 1.2(1) 3.8(2) 0 0 2.3(19)
Maternal PIH 2.4(3) 4.9(4) 1.9(1) 7.1(3) 0 2.2(18)
Maternal GDM 1.6(2) 1.2(1) 5.7(3) 0 9.1(1) 4.4(36)
SGA≤10th
percentile
8.9(11) 12.3(9) 0 9.5(4) 9.1(1) 9.8(80)
Admitted to neonatal unit
9.8(12) 4.9(4) 7.5(4) 7.1(3) 9.1(1) 5.4(44)
Apgar score at 5 min
9.80 ± 0.4 9.83 ± 0.4 9.92 ± 0.27 9.95 ± 0.22 9.91 ± 0.30 9.85 ± 0.66
Arterial cord Blood Ph
7.24 ± 0.06 (n=47)
7.26 ± 0.07 (n=23)
7.25 ± 0.07 (n=14)
7.23 ± 0.07 (n=14)
7.32 ± 0.07 (n=5)
7.25 ± 0.08 (n=254)
BE-Arterial -5.0 ± 2.40
(n=47) -4.5 ± 2.96
(n=23) -3.99 ± 2.26
(n=14) -5.00 ± 2.30
(n=14) -2.34 ± 2.13
(n=5) -4.35 ± 2.69
(n=254)
Venous cord
blood Ph
7.30 ± 0.07
(n=47)
7.32 ± 0.06 (n=22)
7.31 ± 0.06 (n=14)
7.30 ± 0.04 (n=14)
7.38 ± 0.10 (n=6)
7.31 ± 0.07 (n=260)
BE-Venous -4.63 ± 2.10
(n=47) -4.02 ± 2.52
(n=22) -3.99 ± 1.85
(n=14) -4.51 ±
2.24 (n=14) -3.15 ± 1.93
(n=6) -4.17 ± 2.51
(n=260)
Resuscitation required
9.8(12) 1.2(1) 0 0 0 3(24)
RDS 1.6(2) 3.7(3) 1.9(1) 0 9.1(1) 15.9(129)
Table 9.5 (a) Pregnancy and neonatal outcomes in cases with abnormal and normal histology.

CHAPTER 9: CLINICAL OUTCOMES IN RELATION TO PLACENTAL HISTOLOGY
Page | 156
Ascending
genital tract
infection
(n=123)
Chronic
placental
underperfusion
(n=81)
IVT
(n=53)
VUE
(n=42)
FTV
(n=11)
Normal
histology
(n=812)
Mat Age 29.98 ± 5.70 30.73 ± 5.17 30.32±5.39 31.81±5.64 28.36 ± 6.28 31.00±5.78
GA at del(wks) 40.11 ± 1.30 39.70 ± 1.21 39.74±1.00 39.74±1.15 38.82 ± 1.60 39.37±1.49
Birth Wt (gms) 3584 ± 476 3390 ± 524 3660±426 3434±523 3382 ± 512 3466±504
NICU admission
(days) 0 .25 ± 0.50 .75±1.50 0 0 1.86±4.84
SCBU admission
(days) 5.58 ± 1.08 3.75 ± 2.22 4.75±2.63 7.00±2.00 8.00 ± 2.00 6.53±3.50
Total Hospital
admission (days) 5.58 ± 1.08 4.00 ± 2.16 5.50±3.70 7.00±2.00 8.00 ± 2.00 8.21±6.19
Ventilation days 0 0 .50±1 0 0 0.10±0.37
CPAP days 0 0 0 0 0 0.30±1.17
Total days resp
support 0 .25 ± 0.50 .50±1 0 0 0.33±1.14
Table 9.5 (b) Pregnancy and neonatal outcomes in cases with abnormal and normal histology.

CHAPTER 9: CLINICAL OUTCOMES IN RELATION TO PLACENTAL HISTOLOGY
Page | 157
9.5 DISCUSSION
Should all placentas be sent for detailed examination of placenta if there is adverse
perinatal outcome; it is still not clear whether the pregnancy and neonatal outcomes
are any different in abnormal placental histology group as compared to that of
normal histology.
In this study, there were no differences observed in gestational age at delivery,
prevalence of PET, PIH, GDM and SGA, rate of induction of labour or emergence
Caesarean section in either of the group. Even there was no difference in the rate of
admission in neonatal unit in placenta pathology versus normal cases (7.3% versus
5.4% with p=0.26). There was no significant difference in the mean admission days
to NICU (p=0.10), SCBU (p=0.26) or in the total spent in the neonatal unit (p=0.07).
Cord blood gases (arterial and venous) were not any different in abnormal histology
versus normal histology groups (Art-7.25 versus 7.25, Ven-7.31 versus 7.31).
There was no difference observed in the incidence of respiratory distress syndrome
in the placentas with normal versus abnormal histology, with no difference in mean
ventilation days (p=0.92), days on CPAP (p=0.22) or in total days on respiratory
support (p=0.42).
None of the individual histological categories showed any increased prevalence of
the PET, PIH, GDM or SGA.
39.3% of all placental histology cases were of ascending genital tract infection;
however none of these cases had any clinical signs or symptoms suggestive of
chorioamnionitis or any other intrauterine sepsis. The result of this study is in
accordance with the other studies showing poor correlation between clinic and
histologic chorioamnionitis.126-127 Though the histological diagnosis of the
chorioamnionitis is considered a gold standard, the clinical significance of this is not
entirely clear. In this study, there were no significant differences observed in
pregnancy and neonatal outcome of normal versus abnormal histology groups.

CHAPTER 9: CLINICAL OUTCOMES IN RELATION TO PLACENTAL HISTOLOGY
Page | 158
In term pregnancies, chorioamnionitis occurs in labour and clinically remains largely
irrelevant, while in preterm deliveries, this will be of much greater clinical relevance.
A recommendation therefore from this analysis is that every placenta does not need
detailed pathological examination in deliveries at or close to term. However this data
can only be represented for the population at or near term but cannot be extrapolated
to pre term deliveries.

CHAPTER 10 : DISCUSSION
Key Findings:
Close correlation between manual and digital placental measurements using
software image J has been defined.
Morphological indices of the placenta and the umbilical cord defined for
more objective analysis.
These morphological indices were not different in common obstetric outcome
groups as compared to those of the reference population.
This study has shown quantitatively, strong positive correlation of birth
weight to the placental weight and circumference.
For the first time, this study has described the baseline data of predefined
histological lesions in the reference population and the pregnancies with
common obstetric outcome.
Cases of IVT and VUE showed relative hypercoiling of the umbilical cord.
Most placentas from unselected population (72%) as well as common
obstetric outcome groups (66-80%) were histologically normal.
Morphological indices and predefined histological abnormalities were not
any different in the placentas from infants admitted to the Neonatal Unit.
There were no differences in the pregnancy and Neonatal outcome in cases
with abnormal predefined histological lesions.

CHAPTER 10: DISCUSSION
Page | 160
10.1 OVERVIEW OF THESIS
This study was a prospective study of an unselected reference population of women
with singleton pregnancies, delivering in a single unit in Cambridge, Eastern region
of England. The study received ethical approval from Cambridgeshire 3 Research
Ethics Committee. 1159 patients were recruited for the study over a period of 13
months in year 2007-2008. This study largely included term cases (33-43 weeks).
The study predominantly defines the morphological and histological characteristics
of the placenta to the pregnancy and neonatal outcomes. This study has surprisingly
never been done before. The study derived the placental morphological indices
quantitatively using the image analysis, and showed a strong positive correlation
between manual and digital measurements of the placenta. Based on the derived
indices; cord coiling, insertion and the shape of the placenta has been described
quantitatively, avoiding the bias of qualitative method. The study has also derived
the ratio of birth weight to placental weight and the circumference in the reference
population. These morphological indices and the ratios will form the bases of future
studies.
No baseline quantitative data for placental characteristics exists. Previous studies
have either been performed on high risk population and/or analysed placental
characteristics qualitatively, which makes it difficult to compare the data.
This study has defined the criteria for diagnosing the histological lesions of the
placenta and the incidence of these predefined histological lesions in the unselected
population.
As most cases in any unselected population are “normal” and have a normal
outcome, they therefore do not require further investigations of the placenta. This
study has shown this in a more objective manner and we cannot recommend that
there is need for routine detailed placental examination in an unselected term
population.

CHAPTER 10: DISCUSSION
Page | 161
This study was not easy to do, and many problems were encountered. It required
involvement of great number of personnel such as dedicated laboratory assistant for
daily transportation of placenta from delivery unit to pathology lab. Extra biomedical
scientists were required for daily tissue sectioning and processing for further
analysis. Procuring a fridge with greater capacity near labour ward was difficult.
One of the most challenging tasks of this study was to keep the midwifery staff
motivated and encouraged throughout the recruitment period so that all the placentas
from participants were kept for the study from the patients recruited. Since a detailed
and thorough macroscopic examination of the placenta was not possible in the
delivery unit, a dedicated study area was required in the pathology lab. The study
required trained perinatal pathologists, as the general pathologist may not be trained
for the detailed placental histological examination, required by the study.
10.2 MANUAL VERSUS DIGITAL MEASUREMENTS
This study compared the manual measurements of placenta to the digital
measurements of image J software. The data showed a strong positive correlation
between manual and digital measurements using correlation coefficient a nd a more
precise method of comparison of the two measurements; Bland Altman analysis. The
results of digital measurements of the study were comparable to other recent studies
(Table 3.3).
The findings are of potential importance for future studies in this area, since with the
widespread introduction of relatively cheap and accurate digital imaging
technologies and low cost image analysis software, imaging based measurements are
likely to become increasingly commonly used. The advantages of such image based
studies includes the ability to perform measurements in a batch at a subsequent time,
rather than delaying placental or tissue clinical examination, and the storage of the
raw data images which can be revisited at a later date for review or further
measurements. For most such studies examining measurements in relation to
outcome, the precise measurements are less important since provided the same
methodology is used for all group valid comparisons can be made.

CHAPTER 10: DISCUSSION
Page | 162
There was a close correlation in manual measurements of long axis, short axis and
circumference of the placenta to that of digital measurements, though the digital
measurements appeared to be systematically smaller than the traditional manual
measurements. The reason for this difference was not clear. As the comparative data
have not been presented in this format before, it is difficult to know if this finding
was unique to this study or whether there are other reasons.
Digital measurement of the placenta is reproducible and a relatively simple method
of measurement compared to traditional manual measurements. Image J software is
also freely available making it accessible to researchers in countries where financial
resources may be limited.
10.3 PLACENTAL MORPHOLOGICAL INDICES
Studies on the placenta and umbilical cord have generally investigated adverse
outcomes where there is an indication for histological examination of the placenta,
such as fetal demise, intrauterine growth restriction, preterm delivery, pre-eclampsia,
diabetes mellitus, macroscopic abnormalities of placenta, fetal asphyxia, and intra
uterine infection. Few have attempted to establish baseline characteristics in an
unselected population delivering at term. This population studied approximates in
maternal demographics, the incidence of pregnancy conditions and birth
weight/gestation outcomes to a typical UK/European booking population.
Hypocoiling and hypercoiling of the cord (whether detected in antenatal or postnatal
period) have been reported to be associated with adverse perinatal outcome, although
causality remains uncertain. Hypocoiling has been associated with trisomies, preterm
delivery, fetal death, increased intrapartum complications and interventional
deliveries for fetal distress, Apgar score less than 7 at 5 minutes; velamentous cord
insertion and single umbilical artery. Hypercoiling has also been linked with
trisomies, but also small for gestation age, fetal asphyxia and single umbilical artery 5
8 56.

CHAPTER 10: DISCUSSION
Page | 163
Abnormal cord coiling has also been found with thrombosis of the chorionic plate
vessels, umbilical venous thrombosis and umbilical cord stenosis 6.
The coiling index is probably one of the most frequently reported of umbilical cord
related parameters in common outcome groups. Pre-eclampsia and gestational diabetes
have been suggested as maternal risk factors for abnormal coiling 57. In gestational
diabetes both non coiling and hyper coiling were significantly more frequent than in
normal pregnancies96. In addition, hypercoiling has been associated with SGA (OR
2.10) 8. The umbilical cord coiling index in this study was 0.20 coils/cm with a
preponderance of left sided coiling (79%), according with published data which suggest
a range of 65% to 87.5% 8 45 49.11. Our data however showed no significant difference in
umbilical cord coiling index with pre-eclampsia, PIH, GDM or SGA compared to the
reference population.
Whilst central and paracentral cord insertions presumably represent variants of normal
and have no clinical importance, marginal insertion has been suggested as being more
susceptible to vessel rupture and associated with intra uterine growth restriction,
stillbirth and neonatal death 9. The incidence of velamentous insertion increases with
maternal smoking, advanced age or diabetes mellitus and among multiple births,
congenital malformation and in vitro fertilisation pregnancies 9. However, in our study
we did not observe any cases of velamentous insertion of the cord in GDM. Although
the difference between extreme paracentral umbilical cord insertion and marginal cord
insertion may be small, this differentiation may be important as paracentral umbilical
cord insertion is the most common type of umbilical cord insertion in pregnancies with
normal outcome while some studies have shown an increased incidence of marginal
umbilical cord insertion in pregnancies with adverse outcomes such as miscarriage, fetal
congenital anomalies, preterm labour and intrauterine growth restriction 64-66.
The morphological index for the degree of deviation from central insertion into the
chorionic plate is expressed in this study as the cord centrality index (CI). The data of
this study indicated that in unselected population of pregnancies delivering at term, the
„normal‟ cord insertion is not in fact central. In the current study mean cord centrality
index was 0.36, which signifies a markedly „off centre‟ insertion (Figure 4.4).

CHAPTER 10: DISCUSSION
Page | 164
Transposing these results to the traditional descriptive categories, the results concur with
historical as well as newer studies (Table 4.1). Though subjective and qualitative
description of the placenta has a role predominantly in clinical reporting, deriving this
index allows entirely objective analysis of this and other continuous variables in relation
to outcomes and other placental findings.
There are no studies comparing quantitatively the difference between abnormal
insertion of the umbilical cord in common obstetric outcome groups and a reference
population. The distance of umbilical cord insertion from the centre (or from the
chorionic plate margin) has been considered a marker of placental insufficiency 90 97.
Peripheral cord insertion is also strongly related to abnormal placental shape in severe
IUGR with abnormal umbilical artery Doppler.171 The association of velamentous
insertion with IUGR, low birth weight infants and pregnancies affected with diabetes
mellitus has been reported 9. One of the largest studies of its type on 12,750 patients,
found an increased risk of low birth weight (OR 2.32) and small for gestational age
infants (OR 1.54) with velamentous insertion74, and another an increased incidence of
velamentous cord insertion in low birth weight than controls 73. Historic studies have
reported an increased incidence of marginal cord insertion in pregnancies with IUGR
64-66. In the current study there was no significant difference in cord centrality index for
pre-eclampsia, PIH, GDM and SGA groups compared to the reference population.
The shape of the placenta has been thought to closely mirror the pattern of chorionic
vascular growth; studies modelling the placental vascular tree have suggested that
irregular shapes of placenta are common and associated with low birth weight,
suggesting variably shaped placentas have altered function 10. Abnormal shape has
been associated with increased intra uterine fetal death, extreme preterm delivery and
fetal growth restriction 172. The data of the present study indicated that the „normal‟
term placenta was not round. The eccentricity index in this study varied from 0 to 1
with mean eccentricity of the chorionic disc 0.49, in other words more elliptical than
round (fig 4.7). There are no studies describing the shape of placenta quantitatively
in the common obstetric outcome groups of hypertensive disorders of pregnancy,
GDM or SGA. Further few have compared the shapes of the placenta quantitatively

CHAPTER 10: DISCUSSION
Page | 165
between obstetric outcome groups and a reference population, though a recent study
has shown a correlation between the short axis of the placenta and the severity of the
pre-eclampsia 94. The current study did not find the statistically significant difference
in shape (eccentricity) of the placenta between the reference population and any of
the common obstetric outcome groups.
It is, therefore, appropriate to dispel the widely held beliefs that the placenta is, in its
natural and normal state, circular and that the cord normally inserts into its centre.
Further, coiling index, cord centrality index and eccentricity in this study was not any
different in the pregnancy outcome groups compared to the data from pregnancies
which were not affected by those outcomes.
10.4 BIRTH WEIGHT/ PLACENTAL WEIGHT AND CIRCUMFERENCE
The normal birth weight: placental weight ratio has been shown to range between 6.5
to 7.1 at term 37-42 weeks gestation114-115, and 6.3 to 8.46 at 34-43 weeks.116 The
birth weight: placental weight ratio of 7.39 ± 1.20 in the reference population from
33-43 weeks that we derive is therefore within the limits of these gestational age
ranges. This ratio may have relevance as the ratio of birth weight: placental weight
has been considered to be more important than placental weight alone when
considering adverse perinatal outcome such as fetal and neonatal demise.107 117
This relationship between birth weight and placental weight is also important as a
larger placental weight: birth weight ratio has been associated with chronic
hypertension and other adverse cardiovascular outcomes in later life.110 173
Confusingly, the relationship of birth weight and placental weight has been described
differently in other studies, and gestational age strongly affects the ratio with the
ratio being lower at earlier gestations: 2.9 at 24 weeks and 6.8 at 40 weeks.115 Some
studies describe the feto-placental weight ratio116, others as its inverse-placental
weight: birth weight ratio.113 One UK based study174found that the placental: birth
weight ratio at term (39-41 weeks) ranged from 19.5 to 20.4%, which would be
roughly be equal to birth: placental weight ratio of about 5; another measured the
CHAPTER 10: DISCUSSION
Page | 166
placenta: birth weight ratio at term (>37 weeks) in a large cohort as 0.177 i.e. birth:
placenta weight ratio as 5.6.113 These ratios are smaller than those observed in the
current study.
Ethnicity does not seem to affect this ratio, as smaller births in Asian pregnancies are
associated with smaller placentas and greater birth weight with higher placental
weight; therefore the ratio is thought to remain essentially the same.174 The
population in this current study is mainly Caucasians as has been mainly the case in
European based studies.
Birth weight/placenta weight of the reference population has been compared with the
common obstetrics outcomes in this study. This ratio is significantly smaller
(p=0.001) in cases with PET (6.60 ± 1.03) than the cases not affected by PET (7.40 ±
1.19). The mean difference between the two groups was 0.79. This study did not
show any difference in this ratio in cases with SGA, PIH and GDM compared to the
non-affected population.
Another outcome analysed in this study was the ratio of birth weight and placental
circumference. This ratio has not been presented previously. We described it as we
wished to establish whether a relationship existed between the birth weight and the
placental dimensions rather than with weight or volume. Whether or not this ratio is a
clinically useful index, describing it and deriving a relatively robust range and ratio at
gestation between 33-43 weeks allows other researchers to compare their findings to it.
In this study, a significant difference was observed in birth weight/placenta
circumference ratio in cases with PET and SGA. In cases of PET and SGA, the mean
difference of this ratio was significantly less than non-affected population. The study did
not disclose this ratio any different in cases with PIH and GDM as compared to the non-
affected population values.
The birth weight: placental weight ratio, derived in this study was consistent with the
data from studies. The data of the birth weight ratio to the placental weight and
circumference as robust as they were from an unselected population of women

CHAPTER 10: DISCUSSION
Page | 167
delivering at gestational age of 33-43 weeks whose gestations have in all cases been
calculated from a first trimester scan.
There was a strong correlation between placenta weight and circumference to the
birth weight in all common obstetric outcome groups and reference groups. (scatter
plots with significant Pearson‟s correlation coefficient‟s values-figures 6.4-6.10),
which also confers that higher the birth weight, the higher is the placenta weight and
the circumference and vice versa.
10.5 PREDEFINED HISTOLOGICAL LESIONS
These data describe the pattern of histology in unselected population irrespective of
the risk status of the pregnancy. To add this, the study follows strict criteria for the
diagnosis of histological abnormalities. The incidence of various histological
pathologies varies widely in literature; one of the reasons being lack of standard
definitions for these lesions. Every research group has defined the lesions according
to their definitions and therefore the literature lacks uniformity on the subject.
Guidelines suggest that all placentas should be examined by the trained perinatal
pathologists: Placental pathology should be a routine component of obstetric-
neonatal care, as it would provide detailed information, helpful in the post natal
management of adverse pregnancy outcome.18 However the histological examination
and perinatal outcome in most pregnancies is normal, for example in the current
study, the frequency of histologically normal examination was observed in over 70%
of cases, even in the subset of common obstetric outcome pregnancies more than
66% placentas did not show any histological lesions. Therefore the data from this
study do not support the recommendations for the routine examination of placenta by
the pathologist.
The diagnosis of chorioamnionitis clinically is unreliable as the clinical signs and
symptoms are non specific. These symptoms may be suggestive of some other
pathology, not necessarily chorioamnionitis.

CHAPTER 10: DISCUSSION
Page | 168
Above all most cases of chorioamnionitis (confirmed histologically) do not even
have the clinical features of infection per se. Therefore only a histologically made
diagnosis of chorioamnionitis should be taken as a reliable diagnosis. Interestingly,
in the current study we had no cases of clinically diagnosed chorioamnionitis and yet
we had significant number (123; 10.9%) of cases of histological ascending genital
tract infection. This enforces the fact that there is a very poor correlation between a
clinical diagnosis and histological infection. There was no difference in the
frequency of ascending genital tract infection in the common obstetric outcome
groups as compared to the unselected population.
The reported incidence of IVT varies from 3-50% in full term uncomplicated
pregnancies. 132 133 This study reported the frequency of IVT in unselected cohort of
4.7%; comparing the incidence of IVT in uncomplicated pregnancies to small for
gestational age (<10 centile) has shown no difference in the incidence of the
lesion.133 In current study there were no differences in IVT observed in SGA, PET,
PIH and GDM, compared with reference population.
Villitis of unknown etiology is one of the most commonly found placental lesions in
the 3rd trimester. This entity is still unknown to many clinicians and pathologists are
still over or under diagnosing the condition. VUE is primarily seen in the term
placenta; more than 80% cases occur after 37 weeks and all after 32 weeks of
gestation.114 Histology findings suggestive of chronic villitis at less than 32 weeks
should lead to a high suspicion of infectious pathology rather than making a
diagnosis of villitis of unknown etiology.
The diagnosis of VUE can be difficult specially when there is minor degree of
inflammatory change. A high degree of inter-observer variation can be seen in the
diagnosis of villitis of unknown etiology.157 There also exists different histological
criteria for the diagnosis of villitis by different authors. Perhaps if agreed standard
criteria for the diagnosis of VUE; this condition then can be better understood by all.
Villitis of unknown etiology has been described to have a recurrent tendency in
successive pregnancies and recurrent villitis tends to be more extensive and has even

CHAPTER 10: DISCUSSION
Page | 169
stronger association with intra uterine growth restriction. 175 176 The incidence of
VUE in current study what we find was lower (3.7%) than the incidence noted in one
of the study of the UK population (13.6%).136 The frequency of VUE was higher
(11.1%) in cases with PIH but interestingly there were no cases observed in PET.
We also report relatively infrequent histological lesion: fetal thrombotic
vasculopathy, Chorangiosis, massive perivillous fibrin deposition (MPFD) in the
study.
In summary: these histological abnormalities are either studied in uncomplicated
pregnancies or in complicated pregnancies but to the best of our knowledge, no study
has presented the baseline histologic profile in unselected population. We described
an unselected population, the prevalence of the histological abnormalities is low and
therefore the power of the study to determine clinical significance is low. However
the range and incidence of histological abnormalities can be used as baseline data for
future studies.
This study also investigated the relationship between the macroscopic placental
indices to the placental histology. The effect of and/or association between
histological lesions and the morphological characteristics of the placenta have not
been previously comprehensively described in an quantitative manner, using
objective measurements and strict histological criteria combined with completely
blinded histological review.
The study did not find an association between placental macroscopic features such as
the shape (Eccentricity), and cord insertion (Cord centrality index) with the
histological abnormalities. Placental morphology can therefore not predict the
presence or absence of histological abnormality.

CHAPTER 10: DISCUSSION
Page | 170
10.6 PLACENTA IN NEONATES ADMITTED TO THE NEONATAL UNIT
CLINICAL AND OUTCOMES IN ABNORMAL HISTOLOGY GROUP
Macroscopically; the cord coiling index, cord centrality index and placental
eccentricity in infants admitted to the Neonatal Unit did not show any significant
difference as compared to that of macroscopic indices of the cases where infants
were not admitted. The cord coiling index was no different in infants admitted to the
Neonatal Unit. The cord centrality index showed no difference in Neonatal Unit
cases, neither was eccentricity. However microscopically; 34.3% of infants admitted
to the Neonatal Unit had histological abnormalities according to our pre defined
histological groups.
Clinical chorioamnionitis is associated with adverse perinatal outcomes, including
cerebral palsy, abnormal fetal heart rate pattern, fetal hypoxia, chronic lung disease,
broncho-pulmonary dysplasia, IUGR, fetal sepsis, fetal and neonatal death. These
will obviously increase the rate of neonatal admission. However, it is difficult to
determine whether the increased incidence of ascending genital tract infection is a
true reflection of the Neonatal Unit admitted cohort or is due to any particular
clinical outcome group.
The incidence of chronic placental underperfusion, IVT, VUE, fetal thrombotic
vasculopathy and Chorangiosis was very small number to draw any meaningful
conclusions. No cases of MPFD, chorangioma, chronic histiocytic intervillousitis,
and acute abruption were observed in the placentas where infants were admitted to
the Neonatal Unit.
Comparing all cases of abnormal placental histology to normal histology, there was
no significant difference in maternal age, gestational age, prevalence of PET, PIH,
GDM and SGA, rate of induction of labour or emergency caesarean section. There
was no difference in the rate of admission to the Neonatal Unit based on the
histology of the placenta. There was no difference in cord blood gases (arterial and
venous) in both groups. In both groups over 95% of neonates did not require any
resuscitation.

CHAPTER 10: DISCUSSION
Page | 171
The incidence of respiratory distress syndrome was not different in the two groups.
Similarly, there was no significant difference in mean ventilation days, days on
CPAP, total days on respiratory support, mean admission days to NICU, SCBU or in
the total spent in the Neonatal Unit.
Individually comparing with the most common histological categories, there was no
significant difference between the cases with abnormal and normal histology and the
incidence of maternal pre-eclampsia, PIH, GDA and SGA was not increased in the
abnormal histology group.
Out of 313 cases with abnormal placenta histology, the most common histological
category was ascending genital tract infection, which constituted 39.3% of all
placental pathology cases. In this study there were neither cases of clinical suspected
chorioamnionitis nor any obvious cases of antenatal sepsis. Clinical signs and
symptoms which may be suggestive of chorioamnionitis are non specific; there is a
poor correlation between clinical and histologic chorioamnionitis.126-127 We included
funisitis (umbilical cord inflammation) and the inflammation at the choriodecidual
junction within the ascending genital tract infection group. Intrauterine infection due
to any cause is well known to be linked with preterm deliveries.177-180 Intrauterine
infection and subsequent resulting fetal infection has been implicated in neonatal and
fetal injury181-182, cerebral palsy183 and chronic lung disease.184 The end state is
infection is fetal infection and increased neonatal mortality due to neonatal sepsis;
Chorioamnionitis results in increased perinatal morbidity and mortality.
Diagnosis of chorioamnionitis clinically is an unreliable tool as the clinical signs and
symptoms suggestive of chorioamnionitis are non specific. However its clinical
significance is not clear as most term cases would have no clinical concerns.
In summary, this study showed no obvious utility to examining the placenta routinely
or in the case of neonatal and fetal pathology. However in such cases, the
significance of detailed placental examination by the pathologist would still remain
from medico-legal purposes.

CHAPTER 10: DISCUSSION
Page | 172
We recommend that the strict criteria for the definitions for all common histological
categories and standard protocols should be developed for better understanding of the
disease.
10.7 REFLECTIONS ON PROBLEMS IN THESIS
Ethics committee/ R&D /Consent
Patients were provided the consent form with the study information in the antenatal
clinics. They were asked to sign the consent forms if agreed to participate in the
study. Consent forms were kept in the patients notes. At the time of delivery, the
evidence of consent was confirmed by the delivery unit staff and placenta was sent to
the study attached with a study pathology form with a confirmation of the consent.
During the study, there were problems with regard to the consent for the placental
study. The research team identified some shortcomings in filing the written consent
form, in the patients‟ notes, as per the study protocol. In the interest of research
governance, the team agreed to review all case notes when a concern was raised.
Where there was no evidence of signed consent form in the patients‟ notes, the cases
were not included in the study and the patient information was removed from the
study database.
There were some cases where there was no evidence of the written consent form in
the case notes, but the completed and signed study pathology form by the attending
doctor or midwife was present with the placenta stating explicitly that the consent
has been taken. These cases also have not been included in the current study, as they
are pending ethics committee decision.
We very much regret that we do not include these cases but feel we have no
alternative in absence of any response from the ethical committee. (Reference letter
in appendix)

CHAPTER 10: DISCUSSION
Page | 173
10.8 LIMITATIONS OF STUDY
All pregnant women with singleton pregnancy were approached for the study
irrespective of their gestational age at the time of recruitment. Therefore we perhaps
did not recruit patients who either had pre term delivery or developed for example
early onset pregnancy complications for example early onset pre eclampsia, IUGR
etc. Because of the laborious consenting process, women in whom there were clinical
difficulties at preterm gestations are less likely to have consented to take part in this
study. However the incidence of term complications of pre eclampsia, PIH, GDM
and SGA are broadly similar to those reported in other studies from unselected
population. We do plan to extend this study including specific cases of early onset
PET, IUGR, clinical abruption cases, diabetes and IUFD.
We also could not recruit those placentas where placenta those were delivered
manually, making it difficult to perform measurements.
We did not have control on the length of the umbilical cord left on the neonates. We
only relied on the cord which was received with the placenta. This problem is
encountered in most studies performed on the umbilical cord. Therefore fetal end o f
the cord is not truly “fetal” end. The method we have used to derive the placental
circumference worked well for regularly shaped placentas, however was more
approximate where a placenta was a very abnormal shape. There is no geometrical
way of reliably defining the axes of the placenta and its centre where a placenta has a
grossly irregular shape. This is an invariable limitation of this type of study, however
we did not exclude any placentas on the basis of very irregular shape. Furthermore
for consistency rather than deriving placental circumference through direct tracing,
we derived this in all cases from the major and minor axes which form the basis of
the eccentricity and the cord centrality indices.
In the reference population, 123 cases (out of 1125) showed signs suggestive of
histological ascending genital tract infection; none of these cases had a record made
of clinical chorioamnionitis. However we relied on the obstetric database “protos”
for the clinical diagnosis. We did not consider individual clinical markers such as

CHAPTER 10: DISCUSSION
Page | 174
WCC, CRP, history of rupture of membranes or use of antibiotics in labour as
diagnostic in themselves as clinical chorioamnionitis.
10.9 FUTURE WORK
Following demonstration of quantitative morphology of the placenta in unselected
population, this work now allows the future studies to perform further analysis based
on the morphology of the placenta.
This data will serve as baseline dataset for all future studies on placental morphology
in unselected as well as common obstetric outcome pregnancies.
During the period of the study, placental tissues in some cases were stored in RNA
later for possible future molecular based studies.
Future work which could follow this study are:
Study on increased number of abnormal cases now that we have a large reference
population to compare with nested cases control studies.
Analysis on cases of preterm pre-eclampsia, SGA, placental abruption, IUD, diabetes
including IDDM and clinical chorioamnionitis.
To define incidence of rare histological findings in abnormal outcome groups.

REFERENCES
REFERENCES

REFERENCES
Page | 176
1. Histopathology of limited or no clinical value. Report of a working group of the
Royal College of Pathologists. London: Guidelines of the Royal College of
Pathologists, 2002.
2. Spencer MK, Khong TY. Conformity to guidelines for pathologic examination of
the placenta. Arch Pathol Lab Med 2003;127(2):205-7.
3. Khong TY, Gordijn SJ. Quality of placental pathology reports. Pediatr Dev Pathol
2003;6(1):54-8.
4. Sun CC, Revell VO, Belli AJ, Viscardi RM. Discrepancy in pathologic diagnosis
of placental lesions. Arch Pathol Lab Med 2002;126(6):706-9.
5. Strong TH, Jr., Finberg HJ, Mattox JH. Antepartum diagnosis of noncoiled
umbilical cords. Am J Obstet Gynecol 1994;170(6):1729-31; discussion 31-3.
6. Machin GA, Ackerman J, Gilbert-Barness E. Abnormal umbilical cord coiling is
associated with adverse perinatal outcomes. Pediatr Dev Pathol 2000;3(5):462-71.
7. Di Naro E, Ghezzi F, Raio L, Franchi M, D'Addario V. Umbilical cord
morphology and pregnancy outcome. Eur J Obstet Gynecol Reprod Biol
2001;96(2):150-7.
8. de Laat MW, Franx A, Bots ML, Visser GH, Nikkels PG. Umbilical coiling index
in normal and complicated pregnancies. Obstet Gynecol 2006;107(5):1049-55.
9. Heifetz SA. The umbilical cord: obstetrically important lesions. Clin Obstet
Gynecol 1996;39(3):571-87.
10. Yampolsky M, Salafia CM, Shlakhter O, Haas D, Eucker B, Thorp J. Modeling
the variability of shapes of a human placenta. Placenta 2008;29(9):790-7.
11. Strong TH, Jr., Jarles DL, Vega JS, Feldman DB. The umbilical coiling index.
Am J Obstet Gynecol 1994;170(1 Pt 1):29-32.

REFERENCES
Page | 177
12. Salafia CM, Maas E, Thorp JM, Eucker B, Pezzullo JC, Savitz DA. Measures of
placental growth in relation to birth weight and gestational age. Am J Epidemiol
2005;162(10):991-8.
13. Coall DA, Charles AK, Salafia CM. Gross placental structure in a low-risk
population of singleton, term, first-born infants. Pediatr Dev Pathol
2009;12(3):200-10.
14. Irving BA, Weltman JY, Brock DW, Davis CK, Gaesser GA, Weltman A. NIH
ImageJ and Slice-O-Matic computed tomography imaging software to quantify
soft tissue. Obesity (Silver Spring) 2007;15(2):370-6.
15. Travers H, Schmidt WA. College of American Pathologists Conference XIX on
the Examination of the Placenta: introduction. Arch Pathol Lab Med
1991;115(7):660-1.
16. Hargitai B, Marton T, Cox PM. Best practice no 178. Examination of the human
placenta. J Clin Pathol 2004;57(8):785-92.
17. Langston C, Kaplan C, Macpherson T, Manci E, Peevy K, Clark B, et al. Practice
guideline for examination of the placenta: developed by the Placental Pathology
Practice Guideline Development Task Force of the College of American
Pathologists. Arch Pathol Lab Med 1997;121(5):449-76.
18. Salafia CM, Vintzileos AM. Why all placentas should be examined by a
pathologist in 1990. Am J Obstet Gynecol 1990;163(4 Pt 1):1282-93.
19. Heazell AE, Martindale EA. Can post-mortem examination of the placenta help
determine the cause of stillbirth? J Obstet Gynaecol 2009;29(3):225-8.
20. Altshuler G. Placenta within the medicolegal imperative. Arch Pathol Lab Med
1991;115(7):688-95.

REFERENCES
Page | 178
21. Kraus FT. Cerebral palsy and thrombi in placental vessels of the fetus: insights
from litigation. Hum Pathol 1997;28(2):246-8.
22. Kaufmann P, Sen DK, Schweikhart G. Classification of human placental villi. I.
Histology. Cell Tissue Res 1979;200(3):409-23.
23. Boyd J, Hamilton W. General description of specimens:placenta in fifth month
(graph 7). The human placenta: . Cambridge, England: W Heffer and Sons, Ltd,
1970: 98-9.
24. Boyd J, Hamilton M. General description of specimens: statistics of placental
growth. The human placenta. Cambridge, England: W Heffer and Sons, Ltd,,
1970: 112.
25. Wentworth P. Circumvallate and circummarginate placentas. Their incidence and
clinical significance. Am J Obstet Gynecol 1968;102(1):44-7.
26. Suzuki S. Clinical significance of pregnancies with circumvallate placenta. J
Obstet Gynaecol Res 2008;34(1):51-4.
27. Toal M, Keating S, Machin G, Dodd J, Adamson SL, Windrim RC, et al.
Determinants of adverse perinatal outcome in high-risk women with abnormal
uterine artery Doppler images. Am J Obstet Gynecol 2008;198(3):330 e1-7.
28. Nanaev AK, Kohnen G, Milovanov AP, Domogatsky SP, Kaufmann P. Stromal
differentiation and architecture of the human umbilical cord. Placenta
1997;18(1):53-64.
29. Takechi K, Kuwabara Y, Mizuno M. Ultrastructural and immunohistochemical
studies of Wharton's jelly umbilical cord cells. Placenta 1993;14(2):235-45.
30. Baergen RN, Malicki D, Behling C, Benirschke K. Morbidity, mortality, and
placental pathology in excessively long umbilical cords: retrospective study.
Pediatr Dev Pathol 2001;4(2):144-53.

REFERENCES
Page | 179
31. Miller ME, Higginbottom M, Smith DW. Short umbilical cord: its origin and
relevance. Pediatrics 1981;67(5):618-21.
32. Moessinger AC, Blanc WA, Marone PA, Polsen DC. Umbilical cord length as an
index of fetal activity: experimental study and clinical implications. Pediatr Res
1982;16(2):109-12.
33. J.D. Boyd, W.J.Hamilton. Human Placenta: Heffer and Sons Ltd, Cambridge,
1970.
34. Gardiner JP. The umbilical cord: normal length: length in cord complications:
etiology and frequency of coiling. Surgery, Gynecology and Obstetrics
1922;34:252-56.
35. Di Terlizzi G, Rossi GF. [Clinico-statistical study of anomalies of the funiculus.].
Ann Ostet Ginecol 1955;77(5):459-74.
36. Purola E. The length and insertion of the umbilical cord. Ann Chir Gynaecol
Fenn 1968;57(5):621-2.
37. Ragucci N, Morandi C. [Umbilical cord dystocia (clinico-statistical
contribution)]. Minerva Ginecol 1969;21(10):653-5.
38. Berg TG, Rayburn WF. Umbilical cord length and acid-base balance at delivery.
J Reprod Med 1995;40(1):9-12.
39. Picinelli G, Picinelli ML. [Clinical characteristics of some cases of absolute
shortness of the umbilical cord]. Minerva Ginecol 1968;20(15):1322-9.
40. Ottolenghi-Preti GF, Bailo P. [Long funiculi; clinico-statistical study of about
30,000 pregnancies]. Ann Ostet Ginecol 1950;72(3):293-312.
41. Labarrere C, Sebastiani M, Siminovich M, Torassa E, Althabe O. Absence of
Wharton's jelly around the umbilical arteries: an unusual cause of perinatal
mortality. Placenta 1985;6(6):555-9.
REFERENCES
Page | 180
42. Edmonds HW. The spiral twist of the normal umbilical cord in twins and in
singletons. Am J Obstet Gynecol 1954;67(1):102-20.
43. de Laat MW, Nikkels PG, Franx A, Visser GH. The Roach muscle bundle and
umbilical cord coiling. Early Hum Dev 2007;83(9):571-4.
44. Malpas P, Symonds EM. Observations on the structure of the human umbilical
cord. Surg Gynecol Obstet 1966;123(4):746-50.
45. Lacro RV, Jones KL, Benirschke K. The umbilical cord twist: origin, direction,
and relevance. Am J Obstet Gynecol 1987;157(4 Pt 1):833-8.
46. Benirschke K. Obstetrically important lesions of the umbilical cord. J Reprod
Med 1994;39(4):262-72.
47. Soernes T, Bakke T. The length of the human umbilical cord in vertex and breech
presentations. Am J Obstet Gynecol 1986;154(5):1086-7.
48. Rana J, Ebert GA, Kappy KA. Adverse perinatal outcome in patients with an
abnormal umbilical coiling index. Obstet Gynecol 1995;85(4):573-7.
49. Qin Y, Lau TK, Rogers MS. Second-trimester ultrasonographic assessment of the
umbilical coiling index. Ultrasound Obstet Gynecol 2002;20(5):458-63.
50. Gupta Shalu, Faridi MMA, J K. Umbilical coiling index. J Obstet Gynecol India
2006;56(4):315-19.
51. Fletcher S. Chirality in the umbilical cord. Br J Obstet Gynaecol
1993;100(3):234-6.
52. De Laat MW, Franx A, Nikkels PG, Visser GH. Prenatal ultrasonographic
prediction of the umbilical coiling index at birth and adverse pregnancy outcome.
Ultrasound Obstet Gynecol 2006;28(5):704-9.

REFERENCES
Page | 181
53. Blickstein I, Varon Y, Varon E. Implications of differences in coiling indices at
different segments of the umbilical cord. Gynecol Obstet Invest 2001;52(3):203-6.
54. Malpas P, Symonds EM. The direction of the helix of the human umbilical cord.
Ann Hum Genet 1966;29(4):409-10.
55. Predanic M, Perni SC, Chasen ST, Baergen RN, Chervenak FA. Assessment of
umbilical cord coiling during the routine fetal sonographic anatomic survey in the
second trimester. J Ultrasound Med 2005;24(2):185-91; quiz 92-3.
56. Sebire NJ. Pathophysiological significance of abnormal umbilical cord coiling
index. Ultrasound Obstet Gynecol 2007;30(6):804-6.
57. Ezimokhai M, Rizk DE, Thomas L. Maternal risk factors for abnormal vascular
coiling of the umbilical cord. Am J Perinatol 2000;17(8):441-5.
58. Kashanian M, Akbarian A, Kouhpayehzadeh J. The umbilical coiling index and
adverse perinatal outcome. Int J Gynaecol Obstet 2006;95(1):8-13.
59. van Diik CC, Franx A, de Laat MW, Bruinse HW, Visser GH, Nikkels PG. The
umbilical coiling index in normal pregnancy. J Matern Fetal Neonatal Med
2002;11(4):280-3.
60. Degani S, Lewinsky RM, Berger H, Spiegel D. Sonographic estimation of
umbilical coiling index and correlation with Doppler flow characteristics. Obstet
Gynecol 1995;86(6):990-3.
61. Challis DE, Warren PS, Gill RW. The significance of high umbilical venous
blood flow measurements in a high-risk population. J Ultrasound Med
1995;14(12):907-12.
62. Reynolds SR. Mechanisms of placentofetal blood flow. Obstet Gynecol
1978;51(2):245-9.

REFERENCES
Page | 182
63. de Laat MW, van Alderen ED, Franx A, Visser GH, Bots ML, Nikkels PG. The
umbilical coiling index in complicated pregnancy. Eur J Obstet Gynecol Reprod
Biol 2007;130(1):66-72.
64. Brody S, Frenkel DA. Marginal insertion of the cord and premature labor. Am J
Obstet Gynecol 1953;65(6):1305-12.
65. Hathout H. The Vascular Pattern and Mode of Insertion of the Umbilical Cord in
Abortion Material. J Obstet Gynaecol Br Commonw 1964;71:963-4.
66. Monie IW. Velamentous Insertion of the Cord in Early Pregnancy. Am J Obstet
Gynecol 1965;93:276-81.
67. McLennan JE. Implications of the eccentricity of the human umbilical cord. Am J
Obstet Gynecol 1968;101(8):1124-30.
68. Benirschke K, Kaufmann, P. The Pathology of the Human Placenta. 3rd ed,
1995.
69. Robinson LK, Jones KL, Benirschke K. The nature of structural defects
associated with velamentous and marginal insertion of the umbilical cord. Am J
Obstet Gynecol 1983;146(2):191-3.
70. Scott JS. Placenta extrachorialis (placenta marginata and placenta circumvallata).
J Obstet Gynaecol Br Emp 1960;67:904-18.
71. Raaflaub W. [On the causality of umbilical cord complications.]. Gynaecologia
1959;148:145-8.
72. Liu CC, Pretorius DH, Scioscia AL, Hull AD. Sonographic prenatal diagnosis of
marginal placental cord insertion: clinical importance. J Ultrasound Med
2002;21(6):627-32.

REFERENCES
Page | 183
73. Eddleman KA, Lockwood CJ, Berkowitz GS, Lapinski RH, Berkowitz RL.
Clinical significance and sonographic diagnosis of velamentous umbilical cord
insertion. Am J Perinatol 1992;9(2):123-6.
74. Heinonen S, Ryynanen M, Kirkinen P, Saarikoski S. Perinatal diagnostic
evaluation of velamentous umbilical cord insertion: clinical, Doppler, and
ultrasonic findings. Obstet Gynecol 1996;87(1):112-7.
75. Heifetz SA. Pathology of the umbilical cord. Pathology of the Placenta. 2nd ed:
New York: Churchill Livingstone, 1999:107-35.
76. Heinonen S, Ryynanen M, Kirkinen P, Saarikoski S. Velamentous umbilical cord
insertion may be suspected from maternal serum alpha-fetoprotein and hCG. Br J
Obstet Gynaecol 1996;103(3):209-13.
77. www.cleavebooks.co.uk/scol/callipse.htm. Cleave Books. The Ellipses
Calculator, 2004.
78. Davey DA, MacGillivray I. The classification and definition of the hypertensive
disorders of pregnancy. Am J Obstet Gynecol 1988;158(4):892-8.
79. Brown MA, Lindheimer MD, de Swiet M, Van Assche A, Moutquin JM. The
classification and diagnosis of the hypertensive disorders of pregnancy: statement
from the International Society for the Study of Hypertension in Pregnancy
(ISSHP). Hypertens Pregnancy 2001;20(1):IX-XIV.
80. WHO. World Health Organisation/International Diabetes Federation, Definition
and Diagnosis of Diabetes mellitus and Intermediate Hyperglycemia., 2006.
81. http://www.healthforallchildren.co.uk/. Four-In-One (Decimal) Growth Charts
(Birth-20 YRS). London: Child Growth Foundation 1996/1.
82. Bland JM, Altman DG. Statistical methods for assessing agreement between two
methods of clinical measurement. Lancet 1986;1(8476):307-10.

REFERENCES
Page | 184
83. Bland JM, Altman DG. Measurement error and correlation coefficients. BMJ
1996;313(7048):41-2.
84. Coall DA, Charles AK, Salafia CM. Gross Placental Structure in a Low-Risk
Population of Singleton, Term, First-Born Infants. Pediatr Dev Pathol 2008:1.
85. Breeze AC, Gallagher FA, Lomas DJ, Smith GC, Lees CC. Postmortem fetal
organ volumetry using magnetic resonance imaging and comparison to organ
weights at conventional autopsy. Ultrasound Obstet Gynecol 2008;31(2):187-93.
86. Noguchi M, Kikuchi H, Ishibashi M, Noda S. Percentage of the positive area of
bone metastasis is an independent predictor of disease death in advanced prostate
cancer. Br J Cancer 2003;88(2):195-201.
87. Yamamoto T, Takiwaki H, Arase S, Ohshima H. Derivation and clinical
application of special imaging by means of digital cameras and Image J freeware
for quantification of erythema and pigmentation. Skin Res Technol 2008;14(1):26-
34.
88. Dello SA, van Dam RM, Slangen JJ, van de Poll MC, Bemelmans MH, Greve
JW, et al. Liver volumetry plug and play: do it yourself with ImageJ. World J Surg
2007;31(11):2215-21.
89. Viero S, Chaddha V, Alkazaleh F, Simchen MJ, Malik A, Kelly E, et al.
Prognostic value of placental ultrasound in pregnancies complicated by absent
end-diastolic flow velocity in the umbilical arteries. Placenta 2004;25(8-9):735-
41.
90. Whittle W, Chaddha V, Wyatt P, Huppertz B, Kingdom J. Ultrasound detection
of placental insufficiency in women with 'unexplained' abnormal maternal serum
screening results. Clin Genet 2006;69(2):97-104.
91. G Rath, Garg K, Sood M. Insertion of umbilical cord on the placenta in
hypertensive mothers. Journal of Anatomical Society of India 2000;49:149-52.

REFERENCES
Page | 185
92. Yampolsky M, Salafia CM, Shlakhter O, Haas D, Eucker B, Thorp J. Centrality
of the umbilical cord insertion in a human placenta influences the placental
efficiency. Placenta 2009;30(12):1058-64.
93. Barker DJ, Thornburg KL, Osmond C, Kajantie E, Eriksson JG. The surface area
of the placenta and hypertension in the offspring in later life. Int J Dev Biol
2010;54(2-3):525-30.
94. Kajantie E, Thornburg KL, Eriksson JG, Osmond C, Barker DJ. In preeclampsia,
the placenta grows slowly along its minor axis. Int J Dev Biol 2010;54(2-3):469-
73.
95. Pathak S, Jessop F, Hook L, Sebire NJ, Lees CC. Placental weight, digitally
derived placental dimensions at term and their relationship to birth weight. J
Matern Fetal Neonatal Med 2010.
96. Ezimokhai M, Rizk DE, Thomas L. Abnormal vascular coiling of the umbilical
cord in gestational diabetes mellitus. Arch Physiol Biochem 2001;109(3):209-14.
97. Chaddha V, Viero S, Huppertz B, Kingdom J. Developmental biology of the
placenta and the origins of placental insufficiency. Semin Fetal Neonatal Med
2004;9(5):357-69.
98. Craven CM, Zhao L, Ward K. Lateral placental growth occurs by trophoblast cell
invasion of decidual veins. Placenta 2000;21(2-3):160-9.
99. Lemtis H, Hadrich G. [On the decrease of the placental weight following delivery
and its implication for the relationship between placental and neonatal weight
(author's transl)]. Geburtshilfe Frauenheilkd 1974;34(8):618-22.
100. Sivarao S, Vidyadaran MK, Jammal AB, Zainab S, Goh YM, Ramesh KN.
Weight, volume and surface area of placenta of normal pregnant women and their
relation to maternal and neonatal parameters in Malay, Chinese and Indian ethnic
groups. Placenta 2002;23(8-9):691-6.

REFERENCES
Page | 186
101. Naeye RL. Do placental weights have clinical significance? Hum Pathol
1987;18(4):387-91.
102. Heinonen S, Taipale P, Saarikoski S. Weights of placentae from small-for-
gestational age infants revisited. Placenta 2001;22(5):399-404.
103. Thompson JM, Irgens LM, Skjaerven R, Rasmussen S. Placenta weight
percentile curves for singleton deliveries. BJOG 2007;114(6):715-20.
104. Senecal J, Kerisit J, Defawe G, Lefrancois MC, Fisselier MP, Grall JY, et al. [A
study of the weight of the placenta in normal and pathological pregnancies
(author's transl)]. J Gynecol Obstet Biol Reprod (Paris) 1980;9(5):531-6.
105. Jaya DS, Kumar NS, Bai LS. Anthropometric indices, cord length and placental
weight in newborns. Indian Pediatr 1995;32(11):1183-8.
106. Molteni RA, Stys SJ, Battaglia FC. Relationship of fetal and placental weight in
human beings: fetal/placental weight ratios at various gestational ages and birth
weight distributions. J Reprod Med 1978;21(5):327-34.
107. Nummi S. Relative weight of the placenta and perinatal mortali ty. A
retrospective clinical and statistical analysis. Acta Obstet Gynecol Scand Suppl
1972;17:1-69.
108. Godfrey KM, Redman CW, Barker DJ, Osmond C. The effect of maternal
anaemia and iron deficiency on the ratio of fetal weight to placental weight. Br J
Obstet Gynaecol 1991;98(9):886-91.
109. Beischer NA, Sivasamboo R, Vohra S, Silpisornkosal S, Reid S. Placental
hypertrophy in severe pregnancy anaemia. J Obstet Gynaecol Br Commonw
1970;77(5):398-409.
110. Barker DJ, Bull AR, Osmond C, Simmonds SJ. Fetal and placental size and risk
of hypertension in adult life. BMJ 1990;301(6746):259-62.

REFERENCES
Page | 187
111. Larfors G, Lambert PC, Lambe M, Ekbom A, Cnattingius S. Placental weight
and breast cancer survival in young women. Cancer Epidemiol Biomarkers Prev
2009;18(3):777-83.
112. Kabir N, Kawser CA, Rahman F, Kabir ML, Rahman A. The relationship of
placental weight with birth weight. Mymensingh Med J 2007;16(2):177-80.
113. Williams LA, Evans SF, Newnham JP. Prospective cohort study of factors
influencing the relative weights of the placenta and the newborn infant. BMJ
1997;314(7098):1864-8.
114. Kraus FT, Redline RW, Gersell DJ. AFIP atlas of nontumour pathology:
placental pathology. American Registry of Pathology. Washington, DC, 2004.
115. Faye-Peterson OM, S.Debra H, Joshi V. Handbook of placental pathology. New
York: Informa Healthcare., 2006.
116. Salafia CM, Zhang J, Miller RK, Charles AK, Shrout P, Sun W. Placental
growth patterns affect birth weight for given placental weight. Birth Defects Res A
Clin Mol Teratol 2007;79(4):281-8.
117. Fox H, Sebire NJ. Pathology of the Placenta. London, UK: W.B.Saunders
Company, 2007.
118. Eskild A, Romundstad PR, Vatten LJ. Placental weight and birthweight: does
the association differ between pregnancies with and without preeclampsia? Am J
Obstet Gynecol 2009;201(6):595 e1-5.
119. Gersell DJ, Phillips NJ, Beckerman K. Chronic chorioamnionitis: a
clinicopathologic study of 17 cases. Int J Gynecol Pathol 1991;10(3):217-29.
120. Jacques SM, Qureshi F. Chronic chorioamnionitis: a clinicopathologic and
immunohistochemical study. Hum Pathol 1998;29(12):1457-61.

REFERENCES
Page | 188
121. Chellam VG, Rushton DI. Chorioamnionitis and funiculitis in the placentas of
200 births weighing less than 2.5 kg. Br J Obstet Gynaecol 1985;92(8):808-14.
122. Romero R, Salafia CM, Athanassiadis AP, Hanaoka S, Mazor M, Sepulveda W,
et al. The relationship between acute inflammatory lesions of the preterm placenta
and amniotic fluid microbiology. Am J Obstet Gynecol 1992;166(5):1382-8.
123. Aquino TI, Zhang J, Kraus FT, Knefel R, Taff T. Subchorionic fibrin cultures
for bacteriologic study of the placenta. Am J Clin Pathol 1984;81(4):482-6.
124. Pankuch GA, Appelbaum PC, Lorenz RP, Botti JJ, Schachter J, Naeye RL.
Placental microbiology and histology and the pathogenesis of chorioamnionitis.
Obstet Gynecol 1984;64(6):802-6.
125. Gugino LJ, Buerger PT, Wactawski-Wende J, Fisher J. Chorioamnionitis: the
association between clinical and histological diagnosis. Prim Care Update Ob
Gyns 1998;5(4):148.
126. Redline RW, Wilson-Costello D, Borawski E, Fanaroff AA, Hack M. The
relationship between placental and other perinatal risk factors for neurologic
impairment in very low birth weight children. Pediatr Res 2000;47(6):721-6.
127. Smulian JC, Shen-Schwarz S, Vintzileos AM, Lake MF, Ananth CV. Clinical
chorioamnionitis and histologic placental inflammation. Obstet Gynecol
1999;94(6):1000-5.
128. Hillier SL, Martius J, Krohn M, Kiviat N, Holmes KK, Eschenbach DA. A case-
control study of chorioamnionic infection and histologic chorioamnionitis in
prematurity. N Engl J Med 1988;319(15):972-8.
129. Svensson L, Ingemarsson I, Mardh PA. Chorioamnionitis and the isolation of
microorganisms from the placenta. Obstet Gynecol 1986;67(3):403-9.

REFERENCES
Page | 189
130. Zhang JM, Kraus FT, Aquino TI. Chorioamnionitis: a comparative histologic,
bacteriologic, and clinical study. Int J Gynecol Pathol 1985;4(1):1-10.
131. Hillier SL, Witkin SS, Krohn MA, Watts DH, Kiviat NB, Eschenbach DA. The
relationship of amniotic fluid cytokines and preterm delivery, amniotic fluid
infection, histologic chorioamnionitis, and chorioamnion infection. Obstet
Gynecol 1993;81(6):941-8.
132. Wentworth P. The Incidence and Significance of Intervillous Thrombi in the
Human Placenta. J Obstet Gynaecol Br Commonw 1964;71:894-8.
133. Becroft DM, Thompson JM, Mitchell EA. Placental infarcts, intervillous fibrin
plaques, and intervillous thrombi: incidences, cooccurrences, and epidemiological
associations. Pediatr Dev Pathol 2004;7(1):26-34.
134. Fujikura T, Sho S. Placental cavities. Obstet Gynecol 1997;90(1):112-6.
135. Renaer M, Van de Putte I, Vermylen C. Massive feto-maternal hemorrhage as a
cause of perinatal mortality and morbidity. Eur J Obstet Gynecol Reprod Biol
1976;6(3):125-40.
136. Knox WF, Fox H. Villitis of unknown aetiology: its incidence and significance
in placentae from a British population. Placenta 1984;5(5):395-402.
137. Altshuler G, Hyde SR. Clinicopathologic implications of placental pathology.
Clin Obstet Gynecol 1996;39(3):549-70.
138. Becroft DM, Thompson JM, Mitchell EA. Placental villitis of unknown origin:
epidemiologic associations. Am J Obstet Gynecol 2005;192(1):264-71.
139. Labarrere CA, McIntyre JA, Faulk WP. Immunohistologic evidence that villitis
in human normal term placentas is an immunologic lesion. Am J Obstet Gynecol
1990;162(2):515-22.

REFERENCES
Page | 190
140. Redline RW, O'Riordan MA. Placental lesions associated with cerebral palsy
and neurologic impairment following term birth. Arch Pathol Lab Med
2000;124(12):1785-91.
141. Redline RW. Villitis of unknown etiology: noninfectious chronic villitis in the
placenta. Hum Pathol 2007;38(10):1439-46.
142. Russell P, Atkinson K, Krishnan L. Recurrent reproductive failure due to severe
placental villitis of unknown etiology. J Reprod Med 1980;24(2):93-8.
143. Redline RW, Patterson P. Patterns of placental injury. Correlations with
gestational age, placental weight, and clinical diagnoses. Arch Pathol Lab Med
1994;118(7):698-701.
144. Oliveira LH, Xavier CC, Lana AM. [Changes in placental morphology of small
for gestational age newborns]. J Pediatr (Rio J) 2002;78(5):397-402.
145. Salafia CM, Minior VK, Lopez-Zeno JA, Whittington SS, Pezzullo JC,
Vintzileos AM. Relationship between placental histologic features and umbilical
cord blood gases in preterm gestations. Am J Obstet Gynecol 1995;173(4):1058-
64.
146. Dahms BB, Boyd T, Redline RW. Severe perinatal liver disease associated with
fetal thrombotic vasculopathy. Pediatr Dev Pathol 2002;5(1):80-5.
147. Ernst LM, Grossman AB, Ruchelli ED. Familial perinatal liver disease and fetal
thrombotic vasculopathy. Pediatr Dev Pathol 2008;11(2):160-3.
148. McDonald DG, Kelehan P, McMenamin JB, Gorman WA, Madden D, Tobbia
IN, et al. Placental fetal thrombotic vasculopathy is associated with neonatal
encephalopathy. Hum Pathol 2004;35(7):875-80.

REFERENCES
Page | 191
149. Kraus FT, Acheen VI. Fetal thrombotic vasculopathy in the placenta: cerebral
thrombi and infarcts, coagulopathies, and cerebral palsy. Hum Pathol
1999;30(7):759-69.
150. Redline RW, Pappin A. Fetal thrombotic vasculopathy: the clinical significance
of extensive avascular villi. Hum Pathol 1995;26(1):80-5.
151. Katzman PJ, Genest DR. Maternal floor infarction and massive perivillous
fibrin deposition: histological definitions, association with intrauterine fetal
growth restriction, and risk of recurrence. Pediatr Dev Pathol 2002;5(2):159-64.
152. Svensson AM, Waters BL, Laszik ZG, Simmons-Arnold L, Goodwin A, Beatty
BG, et al. The protein C system in placental massive perivillous fibrin deposition.
Blood Coagul Fibrinolysis 2004;15(6):491-5.
153. Sebire NJ, Backos M, Goldin RD, Regan L. Placental massive perivillous fibrin
deposition associated with antiphospholipid antibody syndrome. BJOG
2002;109(5):570-3.
154. Andres RL, Kuyper W, Resnik R, Piacquadio KM, Benirschke K. The
association of maternal floor infarction of the placenta with adverse perinatal
outcome. Am J Obstet Gynecol 1990;163(3):935-8.
155. Bane AL, Gillan JE. Massive perivillous fibrinoid causing recurrent placental
failure. BJOG 2003;110(3):292-5.
156. Naeye RL. Maternal floor infarction. Hum Pathol 1985;16(8):823-8.
157. Khong TY, Staples A, Moore L, Byard RW. Observer reliability in assessing
villitis of unknown aetiology. J Clin Pathol 1993;46(3):208-10.
158. Fox H. Thrombosis of foetal arteries in the human placenta. J Obstet Gynaecol
Br Commonw 1966;73(6):961-5.

REFERENCES
Page | 192
159. Zhang P, Schmidt M, Cook L. Maternal vasculopathy and histologic diagnosis
of preeclampsia: poor correlation of histologic changes and clinical manifestation.
Am J Obstet Gynecol 2006;194(4):1050-6.
160. Roberts DJ, Post MD. The placenta in pre-eclampsia and intrauterine growth
restriction. J Clin Pathol 2008;61(12):1254-60.
161. Kanfer A, Bruch JF, Nguyen G, He CJ, Delarue F, Flahault A, et al. Increased
placental antifibrinolytic potential and fibrin deposits in pregnancy-induced
hypertension and preeclampsia. Lab Invest 1996;74(1):253-8.
162. Fox H. Pathology of the placenta in maternal diabetes mellitus. Obstet Gynecol
1969;34(6):792-8.
163. Jones CJ, Fox H. Placental changes in gestational diabetes. An ultrastructural
study. Obstet Gynecol 1976;48(3):274-80.
164. Daskalakis G, Marinopoulos S, Krielesi V, Papapanagiotou A, Papantoniou N,
Mesogitis S, et al. Placental pathology in women with gestational diabetes. Acta
Obstet Gynecol Scand 2008;87(4):403-7.
165. Labarrere C, Althabe O. Chronic villitis of unknown etiology and maternal
arterial lesions in preeclamptic pregnancies. Eur J Obstet Gynecol Reprod Biol
1985;20(1):1-11.
166. Salafia CM, Pezzullo JC, Lopez-Zeno JA, Simmens S, Minior VK, Vintzileos
AM. Placental pathologic features of preterm preeclampsia. Am J Obstet Gynecol
1995;173(4):1097-105.
167. Altemani AM, Gonzatti AR. [Villitis of unknown etiology in placentas of
pregnancies with hypertensive disorders and of small-for-gestational-age infants].
Rev Assoc Med Bras 2003;49(1):67-71.

REFERENCES
Page | 193
168. Baldwin VJ. Morphologic pathology of fetomaternal interaction. Contrib
Gynecol Obstet 1982;9:1-16.
169. Magee JF. Investigation of stillbirth. Pediatr Dev Pathol 2001;4(1):1-22.
170. Redline RW. Severe fetal placental vascular lesions in term infants with
neurologic impairment. Am J Obstet Gynecol 2005;192(2):452-7.
171. Nordenvall M, Ullberg U, Laurin J, Lingman G, Sandstedt B, Ulmsten U.
Placental morphology in relation to umbilical artery blood velocity waveforms.
Eur J Obstet Gynecol Reprod Biol 1991;40(3):179-90.
172. Costa SL, Proctor L, Dodd JM, Toal M, Okun N, Johnson JA, et al. Screening
for placental insufficiency in high-risk pregnancies: is earlier better? Placenta
2008;29(12):1034-40.
173. Risnes KR, Romundstad PR, Nilsen TI, Eskild A, Vatten LJ. Placental weight
relative to birth weight and long-term cardiovascular mortality: findings from a
cohort of 31,307 men and women. Am J Epidemiol 2009;170(5):622-31.
174. Perry IJ, Beevers DG, Whincup PH, Bareford D. Predictors of ratio of placental
weight to fetal weight in multiethnic community. BMJ 1995;310(6977):436-9.
175. Russell P. Inflammatory lesions of the human placenta. III. The histopathology
of villitis of unknown aetiology. Placenta 1980;1(3):227-44.
176. Redline RW, Abramowsky CR. Clinical and pathologic aspects of recurrent
placental villitis. Hum Pathol 1985;16(7):727-31.
177. Brocklehurst P. Infection and preterm delivery. BMJ 1999;318(7183):548-9.
178. Gibbs RS, Romero R, Hillier SL, Eschenbach DA, Sweet RL. A review of
premature birth and subclinical infection. Am J Obstet Gynecol 1992;166(5):1515-
28.

REFERENCES
Page | 194
179. Romero R, Mazor M, Wu YK, Sirtori M, Oyarzun E, Mitchell MD, et al.
Infection in the pathogenesis of preterm labor. Semin Perinatol 1988;12(4):262-
79.
180. Goldenberg RL, Hauth JC, Andrews WW. Intrauterine infection and preterm
delivery. N Engl J Med 2000;342(20):1500-7.
181. Gomez R, Romero R, Ghezzi F, Yoon BH, Mazor M, Berry SM. The fetal
inflammatory response syndrome. Am J Obstet Gynecol 1998;179(1):194-202.
182. Romero R, Gomez R, Ghezzi F, Yoon BH, Mazor M, Edwin SS, et al. A fetal
systemic inflammatory response is followed by the spontaneous onset of preterm
parturition. Am J Obstet Gynecol 1998;179(1):186-93.
183. Yoon BH, Romero R, Park JS, Kim CJ, Kim SH, Choi JH, et al. Fetal exposure
to an intra-amniotic inflammation and the development of cerebral palsy at the age
of three years. Am J Obstet Gynecol 2000;182(3):675-81.
184. Yoon BH, Romero R, Kim KS, Park JS, Ki SH, Kim BI, et al. A systemic fetal
inflammatory response and the development of bronchopulmonary dysplasia. Am
J Obstet Gynecol 1999;181(4):773-9.

APPENDICES

APPENDIX 1: GESTATIONAL AGE AT DELIVERY
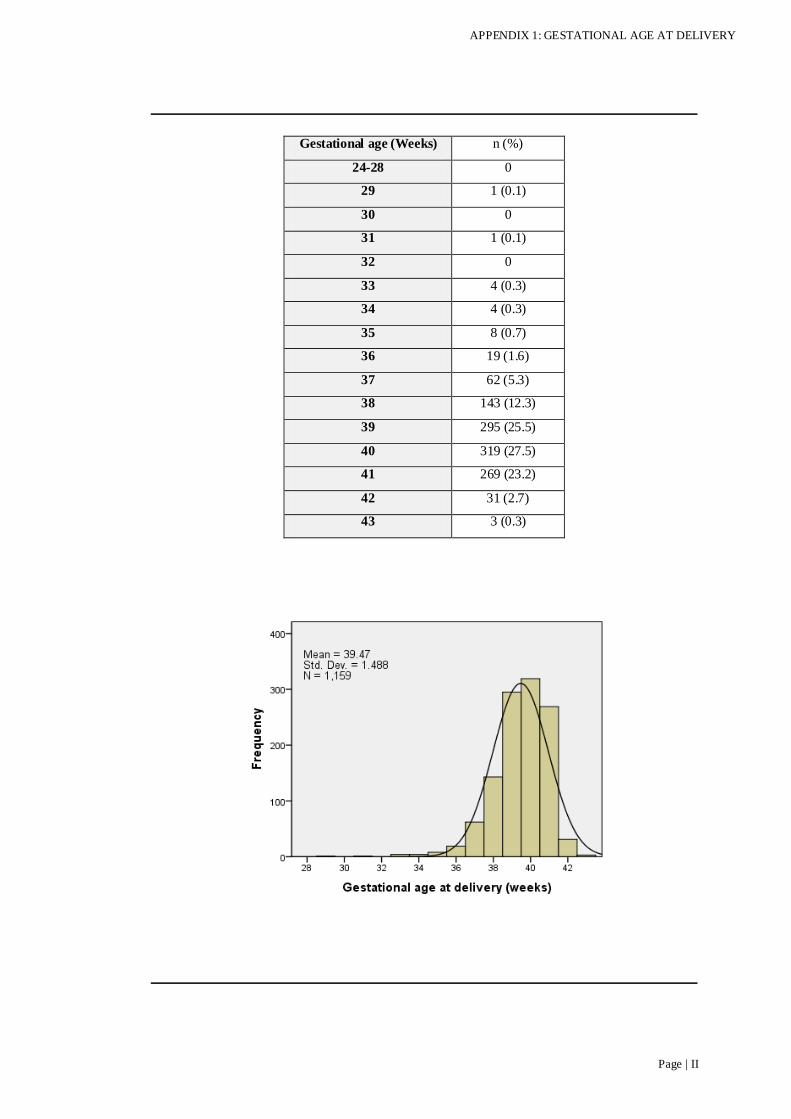
APPENDIX 1: GESTATIONAL AGE AT DELIVERY
Page | II
Gestational age (Weeks) n (%)
24-28 0
29 1 (0.1)
30 0
31 1 (0.1)
32 0
33 4 (0.3)
34 4 (0.3)
35 8 (0.7)
36 19 (1.6)
37 62 (5.3)
38 143 (12.3)
39 295 (25.5)
40 319 (27.5)
41 269 (23.2)
42 31 (2.7)
43 3 (0.3)

APPENDIX 2: ETHICS APPROVAL LETTER

APPENDIX 2: ETHICS APPROVAL LETTER
Page | IV

APPENDIX 2: ETHICS APPROVAL LETTER
Page | V

APPENDIX 3: STUDY INFORMATION FORM

APPENDIX 3: STUDY INFORMATION FORM
Page | VII

APPENDIX 3: STUDY INFORMATION FORM
Page | VIII

APPENDIX 4: CONSENT FORM

APPENDIX 4: CONSENT FORM
Page | X

APPENDIX 5: STUDY POSTER

APPENDIX 5: STUDY POSTER
Page | XII

APPENDIX 6: INSTRUCTIONS TO MIDWIVES

APPENDIX 6: INSTRUCTIONS TO MIDWIVES
Page | XIV

APPENDIX 7: PATHOLOGY FORM DEFINING STUDY
INCLUSIONS

APPENDIX 7: PATHOLOGY FORM
Page | XVI

APPENDIX 7: PATHOLOGY FORM
Page | XVII

APPENDIX 8: COMMUNICATION LETTERS TO LREC
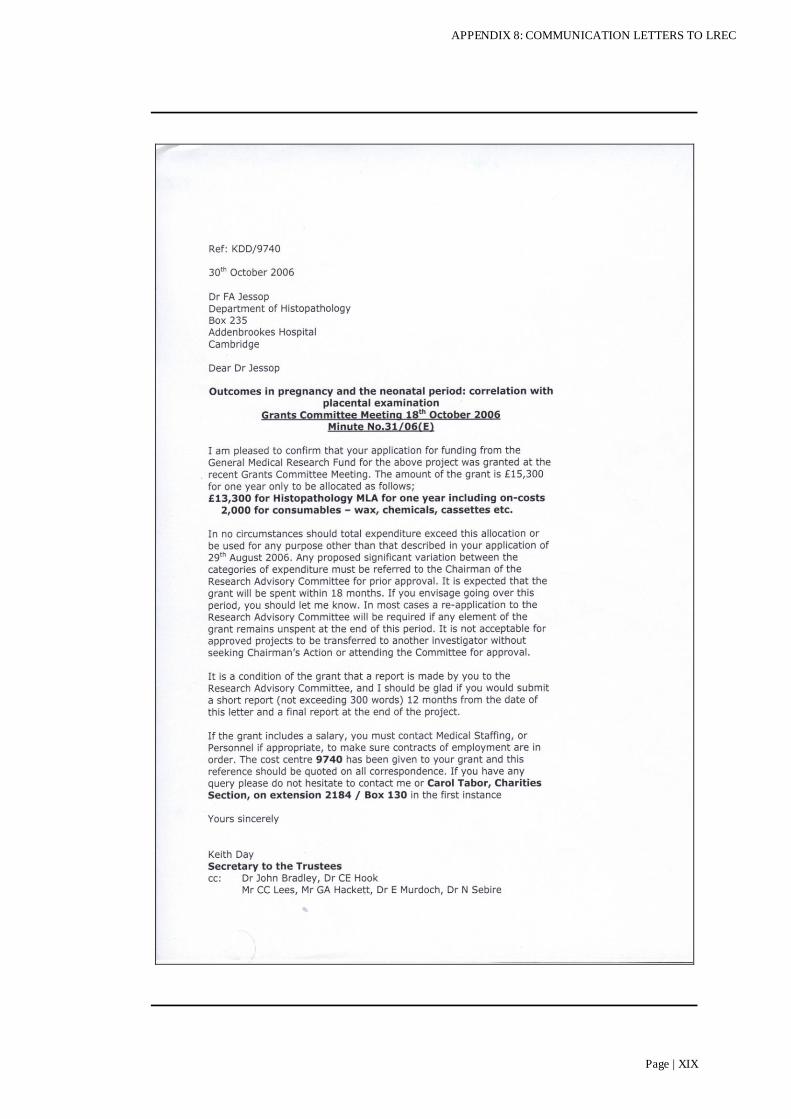
APPENDIX 8: COMMUNICATION LETTERS TO LREC
Page | XIX

APPENDIX 8: COMMUNICATION LETTERS TO LREC
Page | XX

APPENDIX 8: COMMUNICATION LETTERS TO LREC
Page | XXI

APPENDIX 8: COMMUNICATION LETTERS TO LREC
Page | XXII