Morning Insight - 25 May 2016 - kotaksecurities.com · MAY 25, 2016 Economy News As the country...
23
MAY 25, 2016 Economy News As the country awaits the arrival of the southwest monsoon after two years of drought, private weather forecasting agency Skymet on Tuesday revised upward its 2016 southwest monsoon forecast to 109 per cent of the long period average (LPA) from 105 predicted in April.(BS) A day after New-Delhi-based Centre for Science and Environment (CSE)'s report on the presence of high levels of cancer-causing additives in white bread, pav, bun and pizza bread, the country's apex body of bread manufacturers said it would seek a meeting with the Food Safety and Standards Authority of India (FSSAI) to explain their position. (BS) The Left Democratic government, which will assume office on Wednesday, is set to review the erstwhile Oommen Chandy regime's contentious liquor-restriction policy, including closure of more than 400 bars across the state. Finance minister designate Thomas Isaac told ET over phone from Thiruvananthapuram that the outgoing UDF regime's decision has "adversely affected the tourism sector," led to "rampant use of drugs" by the people and, hence, he favoured "a review of the liquor policy." (ET) In the face of growing protest from workers and the middle class, the Union labour ministry on Tuesday indicated it will go slow on labour reforms and changed the narrative of labour reform from employer- centric to employee-centric. (Mint) Corporate News In a move to strengthen its research & development (R&D), India's largest car maker Maruti Suzuki India (MSIL) plans to use 40 per cent of its proposed capex of Rs 44 Bn for the current financial year for new product development. Part of the investment will go towards the new, Rs 20 Bn R&D and testing centre at Rohtak in Haryana. The capex in 2015-16 was Rs 24 Bn. (BS) With intense speculation on which of the seven bidders will make the cut to acquire Tata Steel's loss-making assets in Britain, UK business secretary Sajid Javid met Tata Sons chairman Cyrus Mistry Mumbai on Tuesday. (BS) Tech Mahindra has become the third entity to announce it was surrendering its payments bank licence. Pressure on profitability is supposed to be one of the key reasons for surrendering the licence. (BS) Taking a step towards cleaning up its balance sheet, the Punjab National Bank (PNB) has identified 53 corporate non-performing loans worth Rs 6,300 crore for sale to asset reconstruction companies (ARCs). (BS) Private sector lender Axis Bank on Tuesday said it has raised $500 million from global investors by selling its maiden green bonds. The final pricing for the issue came in at 1.60 per cent over the US treasury, which was 0.15 per cent lower than what was targeted by the bank, making it the lowest spread for a US dollar benchmark bond issue by a domestic bank since the Lehman crisis, the bank said in a statement here. (BS) Sebi on Tuesday barred Ruchi Soya Industries and National Steel and Agro Industries from the securities market for alleged fraudulent and manipulative in trading in castor seeds at the NCDEX. (Mint) Equity % Chg 24 May 16 1 Day 1 Mth 3 Mths Indian Indices SENSEX Index 25,305 0.3 (1.5) 10.1 NIFTY Index 7,749 0.2 (1.4) 11.2 BANKEX Index 18,703 0.3 (1.6) 21.3 SPBSITIP Index 11,075 (0.3) (2.6) 6.5 BSETCG INDEX 12,902 (0.3) (3.4) 13.8 BSEOIL INDEX 8,913 (1.0) (4.9) 7.2 CNXMcap Index 12,866 (0.5) (2.3) 11.5 SPBSSIP Index 10,852 (0.6) (1.7) 13.1 World Indices Dow Jones 17,706 1.2 (1.5) 6.0 Nasdaq 4,861 2.0 (0.7) 6.1 FTSE 6,219 1.3 (0.7) 3.4 NIKKEI 16,499 (0.9) (3.7) 4.1 HANGSENG 19,830 0.1 (4.5) 7.7 Value traded (Rs cr) 24 May 16 % Chg - Day Cash BSE 2,497 28.9 Cash NSE 15,172 3.9 Derivatives 369,988.6 (7.8) Net inflows (Rs cr) 23 May 16 % Chg MTD YTD FII (36) (95) 1,083 12,873 Mutual Fund 15 (96) 3,773 6,370 FII open interest (Rs cr) 23 May 16 % Chg FII Index Futures 17,266 9.5 FII Index Options 71,666 (0.0) FII Stock Futures 51,607 2.4 FII Stock Options 5,139 6.3 Advances / Declines (BSE) 24 May 16 A B T Total % total Advances 129 301 29 459 30 Declines 165 825 30 1,020 67 Unchanged 4 37 4 45 3 Commodity % Chg 24 May 16 1 Day 1 Mth 3 Mths Crude (US$/BBL) 49.3 1.3 15.5 49.0 Gold (US$/OZ) 1,229.0 (1.6) (0.9) (1.0) Silver (US$/OZ) 16.3 (1.0) (4.5) 7.0 Debt / forex market 24 May 16 1 Day 1 Mth 3 Mths 10 yr G-Sec yield % 7.5 7.5 7.5 7.9 Re/US$ 67.8 67.5 66.6 68.6 Sensex Source: ET = Economic Times, BS = Business Standard, FE = Financial Express, BL = Business Line, ToI: Times of India, BSE = Bombay Stock Exchange 22700 24200 25700 27200 28700 May-15 Aug-15 Nov-15 Feb-16 May-16
Transcript of Morning Insight - 25 May 2016 - kotaksecurities.com · MAY 25, 2016 Economy News As the country...

MAY 25, 2016
Economy News As the country awaits the arrival of the southwest monsoon after two
years of drought, private weather forecasting agency Skymet on Tuesdayrevised upward its 2016 southwest monsoon forecast to 109 per cent ofthe long period average (LPA) from 105 predicted in April.(BS)
A day after New-Delhi-based Centre for Science and Environment (CSE)'sreport on the presence of high levels of cancer-causing additives in whitebread, pav, bun and pizza bread, the country's apex body of breadmanufacturers said it would seek a meeting with the Food Safety andStandards Authority of India (FSSAI) to explain their position. (BS)
The Left Democratic government, which will assume office on Wednesday,is set to review the erstwhile Oommen Chandy regime's contentiousliquor-restriction policy, including closure of more than 400 bars acrossthe state. Finance minister designate Thomas Isaac told ET over phonefrom Thiruvananthapuram that the outgoing UDF regime's decision has"adversely affected the tourism sector," led to "rampant use of drugs" bythe people and, hence, he favoured "a review of the liquor policy." (ET)
In the face of growing protest from workers and the middle class, theUnion labour ministry on Tuesday indicated it will go slow on labourreforms and changed the narrative of labour reform from employer-centric to employee-centric. (Mint)
Corporate News In a move to strengthen its research & development (R&D), India's largest
car maker Maruti Suzuki India (MSIL) plans to use 40 per cent of itsproposed capex of Rs 44 Bn for the current financial year for new productdevelopment. Part of the investment will go towards the new, Rs 20 BnR&D and testing centre at Rohtak in Haryana. The capex in 2015-16 was Rs24 Bn. (BS)
With intense speculation on which of the seven bidders will make the cutto acquire Tata Steel's loss-making assets in Britain, UK businesssecretary Sajid Javid met Tata Sons chairman Cyrus Mistry Mumbai onTuesday. (BS)
Tech Mahindra has become the third entity to announce it wassurrendering its payments bank licence. Pressure on profitability issupposed to be one of the key reasons for surrendering the licence. (BS)
Taking a step towards cleaning up its balance sheet, the Punjab NationalBank (PNB) has identified 53 corporate non-performing loans worth Rs6,300 crore for sale to asset reconstruction companies (ARCs). (BS)
Private sector lender Axis Bank on Tuesday said it has raised $500 millionfrom global investors by selling its maiden green bonds. The final pricingfor the issue came in at 1.60 per cent over the US treasury, which was 0.15per cent lower than what was targeted by the bank, making it the lowestspread for a US dollar benchmark bond issue by a domestic bank since theLehman crisis, the bank said in a statement here. (BS)
Sebi on Tuesday barred Ruchi Soya Industries and National Steel andAgro Industries from the securities market for alleged fraudulent andmanipulative in trading in castor seeds at the NCDEX. (Mint)
Equity% Chg
24 May 16 1 Day 1 Mth 3 Mths
Indian IndicesSENSEX Index 25,305 0.3 (1.5) 10.1NIFTY Index 7,749 0.2 (1.4) 11.2BANKEX Index 18,703 0.3 (1.6) 21.3SPBSITIP Index 11,075 (0.3) (2.6) 6.5BSETCG INDEX 12,902 (0.3) (3.4) 13.8BSEOIL INDEX 8,913 (1.0) (4.9) 7.2CNXMcap Index 12,866 (0.5) (2.3) 11.5SPBSSIP Index 10,852 (0.6) (1.7) 13.1
World IndicesDow Jones 17,706 1.2 (1.5) 6.0Nasdaq 4,861 2.0 (0.7) 6.1FTSE 6,219 1.3 (0.7) 3.4NIKKEI 16,499 (0.9) (3.7) 4.1HANGSENG 19,830 0.1 (4.5) 7.7
Value traded (Rs cr)24 May 16 % Chg - Day
Cash BSE 2,497 28.9Cash NSE 15,172 3.9Derivatives 369,988.6 (7.8)
Net inflows (Rs cr)23 May 16 % Chg MTD YTD
FII (36) (95) 1,083 12,873Mutual Fund 15 (96) 3,773 6,370
FII open interest (Rs cr)23 May 16 % Chg
FII Index Futures 17,266 9.5FII Index Options 71,666 (0.0)FII Stock Futures 51,607 2.4FII Stock Options 5,139 6.3
Advances / Declines (BSE)24 May 16 A B T Total % total
Advances 129 301 29 459 30Declines 165 825 30 1,020 67Unchanged 4 37 4 45 3
Commodity % Chg
24 May 16 1 Day 1 Mth 3 Mths
Crude (US$/BBL) 49.3 1.3 15.5 49.0Gold (US$/OZ) 1,229.0 (1.6) (0.9) (1.0)Silver (US$/OZ) 16.3 (1.0) (4.5) 7.0
Debt / forex market24 May 16 1 Day 1 Mth 3 Mths
10 yr G-Sec yield % 7.5 7.5 7.5 7.9Re/US$ 67.8 67.5 66.6 68.6
Sensex
Source: ET = Economic Times, BS = Business Standard, FE = Financial Express,BL = Business Line, ToI: Times of India, BSE = Bombay Stock Exchange
22700
24200
25700
27200
28700
May-15 Aug-15 Nov-15 Feb-16 May-16
Kotak Securities - Private Client Research Please see the disclaimer on the last page For Private Circulation 2
MORNING INSIGHT May 25, 2016
Kotak Securities Limited has two independent equity research groups: Institutional Equities and Private Client Group. This report hasbeen prepared by the Private Client Group. The views and opinions expressed in this document may or may not match or may be contrarywith the views, estimates, rating, target price of the Institutional Equities Research Group of Kotak Securities Limited.
TATA POWER CO LTD
PRICE: RS.72 RECOMMENDATION: BUYTARGET PRICE: RS.84 FY18E P/E: 8.4X
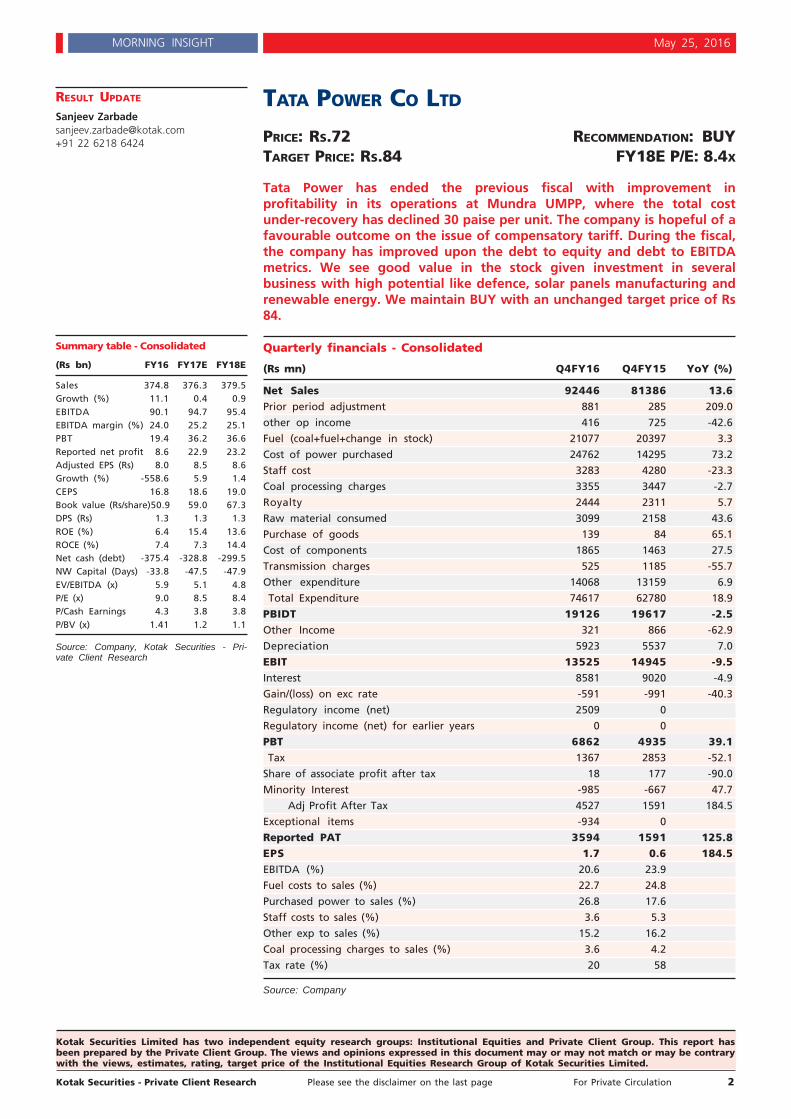
Tata Power has ended the previous fiscal with improvement inprofitability in its operations at Mundra UMPP, where the total costunder-recovery has declined 30 paise per unit. The company is hopeful of afavourable outcome on the issue of compensatory tariff. During the fiscal,the company has improved upon the debt to equity and debt to EBITDAmetrics. We see good value in the stock given investment in severalbusiness with high potential like defence, solar panels manufacturing andrenewable energy. We maintain BUY with an unchanged target price of Rs84.
Quarterly financials - Consolidated
(Rs mn) Q4FY16 Q4FY15 YoY (%)
Net Sales 92446 81386 13.6Prior period adjustment 881 285 209.0
other op income 416 725 -42.6
Fuel (coal+fuel+change in stock) 21077 20397 3.3
Cost of power purchased 24762 14295 73.2
Staff cost 3283 4280 -23.3
Coal processing charges 3355 3447 -2.7
Royalty 2444 2311 5.7
Raw material consumed 3099 2158 43.6
Purchase of goods 139 84 65.1
Cost of components 1865 1463 27.5
Transmission charges 525 1185 -55.7
Other expenditure 14068 13159 6.9
Total Expenditure 74617 62780 18.9
PBIDT 19126 19617 -2.5Other Income 321 866 -62.9
Depreciation 5923 5537 7.0
EBIT 13525 14945 -9.5Interest 8581 9020 -4.9
Gain/(loss) on exc rate -591 -991 -40.3
Regulatory income (net) 2509 0
Regulatory income (net) for earlier years 0 0
PBT 6862 4935 39.1 Tax 1367 2853 -52.1
Share of associate profit after tax 18 177 -90.0
Minority Interest -985 -667 47.7
Adj Profit After Tax 4527 1591 184.5
Exceptional items -934 0
Reported PAT 3594 1591 125.8EPS 1.7 0.6 184.5EBITDA (%) 20.6 23.9
Fuel costs to sales (%) 22.7 24.8
Purchased power to sales (%) 26.8 17.6
Staff costs to sales (%) 3.6 5.3
Other exp to sales (%) 15.2 16.2
Coal processing charges to sales (%) 3.6 4.2
Tax rate (%) 20 58
Source: Company
Summary table - Consolidated
(Rs bn) FY16 FY17E FY18E
Sales 374.8 376.3 379.5Growth (%) 11.1 0.4 0.9EBITDA 90.1 94.7 95.4EBITDA margin (%) 24.0 25.2 25.1PBT 19.4 36.2 36.6Reported net profit 8.6 22.9 23.2Adjusted EPS (Rs) 8.0 8.5 8.6Growth (%) -558.6 5.9 1.4CEPS 16.8 18.6 19.0Book value (Rs/share)50.9 59.0 67.3DPS (Rs) 1.3 1.3 1.3ROE (%) 6.4 15.4 13.6ROCE (%) 7.4 7.3 14.4Net cash (debt) -375.4 -328.8 -299.5NW Capital (Days) -33.8 -47.5 -47.9EV/EBITDA (x) 5.9 5.1 4.8P/E (x) 9.0 8.5 8.4P/Cash Earnings 4.3 3.8 3.8P/BV (x) 1.41 1.2 1.1
Source: Company, Kotak Securities - Pri-vate Client Research
RESULT UPDATE
Sanjeev [email protected]+91 22 6218 6424

Kotak Securities - Private Client Research Please see the disclaimer on the last page For Private Circulation 3
MORNING INSIGHT May 25, 2016
Standalone Performance -
Gross generation rose 5% to 2716 mu vs 2596 mu on a y-o-y basis as Trombayoperations worked well and to some extent compensated for the lower genera-tion from hydro units.
EBITDA at Rs 6.2 bn vs Rs 5.9 bn y-o-y mainly due to lower fuel costs (lower RLNGprices and higher proportion of coal-based generation) and reduction in total powerpurchased (due to lower demand as a result of reverse migration of customers inMumbai license area).
Lower other income of Rs 1.2 bn in Q4FY16 vs 2.5 bn in Q4FY15 as the previousfiscal enjoyed higher interest income from funds collected from rights issue. Thisalong with higher interest charges led to a 29% yoy drop in PBT in Q4FY16. How-ever, tax outgo was lower during the quarter due to lower provisioning. Thus, PATrose to Rs 2.78 bn vs Rs 2.1 bn yoy. The results included exceptional item of Rs 2.26bn related to diminution in value of investments in Tata Teleservices Ltd.
Coal Mines in Indonesia:Revenue from Coal mining operations increased to Rs 20.2 bn in Q4FY16 from Rs18.7 bn in Q4FY15. Realisations for the quarter stood (net of royalty) at USD 35.8per ton in Q4FY16 vs USD 39.1 per ton in Q4FY15.
Coal volumes declined 6% y-o-y to 20.3 mn ton in Q4FY16 vs 21.7 mn tons inQ4FY15.
Segment profits in Coal mining increased to Rs 2.6 bn vs Rs 2.1 bn yoy due to effi-cient coal mining operations.
CGPL (Mundra 4000 MW unit):The average realization at Mundra was Rs 2.52 per unit flattish on a qoq basis.The company sold 6.4 bn units, a marginal declined on y-o-y basis.
Coal prices have been softening in global markets which has reduced somehardship (fuel cost under-recoveries) on CGPL's operations. Taking note of this,the company had reversed impairment of Rs 23.2 bn in Q3FY16.
EBITDA for the quarter has decreased marginally to Rs 3.9 bn on a y-o-y basis due tolower generation for the quarter.
During the quarter, all five units of Mundra were under operation. PAF was high at~ 87% vs 92% in Q4FY15 (full cost recovery at 80% PAF).
PAT for the quarter stood at Rs 90 mn vs a loss of Rs 760 mn in the correspondingquarter of the previous fiscal. The total under-recovery has declined to 0.25 per unitvs 0.33 per unit on a y-o-y basis.
Maithon Unit (1050 MW): Reported improved profitsDuring the quarter, the company's Maithon unit reported revenue of Rs 5.9 bn vs Rs5.6 bn mn in the corresponding quarter of the previous fiscal.
EBITDA increased to Rs 2.2 bn vs Rs 2.1 bn in the corresponding quarter of the pre-vious fiscal.
At the PAT level, profits increased to Rs 740 mn vs Rs 570 mn in the correspondingquarter of the previous fiscal.

Kotak Securities - Private Client Research Please see the disclaimer on the last page For Private Circulation 4
MORNING INSIGHT May 25, 2016
Sum of the parts Valuation of Tata Power
SOTP Per share
Regulated returns business in Tata Power (Mum LA) 25
Jojobera 6
Maithon 9
Mundra 9
IEL 2
TPDDL 5
Bumi Resources stake 16
Powerlinks 3
Cash 3
Investments 6
Total 84
Source: Kotak Securities - Private Client Research
Other conference call highlightsThe consolidated debt stands at Rs 401 bn vs Rs 408 bn in FY15. There has beenimprovement in various metrics like debt to equity and debt to EBITDA, which is apositive.
The strategic electronics business has an order book of Rs 14.5 bn. In addition tothis, through two JVs the company has orders of Rs 100 bn to be delivered over aperiod of seven years. This business is expected to have a revenue of Rs 5.0 bn inFY16 with EBITDA margins in the range of 20-25%.
Tata Solar reported revenue of Rs 14.9 bn in FY16 vs Rs 8.7 bn in the previous fiscaldriven by strong demand for solar equipments. Loss also reduced to Rs 220 mn inFY16 vs Rs 1.1 bn in FY15.
Earnings Revision
Revision in FY17 earnings
(Rs bn) Revised Earlier
Revenue 376.00 413.00
EBITDA (%) 25.2% 23.0%
PAT 22.90 25.30
Source: Kotak Securities - Private Client Research
Maintain BUY with an unchanged target price of Rs 84The company's operations at Mundra unit is on a recovery path thanks to decline incoal prices. An favourable judgement on compensatory tariff would be additionalpositive. The company's Solar panels manufacturing business is also seeing trac-tion and should be able to generate profits in FY17, we believe. The defencebusiness has significant potential due to government's thrust on "make in India".Considering these positives, we maintain BUY on TPL given significant upsidefrom current levels.
We maintain BUY on TataPower Co Ltd with a price
target of Rs.84

Kotak Securities - Private Client Research Please see the disclaimer on the last page For Private Circulation 5
MORNING INSIGHT May 25, 2016
Kotak Securities Limited has two independent equity research groups: Institutional Equities and Private Client Group. This report hasbeen prepared by the Private Client Group. The views and opinions expressed in this document may or may not match or may be contrarywith the views, estimates, rating, target price of the Institutional Equities Research Group of Kotak Securities Limited.
GREENPLY INDUSTRIES LTD
PRICE: RS.197 RECOMMENDATION: BUYTARGET PRICE: RS.224 FY18E P/E: 15.8X
Revenues for Q4FY16 were ahead of our estimates but operating marginswitnessed a decline due to higher ad spend and decline in plywoodrealizations. Net profit performance was impacted by decline in margins andhigher tax rate for the quarter. Premium segment plywood demand is stillfacing challenges in terms of growth but mid segment has startedwitnessing traction led by individual housing demand from tier 2 and tier 3cities. Going ahead, demand environment is likely to witness animprovement led by a) increasing shift towards organized segment due tobrand, quality and warranty b) expected implementation of GST c) rawmaterial security d) strong branding and distributor network e) increaseddisposable income after implementation of OROP and VIIth Pay Commissionrecommendation. We roll forward our valuation on FY18 and arrive at arevised price target of Rs 224 on 18x P/E on FY18 estimates. (Rs 233 earlieron FY17). We continue to maintain BUY recommendation on the stock.
Financial highlights
(Rs mn) Q4FY16 Q4FY15 YoY (%)
Net Sales 4528 4290 5.5
Total Expenditure 3857 3594 7.3
EBITDA 671 697 -3.6
EBITDA margins (%) 14.8 16.2
Depreciation 125 124
EBIT 546 573 -4.7
Interest 61 84
EBT (Exc other income) 486 489 -0.7
Other Income 39 8
EBT 524 497 5.4
Tax 125 41
Tax (%) 23.9 8.3
Profit After Tax 399 456 -12.5
Extra-ordinary item 14 0
Net profit 413 456 -9.3
Equity Capital 121 121
Face Value (In Rs) 1.0 1.0
EPS (Rs) 3.3 3.8 -12.5
Source: Company
Revenue growth impacted by demand slowdownRevenues for the company reported a growth of 5.5% YoY led by 4.4% YoY im-provement in plywood division and 7.1% YoY growth in MDF division.
Plywood division sales stood at 13.4 msm comprising of 8.84 msm from own manu-factured plants while 4.57 msm from outsourcing. Capacity utilization in the ply-wood segment stood at 109% during the quarter and company expects the capacityutilization in plywood segment to move up to 115-120% for FY17. Proportion ofoutsourcing to total sales volume stood at 34% and company expects it to remainabove 30% going forward also. Average net realization of plywood decreased by1.7 % YoY to Rs 238 per sqm. Demand in plywood segment has started recoveringmarginally specifically in the mid-segment while premium segment is still goingslow.
Summary table
(Rs mn) FY16E FY17E FY18E
Sales 16,561 18,391 19,802Growth (%) 6 11 8EBITDA 2,440 2,740 2,970EBITDA margin (%) 14.7 14.9 15.0PBT 1,713 2,018 2,059Net profit 1,292 1,473 1,503EPS(Rs) 10.7 12.2 12.5Growth (%) -79 14 2CEPS (Rs) 14.8 16.3 17.1BVPS (Rs) 50.2 61.7 73.4DPS (Rs) 0.6 0.6 0.6ROE (%) 23.7 21.8 18.4ROCE (%) 22.4 23.3 19.3Net debt 2,466 2,443 5,238NW capital (Days) 71.4 71.4 71.4P/E (x) 18.4 16.1 15.8P/BV (x) 3.9 3.2 2.7EV/Sales (x) 1.6 1.4 1.4EV/EBITDA (x) 10.6 9.4 9.6
Source: Company, Kotak Securities - PrivateClient Research
RESULT UPDATE
Teena [email protected]+91 22 6218 6432
Kotak Securities - Private Client Research Please see the disclaimer on the last page For Private Circulation 6
MORNING INSIGHT May 25, 2016
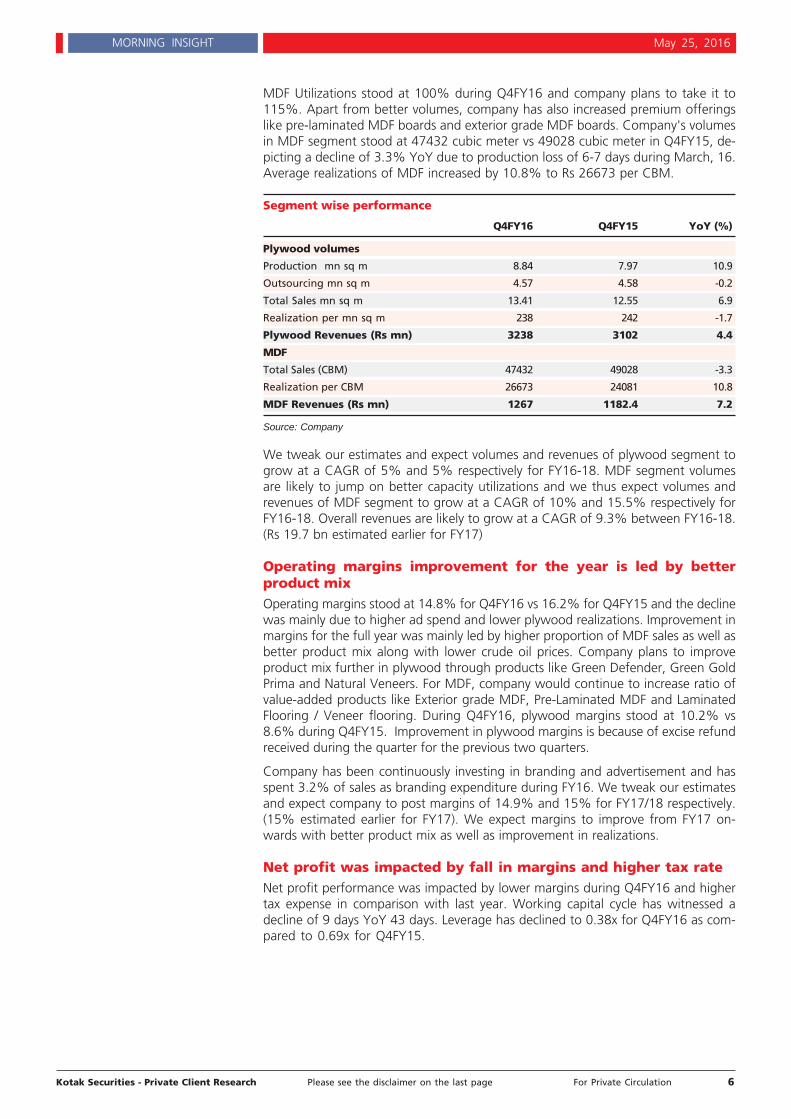
MDF Utilizations stood at 100% during Q4FY16 and company plans to take it to115%. Apart from better volumes, company has also increased premium offeringslike pre-laminated MDF boards and exterior grade MDF boards. Company's volumesin MDF segment stood at 47432 cubic meter vs 49028 cubic meter in Q4FY15, de-picting a decline of 3.3% YoY due to production loss of 6-7 days during March, 16.Average realizations of MDF increased by 10.8% to Rs 26673 per CBM.
Segment wise performance
Q4FY16 Q4FY15 YoY (%)
Plywood volumes
Production mn sq m 8.84 7.97 10.9
Outsourcing mn sq m 4.57 4.58 -0.2
Total Sales mn sq m 13.41 12.55 6.9
Realization per mn sq m 238 242 -1.7
Plywood Revenues (Rs mn) 3238 3102 4.4
MDF
Total Sales (CBM) 47432 49028 -3.3
Realization per CBM 26673 24081 10.8
MDF Revenues (Rs mn) 1267 1182.4 7.2
Source: Company
We tweak our estimates and expect volumes and revenues of plywood segment togrow at a CAGR of 5% and 5% respectively for FY16-18. MDF segment volumesare likely to jump on better capacity utilizations and we thus expect volumes andrevenues of MDF segment to grow at a CAGR of 10% and 15.5% respectively forFY16-18. Overall revenues are likely to grow at a CAGR of 9.3% between FY16-18.(Rs 19.7 bn estimated earlier for FY17)
Operating margins improvement for the year is led by betterproduct mixOperating margins stood at 14.8% for Q4FY16 vs 16.2% for Q4FY15 and the declinewas mainly due to higher ad spend and lower plywood realizations. Improvement inmargins for the full year was mainly led by higher proportion of MDF sales as well asbetter product mix along with lower crude oil prices. Company plans to improveproduct mix further in plywood through products like Green Defender, Green GoldPrima and Natural Veneers. For MDF, company would continue to increase ratio ofvalue-added products like Exterior grade MDF, Pre-Laminated MDF and LaminatedFlooring / Veneer flooring. During Q4FY16, plywood margins stood at 10.2% vs8.6% during Q4FY15. Improvement in plywood margins is because of excise refundreceived during the quarter for the previous two quarters.
Company has been continuously investing in branding and advertisement and hasspent 3.2% of sales as branding expenditure during FY16. We tweak our estimatesand expect company to post margins of 14.9% and 15% for FY17/18 respectively.(15% estimated earlier for FY17). We expect margins to improve from FY17 on-wards with better product mix as well as improvement in realizations.
Net profit was impacted by fall in margins and higher tax rateNet profit performance was impacted by lower margins during Q4FY16 and highertax expense in comparison with last year. Working capital cycle has witnessed adecline of 9 days YoY 43 days. Leverage has declined to 0.38x for Q4FY16 as com-pared to 0.69x for Q4FY15.
Kotak Securities - Private Client Research Please see the disclaimer on the last page For Private Circulation 7
MORNING INSIGHT May 25, 2016
Company is expanding its MDF capacity by 300000- 360000 CBM and hadplanned a capex of 7-7.3 Bn to be invested over FY16-FY19. (Rs 500 mn/Rs 1.5bn/Rs 4.5 bn/Rs 500 mn for FY16/17/18/19 respectively). We expect the debt toincrease by nearly Rs 2.5 bn during FY18 while it is expected to go down oncethe plant becomes operational. If company funds the incremental capex throughQIP or equity proceeds then debt requirement may be lower. During Q4FY16,company has taken a board approval for raising funds through QIP to an extentof Rs 1 bn and through non-convertible debentures/bonds upto Rs 1.75 bn. Weexpect this amount to be utilized for MDF expansion.
Company has acquired land in AP and expects to commission the plant by FY19. Itplans to cater to MDF demand from southern region through this plant. Companywould also be catering to export of MDF from this plant if domestic demand is lowerthan expectations.
Effective tax rate is likely to move up to 27-28% for FY17/18 as the tax exemptionat Uttarakhand plant is over.
We tweak our estimates and expect net profits to grow at a CAGR of 7.3% be-tween FY16-18. (Rs 1.56 bn estimated earlier for FY17).
Valuation and recommendationAt current price of Rs 197, stock is trading at 16.1x and 15.8x P/E and 9.4x and 9.6xEV/EBITDA on FY17and FY18 estimates respectively. Though plywood demand iscurrently impacted by residential slowdown as well as poor secondary sale in realestate, we expect demand to start recovering in the coming quarters led by lowerinterest rates, implementation of GST by mid-FY17, increased disposable incomeafter implementation of OROP and VIIth Pay Commission recommendation.
We roll forward our valuation on FY18 and arrive at a revised price target of Rs 224on 18x P/E on FY18 estimates. (Rs 233 earlier on FY17). We continue to maintainBUY recommendation on the stock.
We maintain BUY on GreenplyIndustries Ltd with a price target
of Rs.224
Kotak Securities - Private Client Research Please see the disclaimer on the last page For Private Circulation 8
MORNING INSIGHT May 25, 2016
Kotak Securities Limited has two independent equity research groups: Institutional Equities and Private Client Group. This report hasbeen prepared by the Private Client Group. The views and opinions expressed in this document may or may not match or may be contrarywith the views, estimates, rating, target price of the Institutional Equities Research Group of Kotak Securities Limited.
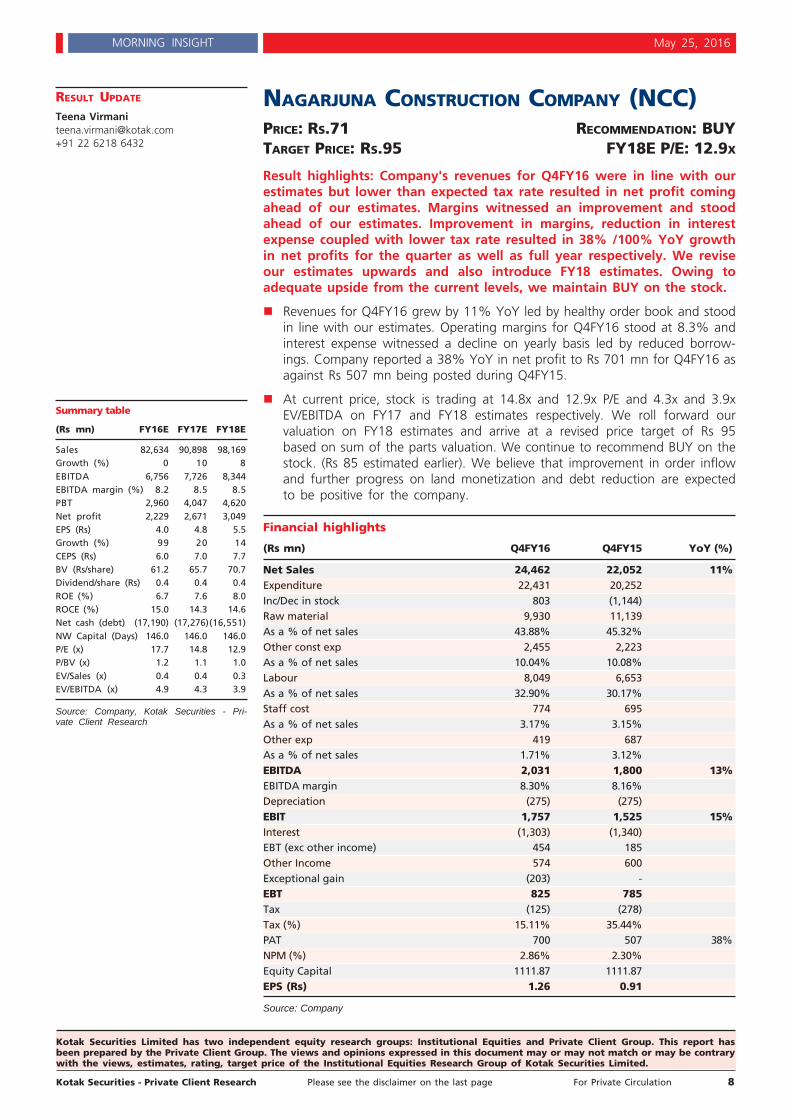
NAGARJUNA CONSTRUCTION COMPANY (NCC)PRICE: RS.71 RECOMMENDATION: BUYTARGET PRICE: RS.95 FY18E P/E: 12.9X
Result highlights: Company's revenues for Q4FY16 were in line with ourestimates but lower than expected tax rate resulted in net profit comingahead of our estimates. Margins witnessed an improvement and stoodahead of our estimates. Improvement in margins, reduction in interestexpense coupled with lower tax rate resulted in 38% /100% YoY growthin net profits for the quarter as well as full year respectively. We reviseour estimates upwards and also introduce FY18 estimates. Owing toadequate upside from the current levels, we maintain BUY on the stock.
Revenues for Q4FY16 grew by 11% YoY led by healthy order book and stoodin line with our estimates. Operating margins for Q4FY16 stood at 8.3% andinterest expense witnessed a decline on yearly basis led by reduced borrow-ings. Company reported a 38% YoY in net profit to Rs 701 mn for Q4FY16 asagainst Rs 507 mn being posted during Q4FY15.
At current price, stock is trading at 14.8x and 12.9x P/E and 4.3x and 3.9xEV/EBITDA on FY17 and FY18 estimates respectively. We roll forward ourvaluation on FY18 estimates and arrive at a revised price target of Rs 95based on sum of the parts valuation. We continue to recommend BUY on thestock. (Rs 85 estimated earlier). We believe that improvement in order inflowand further progress on land monetization and debt reduction are expectedto be positive for the company.
Financial highlights
(Rs mn) Q4FY16 Q4FY15 YoY (%)
Net Sales 24,462 22,052 11%Expenditure 22,431 20,252Inc/Dec in stock 803 (1,144)Raw material 9,930 11,139As a % of net sales 43.88% 45.32%Other const exp 2,455 2,223As a % of net sales 10.04% 10.08%Labour 8,049 6,653As a % of net sales 32.90% 30.17%Staff cost 774 695As a % of net sales 3.17% 3.15%Other exp 419 687As a % of net sales 1.71% 3.12%EBITDA 2,031 1,800 13%EBITDA margin 8.30% 8.16%Depreciation (275) (275)EBIT 1,757 1,525 15%Interest (1,303) (1,340)EBT (exc other income) 454 185Other Income 574 600Exceptional gain (203) -EBT 825 785Tax (125) (278)Tax (%) 15.11% 35.44%PAT 700 507 38%NPM (%) 2.86% 2.30%Equity Capital 1111.87 1111.87EPS (Rs) 1.26 0.91
Source: Company
Summary table
(Rs mn) FY16E FY17E FY18E
Sales 82,634 90,898 98,169Growth (%) 0 10 8EBITDA 6,756 7,726 8,344EBITDA margin (%) 8.2 8.5 8.5PBT 2,960 4,047 4,620Net profit 2,229 2,671 3,049EPS (Rs) 4.0 4.8 5.5Growth (%) 99 20 14CEPS (Rs) 6.0 7.0 7.7BV (Rs/share) 61.2 65.7 70.7Dividend/share (Rs) 0.4 0.4 0.4ROE (%) 6.7 7.6 8.0ROCE (%) 15.0 14.3 14.6Net cash (debt) (17,190) (17,276)(16,551)NW Capital (Days) 146.0 146.0 146.0P/E (x) 17.7 14.8 12.9P/BV (x) 1.2 1.1 1.0EV/Sales (x) 0.4 0.4 0.3EV/EBITDA (x) 4.9 4.3 3.9
Source: Company, Kotak Securities - Pri-vate Client Research
RESULT UPDATE
Teena [email protected]+91 22 6218 6432

Kotak Securities - Private Client Research Please see the disclaimer on the last page For Private Circulation 9
MORNING INSIGHT May 25, 2016
Revenue growth in line with our estimates
Revenue growth for the quarter stood at 11% YoY, in line with our estimates.Execution from power project has declined in line with our estimates and stoodat Rs 10.5 bn during FY16 while it stood at nearly Rs 31 bn during FY15. Execu-tion has been ramping up from other segments since past few quarters.
Current order book of company stands at Rs 176.5 bn. Order book currently isdiversified across roads, building, oil and gas (47%), water and railways (28%),irrigation (5%), electrical (5%), mining (0%), international (13%), metals (mar-ginal) and power (1%). Order inflow during FY16 stood at Rs 74 bn and companyexpects the inflow to increase going forward during the fiscal due to improve-ment in macro-economic climate. It is targeting an inflow of Rs 120 bn for thefull year FY17. Company is expecting the inflow to come largely from road EPCproject, hybrid annuity project, water supply and irrigation related project fromTelangana, building projects from AP etc. Though these projects may not be hav-ing large mobilization advances but company is expecting good margins on theseupcoming projects.
Revenues during FY16 were diversified across roads, building, oil and gas (43%),water and railways (24%), irrigation (3%), electrical (9%), mining (marginal), in-ternational (9%), metals (1%) and power (11%).
We revise our estimates upwards by 8% for FY17 to factor in improvement inexecution and expect revenues to grow at a CAGR of 9% between FY16-18.Company has given a guidance of 10% growth in revenues for FY17.
Operating margins ahead of our estimates
Operating margins for Q4FY16 stood at 8.3%, ahead of our estimates. We be-lieve that operating margins are likely to remain strong going forward as neworder inflows are coming at higher margins. We thus revise our estimates up-wards and expect operating margins of 8.5 % going forward for the company.
Net profit performance boosted by healthy margins and lower in-terest expense
Earnings of the company were boosted by reduction in interest expense coupledwith improvement in margins. During Q4FY16, NCC along with Gayatri projectssold their stake in Western UP tollway project to a Singapore based company,Cube Highways and Infrastructure for an enterprise valuation of Rs 5.75 bn.NCC's stake in the project was 51% and it had invested Rs 1.1 bn as equity cor-responding to its stake. NCC would be receiving Rs 970 mn for its stake. Alongwith this, it also sold its stake in Bangalore elevated tollway to India Infrastruc-ture Fund II, managed by IDFC alternatives Ltd at an enterprise valuation of Rs7.5 bn. NCC's stake in the project was 38% and it had invested Rs 1.6 bn asequity corresponding to its stake and company would be receiving Rs 1 bn forthis project. Company believe that the loss on equity investments in theseprojects would get compensated from the claims which it has filed with NHAIpertaining to these projects.
For power project, company has finalized the stake sale for Rs 2.77 bn for whichit received Rs 2bn in March, 2016 and remaining Rs 770 mn in April, 2016.
Company's debt stands at Rs 18.83 bn which includes Rs 16.74 bn of cash credit,Rs 1.7 bn long term loan and remaining Rs 408 mn including short term loan andmachinery loan. Interest expense has been continuously coming down in linewith debt reduction and improvement of company's rating with banks. Alongwith this, reduction in interest rates is also likely to reduce interest expense forthe company. Company expects interest expense to come down below Rs 4 bn inFy17. It also expects borrowings to come down further by Rs 2 bn by end of thefiscal 2017 led by monetization proceeds from power project and road projectstake.

Kotak Securities - Private Client Research Please see the disclaimer on the last page For Private Circulation 10
MORNING INSIGHT May 25, 2016
We revise our estimates and expect net profits of Rs 2.7 bn (Rs 2.15 bn est ear-lier) and Rs 3.05 bn for FY17 and FY18 respectively.
Valuation and recommendation
At current price, stock is trading at 14.8x and 12.9x P/E and 4.3x and 3.9x EV/EBITDA on FY17 and FY18 estimates respectively. We roll forward our valuationon FY18 estimates and arrive at a revised price target of Rs 95 based on sum ofthe parts valuation. We continue to recommend BUY on the stock. (Rs 85 ear-lier). Road BOT and power business valuation has reduced post its stake sale inwestern UP tollway, Bangalore elevated tollway and krishnapatnam powerproject.
Sum of the parts valuation
(FY18) Rs per share Rationale
Core business valuation 82 Based on 15x one year forward P/E multiple
Road BOT 4 Based on NPV and P/BV methodology
Real estate and other inv 5 Based on P/BV of 0.75x of investments
International 3
Total value per share 95
Source: Kotak Securities - Private Client Research
We recommend BUY onNagarjuna Construction
Company with a price targetof Rs.95

Kotak Securities - Private Client Research Please see the disclaimer on the last page For Private Circulation 11
MORNING INSIGHT May 25, 2016
Kotak Securities Limited has two independent equity research groups: Institutional Equities and Private Client Group. This report hasbeen prepared by the Private Client Group. The views and opinions expressed in this document may or may not match or may be contrarywith the views, estimates, rating, target price of the Institutional Equities Research Group of Kotak Securities Limited.
ALLCARGO LOGISTICS LTD (ALL)PRICE: RS.160 RECOMMENDATION: BUYTARGET PRICE: RS.200 FY18E P/E: 11.7X
Stable in a weak business environmentVolume improvement across segments with stable operational efficiency ina weak business environment has helped Allcargo report stable numbersfor Q4FY16 with sales of Rs 14 bn (+5% QoQ). MTO segment remainedstable, while CFS and Projects division are showing signs of weak demandenvironment. EBIDTA was reported at Rs 1.26 bn (EBIDTA margin of 9% - flatQoQ), a healthy margin level esp. in a weak environment. Accordingly, PATwas reported at Rs 691 mn marginally below our expectation of Rs 720 mn.
Q4FY16 was not encouraging for Allcargo primarily due to weak globalcontainer market. However, we estimate Allcargo to be the biggestbeneficiary of any recovery in trade and GST implementation. Measurestaken by the company to reduce cost would add more value. Maintain"BUY" on Allcargo Logistics with TP of Rs 200 at 15x FY18E earnings.
Consolidated quarterly financials
(Rs mn) Q4FY15 Q1FY16 Q2FY16 Q3FY15 Q4FY16
Sales 14,152 14,779 14,682 13,392 14,020
Operating expense 9,961 10,210 10,012 8,713 9,192
Staff cost 2,190 2,258 2,326 2,324 2,349
Other expense 929 942 929 1,144 1,219
Operating expd 13,080 13,410 13,267 12,181 12,760
EBIDTA 1,072 1,369 1,415 1,211 1,260
EBIDTA (%) 7.6 9.3 9.6 9.0 9.0
Depreciation 384 362 422 386 359
Interest 89 91 108 115 95
Other income 191 44 43 98 78
PBT 790 960 928 808 884
Taxes 222 190 179 163 169
PAT 568 770 749 645 715
Minority interest 13 21 19 -9 24
Adjusted PAT 555 749 730 654 691
Extraordinary' items 0 0 0 0 0
Reported PAT 555 749 730 654 691
Source: Company
Multimodal Transport Operations (MTO) continues to show rea-sonable growthVolumes were healthy in the MTO segment for the quarter at ~112,593 TEUs vs.(104,128 TEUs YoY) despite weak container shipping market and continued declinein global trade. China, India, parts of South East Asia and Europe contributed to theincrease in volumes. The growth can also be attributed to new acquisitions, mea-sures taken by the company and strong relations of Allcargo across the value chain.We estimate the volumes to further improve from here and grow at ~6.2% in FY17and ~5.4% in FY18 attributed to 1) Growth in the MTO segment, 2) Immune natureof Less than Container Load (LCL) business, 3) Strong relations of the company and4) Effective business strategies of the company.
Summary table
(Rs mn) FY16 FY17E FY18E
Sales 56,874 61,290 67,233Growth (%) 1.0 7.8 9.7EBITDA 5,255 5,756 6,271EBITDA margin (%) 9.2 9.4 9.3PBT 3,580 4,031 4,521Net profit 2,789 3,050 3,431EPS (Rs) 11.1 12.1 13.6Growth (%) 15.9 9.4 12.5CEPS (Rs) 17.1 18.5 20.1Book value (Rs/share) 86.4 97.7 110.6Dividend /share (Rs) 1.3 1.3 1.3ROE (%) 12.8 12.4 12.3ROCE (%) 11.7 11.9 12.0Net cash (debt) (3,488) (2,995) (2,531)Net WC (Days) 25.0 26.0 27.0EV/EBITDA (x) 8.3 7.5 6.8P/E (x) 14.4 13.1 11.7P/Cash Earnings 9.3 8.6 7.9P/BV (x) 1.8 1.6 1.4
Source: Company, Kotak Securities - PrivateClient Research
RESULT UPDATE
Amit [email protected]
+91 22 6218 6439
Kotak Securities - Private Client Research Please see the disclaimer on the last page For Private Circulation 12
MORNING INSIGHT May 25, 2016
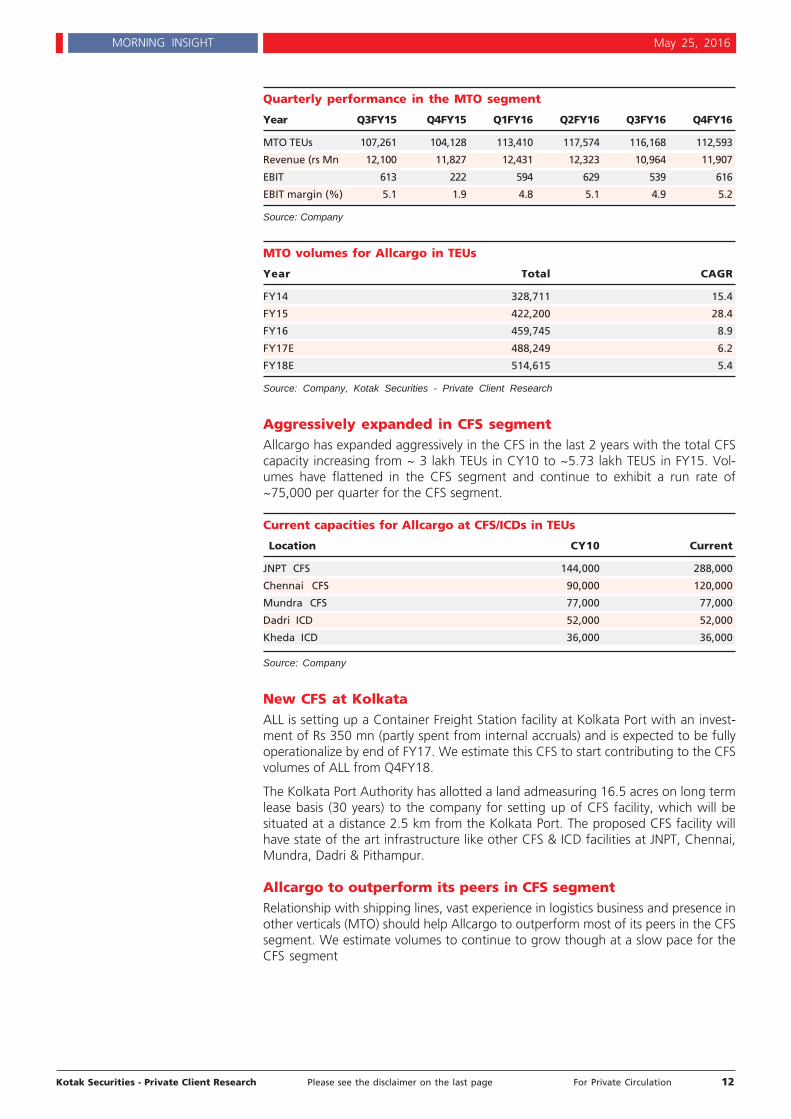
Quarterly performance in the MTO segment
Year Q3FY15 Q4FY15 Q1FY16 Q2FY16 Q3FY16 Q4FY16
MTO TEUs 107,261 104,128 113,410 117,574 116,168 112,593
Revenue (rs Mn 12,100 11,827 12,431 12,323 10,964 11,907
EBIT 613 222 594 629 539 616
EBIT margin (%) 5.1 1.9 4.8 5.1 4.9 5.2
Source: Company
MTO volumes for Allcargo in TEUs
Year Total CAGR
FY14 328,711 15.4
FY15 422,200 28.4
FY16 459,745 8.9
FY17E 488,249 6.2
FY18E 514,615 5.4
Source: Company, Kotak Securities - Private Client Research
Aggressively expanded in CFS segmentAllcargo has expanded aggressively in the CFS in the last 2 years with the total CFScapacity increasing from ~ 3 lakh TEUs in CY10 to ~5.73 lakh TEUS in FY15. Vol-umes have flattened in the CFS segment and continue to exhibit a run rate of~75,000 per quarter for the CFS segment.
Current capacities for Allcargo at CFS/ICDs in TEUs
Location CY10 Current
JNPT CFS 144,000 288,000
Chennai CFS 90,000 120,000
Mundra CFS 77,000 77,000
Dadri ICD 52,000 52,000
Kheda ICD 36,000 36,000
Source: Company
New CFS at KolkataALL is setting up a Container Freight Station facility at Kolkata Port with an invest-ment of Rs 350 mn (partly spent from internal accruals) and is expected to be fullyoperationalize by end of FY17. We estimate this CFS to start contributing to the CFSvolumes of ALL from Q4FY18.
The Kolkata Port Authority has allotted a land admeasuring 16.5 acres on long termlease basis (30 years) to the company for setting up of CFS facility, which will besituated at a distance 2.5 km from the Kolkata Port. The proposed CFS facility willhave state of the art infrastructure like other CFS & ICD facilities at JNPT, Chennai,Mundra, Dadri & Pithampur.
Allcargo to outperform its peers in CFS segmentRelationship with shipping lines, vast experience in logistics business and presence inother verticals (MTO) should help Allcargo to outperform most of its peers in the CFSsegment. We estimate volumes to continue to grow though at a slow pace for theCFS segment
Kotak Securities - Private Client Research Please see the disclaimer on the last page For Private Circulation 13
MORNING INSIGHT May 25, 2016
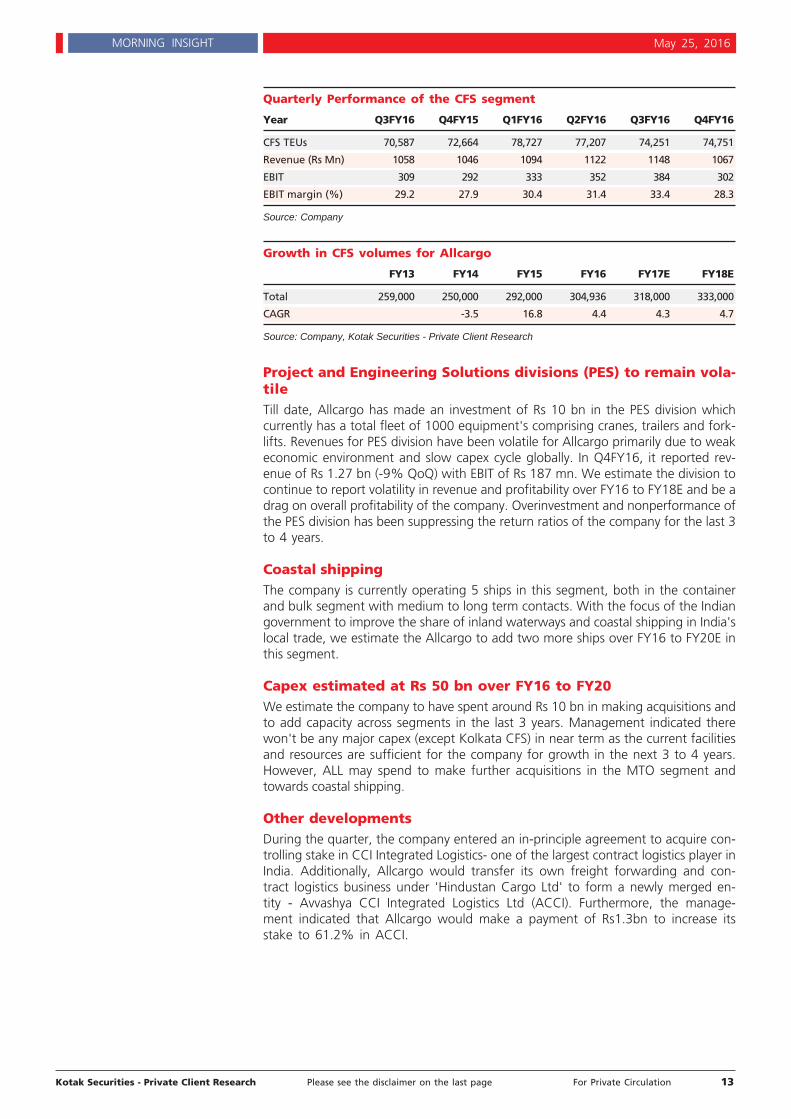
Quarterly Performance of the CFS segment
Year Q3FY16 Q4FY15 Q1FY16 Q2FY16 Q3FY16 Q4FY16
CFS TEUs 70,587 72,664 78,727 77,207 74,251 74,751
Revenue (Rs Mn) 1058 1046 1094 1122 1148 1067
EBIT 309 292 333 352 384 302
EBIT margin (%) 29.2 27.9 30.4 31.4 33.4 28.3
Source: Company
Growth in CFS volumes for Allcargo
FY13 FY14 FY15 FY16 FY17E FY18E
Total 259,000 250,000 292,000 304,936 318,000 333,000
CAGR -3.5 16.8 4.4 4.3 4.7
Source: Company, Kotak Securities - Private Client Research
Project and Engineering Solutions divisions (PES) to remain vola-tileTill date, Allcargo has made an investment of Rs 10 bn in the PES division whichcurrently has a total fleet of 1000 equipment's comprising cranes, trailers and fork-lifts. Revenues for PES division have been volatile for Allcargo primarily due to weakeconomic environment and slow capex cycle globally. In Q4FY16, it reported rev-enue of Rs 1.27 bn (-9% QoQ) with EBIT of Rs 187 mn. We estimate the division tocontinue to report volatility in revenue and profitability over FY16 to FY18E and be adrag on overall profitability of the company. Overinvestment and nonperformance ofthe PES division has been suppressing the return ratios of the company for the last 3to 4 years.
Coastal shippingThe company is currently operating 5 ships in this segment, both in the containerand bulk segment with medium to long term contacts. With the focus of the Indiangovernment to improve the share of inland waterways and coastal shipping in India'slocal trade, we estimate the Allcargo to add two more ships over FY16 to FY20E inthis segment.
Capex estimated at Rs 50 bn over FY16 to FY20We estimate the company to have spent around Rs 10 bn in making acquisitions andto add capacity across segments in the last 3 years. Management indicated therewon't be any major capex (except Kolkata CFS) in near term as the current facilitiesand resources are sufficient for the company for growth in the next 3 to 4 years.However, ALL may spend to make further acquisitions in the MTO segment andtowards coastal shipping.
Other developmentsDuring the quarter, the company entered an in-principle agreement to acquire con-trolling stake in CCI Integrated Logistics- one of the largest contract logistics player inIndia. Additionally, Allcargo would transfer its own freight forwarding and con-tract logistics business under 'Hindustan Cargo Ltd' to form a newly merged en-tity - Avvashya CCI Integrated Logistics Ltd (ACCI). Furthermore, the manage-ment indicated that Allcargo would make a payment of Rs1.3bn to increase itsstake to 61.2% in ACCI.

Kotak Securities - Private Client Research Please see the disclaimer on the last page For Private Circulation 14
MORNING INSIGHT May 25, 2016
Outlook and Valuation
Allcargo has a strong presence in the MTO business through wide network ofECU Line and also has a strong hold on domestic MTO business, Allcargo contin-ues to perform strongly in the MTO segment despite sluggish container shippingmarket. We estimate the MTO segment to grow at ~6.2% in FY17 and ~5.4% inFY18. Strong relationships will help the CFS volumes to grow, though at a slowpace amidst weak container volumes at the ports and increasing competition.We estimate PES division to continue to report volatility in revenue and profit-ability.
We assign a PE of 15x FY18E (earlier 17x FY17E) earnings to the stock on theback of 1) Immune nature of MTO (LCL) business to weak trade: 2) Latest acqui-sitions which help diversify the business: 3) Stable performance of the CFS seg-ment; 4) Strong relations of the company and 5) Estimated recovery in globaltrade. Maintain "BUY" on Allcargo Logistics with TP of Rs 200.
We maintain BUY on AllcargoLogistics Ltd with a price
target of Rs.200
Kotak Securities - Private Client Research Please see the disclaimer on the last page For Private Circulation 15
MORNING INSIGHT May 25, 2016
Kotak Securities Limited has two independent equity research groups: Institutional Equities and Private Client Group. This report hasbeen prepared by the Private Client Group. The views and opinions expressed in this document may or may not match or may be contrarywith the views, estimates, rating, target price of the Institutional Equities Research Group of Kotak Securities Limited.
COLGATE-PALMOLIVE (INDIA) LTD
PRICE: RS.834 RECOMMENDATION: ACCUMULATETARGET PRICE: RS.927 FY18E P/E: 30.6X
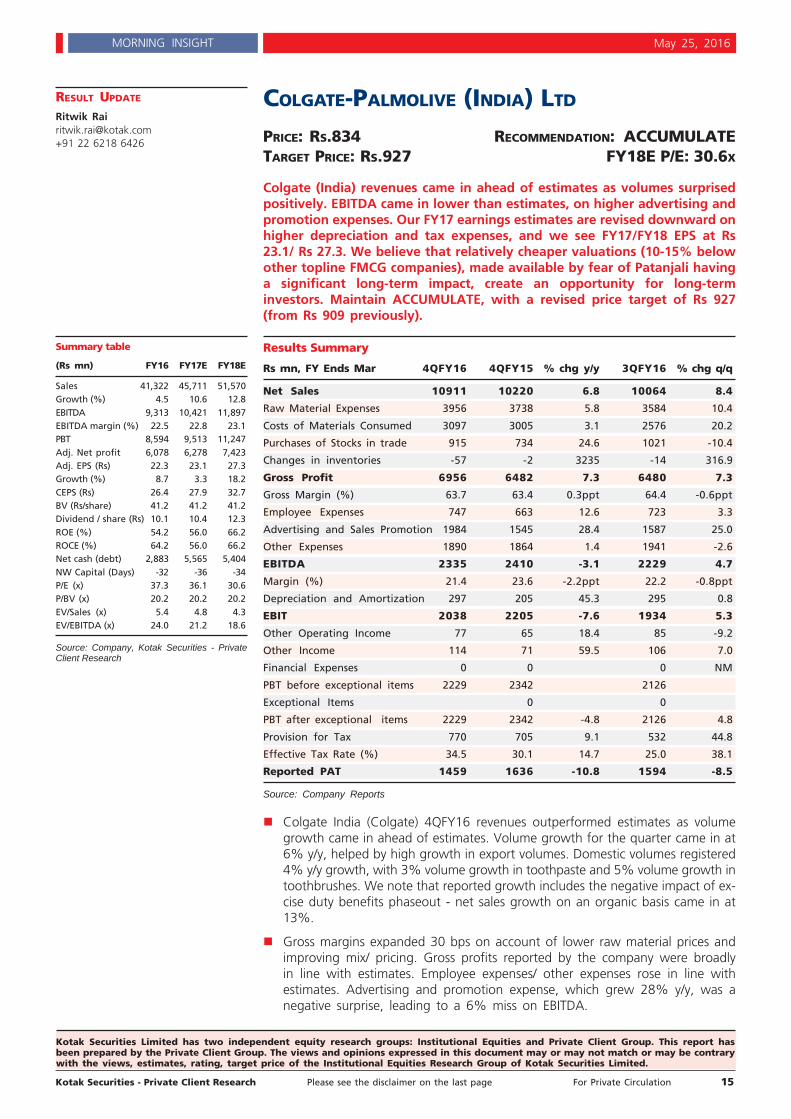
Colgate (India) revenues came in ahead of estimates as volumes surprisedpositively. EBITDA came in lower than estimates, on higher advertising andpromotion expenses. Our FY17 earnings estimates are revised downward onhigher depreciation and tax expenses, and we see FY17/FY18 EPS at Rs23.1/ Rs 27.3. We believe that relatively cheaper valuations (10-15% belowother topline FMCG companies), made available by fear of Patanjali havinga significant long-term impact, create an opportunity for long-terminvestors. Maintain ACCUMULATE, with a revised price target of Rs 927(from Rs 909 previously).
Results Summary
Rs mn, FY Ends Mar 4QFY16 4QFY15 % chg y/y 3QFY16 % chg q/q
Net Sales 10911 10220 6.8 10064 8.4
Raw Material Expenses 3956 3738 5.8 3584 10.4
Costs of Materials Consumed 3097 3005 3.1 2576 20.2
Purchases of Stocks in trade 915 734 24.6 1021 -10.4
Changes in inventories -57 -2 3235 -14 316.9
Gross Profit 6956 6482 7.3 6480 7.3
Gross Margin (%) 63.7 63.4 0.3ppt 64.4 -0.6ppt
Employee Expenses 747 663 12.6 723 3.3
Advertising and Sales Promotion 1984 1545 28.4 1587 25.0
Other Expenses 1890 1864 1.4 1941 -2.6
EBITDA 2335 2410 -3.1 2229 4.7
Margin (%) 21.4 23.6 -2.2ppt 22.2 -0.8ppt
Depreciation and Amortization 297 205 45.3 295 0.8
EBIT 2038 2205 -7.6 1934 5.3
Other Operating Income 77 65 18.4 85 -9.2
Other Income 114 71 59.5 106 7.0
Financial Expenses 0 0 0 NM
PBT before exceptional items 2229 2342 2126
Exceptional Items 0 0
PBT after exceptional items 2229 2342 -4.8 2126 4.8
Provision for Tax 770 705 9.1 532 44.8
Effective Tax Rate (%) 34.5 30.1 14.7 25.0 38.1
Reported PAT 1459 1636 -10.8 1594 -8.5
Source: Company Reports
Colgate India (Colgate) 4QFY16 revenues outperformed estimates as volumegrowth came in ahead of estimates. Volume growth for the quarter came in at6% y/y, helped by high growth in export volumes. Domestic volumes registered4% y/y growth, with 3% volume growth in toothpaste and 5% volume growth intoothbrushes. We note that reported growth includes the negative impact of ex-cise duty benefits phaseout - net sales growth on an organic basis came in at13%.
Gross margins expanded 30 bps on account of lower raw material prices andimproving mix/ pricing. Gross profits reported by the company were broadlyin line with estimates. Employee expenses/ other expenses rose in line withestimates. Advertising and promotion expense, which grew 28% y/y, was anegative surprise, leading to a 6% miss on EBITDA.
Summary table
(Rs mn) FY16 FY17E FY18E
Sales 41,322 45,711 51,570Growth (%) 4.5 10.6 12.8EBITDA 9,313 10,421 11,897EBITDA margin (%) 22.5 22.8 23.1PBT 8,594 9,513 11,247Adj. Net profit 6,078 6,278 7,423Adj. EPS (Rs) 22.3 23.1 27.3Growth (%) 8.7 3.3 18.2CEPS (Rs) 26.4 27.9 32.7BV (Rs/share) 41.2 41.2 41.2Dividend / share (Rs) 10.1 10.4 12.3ROE (%) 54.2 56.0 66.2ROCE (%) 64.2 56.0 66.2Net cash (debt) 2,883 5,565 5,404NW Capital (Days) -32 -36 -34P/E (x) 37.3 36.1 30.6P/BV (x) 20.2 20.2 20.2EV/Sales (x) 5.4 4.8 4.3EV/EBITDA (x) 24.0 21.2 18.6
Source: Company, Kotak Securities - PrivateClient Research
RESULT UPDATE
Ritwik [email protected]+91 22 6218 6426

Kotak Securities - Private Client Research Please see the disclaimer on the last page For Private Circulation 16
MORNING INSIGHT May 25, 2016
On higher effective tax rate (versus est), reported PAT came in 12% belowestimates.
On the conference call, the management said that the FMCG industry/ tooth-pastes are witnessing gradual recovery in volumes. The market share of the com-pany in toothpastes has declined to 55.7% over the last quarter (market share asof April). In the near - term, the company expects volume growth to remain con-tained to low single digits, in our understanding. On pricing, the managementsaid that the company would take a call on pricing depending on macroeco-nomic conditions as also competitive conditions.
Management has guided for 34% effective tax rate, and Rs 3.5Bn-Rs 4 Bn incapex in FY17.
In the conference call/ presentation, the company highlighted its recent innova-tions, and indicated that innovation pipeline is strong with natural/ technologypositioning. We note that the company has recently made an entry into theoral therapeutic segment with its product "Pain Out" (conceieved and devel-oped in India) for express pain relief. Recent innovations of the company, in-cluding Colgate Active Salt Neem (over 1% market share) toothpaste, aretracking well.
Outlook and Investment View
We are encouraged by strengthening volume growth of the company; however,it remains to be seen whether the same can be maintained given the high adver-tising and promotion intensity that this quarter has seen. The management hasindicated that the rise in advertising and promotion expenses line is largelyon account of investments behind brands rather than promotion expenses.
We believe that near/ medium term growth of the copmany is likely to remainsubdued, as industry growth remains soft. Gross margin gains would likely benearing exhaustion ; even so we expect that the company shall be able to makemodest improvements in EBITDA margin on lower overheads.
Our PAT estimate for FY17 is reduced 8% on account of higher depreciationand tax estimates. We estimate FY17/FY18 EPS at Rs 23.1 / Rs 27.3.
Among listed FMCG companies, Colgate is perhaps the most impacted by thegrowth of Patanjali Ayurved, whose toothpaste, it is believed, has gained sub-stantial market share over the past two years (it is believed that Nielsen datadoes not capture well the growth of Patanjali). On this count, Colgate's valuationhas begun to lag other topline FMCG companies by 10-15%.
While it may be true that Patanjali has gathered substantial market share (as hasDabur, with strong growth of Dabur Red), Colgate still is able to generate lower- single digit growth. We believe this pace of growth is sustainable with thegrowth of the ayurveda/ naturals toothpastes. We also like Colgate's commit-ment to create products for India, in India, and we don't think that Colgate islikely to launch products that compete well against such competition.
In this context, we believe that the valuation at CMP offers an opportunity forlong-term investors, although triggers for a significant re-rating are not immedi-ately visible. We maintain ACCUMULATE, with a price target of Rs 928 (34XFY18E PER, revised from Rs 909, as well roll-forward to FY18E).
We recommend ACCUMULATEon Colgate-Palmolive (India) Ltd
with a price target of Rs.927

Kotak Securities - Private Client Research Please see the disclaimer on the last page For Private Circulation 17
MORNING INSIGHT May 25, 2016
Kotak Securities Limited has two independent equity research groups: Institutional Equities and Private Client Group. This report hasbeen prepared by the Private Client Group. The views and opinions expressed in this document may or may not match or may be contrarywith the views, estimates, rating, target price of the Institutional Equities Research Group of Kotak Securities Limited.
CIPLA LTD
PRICE: RS.495 RECOMMENDATION: SELLTARGET PRICE: RS.480 FY18E P/E: 19.2X
Cipla reported lower than expected results led by lower exportformulations and margin pressure. EBIDTA margin for the quarter was at amere 6.7% (lowest ever). Management cited certain one-time inventorywrite offs, severance cost due to rationalization in certain emergingmarkets and higher R&D outgo as a reason for low margins. Going aheadtoo, the outlook for revenues as well as margins looks weak as indicatedin the guidance. We have been cautious on Cipla owing to increasing otherexpenses/employee cost in efforts of putting up front end presence invarious markets globally coupled with lower visibility on timelines forinhaler revenues from EU/US markets over the next few years. We believethe competitive scenario in the inhaler markets is a crucial thing to watchout wherein Cipla may not be amongst the first few entrants in the USmarket (which is the largest market for combination inhalers). Maintain ourSELL rating with a revised price target of Rs 490 (earlier Rs 560).
RESULT UPDATE
Meeta Shetty, [email protected]
+91 22 6218 4425
Quarterly Financials - Snapshot
(Rsmn) 4QFY15 1QFY16 2QFY16 3QFY16 4QFY16 YoY (%) QoQ (%)
Net Sales 29,807 37,768 33,617 30,273 32,067 7.6 5.9
Material Expenses 11,588 12,516 12,169 12,338 14,160 22.2 14.8
Employee Expenses 5,147 6,203 5,859 5,862 6,591 28.1 12.4
Other Operating Expenses 9,115 9,419 8,602 8,328 9,725 6.7 16.8
Operating Profits 3,957 9,630 6,987 3,744 1,591 (59.8) (57.5)
Other Operating Income 1,120 760 907 793 599 (46.5) (24.5)
EBITDA 5,077 10,390 7,894 4,537 2,190 (56.9) (51.7)
Interest Cost 434 514 503 230 368 (15.2) 60.2
Depreciation 1,357 1,288 1,340 1,375 1,414 4.2 2.9
Other Income 612 489 259 793 547 (10.6) (31.0)
PBT 3,898 9,078 6,311 3,726 955 (75.5) (74.4)
Tax 1,030 2,503 1,812 120 -39 (103.8) (132.6)
Minority interest -271 -69 -186 -174 -185 (31.7) 6.4
RPAT 2,597 6,506 4,312 3,432 809 (68.9) (76.4)
Margin Analysis (%) 4QFY15 1QFY16 2QFY16 3QFY16 4QFY16 YoY (bps) QoQ (bps)
Raw mat cost (%) 38.9 33.1 36.2 40.8 44.2 528.1 340.0
Employee cost (%) 17.3 16.4 17.4 19.4 20.6 328.6 118.9
Other expenses (%) 30.6 24.9 25.6 27.5 30.3 (25.4) 281.8
Operating Margin (%) 13.3 25.5 20.8 12.4 5.0 (831.3) (740.7)
EBITDA Margin (%) 16.4 27.0 22.9 14.6 6.7 (971.1) (790.2)
APAT Margin (%) 8.4 16.9 12.5 11.0 2.5 (592.0) (857.2)
Tax Rate (%) 26.4 27.6 28.7 3.2 (4.1) (3051.2) (729.6)
Source: Company
Key results highlights
Domestic formulations revenues posted 15.8% growth at Rs 1.3 bn, higher thanour expectations.
Export formulations segment posted 3% growth at Rs 17.4 bn, we expected Rs~22.0bn revenues (due to pulmicort launch as well as consolidation of acquisition- Exelan, Invagen).
Overall revenues were up 7.6% at Rs 32.1bn.

Kotak Securities - Private Client Research Please see the disclaimer on the last page For Private Circulation 18
MORNING INSIGHT May 25, 2016
EBIDTA margins came in lower than expected at 6.7% (we expected 18.7%)led by sharp decline in gross margins as well better other cost items. EBIDTAmargins were down 971bps YoY and 790 bps QoQ.
Cipla reported lowest ever PAT in 4QFY16 at Rs 0.81bn
Quarterly - Segmental Mix
(Rsmn) 4QFY15 1QFY16 2QFY16 3QFY16 4QFY16 YoY (%) QoQ (%)
Domestic formulations 10860.0 13970.0 12620.0 11940.0 12580.0 15.8 5.4
Exports 18950.0 23800.0 21000.0 18330.0 19480.0 2.8 6.3
- Exports formulations 16900.0 21740.0 18740.0 16900.0 17440.0 3.2 3.2
- Exports API 2050.0 2060.0 2260.0 1430.0 2040.0 (0.5) 42.7
Net revenues 29810.0 37770.0 33620.0 30270.0 32060.0 7.5 5.9
Source: Company
Key con-call highlights
Domestic formulations
Domestic business contribution at ~40% of overall sales, of which Rx sales ac-counted for 81%
Increase in contribution from new introductions, from 3.2% to 4.5% of sales
6 in-licensing deals executed in oncology, respiratory and dermatology segments
US formulations
North America business contribution of ~15% to overall sales (including acquisi-tions)
5 filings in FY 2015-16, 3 products approved and/ or launched (from own pipe-line), recent launches include Celecoxib and Nadolol
Q4 FY16 includes base level of Esomeprazole and Pulmicort that is likely to con-tinue for the next few quarters
Total ANDAs filed: 168 - Approved: 90 - Tentative approval / awaiting approval:78
Company expects to launch 8-10 ANDAs in FY17E (inc few FTFs) and file 20-25ANDAs (with focus on Onco and Resp segment).
Invagen
Company has consolidated its acquisition of Invagen from mid of Feb-16 and thisquarter, however on a realistic basis, as per management, the sales impact dueto the consolidation is only for ~20 days due to higher inventory stocking.
The top 3 products for Invagen account for ~35% of revenues. Of these topproduct is a low competition product while the rest are highly competitive.
Company has indicated that most of the benefit from gNexium is captured in1QFY16. Cipla started supplying gNexium to Teva under exclusivity from Feb-2015, the drug is still under semi-exclusivity with limited competition.
The form 483 observation to Invagen stands resolved.
Invagen is expected to add US$240mn to Cipla's revenues.
Summary table
(Rs mn) FY16 FY17E FY18E
Sales 133,725 154,291 174,585Growth (%) 22.9 15.4 13.2EBITDA 25,011 29,637 34,359EBITDA margin (%) 18.3 18.7 19.3PBT 20,070 21,670 26,475Net profit 15,059 15,960 19,794EPS(Rs) 18.7 19.9 24.6Growth(%) 27.5 6.0 24.0CEPS(Rs) 25.5 27.3 32.8BVPS(Rs) 147.5 164.4 186.1DPS (Rs) 2.5 2.5 2.5ROE (%) 13.3 12.7 14.0ROCE (%) 13.9 13.9 14.9Net debt 43,200 50,825 44,135NW Capital (Days) 117.2 129.5 146.3P/E (x) 26.4 24.9 20.1P/BV (x) 3.4 3.0 2.7EV/Sales (x) 3.3 2.9 2.5EV/EBITDA (x) 17.6 15.1 12.9
Source: Company, Kotak Securities - Pri-vate Client Research

Kotak Securities - Private Client Research Please see the disclaimer on the last page For Private Circulation 19
MORNING INSIGHT May 25, 2016
South Africa (SA)
South Africa contribution at ~11.5% of overall sales and posted 25% growth inconstant currency.
Cipla currently holds ~5% market share in SA.
Growth of 14% in private market, driven by outperformance of base businessand new business. The private market accounts for ~60% of the SA sales.
In the tender segment (~40% of SA sales - Cipla witnessed 60% growth in ten-der sales vs. last year)
Margins
Cipla reported an EBIDTA margin of 6.7% for 4QFY16 but cited certain one offsadjusted for the same, the EBIDTA margins stood at 16.4%.
These adjustments included - ~2.2% - Incremental R&D spending, ~1.3% - pay-ment due to change in bonus act, ~2.1% - Complexity reduction - restructuringand rationalization, ~3.4% - inventory w/offs.
Few of these one off were due to rationalization of emerging market presence.
Company does not expect these one offs to repeat in coming quarters.
The R&D expense which stood at ~6.5% in FY16 will be ~8% in FY17 and be-yond.
Guidance
Expect sales to post mid- teens growth over FY16E (exc the revenues of one timeopportunity from gNexium). We assume gNexium contributed ~US$
Others
The pending form 483 as its Indore plant is still not resolved and the final up-date to the USFDA was sent in early May-16.
The EU launch of gAdvair is still a few quarters away, management has alreadyreplied to the queries that were raised in previous quarter.
Capex for FY16 stood at ~8% to sales and is expected to remain at similar levelsfor the next two years.
Current outstanding hedges stood at US$36mn at Rs 69.35, South African Rand520mn at 4.45/Rs.
The outstanding loan for working capital stood at US$170mn. Cipla has takenadditional loan of US$550mn (to fund the acquisition) at LIBOR + 0.35 -0.85 bps.
The current Debt/Equity stood at 0.44x
Outlook and ValuationCipla reported lower than expected results led by lower export formulations andmargin pressure. EBIDTA margin for the quarter was at a mere 6.7% (lowest ever).Management cited certain one-time inventory write offs, severance cost due to ra-tionalization in certain emerging markets and higher R&D outgo as a reason for lowmargins. Adjusted for these one off (exc R&D), the EBIDTA margins would havebeen at ~14.2%. However, we don't incorporate these adjustments as we see themas operational.
Management gave a broad outline for FY17E wherein they expect mid-teens growthin revenues (excluding the acquisitions but adjusted for limited competition revenuesfrom gNexium in FY16) and 16-18% of EBDIDTA margins. In spite of a strong frontend presence now and ~74 ANDAs pending for approval (inc few FTF opportunities)the guidance looks weak.

Kotak Securities - Private Client Research Please see the disclaimer on the last page For Private Circulation 20
MORNING INSIGHT May 25, 2016
We have been cautious on Cipla owing to increasing other expenses/employeecost in efforts of putting up front end presence in various markets globallycoupled with lower visibility on timelines for inhaler revenues from EU/US mar-kets over the next few years. We believe the competitive scenario in the inhalermarkets is a crucial thing to watch out wherein Cipla may not be amongst thefirst few entrants in the US market (which is the largest market for combinationinhalers).
We retain our revenue estimates for FY17E but revise our EBIDTA margin esti-mates (largely led by higher R&D, up from 6% of revenues to 8% of revenues)from ~22% to ~19%. Our Revised EPS for FY17E stands lower by ~23%. Wealso introduce our FY18E estimates and roll our target to next fiscal. Maintainour SELL rating with a revised price target of Rs 490 (earlier Rs 560), 18x (earlier19x) FY18E EPS and an NPV of Rs 40 for Inhalers.
We maintain SELL onCipla Ltd with a price
target of Rs.490

Kotak Securities - Private Client Research Please see the disclaimer on the last page For Private Circulation 21
MORNING INSIGHT May 25, 2016
Gainers & Losers Nifty Gainers & LosersPrice (Rs) chg (%) Index points Volume (mn)
Gainers
NTPC Ltd 139 2.1 NA 4.9
ACC Ltd 1,446 2.0 NA 0.2
Tata Motors 389 1.9 NA 10.6
Losers
Aurobindo Pharma 728 (4.2) NA 2.3
BPCL 896 (2.8) NA 1.0
Idea Cellular 107 (2.5) NA 6.3
Source: Bloomberg
Bulk deals
Forthcoming events Company/MarketDate Event
25 - May AIA Engineering, Ashok Leyland, Bajaj Auto, Container Corp, Cummins India,Gail, L&T, Thermax earnings expected
26 - May BPCL, India Cements, Mphasis, Natco Pharma, Shree Cement, Union Bankearnings expected
Source: Bloomberg
Trade details of bulk deals
Date Scrip name Name of client Buy/ Quantity Avg.Sell of shares price
(Rs)
24-May BERLDRG Ska Securities & Financial Services B 30,000 36.7
24-May CHLOGIST Mahavir Richab Investments Pvt Ltd S 507,143 20.5
24-May DARSHANORNA Rashmita Mukesh Varma B 38,000 60.7
24-May DARSHANORNA Siddharth Paras Gathani B 42,000 60.0
24-May DARSHANORNA Nishant Miteshbhai Dalal S 28,000 60.0
24-May DARSHANORNA Virali Vicky Jhaveri S 60,000 60.0
24-May DARSHANORNA Vicky Rajesh Jhaveri S 38,000 60.0
24-May DELTA Sitaram Computech Pvt Ltd B 30,000 11.0
24-May DUNE Naginbhai Jeshingbhai Maheriya B 32,000 19.0
24-May IDFCBANK Clsa Global Markets Pte Ltd S 44,037,474 47.2
24-May IDFCBANK Platinum Investment Mgmt Ltd
A/C Platinum International Fnd B 28,913,027 47.2
24-May KRISHFAB Anjanaben Atulkumar Sanghvi S 25,000 28.2
24-May KRISHFAB Wonder Vincom Pvt.Ltd. B 25,000 28.2
24-May SUPRDOM Rameshbhai Vallabhbhai Patel B 50,000 4.9
24-May SVARTCORP Baneet Singh Makkar B 300,000 3.2
24-May SVARTCORP Upsurge Investment & Finance Ltd S 545,000 3.1
24-May SWARNSAR P R Enterprise B 200,000 22.8
24-May TTIL Mainak Comtrade Mainak Comtrade S 30,000 34.8
24-May UVBOARDS Mahesh Hemchand Purohit S 77,707 15.7
24-May UVBOARDS Bp Fintrade Pvt Ltd B 150,000 15.7
24-May VAL Overskud Multi Asset Mgmt Pvt Ltd S 92,000 26.3
24-May VAL Aryaman Broking Limited B 100,000 26.3
24-May VERTICLIND Ghanshyam C Joshi B 194,900 3.4
24-May VERTICLIND Ashish Vrundavan Karia S 187,800 3.4
24-May VMV Vsl Securities Pvt Ltd B 30,000 16.5
Source: BSE

Kotak Securities - Private Client Research Please see the disclaimer on the last page For Private Circulation 22
MORNING INSIGHT May 25, 2016
RATING SCALE
Definitions of ratingsBUY – We expect the stock to deliver more than 12% returns over the next 9 months
ACCUMULATE – We expect the stock to deliver 5% - 12% returns over the next 9 months
REDUCE – We expect the stock to deliver 0% - 5% returns over the next 9 months
SELL – We expect the stock to deliver negative returns over the next 9 months
NR – Not Rated. Kotak Securities is not assigning any rating or price target to the stock. The report has been prepared for information purposesonly.
RS – Rating Suspended. Kotak Securities has suspended the investment rating and price target for this stock, either because there is not a suffi-cient fundamental basis for determining, or there are legal, regulatory or policy constraints around publishing, an investment rating or target.The previous investment rating and price target, if any, are no longer in effect for this stock and should not be relied upon.
NA – Not Available or Not Applicable. The information is not available for display or is not applicable
NM – Not Meaningful. The information is not meaningful and is therefore excluded.
NOTE – Our target prices are with a 9-month perspective. Returns stated in the rating scale are our internal benchmark.
Fundamental Research Team
Dipen ShahInformation [email protected]+91 22 6218 5409
Sanjeev ZarbadeCapital Goods, [email protected]+91 22 6218 6424
Teena VirmaniConstruction, [email protected]+91 22 6218 6432
Saday SinhaBanking, NBFC, [email protected]+91 22 6218 6437
Arun AgarwalAuto & Auto [email protected]+91 22 6218 6443
Ruchir KhareCapital Goods, [email protected]+91 22 6218 6431
Ritwik RaiFMCG, [email protected]+91 22 6218 6426
Sumit PokharnaOil and [email protected]+91 22 6218 6438
Amit AgarwalLogistics, [email protected]+91 22 6218 6439
Meeta Shetty, [email protected]+91 22 6218 6425
Jatin DamaniaMetals & [email protected]+91 22 6218 6440
Pankaj [email protected]+91 22 6218 6434
Nipun GuptaInformation [email protected]+91 22 6218 6433
Jayesh [email protected]+91 22 6218 5373
K. [email protected]+91 22 6218 6427
Technical Research Team
Shrikant [email protected] 22 6218 5408
Amol [email protected]+91 20 6620 3350
Derivatives Research TeamSahaj [email protected]+91 79 6607 2231
Rahul [email protected]+91 22 6218 5498
Malay [email protected]+91 22 6218 6420
Prashanth [email protected]+91 22 6218 5497

Kotak Securities - Private Client Research Please see the disclaimer on the last page For Private Circulation 23
MORNING INSIGHT May 25, 2016
DisclaimerKotak Securities Limited established in 1994, is a subsidiary of Kotak Mahindra Bank Limited. Kotak Securities is one of India's largest brokerage anddistribution house.Kotak Securities Limited is a corporate trading and clearing member of Bombay Stock Exchange Limited (BSE), National Stock Exchange of India Limited (NSE),Metropolitan Stock Exchange of India Limited (MSEI). Our businesses include stock broking, services rendered in connection with distribution of primarymarket issues and financial products like mutual funds and fixed deposits, depository services and Portfolio Management.Kotak Securities Limited is also a depository participant with National Securities Depository Limited (NSDL) and Central Depository Services (India) Limited(CDSL). Kotak Securities Limited is also registered with Insurance Regulatory and Development Authority as Corporate Agent for Kotak Mahindra Old MutualLife Insurance Limited and is also a Mutual Fund Advisor registered with Association of Mutual Funds in India (AMFI). We are registered as a Research Analystunder SEBI (Research Analyst) Regulations, 2014.We hereby declare that our activities were neither suspended nor we have defaulted with any stock exchange authority with whom we are registered in lastfive years. However SEBI, Exchanges and Depositories have conducted the routine inspection and based on their observations have issued advise letters orlevied minor penalty on KSL for certain operational deviations. We have not been debarred from doing business by any Stock Exchange / SEBI or any otherauthorities; nor has our certificate of registration been cancelled by SEBI at any point of time.We offer our research services to clients as well as our prospects.This document is not for public distribution and has been furnished to you solely for your information and must not be reproduced or redistributed to any otherperson. Persons into whose possession this document may come are required to observe these restrictions.This material is for the personal information of the authorized recipient, and we are not soliciting any action based upon it. This report is not to be construedas an offer to sell or the solicitation of an offer to buy any security in any jurisdiction where such an offer or solicitation would be illegal. It is for the generalinformation of clients of Kotak Securities Ltd. It does not constitute a personal recommendation or take into account the particular investment objectives,financial situations, or needs of individual clients.We have reviewed the report, and in so far as it includes current or historical information, it is believed to be reliable though its accuracy or completenesscannot be guaranteed. Neither Kotak Securities Limited, nor any person connected with it, accepts any liability arising from the use of this document. Therecipients of this material should rely on their own investigations and take their own professional advice. Price and value of the investments referred to in thismaterial may go up or down. Past performance is not a guide for future performance. Certain transactions -including those involving futures, options andother derivatives as well as non-investment grade securities - involve substantial risk and are not suitable for all investors. Reports based on technical analysiscenters on studying charts of a stock's price movement and trading volume, as opposed to focusing on a company's fundamentals and as such, may not matchwith a report on a company's fundamentals.Opinions expressed are our current opinions as of the date appearing on this material only. While we endeavor to update on a reasonable basis theinformation discussed in this material, there may be regulatory, compliance or other reasons that prevent us from doing so. Prospective investors and othersare cautioned that any forward-looking statements are not predictions and may be subject to change without notice. Our proprietary trading and investmentbusinesses may make investment decisions that are inconsistent with the recommendations expressed herein.Kotak Securities Limited has two independent equity research groups: Institutional Equities and Private Client Group. This report has been prepared by thePrivate Client Group. The views and opinions expressed in this document may or may not match or may be contrary with the views, estimates, rating, targetprice of the Institutional Equities Research Group of Kotak Securities Limited.We and our affiliates/associates, officers, directors, and employees, Research Analyst(including relatives) worldwide may: (a) from time to time, have long orshort positions in, and buy or sell the securities thereof, of company (ies) mentioned herein or (b) be engaged in any other transaction involving such securitiesand earn brokerage or other compensation or act as a market maker in the financial instruments of the subject company/company (ies) discussed herein oract as advisor or lender / borrower to such company (ies) or have other potential/material conflict of interest with respect to any recommendation and relatedinformation and opinions at the time of publication of Research Report or at the time of public appearance. Kotak Securities Limited (KSL) may haveproprietary long/short position in the above mentioned scrip(s) and therefore may be considered as interested. The views provided herein are general innature and does not consider risk appetite or investment objective of particular investor; readers are requested to take independent professional advicebefore investing. This should not be construed as invitation or solicitation to do business with KSL. Kotak Securities Limited is also a Portfolio Manager.Portfolio Management Team (PMS) takes its investment decisions independent of the PCG research and accordingly PMS may have positions contrary to thePCG research recommendation. Kotak Securities Limited does not provide any promise or assurance of favourable view for a particular industry or sector orbusiness group in any manner. The investor is requested to take into consideration all the risk factors including their financial condition, suitability to riskreturn profile and take professional advice before investing.The analyst for this report certifies that all of the views expressed in this report accurately reflect his or her personal views about the subject company orcompanies and its or their securities, and no part of his or her compensation was, is or will be, directly or indirectly related to specific recommendations orviews expressed in this report.No part of this material may be duplicated in any form and/or redistributed without Kotak Securities' prior written consent.Details of Associates are available on our website ie www.kotak.comResearch Analyst has served as an officer, director or employee of subject company(ies): NoWe or our associates may have received compensation from the subject company(ies) in the past 12 months. We or our associates may have managed or co-managed public offering of securities for the subject company(ies) in the past 12 months. We or our associates may have received compensation forinvestment banking or merchant banking or brokerage services from the subject company(ies) in the past 12 months. We or our associates may have receivedany compensation for products or services other than investment banking or merchant banking or brokerage services from the subject company(ies) in thepast 12 months. We or our associates have not received any compensation or other benefits from the subject company(ies) or third party in connection withthe research report. Our associates may have financial interest in the subject company(ies).Research Analyst or his/her relative's financial interest in the subject company(ies): NoKotak Securities Limited has financial interest in the subject company(ies): Tata Power, Cipla, Colgate - YesOur associates may have actual/beneficial ownership of 1% or more securities of the subject company(ies) at the end of the month immediately precedingthe date of publication of Research Report.Research Analyst or his/her relatives has actual/beneficial ownership of 1% or more securities of the subject company(ies) at the end of the monthimmediately preceding the date of publication of Research Report: NoKotak Securities Limited has actual/beneficial ownership of 1% or more securities of the subject company(ies) at the end of the month immediately precedingthe date of publication of Research Report: NoSubject company(ies) may have been client during twelve months preceding the date of distribution of the research report."A graph of daily closing prices of securities is available at www.nseindia.com and http://economictimes.indiatimes.com/markets/stocks/stock-quotes. (Choosea company from the list on the browser and select the "three years" icon in the price chart)."Kotak Securities Limited. Registered Office: 27 BKC, C 27, G Block, Bandra Kurla Complex, Bandra (E), Mumbai 400051. CIN: U99999MH1994PLC134051,Telephone No.: +22 43360000, Fax No.: +22 67132430. Website: www.kotak.com. Correspondence Address: Infinity IT Park, Bldg. No 21, Opp. Film City Road,A K Vaidya Marg, Malad (East), Mumbai 400097. Telephone No: 42856825. SEBI Registration No: NSE INB/INF/INE 230808130, BSE INB 010808153/INF011133230, MSEI INE 260808130/INB 260808135/INF 260808135, AMFI ARN 0164, PMS INP000000258 and Research Analyst INH000000586. NSDL/CDSL: IN-DP-NSDL-23-97. Our research should not be considered as an advertisement or advice, professional or otherwise. The investor is requested to take intoconsideration all the risk factors including their financial condition, suitability to risk return profile and the like and take professional advice before investing.Investments in securities are subject to market risk; please read the SEBI prescribed Combined Risk Disclosure Document prior to investing. Derivatives are asophisticated investment device. The investor is requested to take into consideration all the risk factors before actually trading in derivative contracts.Compliance Officer Details: Mr. Manoj Agarwal. Call: 022 - 4285 6825, or Email: [email protected] case you require any clarification or have any concern, kindly write to us at below email ids: Level 1: For Trading related queries, contact our customer service at '[email protected]' and for demat account related queries contact us at
[email protected] or call us on: Online Customers - 30305757 (by using your city STD code as a prefix) or Toll free numbers 18002099191 / 1800222299,Offline Customers - 18002099292
Level 2: If you do not receive a satisfactory response at Level 1 within 3 working days, you may write to us at [email protected] or call us on 022-42858445 and if you feel you are still unheard, write to our customer service HOD at [email protected] or call us on 022-42858208.
Level 3: If you still have not received a satisfactory response at Level 2 within 3 working days, you may contact our Compliance Officer (Name: ManojAgarwal ) at [email protected] or call on 91- (022) 4285 6825.
Level 4: If you have not received a satisfactory response at Level 3 within 7 working days, you may also approach CEO (Mr. Kamlesh Rao) [email protected] or call on 91- (022) 6652 9160.