Morgan Stanley TMT Conference -...
24
1 Barcelona – November 12, 2015 Morgan Stanley TMT Conference
Transcript of Morgan Stanley TMT Conference -...

1
Barcelona – November 12, 2015
Morgan Stanley TMT Conference

2
AGENDA
• Numericable - SFR
• Portugal Telecom
• Hot
• Orange Dominicana / Tricom
1
2
3
4

3
ALTICE BUSINESS MODEL
Proven Business Model Successfully Executed in More Than 20 Companies Over the Last 20 Years
Process
and Cost
Optimization
Re-investment
Re-alignment
of Sales
Distribution
Marketing
Relaunch
Stop / reorganize all
inefficient processes
Streamline costs to right
level
1
2 Re-invest savings to
drive growth
─ Best infrastructure
(e.g. fiber, 4G, IT)…
─ Content
─ Customer service
3
Reorganize sales
force to prepare
for higher growth
at optimized costs
4
Relaunch marketing
focused on
─ Better technology
─ Best innovation
─ Better quality
─ Better content
Higher ARPU,
lower churn, fully
bundled
customers
4
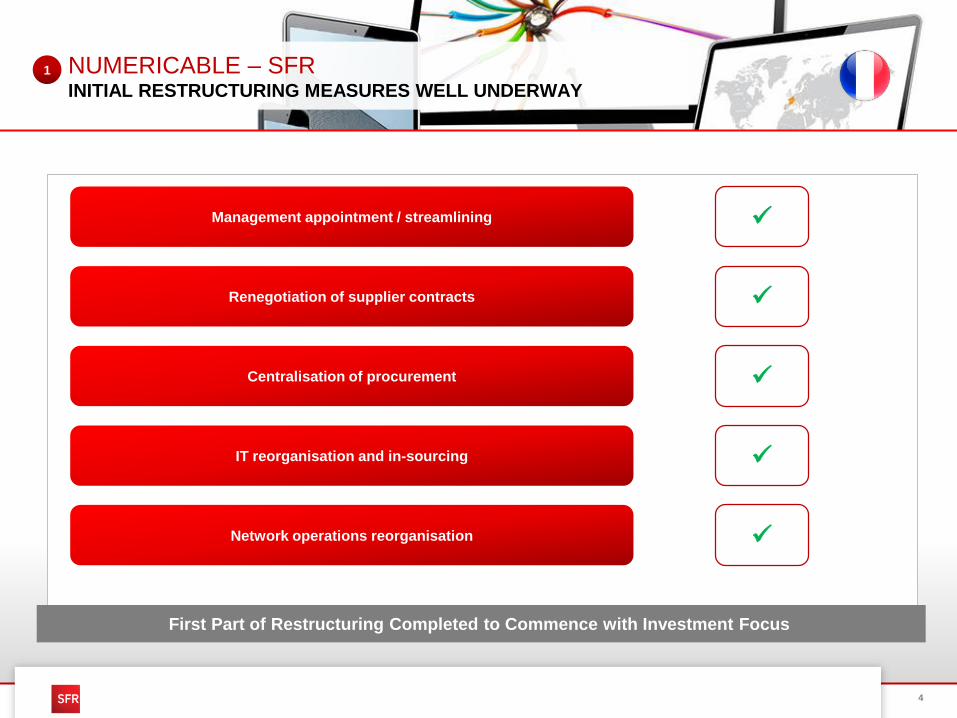
NUMERICABLE – SFRINITIAL RESTRUCTURING MEASURES WELL UNDERWAY
1
Management appointment / streamlining
Renegotiation of supplier contracts
Centralisation of procurement
IT reorganisation and in-sourcing
Network operations reorganisation
First Part of Restructuring Completed to Commence with Investment Focus

5
Revenue
NUMERICABLE – SFRIMPROVING REVENUE TRAJECTORY
727,7 717,6 724,3 724,0
1 239,11 136,6 1 178,2 1 207,9
555,8557,9 532,9 500,9
322,0328,4 336,2 334,8
2 844,7 2 736,5 2 775,4 2 767,6
Q3 2014 Q1 2015 Q2 2015 Q3 2015
Flat B2C service revenue since Q1 2015
Fiber growth at higher gross margins
1 Q3 2014 revenue adjusted for €30m of one-time revenue related to voice interconnection sold and mobile base stations fiber links sold to 3rd party2 Include €(4m) of intercompany adjustments in Q1 2015, and €4m of other revenue in Q2 2015
(0.5%)
(9.9%)
0.0%
(6.0%)
YoY QoQ
(2.5%) 2.5%
(2.7%) (0.3)%
+4.0% (0.4%)Wholesale
B2C
Mobile
B2B
B2C
Fixed
1
(1)
(1)
(€m)
Improving B2B KPIs
(2) (2)

6
Underinvested mobile network at SFR closing
• Initial focus on 3G backhaul and radio capacity
4G deployment ramping up in Q4 (5.2k base stations
by the end of 2015)
Investment timeline defined by
• Re-negotiation of supplier contracts
• Rationalization of equipment suppliers
• Technical reorganisation
Future-proof fiber build-out acceleration: better ARPU,
lower churn, no ULL, payback < 4 years
• 12m homes 2017
• 18m homes 2020
• 22m homes 2022
NUMERICABLE – SFRACCELERATING NETWORK INVESTMENTS
Network and Investment Strategy3G Coverage Improvements
# of Base Stations Upgraded
Fiber Upgrade
# of New Fiber Homes (000’s)
277 282
360330
Q1 2015 Q2 2015 Q3 2015 Q4 2015E 2016/17E
1
Avg. c.500
per quarter
7 1107 656
8 046
9 223
Q1 2015 Q2 2015 Q3 2015 Q4 2015E
% of
Total 42.5% 45.6% 47.6% 54.3%
4G Coverage
33%
60%90% >95%
Nov-14 Q3 2015 2017 2020

7
NUMERICABLE – SFR B2C FIXED: FIBER FOCUS
Fiber (000’s)
Fiber vs. DSL Net Adds
11
27
48
70 72
Q3 2014 Q4 2014 Q1 2015 Q2 2015 Q3 2015
Fiber ARPU (1)
(€/Month)
DSL (000’s)
41.6
1
-32-52
-105
-189
-114
DSL ARPU
(€/Month)32.8
40.7
32.9
41.1
32.5
41.1
33.6
41.0
34.1
1 FTTB ARPU
Superior fiber economics
Higher ARPU
No ULL: 20pts higher gross margin
Lower churn
Expanding fiber network

8
NUMERICABLE – SFR B2C MOBILE: BEST KPIs SINCE ACQUISITION
(000’s)
Postpaid Net Adds/ (Net Losses)
Other ARPU
(€/Month)
1
18.7
Full Service Offer
ARPU (€/Month)30.1
17.8
29.2
17.4
28.8
18.0
29.3
18.6
29.6
Focus on full service customers
• Higher ARPU
• Customer relationship
Accelerating network investments
Strength of brand, and sales force
1 Offre complete2 Includes offre simple, distant access, and lines for testing
+5k full offer net adds in September
-35
-90
-178-148
-29
-28
18 34
-166
-53
-63
-71
-144
-314
-82
Q3 2014 Q4 2014 Q1 2015 Q2 2015 Q3 2015Full Service Offer Other(1) (2)

9
Mix shifting towards data
Data business acceleration
Accelerating fiber delivery
Price pressure on voice
New sales organisation
133,9 131,7
128,2 122,8
262,1 254,5
Q3 2014 Q3 2015
Data Voice
NUMERICABLE – SFR B2B – IMPROVING UNDERLYING TRENDS
1
1 The figures shown in the section for France are Numericable-SFR Group financials. These numbers may hence vary from the financial numbers published by the stand alone Altice
NV financials for France after the elimination of intercompany transactions between the Numericable-SFR Group and other companies of the Altice Group.
Difficult Q1 2015: low gross adds, high
churn
Churn still above expectations but
further decreasing
Gross adds recovering since Q1 2015
(-3% YTD YoY)
Improving ARPU trends
New sales organization
B2B Fixed Trends (c.50% of B2B) (1) B2B Mobile Trends (c. 30% of B2B) B2B ICT Trends (c.20% of B2B)
Security, Unified Communications,
LAN/Wifi and housing and hosting
services
Revenue and margin growth driven by
strong market demand
Numericable-SFR to benefit from Altice
Group synergies on platform
development
-3%
Data + Voice Revenue (€m) (1) Net Losses (000’s) Revenue (€m) (1)
-154
-59-41
Q1 2015 Q2 2015 Q3 20152015
c.430m
+12%

10
NUMERICABLE – SFR SIGNIFICANT RESTRUCTURING PROGRESS: COGS
Cost of Goods Sold – Data Costs
920
Q3 2015Annualised
Data Costs
(€m)
1
3/4 ULL / last
mile rental
1/4 connectivity
/ leased line
DSL- fiber migration and substitution
Fiber network build-out
Defined B2B projects (c.€400m B2B data costs)
Key Drivers

11
Customer Service
Sales and Marketing
Network Operations
and Maintenance
Personnel
~55
2015 Savings
(€m)
~230
~235
~35
NUMERICABLE – SFR INITIAL RESTRUCTURING PROGRESS: OPEX TO DATE
1
G&A ~35
Supplier price negotiations
Equipment subsidies rationalisation
Brand consolidation
Distribution network optimisation
IT simplification / in-sourcing (~50% external personnel reduced, c.1,100)
Network operations productivity improvements / efficiencies
B2B platform consolidation
In-sourcing
Voluntary personnel churn
Real estate portfolio streamlining
Other G&A
~590Total Opex
Capex ~90
COGS ~75 Data cost, content renegotiation
Price renegotiations, IT simplification

12
NUMERICABLE – SFR RESTRUCTURING OUTLOOK
~5%
~35%
~10-15%
~15-20%
~35% Voluntary personnel churn
Overhead optimization
Other G&A
Defined Work Plan to Address Cost Structure
Personnel and G&A
Network Operations
Sales & Marketing
Taxes
(€m)
1
Further IT optimization (also capex)
Network operations efficiency improvements, pricing improvements
Brand consolidation
Distribution network reorganization
Service digitalization
Pricing improvements
~€4.15 Bn
Customer Service
Q3 2015
Total Opex Run-Rate (1)
1 Excluding capitalized costs

13
PORTUGAL TELECOMMORE ROBUST UNDERLYING REVENUE TRENDS
173,0 176,8 174,2 175,2
146,1 129,9 133,7 138,8
176,4 175,1 168,1 160,7
84,5 75,7 75,2 71,0
40,9 28,4 30,4 26,9
620,9
585,9 581,6 572,6
Q3 2014 Q1 2015 Q2 2015 Q3 2015
1.3%
(8.9)%
(7.8)%
(5.0)%
(15.9)%
0.6%
(4.4)%
(1.5%)
3.8%
(5.5)%
(11.4)%(34.2%)
2
Revenue
Other
Wholesale
B2B
B2C Mobile
B2C Fixed
YoY QoQ
(€m)
B2B revenue decline concentrated on top 10 customers
Flat to growing B2C service revenue since Q1 2015
1 Note that PT Portugal Financials are stated before intercompany mobile / fixed eliminations. Service revenue, i.e. excluding €11.8m mobile equipment sales of B2C Mobile in Q3
2015, €11.5m in Q2 2015, €6.9m in Q1 2015, and €18.2m in Q3 2014
(1)
(1)
Other revenue loss due to Oi separation
Low margin wholesale revenue loss due to carve-out
(1)(1)

14
PORTUGAL TELECOMCOMMITMENT TO GO 100% FIBER
Portugal Telecom National Fiber Plan
2,3
3,5
5,3
2015 2017 2020
Coverage (m)
2
Most innovative fiber network in Europe
100% coverage in Portugal
GPON technology
• Today: 2.5 / 1.25 Gbps (download-upload)
• Future: 80 / 80 Gbps
Complements most advanced 3G/4G mobile network

15
PORTUGAL TELECOMB2C FIXED: FOCUS ON HIGH QUALITY CUSTOMERS
Fiber DSL
Solid performance despite 2014 PT issues, ownership change, reorganisation
Focus on higher quality and ARPU subscribers
• Fiber growth
• Net loss of lower ARPU DSL / SAT customers
Fiber network build out increasing addressable fiber market substantially
SAT
2
-7.5% +10.4% -5.1% +16.1%+5.1% +2.3%
YoY Customer
Growth
YoY ARPU (fee)
Growth (1)
YoY Customer
Growth
YoY ARPU (fee)
Growth (1)
YoY Customer
Growth
YoY ARPU (fee)
Growth (1)
Fixed Trends
1 Base ARPU YoY growth, as of September 2015

16
PORTUGAL TELECOMB2C MOBILE PERFORMANCE: IMPROVING POSITIVE KPIS
816 813
1 316
1 815
2 132
2 628
Q3 2014 Q3 2015
2
Postpaid Trends
(000’s)
Continued pre – postpaid migration: 543k net LTM
3.6m prepaid customer base still as of Q3 2015
Increasing postpaid customers in MxO
Voice postpaid ARPU broadly stable
Total mobile customer base growth QoQ
47% MxO
51% MxO
Voice Postpaid Mobile Broadband

17
332 325
2014 2015E
204 199
59 55
95 63
358316
2014 2015E
PORTUGAL TELECOMB2B: CORPORATE SEGMENT UNDER PRESSURE
Corporate Segment Revenue
Corporate
No key corporate losses in Q3 since Altice ownership
Specific team in place since October to protect footprint
Focus on top 40 corporates: retention, expand services
Leverage PT advantage in convergent solution
H1 2015 key contract losses to affect 2016
SoHo/SME
New sales organization in place since October
Focus on gross adds and upselling
National fiber network: increasing addressable market
Attractive growth opportunities
SME/SOHO Revenue
(€m)
Top 10 (-34%)
Remaining Corporate (-2%)
(€m)
(2)%
2
Other Top 30 (-7%)

18
PORTUGAL TELECOMSIGNIFICANT RESTRUCTURING PROGRESS: OPEX TO DATE
2
Customer Service
Sales and Marketing
Network Operations
and Maintenance
Personnel
~6
Annualised
Savings (€m)
~14
~44
~19
G&A ~9
Reduced call volumes: offer simplification
In-sourcing
Termination football sponsorship (end 2014)
Network maintenance contract renegotiations
Efficiency gains network field operations
IT simplification
In-sourcing
Voluntary personnel churn
Real estate consolidation
Other G&A optimisation
~92Total Opex
19
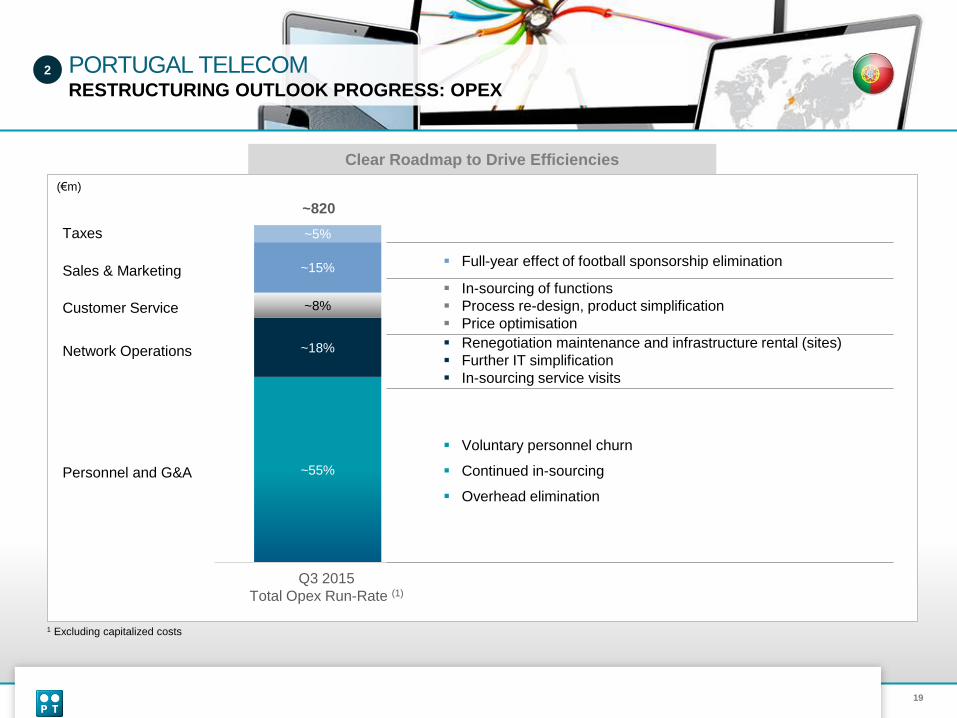
PORTUGAL TELECOMRESTRUCTURING OUTLOOK PROGRESS: OPEX
2
~55%
~18%
~8%
~15%
~5%
Full-year effect of football sponsorship elimination
Clear Roadmap to Drive Efficiencies
Sales & Marketing
Customer Service
Personnel and G&A
Taxes
(€m)
Q3 2015
Total Opex Run-Rate (1)
~820
Network Operations
In-sourcing of functions
Process re-design, product simplification
Price optimisation
Renegotiation maintenance and infrastructure rental (sites)
Further IT simplification
In-sourcing service visits
Voluntary personnel churn
Continued in-sourcing
Overhead elimination
1 Excluding capitalized costs

20
59%
25%
Adj.EBITDA
Op FCF
47%
15%
Adj.EBITDA
Op FCF
4%
-22%
Adj.EBITDA
Op FCF
HOT – FINANCIALSBLENDED PROFITABILITY SIGNIFICANTLY AFFECTED BY MOBILE SEGMENT
EBITDA and Operating Free Cash Flow Margin 2015 YTD
Fixed Blended Mobile
3
21
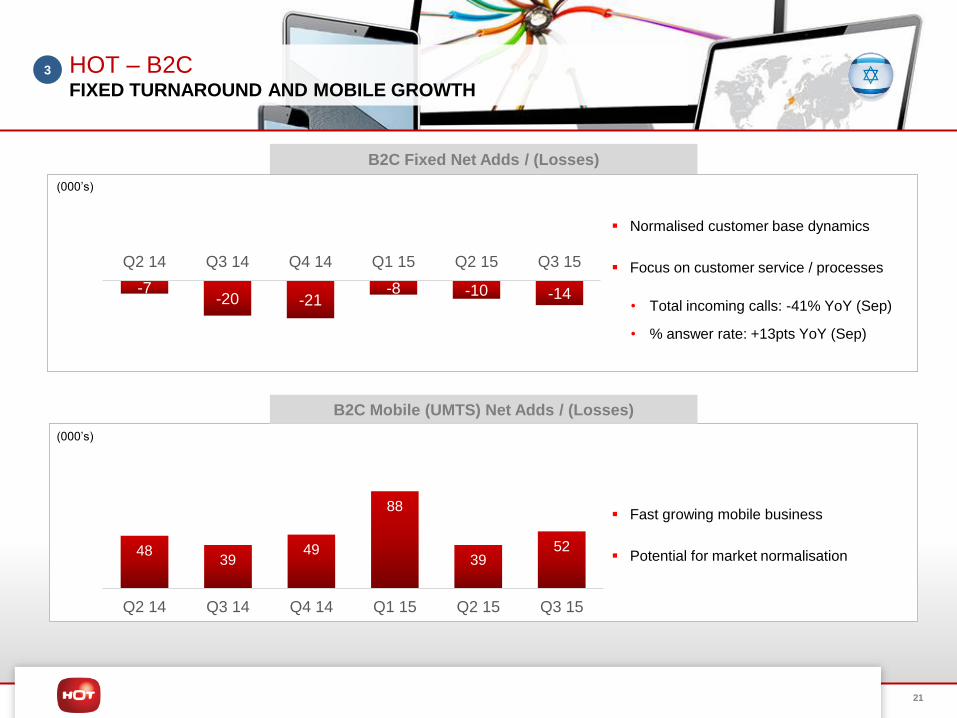
HOT – B2CFIXED TURNAROUND AND MOBILE GROWTH
4839
49
88
3952
Q2 14 Q3 14 Q4 14 Q1 15 Q2 15 Q3 15
B2C Fixed Net Adds / (Losses)
-7-20 -21
-8 -10 -14
Q2 14 Q3 14 Q4 14 Q1 15 Q2 15 Q3 15
B2C Mobile (UMTS) Net Adds / (Losses)
Normalised customer base dynamics
Focus on customer service / processes
• Total incoming calls: -41% YoY (Sep)
• % answer rate: +13pts YoY (Sep)
Fast growing mobile business
Potential for market normalisation
3
(000’s)
(000’s)

22
ORANGE DOMINICANA - TRICOMSUCCESSFUL RESTRUCTURING CASE STUDY
4
G&A: spending controls, linked to personnel
Customer service: bad debt, bank commissions, call center optimisation
Marketing and sales: media production and buying savings
IT simplification / upgrading
Billing system migration
In-sourcing
Network + operations: c.65% of total
Further efficiencies in 2015
C.450 retired by suppliers
Workforce (Internal) IT – Total Cost of Ownership Network – Total Cost of Ownership (1)
3 158
2 389
2013 2014
1 2 3
-24%
# % of Revenue % of Revenue
2,5%
1,8%
1,0%
2013 2014 …..
17,7%
12,1%
2013 2014 …..
Despite
aggressive
network build-out
< 2013 in total
value
1 Excluding fuel
4
5
6

23
ORANGE DOMINICANA - TRICOMRESTRUCTURING CASE STUDY
4
Mobile Subscribers Cable RGUs Financials (lcl)
Q3 15 vs. Q1 14
+3.0%Total
+14.1%Postpaid
+0.6%Prepaid
Q3 15 vs. Q1 14
+44.6%Total
+11.7%Pay-TV
+74%Broadband
Q3 15 vs. Q1 14
+1.5%Revenue
+25.3%EBITDA
Margin
+9.5pts
Successful growth model not affected by significant restructuring
Orange Dominicana / Tricom winning market share

24
NOT AN OFFER TO SELL OR SOLICITATION OF AN OFFER
TO PURCHASE SECURITIES
This presentation does not constitute or form part of, and should not be construed as,
an offer or invitation to sell securities of Altice N.V. or any of its affiliates (collectively
the “Altice Group”) or the solicitation of an offer to subscribe for or purchase securities
of the Altice Group, and nothing contained herein shall form the basis of or be relied on
in connection with any contract or commitment whatsoever. Any decision to purchase
any securities of the Altice Group should be made solely on the basis of the final terms
and conditions of the securities and the information to be contained in the offering
memorandum produced in connection with the offering of such securities. Prospective
investors are required to make their own independent investigations and appraisals of
the business and financial condition of the Altice Group and the nature of the securities
before taking any investment decision with respect to securities of the Altice Group.
Any such offering memorandum may contain information different from the information
contained herein.
FORWARD-LOOKING STATEMENTS
Certain statements in this presentation constitute forward-looking statements within the
meaning of the Private Securities Litigation Reform Act of 1995. These forward-looking
statements include, but are not limited to, all statements other than statements of
historical facts contained in this presentation, including, without limitation, those
regarding our intentions, beliefs or current expectations concerning, among other
things: our future financial conditions and performance, results of operations and
liquidity; our strategy, plans, objectives, prospects, growth, goals and targets; and
future developments in the markets in which we participate or are seeking to
participate. These forward-looking statements can be identified by the use of forward-
looking terminology, including the terms “believe”, “could”, “estimate”, “expect”,
“forecast”, “intend”, “may”, “plan”, “project” or “will” or, in each case, their negative, or
other variations or comparable terminology. Where, in any forward-looking statement,
we express an expectation or belief as to future results or events, such expectation or
belief is expressed in good faith and believed to have a reasonable basis, but there
can be no assurance that the expectation or belief will result or be achieved or
accomplished. To the extent that statements in this press release are not recitations of
historical fact, such statements constitute forward-looking statements, which, by
definition, involve risks and uncertainties that could cause actual results to differ
materially from those expressed or implied by such statements.
FINANCIAL MEASURES
This presentation contains measures and ratios (the “Non-IFRS Measures”), including
EBITDA and Operating Free Cash Flow that are not required by, or presented in
accordance with, IFRS or any other generally accepted accounting standards. We
present Non-IFRS or any other generally accepted accounting standards. We present
Non-IFRS measures because we believe that they are of interest for the investors and
similar measures are widely used by certain investors, securities analysts and other
interested parties as supplemental measures of performance and liquidity. The Non-
IFRS measures may not be comparable to similarly titled measures of other
companies, have limitations as analytical tools and should not be considered in
isolation or as a substitute for analysis of our, or any of our subsidiaries’, operating
results as reported under IFRS or other generally accepted accounting standards.
Non-IFRS measures such as EBITDA are not measurements of our, or any of our
subsidiaries’, performance or liquidity under IFRS or any other generally accepted
accounting principles. In particular, you should not consider EBITDA as an alternative
to (a) operating profit or profit for the period (as determined in accordance with IFRS)
as a measure of our, or any of our operating entities’, operating performance, (b) cash
flows from operating, investing and financing activities as a measure of our, or any of
our subsidiaries’, ability to meet its cash needs or (c) any other measures of
performance under IFRS or other generally accepted accounting standards. In
addition, these measures may also be defined and calculated differently than the
corresponding or similar terms under the terms governing our existing debt.
EBITDA and similar measures are used by different companies for differing purposes
and are often calculated in ways that reflect the circumstances of those companies.
You should exercise caution in comparing EBITDA as reported by us to EBITDA of
other companies. EBITDA as presented herein differs from the definition of
“Consolidated Combined EBITDA” for purposes of any the indebtedness of the Altice
Group. The information presented as EBITDA is unaudited. In addition, the
presentation of these measures is not intended to and does not comply with the
reporting requirements of the U.S. Securities and Exchange Commission (the “SEC”)
and will not be subject to review by the SEC; compliance with its requirements would
require us to make changes to the presentation of this information.
DISCLAIMER