Morgan Stanley ‘Questions in Energy’ Conference · Morgan Stanley ‘Questions in Energy’...
28
Morgan Stanley ‘Questions in Energy’ Conference December 15, 2005
Transcript of Morgan Stanley ‘Questions in Energy’ Conference · Morgan Stanley ‘Questions in Energy’...
Morgan Stanley‘Questions in Energy’ Conference
December 15, 2005
2
This presentation contains forward looking statements, includingThis presentation contains forward looking statements, including these, within the meaning of these, within the meaning of Section 27A of the Securities Act of 1933, as amended and SectioSection 27A of the Securities Act of 1933, as amended and Section 21E of the Exchange Act n 21E of the Exchange Act of 1934, as amended. Forward looking statements are not guarantof 1934, as amended. Forward looking statements are not guarantees of performance. They ees of performance. They involve risks, uncertainties and assumptions. The future resultinvolve risks, uncertainties and assumptions. The future results and securities values of s and securities values of Kinder Morgan Inc., Kinder Morgan Energy Partners, L.P. and KindKinder Morgan Inc., Kinder Morgan Energy Partners, L.P. and Kinder Morgan Management, er Morgan Management, LLC (collectively known as LLC (collectively known as ““Kinder MorganKinder Morgan””) may differ materially from those expressed in ) may differ materially from those expressed in the forwardthe forward--looking statements contained throughout this presentation and inlooking statements contained throughout this presentation and in documents filed documents filed with the SEC. Many of the factors that will determine these reswith the SEC. Many of the factors that will determine these results and values are beyond ults and values are beyond Kinder Morgan's ability to control or predict. These statementsKinder Morgan's ability to control or predict. These statements are necessarily based upon are necessarily based upon various assumptions involving judgments with respect to the futuvarious assumptions involving judgments with respect to the future, including, among others, re, including, among others, completion of the proposed transaction and realization of the becompletion of the proposed transaction and realization of the benefits there from, the ability to nefits there from, the ability to achieve synergies and revenue growth; national, international, rachieve synergies and revenue growth; national, international, regional and local economic, egional and local economic, competitive and regulatory conditions and developments; technolocompetitive and regulatory conditions and developments; technological developments; capital gical developments; capital markets conditions; inflation rates; interest rates; the politicmarkets conditions; inflation rates; interest rates; the political and economic stability of oil al and economic stability of oil producing nations; energy markets; weather conditions; environmeproducing nations; energy markets; weather conditions; environmental conditions; business ntal conditions; business and regulatory or legal decisions; the pace of deregulation of rand regulatory or legal decisions; the pace of deregulation of retail natural gas and electricity etail natural gas and electricity and certain agricultural products; the timing and success of busand certain agricultural products; the timing and success of business development efforts; iness development efforts; terrorism; and other uncertainties. You are cautioned not to puterrorism; and other uncertainties. You are cautioned not to put undue reliance on any t undue reliance on any forwardforward--looking statement. looking statement.
Forward Looking Statements
3
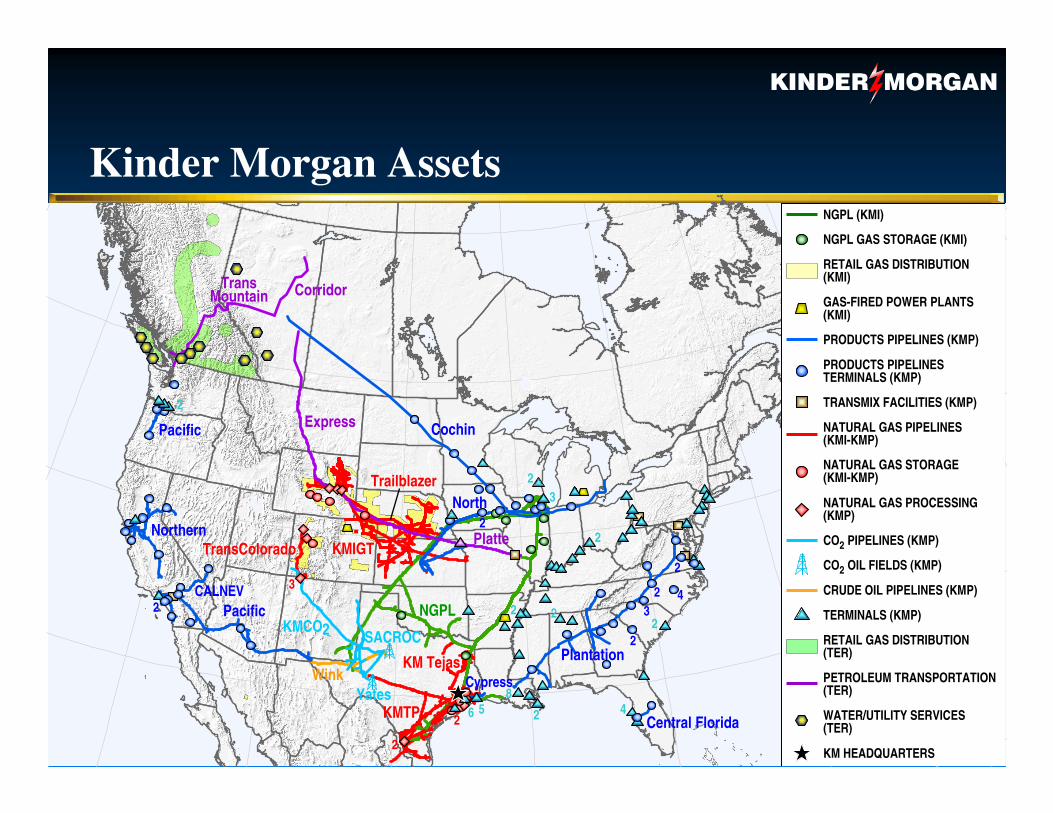
Kinder Morgan AssetsNGPL (KMI)
NGPL GAS STORAGE (KMI)
RETAIL GAS DISTRIBUTION(KMI)
GAS-FIRED POWER PLANTS (KMI)
PRODUCTS PIPELINES (KMP)
PRODUCTS PIPELINESTERMINALS (KMP)
TRANSMIX FACILITIES (KMP)
NATURAL GAS PIPELINES(KMI-KMP)
NATURAL GAS STORAGE(KMI-KMP)
NATURAL GAS PROCESSING(KMP)
CO2 PIPELINES (KMP)
CO2 OIL FIELDS (KMP)
CRUDE OIL PIPELINES (KMP)
TERMINALS (KMP)
KM HEADQUARTERS
RETAIL GAS DISTRIBUTION(TER)
PETROLEUM TRANSPORTATION(TER)
WATER/UTILITY SERVICES(TER)
2
Pacific
NorthernTransColorado
2 PacificCALNEV
KMCO2
2
2KMTP
KM TejasWink
SACROC
Yates6 5 2
22
Plantation
Cypress
NGPL
8
Central Florida4
2
2
2 43
2
23
2KMIGT
Trailblazer
3
Cochin
North
Express
Platte
CorridorTransMountain
2
4
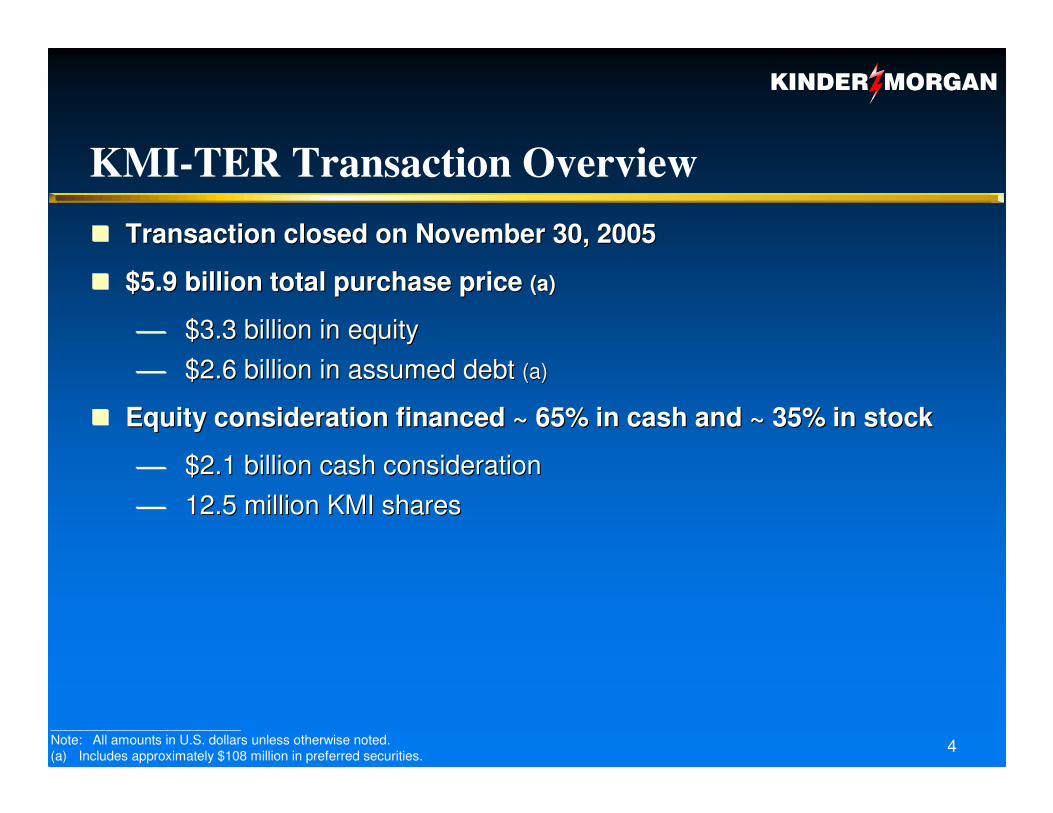
KMI-TER Transaction Overview�� Transaction closed on November 30, 2005Transaction closed on November 30, 2005
�� $5.9 billion total purchase price $5.9 billion total purchase price (a)(a)
$3.3 billion in equity$3.3 billion in equity $2.6 billion in assumed debt $2.6 billion in assumed debt (a)(a)
�� Equity consideration financed ~ 65% in cash and ~ 35% in stockEquity consideration financed ~ 65% in cash and ~ 35% in stock
$2.1 billion cash consideration$2.1 billion cash consideration 12.5 million KMI shares12.5 million KMI shares
__________________________Note: All amounts in U.S. dollars unless otherwise noted.(a) Includes approximately $108 million in preferred securities.
5
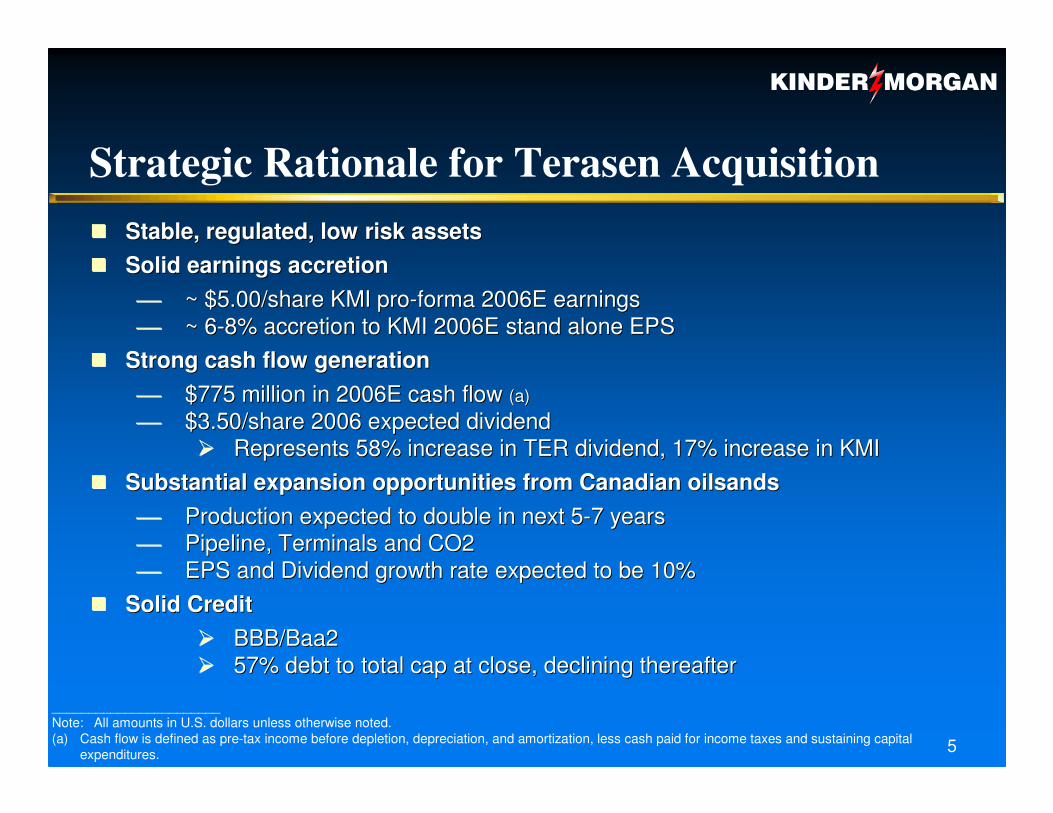
Strategic Rationale for Terasen Acquisition
_______________________Note: All amounts in U.S. dollars unless otherwise noted.(a) Cash flow is defined as pre-tax income before depletion, depreciation, and amortization, less cash paid for income taxes and sustaining capital
expenditures.
�� Stable, regulated, low risk assets Stable, regulated, low risk assets �� Solid earnings accretionSolid earnings accretion
~ $5.00/share KMI pro~ $5.00/share KMI pro--forma 2006E earnings forma 2006E earnings ~ 6~ 6--8% accretion to KMI 2006E stand alone EPS8% accretion to KMI 2006E stand alone EPS
�� Strong cash flow generationStrong cash flow generation $775 million in 2006E cash flow $775 million in 2006E cash flow (a)(a)
$3.50/share 2006 expected dividend $3.50/share 2006 expected dividend �� Represents 58% increase in TER dividend, 17% increase in KMIRepresents 58% increase in TER dividend, 17% increase in KMI
�� Substantial expansion opportunities from Canadian Substantial expansion opportunities from Canadian oilsandsoilsands Production expected to double in next 5Production expected to double in next 5--7 years7 years Pipeline, Terminals and CO2Pipeline, Terminals and CO2 EPS and Dividend growth rate expected to be 10%EPS and Dividend growth rate expected to be 10%
�� Solid CreditSolid Credit�� BBB/Baa2BBB/Baa2�� 57% debt to total cap at close, declining thereafter57% debt to total cap at close, declining thereafter
6
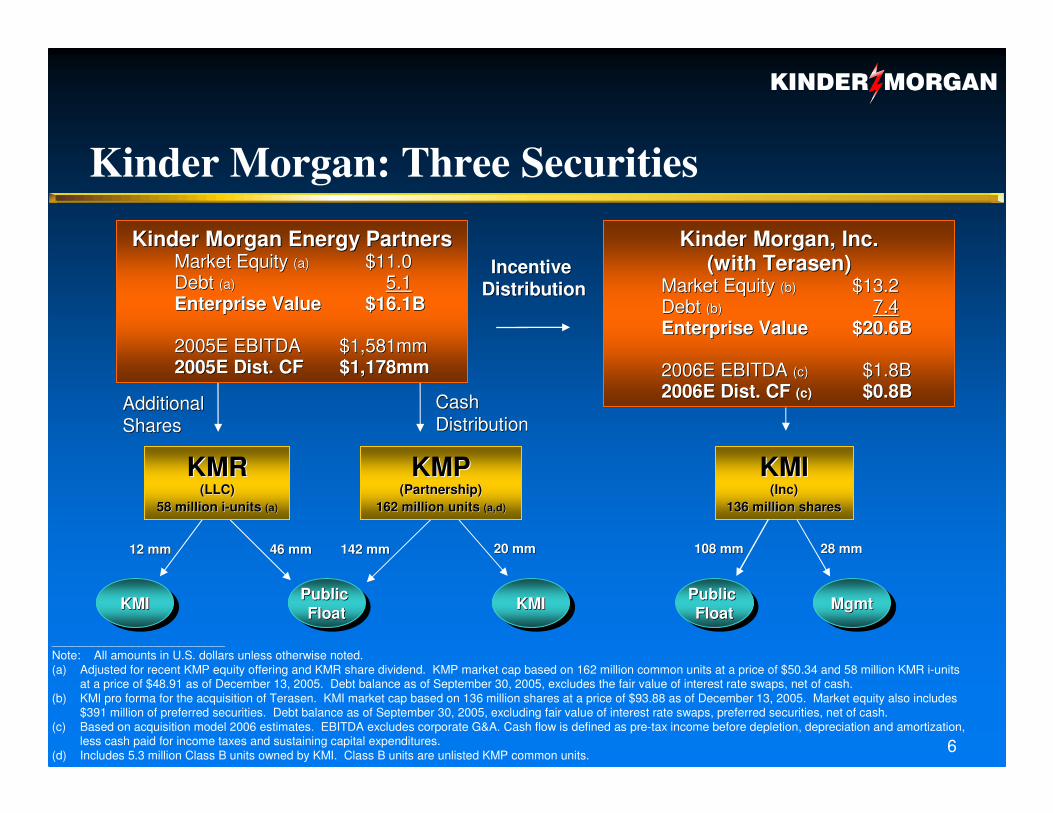
Kinder Morgan: Three Securities
__________________________Note: All amounts in U.S. dollars unless otherwise noted.(a) Adjusted for recent KMP equity offering and KMR share dividend. KMP market cap based on 162 million common units at a price of $50.34 and 58 million KMR i-units
at a price of $48.91 as of December 13, 2005. Debt balance as of September 30, 2005, excludes the fair value of interest rate swaps, net of cash. (b) KMI pro forma for the acquisition of Terasen. KMI market cap based on 136 million shares at a price of $93.88 as of December 13, 2005. Market equity also includes
$391 million of preferred securities. Debt balance as of September 30, 2005, excluding fair value of interest rate swaps, preferred securities, net of cash.(c) Based on acquisition model 2006 estimates. EBITDA excludes corporate G&A. Cash flow is defined as pre-tax income before depletion, depreciation and amortization,
less cash paid for income taxes and sustaining capital expenditures.(d) Includes 5.3 million Class B units owned by KMI. Class B units are unlisted KMP common units.
20 mm20 mm142 mm142 mm46 mm46 mm12 mm12 mm
CashCashDistributionDistribution
Additional Additional SharesShares
KMIKMIKMI Public Float
Public Public FloatFloat KMIKMIKMI
Kinder Morgan Energy Partners Kinder Morgan Energy Partners Market Equity Market Equity (a)(a) $11.0$11.0Debt Debt (a)(a) 5.15.1Enterprise ValueEnterprise Value $16.1B$16.1B
2005E EBITDA2005E EBITDA $1,581mm$1,581mm2005E Dist. CF2005E Dist. CF $1,178mm$1,178mm
KMRKMR(LLC)(LLC)
58 million i58 million i--units units (a)(a)
KMPKMP(Partnership)(Partnership)
162 million units 162 million units (a,d)(a,d)
KMIKMI(Inc)(Inc)
136 million shares136 million shares
MgmtMgmtMgmtPublic Float
Public Public FloatFloat
28 mm28 mm108 mm108 mm
Incentive Incentive DistributionDistribution
Kinder Morgan, Inc.Kinder Morgan, Inc.(with Terasen)(with Terasen)
Market Equity Market Equity (b)(b) $13.2$13.2Debt Debt (b)(b) 7.47.4Enterprise ValueEnterprise Value $20.6B$20.6B
2006E EBITDA 2006E EBITDA (c)(c) $1.8B$1.8B2006E Dist. CF 2006E Dist. CF (c)(c) $0.8B$0.8B
7
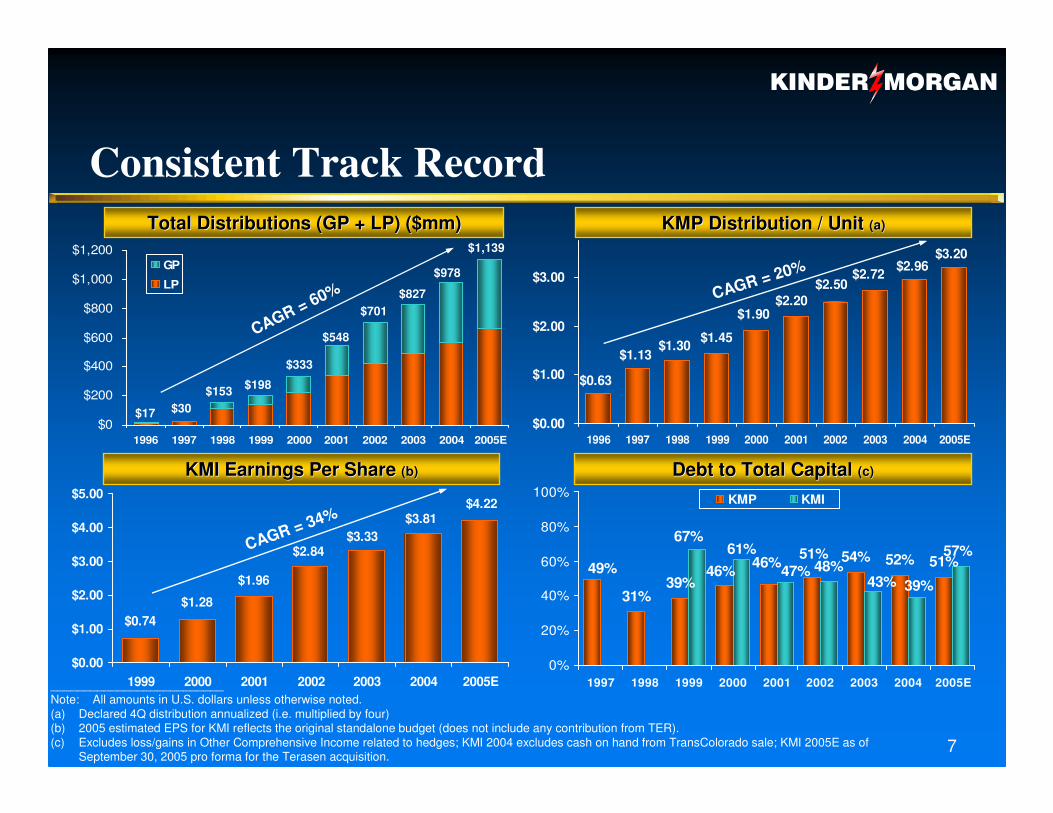
Consistent Track Record
Debt to Total Capital Debt to Total Capital (c)(c)
31%39%
54% 51%48%57%
46%49% 46% 51% 52%61%
67%
43% 39%47%
0%
20%
40%
60%
80%
100%
1997 1998 1999 2000 2001 2002 2003 2004 2005E
KMP KMI
__________________________Note: All amounts in U.S. dollars unless otherwise noted.(a) Declared 4Q distribution annualized (i.e. multiplied by four)(b) 2005 estimated EPS for KMI reflects the original standalone budget (does not include any contribution from TER).(c) Excludes loss/gains in Other Comprehensive Income related to hedges; KMI 2004 excludes cash on hand from TransColorado sale; KMI 2005E as of
September 30, 2005 pro forma for the Terasen acquisition.
KMI Earnings Per Share KMI Earnings Per Share (b)(b)
CAGR = 34%$4.22
$3.81$3.33
$2.84
$1.96
$1.28$0.74
$0.00
$1.00
$2.00
$3.00
$4.00
$5.00
1999 2000 2001 2002 2003 2004 2005E
$3.20$2.96$2.72
$2.50$2.20
$1.90
$1.45$1.30$1.13
$0.63
$0.00
$1.00
$2.00
$3.00
1996 1997 1998 1999 2000 2001 2002 2003 2004 2005E
CAGR = 20%
Total Distributions (GP + LP) ($mm)Total Distributions (GP + LP) ($mm)
$0
$200
$400
$600
$800
$1,000
$1,200
1996 1997 1998 1999 2000 2001 2002 2003 2004 2005E
GP
LP
CAGR = 60%
$17 $30$153 $198
$333
$548
$701$827
$978
KMP Distribution / Unit KMP Distribution / Unit (a)(a)
$1,139
8
Overview�� VisionVision
Find tsunamisFind tsunamis Create opportunitiesCreate opportunities
�� Operational ExcellenceOperational Excellence SafetySafety EnvironmentalEnvironmental EfficiencyEfficiency
�� Financial ExcellenceFinancial Excellence Cost control Cost control Disciplined capital allocationDisciplined capital allocation Bottom line performanceBottom line performance TransparencyTransparency
9
The Kinder Morgan Strategy
�� Focus on stable, feeFocus on stable, fee--based assets which are core to the energy infrastructure based assets which are core to the energy infrastructure of growing marketsof growing markets
�� Increase utilization of assets while controlling costsIncrease utilization of assets while controlling costs
Classic fixed cost businesses with little variable costs Classic fixed cost businesses with little variable costs
Improve productivity to drop all topImprove productivity to drop all top--line growth to bottom lineline growth to bottom line
�� Leverage economies of scale from incremental acquisitions and exLeverage economies of scale from incremental acquisitions and expansionspansions
Reduce needless overheadReduce needless overhead
Apply best practices to core operationsApply best practices to core operations
�� Maximize benefit of a unique financial structure which fits withMaximize benefit of a unique financial structure which fits with strategystrategy
MLP avoids double taxation, increasing distributions from high cMLP avoids double taxation, increasing distributions from high cash flow ash flow businessesbusinesses
Strong balance sheet allows flexibility when raising capital forStrong balance sheet allows flexibility when raising capital for acquisitions / acquisitions / expansionsexpansions
Same Strategy Since InceptionSame Strategy Since Inception
10
Management Philosophy�� Low Cost Asset OperatorLow Cost Asset Operator
�� Attention to DetailAttention to Detail
�� Disciplined Capital AllocationDisciplined Capital Allocation
�� Risk ManagementRisk Management
�� TransparencyTransparency
�� Cash is KingCash is King
�� Alignment of IncentivesAlignment of Incentives
�� Business Unit AutonomyBusiness Unit Autonomy
Kinder Morgan Energy Partners(KMP and KMR)
12
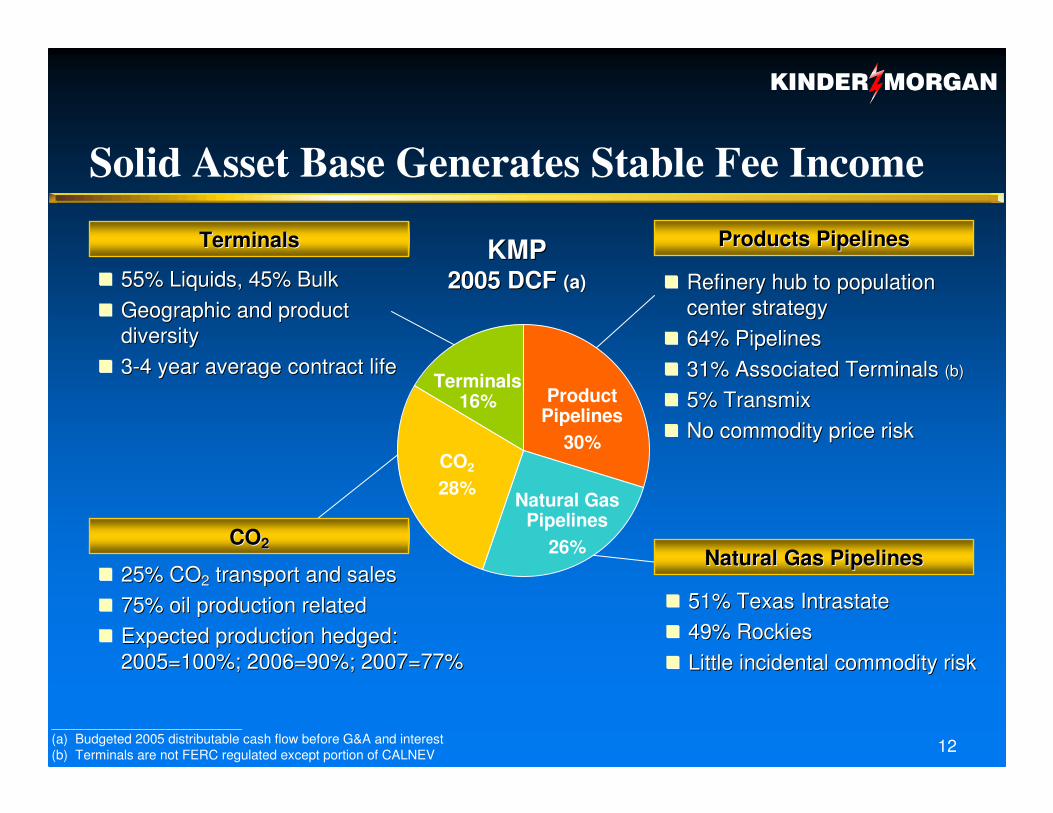
Solid Asset Base Generates Stable Fee Income
�� 51% Texas Intrastate51% Texas Intrastate�� 49% Rockies49% Rockies�� Little incidental commodity riskLittle incidental commodity risk
�� 25% CO25% CO22 transport and salestransport and sales�� 75% oil production related75% oil production related�� Expected production hedged:Expected production hedged:
2005=100%; 2006=90%; 2007=77%2005=100%; 2006=90%; 2007=77%
�� 55% Liquids, 45% Bulk55% Liquids, 45% Bulk�� Geographic and product Geographic and product
diversitydiversity�� 33--4 year average contract life4 year average contract life
�� Refinery hub to population Refinery hub to population center strategycenter strategy
�� 64% Pipelines64% Pipelines�� 31% Associated Terminals 31% Associated Terminals (b)(b)
�� 5% Transmix5% Transmix�� No commodity price riskNo commodity price risk
__________________________(a) Budgeted 2005 distributable cash flow before G&A and interest(b) Terminals are not FERC regulated except portion of CALNEV
Natural Gas PipelinesNatural Gas Pipelines
Products PipelinesProducts PipelinesTerminalsTerminals
COCO22
Product Pipelines
30%
Natural Gas Pipelines
26%
CO2
28%
Terminals16%
KMPKMP2005 DCF 2005 DCF (a)(a)
13
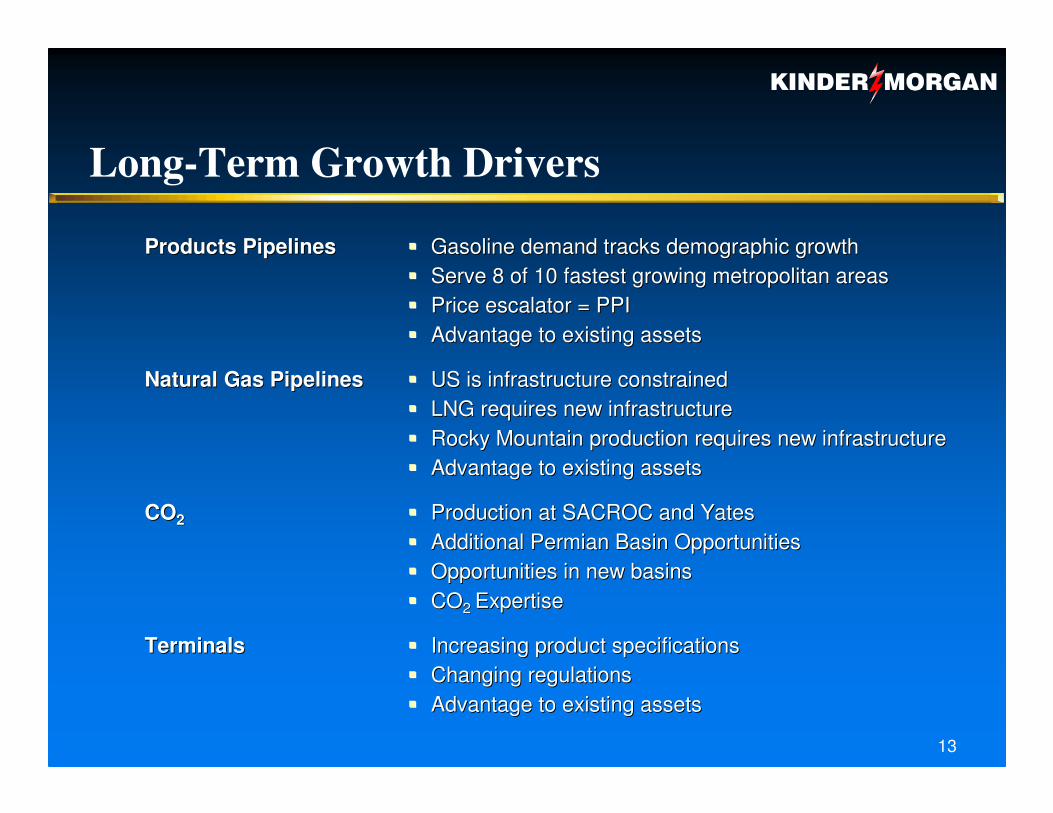
Long-Term Growth Drivers
�� Increasing product specificationsIncreasing product specifications�� Changing regulationsChanging regulations�� Advantage to existing assetsAdvantage to existing assets
TerminalsTerminals
�� Production at SACROC and YatesProduction at SACROC and Yates�� Additional Permian Basin OpportunitiesAdditional Permian Basin Opportunities�� Opportunities in new basinsOpportunities in new basins�� COCO2 2 ExpertiseExpertise
COCO22
�� US is infrastructure constrainedUS is infrastructure constrained�� LNG requires new infrastructureLNG requires new infrastructure�� Rocky Mountain production requires new infrastructureRocky Mountain production requires new infrastructure�� Advantage to existing assetsAdvantage to existing assets
Natural Gas PipelinesNatural Gas Pipelines
�� Gasoline demand tracks demographic growthGasoline demand tracks demographic growth�� Serve 8 of 10 fastest growing metropolitan areasServe 8 of 10 fastest growing metropolitan areas�� Price escalator = PPIPrice escalator = PPI�� Advantage to existing assetsAdvantage to existing assets
Products PipelinesProducts Pipelines
14
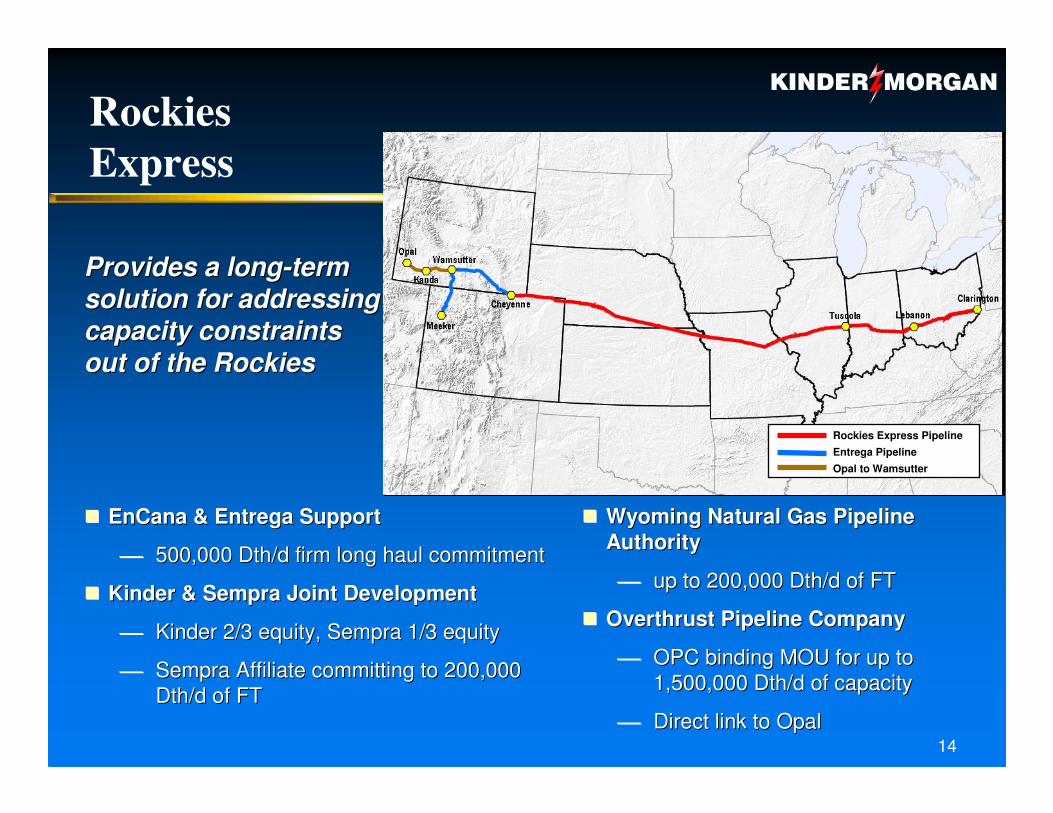
RockiesExpress
Rockies Express PipelineEntrega PipelineOpal to Wamsutter
Provides a longProvides a long--term term solution for addressing solution for addressing capacity constraints capacity constraints out of the Rockiesout of the Rockies
�� EnCana & Entrega SupportEnCana & Entrega Support
500,000 Dth/d firm long haul commitment500,000 Dth/d firm long haul commitment
�� Kinder & Sempra Joint DevelopmentKinder & Sempra Joint Development
Kinder 2/3 equity, Sempra 1/3 equityKinder 2/3 equity, Sempra 1/3 equity
Sempra Affiliate committing to 200,000 Sempra Affiliate committing to 200,000 Dth/d of FTDth/d of FT
�� Wyoming Natural Gas Pipeline Wyoming Natural Gas Pipeline AuthorityAuthority
up to 200,000 Dth/d of FTup to 200,000 Dth/d of FT
�� Overthrust Pipeline CompanyOverthrust Pipeline Company
OPC binding MOU for up to OPC binding MOU for up to 1,500,000 Dth/d of capacity1,500,000 Dth/d of capacity
Direct link to OpalDirect link to Opal
15
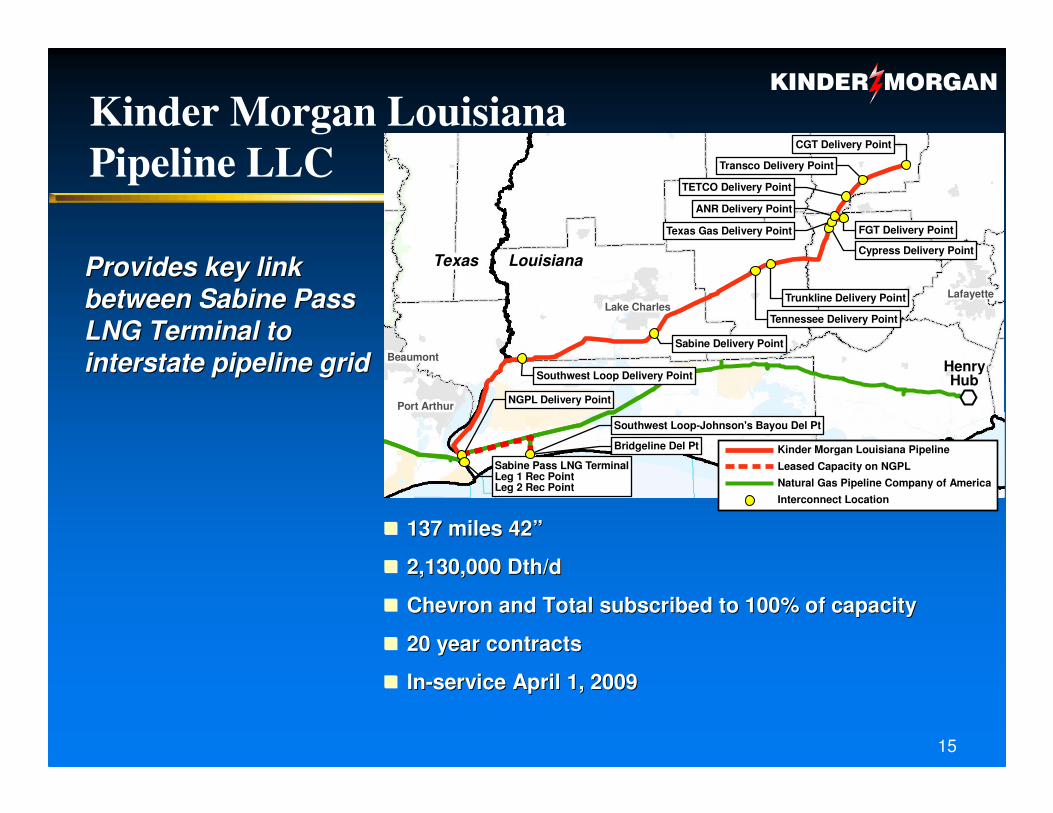
Kinder Morgan LouisianaPipeline LLC
Provides key link Provides key link between Sabine Pass between Sabine Pass LNG Terminal to LNG Terminal to interstate pipeline gridinterstate pipeline grid
�� 137 miles 42137 miles 42””
�� 2,130,000 2,130,000 Dth/dDth/d
�� Chevron and Total subscribed to 100% of capacityChevron and Total subscribed to 100% of capacity
�� 20 year contracts20 year contracts
�� InIn--service April 1, 2009service April 1, 2009
Texas Louisiana
Sabine Pass LNG TerminalLeg 1 Rec PointLeg 2 Rec Point
CGT Delivery Point
FGT Delivery Point
ANR Delivery Point
TETCO Delivery Point
Sabine Delivery Point
Transco Delivery Point
Cypress Delivery Point
Trunkline Delivery Point
Tennessee Delivery Point
Southwest Loop Delivery Point
NGPL Delivery Point
Texas Gas Delivery Point
Bridgeline Del Pt
Southwest Loop-Johnson's Bayou Del Pt
Port Arthur
LafayetteLake Charles
Beaumont
Kinder Morgan Louisiana PipelineLeased Capacity on NGPLNatural Gas Pipeline Company of AmericaInterconnect Location
HenryHub
16
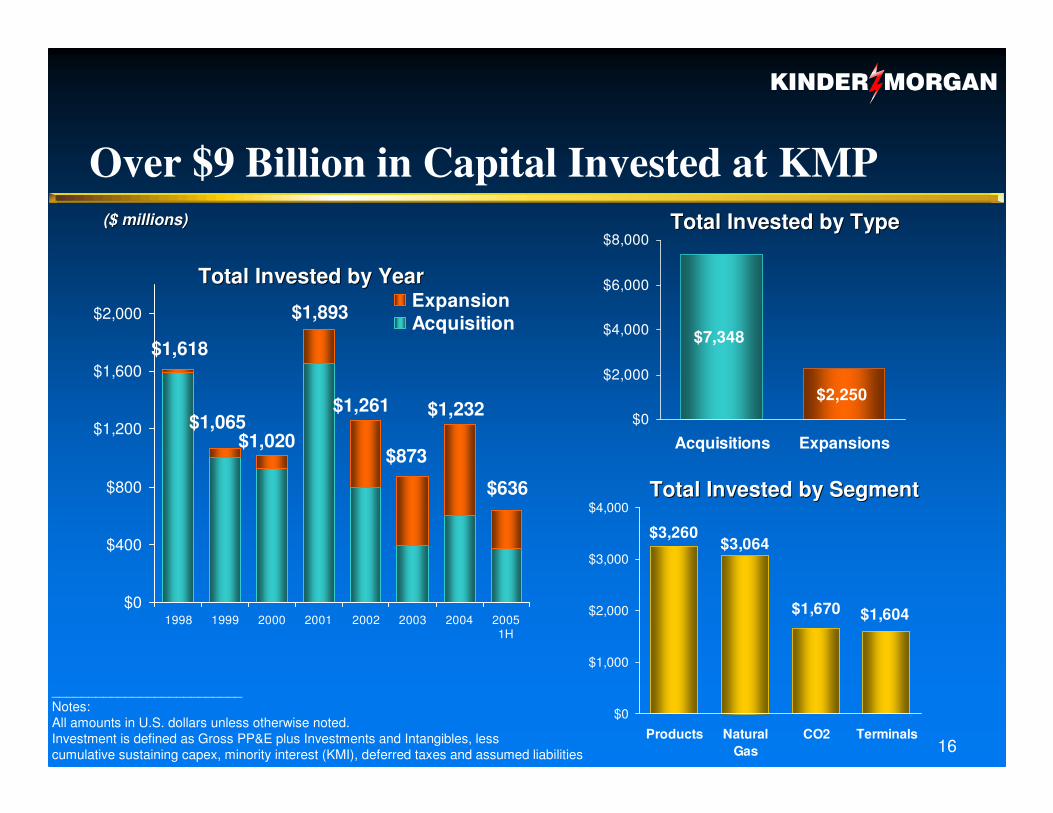
Over $9 Billion in Capital Invested at KMP
__________________________Notes:All amounts in U.S. dollars unless otherwise noted. Investment is defined as Gross PP&E plus Investments and Intangibles, lesscumulative sustaining capex, minority interest (KMI), deferred taxes and assumed liabilities
($ millions)($ millions)
$0
$400
$800
$1,200
$1,600
$2,000
1998 1999 2000 2001 2002 2003 2004 2005
ExpansionAcquisition
$7,348
$2,250$0
$2,000
$4,000
$6,000
$8,000
Acquisitions Expansions
$1,604$1,670
$3,064$3,260
$0
$1,000
$2,000
$3,000
$4,000
Products NaturalGas
CO2 Terminals
Total Invested by SegmentTotal Invested by Segment
Total Invested by TypeTotal Invested by Type
1H
Total Invested by YearTotal Invested by Year
$1,618
$1,065$1,020
$1,893
$1,261
$873
$1,232
$636
17
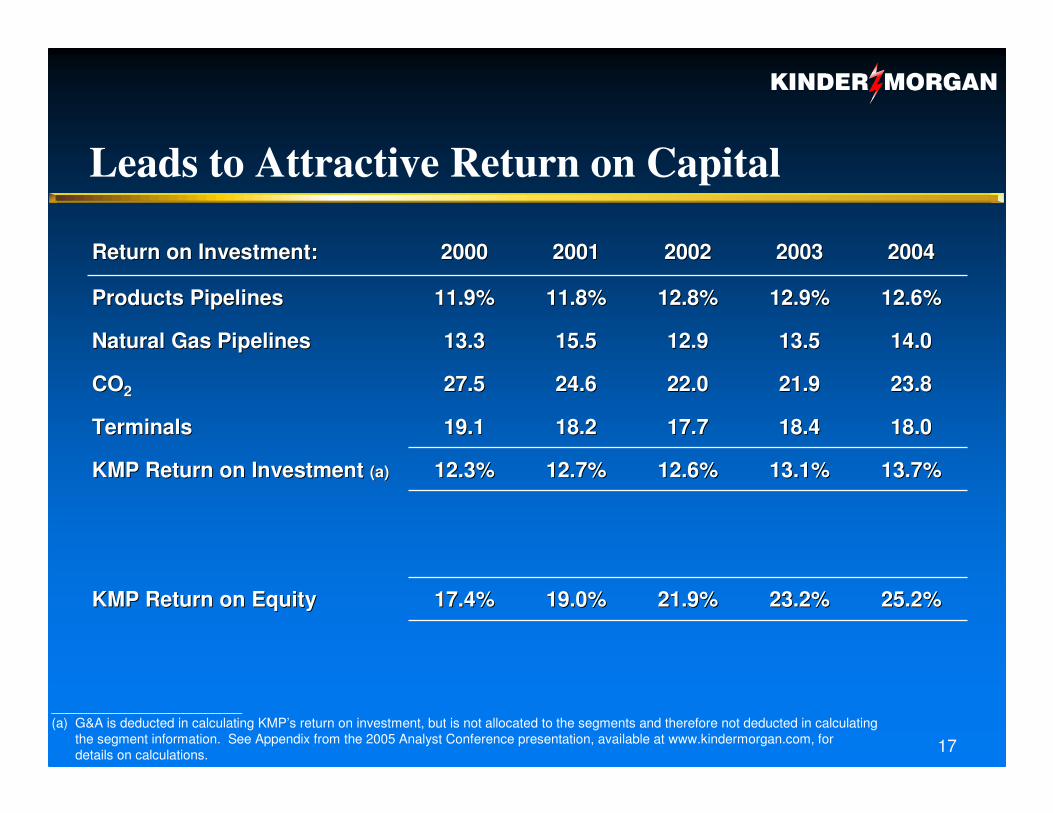
23.2%23.2%
13.1%13.1%
18.418.4
21.921.9
13.513.5
12.9%12.9%
20032003
13.7%13.7%12.6%12.6%12.7%12.7%12.3%12.3%KMP Return on Investment KMP Return on Investment (a)(a)
25.2%25.2%21.9%21.9%19.0%19.0%17.4%17.4%KMP Return on EquityKMP Return on Equity
18.018.017.717.718.218.219.119.1TerminalsTerminals
23.823.822.022.024.624.627.527.5COCO22
14.014.012.912.915.515.513.313.3Natural Gas PipelinesNatural Gas Pipelines
12.6%12.6%12.8%12.8%11.8%11.8%11.9%11.9%Products PipelinesProducts Pipelines
20042004200220022001200120002000Return on Investment:Return on Investment:
__________________________(a) G&A is deducted in calculating KMP’s return on investment, but is not allocated to the segments and therefore not deducted in calculating
the segment information. See Appendix from the 2005 Analyst Conference presentation, available at www.kindermorgan.com, fordetails on calculations.
Leads to Attractive Return on Capital
18
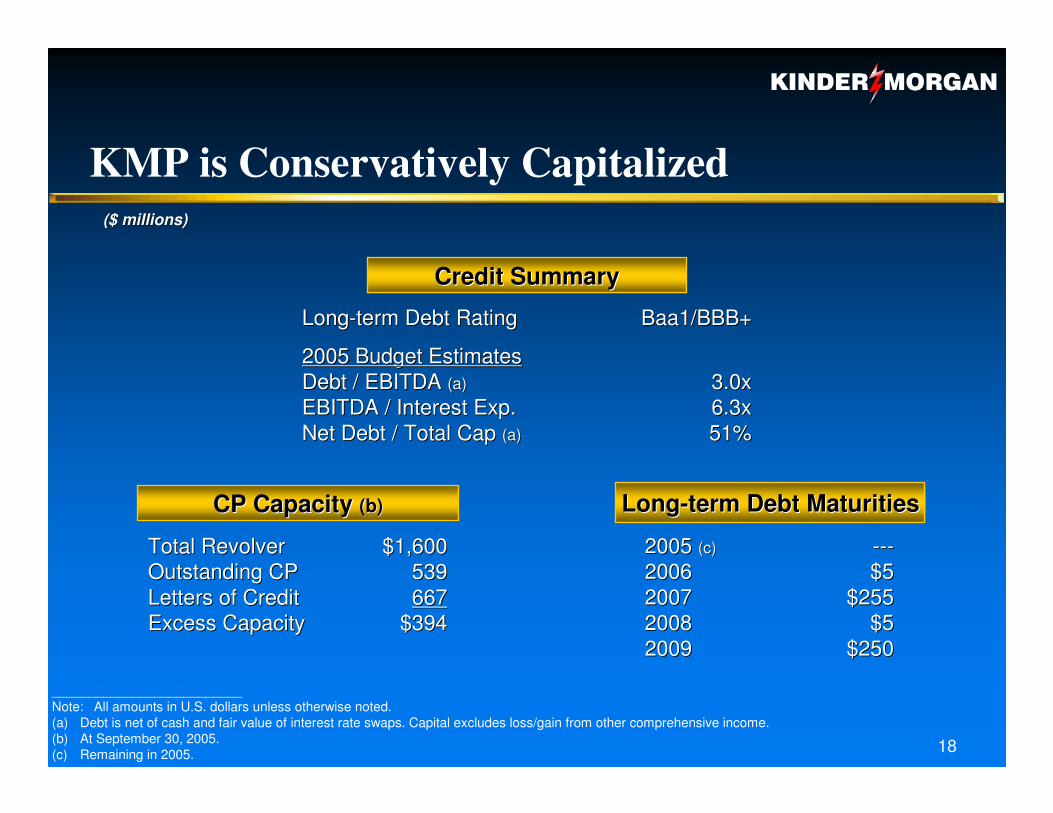
KMP is Conservatively Capitalized($ millions)($ millions)
__________________________Note: All amounts in U.S. dollars unless otherwise noted.(a) Debt is net of cash and fair value of interest rate swaps. Capital excludes loss/gain from other comprehensive income.(b) At September 30, 2005.(c) Remaining in 2005.
Credit SummaryCredit Summary
CP Capacity CP Capacity (b)(b) LongLong--term Debt Maturitiesterm Debt Maturities
539539Outstanding CPOutstanding CP667667Letters of Credit Letters of Credit
$394$394
$1,600$1,600
Excess CapacityExcess Capacity
Total RevolverTotal Revolver
51%51%Net Debt / Total Cap Net Debt / Total Cap (a)(a)
6.3x6.3xEBITDA / Interest Exp.EBITDA / Interest Exp.3.0x3.0x
Baa1/BBB+Baa1/BBB+LongLong--term Debt Ratingterm Debt Rating
2005 Budget Estimates2005 Budget EstimatesDebt / EBITDA Debt / EBITDA (a)(a)
$250$25020092009$5$520082008
$255$255$5$5------
20072007200620062005 2005 (c)(c)
Kinder Morgan, Inc. (KMI)
20
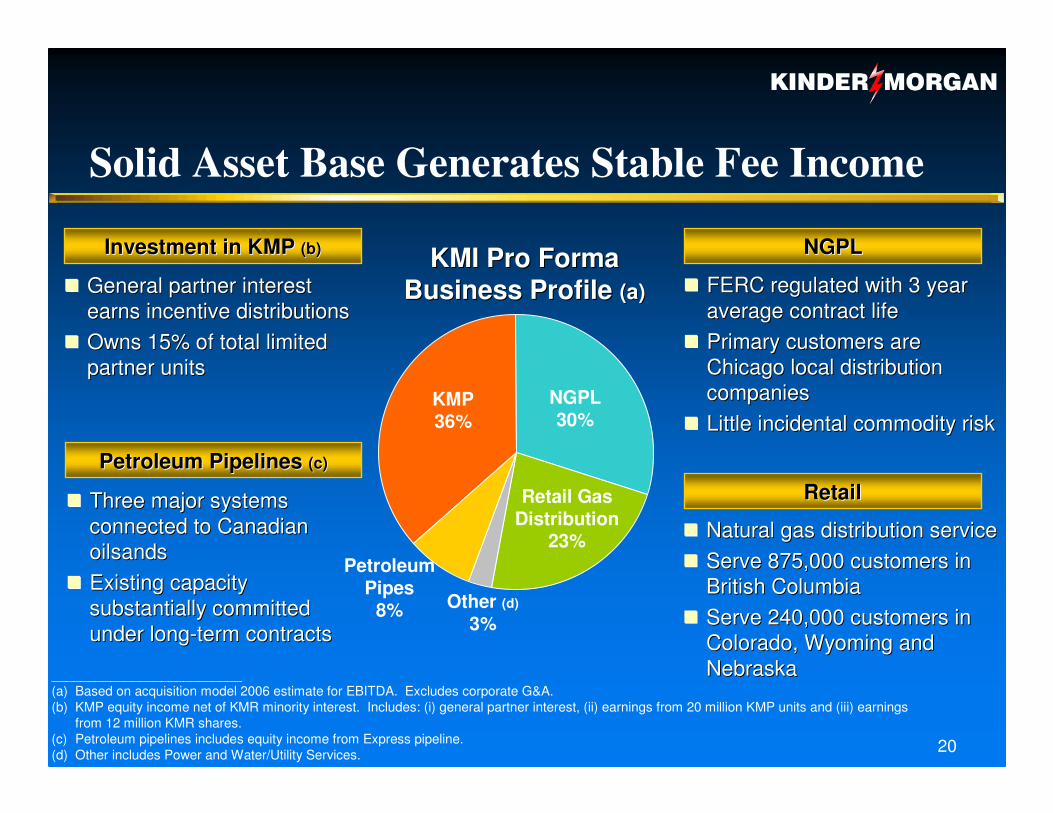
Solid Asset Base Generates Stable Fee Income
KMI Pro FormaKMI Pro FormaBusiness Profile Business Profile (a)(a)
__________________________(a) Based on acquisition model 2006 estimate for EBITDA. Excludes corporate G&A. (b) KMP equity income net of KMR minority interest. Includes: (i) general partner interest, (ii) earnings from 20 million KMP units and (iii) earnings
from 12 million KMR shares. (c) Petroleum pipelines includes equity income from Express pipeline.(d) Other includes Power and Water/Utility Services.
�� FERC regulated with 3 year FERC regulated with 3 year average contract life average contract life
�� Primary customers are Primary customers are Chicago local distribution Chicago local distribution companiescompanies
�� Little incidental commodity riskLittle incidental commodity risk
�� General partner interest General partner interest earns incentive distributionsearns incentive distributions
�� Owns 15% of total limited Owns 15% of total limited partner unitspartner units
Investment in KMP Investment in KMP (b)(b) NGPLNGPL
�� Natural gas distribution serviceNatural gas distribution service�� Serve 875,000 customers in Serve 875,000 customers in
British ColumbiaBritish Columbia�� Serve 240,000 customers in Serve 240,000 customers in
Colorado, Wyoming and Colorado, Wyoming and NebraskaNebraska
RetailRetailPetroleum Pipelines Petroleum Pipelines (c)(c)
�� Three major systems Three major systems connected to Canadian connected to Canadian oilsandsoilsands
�� Existing capacity Existing capacity substantially committed substantially committed under longunder long--term contractsterm contracts
NGPL30%
PetroleumPipes
8%
KMP36%
Retail GasDistribution
23%
Other (d)
3%
21
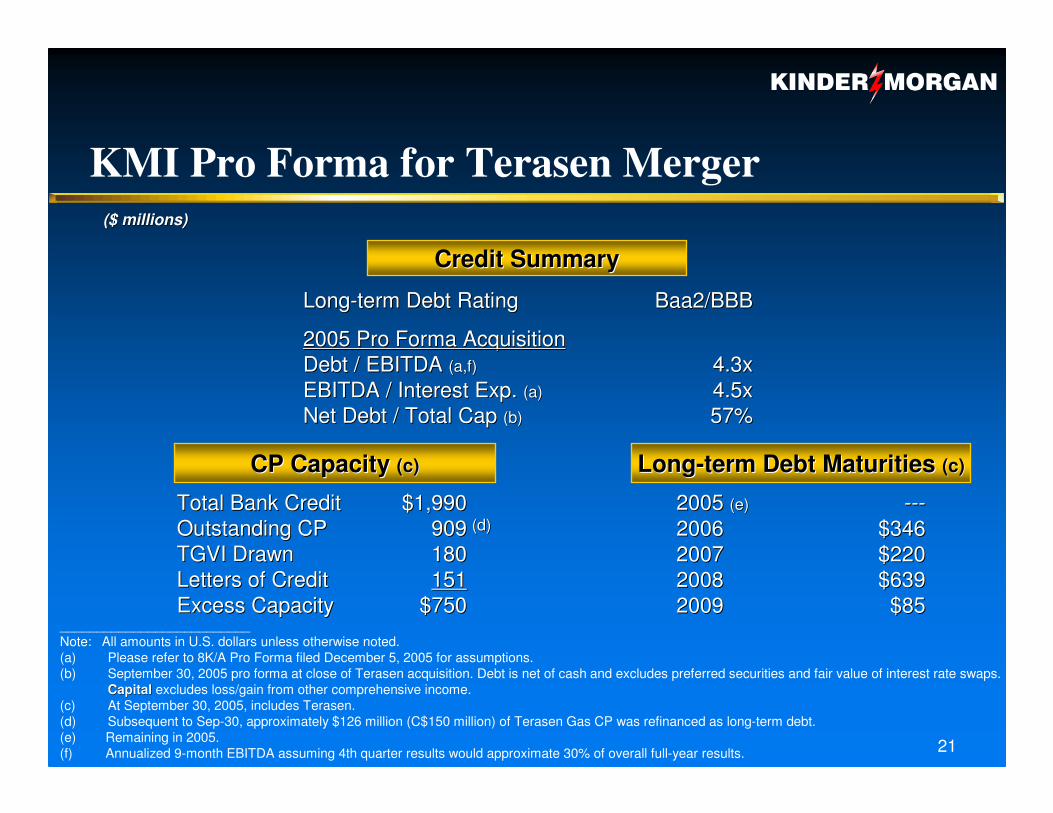
Credit SummaryCredit Summary
LongLong--term Debt Maturities term Debt Maturities (c)(c)
KMI Pro Forma for Terasen Merger
(d)(d)909909Outstanding CPOutstanding CP180180TGVI DrawnTGVI Drawn
$750$750151151
$1,990$1,990
Letters of CreditLetters of CreditExcess CapacityExcess Capacity
Total Bank CreditTotal Bank Credit
57%57%Net Debt / Total Cap Net Debt / Total Cap (b)(b)
4.5x4.5xEBITDA / Interest Exp. EBITDA / Interest Exp. (a)(a)
Baa2/BBBBaa2/BBBLongLong--term Debt Ratingterm Debt Rating
2005 Pro Forma Acquisition2005 Pro Forma Acquisition4.3x4.3xDebt / EBITDA Debt / EBITDA ((a,fa,f))
$85$8520092009$639$63920082008$220$22020072007$346$34620062006
------2005 2005 (e)(e)
($ millions)($ millions)
__________________________Note: All amounts in U.S. dollars unless otherwise noted.(a) Please refer to 8K/A Pro Forma filed December 5, 2005 for assumptions.(b) September 30, 2005 pro forma at close of Terasen acquisition. Debt is net of cash and excludes preferred securities and fair value of interest rate swaps.
Capital Capital excludes loss/gain from other comprehensive income.(c) At September 30, 2005, includes Terasen.(d) Subsequent to Sep-30, approximately $126 million (C$150 million) of Terasen Gas CP was refinanced as long-term debt.(e) Remaining in 2005. (f) Annualized 9-month EBITDA assuming 4th quarter results would approximate 30% of overall full-year results.
CP Capacity CP Capacity (c)(c)
22
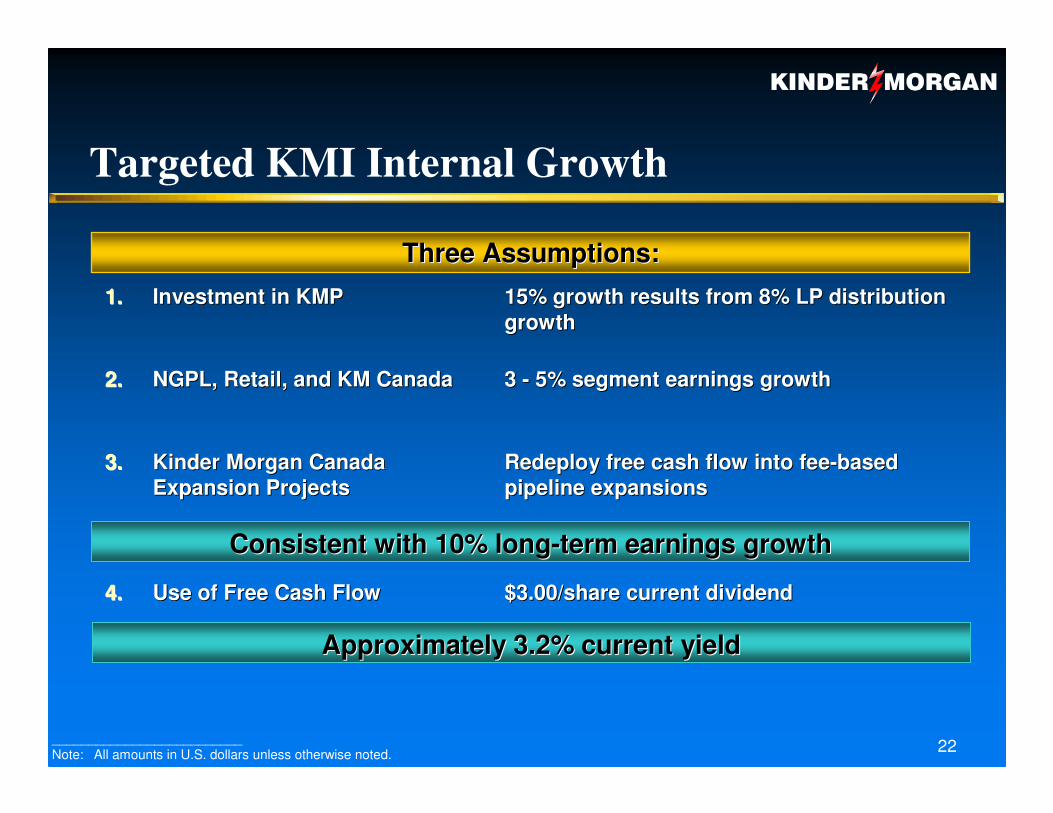
Targeted KMI Internal Growth
__________________________Note: All amounts in U.S. dollars unless otherwise noted.
Redeploy free cash flow into feeRedeploy free cash flow into fee--based based pipeline expansionspipeline expansions
3.3. Kinder Morgan Canada Kinder Morgan Canada Expansion ProjectsExpansion Projects
$3.00/share current dividend$3.00/share current dividend4.4. Use of Free Cash FlowUse of Free Cash Flow
3 3 -- 5% segment earnings growth5% segment earnings growth2.2. NGPL, Retail, and KM CanadaNGPL, Retail, and KM Canada
15% growth results from 8% LP distribution 15% growth results from 8% LP distribution growthgrowth
1.1. Investment in KMPInvestment in KMP
Consistent with 10% longConsistent with 10% long--term earnings growthterm earnings growth
Three Assumptions:Three Assumptions:
Approximately 3.2% current yield Approximately 3.2% current yield
23
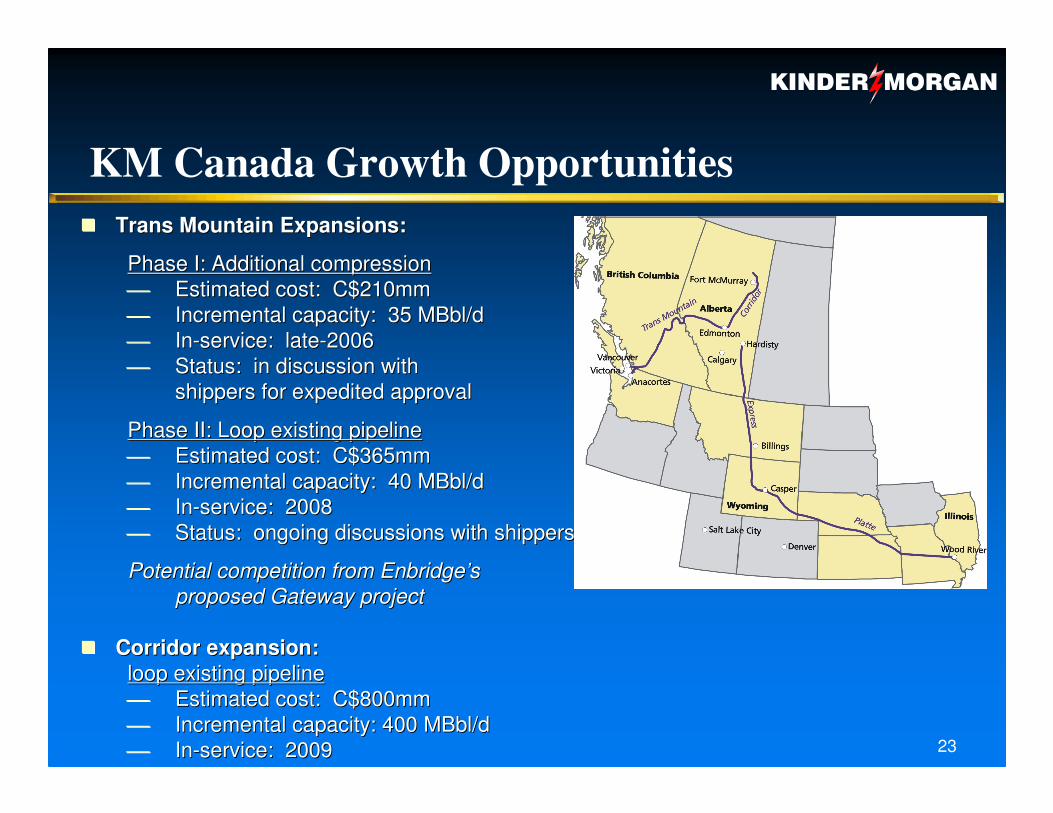
KM Canada Growth Opportunities�� Trans Mountain Expansions:Trans Mountain Expansions:
Phase I: Additional compressionPhase I: Additional compression Estimated cost: C$210mmEstimated cost: C$210mm Incremental capacity: 35 MBbl/dIncremental capacity: 35 MBbl/d InIn--service: lateservice: late--20062006 Status: in discussion withStatus: in discussion with
shippers for expedited approvalshippers for expedited approval
Phase II: Loop existing pipelinePhase II: Loop existing pipeline Estimated cost: C$365mmEstimated cost: C$365mm Incremental capacity: 40 MBbl/dIncremental capacity: 40 MBbl/d InIn--service: 2008service: 2008 Status: ongoing discussions with shippersStatus: ongoing discussions with shippers
Potential competition from EnbridgePotential competition from Enbridge’’ssproposed Gateway projectproposed Gateway project
�� Corridor expansion:Corridor expansion:loop existing pipelineloop existing pipeline Estimated cost: C$800mmEstimated cost: C$800mm Incremental capacity: 400 Incremental capacity: 400 MBbl/dMBbl/d InIn--service: 2009service: 2009
24
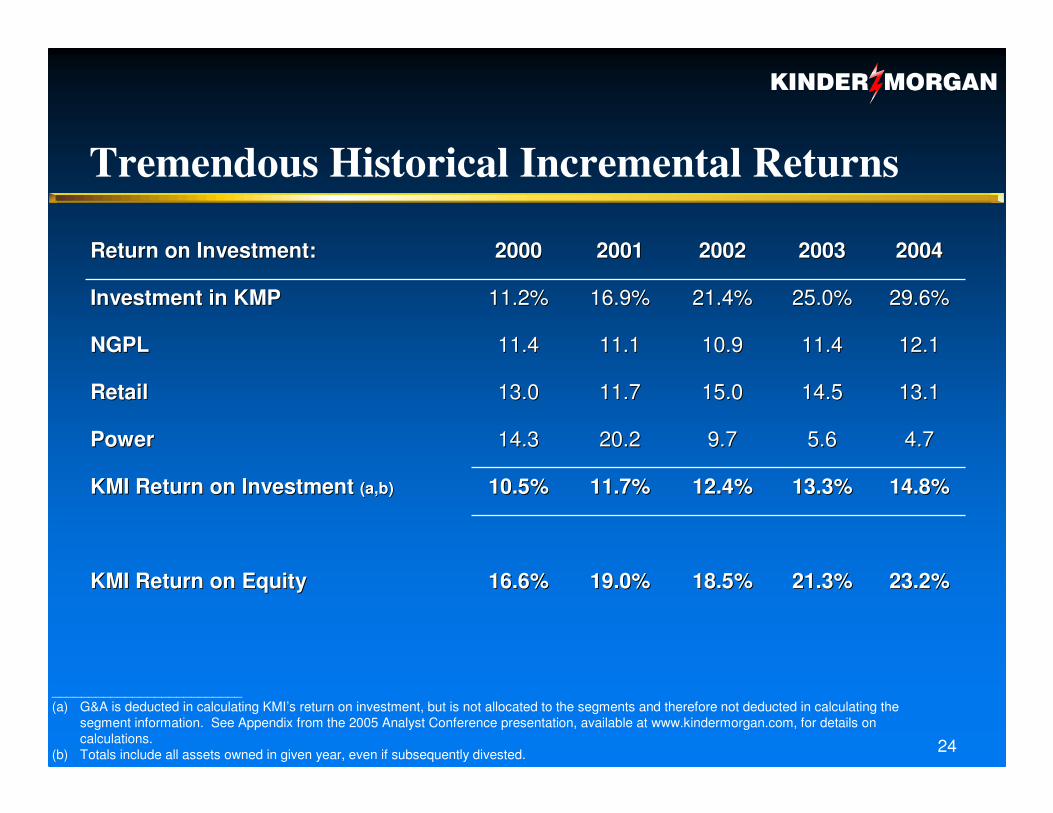
Tremendous Historical Incremental Returns
21.3%21.3%
13.3%13.3%
5.65.6
14.514.5
11.411.4
25.0%25.0%
20032003
14.8%14.8%12.4%12.4%11.7%11.7%10.5%10.5%KMI Return on Investment KMI Return on Investment (a,b)(a,b)
23.2%23.2%18.5%18.5%19.0%19.0%16.6%16.6%KMI Return on EquityKMI Return on Equity
4.74.79.79.720.220.214.314.3PowerPower
13.113.115.015.011.711.713.013.0RetailRetail
12.112.110.910.911.111.111.411.4NGPLNGPL
29.6%29.6%21.4%21.4%16.9%16.9%11.2%11.2%Investment in KMPInvestment in KMP
20042004200220022001200120002000Return on Investment:Return on Investment:
__________________________(a) G&A is deducted in calculating KMI’s return on investment, but is not allocated to the segments and therefore not deducted in calculating the
segment information. See Appendix from the 2005 Analyst Conference presentation, available at www.kindermorgan.com, for details on calculations.
(b) Totals include all assets owned in given year, even if subsequently divested.
25
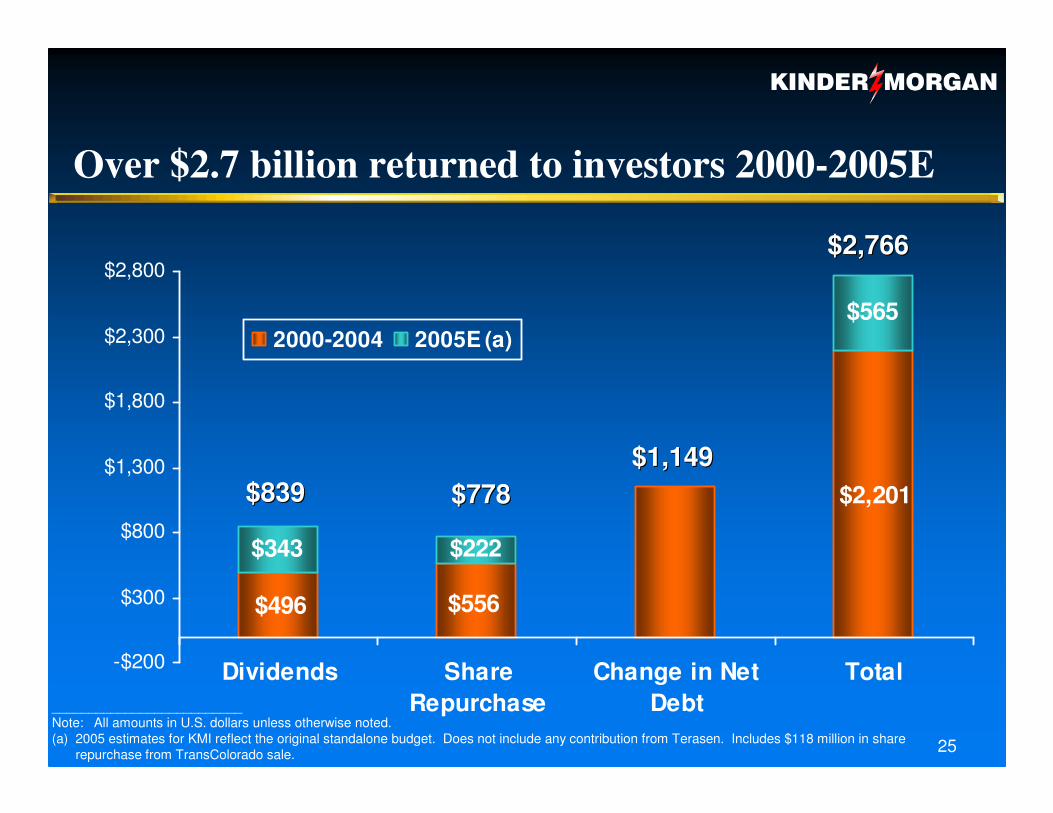
Over $2.7 billion returned to investors 2000-2005E
$343 $222
$565
$2,201
$496 $556
-$200
$300
$800
$1,300
$1,800
$2,300
$2,800
Dividends ShareRepurchase
Change in NetDebt
Total
2000-2004 2005E (a)
$839$839 $778$778
$2,766$2,766
__________________________Note: All amounts in U.S. dollars unless otherwise noted.(a) 2005 estimates for KMI reflect the original standalone budget. Does not include any contribution from Terasen. Includes $118 million in share
repurchase from TransColorado sale.
$1,149$1,149
26
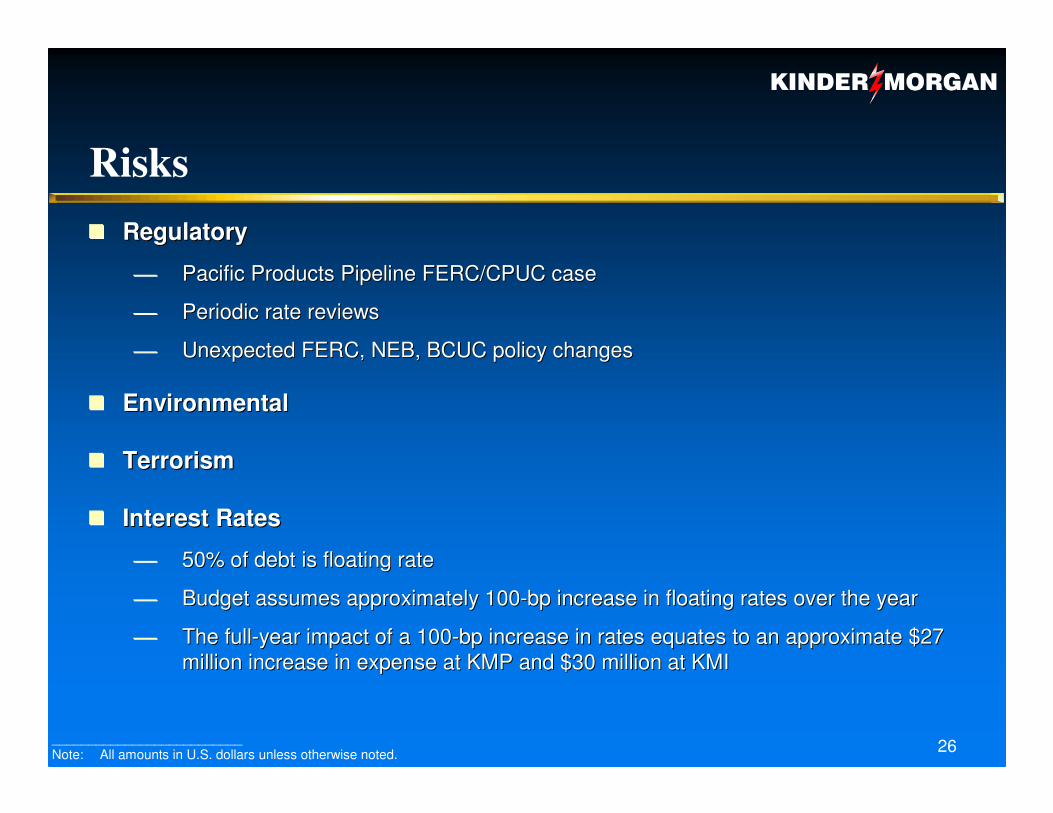
Risks�� RegulatoryRegulatory
Pacific Products Pipeline FERC/CPUC casePacific Products Pipeline FERC/CPUC case
Periodic rate reviewsPeriodic rate reviews
Unexpected FERC, NEB, BCUC policy changesUnexpected FERC, NEB, BCUC policy changes
�� EnvironmentalEnvironmental
�� TerrorismTerrorism
�� Interest RatesInterest Rates
50% of debt is floating rate50% of debt is floating rate
Budget assumes approximately 100Budget assumes approximately 100--bp increase in floating rates over the yearbp increase in floating rates over the year
The fullThe full--year impact of a 100year impact of a 100--bp increase in rates equates to an approximate $27 bp increase in rates equates to an approximate $27 million increase in expense at KMP and $30 million at KMImillion increase in expense at KMP and $30 million at KMI
__________________________Note: All amounts in U.S. dollars unless otherwise noted.
27
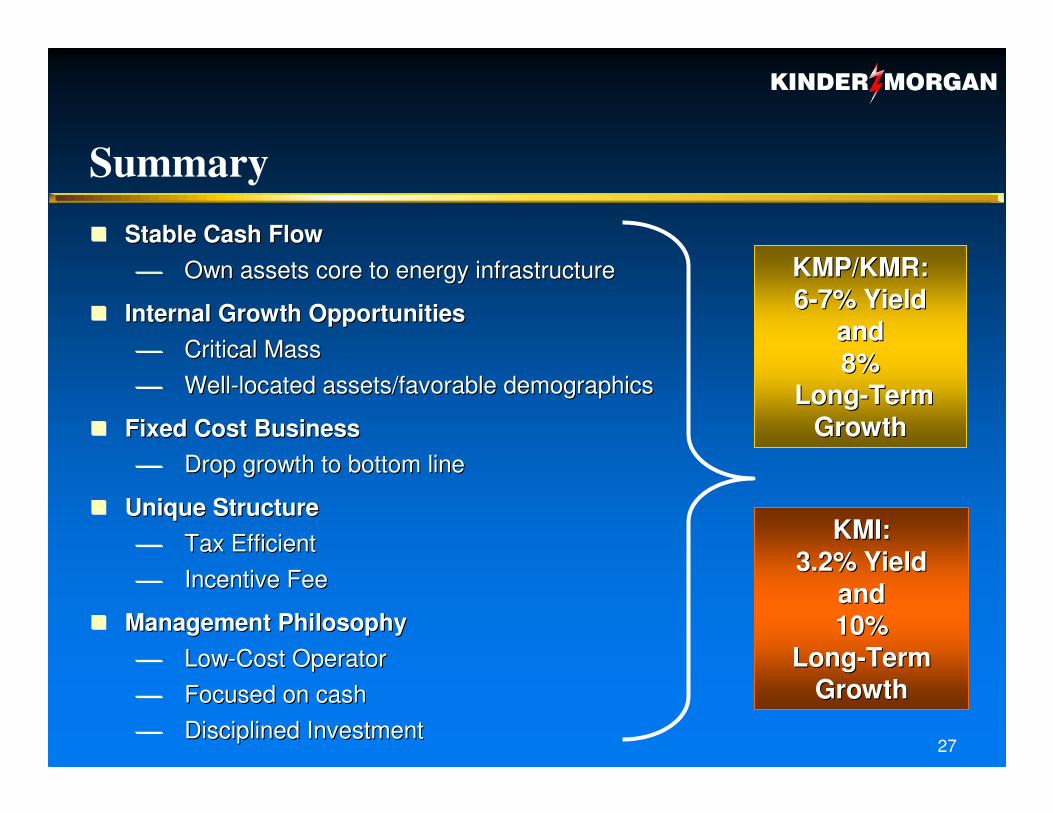
�� Stable Cash FlowStable Cash Flow Own assets core to energy infrastructureOwn assets core to energy infrastructure
�� Internal Growth OpportunitiesInternal Growth Opportunities Critical MassCritical Mass WellWell--located assets/favorable demographicslocated assets/favorable demographics
�� Fixed Cost BusinessFixed Cost Business Drop growth to bottom lineDrop growth to bottom line
�� Unique StructureUnique Structure Tax EfficientTax Efficient Incentive FeeIncentive Fee
�� Management Philosophy Management Philosophy LowLow--Cost OperatorCost Operator Focused on cashFocused on cash Disciplined InvestmentDisciplined Investment
KMI:KMI:3.2% Yield3.2% Yield
and and 10% 10%
LongLong--Term Term GrowthGrowth
KMP/KMR:KMP/KMR:66--7% Yield 7% Yield
andand8%8%
LongLong--TermTermGrowthGrowth
Summary