MORGAN STANLEY INDUSTRIALS & NATURAL RESOURCES SUMMIT/media/Files/A/Anglo-American-PLC-V2/... ·...
21
MORGAN STANLEY INDUSTRIALS & NATURAL RESOURCES SUMMIT Tony O’Neill, Technical Director, 10 September 2015 Kolomela mine – Kumba Iron Ore
Transcript of MORGAN STANLEY INDUSTRIALS & NATURAL RESOURCES SUMMIT/media/Files/A/Anglo-American-PLC-V2/... ·...
MORGAN STANLEY INDUSTRIALS &
NATURAL RESOURCES SUMMITTony O’Neill, Technical Director, 10 September 2015
Kolomela mine – Kumba Iron Ore

2
CAUTIONARY STATEMENTDisclaimer: This presentation has been prepared by Anglo American plc (“Anglo American”) and comprises the written materials/slides for a presentation concerning
Anglo American. By attending this presentation and/or reviewing the slides you agree to be bound by the following conditions.
This presentation is for information purposes only and does not constitute an offer to sell or the solicitation of an offer to buy shares in Anglo American. Further, it does not
constitute a recommendation by Anglo American or any other party to sell or buy shares in Anglo American or any other securit ies. All written or oral forward-looking statements
attributable to Anglo American or persons acting on their behalf are qualified in their entirety by these cautionary statements.
Forward-Looking Statements
This presentation includes forward-looking statements. All statements other than statements of historical facts included in this presentation, including, without limitation, those
regarding Anglo American’s financial position, business and acquisition strategy, plans and objectives of management for future operations (including development plans and
objectives relating to Anglo American’s products, production forecasts and reserve and resource positions), are forward-looking statements. By their nature, such forward-looking
statements involve known and unknown risks, uncertainties and other factors which may cause the actual results, performance or achievements of Anglo American, or industry
results, to be materially different from any future results, performance or achievements expressed or implied by such forward-looking statements.
Such forward-looking statements are based on numerous assumptions regarding Anglo American’s present and future business strateg ies and the environment in which
Anglo American will operate in the future. Important factors that could cause Anglo American’s actual results, performance or achievements to differ materially from those in the
forward-looking statements include, among others, levels of actual production during any period, levels of global demand and commodity market prices, mineral resource
exploration and development capabilities, recovery rates and other operational capabilities, the availability of mining and processing equipment, the ability to produce and
transport products profitably, the impact of foreign currency exchange rates on market prices and operating costs, the availability of sufficient credit, the effects of inflation, political
uncertainty and economic conditions in relevant areas of the world, the actions of competitors, activities by governmental authorities such as changes in taxation or safety, health,
environmental or other types of regulation in the countries where Anglo American operates, conflicts over land and resource ownership rights and such other risk factors identified
in Anglo American’s most recent Annual Report. Forward-looking statements should, therefore, be construed in light of such risk factors and undue reliance should not be placed
on forward-looking statements. These forward-looking statements speak only as of the date of this presentation. Anglo American expressly disclaims any obligation or undertaking
(except as required by applicable law, the City Code on Takeovers and Mergers (the “Takeover Code”), the UK Listing Rules, the Disclosure and Transparency Rules of the
Financial Conduct Authority, the Listings Requirements of the securities exchange of the JSE Limited in South Africa, the SWX Swiss Exchange, the Botswana Stock Exchange
and the Namibian Stock Exchange and any other applicable regulations) to release publicly any updates or revisions to any forward-looking statement contained herein to reflect
any change in Anglo American’s expectations with regard thereto or any change in events, conditions or circumstances on which any such statement is based.
Nothing in this presentation should be interpreted to mean that future earnings per share of Anglo American will necessarily match or exceed its historical published earnings
per share.
Certain statistical and other information about Anglo American included in this presentation is sourced from publicly available third party sources. As such it presents the views of
those third parties, but may not necessarily correspond to the views held by Anglo American.
No Investment Advice
This presentation has been prepared without reference to your particular investment objectives, financial situation, taxation position and particular needs. It is important that you
view this presentation in its entirety. If you are in any doubt in relation to these matters, you should consult your stockbroker, bank manager, solicitor, accountant, taxation adviser
or other independent financial adviser (where applicable, as authorised under the Financial Services and Markets Act 2000 in the UK, or in South Africa, under the Financial
Advisory and Intermediary Services Act 37 of 2002).

3
• MAJOR PROJECTS…on track and below budget
• OPERATIONS…improvements accelerating
• VALUE LEAKAGE…revenues and cost focus
• NEXT 18 MONTHS…improvements accelerated
– $400m production driven volume benefits
– $800m operating cost reduction
– $300m support cost reduction
– Capex guidance reduced by up to $1bn
FOCUS ON DELIVERY
At the mid-point of our transformation programme…
…we are well on track to meet our delivery targets.
1.7
1.1 0.3
0.3
Volume -
productivity
Total
0.6
Costs
$1.7bn delivered 2013, 2014 & H1 2015
0.8
1.5
0.4
0.3
Costs TotalVolume -
productivity
1.1
$1.5bn target H2 2015 & 2016
Operating costs
Studies & exploration

4
Afterdisposals
PORTFOLIO QUALITY…COMPETITIVE POSITIONS
Reflecting current project completions and portfolio restructure…
…with industry leading assets driving returns across the portfolio.
Before
WithQuellaveco
Afterdisposals
Q1 Q2
Aggregate Business Unit cost curve position - 2014
Q3 Q4
Cu equiv.
production
400kt
De Beers
Nickel
Platinum
Iron Ore
Met Coal
Thermal Coal
Copper
Before
Afterdisposals
MoranbahGrasstree
Mogalakwena
Jwaneng
Cerrejon
Quellaveco(1)
With
Minas-RioAfterdisposals
After Barro Alto re-build
WithQuellaveco
Afterdisposals
Before
Before
Before
Before
Before
Notes: Cost curve positions reflect the aggregate of 2014 individual mine site cost curves positions weighted by 2014 production. Mogalakwena reflects 2015 performance. Thermal
Coal is on an energy adjusted basis. Met Coal is on value in use adjusted basis. Phosphates and Niobium not shown as standard industry cost curve not available. Source: Wood
MacKenzie, CRU and internal analysis. (1) Quellaveco unapproved.

5
TECHNICAL EXCELLENCE IS DRIVING BUSINESS PERFORMANCE
Working together with operations to deliver step change value…
…through integrated technical excellence.
T&S plays a key role in all four strategic imperatives:
– Deliver Driving Value
– Focus the portfolio
– Develop core business processes
– Create high performance culture

6
We have the right people in place:
Capability and deep knowledge
Building on a strong foundation
Implementing the Operating Model
Focus on core assets
Wave 1 has been defined and is in progress
Do the fundamentals better
What good looks like
Technological Innovation
Deriving multi-industry solutions
CREATING A HIGH PERFORMANCE CULTURE
Leverage the Business Units’ delivery…
…technical excellence across all disciplines.
Technological Innovation
Technical Leverage
Geosciences Mining Processing
Supply chainSafety and
Sustainability
Information
Management
Operating Model
Projects Asset Strategy

7
Operational planning
Specifications for the most cost effective way to
operate a business
Work management
Reliably deliver the right work at the right time in
the right way
Measures & analysis
Use information from performance measures and
statistical process control to identify opportunities
Continuous improvement
Institute a system to continually examine our
performance and look for opportunities to improve
IMPLEMENTATION OF THE OPERATING MODEL IS
ACCELERATING DELIVERY OF “DRIVING VALUE”
Ensuring that we have the right architecture…
…this is the new language of the business.
Operating Model – key attributes
Set
Performance
Targets
Set
Production
Strategy
Set
Service
Strategy
Set Operating
Master
Schedule
Set
Expenditure
Schedule
Approve
Work/Cost
Commitments
Plan
Work
Schedule
Work
Resourcing
Execute
Work
Process
PerformanceSet
Business
Expectations
Modify or
Adapt the
Business
Measure
Social
Process
Performance
Measure
Work
Management
Performance
Measure Process
Performance
Labour, Materials &
Equipment
Analyse &
Improve
Operational Planning Work Management
Feedback
Do
Plan
Act
Check
Source: Copyright © McAlear Management Consultants 2000

8
THREE PRINCIPLES OF THE OPERATING MODEL
2. Produce stabilityCopy of Generic Control Chart (3)
Control Limits - Set 3: UCL = 4,595, Mean = 4,303, LCL = 4,010 (06/06/2014 - 07/07/2014) (mR = 2)
UCL = 4588
Mean = 3883
LCL = 3178
UCL = 4707
Mean = 4047
LCL = 3388
UCL = 4595
Mean = 4303
LCL = 4010
Week
1
Week
2
Week
3
Week
4
Week
5
Week
6
Week
7
Week
8
Week
9
Week
10
Week
11
Week
12
Week
13
Week
14
Week
15
Week
16
Week
17
Week
18
Week
19
Week
20
Week
21
Week
22
Week
23
Week
24
Week
25
Week
26
Week
27
Week
28
Week
29
Week
30
2014
0
500
1,000
1,500
2,000
2,500
3,000
3,500
4,000
4,500
UNSTABLE PROCESS
STABLE PROCESS
CAPABLE
PROCESS – ready
for the next stage
of improvement
3. Reduce variability
1. Provide clarity

9
OPERATING MODEL – ROLLING OUT ACROSS THE GROUP
Implementation well progressed at Sishen and Minas Rio…
…assets prioritised according to impact and readiness.
2014 2015 2016 2017 2018
Sishen - rest of mine
Mogalakwena
Minas-Rio
Barro Alto
De Beers
Phosphates
SA Coal - other
Corporate – various
Australia Coal - other
Sishen - North mine
Moranbah North
Kolomela
Tumela
Los Bronces
POTENTIAL

10
TAKING US TO THE NEXT LEVEL
Enablers for further safety performance improvement…
…Mogalakwena and Los Bronces Operating Model roll-out highlight improvement potential.
0
1
2
3
4
Jan
-2006
May-2
006
Se
p-2
006
Jan
-2007
May-2
007
Se
p-2
007
Jan
-2008
May-2
008
Se
p-2
008
Jan
-2009
May-2
009
Se
p-2
009
Jan
-2010
May-2
010
Se
p-2
010
Jan
-2011
May-2
011
Se
p-2
011
Jan
-2012
May-2
012
Se
p-2
012
Jan
-2013
May-2
013
Se
p-2
013
Jan
-2014
May-2
014
Se
p-2
014
Jan
-2015
May-2
015
Los Bronces TRCFR
TRCFR Mean
0
2
4
6
8
10
12
Jan
-2006
Ma
y-2
006
Se
p-2
006
Jan
-2007
Ma
y-2
007
Se
p-2
007
Jan
-2008
Ma
y-2
008
Se
p-2
008
Jan
-2009
Ma
y-2
009
Se
p-2
009
Jan
-2010
Ma
y-2
010
Se
p-2
010
Jan
-2011
Ma
y-2
011
Se
p-2
011
Jan
-2012
Ma
y-2
012
Se
p-2
012
Jan
-2013
Ma
y-2
013
Se
p-2
013
Jan
-2014
Ma
y-2
014
Se
p-2
014
Jan
-2015
Ma
y-2
015
Mogalakwena TRCFR
TRCFR Mean

11
LOS BRONCES MINE PRODUCTIVITY
6,379
6,093
5,715
5,472
2012 2013 2014 2015 YTD
+17%
KOM930 Annual Operating Hours
• Significant improvements in truck operating
hours delivered
• Now focused on achieving leading practice

12
Processing “What good looks like” example
Processing
stabilityAdaptive processing to ensure stability
Recovery
optimisationSystems optimised to metallurgical response
Asset Strategy “What good looks like” example
Delivering
design OEE(1) Plant OEE’s of 90-95%
Maintenance Active defect elimination process
Fuel efficiency Fuel consumption reduced by 3-7%
Geosciences “What good looks like” example
Grade control
and
reconciliation
Fully-integrated grade control system at all
operations
End-value
estimation
approach
Recovered value rather than metal content
Mining “What good looks like” example
Drill & blast Mine-to-Plan compliance >90%
Load & haul Payloads consistently at 95-100% of design
Fleet utilisation Shift changeover of <30mins
Fragmentation <2% of unloadable oversized material
DEVELOPING CORE BUSINESS PROCESSES
It’s the detail that matters…
…ensuring excellence comes as standard.
(1) OEE: Overall Equipment Efficiency = availability x utilisation x appropriate performance factor

13
Reduced FOB unit cost guidance at full capacity to $28-$30/t (previously $33-$35/t)
MINAS RIO: RAMP UP
On track for 2015 production between 11 and 14Mt (wet basis)...
…improving performance at the filtration plant.
37439,32
13490,57
43305,43
18039,47
72037,64
20546,64
73819,49
29542,07
66290,65
36678,17
7065,68
29427,45
9004,73
31046,00
9500,00
63270,49
19360,62
54406,68
16648,31
36386,87
11134,29
01/01/15 16/01/15 31/01/15 15/02/15 02/03/15 17/03/15 01/04/15 16/04/15 01/05/15 16/05/15 31/05/15 15/06/15 30/06/15 15/07/15 30/07/15 14/08/15 29/08/15
0
10.000
20.000
30.000
40.000
50.000
60.000
70.000
0
10.000
20.000
30.000
40.000
50.000
60.000
Filtration Production (wmt)

14
LOS BRONCES: FOCUS ON DELIVERING THE PLAN
Mine plan spatial compliance Tonnes and Metal Reconciliation YTD 2015
91%
78%
97%
67%
2012 2013 2014 2015 YTD
0
5
10
15
20
25
30
35
Ore tonnes mined
ActualBudget
0
5
10
15
20
25
30
35
Total metal tonnes delivered
15
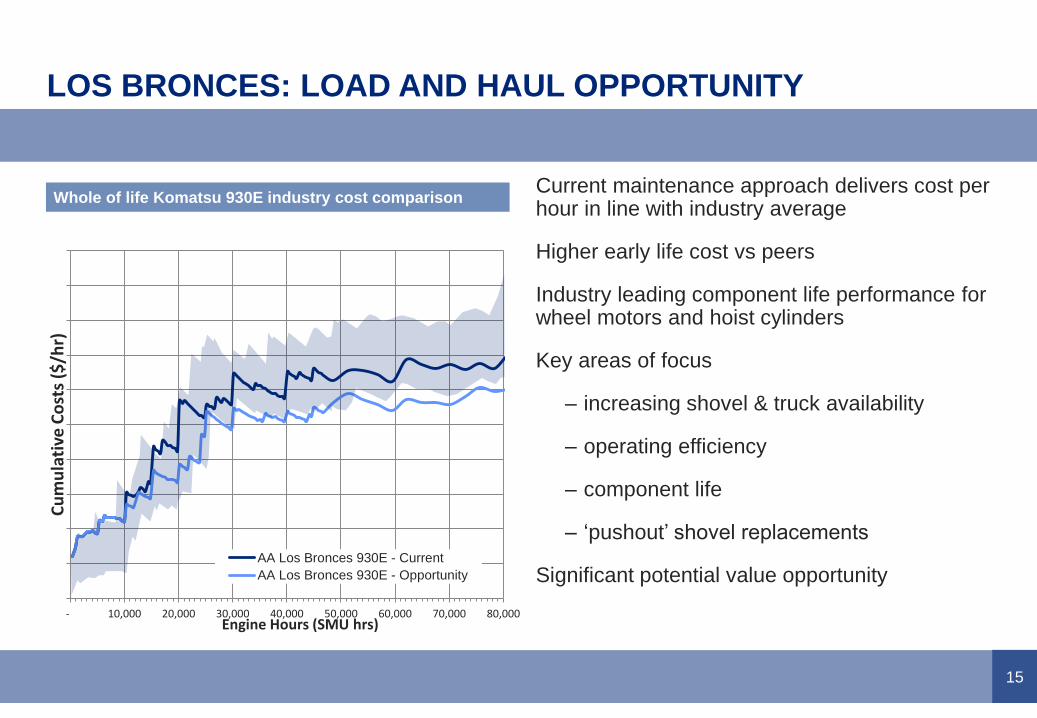
Current maintenance approach delivers cost per hour in line with industry average
Higher early life cost vs peers
Industry leading component life performance for wheel motors and hoist cylinders
Key areas of focus
– increasing shovel & truck availability
– operating efficiency
– component life
– ‘pushout’ shovel replacements
Significant potential value opportunity
LOS BRONCES: LOAD AND HAUL OPPORTUNITY
Whole of life Komatsu 930E industry cost comparison
- 10,000 20,000 30,000 40,000 50,000 60,000 70,000 80,000
Cu
mu
lati
ve C
ost
s ($
/hr)
Engine Hours (SMU hrs)
AA Los Bronces 930E - Current
AA Los Bronces 930E - Opportunity

16
Grade control determines ore destination (flotation,
leach, waste)
Traditional grade control based on Cu grade only
Substantial additional value by taking into account
Mo content, flotation and leach recovery
No capex requirement
Value based grade control sends the right minerals
to the right processing destination
…and therefore optimises the value recovered from
the mineral resource
LOS BRONCES: VALUE BASED GRADE CONTROL

17
IMPROVEMENT INITIATIVES ARE
DELIVERING RESULTS ACROSS ALL OF OUR KEY ASSETS
Inventory
optimisation
JIG plant
optimisation
Sishen mine plan
optimisation
HME fleet size
reduction
Longwall cutting
hours and rates
Water
management at
Los Bronces

18
FOCUSSING THE PORTFOLIO
Optimising our capex, undeveloped projects and exploration expenditure…
…will support cash flow improvement post 2015.
Capital expenditure ($bn)
(1) Capital expenditure here excludes capitalised operating cash profits and losses and is net of proceeds on disposal of PP&E. The expansionary category includes the cash flows from
derivatives related to capital expenditure and is net of direct funding for capital expenditure received from non-controlling interests. Excludes disposal assets in 2016.
(2) 2012 presented on a pro-forma basis to reflect the De Beers acquisition from 1 January 2012.
Capex excludes operating cash
profits and losses capitalised ~25% decline in SIB capex between 2012 and 2015
Lower expansion capex as projects are completed
$0.7-$1.0bn reduction in 2015/16 total capex
announced in July 2015
Optimising our undeveloped projects and
exploration portfolio
2.3 2.1 1.8
0.90.8 0.9
3.0 3.4 3.5
1.0
0.6
4.5
0.4
H1 2015 2015F
-1.7
6.26.2
20142013
6.3
2012
3.6-3.9
2016F
SIBExpansionary Development & stripping

19
0
500
1,000
1,500
2,000
2,500
3,000
3,500
4,000
01-Jul-14 29-Sep-14 30-Mar-15 28-Jun-15
Throughput
Mean
Step change
Project's strategic planning for success
Best practices in safety. Project is LTI free to date
First rebuild commissioned ahead of schedule
Accelerated ramp up to design capacity
Step change in average daily throughput achieved
First metal from the second furnace expected
before the end of Q3
Currently tracking well ahead of plan and below
budget
2015 production guidance raised to 25-30kt
Integrated Project Team concept adopted with
experienced owners and contractors
BARRO ALTO: FURNACE REBUILD AHEAD OF SCHEDULE
0%
20%
40%
60%
80%
100%
06-Apr 04-May 01-Jun 29-Jun 27-Jul 24-Aug
Plan
Actual
Furnace 2 throughput (tonnes dry ore feed)
Furnace 1 rebuild (% completion)
Mean throughput up to 29 Sept 2014 is based on actual performance from 31 July 2013
Pre-rebuild ShutdownRamp
upCompletion

20
DELIVERING STEP CHANGE VALUE
THROUGH INTEGRATED TECHNICAL EXCELLENCE
Delivering Driving Value Accelerating implementation of the Operating Model
Delivering results from “Wave One” initiatives
Focussing the portfolio Focussing efforts on key world class assets
Improving cash flow by optimising our capex, undeveloped projects
and exploration expenditure
Developing core business
processes
Defining “What good looks like”
Demonstrating a pathway to step changes in value through technical
innovation
Creating a high
performance culture
Highly capable teams in place
Deep technical knowledge and expertise

21
INVESTOR RELATIONS
London
Paul Galloway
Tel: +44 20 7968 8718
Ed Kite
Tel: +44 20 7968 2178