
Morgan Stanley - CaixaBank · Morgan Stanley – European ... online completion of in-branch...
39
CaixaBank: 2015-18 Strategic Plan Morgan Stanley – European Financials Conference Gonzalo Gortázar, CEO London, 25 March 2015
Transcript of Morgan Stanley - CaixaBank · Morgan Stanley – European ... online completion of in-branch...
CaixaBank: 2015-18 Strategic Plan Morgan Stanley – European Financials Conference
Gonzalo Gortázar, CEO London, 25 March 2015
The purpose of this presentation is purely informative and the information contained herein is subject to, and must be read in conjunction with, all other publicly available information. In particular, regarding the data provided by third parties, neither CaixaBank, S.A. (“CaixaBank”), nor any of its administrators, directors or employees, is obliged, either explicitly or implicitly, to vouch that these contents are exact, accurate, comprehensive or complete, nor to keep them updated, nor to correct them in the case that any deficiency, error or omission were to be detected. Moreover, in reproducing these contents in any medium, CaixaBank may introduce any changes it deems suitable, may omit partially or completely any of the elements of this document, and in case of any deviation between such a version and this one, assumes no liability for any discrepancy. This document has at no time been submitted to the Comisión Nacional del Mercado de Valores (CNMV – the Spanish Stock Markets regulatory body) and/or to the Stock Markets national regulatory or supervisory body of any other jurisdiction) for approval or scrutiny. In all cases its contents are regulated by the Spanish law applicable at time of writing, and it is not addressed to any person or legal entity located in any other jurisdiction. For this reason it may not necessarily comply with the prevailing norms or legal requisites as required in other jurisdictions. CaixaBank cautions that this presentation might contain forward-looking statements. While these statements represent our judgment and future expectations concerning the development of our business, a number of risks, uncertainties and other important factors could cause actual developments and results to materially differ from our expectations. Statements as to historical performance, historical share price or financial accretion are not intended to mean that future performance, future share price or future earnings for any period will necessarily match or exceed those of any prior year. Nothing in this presentation should be construed as a profit forecast. This presentation on no account should be construed as a service of financial analysis or advice, nor does it aim to offer any kind of financial product or service. In particular, it is expressly remarked here that no information herein contained should be taken as a guarantee of future performance or results. In making this presentation available, CaixaBank provides no advice and makes no recommendation to buy, sell or otherwise deal in CaixaBank shares, or in any other securities or investment whatsoever. Any person at any time acquiring securities must do so only on the basis of such person’s own judgment as to the merits or the suitability of the securities for its purpose and only on such information as is contained in such public information having taken all such professional or other advice as it considers necessary or appropriate in the circumstances and not in reliance on the information contained in this presentation. Without prejudice to legal requirements, or to any limitations imposed by CaixaBank that may be applicable, permission is hereby expressly refused for any type of use or exploitation of the contents of this presentation, and for any use of the signs, trademarks and logotypes which it contains. This prohibition extends to any kind of reproduction, distribution, transmission to third parties, public communication or conversion into any other medium, for commercial purposes, without the previous express permission of CaixaBank and/or other respective proprietary title holders. Any failure to observe this restriction may constitute a legal offence which may be sanctioned by the prevailing laws in such cases. In so far as it relates to results from investee companies, any financial information provided has been prepared mainly on the basis of estimates. In addition, the information and figures included in this presentation related to information on a recently announced Voluntary Tender Offer for BPI assume the completion of the transaction in the proposed terms and conditions.
Disclaimer
2
CaixaBank 2007-2014
Financial targets
From here to there: Strategic priorities
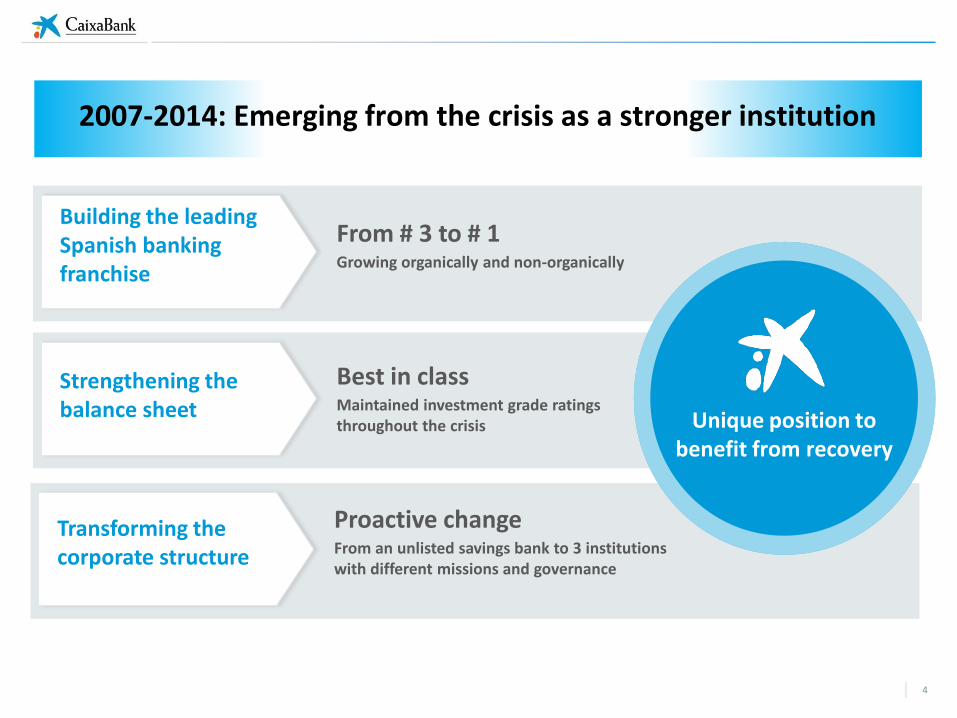
Unique position to benefit from recovery
Transforming the corporate structure
Building the leading Spanish banking franchise
Strengthening the balance sheet
Proactive change From an unlisted savings bank to 3 institutions with different missions and governance
From # 3 to # 1 Growing organically and non-organically
Best in class Maintained investment grade ratings throughout the crisis
2007-2014: Emerging from the crisis as a stronger institution
4
CaixaBank 2007-2014
Financial targets
From here to there: Strategic priorities
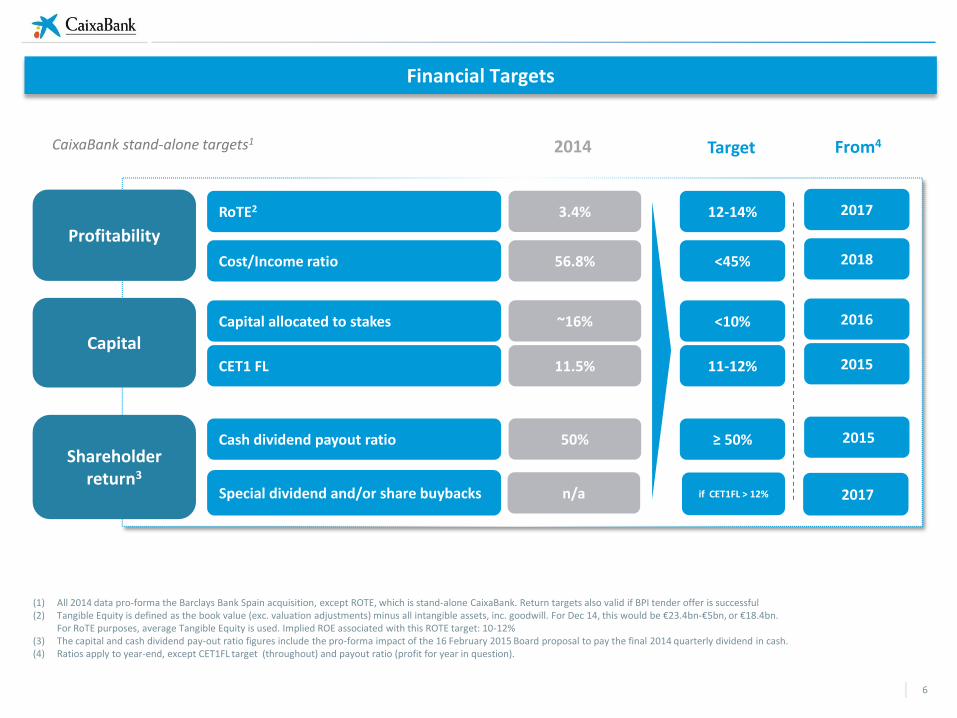
2014 Target
(1) All 2014 data pro-forma the Barclays Bank Spain acquisition, except ROTE, which is stand-alone CaixaBank. Return targets also valid if BPI tender offer is successful (2) Tangible Equity is defined as the book value (exc. valuation adjustments) minus all intangible assets, inc. goodwill. For Dec 14, this would be €23.4bn-€5bn, or €18.4bn.
For RoTE purposes, average Tangible Equity is used. Implied ROE associated with this ROTE target: 10-12% (3) The capital and cash dividend pay-out ratio figures include the pro-forma impact of the 16 February 2015 Board proposal to pay the final 2014 quarterly dividend in cash. (4) Ratios apply to year-end, except CET1FL target (throughout) and payout ratio (profit for year in question).
From4
Capital
Profitability
CET1 FL
Capital allocated to stakes
Cash dividend payout ratio
RoTE2
Cost/Income ratio
11.5%
~16%
50%
3.4%
56.8%
11-12%
<10%
≥ 50%
12-14%
<45%
2015
2016
2015
2017
2018
Shareholder return3
Special dividend and/or share buybacks 2017 if CET1FL > 12%
CaixaBank stand-alone targets1
n/a
Financial Targets
6
CaixaBank 2007-2014
Financial targets
From here to there: Strategic priorities
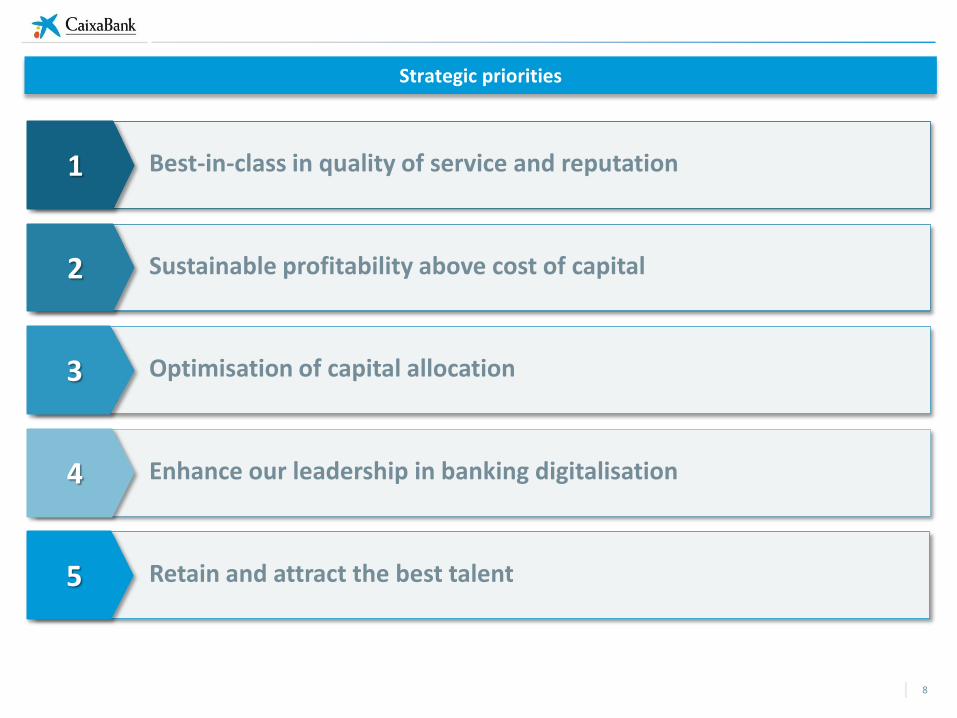
Strategic priorities
1
2
3
4
Best-in-class in quality of service and reputation
Sustainable profitability above cost of capital
Optimisation of capital allocation
Enhance our leadership in banking digitalisation
5 Retain and attract the best talent
8
Strategic priorities
1
2
3
4
Best-in-class in quality of service and reputation
Sustainable profitability above cost of capital
Optimisation of capital allocation
Enhance our leadership in banking digitalisation
5 Retain and attract the best talent
9
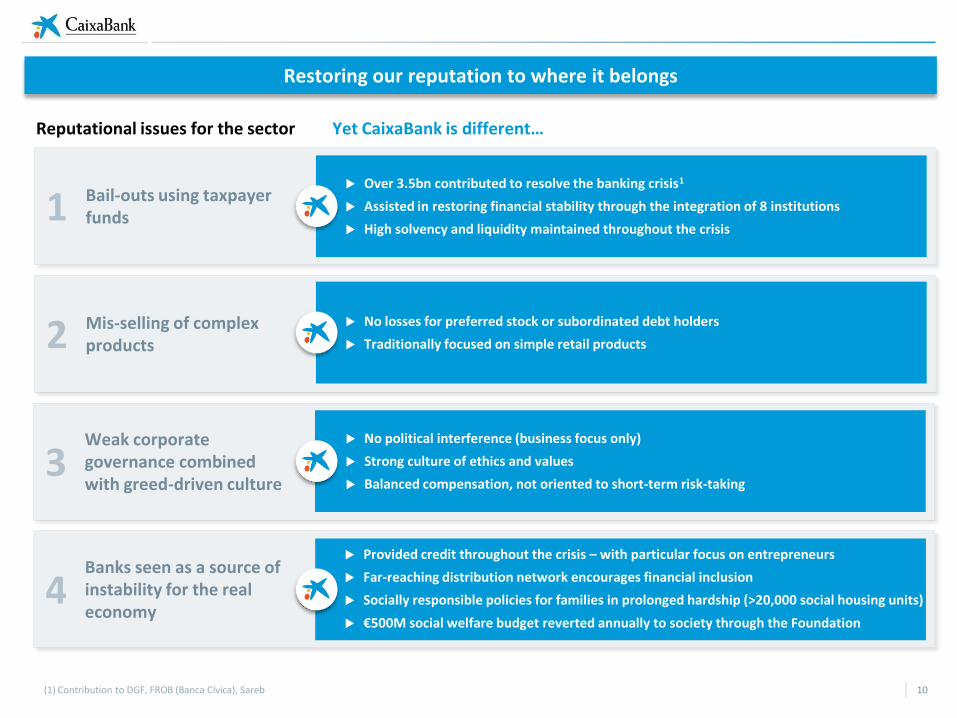
(1) Contribution to DGF, FROB (Banca Cívica), Sareb
Reputational issues for the sector Yet CaixaBank is different…
Bail-outs using taxpayer funds
Mis-selling of complex products
1
2
Over 3.5bn contributed to resolve the banking crisis1
Assisted in restoring financial stability through the integration of 8 institutions
High solvency and liquidity maintained throughout the crisis
No losses for preferred stock or subordinated debt holders
Traditionally focused on simple retail products
Weak corporate governance combined with greed-driven culture
3 No political interference (business focus only)
Strong culture of ethics and values
Balanced compensation, not oriented to short-term risk-taking
Banks seen as a source of instability for the real economy
4 Provided credit throughout the crisis – with particular focus on entrepreneurs
Far-reaching distribution network encourages financial inclusion
Socially responsible policies for families in prolonged hardship (>20,000 social housing units)
€500M social welfare budget reverted annually to society through the Foundation
Restoring our reputation to where it belongs
10
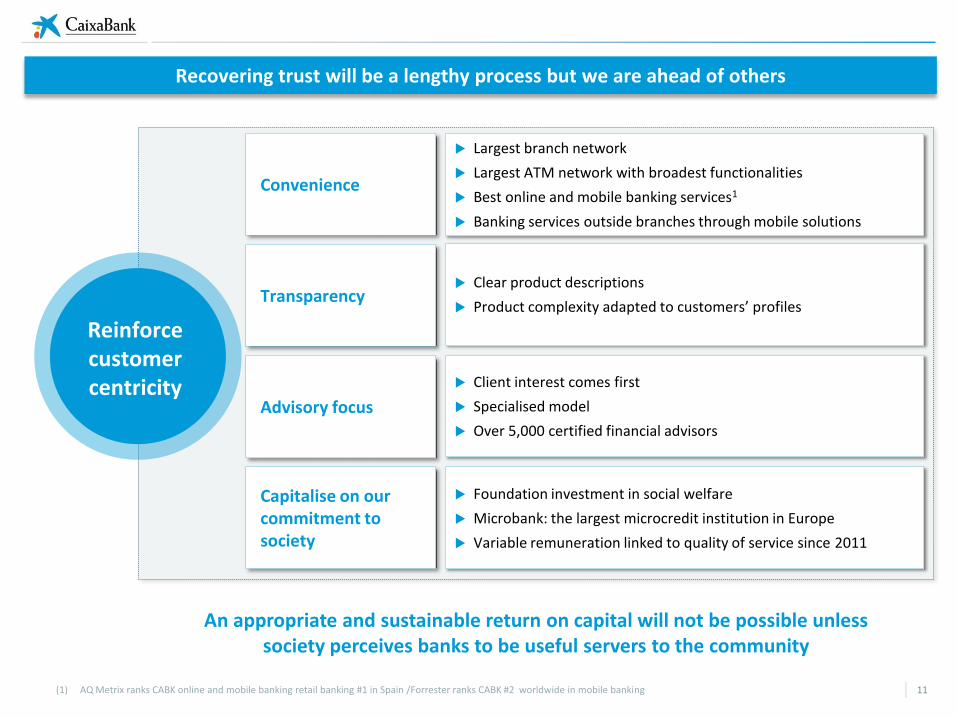
Convenience
Transparency
Advisory focus
Reinforce customer centricity
Largest branch network
Largest ATM network with broadest functionalities
Best online and mobile banking services1
Banking services outside branches through mobile solutions
(1) AQ Metrix ranks CABK online and mobile banking retail banking #1 in Spain /Forrester ranks CABK #2 worldwide in mobile banking
Clear product descriptions
Product complexity adapted to customers’ profiles
Client interest comes first
Specialised model
Over 5,000 certified financial advisors
Capitalise on our commitment to society
Foundation investment in social welfare
Microbank: the largest microcredit institution in Europe
Variable remuneration linked to quality of service since 2011
An appropriate and sustainable return on capital will not be possible unless society perceives banks to be useful servers to the community
Recovering trust will be a lengthy process but we are ahead of others
11
Strategic priorities
1
2
3
4
Best-in-class in quality of service and reputation
Sustainable profitability above cost of capital
Optimisation of capital allocation
Enhance our leadership in banking digitalisation
5 Retain and attract the best talent
12
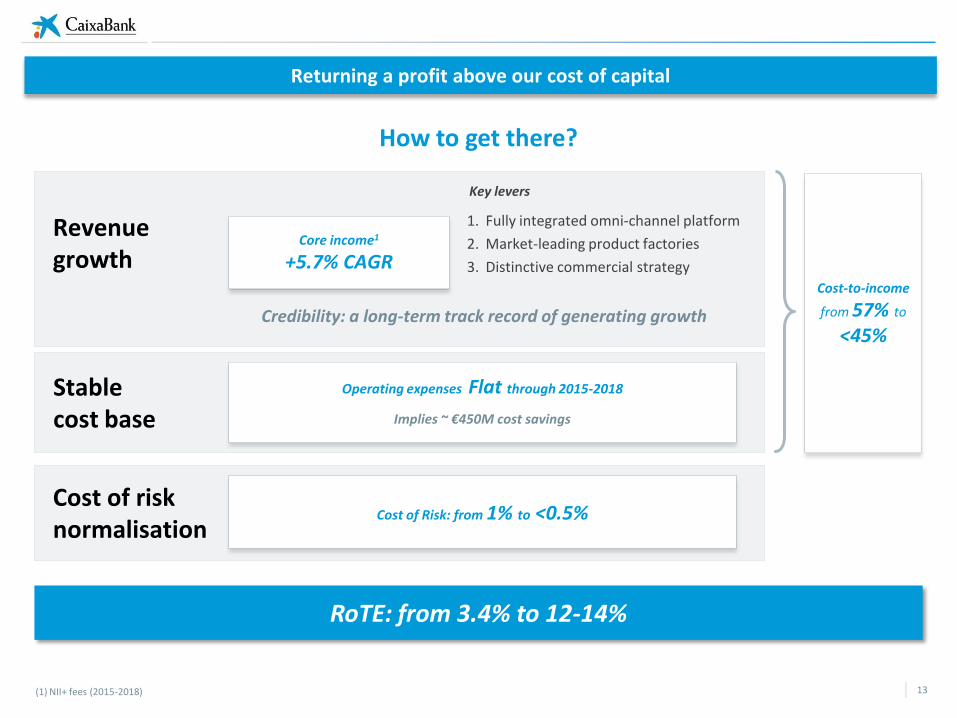
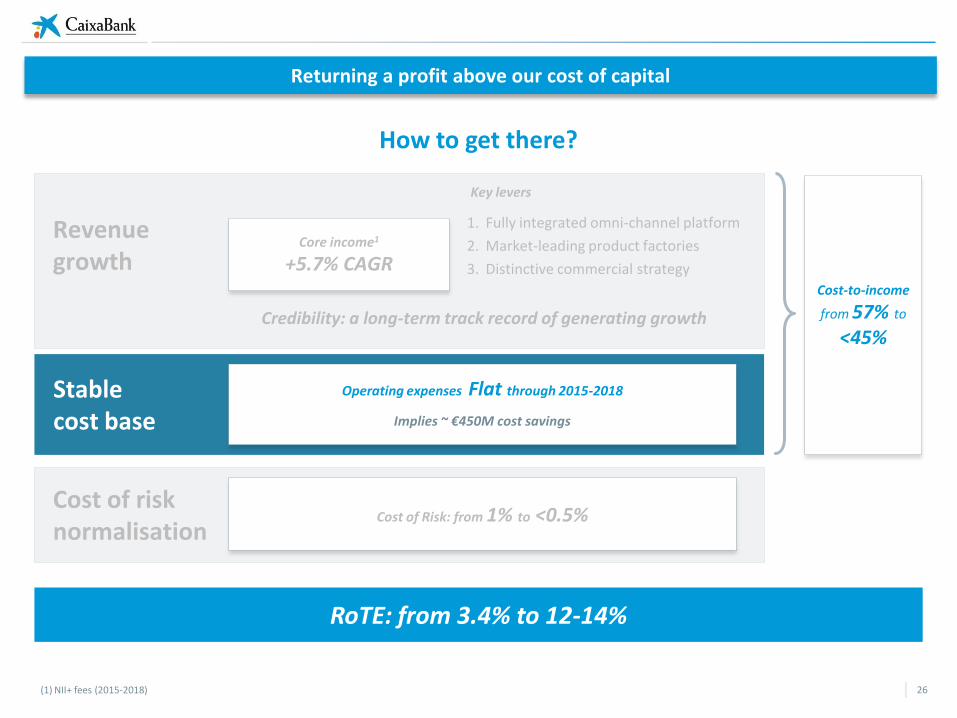
Cost of risk normalisation
Stable cost base
Revenue growth
1. Fully integrated omni-channel platform
2. Market-leading product factories
3. Distinctive commercial strategy
Core income1
+5.7% CAGR
Operating expenses Flat through 2015-2018
Cost of Risk: from 1% to <0.5%
(1) NII+ fees (2015-2018)
RoTE: from 3.4% to 12-14%
Cost-to-income
from 57% to <45%
Credibility: a long-term track record of generating growth
Implies ~ €450M cost savings
Key levers
How to get there?
Returning a profit above our cost of capital
13
A long-term track
record of generating growth
14
• Fully integrated omni-channel distribution platform
• Market-leading product factories
• Distinctive commercial strategy
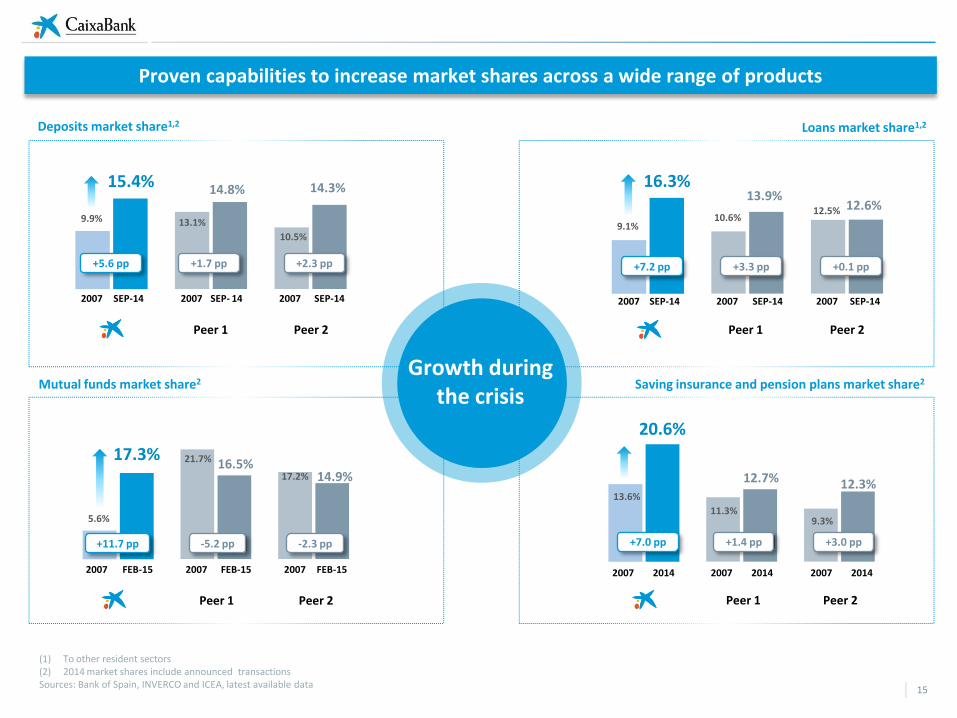
Deposits market share1,2 Loans market share1,2
Mutual funds market share2 Saving insurance and pension plans market share2
2007 SEP-14 2007 SEP- 14 2007 SEP-14
Peer 1 Peer 2
15.4%
9.9%
14.8%
13.1%
10.5%
14.3%
2007 SEP-14 2007 SEP-14 2007 SEP-14
16.3%
9.1%
12.6% 12.5% 10.6%
13.9%
Peer 2 Peer 1
2007 FEB-15 2007 FEB-15 2007 FEB-15 2007 2014 2007 2014 2007 2014
Peer 1 Peer 2 Peer 1 Peer 2
17.3%
5.6%
16.5% 21.7%
17.2% 14.9%
20.6%
13.6%
12.7%
11.3% 9.3%
12.3%
(1) To other resident sectors (2) 2014 market shares include announced transactions Sources: Bank of Spain, INVERCO and ICEA, latest available data
Growth during the crisis
+5.6 pp +1.7 pp +2.3 pp +7.2 pp +3.3 pp +0.1 pp
+11.7 pp -5.2 pp -2.3 pp +7.0 pp +1.4 pp +3.0 pp
Proven capabilities to increase market shares across a wide range of products
15
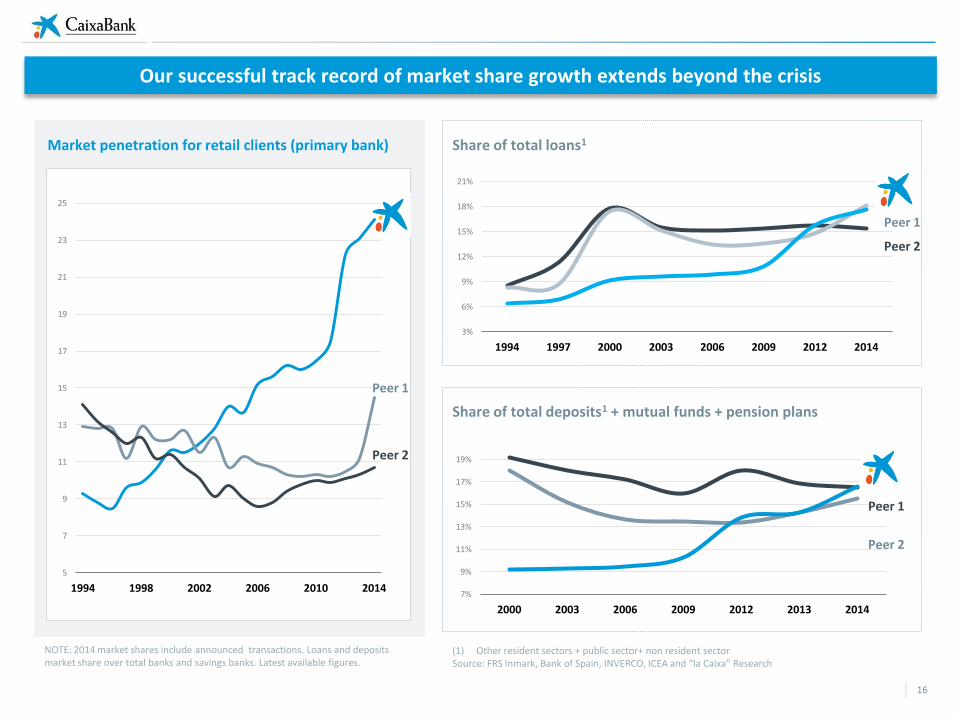
Market penetration for retail clients (primary bank)
Share of total loans1
Share of total deposits1 + mutual funds + pension plans
3%
6%
9%
12%
15%
18%
21%
1994 1997 2000 2003 2006 2009 2012 2014
Peer 1
Peer 2
7%
9%
11%
13%
15%
17%
19%
2000 2003 2006 2009 2012 2013 2014
Peer 1
Peer 2
5
7
9
11
13
15
17
19
21
23
25
1994 1998 2002 2006 2010 2014
Our successful track record of market share growth extends beyond the crisis
16
NOTE: 2014 market shares include announced transactions. Loans and deposits market share over total banks and savings banks. Latest available figures.
(1) Other resident sectors + public sector+ non resident sector Source: FRS Inmark, Bank of Spain, INVERCO, ICEA and “la Caixa” Research
Peer 1
Peer 2
A long-term track
record of generating growth
17
Fully integrated omni-channel distribution platform
• Market-leading product factories
• Distinctive commercial strategy
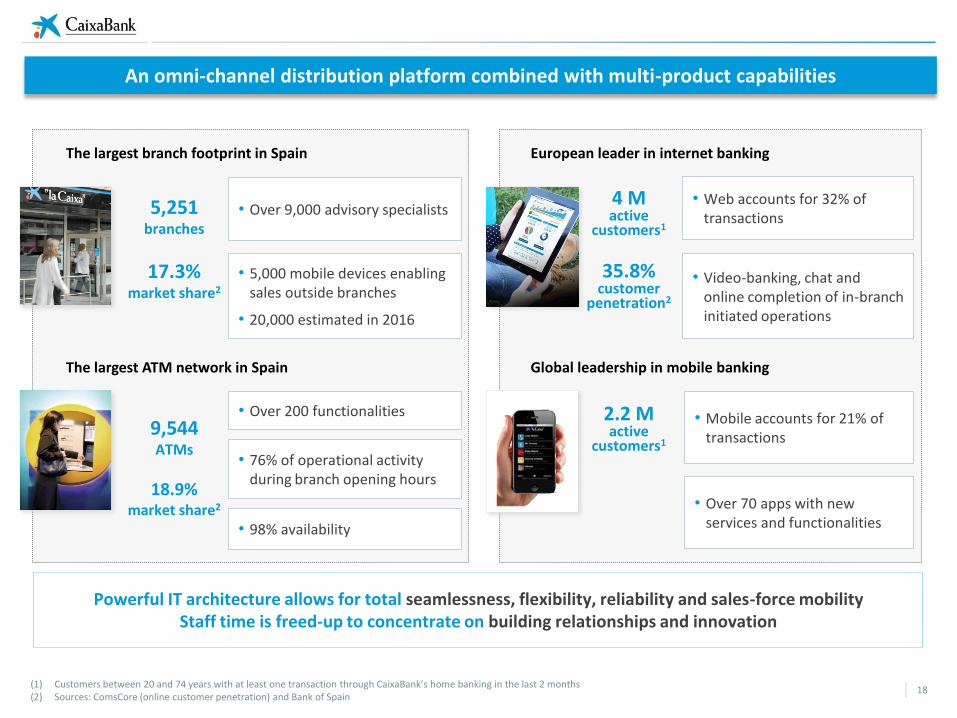
Powerful IT architecture allows for total seamlessness, flexibility, reliability and sales-force mobility Staff time is freed-up to concentrate on building relationships and innovation
• Over 200 functionalities
The largest branch footprint in Spain
5,251 branches
17.3% market share2
• Over 9,000 advisory specialists
• 5,000 mobile devices enabling sales outside branches
• 20,000 estimated in 2016
European leader in internet banking
4 M active
customers1
35.8% customer
penetration2
• Web accounts for 32% of transactions
• Video-banking, chat and online completion of in-branch initiated operations
The largest ATM network in Spain
9,544 ATMs
18.9% market share2
• 76% of operational activity during branch opening hours
• 98% availability
Global leadership in mobile banking
• Mobile accounts for 21% of transactions
• Over 70 apps with new services and functionalities
2.2 M active
customers1
(1) Customers between 20 and 74 years with at least one transaction through CaixaBank’s home banking in the last 2 months (2) Sources: ComsCore (online customer penetration) and Bank of Spain
An omni-channel distribution platform combined with multi-product capabilities
18
A long-term track
record of generating growth
19
• Fully integrated omni-channel distribution platform
Market-leading product factories
• Distinctive commercial strategy
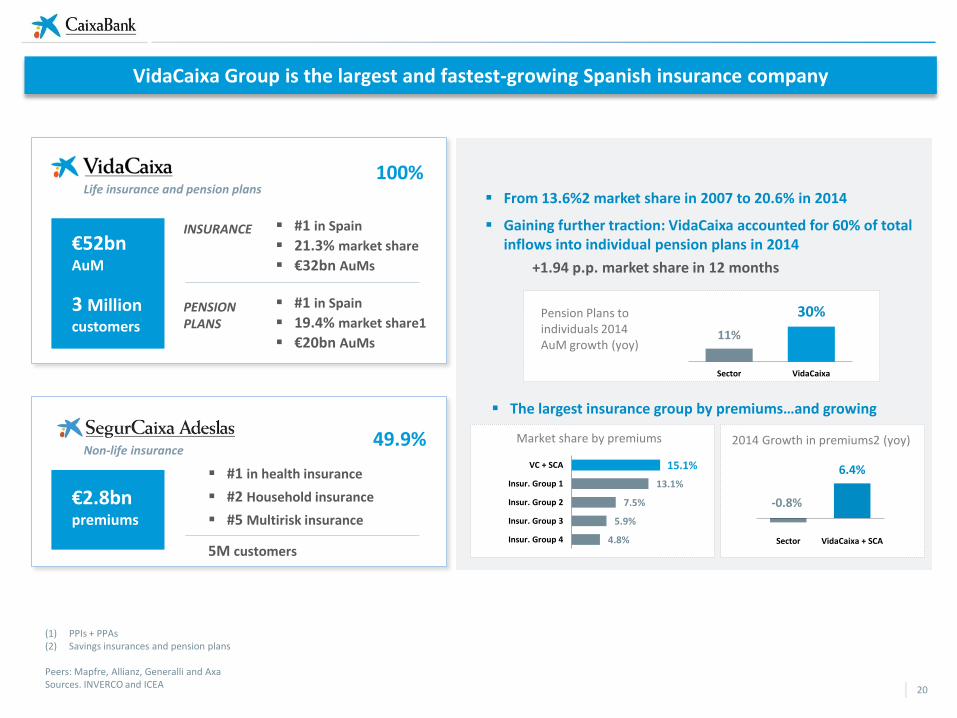
(1) PPIs + PPAs (2) Savings insurances and pension plans Peers: Mapfre, Allianz, Generalli and Axa Sources. INVERCO and ICEA
VidaCaixa Group is the largest and fastest-growing Spanish insurance company
20
Life insurance and pension plans 100%
#1 in Spain
21.3% market share
€32bn AuMs
#1 in Spain
19.4% market share1
€20bn AuMs
INSURANCE
PENSION PLANS
Non-life insurance 49.9%
#1 in health insurance
#2 Household insurance
#5 Multirisk insurance
5M customers
€2.8bn premiums
3 Million customers
€52bn AuM
From 13.6%2 market share in 2007 to 20.6% in 2014
Gaining further traction: VidaCaixa accounted for 60% of total inflows into individual pension plans in 2014
+1.94 p.p. market share in 12 months
Pension Plans to individuals 2014 AuM growth (yoy)
11%
30%
Sector VidaCaixa
2014 Growth in premiums2 (yoy)
-0.8%
6.4%
Sector VidaCaixa + SCA
Market share by premiums
4.8%
5.9%
7.5%
13.1%
15.1%
Insur. Group 4
Insur. Group 3
Insur. Group 2
Insur. Group 1
VC + SCA
The largest insurance group by premiums…and growing
2014: from #3 to # 2
Jan15 – from #2 to # 1
+1.92pp market share in 12 months
Best-in-class investment performance
31.2% 28.1% 28.0%
24.0% 21.9% 20.4%
15.4%
AuM growth 2014 (yoy)
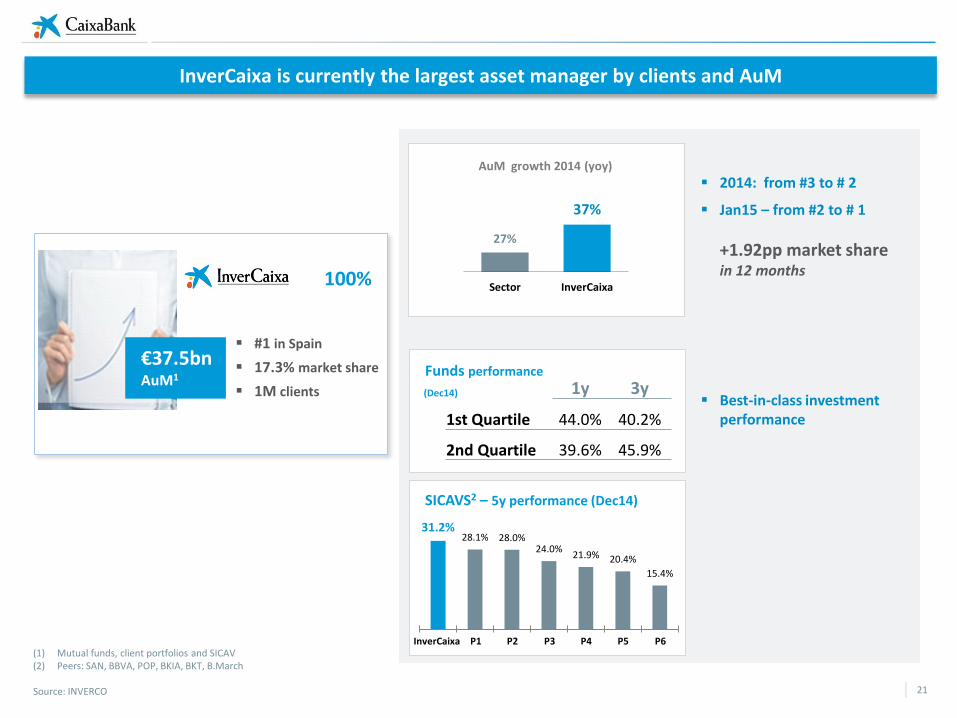
(1) Mutual funds, client portfolios and SICAV (2) Peers: SAN, BBVA, POP, BKIA, BKT, B.March Source: INVERCO
27%
37%
Sector InverCaixa
1y 3y
1st Quartile 44.0% 40.2%
2nd Quartile 39.6% 45.9%
Funds performance
InverCaixa
SICAVS2 – 5y performance (Dec14)
P1 P2 P3 P4 P5 P6
(Dec14)
InverCaixa is currently the largest asset manager by clients and AuM
21
100%
#1 in Spain
17.3% market share
1M clients
€37.5bn AuM1
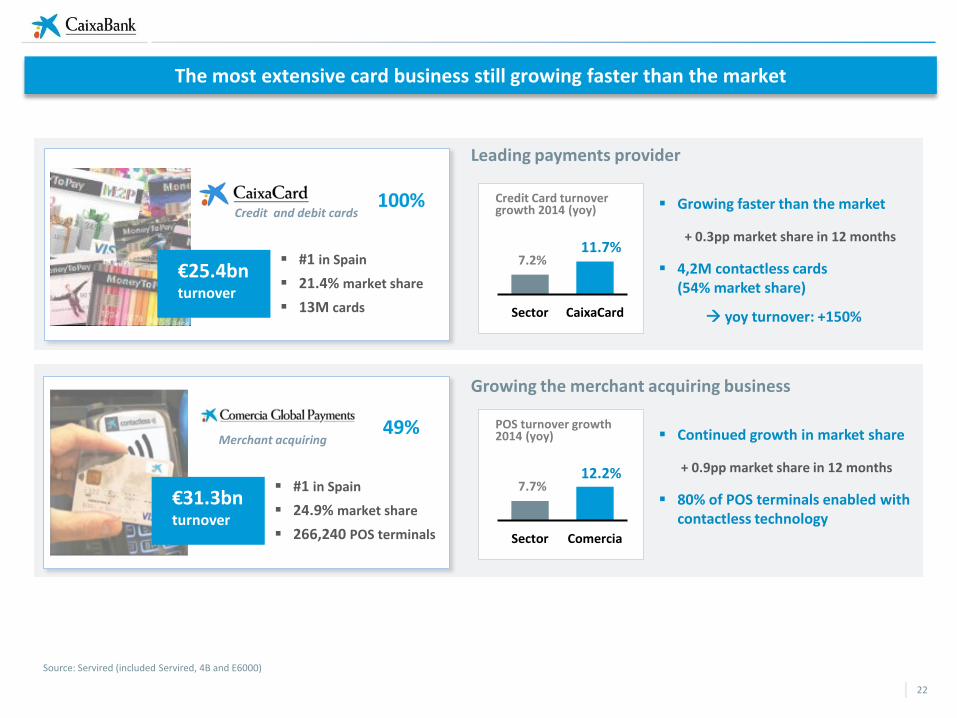
Source: Servired (included Servired, 4B and E6000)
The most extensive card business still growing faster than the market
22
Leading payments provider
Growing faster than the market
+ 0.3pp market share in 12 months
4,2M contactless cards (54% market share)
yoy turnover: +150%
Sector CaixaCard
11.7%
Credit Card turnover growth 2014 (yoy) Credit and debit cards
100%
#1 in Spain
21.4% market share
13M cards
€25.4bn turnover
Growing the merchant acquiring business
Continued growth in market share
+ 0.9pp market share in 12 months
80% of POS terminals enabled with contactless technology
Sector Comercia
POS turnover growth 2014 (yoy) Merchant acquiring
49%
#1 in Spain
24.9% market share
266,240 POS terminals
€31.3bn turnover
7.2%
12.2% 7.7%
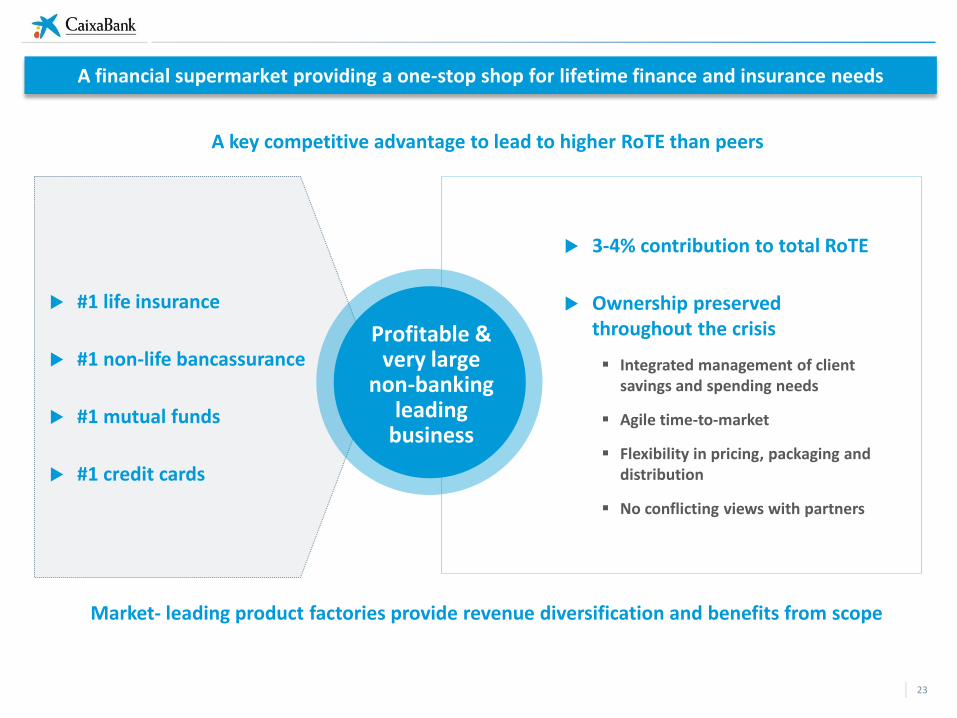
3-4% contribution to total RoTE
Ownership preserved throughout the crisis
Integrated management of client savings and spending needs
Agile time-to-market
Flexibility in pricing, packaging and distribution
No conflicting views with partners
Profitable & very large
non-banking leading
business
#1 life insurance
#1 non-life bancassurance
#1 mutual funds
#1 credit cards
A key competitive advantage to lead to higher RoTE than peers
Market- leading product factories provide revenue diversification and benefits from scope
A financial supermarket providing a one-stop shop for lifetime finance and insurance needs
23
A long-term track
record of generating growth
24
• Fully integrated omni-channel distribution platform
• Market-leading product factories
Distinctive commercial strategy
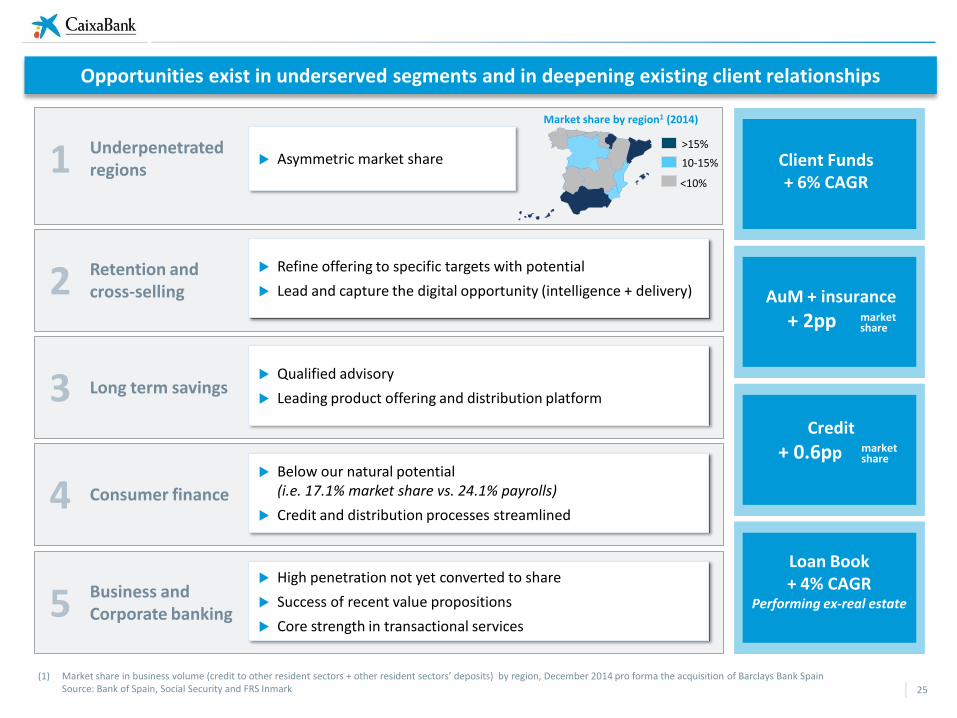
Asymmetric market share Underpenetrated regions 1
Refine offering to specific targets with potential
Lead and capture the digital opportunity (intelligence + delivery)
Retention and cross-selling 2
Qualified advisory
Leading product offering and distribution platform Long term savings 3
Below our natural potential (i.e. 17.1% market share vs. 24.1% payrolls)
Credit and distribution processes streamlined Consumer finance 4
High penetration not yet converted to share
Success of recent value propositions
Core strength in transactional services
Business and Corporate banking 5
(1) Market share in business volume (credit to other resident sectors + other resident sectors’ deposits) by region, December 2014 pro forma the acquisition of Barclays Bank Spain Source: Bank of Spain, Social Security and FRS Inmark
Opportunities exist in underserved segments and in deepening existing client relationships
25
<10%
>15%
10-15%
Market share by region1 (2014)
Client Funds + 6% CAGR
AuM + insurance
+ 2pp market share
Credit
+ 0.6pp market share
Loan Book + 4% CAGR
Performing ex-real estate
(1) NII+ fees (2015-2018)
Cost of risk normalisation
Stable cost base
Revenue growth
1. Fully integrated omni-channel platform
2. Market-leading product factories
3. Distinctive commercial strategy
Core income1
+5.7% CAGR
Operating expenses Flat through 2015-2018
Cost of Risk: from 1% to <0.5%
RoTE: from 3.4% to 12-14%
Cost-to-income
from 57% to <45%
Credibility: a long-term track record of generating growth
Implies ~ €450M cost savings
Key levers
How to get there?
Returning a profit above our cost of capital
26

Our distribution network is highly efficient from an operational perspective
75%
25%
Commercial
Back office
Branches
PoS and automated
Internet
% Tasks undertaken by branch network % operations by channel
24%
76%
Task absorption (%)
Branches
ATMs
8%
9%
54%
29%
ATMs
408
255 248 195
140
CABK Peer1 Peer2 Peer3 Peer4
Customers per employee1
Scalable & very efficient sales-oriented network developed over the last 3 decades
ATMs
Light-branch network that is commercially very effective in a geographically-dispersed country
Main reasons for choice of primary bank 1 (%)
14.7
15.8
18.9
19.2
21.9
37.8
Direct debits
Service quality
Tradition
Payroll/pension
Prescription
Proximity 85%
80% 78% 77%
71%
CABK Peer1 Peer2 Peer3 Peer4
Primary bank clients/clients 1
5.5 6.5
14.7
CABK Average Spanish sector
European average
Number of employees/branch Evolution of branch network size
5,206 5,251
2,099
- 2,054
2007 Acquisitions Integrations 2014
(1) Retail customers, source: FRS Inmark 2014 Peers: SAN, BBVA, SAB, POP
A high number of branches is an indication of reach and client proximity – not a cost driver
27
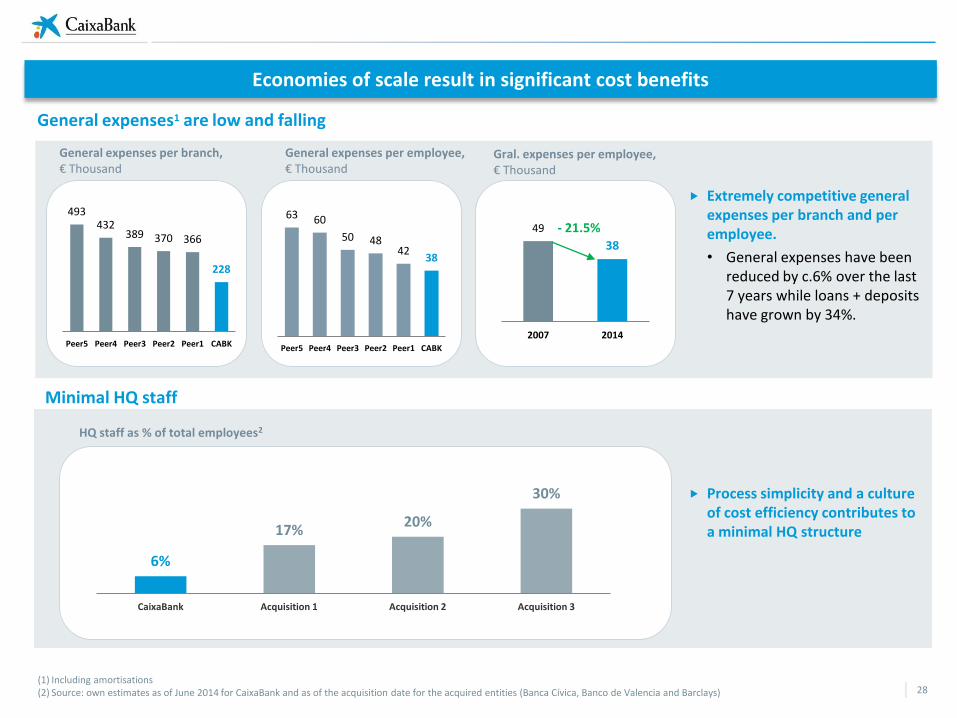
Economies of scale result in significant cost benefits
HQ staff as % of total employees2
6%
17% 20%
30%
CaixaBank Acquisition 1 Acquisition 2 Acquisition 3
38 42
48 50
60 63
CABK Peer1 Peer2 Peer3 Peer4 Peer5
Gral. expenses per employee, € Thousand
49
38
2007 2014
- 21.5%
Minimal HQ staff
General expenses1 are low and falling
General expenses per branch, € Thousand
228
366 370 389 432
493
CABK Peer1 Peer2 Peer3 Peer4 Peer5
Extremely competitive general expenses per branch and per employee.
• General expenses have been reduced by c.6% over the last 7 years while loans + deposits have grown by 34%.
General expenses per employee, € Thousand
Process simplicity and a culture of cost efficiency contributes to a minimal HQ structure
(1) Including amortisations (2) Source: own estimates as of June 2014 for CaixaBank and as of the acquisition date for the acquired entities (Banca Cívica, Banco de Valencia and Barclays) 28

High unit labour costs to be gradually reduced over time
We expect substantial increases in productivity over the life of the plan
83
66
CABK Peers
+ c.1.8% per annum
(without inflation)
Business3 /employee Core income4 /employee
14.9 18.4
2014PF 2018E
0.19 0.25
2014PF 2018E
(1) Weighted average (SAN Spain, BBVA Spain, Bankia, SAB and POP) (2) Partially offset by new hires (3) (Loans+ customer funds) in €M (4) (NII +fees) in €M
Early retirements plans to reduce unit costs
• 829 early retirements in 2014 • 700 new hires in 2015 • ~ 3,000 departures during 2015-182
New hires come at much reduced costs (-80%)
82 100
Labour cost per employee 2014, € Thousand
91
121
2014PF 2018E
1
1.14
1.63
2014PF 2018E
Business3 /branch Core income4 /branch
Personnel expense/business3 Rebased, 2014 =100
2014 PF 2018E
+25% -18%
+23.5% +31.6% +33% +43%
29
Strategic priorities
1
2
3
4
Best-in-class in quality of service and reputation
Sustainable profitability above cost of capital
Optimisation of capital allocation
Enhance our leadership in banking digitalisation
5 Retain and attract the best talent
30
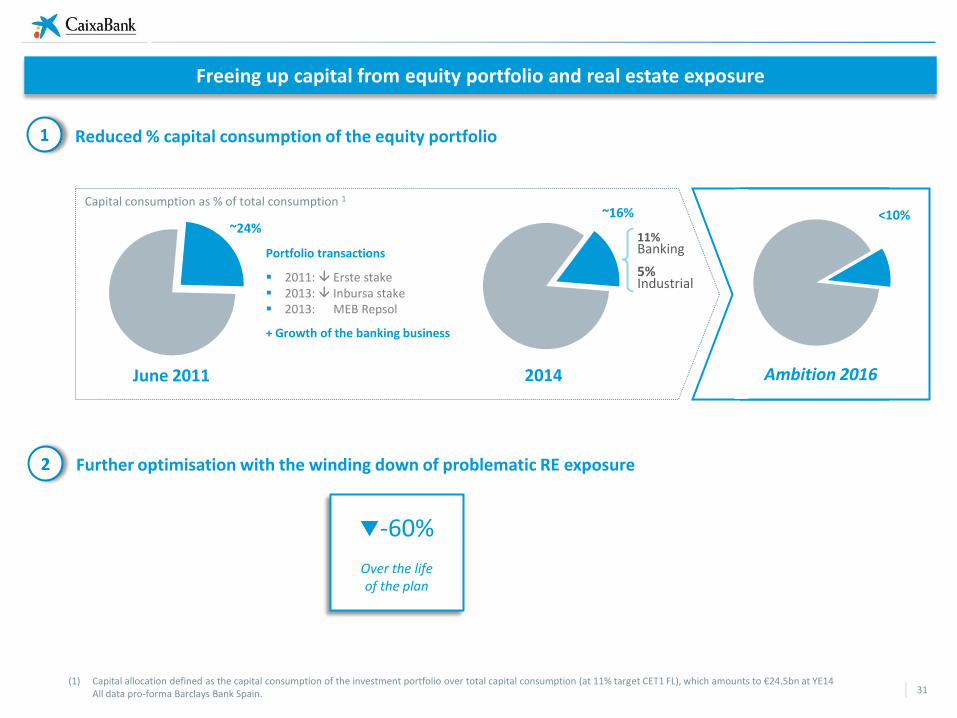
Reduced % capital consumption of the equity portfolio
Freeing up capital from equity portfolio and real estate exposure
Capital consumption as % of total consumption 1
Further optimisation with the winding down of problematic RE exposure
~16%
2014 June 2011
11% Banking
5% Industrial
(1) Capital allocation defined as the capital consumption of the investment portfolio over total capital consumption (at 11% target CET1 FL), which amounts to €24.5bn at YE14 All data pro-forma Barclays Bank Spain.
Portfolio transactions
2011: Erste stake 2013: Inbursa stake 2013: MEB Repsol
+ Growth of the banking business
Ambition 2016
31
1
2
-60%
Over the life of the plan
~24% <10%
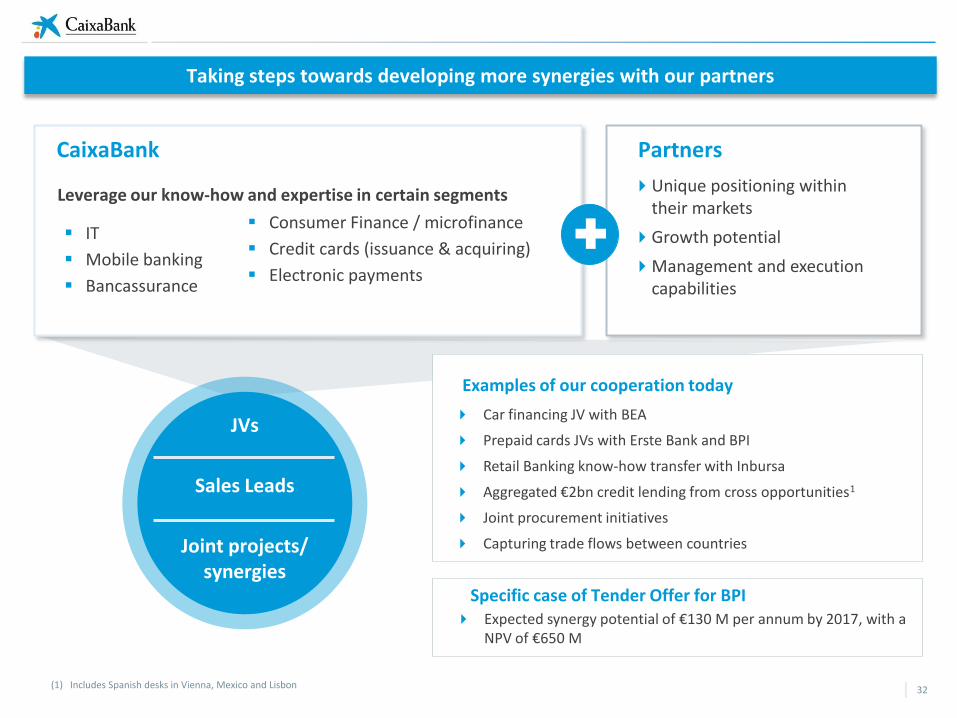
(1) Includes Spanish desks in Vienna, Mexico and Lisbon
Leverage our know-how and expertise in certain segments
IT
Mobile banking
Bancassurance
CaixaBank Partners
Unique positioning within their markets
Growth potential
Management and execution capabilities
Consumer Finance / microfinance
Credit cards (issuance & acquiring)
Electronic payments
Examples of our cooperation today
Car financing JV with BEA
Prepaid cards JVs with Erste Bank and BPI
Retail Banking know-how transfer with Inbursa
Aggregated €2bn credit lending from cross opportunities1
Joint procurement initiatives
Capturing trade flows between countries
JVs
Sales Leads
Joint projects/ synergies
Taking steps towards developing more synergies with our partners
32
Specific case of Tender Offer for BPI Expected synergy potential of €130 M per annum by 2017, with a
NPV of €650 M
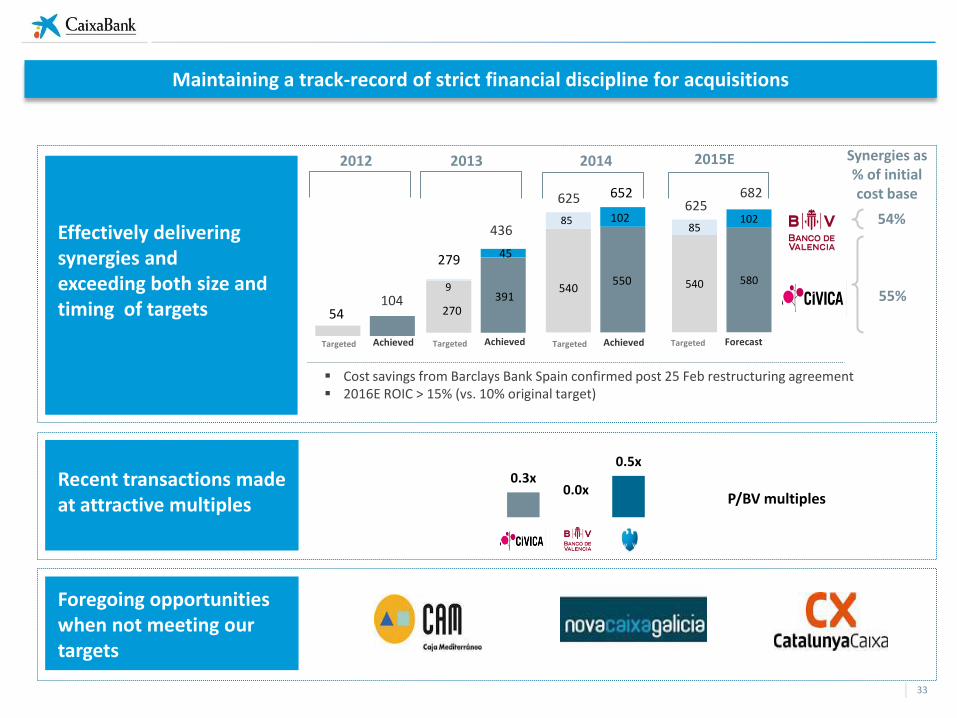
Maintaining a track-record of strict financial discipline for acquisitions
Effectively delivering synergies and exceeding both size and timing of targets
Recent transactions made at attractive multiples
Foregoing opportunities when not meeting our targets
0.3x 0.0x
0.5x
540 580
85 102
P/BV multiples
625 652
2014 2012 2013
436
279
104 54
Targeted Achieved Targeted Achieved Targeted
2015E
Forecast Targeted
625 682
Achieved
Cost savings from Barclays Bank Spain confirmed post 25 Feb restructuring agreement 2016E ROIC > 15% (vs. 10% original target)
33
Synergies as % of initial cost base
54%
55% 9
391
102
270
550 540
85
45

Strategic priorities
1
2
3
4
Best-in-class in quality of service and reputation
Sustainable profitability above cost of capital
Optimisation of capital allocation
Enhance our leadership in banking digitalisation
5 Retain and attract the best talent
34
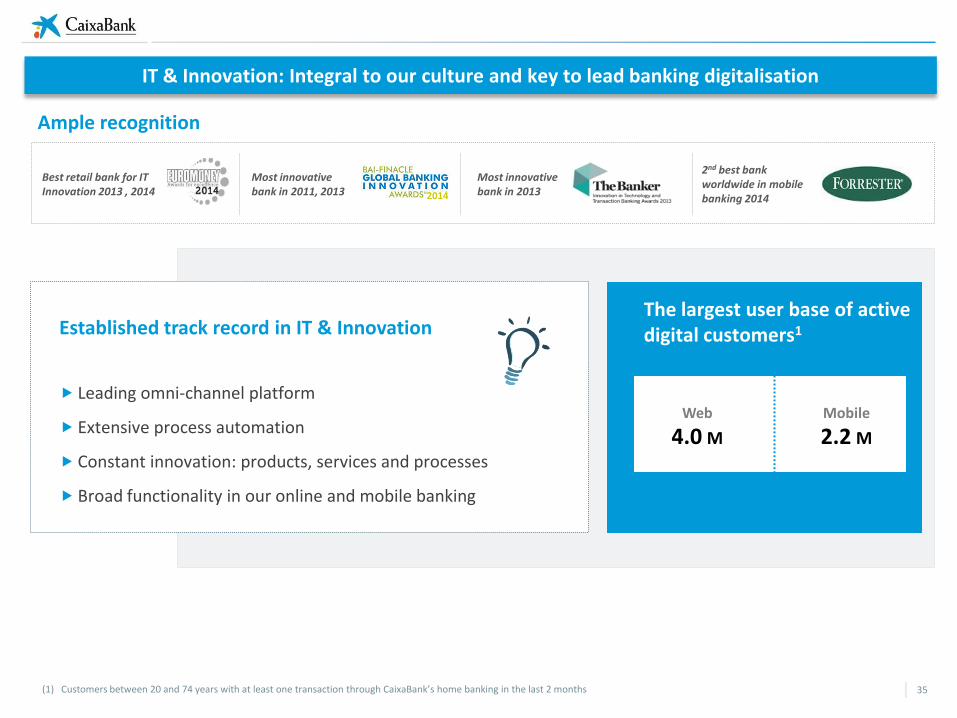
IT & Innovation: Integral to our culture and key to lead banking digitalisation
Most innovative bank in 2013
Best retail bank for IT Innovation 2013 , 2014 2014
Most innovative bank in 2011, 2013
2nd best bank worldwide in mobile banking 2014
Established track record in IT & Innovation
Leading omni-channel platform
Extensive process automation
Constant innovation: products, services and processes
Broad functionality in our online and mobile banking
The largest user base of active digital customers1
Ample recognition
Web
4.0 M
Mobile
2.2 M
(1) Customers between 20 and 74 years with at least one transaction through CaixaBank’s home banking in the last 2 months 35
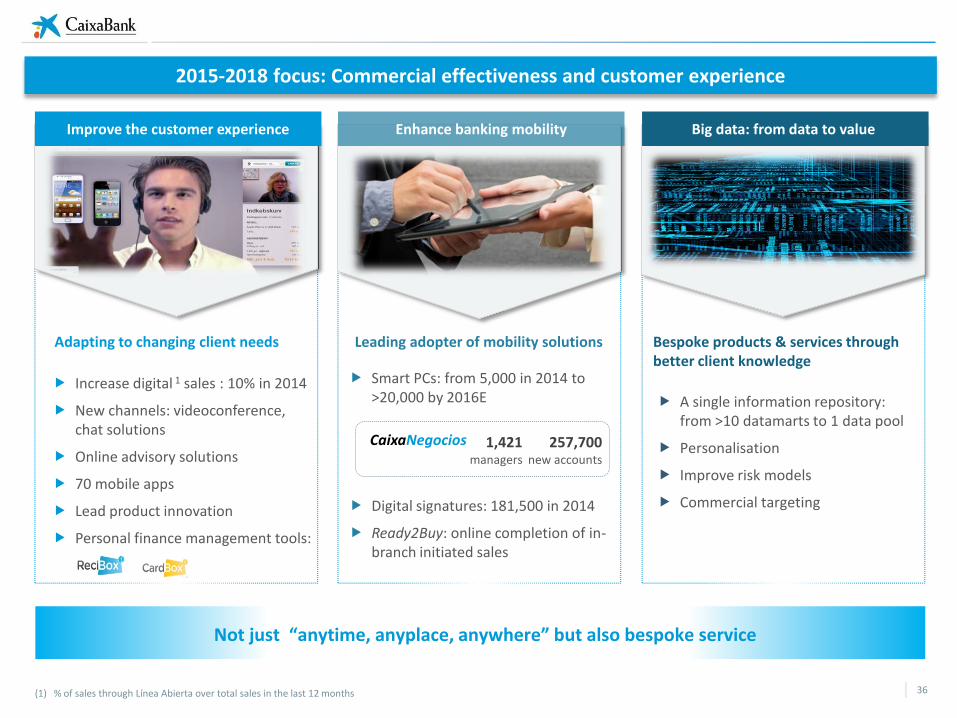
2015-2018 focus: Commercial effectiveness and customer experience
Improve the customer experience Enhance banking mobility Big data: from data to value
Increase digital 1 sales : 10% in 2014
New channels: videoconference, chat solutions
Online advisory solutions
70 mobile apps
Lead product innovation
Personal finance management tools:
Adapting to changing client needs
Smart PCs: from 5,000 in 2014 to >20,000 by 2016E
Digital signatures: 181,500 in 2014
Ready2Buy: online completion of in-branch initiated sales
Leading adopter of mobility solutions Bespoke products & services through better client knowledge
A single information repository: from >10 datamarts to 1 data pool
Personalisation
Improve risk models
Commercial targeting
(1) % of sales through Línea Abierta over total sales in the last 12 months
Not just “anytime, anyplace, anywhere” but also bespoke service
CaixaNegocios 1,421 managers
257,700 new accounts
36
Strategic priorities
1
2
3
4
Best-in-class in quality of service and reputation
Sustainable profitability above cost of capital
Optimisation of capital allocation
Enhance our leadership in banking digitalisation
5 Retain and attract the best talent
37
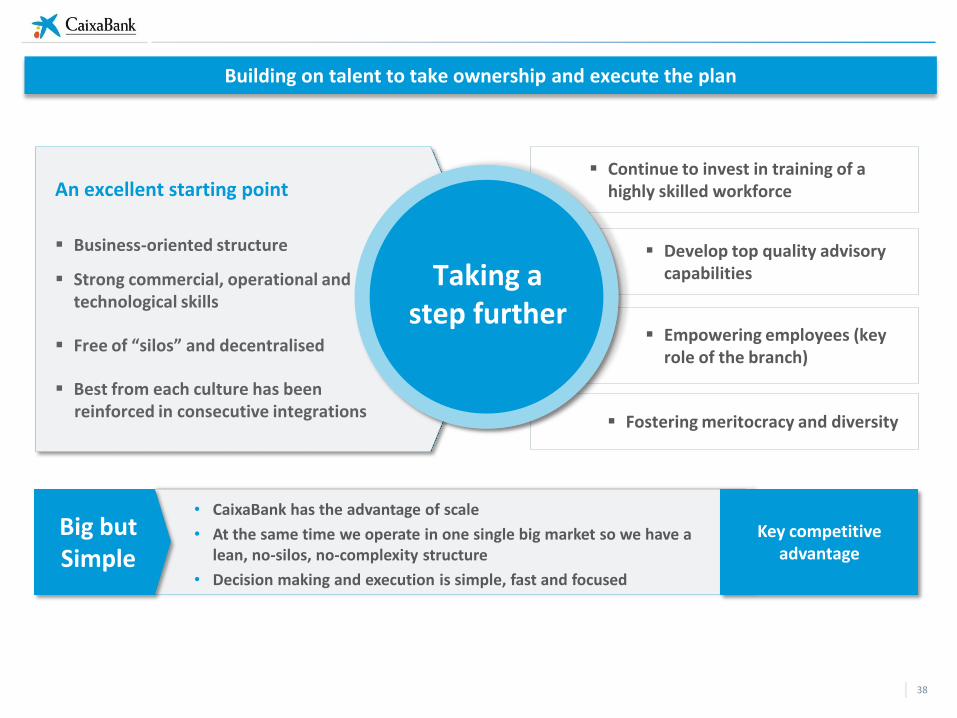
Empowering employees (key role of the branch)
Continue to invest in training of a highly skilled workforce
Develop top quality advisory capabilities
Fostering meritocracy and diversity
An excellent starting point
Business-oriented structure
Strong commercial, operational and technological skills
Free of “silos” and decentralised
Best from each culture has been reinforced in consecutive integrations
Taking a step further
Big but Simple
• CaixaBank has the advantage of scale
• At the same time we operate in one single big market so we have a lean, no-silos, no-complexity structure
• Decision making and execution is simple, fast and focused
Key competitive advantage
Building on talent to take ownership and execute the plan
38
+34 93 411 75 03
Institutional Investors & Analysts Contact
We are at your entire disposal for any questions or suggestions you may wish to make. To contact us, please call or write to us at the following email address and telephone number: