MORGAN STANLEY ASIA INTERNATIONAL LIMITED Reports and financial ...€¦ · MORGAN STANLEY ASIA...
112
MORGAN STANLEY ASIA INTERNATIONAL LIMITED Reports and financial statements 31 December 2018
Transcript of MORGAN STANLEY ASIA INTERNATIONAL LIMITED Reports and financial ...€¦ · MORGAN STANLEY ASIA...
MORGAN STANLEY ASIA INTERNATIONAL LIMITED
Reports and financial statements
31 December 2018
MORGAN STANLEY ASIA INTERNATIONAL LIMITED REPORTS AND FINANCIAL STATEMENTS Year ended 31 December 2018
CONTENTS PAGE Directors’ report 1 Independent auditor’s report 3 Income statement 6 Statement of comprehensive income 7 Statement of changes in equity 8 Statement of financial position 9 Statement of cash flows 10 Notes to the financial statements 11 Unaudited supplementary financial information 69
MORGAN STANLEY ASIA INTERNATIONAL LIMITED DIRECTORS’ REPORT
1
The Directors present the annual report and audited financial statements (which comprise the income statement, statement of comprehensive income, statement of changes in equity, statement of financial position, statement of cash flows and related notes 1 to 33) for Morgan Stanley Asia International Limited (the “Company” or “MSAIL”) for the year ended 31 December 2018.
PRINCIPAL ACTIVITIES
The Company is a private limited company incorporated in Hong Kong, with a head office in Hong Kong and a branch in Singapore (“Branch”). The Company is a restricted licence bank under the Banking Ordinance in Hong Kong and the Branch is licensed as a wholesale bank in Singapore. The Company is regulated by the Hong Kong Monetary Authority (“HKMA”) and the Branch is regulated by the Monetary Authority of Singapore (“MAS”). It is also a registered institution under the Hong Kong Securities and Futures Ordinance.
The principal activities of the Company are to engage in the business of banking including deposit taking and lending. It also acts (a) as agent on behalf of its customers in connection with the provision of general investment, securities and futures dealing, as well as discretionary management and (b) as introducing broker to Morgan Stanley & Co. International plc for the provision of clearance, settlement and custody services in relation to the aforementioned transactions.
The Company’s ultimate parent undertaking and controlling entity is Morgan Stanley which, together with the Company and Morgan Stanley’s other subsidiary undertakings, form the Morgan Stanley Group (the “Morgan Stanley Group”).
RESULTS AND APPROPRIATIONS
The results of the Company for the year ended 31 December 2018 are set out in the income statement on page 6.
No interim dividends were paid to the sole shareholder during the year. The Directors do not recommend the payment of a final dividend and propose that the profits be retained.
SHARE CAPITAL
Details of the Company’s shares issued are set out in note 21 to the financial statements. There was no movement in the Company’s share capital during the year.
DIRECTORS
The following Directors held office throughout the year and up to the date of approval of this report (except where otherwise shown):
Chui, Yik Chiu Vincent Clatworthy, David Peter Fung, Choi Cheung Gazzi, Robert (appointed on 3 September 2018) Kwan, Yin Ping Laroia, Gokul Ong, Whatt Soon Ronald Rajaram, Harish Wraight, David John

MORGAN STANLEY ASIA INTERNATIONAL LIMITED DIRECTORS’ REPORT (CONTINUED)
2
DIRECTORS’ MATERIAL INTERESTS IN TRANSACTIONS, ARRA NGEMENTS AND CONTRACTS THAT ARE SIGNIFICANT IN RELATION TO THE C OMPANY’S BUSINESS
No transactions, arrangements and contracts of significance to which the Company, its holding companies or any subsidiaries of its holding companies were a party and in which a Director of the Company had a material interest, whether directly or indirectly, subsisted at the end of the year or at any time during the year. DIRECTORS’ RIGHTS TO ACQUIRE SHARES AND DEBENTURES
Morgan Stanley, the Company’s ultimate holding company, has several senior executive incentive compensation programs under which senior executives receive, as part of their total compensation, incentive awards of restricted stock units. All Directors of the Company except independent non-executive directors, are eligible to participate in such incentive compensation programs and receive awards of restricted stock units thereunder.
Details of the deferred stock awards of the ultimate holding company, in which the Directors of the Company are entitled to participate, are set out in note 30 to the financial statements.
Other than as disclosed above, at no time during the year was the Company, its holding companies or any subsidiaries of its holding companies a party to any arrangements to enable the Directors of the Company to acquire benefits by means of acquisition of shares in, or debentures of, the Company or any other body corporate. SUBSEQUENT EVENTS
On 5 March 2019, the sale of all of the Company’s ordinary shares from Morgan Stanley Hong Kong Limited (“MSHKL”) to Morgan Stanley Hong Kong 1238 Limited (“MSHK1238”) was completed at a consideration of US$314,896,673.
On 22 March 2019, 500,000,000 ordinary shares were issued by the Company to MSHK1238 for a cash consideration of US$500,000,000.
PERMITTED INDEMNITY PROVISION
The Articles of Association of the Company provide that a Director or former Director of the Company may be indemnified out of the Company’s assets against any liability incurred by the Director to a person other than the Company or an associated company of the Company in connection with any negligence, default, breach of duty or breach of trust in relation to the Company or associated company (as the case may be). AUDITOR
A resolution will be submitted to the annual general meeting to re-appoint Messrs. Deloitte Touche Tohmatsu as auditor of the Company.
On behalf of the Board
CHUI, VINCENT YIK CHIU
DIRECTOR
23 April 2019
INDEPENDENT AUDITOR’S REPORT
TO THE SOLE MEMBER OF MORGAN STANLEY ASIA INTERNATIONAL LIMITED (incorporated in Hong Kong with limited liability)
3
Opinion
We have audited the financial statements of Morgan Stanley Asia International Limited (the "Company") set
out on pages 6 to 68, which comprise the statement of financial position as at 31 December 2018, and the
income statement, statement of comprehensive income, statement of changes in equity and statement of
cash flows for the year then ended, and notes to the financial statements, including a summary of
significant accounting policies.
In our opinion, the financial statements give a true and fair view of the financial position of the Company as
at 31 December 2018, and of its financial performance and its cash flows for the year then ended in
accordance with Hong Kong Financial Reporting Standards ("HKFRSs") issued by the Hong Kong Institute of
Certified Public Accountants (the "HKICPA") and have been properly prepared in compliance with the Hong
Kong Companies Ordinance.
Basis for Opinion
We conducted our audit in accordance with Hong Kong Standards on Auditing ("HKSAs") issued by the
HKICPA. Our responsibilities under those standards are further described in the Auditor's Responsibilities
for the Audit of the Financial Statements section of our report. We are independent of the Company in
accordance with the HKICPA's Code of Ethics for Professional Accountants (the "Code"), and we have
fulfilled our other ethical responsibilities in accordance with the Code. We believe that the audit evidence
we have obtained is sufficient and appropriate to provide a basis for our opinion.
Other Information
The Directors are responsible for the other information. The other information comprises the information
included in the annual report, but does not include the financial statements and our auditor's report thereon.
Our opinion on the financial statements does not cover the other information and we do not express any
form of assurance conclusion thereon.
In connection with our audit of the financial statements, our responsibility is to read the other information
and, in doing so, consider whether the other information is materially inconsistent with the financial
statements or our knowledge obtained in the audit or otherwise appears to be materially misstated. If,
based on the work we have performed, we conclude that there is a material misstatement of this other
information, we are required to report that fact. We have nothing to report in this regard.

INDEPENDENT AUDITOR’S REPORT
TO THE SOLE MEMBER OF MORGAN STANLEY ASIA INTERNATIONAL LIMITED (incorporated in Hong Kong with limited liability)
4
Responsibilities of Directors and Those Charged with Governance for the Financial Statements
The Directors are responsible for the preparation of the financial statements that give a true and fair view in
accordance with HKFRSs issued by the HKICPA and the Hong Kong Companies Ordinance, and for such
internal control as the Directors determine is necessary to enable the preparation of financial statements
that are free from material misstatement, whether due to fraud or error.
In preparing the financial statements, the Directors are responsible for assessing the Company's ability to
continue as a going concern, disclosing, as applicable, matters related to going concern and using the going
concern basis of accounting unless the Directors either intend to liquidate the Company or to cease
operations, or have no realistic alternative but to do so.
Those charged with governance are responsible for overseeing the Company's financial reporting process.
Auditor's Responsibilities for the Audit of the Financial Statements
Our objectives are to obtain reasonable assurance about whether the financial statements as a whole are
free from material misstatement, whether due to fraud or error, and to issue an auditor's report that
includes our opinion solely to you in accordance with section 405 of the Hong Kong Companies Ordinance,
and for no other purpose. We do not assume responsibility towards or accept liability to any other person
for the contents of this report. Reasonable assurance is a high level of assurance, but is not a guarantee
that an audit conducted in accordance with HKSAs will always detect a material misstatement when it exists.
Misstatements can arise from fraud or error and are considered material if, individually or in the aggregate,
they could reasonably be expected to influence the economic decisions of users taken on the basis of these
financial statements.
As part of an audit in accordance with HKSAs, we exercise professional judgment and maintain professional
skepticism throughout the audit. We also:
• Identify and assess the risks of material misstatement of the financial statements, whether due to
fraud or error, design and perform audit procedures responsive to those risks, and obtain audit
evidence that is sufficient and appropriate to provide a basis for our opinion. The risk of not detecting
a material misstatement resulting from fraud is higher than for one resulting from error, as fraud may
involve collusion, forgery, intentional omissions, misrepresentations, or the override of internal control.
• Obtain an understanding of internal control relevant to the audit in order to design audit procedures
that are appropriate in the circumstances, but not for the purpose of expressing an opinion on the
effectiveness of the Company's internal control.
• Evaluate the appropriateness of accounting policies used and the reasonableness of accounting
estimates and related disclosures made by the Directors.

INDEPENDENT AUDITOR’S REPORT
TO THE SOLE MEMBER OF MORGAN STANLEY ASIA INTERNATIONAL LIMITED (incorporated in Hong Kong with limited liability)
5
Auditor's Responsibilities for the Audit of the Financial Statements – continued
• Conclude on the appropriateness of the Directors' use of the going concern basis of accounting and,
based on the audit evidence obtained, whether a material uncertainty exists related to events or
conditions that may cast significant doubt on the Company's ability to continue as a going concern. If
we conclude that a material uncertainty exists, we are required to draw attention in our auditor's report
to the related disclosures in the financial statements or, if such disclosures are inadequate, to modify
our opinion. Our conclusions are based on the audit evidence obtained up to the date of our auditor's
report. However, future events or conditions may cause the Company to cease to continue as a going
concern.
• Evaluate the overall presentation, structure and content of the financial statements, including the
disclosures, and whether the financial statements represent the underlying transactions and events in a
manner that achieves fair presentation.
We communicate with those charged with governance regarding, among other matters, the planned scope
and timing of the audit and significant audit findings, including any significant deficiencies in internal
control that we identify during our audit.
Deloitte Touche Tohmatsu
Certified Public Accountants
Hong Kong
23 April 2019

MORGAN STANLEY ASIA INTERNATIONAL LIMITED INCOME STATEMENT Year ended 31 December 2018
6
2018 2017 Note US$’000 US$’000 Interest income 75,752 26,488 Interest expense (23,517) (33,570) Net interest income/(expense) 9 52,235 (7,082) Fee and commission income 7 245,388 214,535 Net trading income/(expense) 10,152 (108,093) Net income from other financial assets held at fair value 5 - 136,283 Net gains on derecognition of financial assets measured at fair
value through other comprehensive income (“FVOCI”) 6 373 - Other revenue 8 6,503 3,429 Total non-interest revenues 262,416 246,154 Net revenues 314,651 239,072 Non-interest expenses: Other expenses 10 (227,035) (209,711) PROFIT BEFORE INCOME TAX 87,616 29,361 Income tax 11 (13,343) (4,315) PROFIT FOR THE YEAR 74,273 25,046 All operations were continuing in the current year and prior year.
The notes on pages 11 to 68 form an integral part of the financial statements.
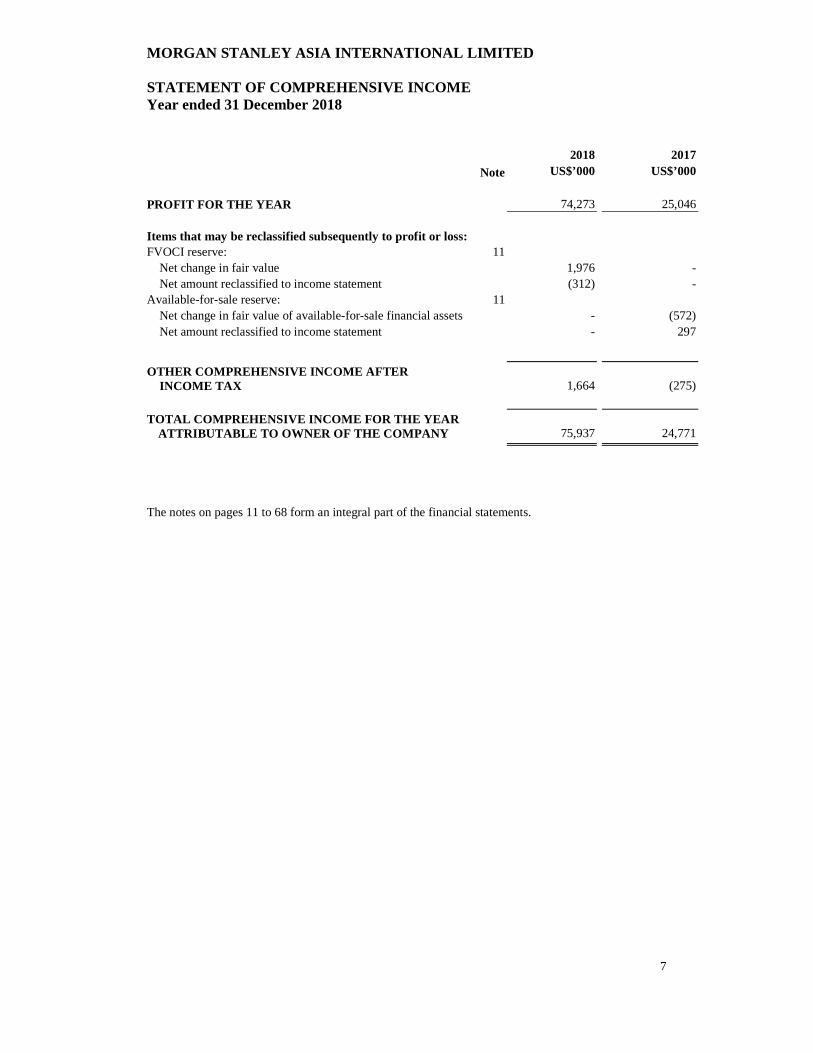
MORGAN STANLEY ASIA INTERNATIONAL LIMITED STATEMENT OF COMPREHENSIVE INCOME Year ended 31 December 2018
7
2018 2017 Note US$’000 US$’000 PROFIT FOR THE YEAR 74,273 25,046 Items that may be reclassified subsequently to profit or loss: FVOCI reserve: 11 Net change in fair value 1,976 - Net amount reclassified to income statement (312) - Available-for-sale reserve: 11 Net change in fair value of available-for-sale financial assets - (572) Net amount reclassified to income statement - 297
OTHER COMPREHENSIVE (LOSSES)/INCOME AFTER OTHER COMPREHENSIVE INCOME AFTER INCOME TAX 1,664 (275) TOTAL COMPREHENSIVE INCOME FOR THE YEAR
ATTRIBUTABLE TO OWNER OF THE COMPANY 75,937 24,771 The notes on pages 11 to 68 form an integral part of the financial statements.
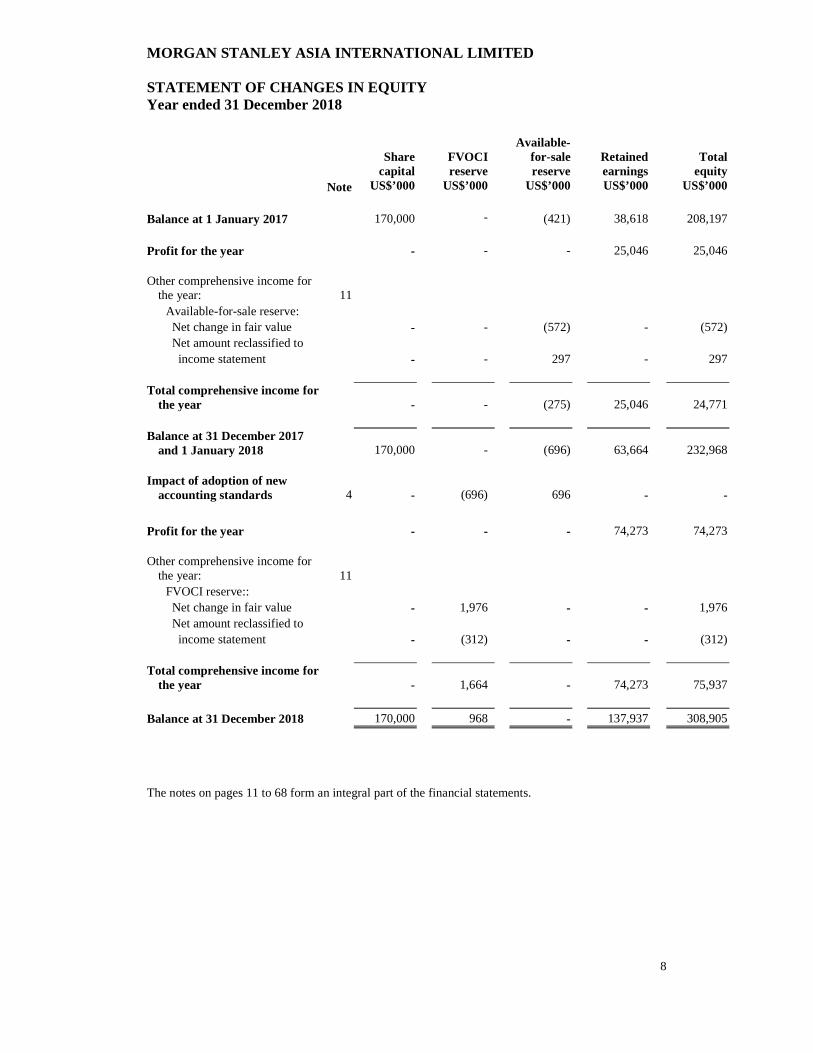
MORGAN STANLEY ASIA INTERNATIONAL LIMITED STATEMENT OF CHANGES IN EQUITY Year ended 31 December 2018
8
Share
capital FVOCI reserve
Available-for-sale reserve
Retained earnings
Total equity
Note US$’000 US$’000 US$’000 US$’000 US$’000 Balance at 1 January 2017 170,000 - (421) 38,618 208,197 Profit for the year - - - 25,046 25,046 Other comprehensive income for
the year: 11
Available-for-sale reserve: Net change in fair value - - (572) - (572) Net amount reclassified to income statement - - 297 - 297 Total comprehensive income for
the year - -
(275) 25,046 24,771
Balance at 31 December 2017 and 1 January 2018 170,000 -
(696) 63,664 232,968
Impact of adoption of new
accounting standards 4 - (696)
696 - - Profit for the year - - - 74,273 74,273 Other comprehensive income for
the year: 11
FVOCI reserve:: Net change in fair value - 1,976 - - 1,976 Net amount reclassified to income statement - (312) - - (312) Total comprehensive income for
the year - 1,664
- 74,273 75,937
Balance at 31 December 2018 170,000 968 - 137,937 308,905 The notes on pages 11 to 68 form an integral part of the financial statements.
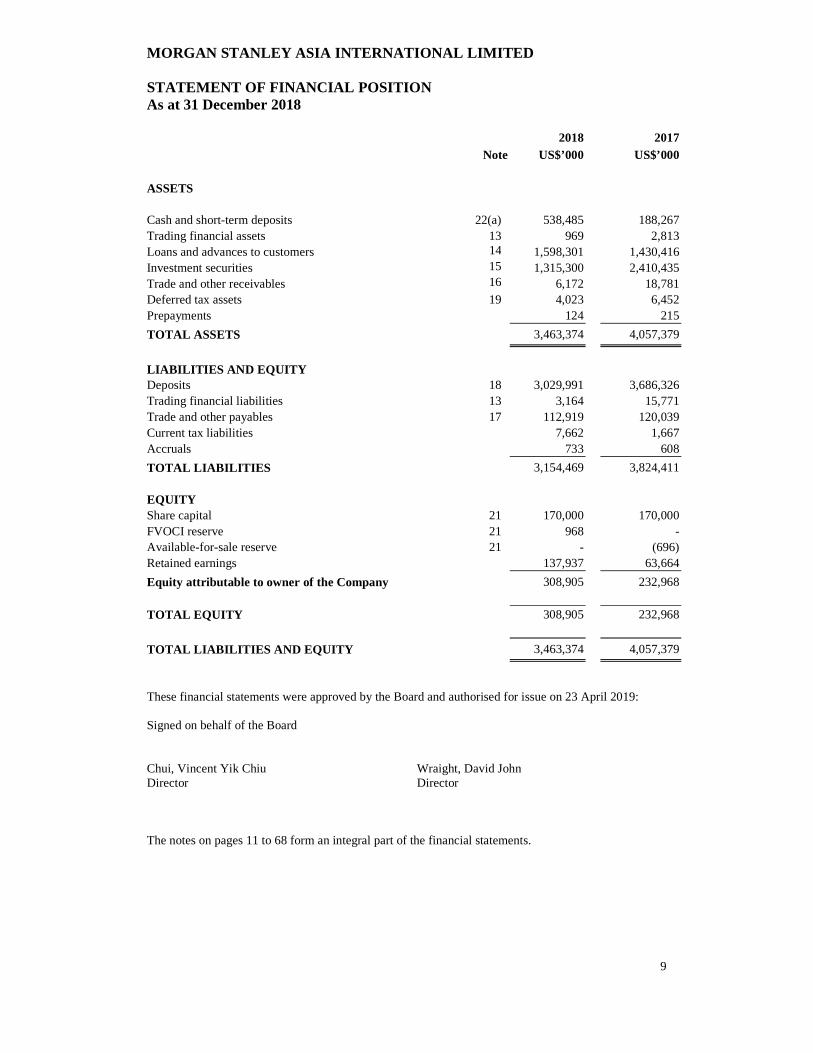
MORGAN STANLEY ASIA INTERNATIONAL LIMITED STATEMENT OF FINANCIAL POSITION As at 31 December 2018
9
2018 2017 Note US$’000 US$’000 ASSETS Cash and short-term deposits 22(a) 538,485 188,267 Trading financial assets 13 969 2,813 Loans and advances to customers 14 1,598,301 1,430,416 Investment securities 15 1,315,300 2,410,435 Trade and other receivables 16 6,172 18,781 Deferred tax assets 19 4,023 6,452 Prepayments 124 215 TOTAL ASSETS 3,463,374 4,057,379 LIABILITIES AND EQUITY Deposits 18 3,029,991 3,686,326 Trading financial liabilities 13 3,164 15,771 Trade and other payables 17 112,919 120,039 Current tax liabilities 7,662 1,667 Accruals 733 608 TOTAL LIABILITIES 3,154,469 3,824,411 EQUITY Share capital 21 170,000 170,000 FVOCI reserve 21 968 - Available-for-sale reserve 21 - (696) Retained earnings 137,937 63,664 Equity attributable to owner of the Company 308,905 232,968 TOTAL EQUITY 308,905 232,968 TOTAL LIABILITIES AND EQUITY 3,463,374 4,057,379 These financial statements were approved by the Board and authorised for issue on 23 April 2019: Signed on behalf of the Board Chui, Vincent Yik Chiu Wraight, David John Director Director The notes on pages 11 to 68 form an integral part of the financial statements.
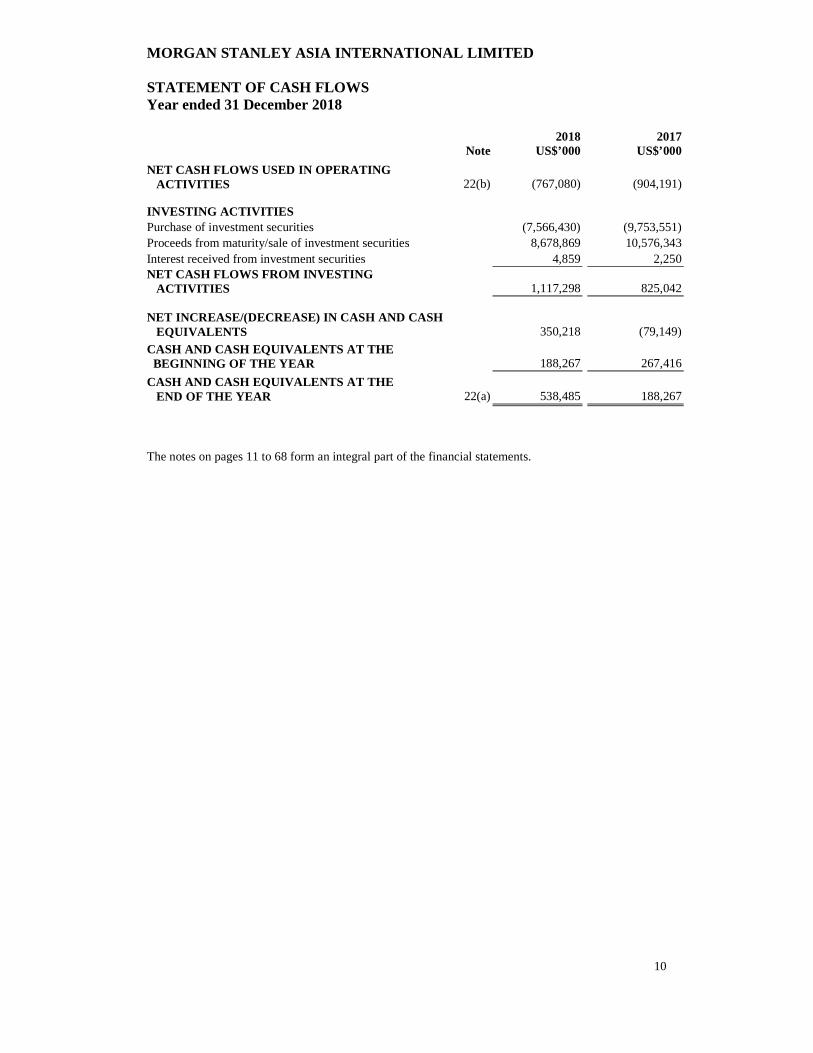
MORGAN STANLEY ASIA INTERNATIONAL LIMITED STATEMENT OF CASH FLOWS Year ended 31 December 2018
10
2018 2017 Note US$’000 US$’000
NET CASH FLOWS USED IN OPERATING ACTIVITIES 22(b) (767,080) (904,191) INVESTING ACTIVITIES Purchase of investment securities (7,566,430) (9,753,551) Proceeds from maturity/sale of investment securities 8,678,869 10,576,343 Interest received from investment securities 4,859 2,250 NET CASH FLOWS FROM INVESTING ACTIVITIES 1,117,298 825,042 NET INCREASE/(DECREASE) IN CASH AND CASH EQUIVALENTS 350,218 (79,149)
CASH AND CASH EQUIVALENTS AT THE BEGINNING OF THE YEAR 188,267 267,416
CASH AND CASH EQUIVALENTS AT THE END OF THE YEAR 22(a) 538,485 188,267 The notes on pages 11 to 68 form an integral part of the financial statements.

MORGAN STANLEY ASIA INTERNATIONAL LIMITED NOTES TO THE FINANCIAL STATEMENTS Year ended 31 December 2018
11
1. CORPORATE INFORMATION The Company is a private limited company with a head office in Hong Kong and a branch in Singapore (“Branch”). The Company was incorporated and is domiciled in Hong Kong, at the following principal place of business: Level 31, International Commerce Centre, 1 Austin Road West, Kowloon, Hong Kong.
The Company is a restricted licence bank under the Banking Ordinance in Hong Kong and the Branch is licensed as a wholesale bank in Singapore. The Company is regulated by the HKMA and the Branch is regulated by the MAS. It is also a registered institution under the Hong Kong Securities and Futures Ordinance. The principal activities of the Company are to engage in the business of banking including deposit taking and lending. It also acts (a) as agent on behalf of its customers in connection with the provision of general investment, securities and futures dealing, as well as discretionary management and (b) as introducing broker to Morgan Stanley & Co. International plc for the provision of clearance, settlement and custody services in relation to the aforementioned transactions.
As at 31 December 2018 and 31 December 2017, the Company’s immediate parent undertaking was MSHKL, which was incorporated in Hong Kong.
The Company’s ultimate parent undertaking and controlling entity is Morgan Stanley which, together with the Company and Morgan Stanley’s other subsidiary undertakings, form the Morgan Stanley Group. Morgan Stanley is incorporated in the State of Delaware, the United States of America. Copies of its financial statements can be obtained from http://www.morganstanley.com/investorrelations.
2. BASIS OF PREPARATION Statement of compliance
The Company has prepared its annual financial statements in accordance with Hong Kong Financial Reporting Standards (“HKFRS”) and interpretations issued by the Hong Kong Institute of Certified Public Accountants (“HKICPA”) and the Hong Kong Companies Ordinance.
New standards and interpretations adopted during the year
The following standards, amendments to standards and interpretations relevant to the Company’s operations were adopted during the year. Except where otherwise stated, these standards, amendments to standards and interpretations did not have a material impact on the Company’s financial statements.
An amendment to HKFRS 2 ‘Share-based Payment’ was issued by the HKICPA in August 2016, for application in accounting periods beginning on or after 1 January 2018. Early application is permitted.
HKFRS 9 ‘Financial instruments’ (“HKFRS 9”) was issued by the HKICPA in November 2009, amended in December 2013, and revised and reissued by the HKICPA in September 2014. HKFRS 9 is applicable retrospectively, except where otherwise prescribed by transitional provisions of the standard, and is effective for accounting periods beginning on or after 1 January 2018. The Company has adopted the requirements of HKFRS 9 from 1 January 2018.

MORGAN STANLEY ASIA INTERNATIONAL LIMITED NOTES TO THE FINANCIAL STATEMENTS Year ended 31 December 2018
12
2. BASIS OF PREPARATION (CONTINUED) New standards and interpretations adopted during the year (continued)
The main aspects of HKFRS 9 which impact the Company are its requirements relating to:
• Classification and measurement of financial assets
The classification and measurement of financial assets is determined based upon how these financial assets are managed (the Company’s business model) and their contractual cash flow characteristics. Measurement will be either at amortised cost, fair value through other comprehensive income (“FVOCI”) or fair value through profit or loss (“FVPL”).
• Impairment of financial instruments
The impairment requirements are based on expected credit losses (“ECLs”) and apply to financial assets measured at amortised cost and at FVOCI.
The Company has completed a project to implement HKFRS 9. As part of this project, the Company performed an evaluation of its business models and a review of the contractual terms of financial assets measured at amortised cost and FVOCI under HKFRS 9 to ensure that they are compatible with such classifications.
As a result of this evaluation, government debt securities held as available-for-sale have reclassified to FVOCI with a consequent transfer of the accumulated available-for-sale reserve to FVOCI reserve. There was no impact on the Company’s retained earnings at 1 January 2018.
For lending products and other debt financial instruments, a model-based approach has been adopted, the key aspects of which are:
• The impairment allowance is based on ECLs associated with the lifetime cash shortfalls that will result if a default occurs in the twelve months after the reporting date (“twelve month ECL”), unless there has been a significant increase in credit risk (“SICR”) since origination, in which case the ECL is based on all possible defaults over the total expected life of the instrument (“lifetime ECL”).
• Identifying whether assets have experienced a SICR since origination. When determining whether credit risk has increased significantly since initial recognition, the Company considers both quantitative and qualitative information and analysis, based on the Company’s historical experience and expert credit risk assessment, including forward-looking information.
• Estimating ECL, reflecting an unbiased and the probability-weighted impact of multiple future economic scenarios. ECLs are calculated using three main components: probability of default (“PD”), the expected loss given default (“LGD”) and an estimated exposure at default (“EAD”). These parameters are generally derived from internally developed statistical models, combined with historical, current and forward-looking customer and macro-economic data.
For some portfolios of financial assets, ECLs have been estimated to be close to zero, reflecting the benefit of collateral or other credit mitigants.
There was no impact to the retained earnings of the Company as at 1 January 2018 as a result of the implementation of the ECL impairment approach.
Under the transitional provisions of the standard, the Company’s opening statement of financial position at the date of initial application (1 January 2018) has been restated, with no restatement of comparative periods. However, the Company has updated the presentation of its primary statements on transition to HKFRS 9 to provide more relevant information to the users of the financial statements. The comparative period has been re-presented to align to the new format in the annual financial statements.
MORGAN STANLEY ASIA INTERNATIONAL LIMITED NOTES TO THE FINANCIAL STATEMENTS Year ended 31 December 2018
13
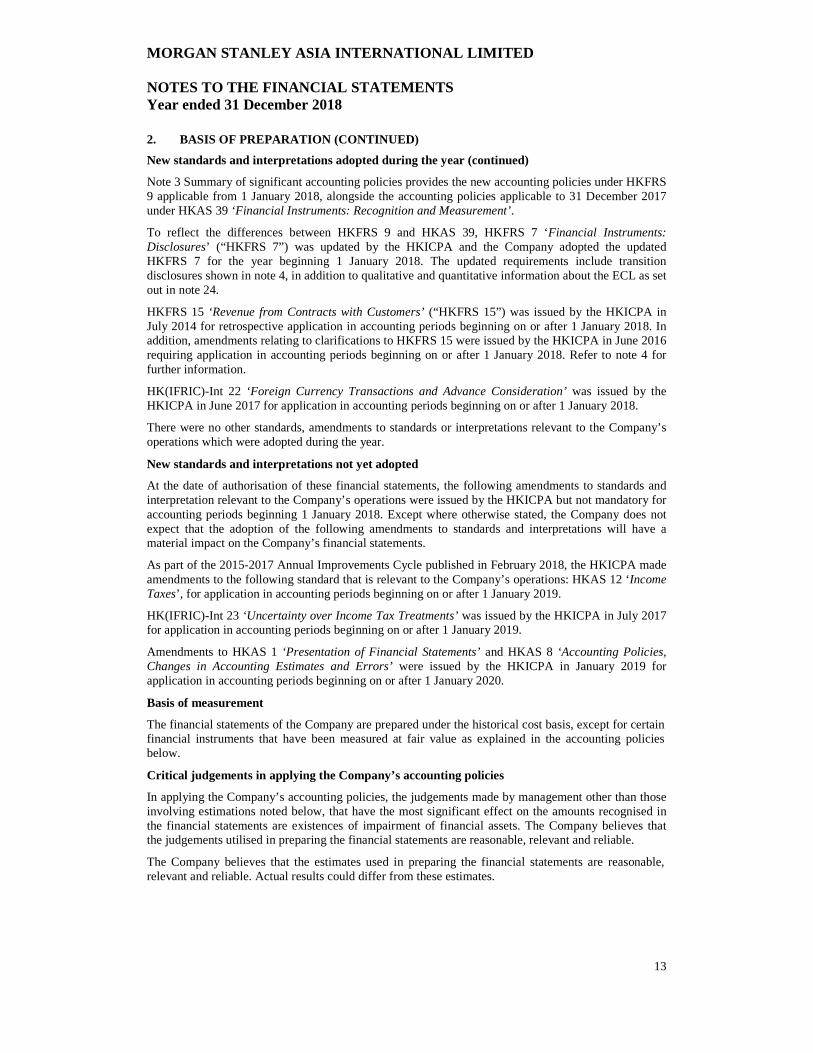
2. BASIS OF PREPARATION (CONTINUED) New standards and interpretations adopted during the year (continued)
Note 3 Summary of significant accounting policies provides the new accounting policies under HKFRS 9 applicable from 1 January 2018, alongside the accounting policies applicable to 31 December 2017 under HKAS 39 ‘Financial Instruments: Recognition and Measurement’ .
To reflect the differences between HKFRS 9 and HKAS 39, HKFRS 7 ‘Financial Instruments: Disclosures’ (“HKFRS 7”) was updated by the HKICPA and the Company adopted the updated HKFRS 7 for the year beginning 1 January 2018. The updated requirements include transition disclosures shown in note 4, in addition to qualitative and quantitative information about the ECL as set out in note 24.
HKFRS 15 ‘Revenue from Contracts with Customers’ (“HKFRS 15”) was issued by the HKICPA in July 2014 for retrospective application in accounting periods beginning on or after 1 January 2018. In addition, amendments relating to clarifications to HKFRS 15 were issued by the HKICPA in June 2016 requiring application in accounting periods beginning on or after 1 January 2018. Refer to note 4 for further information.
HK(IFRIC)-Int 22 ‘Foreign Currency Transactions and Advance Consideration’ was issued by the HKICPA in June 2017 for application in accounting periods beginning on or after 1 January 2018.
There were no other standards, amendments to standards or interpretations relevant to the Company’s operations which were adopted during the year.
New standards and interpretations not yet adopted
At the date of authorisation of these financial statements, the following amendments to standards and interpretation relevant to the Company’s operations were issued by the HKICPA but not mandatory for accounting periods beginning 1 January 2018. Except where otherwise stated, the Company does not expect that the adoption of the following amendments to standards and interpretations will have a material impact on the Company’s financial statements.
As part of the 2015-2017 Annual Improvements Cycle published in February 2018, the HKICPA made amendments to the following standard that is relevant to the Company’s operations: HKAS 12 ‘Income Taxes’, for application in accounting periods beginning on or after 1 January 2019.
HK(IFRIC)-Int 23 ‘Uncertainty over Income Tax Treatments’ was issued by the HKICPA in July 2017 for application in accounting periods beginning on or after 1 January 2019.
Amendments to HKAS 1 ‘Presentation of Financial Statements’ and HKAS 8 ‘Accounting Policies, Changes in Accounting Estimates and Errors’ were issued by the HKICPA in January 2019 for application in accounting periods beginning on or after 1 January 2020.
Basis of measurement
The financial statements of the Company are prepared under the historical cost basis, except for certain financial instruments that have been measured at fair value as explained in the accounting policies below.
Critical judgements in applying the Company’s accounting policies
In applying the Company’s accounting policies, the judgements made by management other than those involving estimations noted below, that have the most significant effect on the amounts recognised in the financial statements are existences of impairment of financial assets. The Company believes that the judgements utilised in preparing the financial statements are reasonable, relevant and reliable.
The Company believes that the estimates used in preparing the financial statements are reasonable, relevant and reliable. Actual results could differ from these estimates.

MORGAN STANLEY ASIA INTERNATIONAL LIMITED NOTES TO THE FINANCIAL STATEMENTS Year ended 31 December 2018
14
2. BASIS OF PREPARATION (CONTINUED) Key sources of estimation uncertainty
The preparation of the Company’s financial statements requires management to make judgements involving estimations and other assumptions regarding the valuation of certain financial instruments that affect the financial statements and related disclosures. For further details on the assumptions and estimation uncertainties in determining the fair value of certain assets and liabilities, see notes 3(d) and 27.
The going concern assumption
The notes to the financial statements include the Company’s objectives, policies and processes for managing its capital; its financial risk management objectives; details of its financial instruments; and its exposures to credit risk and liquidity risk. Retaining sufficient liquidity and capital to withstand market pressures remains central to the Morgan Stanley Group’s and the Company’s strategy.
Taking the above factors into consideration, the Directors believe it is reasonable to assume that the Company will have access to adequate resources to continue in operational existence for the foreseeable future. Accordingly, they continue to adopt the going concern basis in preparing the annual report and financial statements.
3. SUMMARY OF SIGNIFICANT ACCOUNTING POLICIES a. Functional currency
Items included in the financial statements are measured and presented in US dollars, the currency of the primary economic environment in which the Company operates.
All currency amounts in the financial statements are rounded to the nearest thousand US dollars.
b. Foreign currencies
All monetary assets and liabilities denominated in currencies other than US dollars are translated into US dollars at the rates ruling at the reporting date. Transactions and non-monetary assets and liabilities denominated in currencies other than US dollars are recorded at the rates prevailing at the dates of the transactions. From 1 January 2018, foreign exchange differences arising from translation differences of the amortised cost of financial assets measured at FVOCI are recognised in the income statement. All other gains and losses from movements in foreign exchange rates on financial assets measured at FVOCI are recorded in other comprehensive income. Until 31 December 2017, foreign exchange differences on available-for-sale financial assets were recorded in the ‘Available-for-sale reserve’ in equity, with the exception of translation differences on the amortised cost of monetary available-for-sale financial assets, which are recognised through the income statement. All other translation differences are taken through the income statement. Exchange differences recognised in the income statement are presented in ‘Other revenue’ or ‘Other expenses’, except where noted in 3(c) below.
c. Financial instruments
i) Financial instruments mandatorily at fair value through profit and loss
Trading financial instruments
Trading financial instruments include all derivatives contracts.
Trading financial instruments are initially recorded on trade date at fair value (see note 3(d) below). All subsequent changes in fair value and foreign exchange differences are reflected in the income statement in ‘Net trading income/(expense)’.
For all trading financial instruments, transaction costs are excluded from the initial fair value measurement of the financial instrument. These costs are recognised in the income statement in ‘Other expenses’.
MORGAN STANLEY ASIA INTERNATIONAL LIMITED NOTES TO THE FINANCIAL STATEMENTS Year ended 31 December 2018
15
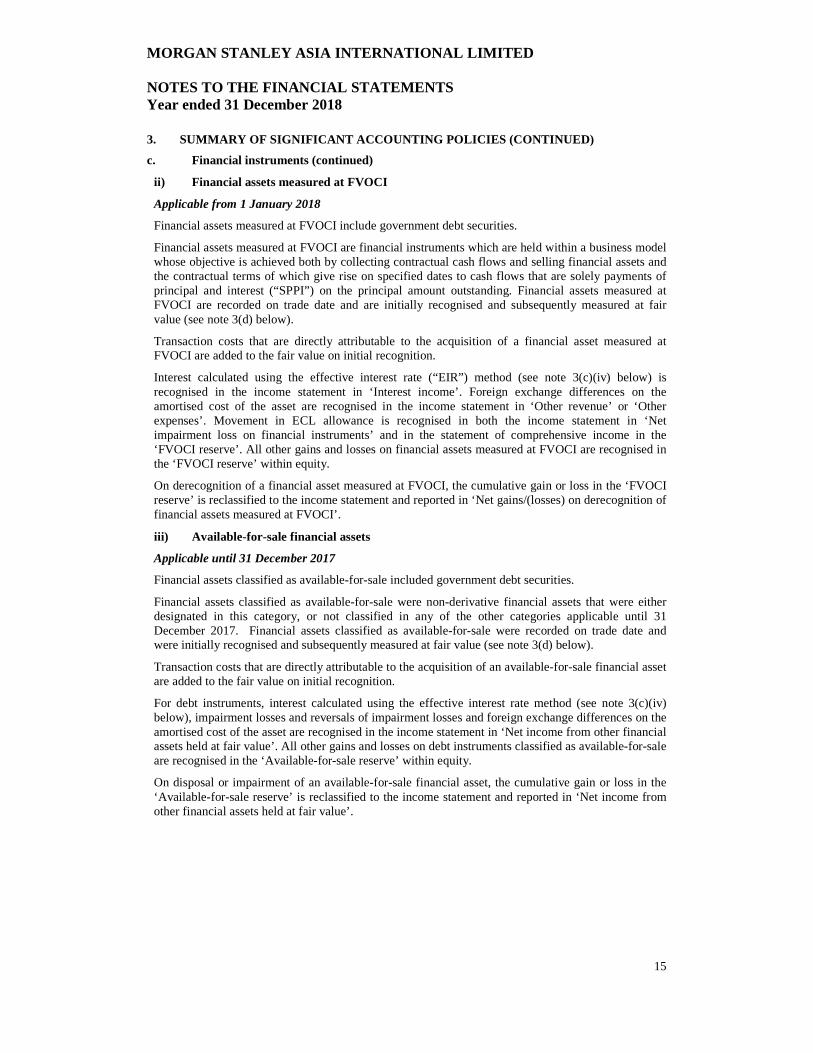
3. SUMMARY OF SIGNIFICANT ACCOUNTING POLICIES (CONTINU ED) c. Financial instruments (continued)
ii) Financial assets measured at FVOCI
Applicable from 1 January 2018
Financial assets measured at FVOCI include government debt securities.
Financial assets measured at FVOCI are financial instruments which are held within a business model whose objective is achieved both by collecting contractual cash flows and selling financial assets and the contractual terms of which give rise on specified dates to cash flows that are solely payments of principal and interest (“SPPI”) on the principal amount outstanding. Financial assets measured at FVOCI are recorded on trade date and are initially recognised and subsequently measured at fair value (see note 3(d) below).
Transaction costs that are directly attributable to the acquisition of a financial asset measured at FVOCI are added to the fair value on initial recognition.
Interest calculated using the effective interest rate (“EIR”) method (see note 3(c)(iv) below) is recognised in the income statement in ‘Interest income’. Foreign exchange differences on the amortised cost of the asset are recognised in the income statement in ‘Other revenue’ or ‘Other expenses’. Movement in ECL allowance is recognised in both the income statement in ‘Net impairment loss on financial instruments’ and in the statement of comprehensive income in the ‘FVOCI reserve’. All other gains and losses on financial assets measured at FVOCI are recognised in the ‘FVOCI reserve’ within equity.
On derecognition of a financial asset measured at FVOCI, the cumulative gain or loss in the ‘FVOCI reserve’ is reclassified to the income statement and reported in ‘Net gains/(losses) on derecognition of financial assets measured at FVOCI’.
iii) Available-for-sale financial assets
Applicable until 31 December 2017
Financial assets classified as available-for-sale included government debt securities.
Financial assets classified as available-for-sale were non-derivative financial assets that were either designated in this category, or not classified in any of the other categories applicable until 31 December 2017. Financial assets classified as available-for-sale were recorded on trade date and were initially recognised and subsequently measured at fair value (see note 3(d) below).
Transaction costs that are directly attributable to the acquisition of an available-for-sale financial asset are added to the fair value on initial recognition.
For debt instruments, interest calculated using the effective interest rate method (see note 3(c)(iv) below), impairment losses and reversals of impairment losses and foreign exchange differences on the amortised cost of the asset are recognised in the income statement in ‘Net income from other financial assets held at fair value’. All other gains and losses on debt instruments classified as available-for-sale are recognised in the ‘Available-for-sale reserve’ within equity.
On disposal or impairment of an available-for-sale financial asset, the cumulative gain or loss in the ‘Available-for-sale reserve’ is reclassified to the income statement and reported in ‘Net income from other financial assets held at fair value’.
MORGAN STANLEY ASIA INTERNATIONAL LIMITED NOTES TO THE FINANCIAL STATEMENTS Year ended 31 December 2018
16
3. SUMMARY OF SIGNIFICANT ACCOUNTING POLICIES (CONTINU ED) c. Financial instruments (continued)
iv) Financial assets and financial liabilities at amortised cost
Applicable from 1 January 2018
Financial assets are recognised at amortised cost when the Company’s business model objective is to collect the contractual cash flows of the assets and where these cash flows are SPPI on the principal amount outstanding until maturity. Such assets are recognised when the Company becomes a party to the contractual provisions of the instrument. The instruments are initially measured at fair value (see note 3(d) below) and subsequently measured at amortised cost less ECL allowance. Interest is recognised in the income statement in ‘Interest income’, using the EIR method as described below. Transaction costs are incremental costs that are directly attributable to the acquisition, issue or disposal of a financial instrument. Transaction costs that are directly attributable to the acquisition of the financial asset are added to the fair value on initial recognition. ECL and reversals thereof are recognised in the income statement in ‘Net impairment loss on financial instruments’.
Financial assets at amortised cost include cash and short-term deposits, loans and advances to customers and trade and other receivables.
Applicable until 31 December 2017
Financial assets classified as loans and receivables were recognised when the Company became a party to the contractual provisions of the instrument. They were initially measured at fair value (see note 3(d) below) and subsequently measured at amortised cost less allowance for impairment. Interest was recognised in the income statement in ‘Interest income’, using the EIR method as described below. Transaction costs that were directly attributable to the acquisition of the financial asset were added to the fair value on initial recognition. Impairment losses and reversals of impairment losses on financial assets classified as loans and receivables were recognised in the income statement in ‘Other expense’.
Financial assets classified as loans and receivables included cash and short-term deposits, loans and advances to customers and trade and other receivables.
Applicable until 31 December 2017 and from 1 January 2018
Financial liabilities are classified as being subsequently measured at amortised cost, except where they are held for trading or are designated as measured at FVPL. They are recognised when the Company becomes a party to the contractual provisions of the instrument and are initially measured at fair value (see note 3(d) below) and subsequently measured at amortised cost. Interest is recognised in the income statement in ‘Interest expense’ using the EIR method as described below. Transaction costs that are directly attributable to the issue of a financial liability are deducted from the fair value on initial recognition.
The EIR method is a method of calculating the amortised cost of a financial instrument (or a group of financial instruments) and of allocating the interest income or interest expense over the expected life of the financial instrument. The EIR is the rate that exactly discounts the estimated future cash payments and receipts through the expected life of the financial instrument (or, where appropriate, a shorter period) to the carrying amount of the financial instrument. The EIR is established on initial recognition of the financial instrument. The calculation of the EIR includes all fees and commissions paid or received, transaction costs, and discounts or premiums that are an integral part of the EIR.
Financial liabilities classified at amortised cost include deposits and trade and other payables.

MORGAN STANLEY ASIA INTERNATIONAL LIMITED NOTES TO THE FINANCIAL STATEMENTS Year ended 31 December 2018
17
3. SUMMARY OF SIGNIFICANT ACCOUNTING POLICIES (CONTINU ED) d. Fair value
Fair value measurement
Fair value is defined as the price that would be received to sell an asset or paid to transfer a liability (i.e. the “exit price”) in an orderly transaction between market participants at the measurement date.
Fair value is a market-based measure considered from the perspective of a market participant rather than an entity-specific measure. Therefore, even when market assumptions are not readily available, assumptions are set to reflect those that the Company believes market participants would use in pricing the asset or liability at the measurement date.
Where the Company manages a group of financial assets and financial liabilities on the basis of its net exposure to either market risks or credit risk, the Company measures the fair value of that group of financial instruments consistently with how market participants would price the net risk exposure at the measurement date.
In determining fair value, the Company uses various valuation approaches and establishes a hierarchy for inputs used in measuring fair value that maximises the use of relevant observable inputs and minimises the use of unobservable inputs by requiring that the most observable inputs be used when available. Observable inputs are inputs that market participants would use in pricing the asset or liability that were developed based on market data obtained from sources independent of the Company. Unobservable inputs are inputs that reflect assumptions that the Company believes other market participants would use in pricing the asset or liability, that are developed based on the best information available in the circumstances.
The hierarchy is broken down into three levels based on the observability of inputs as follows, with Level 1 being the highest and Level 3 being the lowest level:
• Level 1 - Quoted prices (unadjusted) in an active market for identical assets or liabilities
Valuations based on quoted prices in active markets that the Morgan Stanley Group has the ability to access for identical assets or liabilities. Valuation adjustments and block discounts are not applied to Level 1 instruments. Since valuations are based on quoted prices that are readily and regularly available in an active market, valuation of these products does not entail a significant degree of judgement.

MORGAN STANLEY ASIA INTERNATIONAL LIMITED NOTES TO THE FINANCIAL STATEMENTS Year ended 31 December 2018
18
3. SUMMARY OF SIGNIFICANT ACCOUNTING POLICIES (CONTINU ED) d. Fair value (continued)
Fair value measurement (continued)
• Level 2 - Valuation techniques using observable inputs
Valuations based on one or more quoted prices in markets that are not active or for which all significant inputs are observable, either directly or indirectly.
• Level 3 - Valuation techniques with significant unobservable inputs
Valuations based on inputs that are unobservable and significant to the overall fair value measurement.
The availability of observable inputs can vary from product to product and is affected by a wide variety of factors, including, for example, the type of product, whether the product is new and not yet established in the marketplace, the liquidity of markets and other characteristics particular to the product. To the extent that valuation is based on models or inputs that are less observable or unobservable in the market, the determination of fair value requires more judgement. Accordingly, the degree of judgement exercised by the Company in determining fair value is greatest for instruments categorised in Level 3 of the fair value hierarchy.
The Company considers prices and inputs that are current as of the measurement date, including during periods of market dislocation. In periods of market dislocation, the observability of prices and inputs may be reduced for many instruments. This condition could cause an instrument to be reclassified from Level 1 to Level 2 or Level 2 to Level 3 of the fair value hierarchy.
In certain cases, the inputs used to measure fair value may fall into different levels of the fair value hierarchy. In such cases, for disclosure purposes, the level in the fair value hierarchy within which the fair value measurement falls in its entirety is determined based on the lowest level input that is significant to the fair value measurement in its entirety.
For assets and liabilities that are transferred between levels in the fair value hierarchy during the period, fair values are ascribed as if the assets or liabilities had been transferred as of beginning of the period.
Valuation techniques
Many cash instruments and OTC derivative contracts have bid and ask prices that can be observed in the marketplace. Bid prices reflect the highest price that a party is willing to pay for an asset. Ask prices represent the lowest price that a party is willing to accept for an asset. The Company carries positions at the point within the bid-ask range that meets its best estimate of fair value. For offsetting positions in the same financial instrument, the same price within the bid-ask spread is used to measure both the long and short positions.
Fair value for many cash instruments and OTC derivative contracts is derived using pricing models. Pricing models take into account the contract terms, as well as multiple inputs including, where applicable, commodity prices, equity prices, interest rate yield curves, credit curves, correlation, creditworthiness of the counterparty, creditworthiness of the Company, option volatility and currency rates.
Where appropriate, valuation adjustments are made to account for various factors such as liquidity risk (bid-ask adjustments), credit quality, model uncertainty and concentration risk.
MORGAN STANLEY ASIA INTERNATIONAL LIMITED NOTES TO THE FINANCIAL STATEMENTS Year ended 31 December 2018
19
3. SUMMARY OF SIGNIFICANT ACCOUNTING POLICIES (CONTINU ED) d. Fair value (continued)
Valuation techniques (continued)
Adjustments for liquidity risk adjust model-derived mid-market levels of Level 2 and Level 3 financial instruments for the bid-mid or mid-ask spread required to properly reflect the exit price of a risk position. Bid-mid and mid-ask spreads are marked to levels observed in trade activity, broker quotes or other external third-party data. Where these spreads are unobservable for the particular position in question, spreads are derived from observable levels of similar positions.
Valuation process
Valuation Control (“VC”) within the Financial Control Group (“FCG”) is responsible for the Company’s fair value valuation policies, processes and procedures. VC is independent of the business units and reports to the Chief Financial Officer of the Morgan Stanley Group (“CFO”), who has final authority over the valuation of the Company’s financial instruments. VC implements valuation control processes designed to validate the fair value of the Company’s financial instruments measured at fair value including those derived from pricing models.
Model Review. VC, in conjunction with the Model Risk Management Department (“MRM”), which reports to the Chief Risk Officer of the Morgan Stanley Group (“CRO”), independently reviews valuation models’ theoretical soundness, the appropriateness of the valuation methodology and calibration techniques developed by the business units using observable inputs. Where inputs are not observable, VC reviews the appropriateness of the proposed valuation methodology to determine that it is consistent with how a market participant would arrive at the unobservable input. The valuation methodologies utilised in the absence of observable inputs may include extrapolation techniques and the use of comparable observable inputs. As part of the review, VC develops a methodology to independently verify the fair value generated by the business unit’s valuation models. The Company generally subjects valuations and models to a review process initially and on a periodic basis thereafter.

MORGAN STANLEY ASIA INTERNATIONAL LIMITED NOTES TO THE FINANCIAL STATEMENTS Year ended 31 December 2018
20
3. SUMMARY OF SIGNIFICANT ACCOUNTING POLICIES (CONTINU ED) d. Fair value (continued)
Valuation process (continued)
Independent Price Verification. The business units are responsible for determining the fair value of financial instruments using approved valuation models and valuation methodologies. Generally on a monthly basis, VC independently validates the fair values of financial instruments determined using valuation models by determining the appropriateness of the inputs used by the business units and by testing compliance with the documented valuation methodologies approved in the model review process described above.
The results of this independent price verification and any adjustments made by VC to the fair value generated by the business units are presented to management of the Morgan Stanley Group’s three business segments (i.e. Institutional Securities, Wealth Management and Investment Management), the CFO and the CRO on a regular basis.
VC uses recently executed transactions, other observable market data such as exchange data, broker/ dealer quotes, third-party pricing vendors and aggregation services for validating the fair values of financial instruments generated using valuation models. VC assesses the external sources and their valuation methodologies to determine if the external providers meet the minimum standards expected of a third-party pricing source. Pricing data provided by approved external sources are evaluated using a number of approaches; for example, by corroborating the external sources’ prices to executed trades, by analysing the methodology and assumptions used by the external source to generate a price and/ or by evaluating how active the third-party pricing source (or originating sources used by the third-party pricing source) is in the market. Based on this analysis, VC generates a ranking of the observable market data designed to ensure that the highest-ranked market data source is used to validate the business unit’s fair value of financial instruments.
VC reviews the models and valuation methodology used to price new material Level 2 and Level 3 transactions and both FCG and MRM must approve the fair value of the trade that is initially recognised.
Level 3 Transactions. VC reviews the business unit’s valuation techniques to assess whether these are consistent with market participant assumptions.
Gains and losses on inception
In the normal course of business, the fair value of a financial instrument on initial recognition is the transaction price (i.e. the fair value of the consideration given or received). In certain circumstances, however, the fair value will be based on other observable current market transactions in the same instrument, without modification or repackaging, or on a valuation technique whose variables include only data from observable markets. When such evidence exists, the Company recognises a gain or loss on inception of the transaction.
When the use of unobservable market data has a significant impact on determining fair value at the inception of the transaction, the entire initial gain or loss indicated by the valuation technique as at the transaction date is not recognised immediately in the income statement and is recognised instead when the market data becomes observable or on maturity or disposal of the instrument.
e. Derecognition of financial assets and liabilities
Applicable until 31 December 2017 and from 1 January 2018
The Company derecognises a financial asset when the contractual rights to the cash flows from the asset expire, or when it transfers the financial asset and substantially all the risk and rewards of ownership of the asset.
If the asset has been transferred, and the Company neither transfers nor retains substantially all of the risks and rewards of the asset, then the Company determines whether it has retained control of the asset.
MORGAN STANLEY ASIA INTERNATIONAL LIMITED NOTES TO THE FINANCIAL STATEMENTS Year ended 31 December 2018
21
3. SUMMARY OF SIGNIFICANT ACCOUNTING POLICIES (CONTINU ED) e. Derecognition of financial assets and liabilities (continued)
Applicable until 31 December 2017 and from 1 January 2018 (continued)
If the Company has retained control of the asset, it shall continue to recognise the financial asset to the extent of its continuing involvement in the financial asset. If the Company has not retained control of the asset, it derecognises the asset and separately recognises any rights or obligation created or retained in the transfer.
Upon derecognition of a financial asset, the difference between the previous carrying amount and the sum of any consideration received, together with the transfer of any cumulative gain/loss previously recognised in equity, are recognised in the income statement within ‘Net gains/(losses) on derecognition of financial assets measured at FVOCI’.
The Company derecognises financial liabilities when the Company’s obligations are discharged or cancelled or when they expire.
f. Impairment of financial instruments
Applicable from 1 January 2018
The Company recognises loss allowances for ECL for the following financial instruments that are not measured at FVPL:
• financial assets measured at amortised cost;
• financial assets measured at FVOCI;
Measurement of ECL
For financial assets, ECLs are the present value of cash shortfalls (i.e. the difference between contractual and expected cash flows) over the expected life of the financial instrument, discounted at the asset’s EIR.
Where a financial asset is credit-impaired at the reporting date, the ECL is measured as the difference between the asset’s gross carrying amount and the present value of future cash flows, discounted at the original EIR.
The Company applies a three stage approach to measuring ECLs based on the change in credit risk since initial recognition:
• Stage 1: if the credit risk of the financial instrument at the reporting date has not increased significantly since initial recognition then the loss allowance is calculated as the lifetime cash shortfalls that will result if a default occurs in the next 12 months, weighted by the probability of that default occurring.
• Stage 2: if there has been a SICR since initial recognition, the loss allowance is calculated as the ECL over the remaining life of the financial instrument. If it is subsequently determined that there has no longer been a SICR since initial recognition, then the loss allowance reverts to reflecting 12 month expected losses.
MORGAN STANLEY ASIA INTERNATIONAL LIMITED NOTES TO THE FINANCIAL STATEMENTS Year ended 31 December 2018
22
3. SUMMARY OF SIGNIFICANT ACCOUNTING POLICIES (CONTINU ED) f. Impairment of financial instruments (continued)
Applicable from 1 January 2018 (continued)
Measurement of ECL (continued)
• Stage 3: if there has been a SICR since initial recognition and the financial instrument is deemed credit-impaired (see below for definition of credit-impaired), the loss allowance is calculated as the ECL over the remaining life of the financial instrument. If it is subsequently determined that there has no longer been a SICR since initial recognition, then the loss allowance reverts to reflecting 12 month expected losses.
The Company’s accounting policy is to not use the ‘low’ credit risk practical expedient. As a result, the Company monitors all financial instruments which do not have a significant financing component that are subject to impairment for SICR, with the exception of loans and advances to customers and the corresponding interest receivable, for which a lifetime ECL is always calculated.
In general, ECLs are measured so that they reflect:
a) A probability-weighted range of possible outcomes
b) The time value of money; and
c) Relevant information relating to past, current and future economic conditions.
When measuring ECLs, the Company considers multiple scenarios, except where practical expedients are used to determine ECLs. Practical expedients are used where they are consistent with the principles described above.
The Company measures ECL on an individual asset basis and has no purchased or originated credit-impaired financial assets.
More information on measurement of ECLs is provided in note 24.
Presentation of ECL
ECL is recognised in the income statement within ‘Net impairment loss on financial instruments’. ECLs on financial assets measured at amortised cost are presented as an ECL allowance. The allowance reduces the net carrying amount on the face of the statement of financial position. Where the financial asset is measured at FVOCI, the loss allowance is recognised as an accumulated impairment amount in other comprehensive income and does not reduce the carrying amount of the financial asset on the statement of financial position.
MORGAN STANLEY ASIA INTERNATIONAL LIMITED NOTES TO THE FINANCIAL STATEMENTS Year ended 31 December 2018
23
3. SUMMARY OF SIGNIFICANT ACCOUNTING POLICIES (CONTINU ED) f. Impairment of financial instruments (continued)
Applicable from 1 January 2018 (continued)
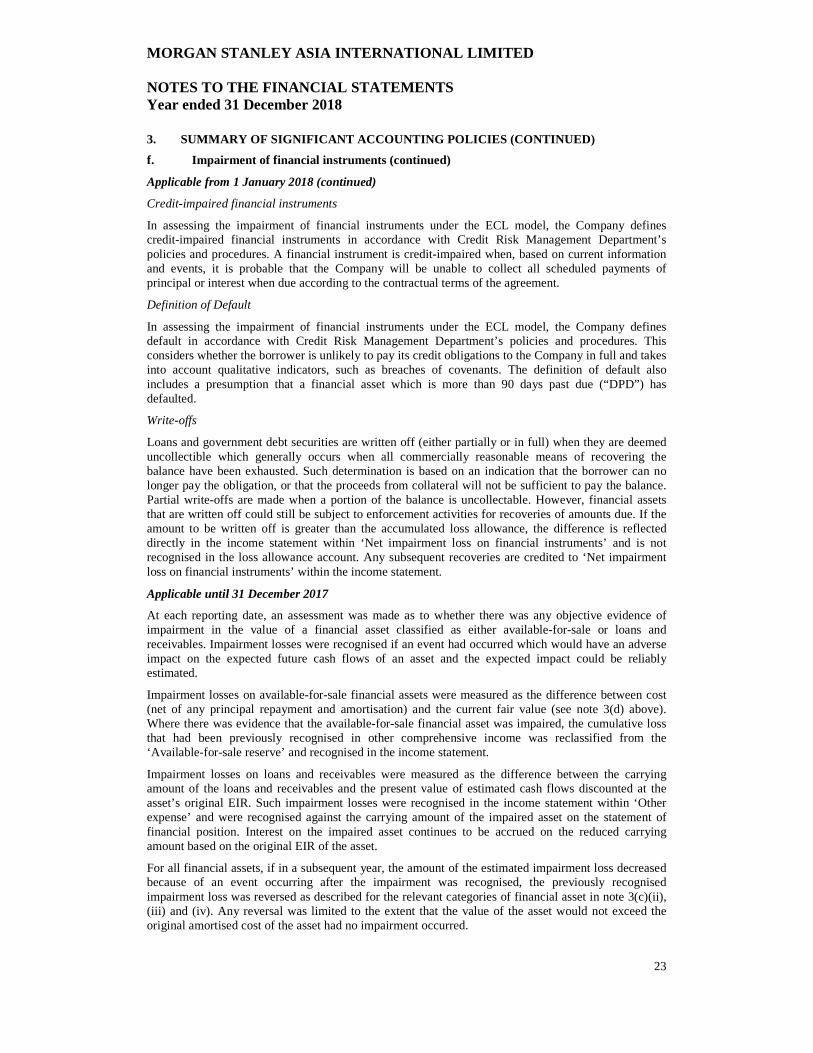
Credit-impaired financial instruments
In assessing the impairment of financial instruments under the ECL model, the Company defines credit-impaired financial instruments in accordance with Credit Risk Management Department’s policies and procedures. A financial instrument is credit-impaired when, based on current information and events, it is probable that the Company will be unable to collect all scheduled payments of principal or interest when due according to the contractual terms of the agreement.
Definition of Default
In assessing the impairment of financial instruments under the ECL model, the Company defines default in accordance with Credit Risk Management Department’s policies and procedures. This considers whether the borrower is unlikely to pay its credit obligations to the Company in full and takes into account qualitative indicators, such as breaches of covenants. The definition of default also includes a presumption that a financial asset which is more than 90 days past due (“DPD”) has defaulted.
Write-offs
Loans and government debt securities are written off (either partially or in full) when they are deemed uncollectible which generally occurs when all commercially reasonable means of recovering the balance have been exhausted. Such determination is based on an indication that the borrower can no longer pay the obligation, or that the proceeds from collateral will not be sufficient to pay the balance. Partial write-offs are made when a portion of the balance is uncollectable. However, financial assets that are written off could still be subject to enforcement activities for recoveries of amounts due. If the amount to be written off is greater than the accumulated loss allowance, the difference is reflected directly in the income statement within ‘Net impairment loss on financial instruments’ and is not recognised in the loss allowance account. Any subsequent recoveries are credited to ‘Net impairment loss on financial instruments’ within the income statement.
Applicable until 31 December 2017
At each reporting date, an assessment was made as to whether there was any objective evidence of impairment in the value of a financial asset classified as either available-for-sale or loans and receivables. Impairment losses were recognised if an event had occurred which would have an adverse impact on the expected future cash flows of an asset and the expected impact could be reliably estimated.
Impairment losses on available-for-sale financial assets were measured as the difference between cost (net of any principal repayment and amortisation) and the current fair value (see note 3(d) above). Where there was evidence that the available-for-sale financial asset was impaired, the cumulative loss that had been previously recognised in other comprehensive income was reclassified from the ‘Available-for-sale reserve’ and recognised in the income statement.
Impairment losses on loans and receivables were measured as the difference between the carrying amount of the loans and receivables and the present value of estimated cash flows discounted at the asset’s original EIR. Such impairment losses were recognised in the income statement within ‘Other expense’ and were recognised against the carrying amount of the impaired asset on the statement of financial position. Interest on the impaired asset continues to be accrued on the reduced carrying amount based on the original EIR of the asset.
For all financial assets, if in a subsequent year, the amount of the estimated impairment loss decreased because of an event occurring after the impairment was recognised, the previously recognised impairment loss was reversed as described for the relevant categories of financial asset in note 3(c)(ii), (iii) and (iv). Any reversal was limited to the extent that the value of the asset would not exceed the original amortised cost of the asset had no impairment occurred.
MORGAN STANLEY ASIA INTERNATIONAL LIMITED NOTES TO THE FINANCIAL STATEMENTS Year ended 31 December 2018
24
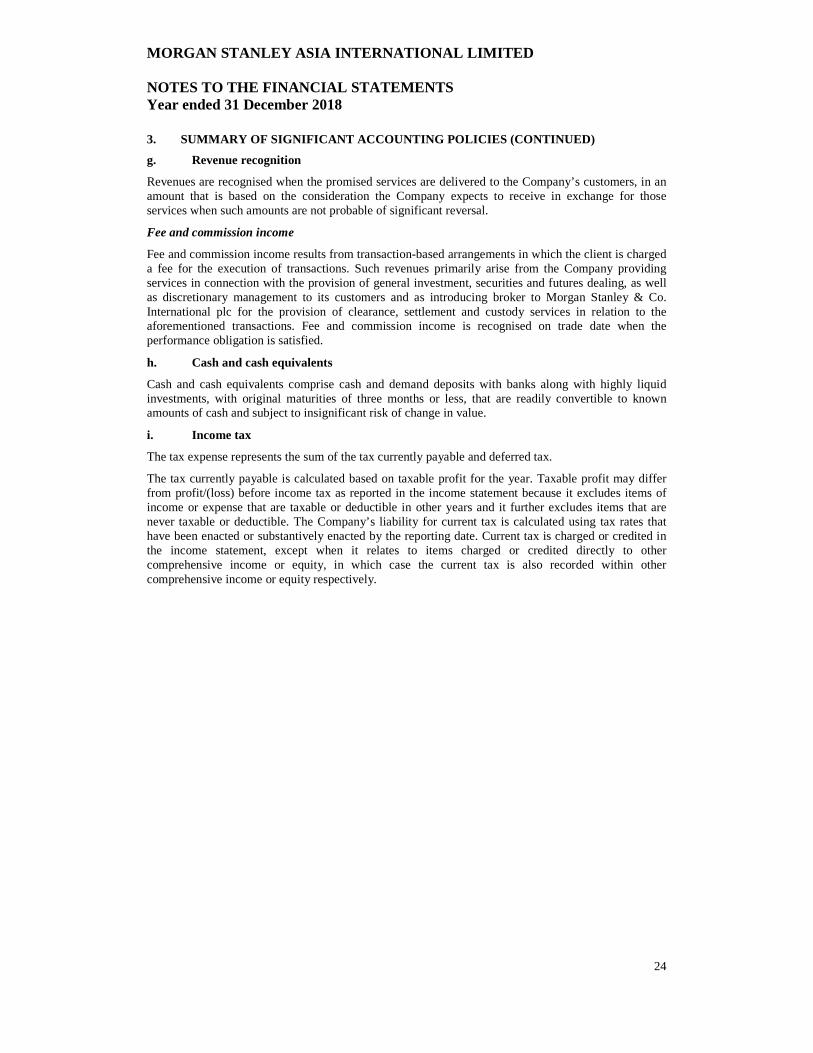
3. SUMMARY OF SIGNIFICANT ACCOUNTING POLICIES (CONTINU ED) g. Revenue recognition
Revenues are recognised when the promised services are delivered to the Company’s customers, in an amount that is based on the consideration the Company expects to receive in exchange for those services when such amounts are not probable of significant reversal.
Fee and commission income
Fee and commission income results from transaction-based arrangements in which the client is charged a fee for the execution of transactions. Such revenues primarily arise from the Company providing services in connection with the provision of general investment, securities and futures dealing, as well as discretionary management to its customers and as introducing broker to Morgan Stanley & Co. International plc for the provision of clearance, settlement and custody services in relation to the aforementioned transactions. Fee and commission income is recognised on trade date when the performance obligation is satisfied.
h. Cash and cash equivalents
Cash and cash equivalents comprise cash and demand deposits with banks along with highly liquid investments, with original maturities of three months or less, that are readily convertible to known amounts of cash and subject to insignificant risk of change in value.
i. Income tax
The tax expense represents the sum of the tax currently payable and deferred tax.
The tax currently payable is calculated based on taxable profit for the year. Taxable profit may differ from profit/(loss) before income tax as reported in the income statement because it excludes items of income or expense that are taxable or deductible in other years and it further excludes items that are never taxable or deductible. The Company’s liability for current tax is calculated using tax rates that have been enacted or substantively enacted by the reporting date. Current tax is charged or credited in the income statement, except when it relates to items charged or credited directly to other comprehensive income or equity, in which case the current tax is also recorded within other comprehensive income or equity respectively.

MORGAN STANLEY ASIA INTERNATIONAL LIMITED NOTES TO THE FINANCIAL STATEMENTS Year ended 31 December 2018
25
3. SUMMARY OF SIGNIFICANT ACCOUNTING POLICIES (CONTINU ED) i. Income tax (continued)
Deferred tax is the tax expected to be payable or recoverable on differences between the carrying amounts of assets and liabilities in the financial statements and the corresponding tax bases used in the computation of taxable profit, and is accounted for using the balance sheet liability method. Deferred tax liabilities are generally recognised for all taxable temporary differences and deferred tax assets are recognised to the extent that it is probable that taxable profits will be available against which deductible temporary differences can be utilised.
The carrying amount of deferred tax assets is reviewed at each reporting date and limited to the extent that it is probable that sufficient taxable profits will be available to allow all or part of the asset to be recovered.
Deferred tax is calculated at the tax rates that are expected to apply in the period when the liability is settled or the asset is realised. Deferred tax is charged or credited in the income statement, except when it relates to items charged or credited directly to other comprehensive income or equity, in which case the deferred tax is reflected within other comprehensive income or equity, respectively.
Current tax assets are offset against current tax liabilities when there is a legally enforceable right to set off current tax assets against current tax liabilities and the Company intends to settle its current tax assets and current tax liabilities on a net basis or to realise the asset and settle the liability simultaneously. Deferred tax assets and liabilities are offset when there is a legally enforceable right to set off current tax assets against current tax liabilities and when they relate to income taxes levied by the same taxation authority and the Company intends to settle its current tax assets and current tax liabilities on a net basis.
j. Employee compensation plans
i) Equity-settled share-based compensation plans
Morgan Stanley issues awards in the form of restricted stock units (“RSUs”) to employees of the Morgan Stanley Group for services rendered to the Company. Awards are classified as equity-settled and the cost of the equity-based transactions with employees is measured based on the fair value of the equity instruments at grant date. The fair value of RSUs is based on the market price of Morgan Stanley shares. Awards are amortised over the service period. An estimation of awards that will be forfeited prior to vesting due to the failure to satisfy service conditions or non-market based performance conditions is considered in calculating the total compensation cost to be amortised over the requisite service period.
Compensation expense for awards with performance conditions is recognised based on the probable outcome of the performance condition at each reporting date. Compensation expense for awards with market-based conditions is recognised irrespective of the probability of the market condition being achieved and is not reversed if the market condition is not met.
Generally awards contain clawback and cancellation provisions which permit the Company to cancel all or a portion of the award under specified circumstances. Compensation expense for those awards is adjusted to fair value based upon changes in the share price of Morgan Stanley’s common stock until conversion, exercise or expiration.
For year end equity-based awards anticipated to be granted to retirement-eligible employees under award terms that do not contain a future service requirement, the Company accrues the estimated cost over the course of the calendar year preceding the grant date, which reflects the period over which compensation is earned.

MORGAN STANLEY ASIA INTERNATIONAL LIMITED NOTES TO THE FINANCIAL STATEMENTS Year ended 31 December 2018
26
3. SUMMARY OF SIGNIFICANT ACCOUNTING POLICIES (CONTINU ED) j. Employee compensation plans (continued)
i) Equity-settled share-based compensation plans (continued)
The Company pays Morgan Stanley in consideration of the procurement of the transfer of shares to employees via a chargeback agreement under which it is committed to pay to Morgan Stanley the grant date fair value as well as subsequent movements in the fair value of those awards at the time of delivery to the employees.
Share-based compensation expense is recorded within ‘Staff costs’ and ‘Directors’ remuneration’ in ‘Other expenses’ in the income statement.
ii) Deferred cash-based compensation plans
Morgan Stanley also maintains deferred compensation plans on behalf of the Company for the benefit of certain current and former employees that provide a return to the participating employees based upon the performance of various referenced investments. Liabilities for these awards, which are included within ‘Trade and other payables’ in the statement of financial position, are measured based on the notional value of the award granted, adjusted for changes in the fair value of the referenced investments fair value and recognised over time in accordance with the awards’ vesting conditions. For unvested awards, the expense is recognised over the service period. For vested awards with only notional earnings on the referenced investments, the expense is fully recognised in the current period.
For year end awards anticipated to be granted to retirement-eligible employees under award terms that do not contain a future service requirement, the Company accrued the estimated cost over the course of the calendar year preceding the grant date, which reflects the period over which the compensation is earned.
The related expense is recorded within ‘Staff costs’ and ‘Directors’ remuneration’ in ‘Other expense’ in the income statement.
k. Post-employment benefits
The Company operates defined contribution post-employment plans. Additionally, the Branch of the Company participates in a defined contribution plan, the Singapore Central Provident Fund.
Contributions due in relation to the Company’s defined contribution post-employment plan are recognised in ‘Other expense’ in the income statement when payable.
Details of the plans are given in note 31 to these financial statements.
l. Offsetting of financial assets and financial liabilities
Where there is a currently legally enforceable right to set off the recognised amounts and an intention to either settle on a net basis or to realise the asset and the liability simultaneously, financial assets and financial liabilities are offset and the net amount is presented on the statement of financial position. In the absence of such conditions, financial assets and financial liabilities are presented on a gross basis.

MORGAN STANLEY ASIA INTERNATIONAL LIMITED NOTES TO THE FINANCIAL STATEMENTS Year ended 31 December 2018
27
As discussed at note 2, the Company adopted two new standards from 1 January 2018, HKFRS 9 and HKFRS 15, which have no impact to retained earnings at the date of adoption.
HKFRS 9
The disclosures below set out the impact of adopting HKFRS 9 on the statement of financial position, including the effect of replacing HKAS 39’s incurred credit loss models with the ECL framework under HKFRS 9.
The following table shows the original measurement categories in accordance with HKAS 39 and the new measurement categories under HKFRS 9 for the Company’s financial assets and financial liabilities as at 1 January 2018 in accordance with the Company’s updated accounting policies on the classification and impairment of financial instruments under HKFRS 9 as set out in note 3.
Note
Original classification under HKAS 39
New classification under HKFRS 9
Original carrying amount
under HKAS 39
New carrying amount under
HKFRS 9
Financial assets US$’000 US$’000
Cash and short-
term deposits Loans and
receivables Financial assets at amortised cost
188,267 188,267
Trading financial
assets FVPL FVPL (trading) 2,813 2,813
Loans and
advances to customers
a Loans and receivables
Financial assets at amortised cost
1,430,416 1,430,416
Investment
securities b Available-for-
sale Financial assets measured at FVOCI
2,410,435
2,410,435
Trade and other receivables
Loans and receivables
Financial assets at amortised cost
18,781 18,781
Total financial
assets 4,050,712 4,050,712
4. TRANSITION TO HKFRS 9 AND HKFRS 15
MORGAN STANLEY ASIA INTERNATIONAL LIMITED NOTES TO THE FINANCIAL STATEMENTS Year ended 31 December 2018
28
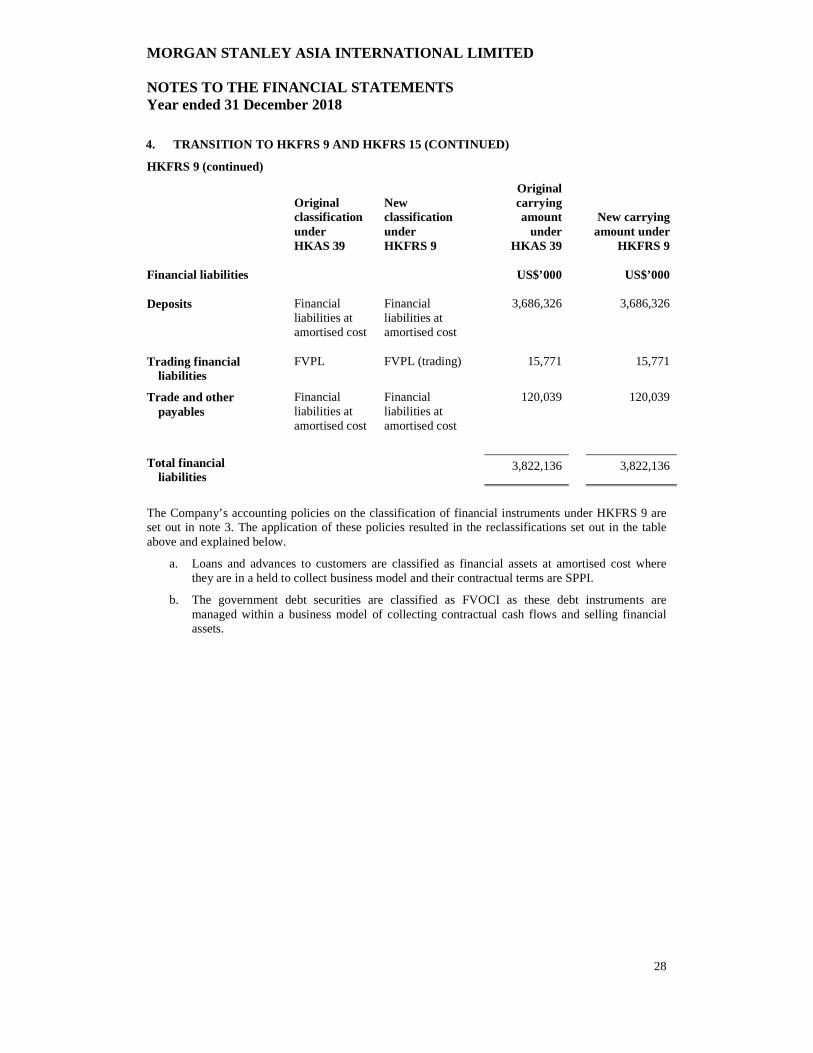
HKFRS 9 (continued)
Original classification under HKAS 39
New classification under HKFRS 9
Original carrying amount
under HKAS 39
New carrying amount under
HKFRS 9
Financial liabilities US$’000 US$’000
Deposits Financial
liabilities at amortised cost
Financial liabilities at amortised cost
3,686,326 3,686,326
Trading financial
liabilities FVPL FVPL (trading) 15,771 15,771
Trade and other
payables Financial
liabilities at amortised cost
Financial liabilities at amortised cost
120,039 120,039
Total financial
liabilities 3,822,136 3,822,136
The Company’s accounting policies on the classification of financial instruments under HKFRS 9 are set out in note 3. The application of these policies resulted in the reclassifications set out in the table above and explained below.
a. Loans and advances to customers are classified as financial assets at amortised cost where they are in a held to collect business model and their contractual terms are SPPI.
b. The government debt securities are classified as FVOCI as these debt instruments are managed within a business model of collecting contractual cash flows and selling financial assets.
4. TRANSITION TO HKFRS 9 AND HKFRS 15 (CONTINUED)

MORGAN STANLEY ASIA INTERNATIONAL LIMITED NOTES TO THE FINANCIAL STATEMENTS Year ended 31 December 2018
29
HKFRS 9 (continued)
The following table reconciles the carrying amounts under HKAS 39 to the carrying amounts under HKFRS 9 on transition to HKFRS 9 on 1 January 2018 by showing where there has been a presentation reclassification.
HKAS 39
carrying amount 31 December 2017 Reclassification
HKFRS 9 carrying amount
1 January 2018
US$’000 US$’000 US$’000
Financial assets
Amortised cost
Cash and short-term deposits 188,267 - 188,267
Loans and advances to customers 1,430,416 - 1,430,416
Trade and other receivables 18,781 - 18,781
Total amortised cost 1,637,464 - 1,637,464
Available-for-sale
Investment securities:
Opening balance 2,410,435 - 2,410,435
To FVOCI - (2,410,435) (2,410,435)
Total available-for-sale 2,410,435 (2,410,435) -
FVOCI
Investment securities:
Opening balance - - -
From available-for-sale - 2,410,435 2,410,435
Total FVOCI - 2,410,435 2,410,435
FVPL (trading)
Trading financial assets 2,813 - 2,813
Total FVPL (trading) 2,813 - 2,813
4. TRANSITION TO HKFRS 9 AND HKFRS 15 (CONTINUED)
MORGAN STANLEY ASIA INTERNATIONAL LIMITED NOTES TO THE FINANCIAL STATEMENTS Year ended 31 December 2018
30
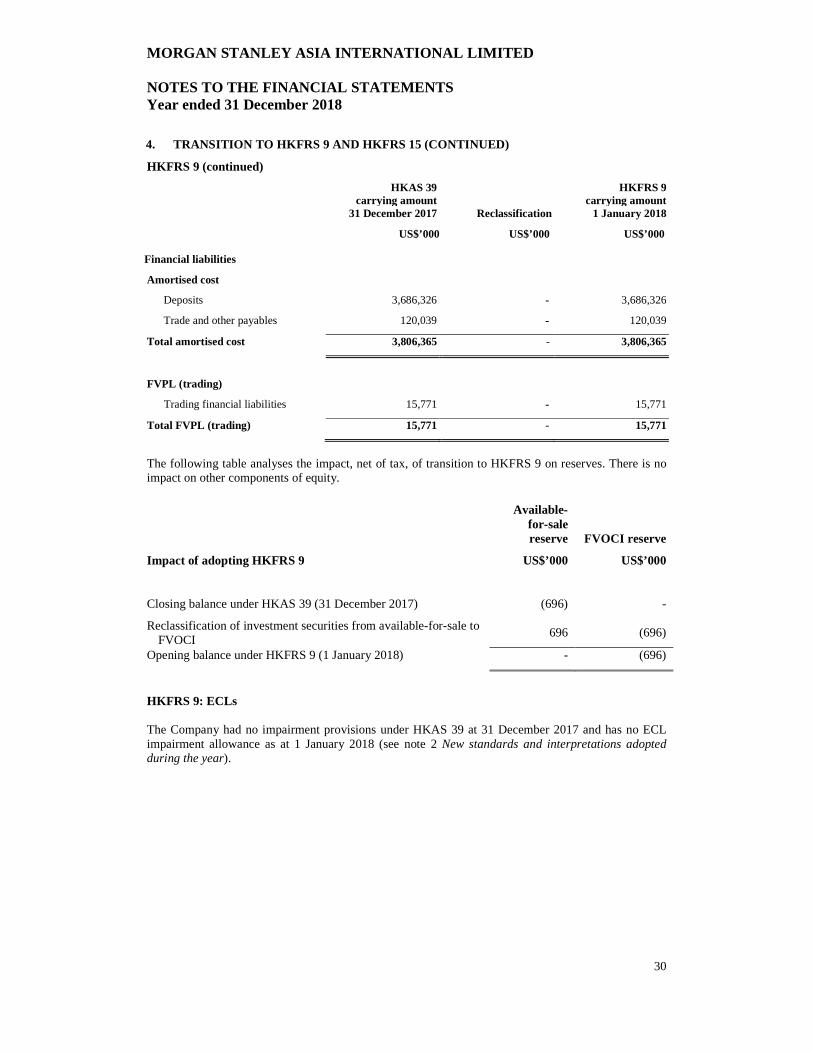
HKFRS 9 (continued)
HKAS 39
carrying amount 31 December 2017 Reclassification
HKFRS 9 carrying amount
1 January 2018
US$’000 US$’000 US$’000
Financial liabilities
Amortised cost
Deposits 3,686,326 - 3,686,326
Trade and other payables 120,039 - 120,039
Total amortised cost 3,806,365 - 3,806,365
FVPL (trading)
Trading financial liabilities 15,771 - 15,771
Total FVPL (trading) 15,771 - 15,771
The following table analyses the impact, net of tax, of transition to HKFRS 9 on reserves. There is no impact on other components of equity.
Available-for-sale reserve FVOCI reserve
Impact of adopting HKFRS 9 US$’000 US$’000
Closing balance under HKAS 39 (31 December 2017) (696) -
Reclassification of investment securities from available-for-sale to FVOCI
696 (696)
Opening balance under HKFRS 9 (1 January 2018) - (696)
HKFRS 9: ECLs The Company had no impairment provisions under HKAS 39 at 31 December 2017 and has no ECL impairment allowance as at 1 January 2018 (see note 2 New standards and interpretations adopted during the year).
4. TRANSITION TO HKFRS 9 AND HKFRS 15 (CONTINUED)

MORGAN STANLEY ASIA INTERNATIONAL LIMITED NOTES TO THE FINANCIAL STATEMENTS Year ended 31 December 2018
31
HKFRS 15
At 1 January 2018, the Company adopted HKFRS 15, in accordance with the transition provisions therein. The Company has applied the provisions of HKFRS 15 retrospectively only to contracts that were not completed as at 1 January 2018, the date of initial application. The Company has not retrospectively restated contracts for modifications before the beginning of the earliest period presented and prior periods have not been restated, which have no impact to retained earnings. As a result of adopting HKFRS 15, the accounting for certain transactions has changed, resulting in certain transactions now being presented on a gross basis. This adoption had the following impact:
Year ended
31 December 2018
US$’000
Increase in other revenue 6,420
Increase in other expenses 6,420
5. NET INCOME FROM OTHER FINANCIAL ASSETS HELD AT FAIR VALUE 2018
US$’000
2017
US$’000 Available-for-sale financial assets
Interest income - 25,696
Foreign exchange revaluation - 110,925
Net fair value losses reclassified from the
available-for-sale reserve on disposal of assets - (338)
- 136,283
6. NET GAINS ON DERECOGNITION OF FINANCIAL ASSETS AT F VOCI The table below summarises the carrying amount of the derecognised financial assets measured at FVOCI and the gain on derecognition.
2018
Carrying amount of
financial assets sold
Gains arising from
derecognition US$’000 US$’000
Investment securities 1,021,581 373
4. TRANSITION TO HKFRS 9 AND HKFRS 15 (CONTINUED)

MORGAN STANLEY ASIA INTERNATIONAL LIMITED NOTES TO THE FINANCIAL STATEMENTS Year ended 31 December 2018
32
7. FEE AND COMMISSION INCOME 2018 2017 US$’000 US$’000 Sales commissions and fees 245,378 214,520 Other fees 10 15 245,388 214,535
Of which, revenue from contracts with customers 16,980
N/A
Revenue from contracts with customers
‘Revenue from contracts with customers’ was introduced by HKFRS 15, for which comparative periods have not been restated. The equivalent figure for 2017 of US$3,983,000 is presented within ‘Fee and commission income’.
Performance obligations
The following table presents revenues in the current year. The Company had no unsatisfied performance obligations from contracts with customers with original expected durations exceeding 1 year as at 31 December 2018.
Current contract revenues
2018
US$’000
Commission income 16,970
Other revenue from contracts with customers 10
Total revenue from contracts with customers 16,980

MORGAN STANLEY ASIA INTERNATIONAL LIMITED NOTES TO THE FINANCIAL STATEMENTS Year ended 31 December 2018
33
8. OTHER REVENUE 2018 2017 US$’000 US$’000 Net foreign exchange gains - 1,408 Management charges to other Morgan Stanley Group undertakings
6,420 1,889
Others 83 132 12, 6,503 3,429 9. INTEREST INCOME AND INTEREST EXPENSE No other gains or losses have been recognised in respect of financial assets measured at amortised cost other than as disclosed as ‘Interest income’ and foreign exchange differences disclosed in ‘Other expenses’ (note 10).
No other gains or losses have been recognised in respect of financial liabilities measured at amortised cost other than as disclosed as ‘Interest expense’, and foreign exchange differences disclosed in ‘Other expenses’ (note 10).
The table below presents interest income and expense by accounting classification. Interest income and expense is calculated using the effective interest method for financial assets and financial liabilities measured at amortised cost and financial assets measured at FVOCI.
2018 2017
US$’000 US$’000
Financial assets measured at amortised cost 40,652 - Financial assets measured at FVOCI 35,100 - Loans and receivables - 26,488 Total interest income 75,752 26,488
Financial liabilities measured at amortised cost (23,517) (33,570)
Total interest expense (23,517) (33,570)
Net interest income/(expense) 52,235 (7,082)
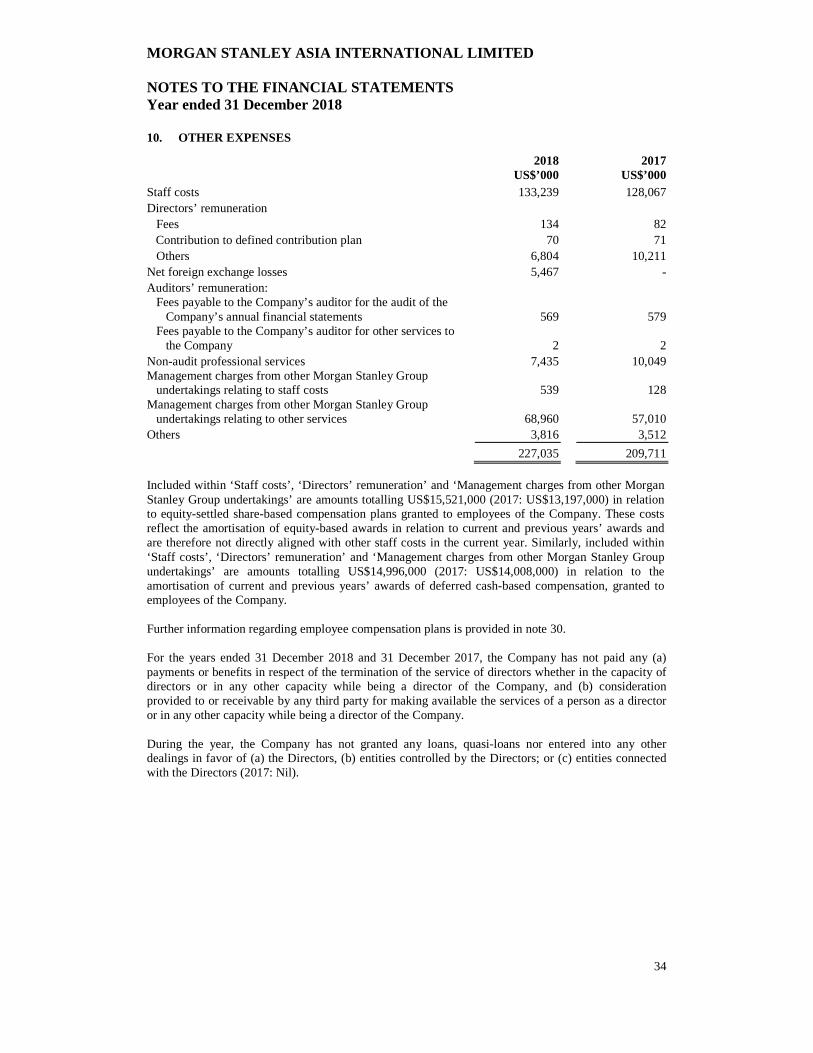
MORGAN STANLEY ASIA INTERNATIONAL LIMITED NOTES TO THE FINANCIAL STATEMENTS Year ended 31 December 2018
34
10. OTHER EXPENSES
2018 2017 US$’000 US$’000 Staff costs 133,239 128,067 Directors’ remuneration Fees 134 82
Contribution to defined contribution plan 70 71 Others 6,804 10,211 Net foreign exchange losses 5,467 - Auditors’ remuneration: Fees payable to the Company’s auditor for the audit of the Company’s annual financial statements
569 579
Fees payable to the Company’s auditor for other services to the Company
2 2
Non-audit professional services 7,435 10,049 Management charges from other Morgan Stanley Group undertakings relating to staff costs
539 128
Management charges from other Morgan Stanley Group undertakings relating to other services
68,960 57,010
Others 3,816 3,512 227,035 209,711
Included within ‘Staff costs’, ‘Directors’ remuneration’ and ‘Management charges from other Morgan Stanley Group undertakings’ are amounts totalling US$15,521,000 (2017: US$13,197,000) in relation to equity-settled share-based compensation plans granted to employees of the Company. These costs reflect the amortisation of equity-based awards in relation to current and previous years’ awards and are therefore not directly aligned with other staff costs in the current year. Similarly, included within ‘Staff costs’, ‘Directors’ remuneration’ and ‘Management charges from other Morgan Stanley Group undertakings’ are amounts totalling US$14,996,000 (2017: US$14,008,000) in relation to the amortisation of current and previous years’ awards of deferred cash-based compensation, granted to employees of the Company. Further information regarding employee compensation plans is provided in note 30. For the years ended 31 December 2018 and 31 December 2017, the Company has not paid any (a) payments or benefits in respect of the termination of the service of directors whether in the capacity of directors or in any other capacity while being a director of the Company, and (b) consideration provided to or receivable by any third party for making available the services of a person as a director or in any other capacity while being a director of the Company. During the year, the Company has not granted any loans, quasi-loans nor entered into any other dealings in favor of (a) the Directors, (b) entities controlled by the Directors; or (c) entities connected with the Directors (2017: Nil).

MORGAN STANLEY ASIA INTERNATIONAL LIMITED NOTES TO THE FINANCIAL STATEMENTS Year ended 31 December 2018
35
11. INCOME TAX 2018 2017 US$’000 US$’000 Current tax Current year Hong Kong 9,210 4,638 Other jurisdiction 1,959 742
11,169 5,380 Adjustments in respect of prior years Hong Kong 44 (43) Other jurisdiction 21 (50) 65 (93) 11,234 5,287 Deferred tax Origination and reversal of temporary differences 2,101 (951)Adjustments in respect of prior years 8 (21) 2,109 (972)
Income tax 13,343 4,315
Reconciliation of effective tax rate
The current year income tax expense is lower (2017: lower) than that resulting from applying the standard rate of profits tax in Hong Kong for the year of 16.5% (2017:16.5%). The main differences are explained below:
2018 2017 US$’000 US$’000 Profit before income tax 87,616 29,361 Income tax using the standard rate of profits tax in Hong Kong of 16.5%
14,457 4,845
Impact on tax of: Expenses not deductible for tax purposes 1,583 1,834 Recognition of previously unrecognised tax losses - (44) Tax exempt income (2,010) (1,823) Concessionary tax rate (794) (450) Effect of tax rates in foreign jurisdiction 85 47 Tax under/(over) provided in prior years 73 (70) Withholding tax expensed 10 6 Other (61) (30) Total income tax in the income statement 13,343 4,315
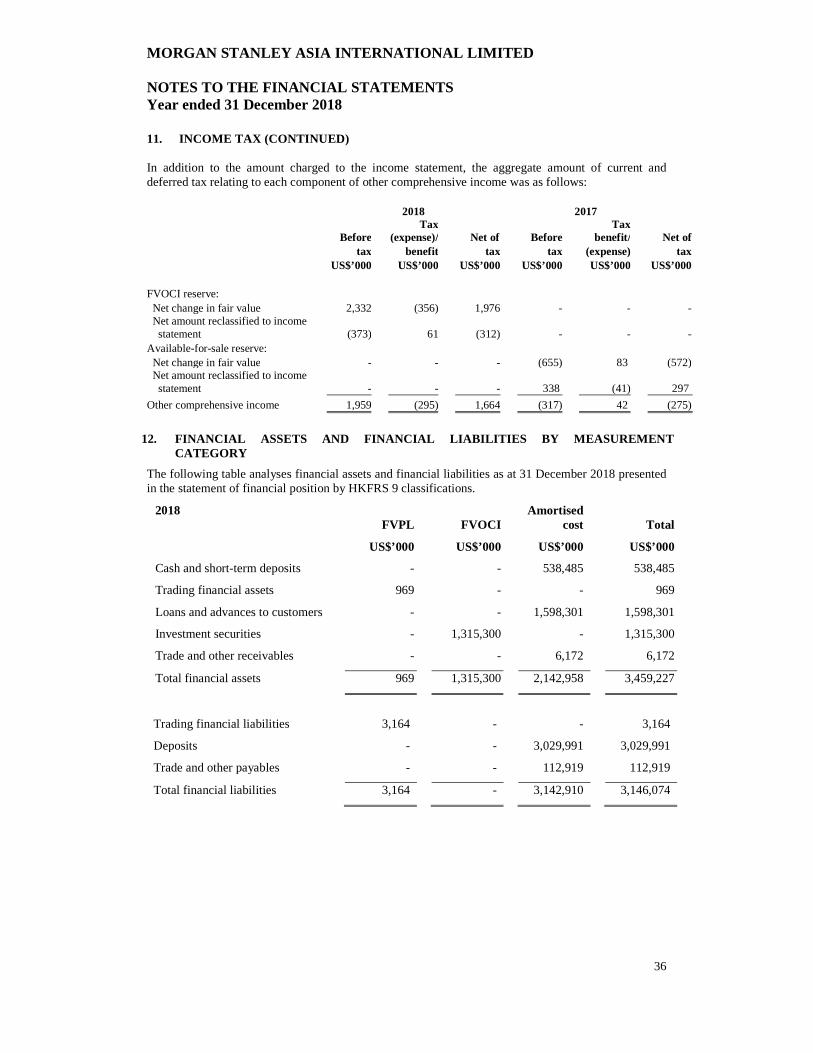
MORGAN STANLEY ASIA INTERNATIONAL LIMITED NOTES TO THE FINANCIAL STATEMENTS Year ended 31 December 2018
36
In addition to the amount charged to the income statement, the aggregate amount of current and deferred tax relating to each component of other comprehensive income was as follows:
2018 2017
Before
Tax(expense)/ Net of Before
Taxbenefit/ Net of
tax benefit tax tax (expense) tax US$’000 US$’000 US$’000 US$’000 US$’000 US$’000 FVOCI reserve: Net change in fair value 2,332 (356) 1,976 - - - Net amount reclassified to income statement (373) 61 (312) - - - Available-for-sale reserve: Net change in fair value - - - (655) 83 (572) Net amount reclassified to income statement - - - 338 (41) 297 Other comprehensive income 1,959 (295) 1,664 (317) 42 (275)
12. FINANCIAL ASSETS AND FINANCIAL LIABILITIES BY MEASU REMENT CATEGORY
The following table analyses financial assets and financial liabilities as at 31 December 2018 presented in the statement of financial position by HKFRS 9 classifications.
2018 FVPL
FVOCI
Amortised cost
Total
US$’000 US$’000 US$’000 US$’000
Cash and short-term deposits - - 538,485 538,485
Trading financial assets 969 - - 969
Loans and advances to customers - - 1,598,301 1,598,301
Investment securities - 1,315,300 - 1,315,300
Trade and other receivables - - 6,172 6,172
Total financial assets 969 1,315,300 2,142,958 3,459,227
Trading financial liabilities 3,164 - - 3,164
Deposits - - 3,029,991 3,029,991
Trade and other payables - - 112,919 112,919
Total financial liabilities 3,164 - 3,142,910 3,146,074
11. INCOME TAX (CONTINUED)
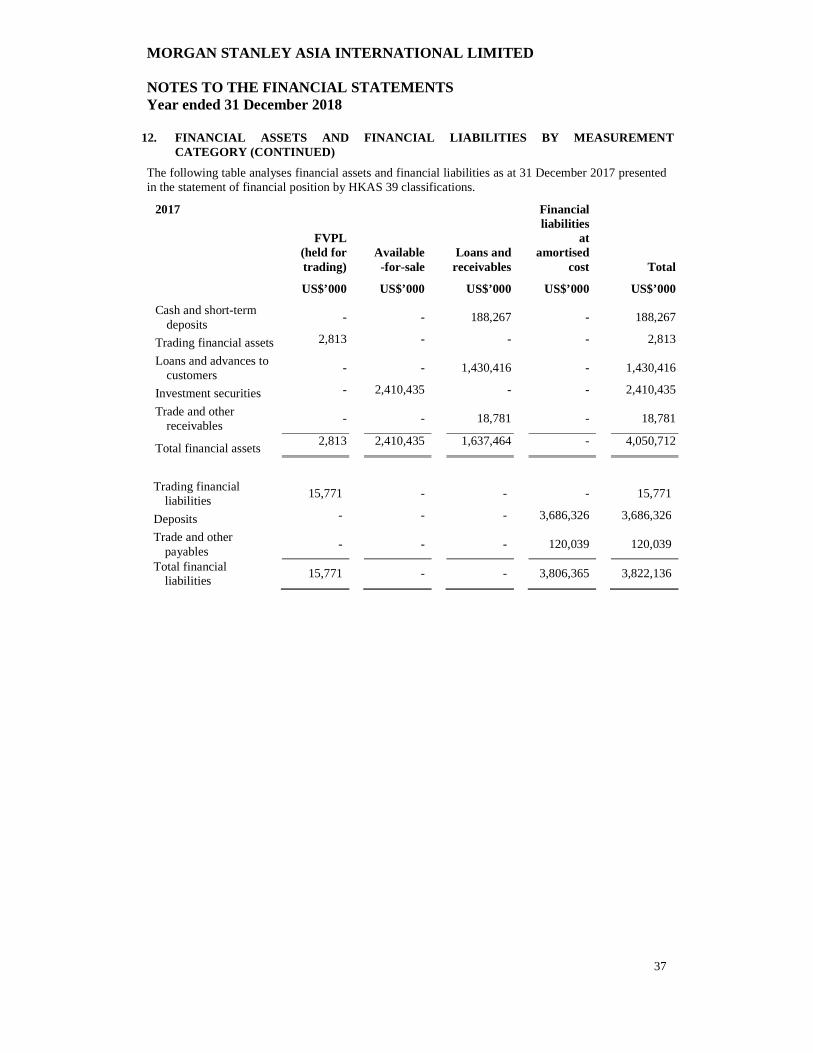
MORGAN STANLEY ASIA INTERNATIONAL LIMITED NOTES TO THE FINANCIAL STATEMENTS Year ended 31 December 2018
37
12. FINANCIAL ASSETS AND FINANCIAL LIABILITIES BY MEASU REMENT CATEGORY (CONTINUED)
The following table analyses financial assets and financial liabilities as at 31 December 2017 presented in the statement of financial position by HKAS 39 classifications.
2017
FVPL (held for trading)
Available-for-sale
Loans and receivables
Financial liabilities
at amortised
cost
Total
US$’000 US$’000 US$’000 US$’000 US$’000
Cash and short-term deposits
- - 188,267 - 188,267
Trading financial assets 2,813 - - - 2,813
Loans and advances to customers
- - 1,430,416 - 1,430,416
Investment securities - 2,410,435 - - 2,410,435
Trade and other receivables
- - 18,781 - 18,781
Total financial assets 2,813 2,410,435 1,637,464 - 4,050,712
Trading financial liabilities
15,771 - - - 15,771
Deposits - - - 3,686,326 3,686,326
Trade and other payables
- - - 120,039 120,039
Total financial liabilities
15,771 - - 3,806,365 3,822,136
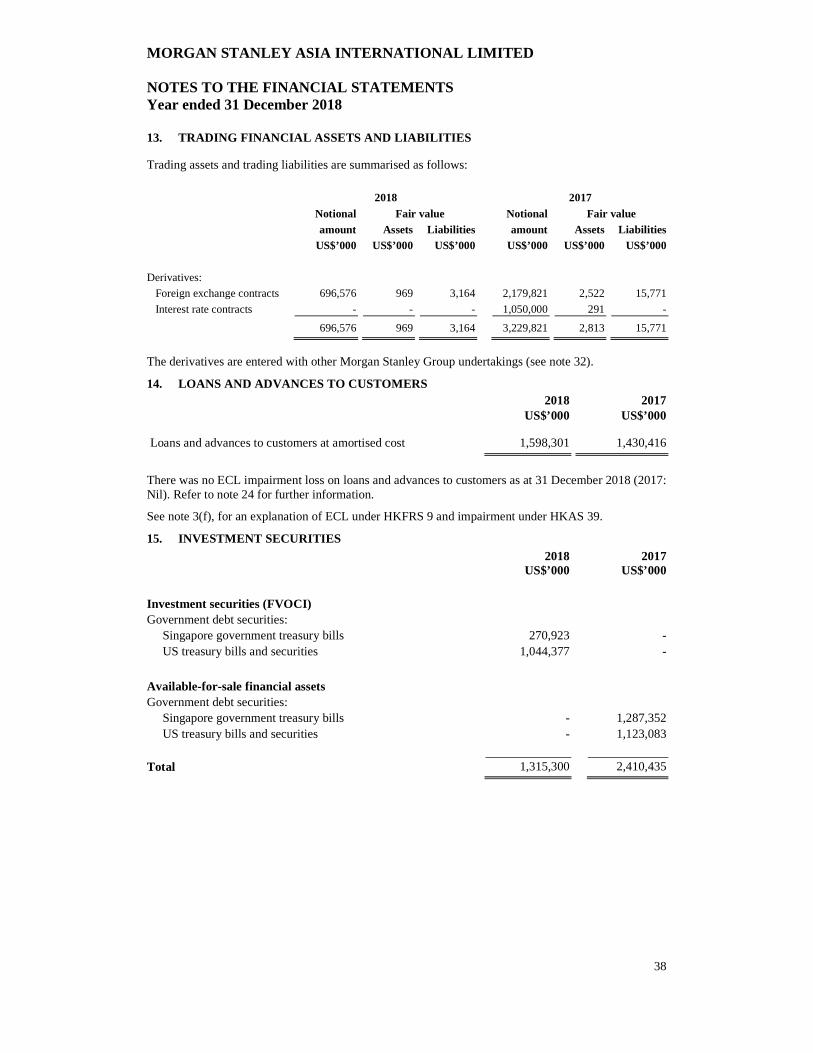
MORGAN STANLEY ASIA INTERNATIONAL LIMITED NOTES TO THE FINANCIAL STATEMENTS Year ended 31 December 2018
38
13. TRADING FINANCIAL ASSETS AND LIABILITIES Trading assets and trading liabilities are summarised as follows: 2018 2017 Notional Fair value Notional Fair value
amount Assets Liabilities amount Assets Liabilities
US$’000 US$’000 US$’000 US$’000 US$’000 US$’000
Derivatives:
Foreign exchange contracts 696,576 969 3,164 2,179,821 2,522 15,771
Interest rate contracts - - - 1,050,000 291 - 696,576 969 3,164 3,229,821 2,813 15,771 The derivatives are entered with other Morgan Stanley Group undertakings (see note 32).
14. LOANS AND ADVANCES TO CUSTOMERS 2018 2017 US$’000 US$’000 Loans and advances to customers at amortised cost 1,598,301 1,430,416 There was no ECL impairment loss on loans and advances to customers as at 31 December 2018 (2017: Nil). Refer to note 24 for further information.
See note 3(f), for an explanation of ECL under HKFRS 9 and impairment under HKAS 39.
15. INVESTMENT SECURITIES 2018 2017 US$’000 US$’000 Investment securities (FVOCI) Government debt securities: Singapore government treasury bills 270,923 - US treasury bills and securities 1,044,377 - Available-for-sale financial assets Government debt securities: Singapore government treasury bills - 1,287,352 US treasury bills and securities - 1,123,083 Total 1,315,300 2,410,435

MORGAN STANLEY ASIA INTERNATIONAL LIMITED NOTES TO THE FINANCIAL STATEMENTS Year ended 31 December 2018
39
16. TRADE AND OTHER RECEIVABLES 2018 2017 US$’000 US$’000 Trade and other receivables Trade receivables 1,735 15,314 Other receivables Amounts due from other Morgan Stanley Group undertakings 39 633 Interest receivable 4,362 2,743 Other amounts receivable 36 91 6,172 18,781 17. TRADE AND OTHER PAYABLES 2018 2017 US$’000 US$’000 Trade and other payables Trade payables 17,047 254 Other payables Amounts due to other Morgan Stanley Group undertakings 12,039 13,520 Staff compensation and benefits accruals 74,577 81,502 Funds-in-transit - 20,000 Interest payable 5,589 1,160 Other amounts payable 3,667 3,603 112,919 120,039 18. DEPOSITS 2018 2017 US$’000 US$’000 Deposits of banks Current account balances 1,202 1,734 Deposits of non-bank customers Current account balances 2,484,966 2,644,840 Term deposits 543,823 254,478 Deposits of other Morgan Stanley Group undertakings - 785,274 3,029,991 3,686,326 19. DEFERRED TAX ASSETS Deferred taxes are calculated on all temporary differences under the liability method. The movement in the deferred tax account is as follows: Deferred tax asset 2018 2017 US$’000 US$’000 At 1 January 6,452 5,406 Amount recognised in the income statement (2,109) 972 Amount recognised in other comprehensive income: Financial assets measured at FVOCI (295) - Available-for-sale financial assets - 42 Foreign exchange revaluation (25) 32 5, At 31 December 4,023 6,452

MORGAN STANLEY ASIA INTERNATIONAL LIMITED NOTES TO THE FINANCIAL STATEMENTS Year ended 31 December 2018
40
The deferred tax included in the statement of financial position and changes recorded in ‘Income tax’/‘Other comprehensive income’ are as follows: 2018 2017 Deferred Other Deferred Other Tax Income Comprehensive tax Income Comprehensive Asset statement Income asset statement Income US$’000 US$’000 US$’000 US$’000 US$’000 US$’000
Deferred compensation 2,779 (2,109) - 6,355 1,585 - Financial assets measured at
FVOCI 1,244 - (295) - - - Available-for-sale financial
assets - - - 97 - 42
Tax losses utilised - - - - (613) - 4,023 (2,109) (295) 6,452 972 42
The deferred tax assets recognised are based on management assessment that it is probable that the Company will have taxable profits against which the temporary differences can be utilised. 20. COMMITMENTS AND CONTINGENCIES
At 31 December 2018, there were no commitments and contingencies (2017: Nil).
21. EQUITY
Ordinary share capital
Ordinary
shares
Ordinary
shares Number US$’000 Issued and fully paid At 1 January 2017, 31 December 2017 and 31 December 2018 170,000,000 170,000 The holders of ordinary shares are entitled to receive dividends as declared from time to time and are entitled to one vote per share at general meetings of the Company. All shares rank equally with regard to the Company’s residual assets.
Reserves FVOCI reserve
The ‘FVOCI reserve’ of US$968,000 (2017: US$nil) includes the cumulative net change in the fair value of FVOCI financial assets held at the reporting date. The tax effect of these movements is also included in the ‘FVOCI reserve’.
Available-for-sale reserve
The ‘Available-for-sale reserve’ of US$nil (2017: US$696,000) includes the cumulative net change in the fair value of available-for-sale financial assets held at the reporting date. The tax effect of these movements is also included in the ‘Available-for-sale reserve’.
19. DEFERRED TAX ASSETS (CONTINUED)
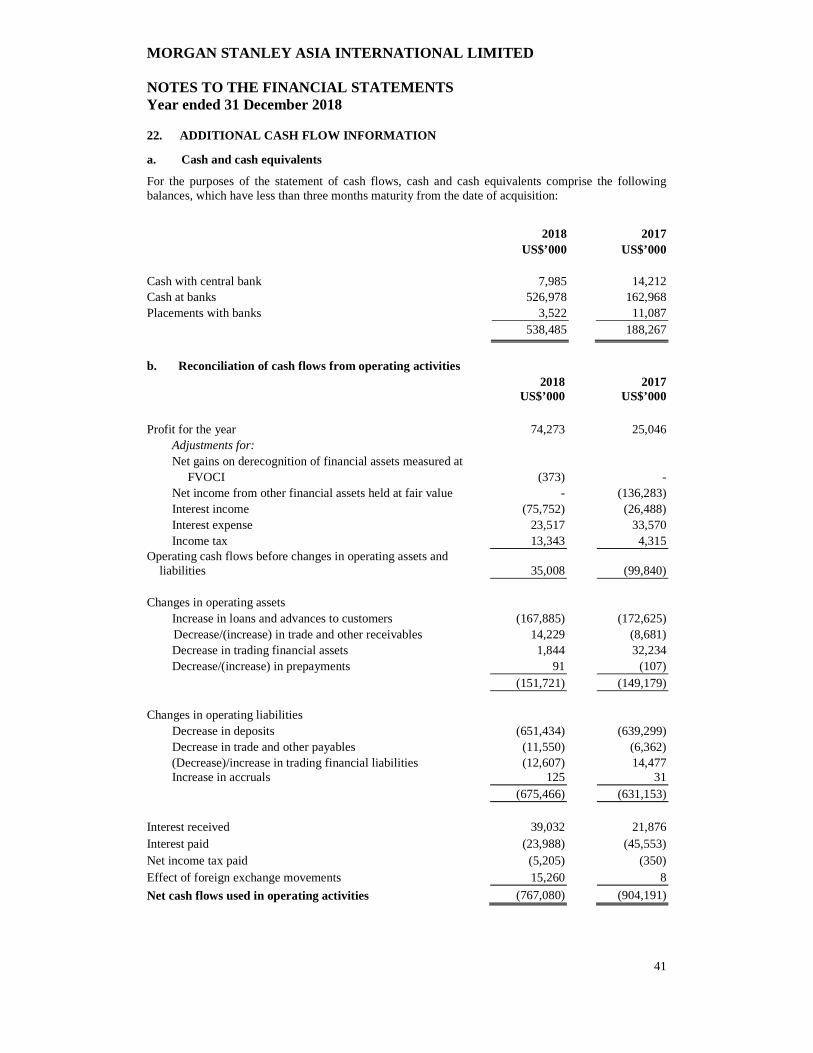
MORGAN STANLEY ASIA INTERNATIONAL LIMITED NOTES TO THE FINANCIAL STATEMENTS Year ended 31 December 2018
41
a. Cash and cash equivalents
For the purposes of the statement of cash flows, cash and cash equivalents comprise the following balances, which have less than three months maturity from the date of acquisition:
2018 2017 US$’000 US$’000 Cash with central bank 7,985 14,212 Cash at banks 526,978 162,968 Placements with banks 3,522 11,087 538,485 188,267 b. Reconciliation of cash flows from operating activities 2018 2017 US$’000 US$’000 Profit for the year 74,273 25,046 Adjustments for: Net gains on derecognition of financial assets measured at FVOCI (373) - Net income from other financial assets held at fair value - (136,283) Interest income (75,752) (26,488) Interest expense 23,517 33,570 Income tax 13,343 4,315 Operating cash flows before changes in operating assets and liabilities 35,008 (99,840) Changes in operating assets Increase in loans and advances to customers (167,885) (172,625)
Decrease/(increase) in trade and other receivables 14,229 (8,681) Decrease in trading financial assets 1,844 32,234 Decrease/(increase) in prepayments 91 (107) (151,721) (149,179) Changes in operating liabilities Decrease in deposits (651,434) (639,299) Decrease in trade and other payables (11,550) (6,362) (Decrease)/increase in trading financial liabilities (12,607) 14,477 Increase in accruals 125 31 (675,466) (631,153) Interest received 39,032 21,876 Interest paid (23,988) (45,553) Net income tax paid (5,205) (350) Effect of foreign exchange movements 15,260 8
Net cash flows used in operating activities (767,080) (904,191)
22. ADDITIONAL CASH FLOW INFORMATION

MORGAN STANLEY ASIA INTERNATIONAL LIMITED NOTES TO THE FINANCIAL STATEMENTS Year ended 31 December 2018
42
23. EXPECTED MATURITY OF ASSETS AND LIABILITIES The table below shows an analysis of assets and liabilities analysed according to when they are expected to be recovered, realised or settled.
At 31 December 2018
Less than or equal
More than
to twelve twelve months months Total US$’000 US$’000 US$’000 ASSETS
Cash and short-term deposits 538,485 - 538,485 Trading financial assets 969 - 969 Loans and advances to customers 1,598,301 - 1,598,301 Investment securities 720,304 594,996 1,315,300 Trade and other receivables 6,172 - 6,172 Deferred tax assets - 4,023 4,023 Prepayments 124 - 124 2,864,355 599,019 3,463,374 LIABILITIES Trading financial liabilities 3,164 - 3,164 Deposits 3,029,991 - 3,029,991 Trade and other payables 96,462 16,457 112,919 Current tax liabilities 7,662 - 7,662 Accruals 733 - 733 3,138,012 16,457 3,154,469 At 31 December 2017 Less than or equal More than to twelve twelve months months Total US$’000 US$’000 US$’000 ASSETS
Cash and short-term deposits 188,267 - 188,267 Trading financial assets 2,813 - 2,813 Loans and advances to customers 1,430,416 - 1,430,416 Investment securities 2,410,435 - 2,410,435 Trade and other receivables 18,781 - 18,781 Deferred tax assets - 6,452 6,452 Prepayments 215 - 215 4,050,927 6,452 4,057,379 LIABILITIES Trading financial liabilities 15,771 - 15,771 Deposits 3,686,326 - 3,686,326 Trade and other payables 94,458 25,581 120,039 Current tax liabilities 1,667 - 1,667 Accruals 608 - 608 3,798,830 25,581 3,824,411

MORGAN STANLEY ASIA INTERNATIONAL LIMITED NOTES TO THE FINANCIAL STATEMENTS Year ended 31 December 2018
43
24. FINANCIAL RISK MANAGEMENT Risk management procedures
Risk is an inherent part of the Morgan Stanley Group’s and the Company’s business activities. The Company seeks to identify, assess, monitor, and manage each of the various types of risk involved in its business activities in accordance with defined policies and procedures. The Company has developed its own risk management policy framework, which is consistent with and leverages the risk management policies and procedures of the Morgan Stanley Group and which includes escalation to appropriate senior management personnel of the Company as well as oversight through the Company’s Board of Directors (the “Board”) and through a dedicated Risk Committee that reports to the Board.
Significant risks faced by the Company resulting from its private wealth management and financing activities are set out below.
Credit risk
Credit risk refers to the risk of loss arising when a borrower, counterparty or issuer does not meet its financial obligations to the Company. The Company incurs credit risk primarily from margin loans to clients of the Wealth Management business segment, and to a lesser extent from Treasury activities related to deposit placement, investment portfolio and interest rate and foreign exchange hedges.
Credit risk management
Credit risk exposure is managed on a global basis and in consideration of each significant legal entity within the Morgan Stanley Group. The credit risk management policies and procedures establish the framework for identifying, measuring, monitoring and controlling credit risk whilst ensuring transparency of material credit risks, compliance with established limits and escalating risk concentrations to appropriate senior management and the Board of Directors.
The Company incurs credit risk primarily in the Wealth Management business through margin loans to its clients. Margin loans are asset-based in nature secured by mostly cash and marketable securities held with the Company as collateral.
The Company also incurs credit risk through a variety of treasury activities, including, but not limited to, the following:
• entering into derivative contracts with other Morgan Stanley Group undertakings under which counterparties may have obligations to make payments to the Company;
• posting margin and/or collateral to banks and other financial counterparties;
• placing funds on deposit at other financial institutions; and
• entering into securities transactions, whereby the value of these assets may fluctuate based on realised or expected defaults on the underlying obligations.
Monitoring and Control
In order to help protect the Company from losses, the Credit Risk Management Department establishes firm-wide practices to evaluate, monitor and control credit risk at the transaction, obligor and portfolio levels. The Credit Risk Management Department approves extensions of credit, evaluates the creditworthiness of the Company’s counterparties and borrowers on a regular basis, and helps ensure that credit exposure is actively monitored and managed. The evaluation of counterparties and borrowers includes an assessment of the probability that an obligor will default on its financial obligations and any subsequent losses that may occur when an obligor defaults. In addition, credit risk exposure is actively managed by credit professionals and committees within the Credit Risk Management Department and through various risk committees, whose membership includes individuals from the Credit Risk Management Department.
MORGAN STANLEY ASIA INTERNATIONAL LIMITED NOTES TO THE FINANCIAL STATEMENTS Year ended 31 December 2018
44
24. FINANCIAL RISK MANAGEMENT (CONTINUED) Credit risk management (continued)
Monitoring and Control (continued)
A Credit Limits Framework is utilised to manage credit risk levels across the Company. The Credit Limits Framework is calibrated within the Company’s risk appetite and includes stress loss, product, collateral concentration, correlated collateral, single-name, regulatory and connected lending limits. The Credit Risk Management Department helps ensure timely and transparent communication of material credit risks, compliance with established limits and escalation of risk concentrations to appropriate senior management. The Credit Risk Management Department also works closely with the Market Risk Department and applicable business units to monitor risk exposures and to perform stress tests to identify, analyse and control credit risk concentrations arising from the Company’s lending and treasury activities. The stress tests shock market factors (e.g. interest rates, security prices, credit spreads) and risk parameters (e.g. default probabilities), in order to assess the impact of stresses on exposures, profit and loss, and the Company’s capital position. Stress tests are conducted in accordance with established policies and procedures of Morgan Stanley Group and the Company and comply with methodologies outlined in the Basel regulatory framework.
Credit Evaluation
The evaluation of corporate and institutional counterparties and borrowers includes assigning obligor credit ratings, which reflect an assessment of an obligor’s PD and LGD. An obligor credit rating can be categorised into Investment grade, Non-investment grade and Default. Credit evaluations typically involve the assessment of financial statements, leverage, liquidity, capital strength, asset composition and quality, market capitalisation, access to capital markets, the adequacy of collateral, if applicable, and in the case of certain loans, cash flow projections and debt service requirements. The Credit Risk Management Department also evaluates strategy, market position, industry dynamics, management and other factors that could affect the obligor’s risk profile. Additionally, the Credit Risk Management Department evaluates the relative position of the Morgan Stanley Group’s exposure in the borrower’s capital structure and relative recovery prospects, as well as adequacy of collateral (if applicable) and other structural elements of the particular transaction.
The Company’s Wealth Management business segment generates minimal credit exposure given the collateralised nature of the business, as such the credit evaluation focuses on the counterparties’ and borrowers’ background and collateral evaluation, to ensure the exposures are well-collateralised and credit risk is mitigated.
In addition to assessing and monitoring its credit exposure and risk at the individual obligor level, the Company also reviews its credit exposure and risk to geographic regions. As at 31 December 2018 and 31 December 2017, credit exposure was concentrated in North American and Asian countries. In addition, the Company pays particular attention to smaller exposures in emerging markets given their unique risk profile. Sovereign ceiling ratings are derived using methodologies generally consistent with those employed by external rating agencies.
The Company also reviews its credit exposure and risk to certain types of customers. At 31 December 2018 and 31 December 2017, the Company’s material credit exposure was to sovereigns, sovereign related entities, corporate entities, financial institutions and individuals.

MORGAN STANLEY ASIA INTERNATIONAL LIMITED NOTES TO THE FINANCIAL STATEMENTS Year ended 31 December 2018
45
24. FINANCIAL RISK MANAGEMENT (CONTINUED)
Credit risk management (continued)
Risk Mitigation
The Credit Risk Management Department may seek to mitigate credit risk from its lending and treasury activities in multiple ways, including collateral provisions and hedges.
In connection with the Company’s Wealth Management business, the Company relies on the use of collateral to manage credit risk. The amount and type of collateral required by the Company depends on an assessment of the credit risk of the obligor. Collateral held is managed in accordance with the Company’s guidelines and the relevant underlying agreements. Collateral is primarily publicly traded debt and equity securities, as well as a small amount of other collateral including unlisted securities, notes, mutual funds and insurance policies that fulfill the risk management requirement of being valuable and realisable at short notice.
In connection with the Company’s derivatives activities with other Morgan Stanley Group undertakings, the Company generally enters into master netting agreements and collateral arrangements with counterparties. These agreements provide the Company with the ability to demand collateral, as well as to liquidate collateral and offset receivables and payables covered under the same master agreement in the event of a counterparty default.
In connection with securities purchased under agreements to resell transactions, the Company manages credit exposure arising from such transactions by, in appropriate circumstances, entering into Global Master Repurchase Agreements with counterparties that provide the Company, in the event of a counterparty default, with the right to net a counterparty’s rights and obligations under such agreement and liquidate and set off collateral held by the Company against the net amount owed by the counterparty. Under these securities purchased under agreements to resell transactions, the Company receives collateral, including US government securities. The Company also monitors the fair value of the underlying securities as compared with the related receivable or payable, including accrued interest, and, as necessary, requests additional collateral to ensure such transactions are adequately collateralised. As at 31 December 2018 and 31 December 2017, there were no outstanding securities purchased under agreements to resell transactions.
Exposure to credit risk
The maximum exposure to credit risk (“gross credit exposure”) of the Company as at 31 December 2018 and 31 December 2017 is disclosed below, based on the carrying amounts of the financial assets the Company believes are subject to credit risk. Within the table financial instruments subject to accounting ECL are distinguished from those that are not. Those financial instruments that bear credit risk but are not subject to ECL are subsequently measured at fair value. Where the Company enters into credit enhancements, including receiving cash and security as collateral and master netting agreements, to manage the credit exposure on these financial instruments the financial effect of the credit enhancements is also disclosed below. The net credit exposure represents the credit exposure remaining after the effect of the credit enhancements.
The Company does not have any significant exposure arising from items not recognised on the statement of financial position.
Collateral and other credit enhancements
The Company employs a range of policies and practices to mitigate credit risk, the most common being acceptance of collateral for funds advanced. The main types of collateral held are cash and marketable securities. The Company has internal policies on the acceptability of specific classes of collateral or credit risk mitigation.
The market value of securities received as collateral is monitored on a daily basis and securities received as collateral generally are not recognised on the statement of financial position. The Company monitors the creditworthiness of counterparties on an ongoing basis and requests additional collateral in accordance with collateral arrangements when deemed necessary.

MORGAN STANLEY ASIA INTERNATIONAL LIMITED NOTES TO THE FINANCIAL STATEMENTS Year ended 31 December 2018
46
24. FINANCIAL RISK MANAGEMENT (CONTINUED)
Collateral and other credit enhancements (continued)
At 31 December 2018, the carrying amount of financial assets on which no ECL were recognised because of collateral held was US$1,598,301,000.
The Company closely monitors collateral held for financial assets considered to be credit-impaired, as in such cases it is considered more likely that the Company will take possession of collateral to mitigate potential credit losses.
The Company does not hold financial assets considered to be credit-impaired.
Exposure to credit risk by product 2018 Gross Net credit Credit credit exposure(¹) enhancements exposure US$’000 US$’000 US$’000 Subject to ECL: Cash and short-term deposits 538,485 - 538,485 Loans and advances to customers(3) 1,598,301 (1,598,301) - Investment securities 1,315,300 - 1,315,300 Trade and other receivables(2) 6,172 - 6,172 Not subject to ECL(4): Trading financial assets Derivatives 969 (969) - 3,459,227 (1,599,270) 1,859,957
Maximum exposure to credit risk for 2017 is presented as follows, reflecting the statement of financial position categories used in 2017:
2017 Gross Net credit Credit credit exposure(¹) enhancements exposure US$’000 US$’000 US$’000
Cash and short-term deposits 188,267 - 188,267 Trading financial assets 2,813 (243) 2,570 Loans and advances to customers(3) 1,430,416 (1,430,416) - Investment securities 2,410,435 - 2,410,435 Trade and other receivables(2) 18,781 - 18,781
4,050,712 (1,430,659) 2,620,053
(1) The carrying amount recognised in the statement of financial position best represents the Company's maximum exposure to credit risk.
(2) Trade and other receivables include cash collateral pledged against the payable on OTC derivative positions. These derivative liabilities are included within trading financial liabilities in the statement of financial position.
(3) The collateral held as security for loan and advances to customers consists of cash of US$379,894,000 (2017: US$358,105,000), securities of US$714,488,000 (2017: US$647,222,000) and other collateral of US$503,919,000 (2017: US$425,089,000).
(4) Financial assets measured at FVPL are not subject to ECL.

MORGAN STANLEY ASIA INTERNATIONAL LIMITED NOTES TO THE FINANCIAL STATEMENTS Year ended 31 December 2018
47
24. FINANCIAL RISK MANAGEMENT (CONTINUED)
Expected credit loss measurement
Assessment of significant increase in credit risk
As explained in note 3(f), in order to assess whether an instrument is subject to a 12 month ECL or to a lifetime ECL, and therefore its appropriate staging, the Company determines whether there has been a SICR for the instrument since initial recognition.
When making this assessment, the Company considers both quantitative and qualitative information and analysis based on the Company’s historical experience and expert credit risk assessment, including forward-looking information.
The PD is derived from internal credit rating grades (based on available information about the borrower) and multiple forward-looking macroeconomic scenarios which are probability weighted. Credit risk is considered to have increased significantly if the PD has significantly increased at the reporting date relative to the PD of the facility, at the date of initial recognition. The assessment of whether a change in PD is “significant” is based both on a consideration of the relative change in PD and on qualitative indicators of the credit risk of the facility, which indicate whether a loan is performing or in difficulty. In addition, as a backstop, the Company considers that SICR has occurred in all cases when an asset is more than 30 DPD.
Calculation of ECL
ECLs are calculated using three main components:
• PD: for accounting purposes, the 12 month and lifetime PD represent the expected point-in-time probability of a default over the next 12 months and over the remaining lifetime of the financial instrument respectively, based on conditions existing at the balance sheet date and future economic conditions.
• LGD: the LGD represents expected loss conditional on default, taking into account the mitigating effect of collateral, including the expected value of the collateral when realised and the time value of money.
• EAD: this represents the expected EAD, taking into account the expected repayment of principal and interest from the balance sheet date to the default event together with any expected drawdowns of the facility over that period.
These parameters are generally derived from internally developed statistical models, incorporating historical, current and forward-looking macro-economic data.
The 12 month ECL is equal to the sum over the next 12 months of quarterly PD multiplied by LGD and EAD, with such expected losses being discounted at the EIR. Lifetime ECL is calculated using the discounted present value of total quarterly PDs multiplied by LGD and EAD, over the full remaining life of the facility.
Incorporation of forward looking information
The Company uses internal macro-economic research and country risk expert judgement to support the calculation of ECL. The macro-economic scenarios are reviewed quarterly.
There have been no changes made to estimation techniques or significant assumptions for estimating impairment, during the year.

MORGAN STANLEY ASIA INTERNATIONAL LIMITED NOTES TO THE FINANCIAL STATEMENTS Year ended 31 December 2018
48
24. FINANCIAL RISK MANAGEMENT (CONTINUED)
Exposure to credit risk by internal rating grades
Internal credit ratings are derived using methodologies generally consistent with those used by external agencies.
Recognised financial instruments subject to ECL
The following table provides an analysis of the credit risk exposure by ECL stage per class of recognised financial instrument subject to ECL, based on the following internal credit rating grades:
Investment grade: internal grades AAA - BBB
Non-investment grade: internal grades BB - CCC
Default: internal grades D
31 December 2018 ECL staging Stage 1 Stage 2 12-month Lifetime ECL ECL Total US$’000 US$’000 US$’000 Cash and short-term
deposits:
Credit grade Investment grade 538,485 - 538,485 Gross carrying amount and
carrying amount
538,485 - 538,485
Loans and advances to customers(1):
Credit grade Investment grade - 45,500 45,500
Non-investment grade - 1,530,209 1,530,209
Unrated - 22,592 22,592 Gross carrying amount and
carrying amount
- 1,598,301 1,598,301
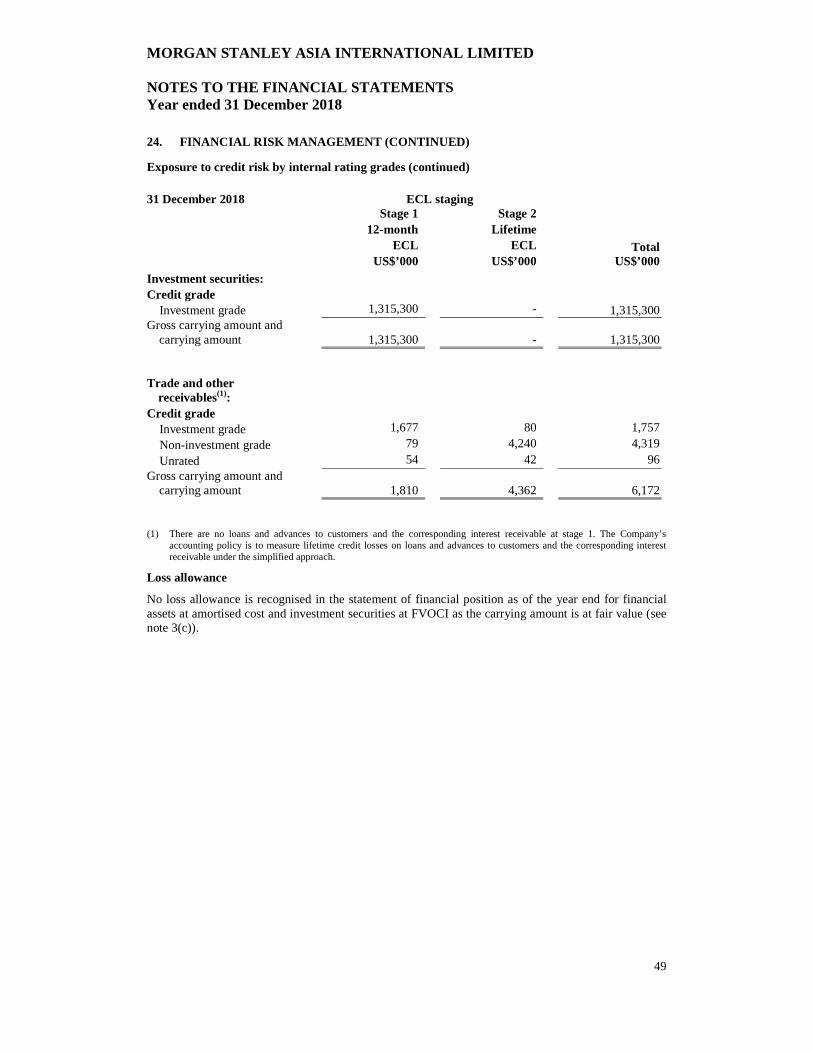
MORGAN STANLEY ASIA INTERNATIONAL LIMITED NOTES TO THE FINANCIAL STATEMENTS Year ended 31 December 2018
49
24. FINANCIAL RISK MANAGEMENT (CONTINUED)
Exposure to credit risk by internal rating grades (continued)
(1) There are no loans and advances to customers and the corresponding interest receivable at stage 1. The Company’s accounting policy is to measure lifetime credit losses on loans and advances to customers and the corresponding interest receivable under the simplified approach.
Loss allowance
No loss allowance is recognised in the statement of financial position as of the year end for financial assets at amortised cost and investment securities at FVOCI as the carrying amount is at fair value (see note 3(c)).
31 December 2018 ECL staging Stage 1 Stage 2 12-month Lifetime ECL ECL Total US$’000 US$’000 US$’000 Investment securities: Credit grade Investment grade 1,315,300 - 1,315,300 Gross carrying amount and
carrying amount
1,315,300 - 1,315,300
Trade and other receivables(1):
Credit grade Investment grade 1,677 80 1,757
Non-investment grade 79 4,240 4,319
Unrated 54 42 96 Gross carrying amount and
carrying amount
1,810 4,362 6,172

MORGAN STANLEY ASIA INTERNATIONAL LIMITED NOTES TO THE FINANCIAL STATEMENTS Year ended 31 December 2018
50
24. FINANCIAL RISK MANAGEMENT (CONTINUED)
Liquidity risk
Liquidity risk refers to the risk that the Company will be unable to finance its operations due to a loss of access to the capital markets or difficulty in liquidating its assets. Liquidity risk encompasses the Company’s ability (or perceived ability) to meet its financial obligations without experiencing significant business disruption or reputational damage that may threaten the Company’s viability as a going concern. Liquidity risk also encompasses the associated funding risks triggered by the market or idiosyncratic stress events that may cause unexpected changes in funding needs or an inability to raise new funding. Generally, the Company incurs liquidity risk as a result of its trading, lending, investing and client facilitation activities.
The Morgan Stanley Group’s Liquidity Risk Management Framework is critical to helping ensure that the Company maintains sufficient liquidity reserves and durable funding sources to meet its daily obligations and to withstand unanticipated stress events. The Liquidity Risk Department is a distinct area in Risk Management, which oversees and monitors liquidity risk. The Liquidity Risk Department ensures transparency of material liquidity risks, compliance with established risk limits and escalation of risk concentrations to appropriate senior management. To execute these responsibilities, the Liquidity Risk Department:
• Establishes limits in line with the Morgan Stanley Group’s risk appetite;
• Identifies and analyses emerging liquidity risks to ensure such risks are appropriately mitigated;
• Monitors and reports risk exposures against metrics and limits; and
• Reviews the methodologies and assumptions underpinning the Morgan Stanley Group’s Liquidity Stress Tests to ensure sufficient liquidity under a range of adverse scenarios.
The liquidity risks identified by these processes are summarised in reports produced by the Liquidity Risk Department that are circulated to and discussed with the Company’s Asset & Liability Committee (“ALCO”) and regional ALCO and risk committees, as appropriate.
The Treasury Department and applicable business units have primary responsibility for evaluating, monitoring and controlling the liquidity risks arising from the Morgan Stanley Group’s business activities, and for maintaining processes and controls to manage the key risks inherent in their respective areas. The Liquidity Risk Department coordinates with the Treasury Department and these business units to help ensure a consistent and comprehensive framework for managing liquidity risk across the Morgan Stanley Group.
The Company’s liquidity risk management policies and procedures are consistent with those of the Morgan Stanley Group. The Board of Directors of the Company is ultimately responsible for establishing the liquidity risk tolerance and ensuring the Company’s liquidity risk is appropriately managed. In addition to the internal liquidity risk management framework, the Company is locally subject to the liquidity regulations prescribed by the HKMA. The Company has daily monitoring and reporting processes in place to ensure compliance with its regulatory requirements.
The primary goal of the Company’s liquidity risk and funding management framework is to ensure that the Company has access to adequate funding across a wide range of market conditions and time horizons. The framework is designed to enable the Company to fulfil its financial obligations and support the execution of its business strategies.
The following principles guide the Company’s liquidity risk management framework:
• Sufficient liquid assets should be maintained to cover maturing liabilities and other planned and contingent outflows;
• Maturity profile of assets and liabilities should be aligned, with limited reliance on short-term funding;
• Source, counterparty, currency, region, and term of funding should be diversified; and
• Liquidity Stress Tests should anticipate, and account for, periods of limited access to funding.

MORGAN STANLEY ASIA INTERNATIONAL LIMITED NOTES TO THE FINANCIAL STATEMENTS Year ended 31 December 2018
51
24. FINANCIAL RISK MANAGEMENT (CONTINUED)
Liquidity risk (continued)
The core components of the Company’s liquidity risk management framework, are the Required Liquidity Framework, Liquidity Stress Tests and the Liquidity Reserve (as defined below), which support its target liquidity profile.
Required Liquidity Framework
The Required Liquidity Framework establishes the amount of liquidity the Company must hold in both normal and stressed environments to ensure that its financial condition and overall soundness is not adversely affected by an inability (or perceived inability) to meet its financial obligations in a timely manner. The Required Liquidity Framework considers the most constraining liquidity requirement to satisfy all regulatory and internal limits at a Morgan Stanley Group and legal entity level.
Liquidity Stress Tests
The Company uses Liquidity Stress Tests to model external and intercompany liquidity flows across multiple scenarios and a range of time horizons. These scenarios contain various combinations of idiosyncratic and systemic stress events of different severity and duration. The methodology, implementation, production and analysis of the Company’s Liquidity Stress Tests are important components of the Required Liquidity Framework.
Liquidity Stress Tests are produced for the Company, to capture specific cash requirements and cash availability. The Liquidity Stress Tests assume that a legal entity will use its own liquidity first to fund its obligations before drawing liquidity from its ultimate parent undertaking, Morgan Stanley. Morgan Stanley will support its subsidiaries and will not have access to subsidiaries’ liquidity reserves that are subject to any regulatory, legal or tax constraints. In addition to the assumptions underpinning the Liquidity Stress Tests, the Company takes into consideration the settlement risk related to intra-day settlement and clearing of securities and financing activities.
At 31 December 2018 and 31 December 2017, the Company maintained sufficient liquidity to meet current and contingent funding obligations as modelled in its Liquidity Stress Tests.
Liquidity Reserve
The Company maintains sufficient liquidity reserves (“Liquidity Reserve”) to meet regulatory requirements, cover daily funding needs and to meet strategic liquidity targets sized by the Required Liquidity Framework and Liquidity Stress Tests. The size of the Liquidity Reserve is actively managed by the Company considering the following components: unsecured debt maturity profile; balance sheet size and composition; funding needs in a stressed environment inclusive of contingent cash outflows; regulatory requirements; and collateral requirements. In addition, the Company’s Liquidity Reserve includes a discretionary surplus based on the Company’s risk tolerance and is subject to change depending on market and firm-specific events.
The Company holds its own Liquidity Reserve which is composed of diversified cash and cash equivalents and unencumbered highly liquid securities.
MORGAN STANLEY ASIA INTERNATIONAL LIMITED NOTES TO THE FINANCIAL STATEMENTS Year ended 31 December 2018
52
24. FINANCIAL RISK MANAGEMENT (CONTINUED)
Liquidity risk (continued)
Eligible unencumbered highly liquid securities include primarily non-US government securities in addition to US government securities.
Funding Management
The Company manages its funding in a manner that reduces the risk of disruption to the Company’s operations. The Company pursues a strategy of diversification of secured and unsecured funding sources (by product, investor and region) and attempts to ensure that the tenor of its liabilities equals or exceeds the expected holding period of the assets being financed.
The Company funds itself through diverse sources. These sources may include the Company’s equity capital, borrowings and deposits.
Balance sheet management
In managing both the Morgan Stanley Group’s and the Company’s liquidity risk the composition and size of the entire balance sheet, not just financial liabilities, is monitored and evaluated. A substantial portion of the Morgan Stanley Group’s total assets consists of liquid marketable securities and short-term receivables arising principally from sales and trading activities in the Institutional Securities business. The liquid nature of these assets provides the Morgan Stanley Group and the Company with flexibility in managing the composition and size of its balance sheet.
Maturity analysis
In the following maturity analysis of financial assets and financial liabilities, derivatives contracts measured at fair value are presented at fair value, consistent with how these financial assets and liabilities are managed, and disclosed as on demand. Investment securities measured at fair value which are not held as part of the Company’s trading activities are disclosed according to their earliest contractual maturity; all such amounts are presented at their fair value, consistent with how these financial assets are managed. All other amounts represent undiscounted cash flows receivable and payable by the Company arising from its financial assets and financial liabilities to earliest contractual maturities as at 31 December 2018 and 31 December 2017. Receipts of financial assets and repayments of financial liabilities that are subject to immediate notice are treated as if notice were given immediately and are classified as on demand. This presentation is considered by the Company to appropriately reflect the liquidity risk arising from those financial assets and financial liabilities, presented in a way that is consistent with how the liquidity risk on these financial assets and financial liabilities is managed by the Company.
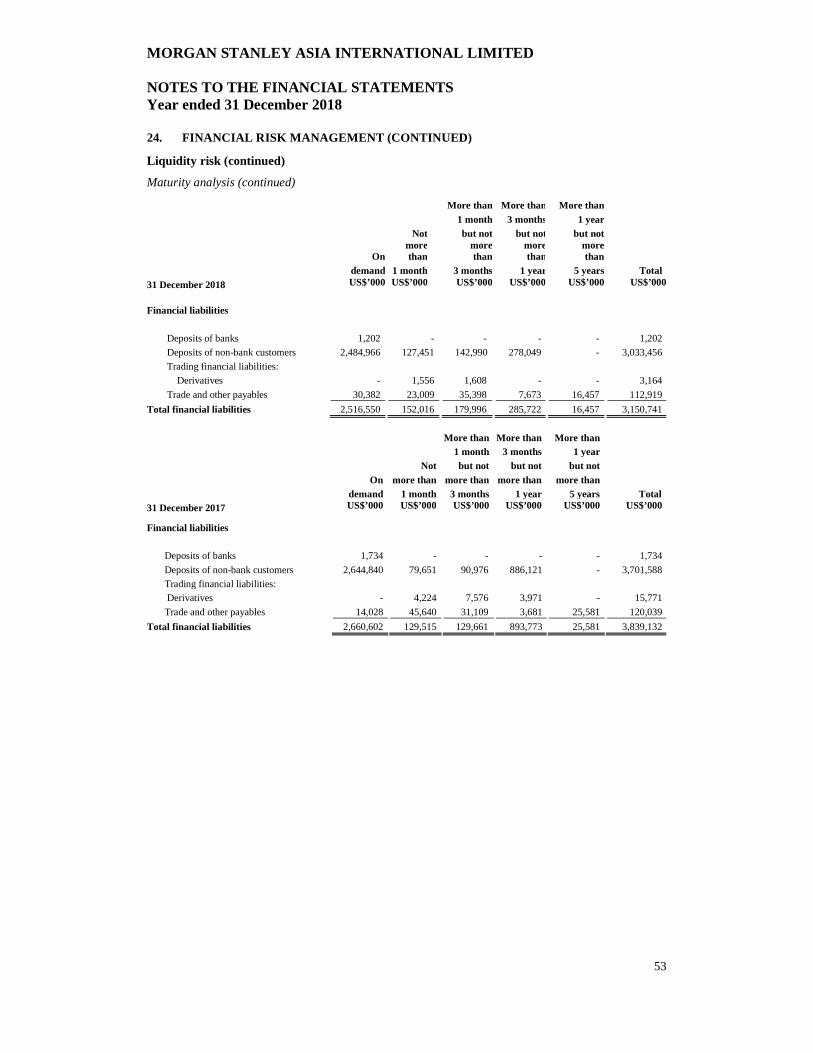
MORGAN STANLEY ASIA INTERNATIONAL LIMITED NOTES TO THE FINANCIAL STATEMENTS Year ended 31 December 2018
53
24. FINANCIAL RISK MANAGEMENT (CONTINUED)
Liquidity risk (continued)
Maturity analysis (continued)
More than More than More than
1 month 3 months 1 year
Not but not but not but not
Onmorethan
more than
more than
more than
demand 1 month 3 months 1 year 5 years Total 31 December 2018 US$’000 US$’000 US$’000 US$’000 US$’000 US$’000 Financial liabilities
Deposits of banks 1,202 - - - - 1,202
Deposits of non-bank customers 2,484,966 127,451 142,990 278,049 - 3,033,456
Trading financial liabilities:
Derivatives - 1,556 1,608 - - 3,164
Trade and other payables 30,382 23,009 35,398 7,673 16,457 112,919
Total financial liabilities 2,516,550 152,016 179,996 285,722 16,457 3,150,741
More than More than More than 1 month 3 months 1 year Not but not but not but not On more than more than more than more than demand 1 month 3 months 1 year 5 years Total 31 December 2017 US$’000 US$’000 US$’000 US$’000 US$’000 US$’000 Financial liabilities
Deposits of banks 1,734 - - - - 1,734
Deposits of non-bank customers 2,644,840 79,651 90,976 886,121 - 3,701,588
Trading financial liabilities: Derivatives - 4,224 7,576 3,971 - 15,771
Trade and other payables 14,028 45,640 31,109 3,681 25,581 120,039
Total financial liabilities 2,660,602 129,515 129,661 893,773 25,581 3,839,132

MORGAN STANLEY ASIA INTERNATIONAL LIMITED NOTES TO THE FINANCIAL STATEMENTS Year ended 31 December 2018
54
24. FINANCIAL RISK MANAGEMENT (CONTINUED)
Market Risk
Market risk is defined by HKFRS 7 ‘Financial Instruments: Disclosures’ as the risk that the fair value or future cash flows of a financial instrument will fluctuate because of changes in market prices.
The Company manages the market risk associated with its assets and liabilities management activities at both division and an individual product level, and includes consideration of market risk at the legal entity level.
Sound market risk management is an integral part of the Company’s culture. The Company is responsible for ensuring that market risk exposures are well-managed and monitored. The Company also ensures transparency of material market risks, monitors compliance with established limits, and escalates risk concentrations to appropriate senior management.
To execute these responsibilities, the Morgan Stanley Group monitors the market risk of the firm against limits on aggregate risk exposures, performs a variety of risk analyses including monitoring Value-at-risk (“VaR”) and stress testing analyses, routinely reports risk summaries and maintains the VaR and scenario analysis methodologies. The Company is managed within the Morgan Stanley Group’s global framework. The market risk management policies and procedures of the Company include performing risk analyses and reporting material risks identified to appropriate senior management of the Company.
The Company is exposed to the following types of market risk under this definition: interest rate risk and currency risk.
Interest rate risk
Interest rate risk is defined by HKFRS 7 as the risk that the fair value or future cash flows of a financial instrument will fluctuate because of changes in market interest rates. The Company is primarily exposed to interest rate risk under this definition as a result of changes in the future cash flows of deposits and loans, bank balance, changes in the fair value of fixed rate debt investments categorised as FVOCI, and the interest rate swap hedges.
The application of a parallel shift in market interest rates of 50 basis points increase or decrease to these positions, would result in a net gain or loss of approximately US$2,487,000 (2017: US$3,093,000).

MORGAN STANLEY ASIA INTERNATIONAL LIMITED NOTES TO THE FINANCIAL STATEMENTS Year ended 31 December 2018
55
24. FINANCIAL RISK MANAGEMENT (CONTINUED)
Market Risk (continued)
Currency risk
The Company has foreign currency exposure arising from its assets and liabilities in currencies other than US dollars, which it actively manages by hedging with other Morgan Stanley Group undertakings.
The analysis below details the material foreign currency exposure for the Company, by foreign currency. The analysis calculates the impact on total comprehensive income of a reasonably possible parallel shift of the foreign currency in relation to the US dollar, with all other variables held constant.
2018 2017
Sensitivity to applied percentage change in
currency (+/-)
Sensitivity to applied percentage change in
currency (+/-)
Foreign currency exposure
Percentage change applied
Profit or loss
Other comprehensive
income
Foreign currency exposure
Percentage change applied
Profit or loss
Other comprehensive
income US$’000 % US$’000 US$’000 US$’000 % US$’000 US$’000
Hong Kong Dollar (10,557) 1 106 - (7,344) 1 73 -
Singapore Dollar (2,268) 8 181 - (1,702) 8 101 35
Yuan Renminbi (221) 6 13 - (274) 6 16 - (13,046) (9,320)
The reasonably possible percentage change in the currency rate in relation to US dollars has been calculated based on the greatest annual percentage change over the 2-year period from 1 January 2017 to 31 December 2018 (2017: from 1 January 2016 to 31 December 2017). Thus, the percentage change applied may not be the same percentage as the actual change in the currency rate for the year ended 31 December 2018, or for the year ended 31 December 2017.
MORGAN STANLEY ASIA INTERNATIONAL LIMITED NOTES TO THE FINANCIAL STATEMENTS Year ended 31 December 2018
56
25. OPERATIONAL RISK
Operational risk refers to the risk of loss, or of damage to the Company’s reputation, resulting from inadequate or failed processes, people and systems or from external events (e.g. fraud, theft, legal and compliance risks, cyber attacks or damage to physical assets). Operational risk relates to the following risk event categories as defined by Basel Capital Standards: internal fraud; external fraud; employment practices and workplace safety; clients, products and business practices; business disruption and system failure; damage to physical assets; and execution, delivery and process management.
The Company may incur operational risk across the full scope of its business activities, including revenue-generating activities (e.g. private wealth management) and support and control groups (e.g., information technology and trade processing).
The Company has established an operational risk framework to identify, measure, monitor and control risk across the Company. This framework is consistent with the framework established by the Morgan Stanley Group and includes escalation to the Company’s Board of Directors and appropriate senior management personnel. Effective operational risk management is essential to reducing the impact of operational risk incidents and mitigating legal and reputational risks. The framework is continually evolving to account for changes in the Company and to respond to the changing regulatory and business environment. The Company has implemented operational risk data and assessment systems to monitor and analyse internal and external operational risk events, to assess business environment and internal control factors and to perform scenario analysis. The collected data elements are incorporated in the operational risk capital model. The model encompasses both quantitative and qualitative elements. Internal loss data and scenario analysis results are direct inputs to the capital model, while external operational incidents, business environment and internal control factors are evaluated as part of the scenario analysis process.
In addition, the Company employs a variety of risk processes and mitigants to manage its operational risk exposures. These include a strong governance framework, a comprehensive risk management programme and insurance. Operational risks and associated risk exposures are assessed relative to the risk tolerance reviewed and confirmed by the Board and are prioritised accordingly. The breadth and range of operational risk are such that the types of mitigating activities are wide-ranging. Examples of activities include enhancement of defences against cyber attacks; use of legal agreements and contracts to transfer and/or limit operational risk exposures; due diligence; implementation of enhanced policies and procedures; exception management processing controls; and segregation of duties.
Primary responsibility for the management of operational risk is with the business, the control groups and the business managers therein. The business managers maintain processes and controls designed to identify, assess, manage, mitigate and report operational risk. Each of the business segments has a designated operational risk coordinator. The operational risk coordinator regularly reviews operational risk issues and reports to the Company’s senior management within each business. Each control group also has a designated operational risk coordinator and a forum for discussing operational risk matters with the Company’s senior management. Oversight of operational risk is provided by the Operational Risk Oversight Committee, regional risk committees and senior management. In the event of a merger; joint venture; divestiture; reorganisation; or creation of a new legal entity, a new product or a business activity, operational risks are considered, and any necessary changes in processes or controls are implemented.
MORGAN STANLEY ASIA INTERNATIONAL LIMITED NOTES TO THE FINANCIAL STATEMENTS Year ended 31 December 2018
57
25. OPERATIONAL RISK (CONTINUED)
The Operational Risk Department provides oversight of operational risk management and independently assesses measures and monitors operational risk. The Operational Risk Department works with the business divisions and control groups to help ensure a transparent, consistent and comprehensive framework for managing operational risk within each area and across the Company. The Operational Risk Department scope includes oversight of the technology and data risk management programme (e.g., cybersecurity), fraud risk management and prevention programme and a supplier management (vendor risk oversight and assessment) programme. Furthermore, the Operational Risk Department supports the collection and reporting of operational risk incidents and the execution of operational risk assessments; provides the infrastructure needed for risk measurement and risk management; and ensures ongoing validation and verification of the Company’s advanced measurement approach for operational risk capital.
Business Continuity Management is responsible for identifying key risks and threats to the Company’s resiliency and planning to ensure that a recovery strategy and required resources are in place for the resumption of critical business functions following a disaster or other business interruption. Disaster recovery plans are in place for critical facilities and resources, and redundancies are built into the systems as deemed appropriate. The key components of the Company’s Business Continuity Management Programme include: crisis management; business recovery plans; applications/data recovery; work area recovery; and other elements addressing management, analysis, training and testing.
The Company maintains a programme that oversees its cyber and information security risks. The Company’s cybersecurity and information security policies, procedures and technologies are designed to protect the Company’s client and employee data against unauthorised disclosure, modification or misuse and are also designed to address regulatory requirements. These policies and procedures cover a broad range of areas, including: identification of internal and external threats, access control, data security, protective controls, detection of malicious or unauthorised activity, incident response and recovery planning.
In connection with its ongoing operations, the Company utilises the services of external vendors, which it anticipates will continue and may increase in the future. These services include, for example, outsourced processing and support functions and consulting and other professional services. The Company manages its exposures to these services through a variety of means such as the performance of due diligence, consideration of operational risk, implementation of service level and other contractual agreements, and ongoing monitoring of the vendors’ performance. The Company maintains a supplier risk management programme with policies, procedures, organisation, governance and supporting technology that aligns with the risk tolerance and is designed to meet regulatory requirements. The programme includes the adoption of appropriate risk management controls including, but not limited to information security, operational failure, financial stability, disaster recoverability, reputational risk, safeguards against corruption and termination.
MORGAN STANLEY ASIA INTERNATIONAL LIMITED NOTES TO THE FINANCIAL STATEMENTS Year ended 31 December 2018
58
26. FINANCIAL ASSETS AND FINANCIAL LIABILITIES SUBJECT TO OFFSETTING In order to manage credit exposure arising from its business activities, the Company applies various credit risk management policies and procedures, see note 24 for further details. Primarily in connection with derivative transactions, the Company enters into master netting arrangements and collateral arrangements with its counterparties. These agreements provide the Company with the right, in the ordinary course of business and/or in the event of a counterparty default (such as bankruptcy or a counterparty’s failure to pay or perform), to net a counterparty’s rights and obligations under such agreement and, in the event of counterparty default, set off collateral held by the Company against the net amount owed by the counterparty. However, in certain circumstances, the Company may not have such an agreement in place; the relevant insolvency regime (which is based on type of counterparty entity and the jurisdiction of organisation of the counterparty) may not support the enforceability of the agreement; or the Company may not have sought legal advice to support the enforceability of the agreement. In cases where the Company has not determined an agreement to be enforceable, the related amounts are not offset.
The Company’s policy is generally to receive cash and marketable securities posted as collateral. In certain cases the Company may be permitted to post collateral to a third party custodian under a tri-party arrangement that enables the Company to take control of such collateral in the event of a counterparty default.
In the statement of financial position, financial assets and financial liabilities are only offset and presented on a net basis where there is a current legally enforceable right to set off the recognised amounts and an intention to either settle on a net basis or to realise the assets and the liabilities simultaneously. In the absence of such conditions, financial assets and financial liabilities are presented on a gross basis.
The following tables present information about the offsetting of financial instruments and related collateral amounts. The tables do not include information about financial instruments that are subject only to a collateral agreement. The effect of master netting arrangements, collateral agreements and other credit enhancements, on the Company’s exposure to credit risk is disclosed in note 24.

MORGAN STANLEY ASIA INTERNATIONAL LIMITED NOTES TO THE FINANCIAL STATEMENTS Year ended 31 December 2018
59
26. FINANCIAL ASSETS AND FINANCIAL LIABILITIES SUBJECT TO OFFSETTING (CONTINUED)
Amounts not offset in the statement of
financial position(1)(2)
Gross
amounts
Amounts offset in the statement of
financial position
Net amounts presented in
the statement of financial
position Financial
instruments Cash
collateral Net
exposure US$’000 US$’000 US$’000 US$’000 US$’000 US$’000 31 December 2018 Assets Trading financial assets: Derivatives 969 - 969 (969) - - TOTAL 969 - 969 (969) - - Liabilities Trading financial liabilities: Derivatives 3,164 - 3,164 (969) (1,734) 461 TOTAL 3,164 - 3,164 (969) (1,734) 461 31 December 2017 Assets Trading financial assets: Derivatives 2,813 - 2,813 (2,522) (243) 48 TOTAL 2,813 - 2,813 (2,522) (243) 48 Liabilities Trading financial liabilities: Derivatives 15,771 - 15,771 (2,522) (13,249) - TOTAL 15,771 - 15,771 (2,522) (13,249) - (1) Amounts relate to master netting arrangements and collateral arrangements which have been determined by the
Company to be legally enforceable, but do not meet all criteria required for net presentation within the statement of financial position.
(2) The cash collateral is recognised in the statement of financial position within ‘Trade and other receivables’ and ‘Trade and other payables’ respectively.
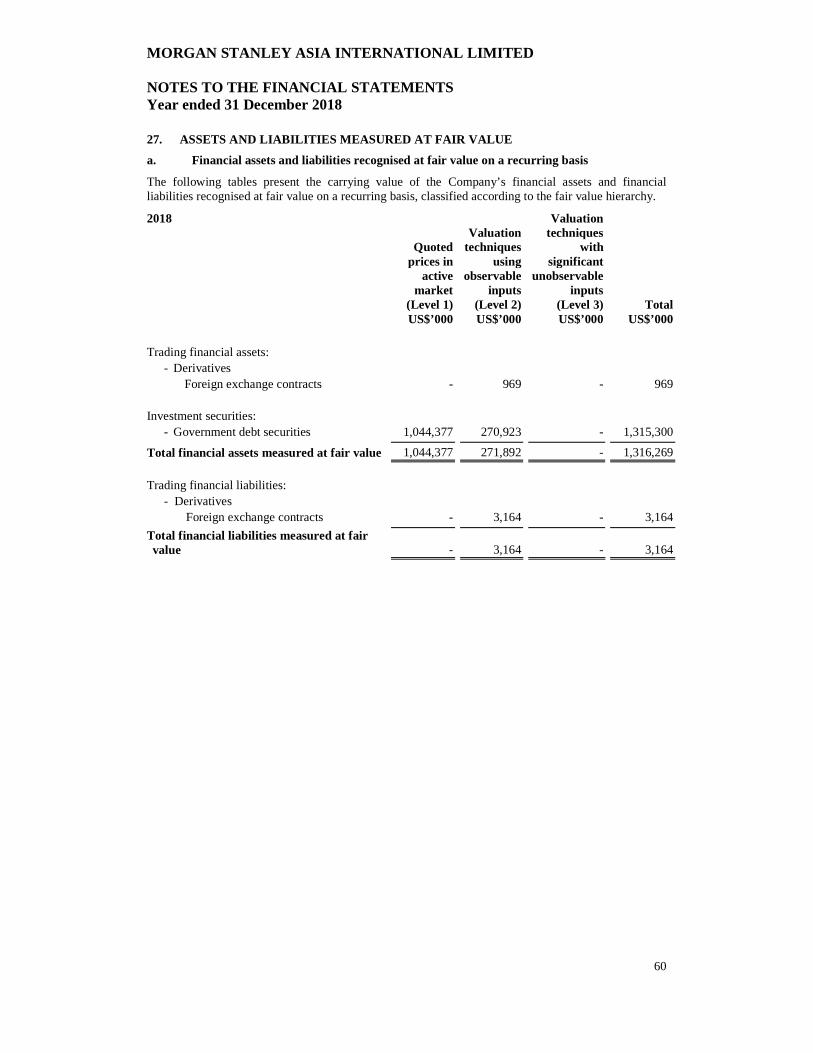
MORGAN STANLEY ASIA INTERNATIONAL LIMITED NOTES TO THE FINANCIAL STATEMENTS Year ended 31 December 2018
60
27. ASSETS AND LIABILITIES MEASURED AT FAIR VALUE a. Financial assets and liabilities recognised at fair value on a recurring basis
The following tables present the carrying value of the Company’s financial assets and financial liabilities recognised at fair value on a recurring basis, classified according to the fair value hierarchy.
2018 Valuation Valuation techniques Quoted techniques with prices in using significant active observable unobservable market inputs inputs (Level 1) (Level 2) (Level 3) Total US$’000 US$’000 US$’000 US$’000 Trading financial assets: - Derivatives Foreign exchange contracts - 969 - 969 Investment securities: - Government debt securities 1,044,377 270,923 - 1,315,300 Total financial assets measured at fair value 1,044,377 271,892 - 1,316,269 Trading financial liabilities: - Derivatives Foreign exchange contracts - 3,164 - 3,164 Total financial liabilities measured at fair value - 3,164 - 3,164

MORGAN STANLEY ASIA INTERNATIONAL LIMITED NOTES TO THE FINANCIAL STATEMENTS Year ended 31 December 2018
61
27. ASSETS AND LIABILITIES MEASURED AT FAIR VALUE (CONT INUED) a. Financial assets and liabilities recognised at fair value on a recurring basis (continued)
2017 Valuation Valuation techniques Quoted techniques with prices in using significant active observable unobservable market inputs inputs (Level 1) (Level 2) (Level 3) Total US$’000 US$’000 US$’000 US$’000
Trading financial assets:
- Derivatives Foreign exchange contracts/ interest rate contracts - 2,813 - 2,813
Investment securities:
- Government debt securities 1,123,083 1,287,352 - 2,410,435 - Total financial assets measured at fair value 1,123,083 1,290,165 - 2,413,248
Trading financial liabilities:
- Derivatives
Foreign exchange contracts - 15,771 - 15,771 Total financial liabilities measured at fair value - 15,771 - 15,771
The Company’s valuation approach and fair value hierarchy categorisation for certain significant classes of financial instruments recognised at fair value on a recurring basis is as follows:
Asset and Liability / Valuation Technique Valuation Hierarchy Classification Government debt securities US treasury securities
• Fair value is determined using quoted market prices.
• Generally Level 1 Non US Government Obligations
• Fair value is determined using quoted prices in active markets when available.
• Generally Level 1 • Level 2 - if the market is less active or
prices are dispersed • Level 3 - in instances where the prices
are unobservable Derivatives OTC derivative contracts (include swap contracts related to interest rates and foreign currencies)
• Depending on the product and the terms of the transaction, the fair value of OTC derivative products can be modeled using a series of techniques, including closed-form analytic formulas, such as the Black-Scholes option-pricing model, simulation models or a combination thereof. Many pricing models do not entail material subjectivity as the methodologies employed do not necessitate significant judgement, since model inputs may be observed from actively quoted markets, as is the case for generic interest rate swaps. In the case of more established derivative products, the pricing models used by the Company are widely accepted by the financial services industry.
• Generally Level 2 - OTC derivative products valued using observable inputs, or where the unobservable input is not deemed significant
• Level 3 - OTC derivative products for which the unobservable input is deemed significant
MORGAN STANLEY ASIA INTERNATIONAL LIMITED NOTES TO THE FINANCIAL STATEMENTS Year ended 31 December 2018
62
27. ASSETS AND LIABILITIES MEASURED AT FAIR VALUE (CONT INUED) b. Transfers between Level 1 and Level 2 of the fair value hierarchy for financial assets and
liabilities recognised at fair value on a recurring basis
There were no transfers between Level 1 and Level 2 of the fair value hierarchy during the current year and prior year.
c. Changes in Level 3 financial assets and liabilities recognised at fair value on a recurring basis
There were no transfers between Level 2 and Level 3 of the fair value hierarchy during the current year and prior year.
d. Assets and liabilities measured at fair value on a non-recurring basis
Non-recurring fair value measurements of assets or liabilities are those which are required or permitted in the statement of financial position in particular circumstances. There were no assets or liabilities measured at fair value on a non-recurring basis during the current year and prior year.
28. ASSETS AND LIABILITIES NOT MEASURED AT FAIR VALUE For all financial instruments not measured at fair value, the carrying amount is considered to be a reasonable approximation of fair value due to the short term nature of these assets and liabilities.
29. CAPITAL MANAGEMENT The Morgan Stanley Group manages its capital on a global basis with consideration for its legal entities. The capital managed by the Morgan Stanley Group broadly includes ordinary share capital, preference share capital, subordinated loans and reserves.
The Morgan Stanley Group actively manages its consolidated capital position based upon, among other things, business opportunities, risks, capital availability and rates of return together with internal capital policies, regulatory requirements and rating agency guidelines and, therefore, in the future may expand or contract its capital base to address the changing needs of its businesses.
The Morgan Stanley Group also aims to adequately capitalise at a legal entity level whilst safeguarding that entity’s ability to continue as a going concern and ensuring that it meets all regulatory capital requirements, so that it can continue to provide returns for the Morgan Stanley Group.
In order to maintain or adjust the capital structure as described above, the Company may adjust the amount of dividends paid, return capital to shareholder, issue new shares, issue subordinated debt or sell assets to reduce debt.
MORGAN STANLEY ASIA INTERNATIONAL LIMITED NOTES TO THE FINANCIAL STATEMENTS Year ended 31 December 2018
63
29. CAPITAL MANAGEMENT (CONTINUED) The Company is regulated by the HKMA and as such is subject to minimum capital requirements. The Company’s capital is monitored on an ongoing basis to ensure compliance with these requirements. At a minimum, the Company must ensure that capital is greater than the capital requirement covering credit, market and operational risk.
The Company complied with all of its regulatory capital requirements during the current and prior year.
The Company manages the following items as capital: 2018 2017 US$’000 US$’000 Ordinary share capital 170,000 170,000 FVOCI reserve 968 - Available-for-sale reserve - (696) Retained earnings 137,937 63,664 308,905 232,968
The Company has earmarked part of its retained earnings for maintaining its regulatory reserve for general banking risks to satisfy the provisions of the Banking Ordinance for prudential supervision purposes. At 31 December 2018, US$17,581,000 (2017: US$7,152,000) in the retained earnings was earmarked for this purpose.
30. EMPLOYEE COMPENSATION PLANS Morgan Stanley maintains various equity-settled share-based and cash-based deferred compensation plans for the benefit of certain current and former employees.
Equity-settled share-based compensation plans
• Restricted stock units
Morgan Stanley has granted RSU awards pursuant to several equity-based compensation plans. The plans provide for the deferral of a portion of certain employees’ incentive compensation with awards made in the form of restricted common stock or in the right to receive unrestricted shares of common stock in the future. Awards under these plans are generally subject to vesting over time, generally three years from the date of award, and are generally contingent upon continued employment and subject to restrictions on sale, transfer or assignment until conversion to a common stock. All or a portion of an award may be cancelled if employment is terminated before the end of the relevant vesting period and after the vesting period in certain situations. Recipients of RSU awards may have voting rights, at the Morgan Stanley Group’s discretion, and generally receive dividend equivalents, if the awards vest.
During the year, Morgan Stanley granted 323,657 units (2017: 288,821 units) of RSUs to employees of the Company with a weighted average fair value per unit of US$56.13 (2017: US$42.71), based on the market value of Morgan Stanley shares at grant date.
Included within ‘Staff costs’, ‘Directors’ remuneration’ and ‘Management charges from other Morgan Stanley Group undertakings’ within the ‘Other expense’ note is an amount of US$15,521,000 (2017: US$13,197,000) in relation to RSUs equity based compensation plans, granted to employees of the Company.
MORGAN STANLEY ASIA INTERNATIONAL LIMITED NOTES TO THE FINANCIAL STATEMENTS Year ended 31 December 2018
64
30. EMPLOYEE COMPENSATION PLANS (CONTINUED) Deferred cash-based compensation plans
Morgan Stanley has granted deferred cash-based compensation awards to certain employees which defer a portion of the employees’ discretionary compensation. The plans generally provide a return based upon the performance of various referenced investments. Awards under these plans are generally subject to a sole vesting condition of service over time, which normally ranges from six months to three years from the date of grant. All or a portion of an award may be cancelled if employment is terminated before the end of the relevant vesting period. The awards are settled in cash at the end of the relevant vesting period.
Awards with a value of US$17,076,000 (2017: US$12,305,000) have been granted to employees of the Company during the year. The liability to employees at the end of the year, reported within ‘Trade and other payables’ in the statement of financial position, is US$21,826,000 (2017: US$20,451,000).
Plans operated by fellow Morgan Stanley undertakings
As explained in note 10, the Company utilises the services of staff who are employed by other Morgan Stanley Group entities. Management charges are incurred in respect of these employee services which include the cost of equity-settled share-based compensation plans and deferred cash-based compensation plans.
31. POST-EMPLOYMENT BENEFITS Defined contribution plans
The Morgan Stanley Group operates the Morgan Stanley Defined Contribution Plan (the “Plan”), which requires contributions to be made to funds held in trust, separate from the assets of the Company. The Plan is a defined contribution plan.
Additionally, the employees of the Branch are members of a state-managed retirement benefit plan, the Central Provident Board Fund, operated by the Government of Singapore. The Branch is required to contribute a specified percentage of payroll costs to the retirement benefit scheme to fund the benefits. The only obligation of the Branch with respect to the retirement plan is to make the specified contributions.
The defined contribution pension charge recognised within ‘Staff costs’ and ‘Directors’ remuneration’ in ‘Other expense’ in the income statement was US$4,730,000 for the year (2017: US$4,628,000) of which US$218,000 was accrued at 31 December 2018 (2017: US$193,000).
32. RELATED PARTY DISCLOSURES Parent and subsidiary relationships
Parent and ultimate controlling entity
The Company’s immediate parent undertaking is Morgan Stanley Hong Kong Limited, which is incorporated in Hong Kong.
The ultimate parent undertaking and controlling entity and the largest group of which the Company is a member and for which group financial statements are prepared is Morgan Stanley. Morgan Stanley is incorporated in the State of Delaware, the United States of America. Copies of its financial statements can be obtained from www.morganstanley.com/investorrelations.
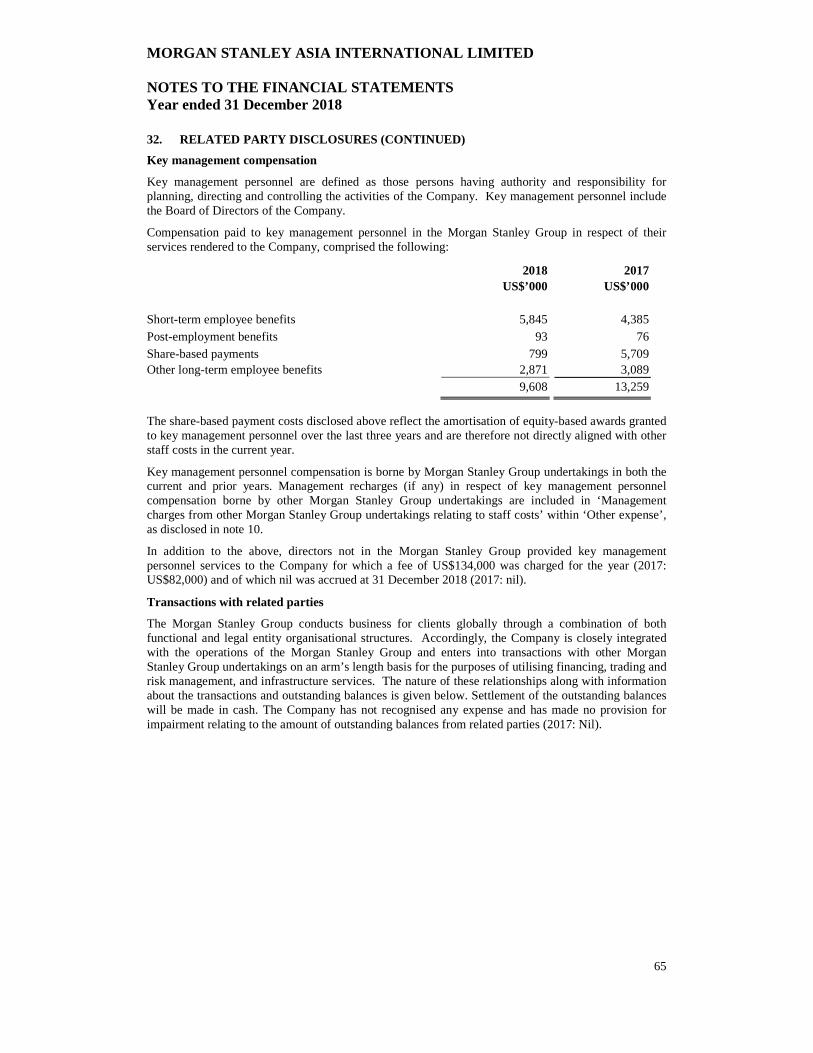
MORGAN STANLEY ASIA INTERNATIONAL LIMITED NOTES TO THE FINANCIAL STATEMENTS Year ended 31 December 2018
65
32. RELATED PARTY DISCLOSURES (CONTINUED) Key management compensation
Key management personnel are defined as those persons having authority and responsibility for planning, directing and controlling the activities of the Company. Key management personnel include the Board of Directors of the Company.
Compensation paid to key management personnel in the Morgan Stanley Group in respect of their services rendered to the Company, comprised the following:
2018 2017 US$’000 US$’000 Short-term employee benefits 5,845 4,385 Post-employment benefits 93 76 Share-based payments 799 5,709 Other long-term employee benefits 2,871 3,089 9,608 13,259 The share-based payment costs disclosed above reflect the amortisation of equity-based awards granted to key management personnel over the last three years and are therefore not directly aligned with other staff costs in the current year.
Key management personnel compensation is borne by Morgan Stanley Group undertakings in both the current and prior years. Management recharges (if any) in respect of key management personnel compensation borne by other Morgan Stanley Group undertakings are included in ‘Management charges from other Morgan Stanley Group undertakings relating to staff costs’ within ‘Other expense’, as disclosed in note 10.
In addition to the above, directors not in the Morgan Stanley Group provided key management personnel services to the Company for which a fee of US$134,000 was charged for the year (2017: US$82,000) and of which nil was accrued at 31 December 2018 (2017: nil).
Transactions with related parties
The Morgan Stanley Group conducts business for clients globally through a combination of both functional and legal entity organisational structures. Accordingly, the Company is closely integrated with the operations of the Morgan Stanley Group and enters into transactions with other Morgan Stanley Group undertakings on an arm’s length basis for the purposes of utilising financing, trading and risk management, and infrastructure services. The nature of these relationships along with information about the transactions and outstanding balances is given below. Settlement of the outstanding balances will be made in cash. The Company has not recognised any expense and has made no provision for impairment relating to the amount of outstanding balances from related parties (2017: Nil).

MORGAN STANLEY ASIA INTERNATIONAL LIMITED NOTES TO THE FINANCIAL STATEMENTS Year ended 31 December 2018
66
32. RELATED PARTY DISCLOSURES (CONTINUED) Transactions with related parties (continued)
Cash
The Company receives deposits from other Morgan Stanley Group undertakings. All such transactions are entered into on an arm’s length basis.
2018 2017
Interest Balance Interest Balance
US$’000 US$’000 US$’000 US$’000
Amounts due to the Company’s direct and indirect parent undertakings 7,193 - 10,490 473,139 Amounts due to other Morgan Stanley Group undertakings 5,921 - 16,332 312,135 13,114 - 26,822 785,274
Trading and risk management
The Company enters into purchases and sales of securities and derivative transactions with other Morgan Stanley Group undertakings primarily to meet local regulatory requirements and to manage the market risks associated with such transactions. The Company also has a cash sweep service with other Morgan Stanley Group undertakings to facilitate provision of financial services to clients on a global basis. All such transactions are entered into on an arm’s length basis. The total amounts receivable and payable on such securities transactions not yet settled and the fair value of such derivatives contracts outstanding at the year end were as follows:
2018 2017 US$’000 US$’000 Amounts due from other Morgan Stanley Group undertakings 969 4,833
Amounts due to other Morgan Stanley Group undertakings 20,208 15,778
The Company has received collateral of US$Nil (2017: US$243,000) at 31 December 2018 and incurred interest charges of US$111,000 (2017: US$8,000) to other Morgan Stanley Group undertakings during the year and has pledged collateral of US$1,734,000 (2017: US$13,295,000) at 31 December 2018 and received interest of US$90,000 (2017: US$118,000) from other Morgan Stanley Group undertakings during the year to mitigate credit risk on exposures arising under derivatives contracts between the Company and other Morgan Stanley Group undertakings. This is reported in the statement of financial position in ‘Trade and other receivables’/ ‘Trade and other payables’.

MORGAN STANLEY ASIA INTERNATIONAL LIMITED NOTES TO THE FINANCIAL STATEMENTS Year ended 31 December 2018
67
32. RELATED PARTY DISCLOSURES (CONTINUED) Transactions with related parties (continued)
Infrastructure services and fees and commissions
The Company receives and incurs management charges to and from other Morgan Stanley Group undertakings for infrastructure services, including the provision of staff, administrative support and office facilities. Management recharges received and incurred during the year are as follows:
2018 2017 US$’000 US$’000 Amounts recharged from the Company’s direct and indirect parent undertakings 144 168 Amounts recharged from other Morgan Stanley Group undertakings 69,355 56,970 69,499 57,138 Amounts recharged to other Morgan Stanley Group undertakings 6,420 1,889 The management and execution of business strategies on a global basis results in many Morgan Stanley transactions impacting a number of Morgan Stanley Group undertakings. The Morgan Stanley Group operates a number of intra-group policies to ensure that, where possible, revenues and related costs are matched.
The Company earns fee and commission income from other Morgan Stanley Group undertakings for value added services which include sales commissions and fees arising from such policies. Fees and commissions received during the year are as follows:
2018 2017 US$’000 US$’000 Fees and commissions received from the Company’s direct and
indirect parent undertakings 228,408 210,552 228,408 210,552
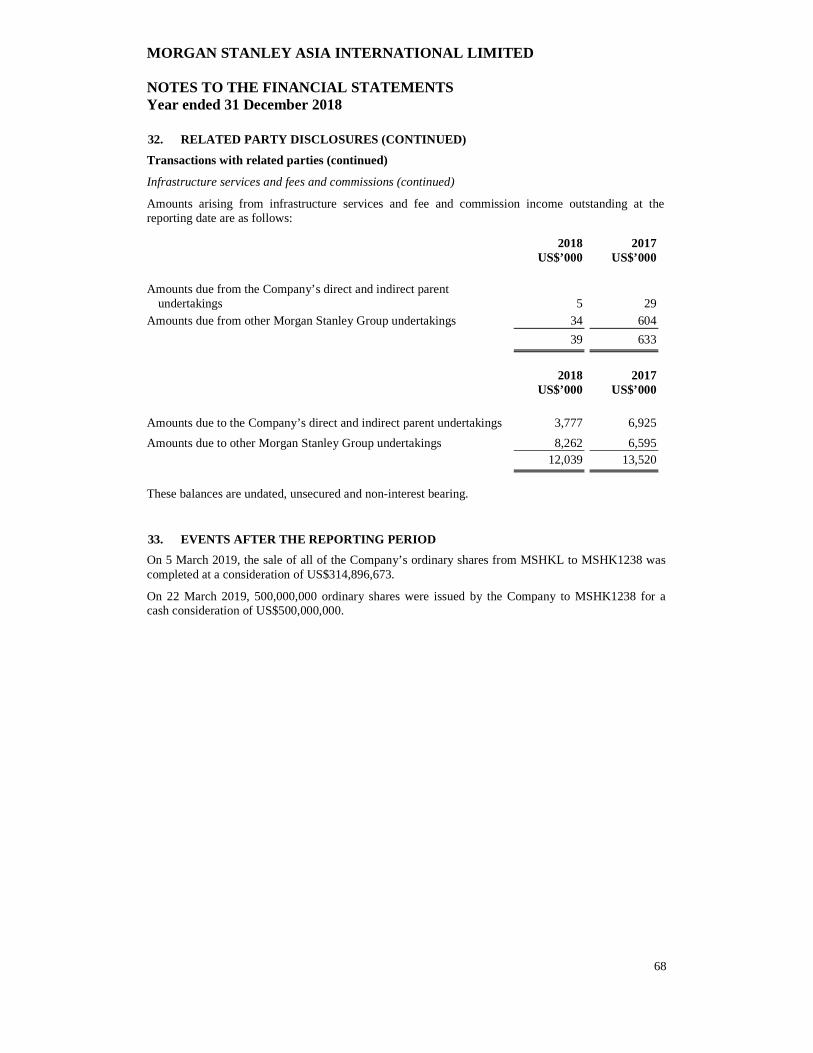
MORGAN STANLEY ASIA INTERNATIONAL LIMITED NOTES TO THE FINANCIAL STATEMENTS Year ended 31 December 2018
68
32. RELATED PARTY DISCLOSURES (CONTINUED) Transactions with related parties (continued)
Infrastructure services and fees and commissions (continued)
Amounts arising from infrastructure services and fee and commission income outstanding at the reporting date are as follows:
2018 2017 US$’000 US$’000 Amounts due from the Company’s direct and indirect parent
undertakings 5 29 Amounts due from other Morgan Stanley Group undertakings 34 604 39 633 2018 2017 US$’000 US$’000 Amounts due to the Company’s direct and indirect parent undertakings 3,777 6,925
Amounts due to other Morgan Stanley Group undertakings 8,262 6,595 12,039 13,520 These balances are undated, unsecured and non-interest bearing.
33. EVENTS AFTER THE REPORTING PERIOD On 5 March 2019, the sale of all of the Company’s ordinary shares from MSHKL to MSHK1238 was completed at a consideration of US$314,896,673.
On 22 March 2019, 500,000,000 ordinary shares were issued by the Company to MSHK1238 for a cash consideration of US$500,000,000.
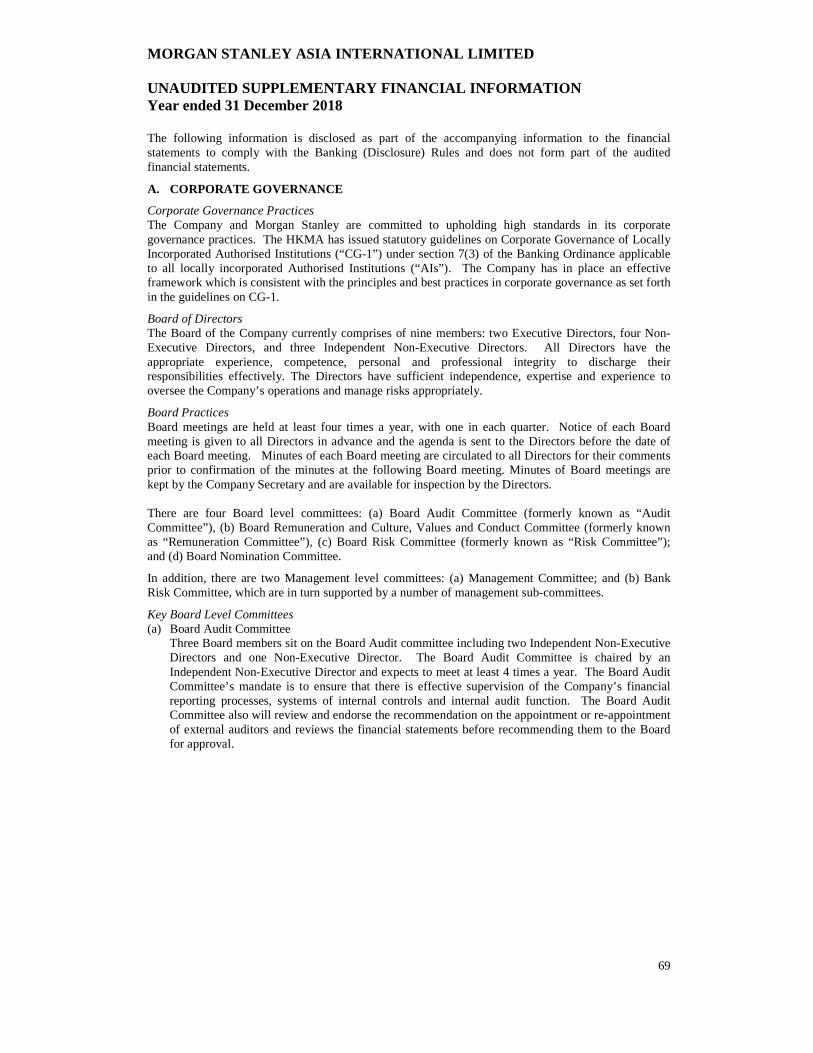
MORGAN STANLEY ASIA INTERNATIONAL LIMITED UNAUDITED SUPPLEMENTARY FINANCIAL INFORMATION Year ended 31 December 2018
69
The following information is disclosed as part of the accompanying information to the financial statements to comply with the Banking (Disclosure) Rules and does not form part of the audited financial statements.
A. CORPORATE GOVERNANCE
Corporate Governance Practices The Company and Morgan Stanley are committed to upholding high standards in its corporate governance practices. The HKMA has issued statutory guidelines on Corporate Governance of Locally Incorporated Authorised Institutions (“CG-1”) under section 7(3) of the Banking Ordinance applicable to all locally incorporated Authorised Institutions (“AIs”). The Company has in place an effective framework which is consistent with the principles and best practices in corporate governance as set forth in the guidelines on CG-1.
Board of Directors The Board of the Company currently comprises of nine members: two Executive Directors, four Non-Executive Directors, and three Independent Non-Executive Directors. All Directors have the appropriate experience, competence, personal and professional integrity to discharge their responsibilities effectively. The Directors have sufficient independence, expertise and experience to oversee the Company’s operations and manage risks appropriately.
Board Practices Board meetings are held at least four times a year, with one in each quarter. Notice of each Board meeting is given to all Directors in advance and the agenda is sent to the Directors before the date of each Board meeting. Minutes of each Board meeting are circulated to all Directors for their comments prior to confirmation of the minutes at the following Board meeting. Minutes of Board meetings are kept by the Company Secretary and are available for inspection by the Directors. There are four Board level committees: (a) Board Audit Committee (formerly known as “Audit Committee”), (b) Board Remuneration and Culture, Values and Conduct Committee (formerly known as “Remuneration Committee”), (c) Board Risk Committee (formerly known as “Risk Committee”); and (d) Board Nomination Committee.
In addition, there are two Management level committees: (a) Management Committee; and (b) Bank Risk Committee, which are in turn supported by a number of management sub-committees.
Key Board Level Committees (a) Board Audit Committee
Three Board members sit on the Board Audit committee including two Independent Non-Executive Directors and one Non-Executive Director. The Board Audit Committee is chaired by an Independent Non-Executive Director and expects to meet at least 4 times a year. The Board Audit Committee’s mandate is to ensure that there is effective supervision of the Company’s financial reporting processes, systems of internal controls and internal audit function. The Board Audit Committee also will review and endorse the recommendation on the appointment or re-appointment of external auditors and reviews the financial statements before recommending them to the Board for approval.

MORGAN STANLEY ASIA INTERNATIONAL LIMITED UNAUDITED SUPPLEMENTARY FINANCIAL INFORMATION Year ended 31 December 2018
70
A. CORPORATE GOVERNANCE (CONTINUED)
Key Board Level Committees (continued) (b) Board Remuneration and Culture, Values and Conduct Committee
Three Board members sit on the Board Remuneration and Culture, Values and Conduct Committee including two Independent Non-Executive Directors and one Non-Executive Director. The Board Remuneration and Culture, Values and Conduct Committee is chaired by an Independent Non-Executive Director and meets at least twice a year. The Board Remuneration and Culture, Values and Conduct Committee’s responsibility is to assist the Board in discharging its responsibility for the design and operation of the Company’s remuneration system, and the oversight of the Company’s culture, values and conduct programme. The Board has delegated to the Board Remuneration and Culture, Values and Conduct Committee the authority to approve the remuneration packages for the Company’s senior management and key personnel with a view to creating a remuneration system that incentivises proper employee behavior, and to oversee the implementation of the Company’s culture, values and conduct programme.
(c) Board Risk Committee The Board Risk Committee comprises three Board members, including two Independent Non-Executive Directors and one Non-Executive Director. The Board Risk Committee meets at a minimum of 4 times a year and is chaired by an Independent Non-Executive Director. The Board Risk Committee oversees key risk matters and risk governance and recommends to the Board the Company’s risk appetite statements. It also reviews annually the Company’s risk management strategy and policy, and reviews and ensures that the Company has appropriate manpower resources, infrastructure and other resources and systems to identify, assess, monitor, and manage risks.
(d) Board Nomination Committee Three Board members sit on the Board Nomination Committee including two Independent Non-Executive Directors and one Non-Executive Director. The Board Nomination Committee is chaired by an Independent Non-Executive Director and meets as frequently as is properly required to carry out its functions and at least once a year. The Board Nomination Committee is responsible for assisting and providing guidance to the Board in relation to the appointment of board members, and the assessment of board performance for the Company.
Key Management Level Committees (a) Management Committee
The Management Committee is chaired by the Chief Executive of the Company and meets monthly. The Management Committee oversees the operations of the Company and provides a regular forum for business leaders across the Company to identify and discuss key issues and actions that need to be taken to fulfill the Company’s strategy.
(b) Bank Risk Committee The Bank Risk Committee is chaired by the Chief Executive of the Company and meets monthly. The Bank Risk Committee provides a regular forum for senior representatives of the Company to oversee the risk management practices within the Company.
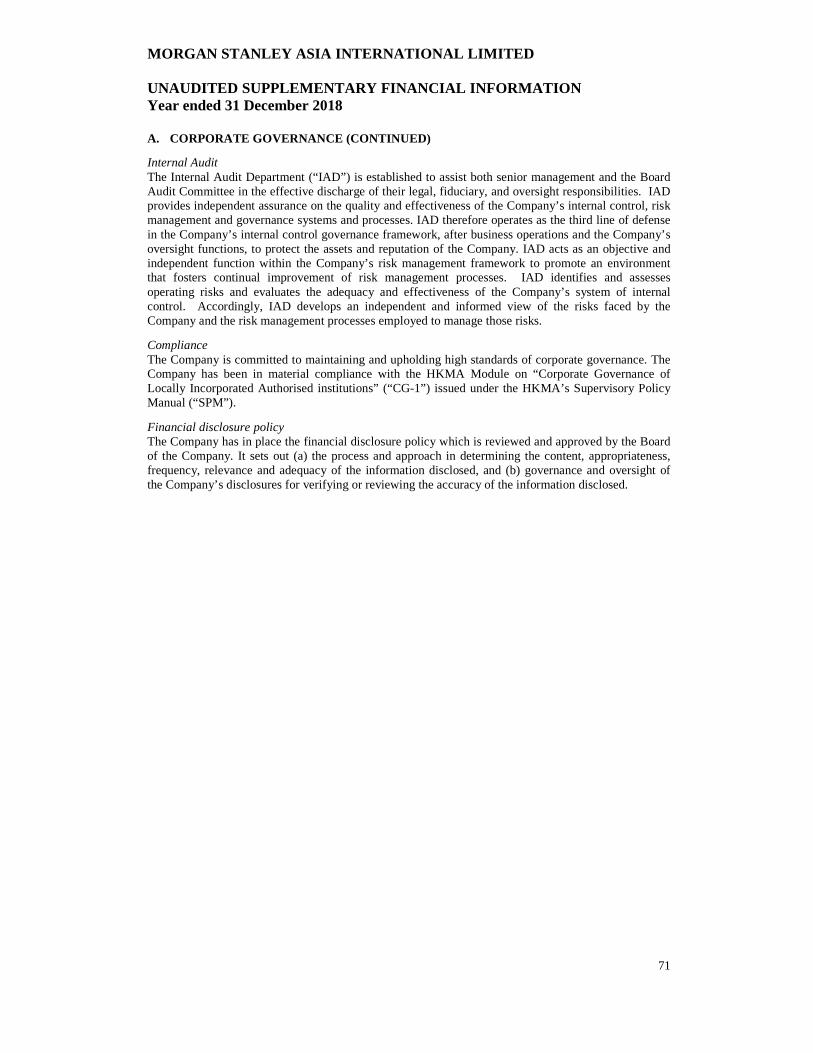
MORGAN STANLEY ASIA INTERNATIONAL LIMITED UNAUDITED SUPPLEMENTARY FINANCIAL INFORMATION Year ended 31 December 2018
71
A. CORPORATE GOVERNANCE (CONTINUED)
Internal Audit The Internal Audit Department (“IAD”) is established to assist both senior management and the Board Audit Committee in the effective discharge of their legal, fiduciary, and oversight responsibilities. IAD provides independent assurance on the quality and effectiveness of the Company’s internal control, risk management and governance systems and processes. IAD therefore operates as the third line of defense in the Company’s internal control governance framework, after business operations and the Company’s oversight functions, to protect the assets and reputation of the Company. IAD acts as an objective and independent function within the Company’s risk management framework to promote an environment that fosters continual improvement of risk management processes. IAD identifies and assesses operating risks and evaluates the adequacy and effectiveness of the Company’s system of internal control. Accordingly, IAD develops an independent and informed view of the risks faced by the Company and the risk management processes employed to manage those risks.
Compliance The Company is committed to maintaining and upholding high standards of corporate governance. The Company has been in material compliance with the HKMA Module on “Corporate Governance of Locally Incorporated Authorised institutions” (“CG-1”) issued under the HKMA’s Supervisory Policy Manual (“SPM”).
Financial disclosure policy The Company has in place the financial disclosure policy which is reviewed and approved by the Board of the Company. It sets out (a) the process and approach in determining the content, appropriateness, frequency, relevance and adequacy of the information disclosed, and (b) governance and oversight of the Company’s disclosures for verifying or reviewing the accuracy of the information disclosed.

MORGAN STANLEY ASIA INTERNATIONAL LIMITED UNAUDITED SUPPLEMENTARY FINANCIAL INFORMATION Year ended 31 December 2018
72
B. SEGMENTAL INFORMATION (a) By geographical area
The geographical segmental analysis for the year ended 31 December 2018 is as follows: Hong Kong (1) Singapore (1) Total
2018 US$’000 US$’000 US$’000
Total operating income (net of interest expense) 231,701 82,950 314,651
Profit before income tax 47,794 39,822 87,616
Total assets 1,841,689 1,621,685 3,463,374
Total liabilities 2,087,026 1,067,443 3,154,469
(1) The amounts disclosed above are after elimination of interoffice balances or transactions between the head office in Hong Kong and the Branch.
There were no contingent liabilities and commitments as at 31 December 2018.
(b) By class of business
The main business segments of the Company are as follows: (i) Wealth Management: the Company engages in the business of banking including deposit
taking and lending. It also acts (a) as agent on behalf of its customers in connection with the provision of general investment, securities dealing, as well as discretionary management and (b) as introducing broker to Morgan Stanley & Co. International plc for the provision of clearance, settlement and custody services in relation to the aforementioned transactions.
(ii) Treasury and others: includes treasury operations and back office activities.
The Company’s business segment results for the year ended 31 December 2018 are as follows:
Wealth
Management (1) Treasury
and others (1) Total
2018 US$’000 US$’000 US$’000
Total operating income (net of interest expense) 281,491 33,160 314,651
Profit before income tax 80,223 7,393 87,616
Total assets 1,602,822 1,860,552 3,463,374
(1) The amounts disclosed above are after elimination of interoffice balances or transactions between the head office in Hong Kong and the Branch.
There were no impairment losses, specific provision and collective provision for impaired assets for the year.

MORGAN STANLEY ASIA INTERNATIONAL LIMITED UNAUDITED SUPPLEMENTARY FINANCIAL INFORMATION Year ended 31 December 2018
73
C. LOAN AND ADVANCES – SECTOR INFORMATION As at
31 December 2018
Sector classification US$’000 Loans and advances for use in Hong Kong Industrial, commercial and financial:
- Financial concerns 8,474 - Others 491,136
Individuals - Others 122,602
Loans and advances for use outside Hong Kong 976,089 Total 1,598,301
The total loans were fully secured by collateral as at 31 December 2018.
As at 31 December
2018 Geographical Areas US$’000 Hong Kong 622,212 Taiwan 210,875 Singapore 200,016 Mainland China 141,365 Others 423,833 Total 1,598,301 Loan and Advances are exposures of counterparties based on the location of the counterparties after taking into account any risk transfer. The risk transfers have been made if the claims are guaranteed by a party in a geographical area which is different from that of the counterparty or if the claims are on an overseas branch of a bank whose head office is located in another geographical area. D. INTERNATIONAL CLAIMS International claims are on-balance sheet exposures of counterparties based on the location of the counterparties after taking into account any risk transfer. The risk transfers have been made if the claims are guaranteed by a party in a geographical area which is different from that of the counterparty or if the claims are on an overseas branch of a bank whose head office is located in another geographical area.
Non-bank private sector
Non-bank Non-financial Official financial private
Bank sector institutions sector Total
31 December 2018 US$'000 US$'000 US$'000
US$’000 US$'000
Developed countries 296,897 1,044,411 19 2,486 1,343,813
of which: United States 226,723 1,044,411 17 391 1,271,542
Offshore centres 224,680 - 100,014 732,584 1,057,278
of which: Hong Kong 28,873 - 54,332 426,283 509,488
of which: Singapore 195,808 - 11 184,219 380,038
Developing Asia and Pacific - - 2,648 605,563 608,211
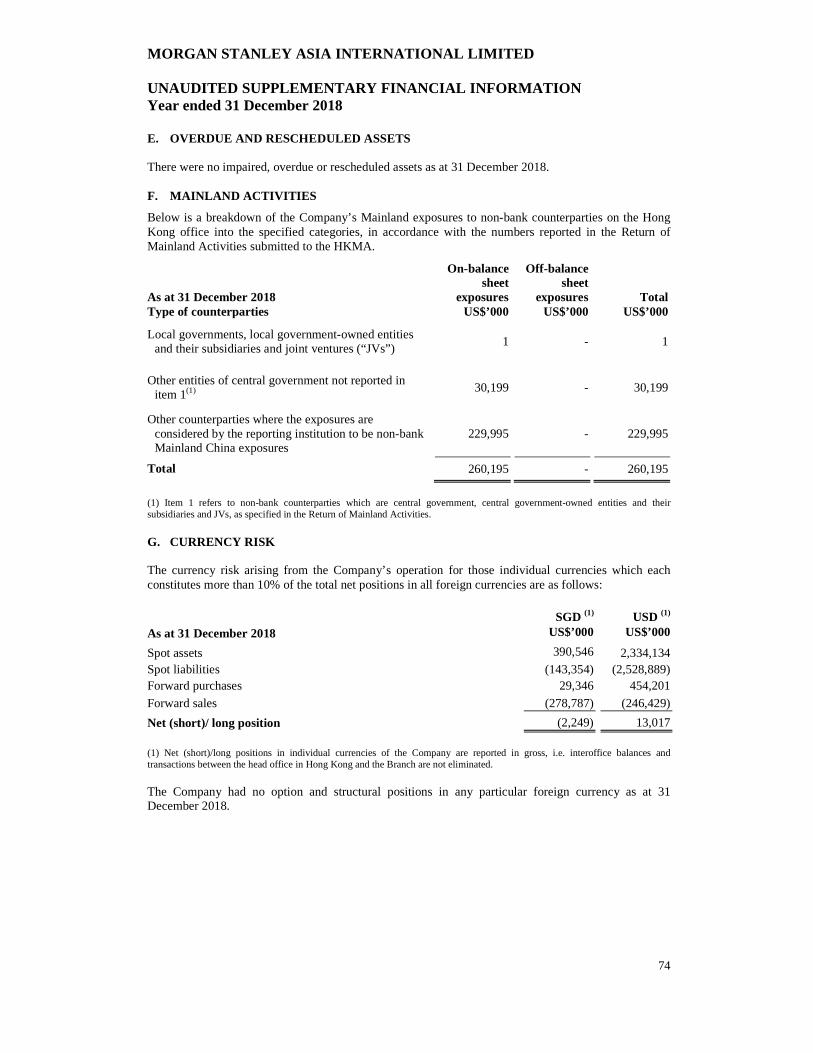
MORGAN STANLEY ASIA INTERNATIONAL LIMITED UNAUDITED SUPPLEMENTARY FINANCIAL INFORMATION Year ended 31 December 2018
74
E. OVERDUE AND RESCHEDULED ASSETS There were no impaired, overdue or rescheduled assets as at 31 December 2018. F. MAINLAND ACTIVITIES
Below is a breakdown of the Company’s Mainland exposures to non-bank counterparties on the Hong Kong office into the specified categories, in accordance with the numbers reported in the Return of Mainland Activities submitted to the HKMA.
As at 31 December 2018
On-balance sheet
exposures
Off-balance sheet
exposures Total Type of counterparties US$’000 US$’000 US$’000
Local governments, local government-owned entities and their subsidiaries and joint ventures (“JVs”)
1 - 1
Other entities of central government not reported in item 1(1)
30,199 - 30,199
Other counterparties where the exposures are considered by the reporting institution to be non-bank Mainland China exposures
229,995 - 229,995
Total 260,195 - 260,195 (1) Item 1 refers to non-bank counterparties which are central government, central government-owned entities and their subsidiaries and JVs, as specified in the Return of Mainland Activities. G. CURRENCY RISK The currency risk arising from the Company’s operation for those individual currencies which each constitutes more than 10% of the total net positions in all foreign currencies are as follows:
SGD (1) USD (1) As at 31 December 2018 US$’000 US$’000 Spot assets 390,546 2,334,134 Spot liabilities (143,354) (2,528,889) Forward purchases 29,346 454,201
Forward sales (278,787) (246,429) (2,249) 13,017 Net (short)/ long position (1) Net (short)/long positions in individual currencies of the Company are reported in gross, i.e. interoffice balances and transactions between the head office in Hong Kong and the Branch are not eliminated. The Company had no option and structural positions in any particular foreign currency as at 31 December 2018.

MORGAN STANLEY ASIA INTERNATIONAL LIMITED UNAUDITED SUPPLEMENTARY FINANCIAL INFORMATION Year ended 31 December 2018
75
H. PILLAR 3 DISCLOSURE
The capital adequacy ratios of the Company were calculated in accordance with Banking (Capital) Rules of the Banking Ordinance. The Company uses the following approaches to calculate its capital charge for:
(a) credit risk: Standardised (Credit Risk) Approach (“STC approach”); and (b) operational risk: Basic Indicator Approach (“BIA approach”).
There was no risk-weighted amount (“RWA”) for market risk for the Company because the Company was exempted by the HKMA from the calculation of market risk.
The following templates and tables show the standard disclosure templates and tables specified by the HKMA in relation to the Pillar 3 disclosures required under the Banking (Disclosure) Rules. Other Pillar 3 templates or tables not disclosed below either are not applicable to the Company or have no reportable amount for the period.
Table OVA: Overview of risk management
Risk Management Framework
The Company has established a risk governance framework (“RGF”), which is vital to the success of the Company’s business activities. The RGF integrates the diverse roles of the Business Units, Support and Control Functions, Firm Risk Management, and Compliance Functions into a holistic enterprise structure and facilitates the incorporation of risk assessment into decision-making processes across the Company. The Company’s RGF affirms to Morgan Stanley’s firm-wide risk governance framework.
RGF recognises that risks are often interrelated and therefore should be managed Bank-wide on an aggregate and individual basis. RGF encompasses the Company’s risk management culture, principles and practices that support risk identification, measurement, monitoring, escalation and decision-making processes. RGF views risk in a broad context and considers the risk to earnings and capital adequacy in a stressed market environment, as well as the risks to future earnings due to reputational damage.
The principal risks involved in the Company’s business activities include market, interest rate, credit, operational, liquidity, compliance, conduct and reputational risk. Strategic risk is integrated into the Company’s business planning, embedded in the evaluation of all principal risks and overseen by the Company’s Board of Directors (or a committee thereof).
The Company’s articulation of the aggregate level and types of risk that it is willing to accept in order to achieve its business objectives is established, communicated and monitored in accordance with the Company’s Risk Appetite Statement. The combination of Risk Tolerance Statements, quantitative risk limits, and Key Risk Indicators (“KRIs”) aims to ensure the Company’s businesses are carried out in line with the risk appetite established by the Company’s Board, and to protect the Company’s capital and reputation in both normal and stressed environments. There are regular reporting, including reporting on breaches, to the both management and Board level committees.
Risk Management Culture
The Company’s risk management culture requires the Company to seek acceptable risk-adjusted returns through prudent risk- taking that protects the Company’s capital base and franchise, and is faithful to the Company’s risk appetite and core values. The Company’s three lines of defense, its Business Units, Independent Risk Management and Compliance functions, and the Internal Audit Department, shall play an integral role in enabling the Company’s to achieve the objectives of the RGF.
The Company’s risk management culture is based on the following five key principles:
• Integrity : critical to Morgan Stanley Group’s approach to Enterprise Risk Management (“ERM”) is strong risk culture and risk governance. Developing the Morgan Stanley Group’s risk culture is a continuous process and builds upon the Morgan Stanley Group’s commitment to “doing the right thing” and its values that make managing risk each employee’s responsibility;
• Comprehensiveness: a well-defined, comprehensive risk governance structure maintained by employees with appropriate risk management expertise that provides for periodic assessment of the efficacy of the Morgan Stanley Group’s risk management framework;

MORGAN STANLEY ASIA INTERNATIONAL LIMITED UNAUDITED SUPPLEMENTARY FINANCIAL INFORMATION Year ended 31 December 2018
76
H. PILLAR 3 DISCLOSURE (CONTINUED)
Table OVA: Overview of risk management (continued)
Risk Management Culture (continued)
• Independence: independent lines of reporting for risk managers in regard to identification, measurement, monitoring, escalation and mitigation of risk;
• Accountability : well-defined roles and responsibilities that establish clear accountability for risk management and are aligned with the Morgan Stanley Group’s disciplinary and compensation structure;
• Transparency: strong risk culture that encourages open dialogue, effective challenge, escalation and appropriate reporting of risk to senior management, the Board (or a committee thereof) and the Company’s regulators as well as external disclosures of risk matters.
The Company executes risk oversight through multiple lines of defense.
• The first line of defense is provided by the business units where risks are taken. In the course of conducting business activities, staff in the business units hold frontline positions in the proper identification, assessment, management and reporting of risk exposures on an ongoing basis, having regard to the Company’s risk appetite, policies, procedures and controls.
• The second line of defense is provided by independent and effective risk management and compliance functions. The risk management function is primarily responsible for overseeing the Company’s risk-taking activities, undertaking risk assessments and reporting independently from the business line, while the compliance function monitors compliance with laws, corporate governance rules, regulations and internal policies; and
• The third line of defense is provided by an independent and effective internal audit function, which is responsible for providing assurance on the effectiveness of the Company’s risk management framework including the risk governance arrangements (including the first and second lines of defense described above).
Risk Governance Structure
Risk management requires independent bank-level oversight, accountability of the Company’s business segments, and effective communication of risk matters to senior management and the Board. The nature of the Company’s risks, coupled with this risk management philosophy, forms the Company’s risk governance structure.
The Company’s risk governance structure includes:
Board and Board level committees
Management level committees
MORGAN STANLEY ASIA INTERNATIONAL LIMITED UNAUDITED SUPPLEMENTARY FINANCIAL INFORMATION Year ended 31 December 2018
77
H. PILLAR 3 DISCLOSURE (CONTINUED)
Table OVA: Overview of risk management (continued)
Risk Governance Structure (continued)
Above committees are further detailed in Section A of the Unaudited Supplementary Financial Information.
Risk Appetite Monitoring and Reporting
The Company’s Risk Appetite Framework requires a comprehensive approach to monitor, assess and report on the risk profiles of the Company, Business Units on an ongoing basis, with regular reporting to the Bank Risk Committee and Board Risk Committee. The reporting must include quantitative measurements and qualitative assessments that enable a comparison of the Company’s current risk profile against risk limits, KRIs and Risk Tolerance Statements. Reporting must identify matters for escalation and decisions, as well as highlight emerging risks, mitigating actions and matters that are significant to the Company’s strategy.
Monitoring is an ongoing review of major risks and/or controls at a set frequency. The scope and frequency of monitoring depends on the types of risk, as well as on the specific business risk operations and activities. Adequate monitoring enables the Company to understand its risk profile across risk types, groups, and lines of business. It also helps the Company to ascertain how particular risks may be evolving or changing in reaction to controls and the impact of emerging risks.
Risk data and analysis are reported at and across multiple levels of the Company, and to various audiences, through an extensive suite of periodic and ad hoc reports. Reports include backward- looking, current, and forward-looking risk management information. The goal of effective risk reporting is to provide actionable information that informs daily business decisions, prompts responses to key current and emerging issues, and ensures that senior management and the Board maintain a comprehensive view of key risk profiles.
Firm Risk Management Functions
Market Risk
The Market Risk Department (“MRD”) is responsible for the governance and oversight of all market risk exposures arising from the Company’s trading and non-trading business activities by identifying and defining market risks; developing and employing risk measures and tools to monitor, control and mitigate those risks; establishing limits; monitoring usage against these limits; and producing and distributing comprehensive reports designed to keep senior management apprised of the Company’s market risk exposures. MRD helps ensure transparency of material market risks, which includes, but is not limited to, the escalation of risk concentrations to senior management, as well as the disclosure and reporting of market risks to the Board and the Company’s regulatory authorities.
Credit Risk
The Credit Risk Management Department (“CRM”) oversees, assesses, monitors, measures, controls and reports on credit risk exposure to institutions and individuals primarily through the Wealth Management businesses (“PWM Asia”). CRM helps ensure transparency of material credit risks, which includes the escalation of risk concentrations to senior management, as well as the disclosure and reporting of credit risks to the Board and the Company’s regulatory authorities. CRM also works closely with MRD and applicable Business Units to monitor risk exposures and to perform stress tests to identify, analyse and control credit risk concentrations arising in PWM Asia’s lending and trading activities.
MORGAN STANLEY ASIA INTERNATIONAL LIMITED UNAUDITED SUPPLEMENTARY FINANCIAL INFORMATION Year ended 31 December 2018
78
H. PILLAR 3 DISCLOSURE (CONTINUED)
Table OVA: Overview of risk management (continued)
Firm Risk Management Functions (continued)
Liquidity Risk
The Liquidity Risk Department (“LRD”) oversees the liquidity risk arising from the Company’s business activities. LRD independently ensures transparency of material liquidity risks, compliance with established risk limits, escalation of risk concentrations to senior management, adherence to sound business practices, and compliance with applicable regulations and supervisory guidance.
Operational Risk
The Operational Risk Department (“ORD”) provides independent oversight and challenge of Operational Risk management within the Company by identifying, measuring, monitoring and controlling Operational Risks and independently validating the effectiveness and consistency of risk management processes via its Operational Risk framework.
Legal and Compliance Department
The Company has established procedures based on legal and regulatory requirements that are designed to facilitate compliance with applicable statutory and regulatory requirements as well as Morgan Stanley’s global standard relating to business conduct, ethics and practices.
Compliance Department
• The Compliance Department maintains an enterprise-wide, independent compliance risk management program. The Compliance Department is responsible for promoting a strong culture of compliance; defining an operating model and setting standards for compliance risk management; identifying, measuring, mitigating and reporting on compliance risks; maintaining a risk-based program for monitoring and testing compliance risk management by the risk owners across the Company; providing management and staff with advice, guidance (including policies and, where appropriate, procedures) and training concerning the laws, regulations and policies associated with their responsibilities; managing a Company-wide compliance risk reporting framework; reviewing new products and business initiatives; and supporting and facilitating the framework for managing significant communications with regulators and regulatory relationships through oversight by the Regulatory Relations Group.
Legal Department
• The Legal Department provides legal and regulatory advice that protects the Company’s financial well-being and reputation and assists the business in evaluating risks associated with completing transactions and other activities.
Global Financial Crimes
• The Company has adopted an AML policy which outlines the Company’s anti-money laundering compliance program. This AML policy sets forth the guiding principles and consistent standards for best practices designed to protect the Company’s business from being used to facilitate money laundering, terrorist financing, or other illicit activities.
• The Company is subject to risk of major regulatory sanctions and reputation damage if the Company significantly fails to comply with applicable AML, sanction screening laws, or Anti-Bribery and Corruption rules.
• AML related issues are reported as required to the Franchise Risk Officer, the Company’s AML Committee, Management Committee and the Board of Directors.
Internal Audit Department
IAD is established to assist both senior management and the Board Audit Committee in the effective discharge of their legal, fiduciary, and oversight responsibilities. It is further detailed in Section A of the Unaudited Supplementary Financial Information.

MORGAN STANLEY ASIA INTERNATIONAL LIMITED UNAUDITED SUPPLEMENTARY FINANCIAL INFORMATION Year ended 31 December 2018
79
H. PILLAR 3 DISCLOSURE (CONTINUED)
Table OVA: Overview of risk management (continued)
Stress testing
Stress testing is one of the Company’s principal risk management tools, which is used to identify and assess the impact of scenarios on its portfolios and capital, covering all products offered by the Company. Stress testing complements other company-wide risk metrics by providing a flexible approach to understanding risk and assessing the Company’s resilience to different scenarios over a range of severities, relevant to current market conditions and forward looking macroeconomic views. Most notably, stress testing is used for:
• Risk Management: Identifying areas of potential weakness in Company’s portfolio as a basis for senior management to take portfolio-level decisions, determining risk mitigation actions and set risk limits, and improving risk and control environment.
• Capital and Liquidity planning: Informing the proposed stressed capital and liquidity forecasts through severe but plausible stress tests.
• Others including business planning, new product evaluation and strategic business decision.
The MSAIL Stress Testing Framework utilises stress testing methodologies, including sensitivity tests and scenario analyses, to identify and assess Company’s resilience to different stress conductions.
Risk Mitigation
Risk Mitigation is further detailed in the note 24 to the audited financial statements.
Adequacy of Risk Management Arrangements
The Company is satisfied that the risk management arrangements and systems, as described, are appropriate given the strategy and risk profile of the Company. These elements are reviewed at least annually and, where applicable, updated to reflect best practice, evolving market conditions and changing regulatory requirements.

MORGAN STANLEY ASIA INTERNATIONAL LIMITED UNAUDITED SUPPLEMENTARY FINANCIAL INFORMATION Year ended 31 December 2018
80
H. PILLAR 3 DISCLOSURE (CONTINUED)
Template KM1: Key Prudential Ratios
As at 31
December 2018
As at 30
September 2018
As at 30
June 2018
As at 31
March 2018
As at 31
December 2017
USD’000 USD’000 USD’000 USD’000 USD’000
Regulatory capital (amount)
1 Common Equity Tier 1 (“CET1”) 287,225 273,366 259,078 232,685 219,236
2 Tier 1 287,225 273,366 259,078 232,685 219,236
3 Total capital 295,717 280,931 266,401 239,638 225,816
RWA (amount)
4 Total RWA 1,135,987 1,047,309 1,021,646 987,955 954,272
Risk-based regulatory capital ratios (as a percentage of RWA)
5 CET1 ratio (%) 25% 26% 25% 24% 23%
6 Tier 1 ratio (%) 25% 26% 25% 24% 23%
7 Total capital ratio (%) 26% 27% 26% 24% 24%
Additional CET1 buffer requirements (as a percentage of RWA)
8 Capital conservation buffer requirement (%) 1.875% 1.875% 1.875% 1.875% 1.250%
9 Countercyclical capital buffer requirement (%) 0.935% 0.772% 0.806% 0.747% 0.528%
10 Higher loss absorbency requirements (%) (applicable only to G-SIBs or D-SIBs)
0% 0% 0% 0% 0%
11 Total Authorised Institution (“AI”)-specific CET1 buffer requirements (%)
2.810% 2.647% 2.681% 2.622% 1.778%
12 CET1 available after meeting the AI’s minimum capital requirements (%)
18% 19% 18% 16% 16%
Basel III leverage ratio
13 Total leverage ratio (“LR”) exposure measure 3,443,511 3,867,740 4,071,075 4,423,128 4,049,844
14 LR (%) 8.34% 7.07% 6.36% 5.26% 5.41%
Liquidity Maintenance Ratio (“LMR”)
17a LMR (%) (2) 61% 60% 52% 53% 52%
Core Funding Ratio (“CFR”)
20a CFR (%) (2) 240% 247% 262% 291% N/A (1)
Note 1: The Company is subject to the CFR requirement with effect from 1 January 2018. Note 2: The LMR and CFR disclosed above represent the arithmetic mean of the average LMR and average CFR of the 3
calendar months within each quarter respectively. The Company is not required, under the Banking (Liquidity) Rules, to calculate Liquidity Coverage Ratio or Net Stable Funding Ratio for its liquidity risk.

MORGAN STANLEY ASIA INTERNATIONAL LIMITED UNAUDITED SUPPLEMENTARY FINANCIAL INFORMATION Year ended 31 December 2018
81
H. PILLAR 3 DISCLOSURE (CONTINUED)
Template OV1: Overview of RWA
RWA
Minimum capital
requirements
As at 31 December
2018
As at 30
September 2018
As at 31 December
2018
USD’000 USD’000 USD’000 1 Credit risk for non-securitization exposures 677,941 601,476 54,235
2 Of which Standardised (Credit Risk) Approach (“STC approach”) 677,941 601,476 54,235
2a Of which Basic Approach (“BSC approach”) - - -
3 Of which foundation Internal Ratings-Based (“IRB”) Approach - - -
4 Of which supervisory slotting criteria approach - - -
5 Of which advanced IRB approach - - -
6 Counterparty default risk and default fund contributions 1,393 3,735 111
7 Of which Standardised Approach for measuring Counterparty Credit Risk
(“SA-CCR”) Not applicable
7a Of which Current Exposure Method (“CEM”) 1,393 3,735 111
8 Of which Internal Models (Counterparty Credit Risk)
Approach (“IMM(CCR) approach”) - - -
9 Of which others - - -
10 Credit Valuation Adjustment (“CVA”) risk 634 1,698 51
11 Equity positions in banking book under the simple risk-weight method and
internal models method - - -
12 Collective investment scheme (“CIS”) exposures – Look-Through Approach
(“LTA”) Not applicable
13 CIS exposures – Mandate-Based Approach (“MBA”) Not applicable
14 CIS exposures – Fall-Back Approach (“FBA”) Not applicable
14a CIS exposures – combination of approaches Not applicable
15 Settlement risk - - -
16 Securitization exposures in banking book - - -
17 Of which Securitization Internal Ratings-Based Approach (“SEC-IRBA”) - - -
18 Of which Securitization External Ratings-Based Approach (“SEC-ERBA”) - - -
19 Of which Securitization Standardised Approach (“SEC-SA”) - - -
19a Of which Securitization Fall-Back Approach (“SEC-FBA”) - - -
20 Market risk - - -
21 Of which Standardised (Market Risk) Approach (“STM approach”) - - -
22 Of which Internal Models Approach (“IMM approach”) - - -
23 Capital charge for switch between exposures in trading book and banking book
(not applicable before the revised market risk framework takes effect) Not applicable
24 Operational risk 465,109 450,454 37,209
25 Amounts below the thresholds for deduction (subject to 250% Risk-Weight
(“RW”)) - - -
26 Capital floor adjustment - - -
26a Deduction to RWA 9,090 10,054 727
26b Of which portion of regulatory reserve for general banking risks and collective provisions which is not included in Tier 2 Capital
9,090 10,054 727
26c Of which portion of cumulative fair value gains arising from the revaluation of land and buildings which is not included in Tier 2 Capital - - -
27 Total 1,135,987 1,047,309 90,879
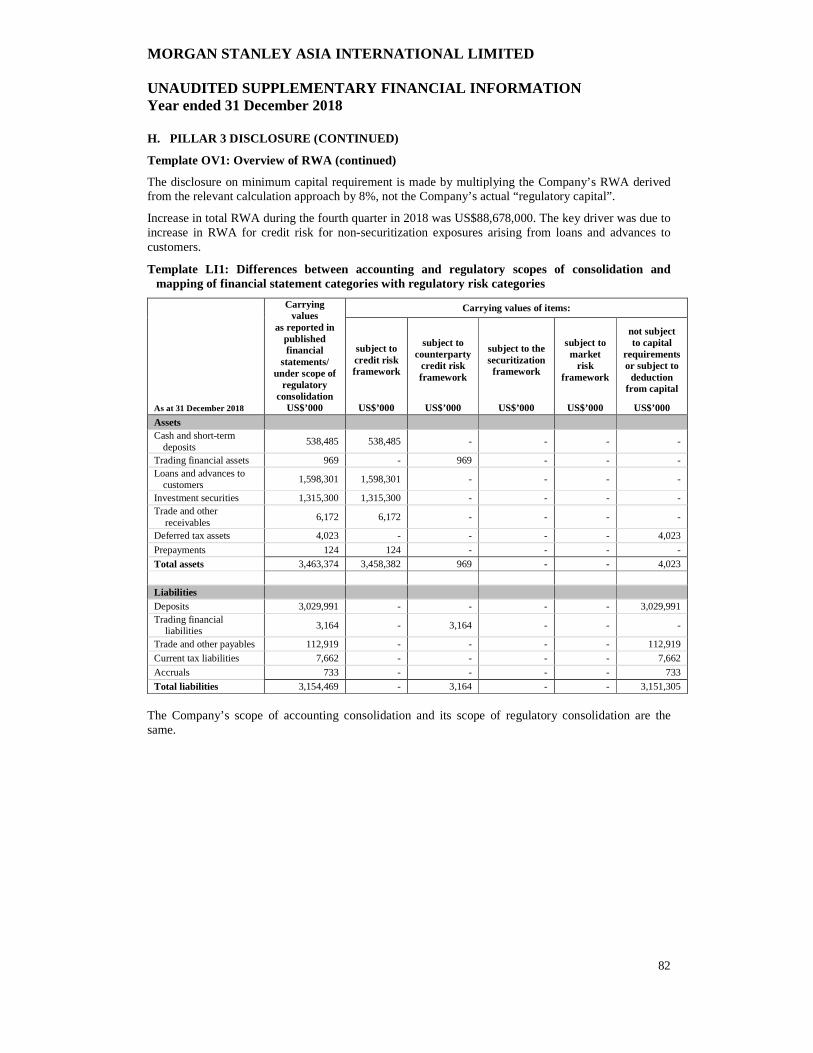
MORGAN STANLEY ASIA INTERNATIONAL LIMITED UNAUDITED SUPPLEMENTARY FINANCIAL INFORMATION Year ended 31 December 2018
82
H. PILLAR 3 DISCLOSURE (CONTINUED)
Template OV1: Overview of RWA (continued)
The disclosure on minimum capital requirement is made by multiplying the Company’s RWA derived from the relevant calculation approach by 8%, not the Company’s actual “regulatory capital”.
Increase in total RWA during the fourth quarter in 2018 was US$88,678,000. The key driver was due to increase in RWA for credit risk for non-securitization exposures arising from loans and advances to customers.
Template LI1: Differences between accounting and regulatory scopes of consolidation and mapping of financial statement categories with regulatory risk categories
Carrying
values as reported in
published financial
statements/ under scope of
regulatory consolidation
Carrying values of items:
subject to credit risk framework
subject to counterparty
credit risk framework
subject to the securitization framework
subject to market
risk framework
not subject to capital
requirements or subject to
deduction from capital
As at 31 December 2018 US$’000 US$’000 US$’000 US$’000 US$’000 US$’000
Assets Cash and short-term
deposits 538,485 538,485 - - - -
Trading financial assets 969 - 969 - - - Loans and advances to
customers 1,598,301 1,598,301 - - - -
Investment securities 1,315,300 1,315,300 - - - - Trade and other
receivables 6,172 6,172 - - - -
Deferred tax assets 4,023 - - - - 4,023
Prepayments 124 124 - - - -
Total assets 3,463,374 3,458,382 969 - - 4,023
Liabilities
Deposits 3,029,991 - - - - 3,029,991 Trading financial
liabilities 3,164 - 3,164 - - -
Trade and other payables 112,919 - - - - 112,919
Current tax liabilities 7,662 - - - - 7,662
Accruals 733 - - - - 733
Total liabilities 3,154,469 - 3,164 - - 3,151,305
The Company’s scope of accounting consolidation and its scope of regulatory consolidation are the same.
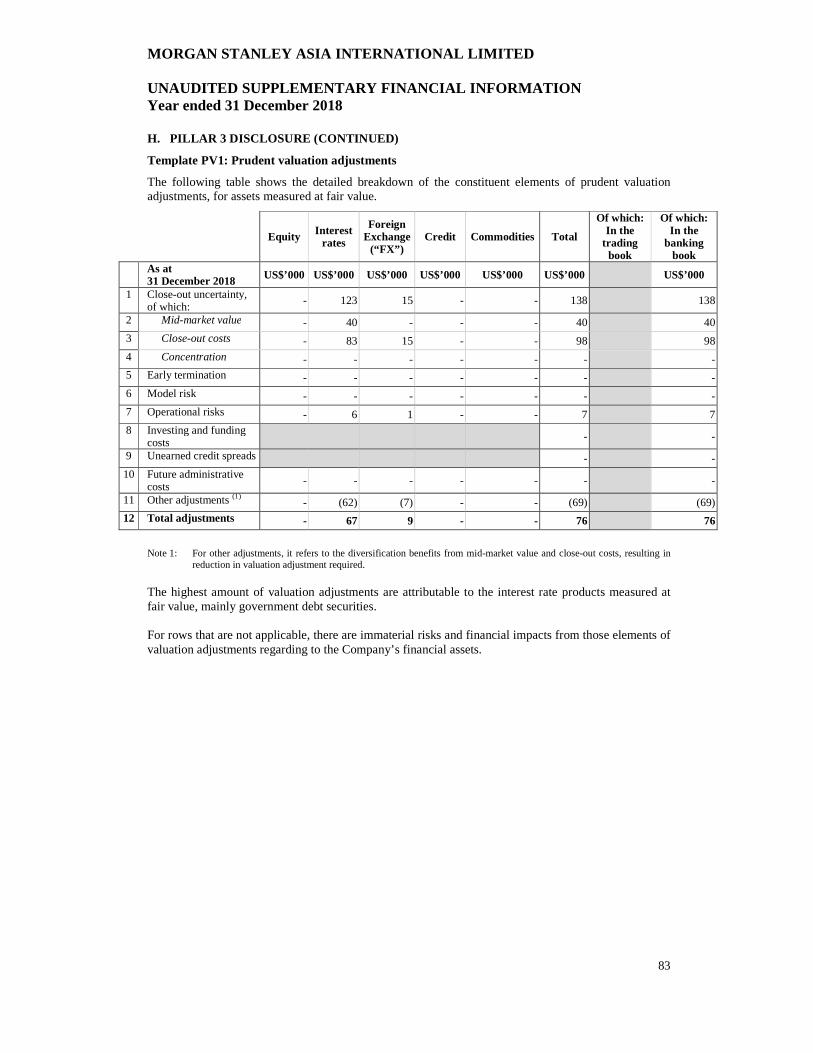
MORGAN STANLEY ASIA INTERNATIONAL LIMITED UNAUDITED SUPPLEMENTARY FINANCIAL INFORMATION Year ended 31 December 2018
83
H. PILLAR 3 DISCLOSURE (CONTINUED)
Template PV1: Prudent valuation adjustments
The following table shows the detailed breakdown of the constituent elements of prudent valuation adjustments, for assets measured at fair value.
Equity Interest rates
Foreign Exchange
(“FX”) Credit Commodities Total
Of which: In the
trading book
Of which: In the
banking book
As at 31 December 2018 US$’000 US$’000 US$’000 US$’000 US$’000 US$’000 US$’000
1 Close-out uncertainty, of which:
- 123 15 - - 138 138
2 Mid-market value - 40 - - - 40 40
3 Close-out costs - 83 15 - - 98 98
4 Concentration - - - - - - - 5 Early termination - - - - - - -
6 Model risk - - - - - - -
7 Operational risks - 6 1 - - 7 7
8 Investing and funding costs - -
9 Unearned credit spreads - -
10 Future administrative costs - - - - - - -
11 Other adjustments (1) - (62) (7) - - (69) (69) 12 Total adjustments - 67 9 - - 76 76
Note 1: For other adjustments, it refers to the diversification benefits from mid-market value and close-out costs, resulting in
reduction in valuation adjustment required. The highest amount of valuation adjustments are attributable to the interest rate products measured at fair value, mainly government debt securities. For rows that are not applicable, there are immaterial risks and financial impacts from those elements of valuation adjustments regarding to the Company’s financial assets.
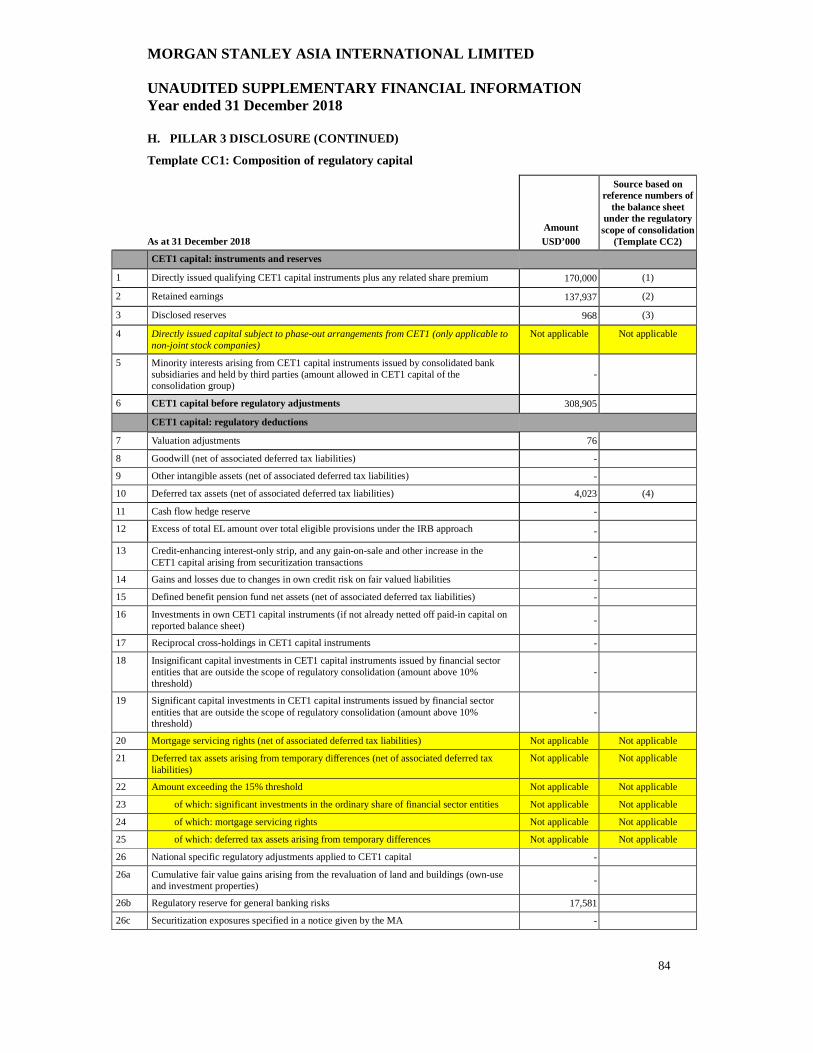
MORGAN STANLEY ASIA INTERNATIONAL LIMITED UNAUDITED SUPPLEMENTARY FINANCIAL INFORMATION Year ended 31 December 2018
84
H. PILLAR 3 DISCLOSURE (CONTINUED)
Template CC1: Composition of regulatory capital
As at 31 December 2018 Amount USD’000
Source based on reference numbers of
the balance sheet under the regulatory scope of consolidation
(Template CC2)
CET1 capital: instruments and reserves
1 Directly issued qualifying CET1 capital instruments plus any related share premium 170,000 (1)
2 Retained earnings 137,937 (2)
3 Disclosed reserves 968 (3)
4 Directly issued capital subject to phase-out arrangements from CET1 (only applicable to non-joint stock companies)
Not applicable Not applicable
5 Minority interests arising from CET1 capital instruments issued by consolidated bank subsidiaries and held by third parties (amount allowed in CET1 capital of the consolidation group)
-
6 CET1 capital before regulatory adjustments 308,905
CET1 capital: regulatory deductions
7 Valuation adjustments 76
8 Goodwill (net of associated deferred tax liabilities) -
9 Other intangible assets (net of associated deferred tax liabilities) -
10 Deferred tax assets (net of associated deferred tax liabilities) 4,023 (4)
11 Cash flow hedge reserve -
12 Excess of total EL amount over total eligible provisions under the IRB approach -
13 Credit-enhancing interest-only strip, and any gain-on-sale and other increase in the CET1 capital arising from securitization transactions
-
14 Gains and losses due to changes in own credit risk on fair valued liabilities -
15 Defined benefit pension fund net assets (net of associated deferred tax liabilities) -
16 Investments in own CET1 capital instruments (if not already netted off paid-in capital on reported balance sheet)
-
17 Reciprocal cross-holdings in CET1 capital instruments -
18 Insignificant capital investments in CET1 capital instruments issued by financial sector entities that are outside the scope of regulatory consolidation (amount above 10% threshold)
-
19 Significant capital investments in CET1 capital instruments issued by financial sector entities that are outside the scope of regulatory consolidation (amount above 10% threshold)
-
20 Mortgage servicing rights (net of associated deferred tax liabilities) Not applicable Not applicable
21 Deferred tax assets arising from temporary differences (net of associated deferred tax liabilities)
Not applicable Not applicable
22 Amount exceeding the 15% threshold Not applicable Not applicable
23 of which: significant investments in the ordinary share of financial sector entities Not applicable Not applicable
24 of which: mortgage servicing rights Not applicable Not applicable
25 of which: deferred tax assets arising from temporary differences Not applicable Not applicable
26 National specific regulatory adjustments applied to CET1 capital -
26a Cumulative fair value gains arising from the revaluation of land and buildings (own-use and investment properties)
-
26b Regulatory reserve for general banking risks 17,581
26c Securitization exposures specified in a notice given by the MA -

MORGAN STANLEY ASIA INTERNATIONAL LIMITED UNAUDITED SUPPLEMENTARY FINANCIAL INFORMATION Year ended 31 December 2018
85
H. PILLAR 3 DISCLOSURE (CONTINUED)
Template CC1: Composition of regulatory capital (continued)
As at 31 December 2018 Amount
USD’000
Source based on reference numbers of
the balance sheet under the regulatory scope of consolidation
(Template CC2)
26d Cumulative losses below depreciated cost arising from the institution's holdings of land and buildings
-
26e Capital shortfall of regulated non-bank subsidiaries -
26f Capital investment in a connected company which is a commercial entity (amount above 15% of the reporting institution's capital base)
-
27 Regulatory deductions applied to CET1 capital due to insufficient AT1 capital and Tier 2 capital to cover deductions
-
28 Total regulatory deductions to CET1 capital 21,680
29 CET1 capital 287,225
AT1 capital: instruments
30 Qualifying AT1 capital instruments plus any related share premium -
31 of which: classified as equity under applicable accounting standards -
32 of which: classified as liabilities under applicable accounting standards -
33 Capital instruments subject to phase-out arrangements from AT1 capital -
34 AT1 capital instruments issued by consolidated bank subsidiaries and held by third parties (amount allowed in AT1 capital of the consolidation group)
-
35 of which: AT1 capital instruments issued by subsidiaries subject to phase-out arrangements
-
36 AT1 capital before regulatory deductions -
AT1 capital: regulatory deductions
37 Investments in own AT1 capital instruments -
38 Reciprocal cross-holdings in AT1 capital instruments -
39 Insignificant capital investments in AT1 capital instruments issued by financial sector entities that are outside the scope of regulatory consolidation (amount above 10% threshold)
-
40 Significant capital investments in AT1 capital instruments issued by financial sector entities that are outside the scope of regulatory consolidation
-
41 National specific regulatory adjustments applied to AT1 capital -
42 Regulatory deductions applied to AT1 capital due to insufficient Tier 2 capital to cover deductions
-
43 Total regulatory deductions to AT1 capital -
44 AT1 capital -
45 Tier 1 capital (T1 = CET1 + AT1) 287,225
Tier 2 capital: instruments and provisions
46 Qualifying Tier 2 capital instruments plus any related share premium -
47 Capital instruments subject to phase-out arrangements from Tier 2 capital -
48 Tier 2 capital instruments issued by consolidated bank subsidiaries and held by third parties (amount allowed in Tier 2 capital of the consolidation group)
-
49 of which: capital instruments issued by subsidiaries subject to phase-out arrangements
-
50 Collective provisions and regulatory reserve for general banking risks eligible for inclusion in Tier 2 capital
8,492
51 Tier 2 capital before regulatory deductions 8,492

MORGAN STANLEY ASIA INTERNATIONAL LIMITED UNAUDITED SUPPLEMENTARY FINANCIAL INFORMATION Year ended 31 December 2018
86
H. PILLAR 3 DISCLOSURE (CONTINUED)
Template CC1: Composition of regulatory capital (continued)
As at 31 December 2018 Amount USD’000
Source based on reference numbers of
the balance sheet under the regulatory scope of consolidation
(Template CC2)
Tier 2 capital: regulatory deductions
52 Investments in own Tier 2 capital instruments -
53 Reciprocal cross-holdings in Tier 2 capital instruments -
54 Insignificant capital investments in Tier 2 capital instruments issued by financial sector entities that are outside the scope of regulatory consolidation (amount above 10% threshold)
-
55 Significant capital investments in Tier 2 capital instruments issued by financial sector entities that are outside the scope of regulatory consolidation (net of eligible short positions)
-
56 National specific regulatory adjustments applied to Tier 2 capital -
56a Add back of cumulative fair value gains arising from the revaluation of land and buildings (own-use and investment properties) eligible for inclusion in Tier 2 capital
-
57 Total regulatory adjustments to Tier 2 capital -
58 Tier 2 capital (T2) 8,492
59 Total regulatory capital (TC = T1 + T2) 295,717
60 Total RWA 1,135,987
Capital ratios (as a percentage of RWA)
61 CET1 capital ratio 25%
62 Tier 1 capital ratio 25%
63 Total capital ratio 26%
64 Institution-specific buffer requirement (capital conservation buffer plus countercyclical capital buffer plus higher loss absorbency requirements)
2.810%
65 of which: capital conservation buffer requirement 1.875%
66 of which: bank specific countercyclical capital buffer requirement 0.935%
67 of which: higher loss absorbency requirement 0%
68 CET1 (as a percentage of RWA) available after meeting minimum capital requirements 18%
National minima (if different from Basel 3 minimum)
69 National CET1 minimum ratio Not applicable Not applicable
70 National Tier 1 minimum ratio Not applicable Not applicable
71 National Total capital minimum ratio Not applicable Not applicable
Amounts below the thresholds for deduction (before risk weighting)
72 Insignificant capital investments in CET1, AT1 and Tier 2 capital instruments issued by financial sector entities that are outside the scope of regulatory consolidation
-
73 Significant capital investments in CET1 capital instruments issued by financial sector entities that are outside the scope of regulatory consolidation
-
74 Mortgage servicing rights (net of associated deferred tax liabilities) Not applicable Not applicable
75 Deferred tax assets arising from temporary differences (net of associated deferred tax liabilities)
Not applicable Not applicable
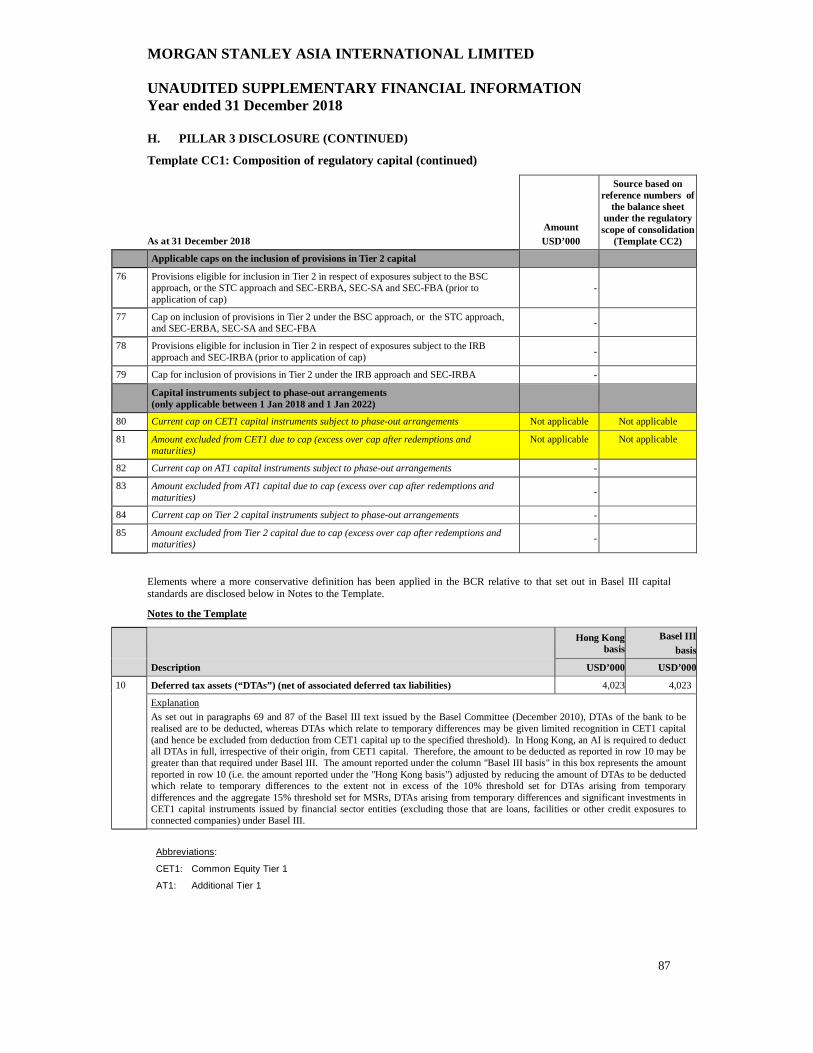
MORGAN STANLEY ASIA INTERNATIONAL LIMITED UNAUDITED SUPPLEMENTARY FINANCIAL INFORMATION Year ended 31 December 2018
87
H. PILLAR 3 DISCLOSURE (CONTINUED)
Template CC1: Composition of regulatory capital (continued)
As at 31 December 2018 Amount USD’000
Source based on reference numbers of
the balance sheet under the regulatory scope of consolidation
(Template CC2)
Applicable caps on the inclusion of provisions in Tier 2 capital
76 Provisions eligible for inclusion in Tier 2 in respect of exposures subject to the BSC approach, or the STC approach and SEC-ERBA, SEC-SA and SEC-FBA (prior to application of cap)
-
77 Cap on inclusion of provisions in Tier 2 under the BSC approach, or the STC approach, and SEC-ERBA, SEC-SA and SEC-FBA -
78 Provisions eligible for inclusion in Tier 2 in respect of exposures subject to the IRB approach and SEC-IRBA (prior to application of cap)
-
79 Cap for inclusion of provisions in Tier 2 under the IRB approach and SEC-IRBA -
Capital instruments subject to phase-out arrangements (only applicable between 1 Jan 2018 and 1 Jan 2022)
80 Current cap on CET1 capital instruments subject to phase-out arrangements Not applicable Not applicable
81 Amount excluded from CET1 due to cap (excess over cap after redemptions and maturities)
Not applicable Not applicable
82 Current cap on AT1 capital instruments subject to phase-out arrangements -
83 Amount excluded from AT1 capital due to cap (excess over cap after redemptions and maturities)
-
84 Current cap on Tier 2 capital instruments subject to phase-out arrangements -
85 Amount excluded from Tier 2 capital due to cap (excess over cap after redemptions and maturities)
-
Elements where a more conservative definition has been applied in the BCR relative to that set out in Basel III capital standards are disclosed below in Notes to the Template.
Notes to the Template
Hong Kong basis
Basel III basis
Description USD’000 USD’000
10 Deferred tax assets (“DTAs”) (net of associated deferred tax liabilities) 4,023 4,023
Explanation
As set out in paragraphs 69 and 87 of the Basel III text issued by the Basel Committee (December 2010), DTAs of the bank to be realised are to be deducted, whereas DTAs which relate to temporary differences may be given limited recognition in CET1 capital (and hence be excluded from deduction from CET1 capital up to the specified threshold). In Hong Kong, an AI is required to deduct all DTAs in full, irrespective of their origin, from CET1 capital. Therefore, the amount to be deducted as reported in row 10 may be greater than that required under Basel III. The amount reported under the column "Basel III basis" in this box represents the amount reported in row 10 (i.e. the amount reported under the "Hong Kong basis") adjusted by reducing the amount of DTAs to be deducted which relate to temporary differences to the extent not in excess of the 10% threshold set for DTAs arising from temporary differences and the aggregate 15% threshold set for MSRs, DTAs arising from temporary differences and significant investments in CET1 capital instruments issued by financial sector entities (excluding those that are loans, facilities or other credit exposures to connected companies) under Basel III.
Abbreviations:
CET1: Common Equity Tier 1
AT1: Additional Tier 1
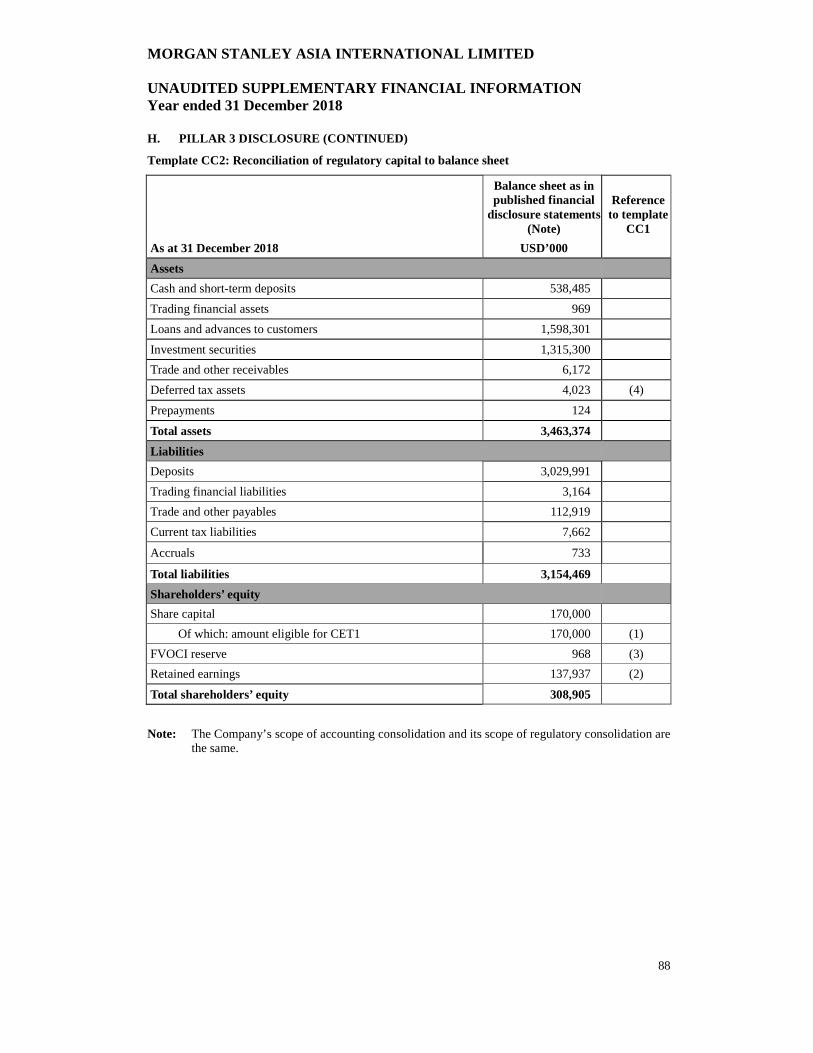
MORGAN STANLEY ASIA INTERNATIONAL LIMITED UNAUDITED SUPPLEMENTARY FINANCIAL INFORMATION Year ended 31 December 2018
88
H. PILLAR 3 DISCLOSURE (CONTINUED)
Template CC2: Reconciliation of regulatory capital to balance sheet
Balance sheet as in published financial
disclosure statements (Note)
Reference to template
CC1
As at 31 December 2018 USD’000
Assets
Cash and short-term deposits 538,485
Trading financial assets 969
Loans and advances to customers 1,598,301
Investment securities 1,315,300
Trade and other receivables 6,172
Deferred tax assets 4,023 (4)
Prepayments 124
Total assets 3,463,374
Liabilities
Deposits 3,029,991
Trading financial liabilities 3,164
Trade and other payables 112,919
Current tax liabilities 7,662
Accruals 733
Total liabilities 3,154,469
Shareholders’ equity
Share capital 170,000
Of which: amount eligible for CET1 170,000 (1)
FVOCI reserve 968 (3)
Retained earnings 137,937 (2)
Total shareholders’ equity 308,905
Note: The Company’s scope of accounting consolidation and its scope of regulatory consolidation are the same.

MORGAN STANLEY ASIA INTERNATIONAL LIMITED UNAUDITED SUPPLEMENTARY FINANCIAL INFORMATION Year ended 31 December 2018
89
H. PILLAR 3 DISCLOSURE (CONTINUED)
Table CCA: Main features of regulatory capital instruments
The following table shows the main features of outstanding capital instruments issued.
Quantitative / qualitative information
1 Issuer Morgan Stanley Asia International Limited
2 Unique identifier (e.g. CUSIP, ISIN or Bloomberg identifier for private placement) Not applicable
3 Governing law(s) of the instrument Hong Kong Law
Regulatory treatment
4 Transitional Basel III rules1 Not applicable
5 Post-transitional Basel III rules2 Common Equity Tier 1
6 Eligible at solo / group / solo and group Solo
7 Instrument type (types to be specified by each jurisdiction) Ordinary shares
8 Amount recognised in regulatory capital (currency in millions, as of most recent
reporting date) US$170 million
9 Par value of instrument Not applicable
10 Accounting classification Shareholders’ equity
11 Original date of issuance • 1 share issued on 19 May 2014 • 13,000,000 shares issued on 11 July 2014 • 156,999,998 shares issued on 13 January 2015 • 1 share issued on 9 February 2015
12 Perpetual or dated Perpetual
13 Original maturity date No maturity
14 Issuer call subject to prior supervisory approval No
15 Optional call date, contingent call dates and redemption amount Not applicable
16 Subsequent call dates, if applicable Not applicable
Coupons / dividends
17 Fixed or floating dividend / coupon Floating
18 Coupon rate and any related index Not applicable
19 Existence of a dividend stopper No
20 Fully discretionary, partially discretionary or mandatory Fully discretionary
21 Existence of step-up or other incentive to redeem No
22 Non-cumulative or cumulative Non-cumulative
23 Convertible or non-convertible Non-convertible
24 If convertible, conversion trigger(s) Not applicable
25 If convertible, fully or partially Not applicable
26 If convertible, conversion rate Not applicable
27 If convertible, mandatory or optional conversion Not applicable
28 If convertible, specify instrument type convertible into Not applicable
29 If convertible, specify issuer of instrument it converts into Not applicable
30 Write-down feature No
31 If write-down, write-down trigger(s) Not applicable
32 If write-down, full or partial Not applicable
33 If write-down, permanent or temporary Not applicable
34 If temporary write-down, description of write-up mechanism Not applicable
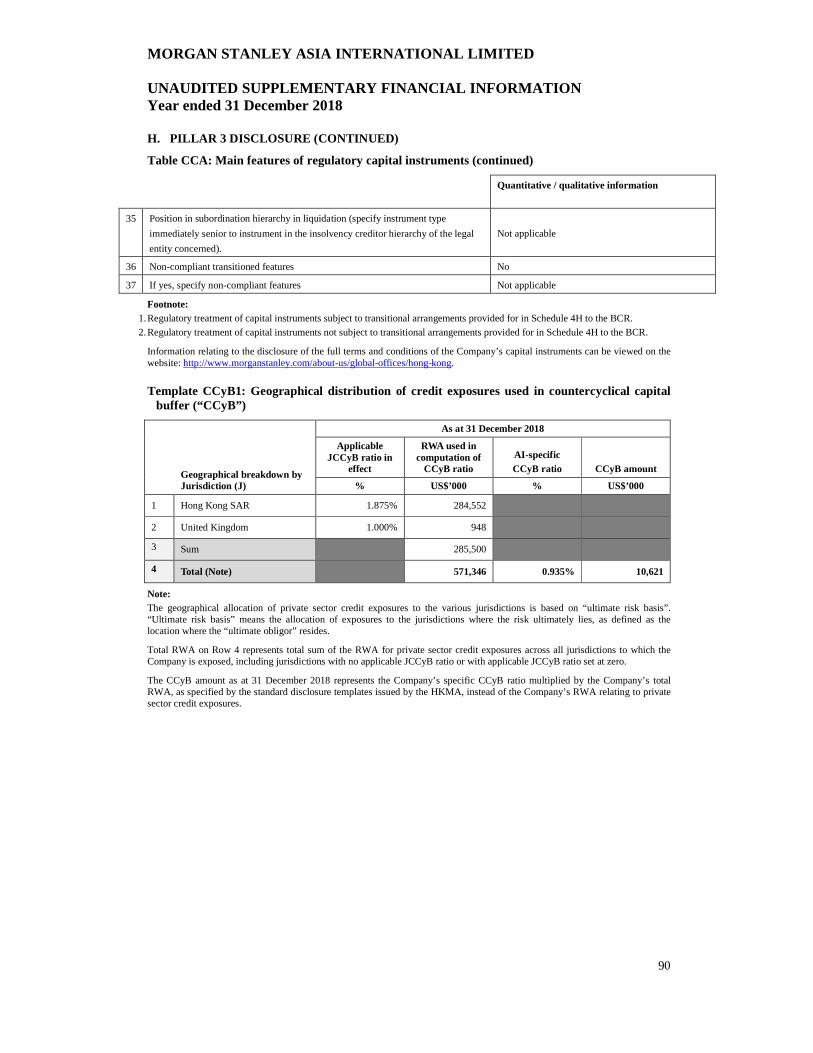
MORGAN STANLEY ASIA INTERNATIONAL LIMITED UNAUDITED SUPPLEMENTARY FINANCIAL INFORMATION Year ended 31 December 2018
90
H. PILLAR 3 DISCLOSURE (CONTINUED)
Table CCA: Main features of regulatory capital instruments (continued)
Quantitative / qualitative information
35 Position in subordination hierarchy in liquidation (specify instrument type
immediately senior to instrument in the insolvency creditor hierarchy of the legal
entity concerned).
Not applicable
36 Non-compliant transitioned features No
37 If yes, specify non-compliant features Not applicable
Footnote: 1. Regulatory treatment of capital instruments subject to transitional arrangements provided for in Schedule 4H to the BCR.
2. Regulatory treatment of capital instruments not subject to transitional arrangements provided for in Schedule 4H to the BCR.
Information relating to the disclosure of the full terms and conditions of the Company’s capital instruments can be viewed on the website: http://www.morganstanley.com/about-us/global-offices/hong-kong.
Template CCyB1: Geographical distribution of credit exposures used in countercyclical capital buffer (“CCyB”)
As at 31 December 2018
Geographical breakdown by Jurisdiction (J)
Applicable JCCyB ratio in
effect
RWA used in computation of
CCyB ratio AI-specific CCyB ratio CCyB amount
% US$’000 % US$’000
1 Hong Kong SAR 1.875% 284,552
2 United Kingdom 1.000% 948
3 Sum 285,500
4 Total (Note) 571,346 0.935% 10,621
Note: The geographical allocation of private sector credit exposures to the various jurisdictions is based on “ultimate risk basis”. “Ultimate risk basis” means the allocation of exposures to the jurisdictions where the risk ultimately lies, as defined as the location where the “ultimate obligor” resides.
Total RWA on Row 4 represents total sum of the RWA for private sector credit exposures across all jurisdictions to which the Company is exposed, including jurisdictions with no applicable JCCyB ratio or with applicable JCCyB ratio set at zero.
The CCyB amount as at 31 December 2018 represents the Company’s specific CCyB ratio multiplied by the Company’s total RWA, as specified by the standard disclosure templates issued by the HKMA, instead of the Company’s RWA relating to private sector credit exposures.
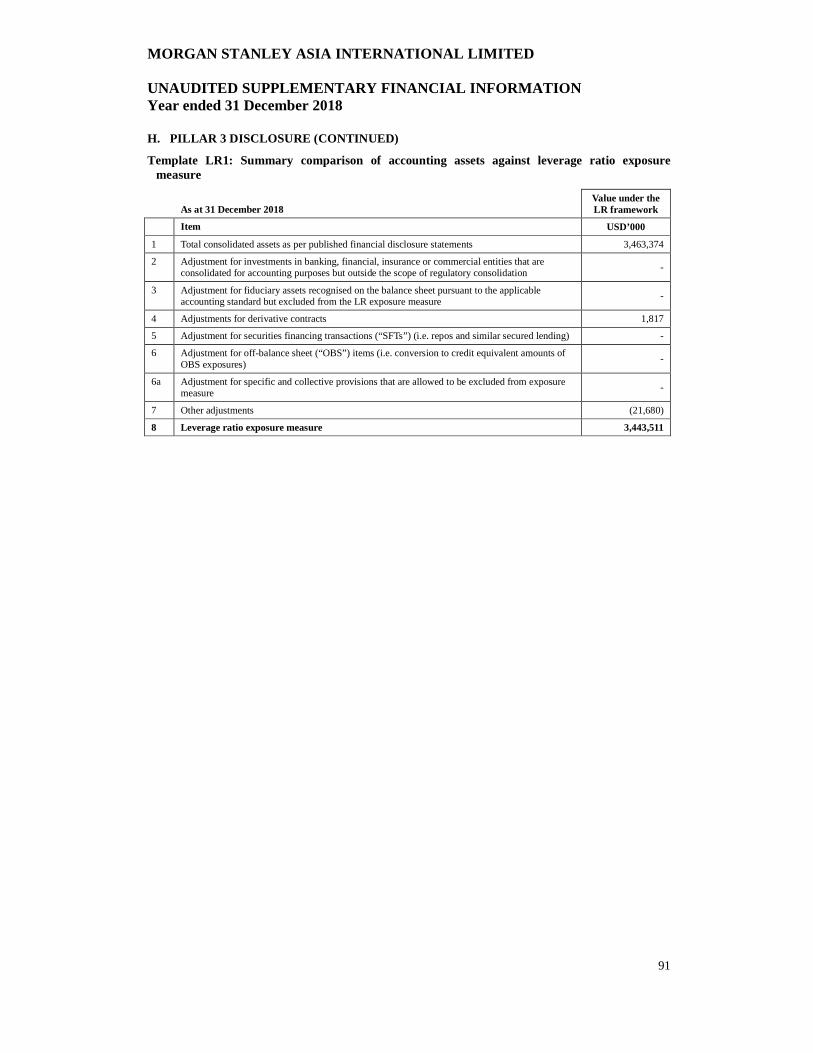
MORGAN STANLEY ASIA INTERNATIONAL LIMITED UNAUDITED SUPPLEMENTARY FINANCIAL INFORMATION Year ended 31 December 2018
91
H. PILLAR 3 DISCLOSURE (CONTINUED)
Template LR1: Summary comparison of accounting assets against leverage ratio exposure measure
As at 31 December 2018
Value under the LR framework
Item USD’000
1 Total consolidated assets as per published financial disclosure statements 3,463,374
2 Adjustment for investments in banking, financial, insurance or commercial entities that are consolidated for accounting purposes but outside the scope of regulatory consolidation
-
3 Adjustment for fiduciary assets recognised on the balance sheet pursuant to the applicable accounting standard but excluded from the LR exposure measure
-
4 Adjustments for derivative contracts 1,817
5 Adjustment for securities financing transactions (“SFTs”) (i.e. repos and similar secured lending) -
6 Adjustment for off-balance sheet (“OBS”) items (i.e. conversion to credit equivalent amounts of OBS exposures)
-
6a Adjustment for specific and collective provisions that are allowed to be excluded from exposure measure
-
7 Other adjustments (21,680)
8 Leverage ratio exposure measure 3,443,511

MORGAN STANLEY ASIA INTERNATIONAL LIMITED UNAUDITED SUPPLEMENTARY FINANCIAL INFORMATION Year ended 31 December 2018
92
H. PILLAR 3 DISCLOSURE (CONTINUED)
Template LR2: Leverage Ratio
As at
31 December 2018
As at 30 September
2018
USD’000 USD’000
On-balance sheet exposures
1 On-balance sheet exposures (excluding those arising from derivative contracts and SFTs, but including collateral)
3,462,405 3,881,324
2 Less: Asset amounts deducted in determining Tier 1 capital (21,680) (22,177)
3 Total on-balance sheet exposures (excluding derivative contracts and SFTs) 3,440,725 3,859,147
Exposures arising from derivative contracts
4 Replacement cost associated with all derivative contracts (where applicable net of eligible cash variation margin and/or with bilateral netting)
- 1,239
5 Add-on amounts for potential future exposure (“PFE”) associated with all derivative contracts
2,786 7,354
6 Gross-up for derivatives collateral provided where deducted from the balance sheet assets pursuant to the applicable accounting framework
- -
7 Less: Deductions of receivables assets for cash variation margin provided under derivative contracts
- -
8 Less: Exempted Central Counterparty (“CCP”) leg of client-cleared trade exposures
- -
9 Adjusted effective notional amount of written credit derivative contracts - -
10 Less: Adjusted effective notional offsets and add-on deductions for written credit derivative contracts
- -
11 Total exposures arising from derivative contracts 2,786 8,593
Exposures arising from SFTs
12 Gross SFT assets (with no recognition of netting), after adjusting for sale accounting transactions
- -
13 Less: Netted amounts of cash payables and cash receivables of gross SFT assets - -
14 Counterparty Credit Risk (“CCR”) exposure for SFT assets - -
15 Agent transaction exposures - -
16 Total exposures arising from SFTs - -
Other off-balance sheet exposures
17 Off-balance sheet exposure at gross notional amount - -
18 Less: Adjustments for conversion to credit equivalent amounts - -
19 Off-balance sheet items - -
Capital and total exposures
20 Tier 1 capital 287,225 273,366
20a Total exposures before adjustments for specific and collective provisions 3,443,511 3,867,740
20b Adjustments for specific and collective provisions - -
21 Total exposures after adjustments for specific and collective provisions 3,443,511 3,867,740
Leverage ratio
22 Leverage ratio 8.34% 7.07%
The increase in leverage ratio during the period is mainly due to (a) an increase in Tier 1 capital attributed to the profit retained for the quarter ended 31 December 2018 and (b) decrease in total on-balance sheet exposures mainly due to decrease in deposits of non-bank customers during the quarter ended 31 December 2018.
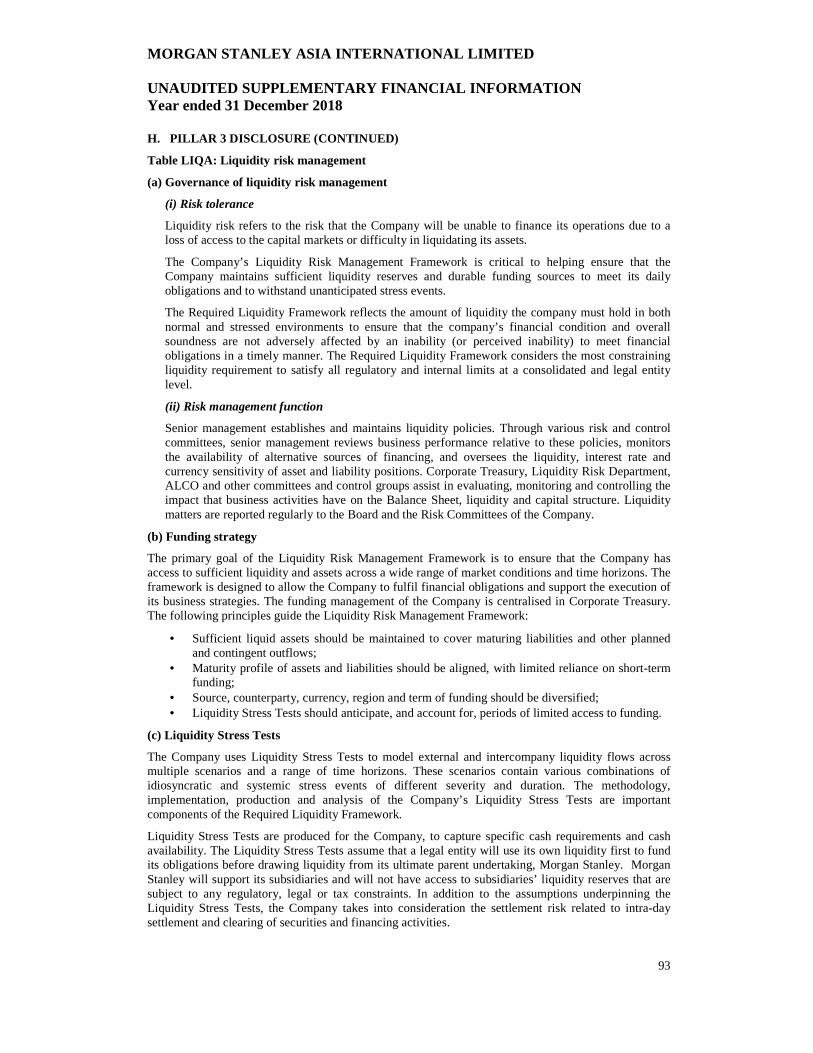
MORGAN STANLEY ASIA INTERNATIONAL LIMITED UNAUDITED SUPPLEMENTARY FINANCIAL INFORMATION Year ended 31 December 2018
93
H. PILLAR 3 DISCLOSURE (CONTINUED)
Table LIQA: Liquidity risk management
(a) Governance of liquidity risk management
(i) Risk tolerance
Liquidity risk refers to the risk that the Company will be unable to finance its operations due to a loss of access to the capital markets or difficulty in liquidating its assets.
The Company’s Liquidity Risk Management Framework is critical to helping ensure that the Company maintains sufficient liquidity reserves and durable funding sources to meet its daily obligations and to withstand unanticipated stress events.
The Required Liquidity Framework reflects the amount of liquidity the company must hold in both normal and stressed environments to ensure that the company’s financial condition and overall soundness are not adversely affected by an inability (or perceived inability) to meet financial obligations in a timely manner. The Required Liquidity Framework considers the most constraining liquidity requirement to satisfy all regulatory and internal limits at a consolidated and legal entity level.
(ii) Risk management function
Senior management establishes and maintains liquidity policies. Through various risk and control committees, senior management reviews business performance relative to these policies, monitors the availability of alternative sources of financing, and oversees the liquidity, interest rate and currency sensitivity of asset and liability positions. Corporate Treasury, Liquidity Risk Department, ALCO and other committees and control groups assist in evaluating, monitoring and controlling the impact that business activities have on the Balance Sheet, liquidity and capital structure. Liquidity matters are reported regularly to the Board and the Risk Committees of the Company.
(b) Funding strategy
The primary goal of the Liquidity Risk Management Framework is to ensure that the Company has access to sufficient liquidity and assets across a wide range of market conditions and time horizons. The framework is designed to allow the Company to fulfil financial obligations and support the execution of its business strategies. The funding management of the Company is centralised in Corporate Treasury. The following principles guide the Liquidity Risk Management Framework:
• Sufficient liquid assets should be maintained to cover maturing liabilities and other planned and contingent outflows;
• Maturity profile of assets and liabilities should be aligned, with limited reliance on short-term funding;
• Source, counterparty, currency, region and term of funding should be diversified; • Liquidity Stress Tests should anticipate, and account for, periods of limited access to funding.
(c) Liquidity Stress Tests
The Company uses Liquidity Stress Tests to model external and intercompany liquidity flows across multiple scenarios and a range of time horizons. These scenarios contain various combinations of idiosyncratic and systemic stress events of different severity and duration. The methodology, implementation, production and analysis of the Company’s Liquidity Stress Tests are important components of the Required Liquidity Framework.
Liquidity Stress Tests are produced for the Company, to capture specific cash requirements and cash availability. The Liquidity Stress Tests assume that a legal entity will use its own liquidity first to fund its obligations before drawing liquidity from its ultimate parent undertaking, Morgan Stanley. Morgan Stanley will support its subsidiaries and will not have access to subsidiaries’ liquidity reserves that are subject to any regulatory, legal or tax constraints. In addition to the assumptions underpinning the Liquidity Stress Tests, the Company takes into consideration the settlement risk related to intra-day settlement and clearing of securities and financing activities.
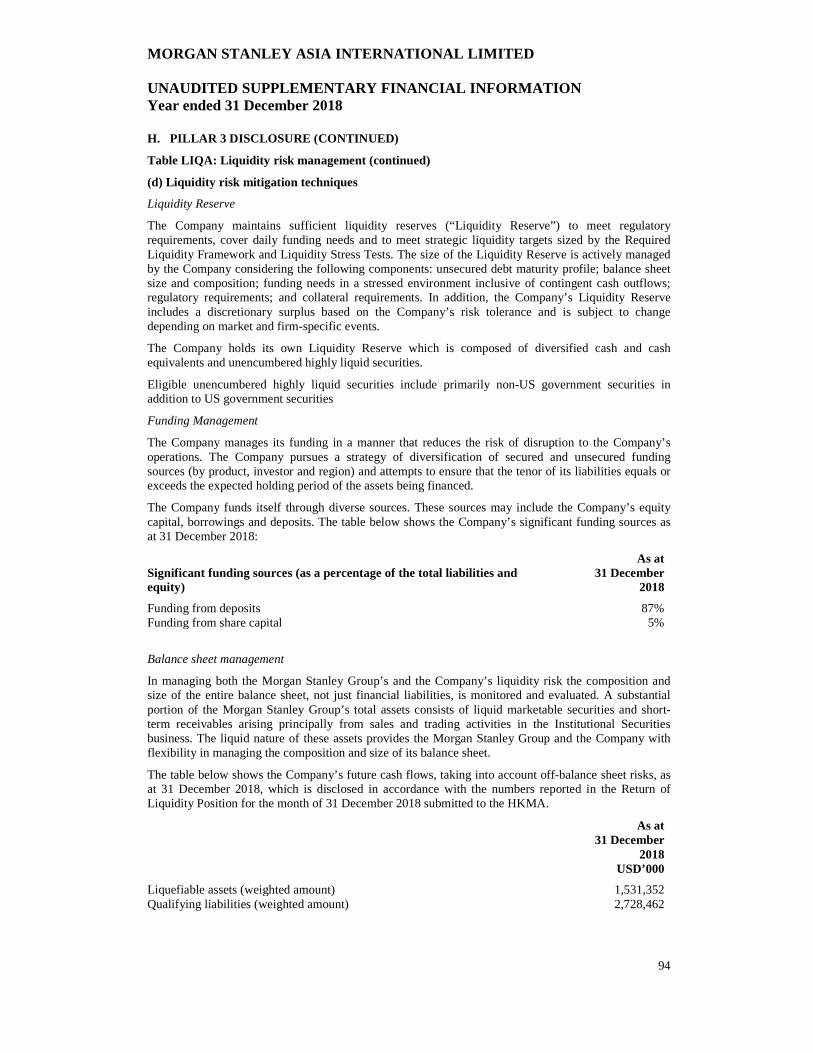
MORGAN STANLEY ASIA INTERNATIONAL LIMITED UNAUDITED SUPPLEMENTARY FINANCIAL INFORMATION Year ended 31 December 2018
94
H. PILLAR 3 DISCLOSURE (CONTINUED)
Table LIQA: Liquidity risk management (continued)
(d) Liquidity risk mitigation techniques
Liquidity Reserve
The Company maintains sufficient liquidity reserves (“Liquidity Reserve”) to meet regulatory requirements, cover daily funding needs and to meet strategic liquidity targets sized by the Required Liquidity Framework and Liquidity Stress Tests. The size of the Liquidity Reserve is actively managed by the Company considering the following components: unsecured debt maturity profile; balance sheet size and composition; funding needs in a stressed environment inclusive of contingent cash outflows; regulatory requirements; and collateral requirements. In addition, the Company’s Liquidity Reserve includes a discretionary surplus based on the Company’s risk tolerance and is subject to change depending on market and firm-specific events.
The Company holds its own Liquidity Reserve which is composed of diversified cash and cash equivalents and unencumbered highly liquid securities.
Eligible unencumbered highly liquid securities include primarily non-US government securities in addition to US government securities
Funding Management
The Company manages its funding in a manner that reduces the risk of disruption to the Company’s operations. The Company pursues a strategy of diversification of secured and unsecured funding sources (by product, investor and region) and attempts to ensure that the tenor of its liabilities equals or exceeds the expected holding period of the assets being financed.
The Company funds itself through diverse sources. These sources may include the Company’s equity capital, borrowings and deposits. The table below shows the Company’s significant funding sources as at 31 December 2018:
Significant funding sources (as a percentage of the total liabilities and equity)
As at 31 December
2018 Funding from deposits 87% Funding from share capital 5%
Balance sheet management
In managing both the Morgan Stanley Group’s and the Company’s liquidity risk the composition and size of the entire balance sheet, not just financial liabilities, is monitored and evaluated. A substantial portion of the Morgan Stanley Group’s total assets consists of liquid marketable securities and short-term receivables arising principally from sales and trading activities in the Institutional Securities business. The liquid nature of these assets provides the Morgan Stanley Group and the Company with flexibility in managing the composition and size of its balance sheet.
The table below shows the Company’s future cash flows, taking into account off-balance sheet risks, as at 31 December 2018, which is disclosed in accordance with the numbers reported in the Return of Liquidity Position for the month of 31 December 2018 submitted to the HKMA.
As at 31 December
2018 USD’000 Liquefiable assets (weighted amount) 1,531,352 Qualifying liabilities (weighted amount) 2,728,462
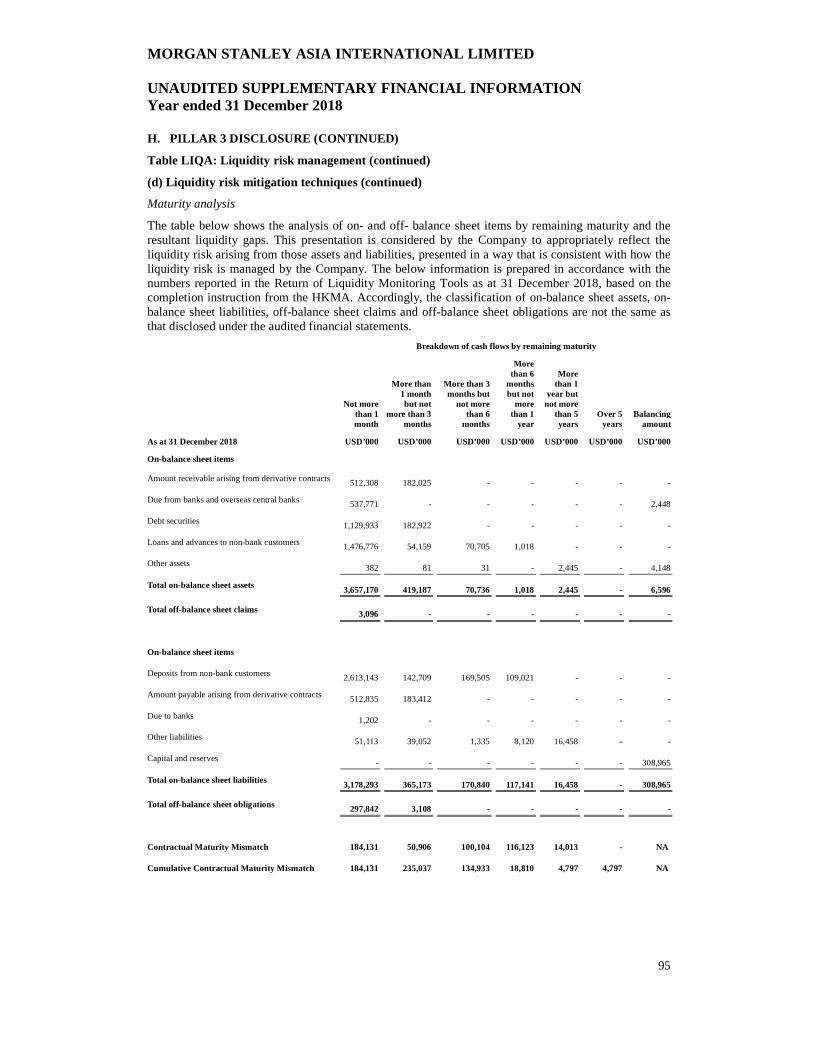
MORGAN STANLEY ASIA INTERNATIONAL LIMITED UNAUDITED SUPPLEMENTARY FINANCIAL INFORMATION Year ended 31 December 2018
95
H. PILLAR 3 DISCLOSURE (CONTINUED)
Table LIQA: Liquidity risk management (continued)
(d) Liquidity risk mitigation techniques (continued)
Maturity analysis
The table below shows the analysis of on- and off- balance sheet items by remaining maturity and the resultant liquidity gaps. This presentation is considered by the Company to appropriately reflect the liquidity risk arising from those assets and liabilities, presented in a way that is consistent with how the liquidity risk is managed by the Company. The below information is prepared in accordance with the numbers reported in the Return of Liquidity Monitoring Tools as at 31 December 2018, based on the completion instruction from the HKMA. Accordingly, the classification of on-balance sheet assets, on-balance sheet liabilities, off-balance sheet claims and off-balance sheet obligations are not the same as that disclosed under the audited financial statements.
Breakdown of cash flows by remaining maturity
Not more than 1 month
More than 1 month but not
more than 3 months
More than 3 months but
not more than 6
months
More than 6
months but not
more than 1
year
More
than 1 year but not more
than 5 years
Over 5 years
Balancing amount
As at 31 December 2018 USD’000 USD’000 USD’000 USD’000 USD’000 USD’000 USD’000 On-balance sheet items
Amount receivable arising from derivative contracts
512,308
182,025
-
-
-
-
-
Due from banks and overseas central banks
537,771
-
-
-
-
-
2,448
Debt securities
1,129,933
182,922
-
-
-
-
-
Loans and advances to non-bank customers
1,476,776
54,159
70,705
1,018
-
-
-
Other assets
382
81
31
-
2,445
-
4,148
Total on-balance sheet assets
3,657,170
419,187
70,736
1,018
2,445
-
6,596 Total off-balance sheet claims
3,096
-
-
-
-
-
-
On-balance sheet items
Deposits from non-bank customers
2,613,143
142,709
169,505
109,021
-
-
-
Amount payable arising from derivative contracts
512,835
183,412
-
-
-
-
-
Due to banks
1,202
-
-
-
-
-
-
Other liabilities
51,113
39,052
1,335
8,120
16,458
-
-
Capital and reserves
-
-
-
-
-
-
308,965
Total on-balance sheet liabilities
3,178,293
365,173
170,840
117,141
16,458
-
308,965 Total off-balance sheet obligations
297,842
3,108
-
-
-
-
-
Contractual Maturity Mismatch 184,131 50,906 100,104 116,123 14,013 - NA
Cumulative Contractual Maturity Mismatch 184,131 235,037 134,933 18,810 4,797 4,797 NA

MORGAN STANLEY ASIA INTERNATIONAL LIMITED UNAUDITED SUPPLEMENTARY FINANCIAL INFORMATION Year ended 31 December 2018
96
H. PILLAR 3 DISCLOSURE (CONTINUED)
Table LIQA: Liquidity risk management (continued)
(e) Contingency funding plan
The Company has developed a Liquidity Stress Event Playbook (the “Playbook”) that captures the governance, liquidity management tools for event identification, and processes for Playbook activation and de-activation during liquidity stress events for the Company. The Playbook documents the Company’s systematic approach to accessing available liquidity sources, in addition to those used for day to day operations, to meet its obligations and maintain operational services during a liquidity stress event.
The Playbook supports the existing liquidity risk management framework and defines processes for:
• Identification through quantitative measures of a potential or actual liquidity stress event; • Definition of roles and responsibilities for playbook activation and execution; • Coordination and communication in response to liquidity shortfalls; • Identification of available contingent liquidity sources; • Return to standard operating liquidity management status, and post-event analysis.
MORGAN STANLEY ASIA INTERNATIONAL LIMITED UNAUDITED SUPPLEMENTARY FINANCIAL INFORMATION Year ended 31 December 2018
97
H. PILLAR 3 DISCLOSURE (CONTINUED)
Table CRA: General information about credit risk
Overview
Credit risk refers to the risk of loss arising when a borrower, counterparty or issuer does not meet its financial obligations to the Company.
The Company incurs credit risk primarily in the Wealth Management business through margin loans to its clients. Margin loans are asset-based in nature secured by mostly cash and marketable securities held with the Company as collateral. Credit risk from the margin loan portfolio is largely mitigated by the quality of the collateral held under a conservative margin policy.
The Company also incurs credit risk through a variety of treasury activities from: (i) bank exposures with respect to agent banks and securities purchased under agreements to resell; and (ii) sovereign exposures from government debt securities. The credit risk of these activities is mitigated by high credit quality of bank counterparties and the sovereign entities.
Credit Risk Management
The Company’s credit risk management policies and procedures establish the framework for identifying, measuring, monitoring and controlling credit risk while ensuring transparency of material credit risks, compliance with established limits and escalating risk concentrations to appropriate senior management and the Board of Directors. A Credit Limits Framework is utilised to manage credit risk levels across the Company. The Credit Limits Framework is calibrated within the Company’s risk appetite and includes stress loss, product, collateral concentration, correlated collateral, single-name, regulatory and connected lending limits.
The Company executes oversight of credit risk management through three lines of defense. The Company believes this structure creates clear delineation of responsibilities and facilitates effective implementation of the control framework.
(i) Business Unit – the first line of defense with decentralised ownership and business management accountability.
(ii) Credit Risk Management Department (“CRM”) – the second line of defense providing independent risk oversight and challenges.
(iii) Internal Audit Department (“IAD”) – the third line of defense independently assessing the Company’s operating and control environment and control processes.
Credit risk exposure is actively managed by business unit, CRM and senior management. A variety of credit risk reports are distributed daily to business unit and CRM, monthly to Credit and Market Risk Committee and Bank Risk Committee where membership includes senior management, and quarterly to Board Risk Committee and the Board of Directors.
Details of the Financial Risk Managements are further detailed in note 24 to the audited financial statements, and Table OVA of the Unaudited Supplementary Financial Information.

MORGAN STANLEY ASIA INTERNATIONAL LIMITED UNAUDITED SUPPLEMENTARY FINANCIAL INFORMATION Year ended 31 December 2018
98
H. PILLAR 3 DISCLOSURE (CONTINUED)
Template CR1: Credit quality of exposures
Gross carrying amounts of Allowances / impairments Net values
Defaulted exposures
Non-defaulted exposures
As at 31 December 2018
USD’000 USD’000 USD’000 USD’000
1 Loans - 1,602,663 - 1,602,663
2 Debt securities - 1,315,300 - 1,315,300
3 Off-balance sheet exposures
- - - -
4 Total - 2,917,963 - 2,917,963 Loans included loans and advances to customers and related accrued interest receivables.

MORGAN STANLEY ASIA INTERNATIONAL LIMITED UNAUDITED SUPPLEMENTARY FINANCIAL INFORMATION Year ended 31 December 2018
99
H. PILLAR 3 DISCLOSURE (CONTINUED)
Table CRB: Additional disclosure related to credit quality of exposures
A financial asset is considered past due when a counterparty has failed to make a payment when contractually due.
A financial asset is considered impaired if there is objective evidence of impairment resulting from an event occurring which will have an adverse impact on expected future cash flows of an asset and the expected impact can be reliably estimated.
For details of methods adopted for determining impairments, please refer to the note 3(f) and 24 to the audited financial statements.
As at 31 December 2018, the Company had no impaired exposures and no exposure which is past due for more than 90 days but is not impaired.
Restructured exposures refer to assets that have been restructured and renegotiated between the Company and the counterparties because of a deterioration in the financial position of the counterparties or of the inability of the counterparties to meet the original repayment schedule and for which the revised repayment terms, either of interest or of repayment period, are non-commercial to the Company. As at 31 December 2018, the Company had no restructured exposures.
The following tables show the breakdown of the Company’s exposures by geographical areas, industry and residual maturity as at 31 December 2018. These amounts do not include the effects of recognised credit risk mitigation.
2018 Exposures by geographical areas US$’000 Hong Kong 839,492 Singapore 485,090 Others (1) 2,134,236
Total 3,458,818
2018 Exposures by industry US$’000 Industrial, commercial and financial 1,311,407 Individuals 291,114 Others (1) 1,856,297
Total 3,458,818
2018 Exposures by residual maturity US$’000 Less than 1 year 2,863,822 Between 1 and 5 years 594,996
Total 3,458,818
Note (1): Any segment which constitutes less than 10% of the Company’s total RWA for credit risk (after taking into account of any recognised credit risk mitigation) is not separately disclosed and grouped on an aggregated basis under the category “others”.

MORGAN STANLEY ASIA INTERNATIONAL LIMITED UNAUDITED SUPPLEMENTARY FINANCIAL INFORMATION Year ended 31 December 2018
100
H. PILLAR 3 DISCLOSURE (CONTINUED)
Table CRC: Qualitative disclosures related to credit risk mitigation
In order to manage credit exposure arising from its business activities, the Company applies various credit risk management policies and procedures, see note 24 to the audited financial statements for further details.
The Company’s primary method of mitigating credit risk is the use of eligible collateral for the margin loan portfolio. Eligible collaterals include cash, marketable securities and other investment products. Majority of the Company’s collaterals are cash and marketable securities, including equity securities, bonds and mutual funds, where collateral values are being revaluated daily.
The Company maintains policies and procedures related to collateral management. It applies a conservative margin policy to ensure with a high degree of confidence that claims can be repaid in full through the liquidation of assets in the client portfolio securing the exposure.
The Company enters into valid bilateral netting agreements with Morgan Stanley affiliates which satisfied the conditions set out under section 2 of the Banking (Capital) Rules for recognised netting. As at 31 December 2018, minimal recognised netting is applied for both on- and off-balance sheet exposures.
Template CR3: Overview of recognised credit risk mitigation
Exposures unsecured: carrying amount(1)
Exposures to be
secured
Exposures secured by recognised collateral
Exposures secured by recognised guarantees
Exposures secured by recognised
credit derivative contracts
As at 31 December 2018
US$’000 US$’000 US$’000 US$’000 US$’000
1 Loans 571,071 1,031,592 1,031,592 - - 2 Debt securities 1,315,300 - - - - 3 Total 1,886,371 1,031,592 1,031,592 - - 4 Of which defaulted - - - - - Loans included loans and advances to customers and related accrued interest receivables. Note (1): All exposures arising from loans are fully secured by collateral as at 31 December 2018. Unsecured exposures
disclosed in the above table are either because the relevant collateral is not considered as recognised collateral, or the carrying amount of such recognised collateral is subject to standard supervisory haircut in accordance with the Banking (Capital) Rules.
Table CRD: Qualitative disclosures on use of ECAI ratings under STC approach
The Company uses the STC approach to calculate its credit risk.
Standard & Poor’s Rating Services, Moody’s Investors Service and Fitch Ratings are the external credit assessment institutions (the “ECAIs”) that the Company used to determine the risk weight of the exposure classes, including sovereign, bank, securities firm, corporate and other exposures which are not past due exposures. The Company follows the process as prescribed in Part 4 of the Banking (Capital) Rules to map ECAI issuer ratings to exposures booked in its banking book.
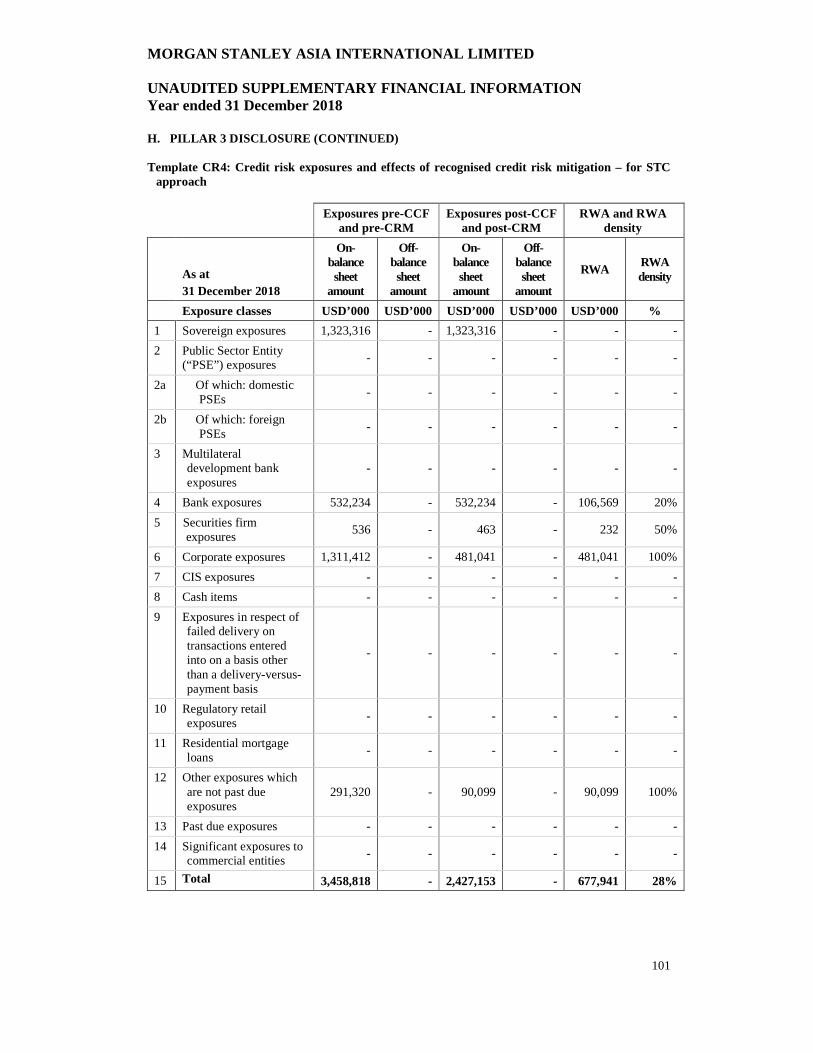
MORGAN STANLEY ASIA INTERNATIONAL LIMITED UNAUDITED SUPPLEMENTARY FINANCIAL INFORMATION Year ended 31 December 2018
101
H. PILLAR 3 DISCLOSURE (CONTINUED)
Template CR4: Credit risk exposures and effects of recognised credit risk mitigation – for STC approach
Exposures pre-CCF
and pre-CRM Exposures post-CCF
and post-CRM RWA and RWA
density
As at 31 December 2018
On-balance sheet
amount
Off-balance sheet
amount
On-balance sheet
amount
Off-balance sheet
amount
RWA RWA density
Exposure classes USD’000 USD’000 USD’000 USD’000 USD’000 %
1 Sovereign exposures 1,323,316 - 1,323,316 - - -
2 Public Sector Entity (“PSE”) exposures
- - - - - -
2a Of which: domestic PSEs
- - - - - -
2b Of which: foreign PSEs
- - - - - -
3 Multilateral development bank exposures
- - - - - -
4 Bank exposures 532,234 - 532,234 - 106,569 20%
5 Securities firm exposures
536 - 463 - 232 50%
6 Corporate exposures 1,311,412 - 481,041 - 481,041 100%
7 CIS exposures - - - - - -
8 Cash items - - - - - -
9 Exposures in respect of failed delivery on transactions entered into on a basis other than a delivery-versus-payment basis
- - - - - -
10 Regulatory retail exposures
- - - - - -
11 Residential mortgage loans
- - - - - -
12 Other exposures which are not past due exposures
291,320 - 90,099 - 90,099 100%
13 Past due exposures - - - - - -
14 Significant exposures to commercial entities
- - - - - -
15 Total 3,458,818 - 2,427,153 - 677,941 28%
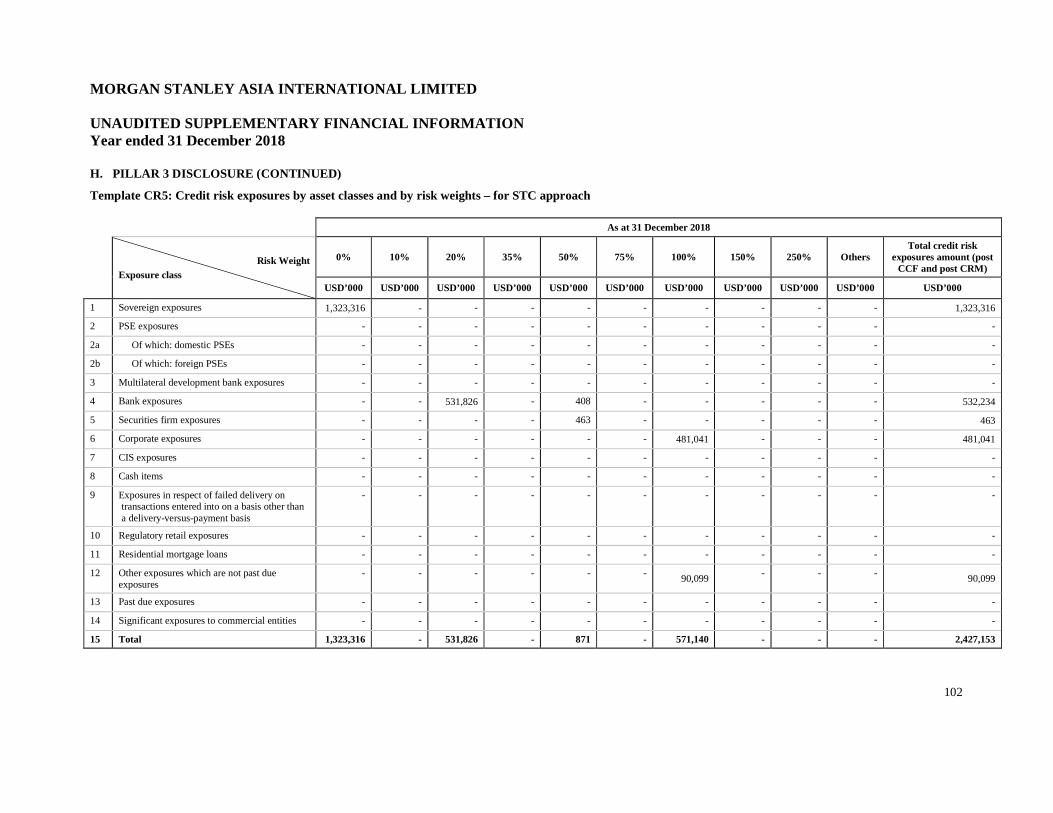
MORGAN STANLEY ASIA INTERNATIONAL LIMITED UNAUDITED SUPPLEMENTARY FINANCIAL INFORMATION Year ended 31 December 2018
102
H. PILLAR 3 DISCLOSURE (CONTINUED)
Template CR5: Credit risk exposures by asset classes and by risk weights – for STC approach
As at 31 December 2018
Risk Weight Exposure class
0% 10% 20% 35% 50% 75% 100% 150% 250% Others Total credit risk
exposures amount (post CCF and post CRM)
USD’000 USD’000 USD’000 USD’000 USD’000 USD’000 USD’000 USD’000 USD’000 USD’000 USD’000
1 Sovereign exposures 1,323,316 - - - - - - - - - 1,323,316
2 PSE exposures - - - - - - - - - - -
2a Of which: domestic PSEs - - - - - - - - - - -
2b Of which: foreign PSEs - - - - - - - - - - -
3 Multilateral development bank exposures - - - - - - - - - - -
4 Bank exposures - - 531,826 - 408 - - - - - 532,234
5 Securities firm exposures - - - - 463 - - - - - 463
6 Corporate exposures - - - - - - 481,041 - - - 481,041
7 CIS exposures - - - - - - - - - - -
8 Cash items - - - - - - - - - - -
9 Exposures in respect of failed delivery on transactions entered into on a basis other than a delivery-versus-payment basis
- - - - - - - - - - -
10 Regulatory retail exposures - - - - - - - - - - -
11 Residential mortgage loans - - - - - - - - - - -
12 Other exposures which are not past due exposures
- - - - - - 90,099 - - - 90,099
13 Past due exposures - - - - - - - - - - -
14 Significant exposures to commercial entities - - - - - - - - - - -
15 Total 1,323,316 - 531,826 - 871 - 571,140 - - - 2,427,153

MORGAN STANLEY ASIA INTERNATIONAL LIMITED UNAUDITED SUPPLEMENTARY FINANCIAL INFORMATION Year ended 31 December 2018
103
H. PILLAR 3 DISCLOSURE (CONTINUED)
Table CCRA: Qualitative disclosures related to counterparty credit risk (including those arising from clearing through CCPs)
Counterparty credit risk refers to the risk of loss associated with the failure by one or more sales and trading counterparties to perform against its contractual obligations. The Company’s counterparty credit risk arises from securities purchased under agreements to resell with external counterparties and derivative transactions with Morgan Stanley affiliates in relation to treasury activities. Counterparty credit exposure is managed by eligible collateral with daily margining between the Company and counterparties and the collateral requirement is not linked to credit rating. Given the nature of such transactions, there is no general wrong-way-risk and specific wrong-way risk. Operating limits in relation to exposures arising from the derivative transactions with Morgan Stanley affiliates are set as a percentage of the Company’s capital based on historical usage of such activities.
Details of such transactions are further detailed in note 24 and note 26 to the audited financial statements.
Template CCR1: Analysis of counterparty default risk exposures (other than those to CCPs) by approaches
Replacement
cost (RC) PFE
Effective EPE
Alpha (α) used for
computing default risk exposure
Default risk
exposure after CRM
RWA
As at 31 December 2018 US$’000 US$’000 US$’000 US$’000 US$’000 US$’000
1 SA-CCR (for derivative contracts)
Not applicable
1a CEM - 2,786 1 2,786 1,393
2 IMM (CCR) approach - - - -
3 Simple Approach (for SFTs) - -
4 Comprehensive Approach (for SFTs)
- -
5 Value-at-risk (“VaR”) (for SFTs)
- -
6 Total 1,393 Template CCR2: CVA capital charge
Exposure at default (“EAD”)
post CRM RWA
As at 31 December 2018 US$’000 US$’000
Netting sets for which CVA capital charge is calculated by the advanced CVA method
- -
1 (i) VaR (after application of multiplication factor if applicable) -
2 (ii) Stressed VaR (after application of multiplication factor if applicable)
-
3 Netting sets for which CVA capital charge is calculated by the standardised CVA method
2,786 634
4 Total 2,786 634

MORGAN STANLEY ASIA INTERNATIONAL LIMITED UNAUDITED SUPPLEMENTARY FINANCIAL INFORMATION Year ended 31 December 2018
104
H. PILLAR 3 DISCLOSURE (CONTINUED)
Template CCR3: Counterparty default risk exposures (other than those to CCPs) by asset classes and by risk weights – for STC approach As at 31 December 2018
Risk Weight Exposure class
0% 10% 20% 35% 50% 75% 100% 150% 250% Others
Total default risk exposure
after CRM
US$ ’000
US$ ’000
US$ ’000
US$ ’000
US$ ’000
US$ ’000
US$ ’000
US$ ’000
US$ ’000
US$ ’000
US$ ’000
1 Sovereign exposures - - - - - - - - - - -
2 PSE exposures - - - - - - - - - - -
2a Of which: domestic PSEs - - - - - - - - - - -
2b Of which: foreign PSEs - - - - - - - - - - -
3 Multilateral development bank exposures
- - - - - - - - - - -
4 Bank exposures - - - - 2,786 - - - - - 2,786
5 Securities firm exposures - - - - - - - - - - -
6 Corporate exposures - - - - - - - - - - -
7 CIS exposures - - - - - - - - - - -
8 Regulatory retail exposures - - - - - - - - - - -
9 Residential mortgage loans - - - - - - - - - - -
10 Other exposures which are not past due exposures
- - - - - - - - - - -
11 Significant exposures to commercial entities
- - - - - - - - - - -
12 Total - - - - 2,786 - - - - - 2,786

MORGAN STANLEY ASIA INTERNATIONAL LIMITED UNAUDITED SUPPLEMENTARY FINANCIAL INFORMATION Year ended 31 December 2018
105
H. PILLAR 3 DISCLOSURE (CONTINUED)
Template CCR5: Composition of collateral for counterparty default risk exposures (including those for contracts or transactions cleared through CCPs)
Derivative contracts SFTs
Fair value of recognised collateral received
Fair value of posted collateral
Fair value of
recognised collateral received
Fair value of posted collateral Segregated Unsegregated Segregated Unsegregated
As at 31 December 2018
US$’000 US$’000 US$’000 US$’000 US$’000 US$’000
Cash - domestic currency
- - - 1,595 - -
Total - - - 1,595 - -
Domestic currency refers to the reporting currency of the Company, i.e. USD.
Table IRRBB: Interest rate exposures in banking book
The Company is exposed to interest rate risk arising from banking book activities covering clients’ deposits and loans, the Company’s funding and liquidity investments. The financial assets and liabilities of the Company, which inherently have interest rate risk, are primarily driven by prevailing market rates. The sensitivity analysis for the interest rate risk of the banking book is based on the difference in interest rate sensitivity of interest bearing assets and interest bearing liabilities. The Company uses an instantaneous parallel interest rate shock of 200 basis points (upward or downward) to evaluate the potential impact on its earnings, which was a gain or loss of approximately US$5,620,000 as at 31 December 2018. The Company also monitors the interest rate risk of the banking book daily based on price value per one basis point increase or decrease in interest rates, which was a gain or loss of approximately US$50,000 as at 31 December 2018.
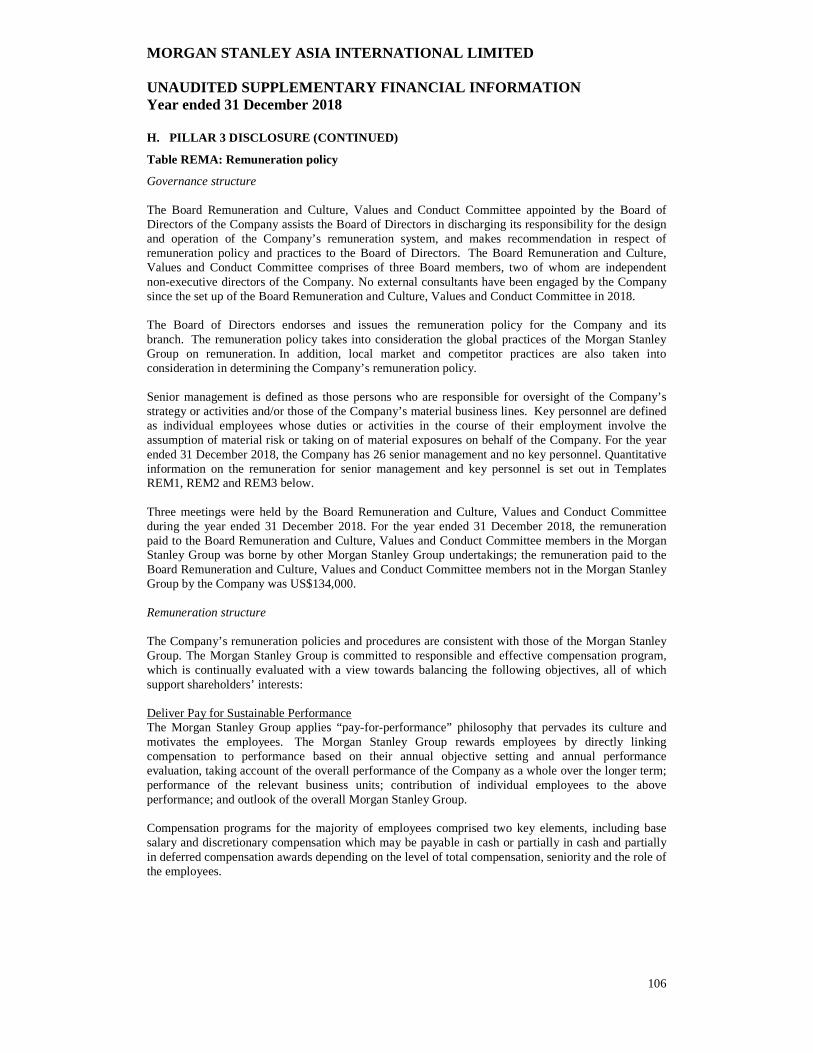
MORGAN STANLEY ASIA INTERNATIONAL LIMITED UNAUDITED SUPPLEMENTARY FINANCIAL INFORMATION Year ended 31 December 2018
106
H. PILLAR 3 DISCLOSURE (CONTINUED)
Table REMA: Remuneration policy
Governance structure The Board Remuneration and Culture, Values and Conduct Committee appointed by the Board of Directors of the Company assists the Board of Directors in discharging its responsibility for the design and operation of the Company’s remuneration system, and makes recommendation in respect of remuneration policy and practices to the Board of Directors. The Board Remuneration and Culture, Values and Conduct Committee comprises of three Board members, two of whom are independent non-executive directors of the Company. No external consultants have been engaged by the Company since the set up of the Board Remuneration and Culture, Values and Conduct Committee in 2018. The Board of Directors endorses and issues the remuneration policy for the Company and its branch. The remuneration policy takes into consideration the global practices of the Morgan Stanley Group on remuneration. In addition, local market and competitor practices are also taken into consideration in determining the Company’s remuneration policy. Senior management is defined as those persons who are responsible for oversight of the Company’s strategy or activities and/or those of the Company’s material business lines. Key personnel are defined as individual employees whose duties or activities in the course of their employment involve the assumption of material risk or taking on of material exposures on behalf of the Company. For the year ended 31 December 2018, the Company has 26 senior management and no key personnel. Quantitative information on the remuneration for senior management and key personnel is set out in Templates REM1, REM2 and REM3 below. Three meetings were held by the Board Remuneration and Culture, Values and Conduct Committee during the year ended 31 December 2018. For the year ended 31 December 2018, the remuneration paid to the Board Remuneration and Culture, Values and Conduct Committee members in the Morgan Stanley Group was borne by other Morgan Stanley Group undertakings; the remuneration paid to the Board Remuneration and Culture, Values and Conduct Committee members not in the Morgan Stanley Group by the Company was US$134,000. Remuneration structure The Company’s remuneration policies and procedures are consistent with those of the Morgan Stanley Group. The Morgan Stanley Group is committed to responsible and effective compensation program, which is continually evaluated with a view towards balancing the following objectives, all of which support shareholders’ interests: Deliver Pay for Sustainable Performance The Morgan Stanley Group applies “pay-for-performance” philosophy that pervades its culture and motivates the employees. The Morgan Stanley Group rewards employees by directly linking compensation to performance based on their annual objective setting and annual performance evaluation, taking account of the overall performance of the Company as a whole over the longer term; performance of the relevant business units; contribution of individual employees to the above performance; and outlook of the overall Morgan Stanley Group. Compensation programs for the majority of employees comprised two key elements, including base salary and discretionary compensation which may be payable in cash or partially in cash and partially in deferred compensation awards depending on the level of total compensation, seniority and the role of the employees.

MORGAN STANLEY ASIA INTERNATIONAL LIMITED UNAUDITED SUPPLEMENTARY FINANCIAL INFORMATION Year ended 31 December 2018
107
H. PILLAR 3 DISCLOSURE (CONTINUED)
Table REMA: Remuneration policy (continued)
Remuneration structure (continued) Deliver Pay for Sustainable Performance (continued) In addition, for employees in the most senior roles, a significant portion of compensation is delivered in the form of long-term incentive awards, which closely tie such employees’ compensation to the Morgan Stanley Group’s long-term performance. Investment Representatives ("IRs") are also eligible to receive commissions, which are formulaically calculated based on predetermined production goals and also payable in cash or partially in cash and partially in deferred compensation awards. Align Employees’ Compensation with Shareholders’ Interests The Morgan Stanley Group links a significant portion of employees’ incentive compensation to performance and delivers annual deferred compensation awards which helps motivate employees to achieve the Morgan Stanley Group’s financial and strategic goals. Compensation decisions for employees in risk control functions (including risk management, financial control, compliance, legal and internal audit functions) are determined by senior management of these divisions, wholly independent of the performance of the business units, and not by the management of the business units. Attract and Retain Top Talent The Morgan Stanley Group competes for talent globally with other banks and financial institutions. The Morgan Stanley Group continually monitors competitive pay levels and structures its incentive awards to attract and retain the most qualified employees. Mitigate Excessive Risk-Taking The Compensation, Management Development and Succession Committee (the “CMDS Committee”) of the Morgan Stanley Group is advised by the Morgan Stanley Group’s CRO and the CMDS Committee’s independent compensation consultant to help ensure that the structure and design of compensation arrangements disincentivise unnecessary or excessive risk-taking that threatens the Morgan Stanley Group’s interests or give rise to risks that could have a material adverse effect on the Morgan Stanley Group. Remuneration process
In the first quarter of each year, senior management of the Morgan Stanley Group proposes and works with the members of the Morgan Stanley Group’s Operating Committee (including the CRO of the Morgan Stanley Group) and the Board of Directors of the Morgan Stanley Group to establish financial and non-financial performance priorities that are aligned with the Morgan Stanley Group’s business strategy and to incorporate risk-adjusted measures and objectives.
The CRO of the Morgan Stanley Group evaluates the Morgan Stanley Group’s current compensation programs on annual basis and has determined that such programs do not encourage excessive risk-taking behavior, due in part to (i) the balance of fixed compensation and variable compensation; (ii) the balance between short-term and long-term incentives; (iii) mandatory deferrals into both equity-based and cash-based incentives programs; (iv) the governance procedures followed in making compensation decisions; and (v) the risk-mitigating features of the deferred incentive compensation awards, such as cancellation and clawback provisions. Details of the deferred compensation plans are set out in note 30 to the financial statements.

MORGAN STANLEY ASIA INTERNATIONAL LIMITED UNAUDITED SUPPLEMENTARY FINANCIAL INFORMATION Year ended 31 December 2018
108
H. PILLAR 3 DISCLOSURE (CONTINUED)
Table REMA: Remuneration policy (continued)
Remuneration process (continued)
The overall discretionary bonus pool is established in consultation with the CMDS Committee. Risk-Adjusted Return on Equity is the primary quantitative metric reviewed with the CMDS Committee to determine the size of the bonus pool. Employee eligibility for bonus compensation is discretionary and bonus decisions are subject to a multi-dimensional process, which considers financial and non-financial individual, business unit and Morgan Stanley Group’s performance measures.
Non-financial performance criteria that may be taken into account in deciding whether to award, and the amount of any bonus compensation, include (but are not limited to):
• Individual conduct, including but not limited to, adherence to the Morgan Stanley Group’s Code of Conduct and policies and the Morgan Stanley Group’s cultural values;
• Contribution to the performance and profitability of both the business unit and the Morgan Stanley Group and the strategic objectives of the Morgan Stanley Group, business unit and the team and the associated value attributed to the role;
• Commercial impact, including business/functional knowledge and judgment, client relationships, innovation and execution;
• Leadership skills, including teamwork, communication and management; • Professional skills, including recruiting, diversity and inclusion; and
• Adherence to compliance and risk policies, including ethics, control and risk management.
Senior management of the Morgan Stanley Group and the CMDS Committee oversee the Morgan Stanley Group’s controls regarding the year-end compensation process to help eliminate incentives for excessive risk-taking, including:
• Sizing the incentive compensation pool to more fully consider risk-adjusted returns, compliance with risk limits and the market and competitive environment;
• Allocating the incentive compensation pool among businesses after consideration of the business’ returns on certain financial and return on capital metrics;
• Delivering a substantial portion of compensation in multi-year deferrals subject to malus/cancellation;
• Directing compensation managers to consider malus/cancellation events and an employee’s risk management activities and outcomes in making compensation decisions; and
• Undertaking a rigorous review process by risk control functions to identify potential malus/cancellation situations.
In addition, on an annual basis, business heads and Operating Committee members representing the Morgan Stanley Group’s revenue-generating divisions will prepare a Pay and Performance Analysis report that is presented to the CMDS Committee. This report sets the stage for the CMDS Committee to understand the outcomes of pay from the prior year relative to the market, and the linkage of prior year pay and performance. In turn, this enables the CMDS Committee to consider where the starting baseline of pay either trails or leads the market and whether such a position is warranted or should be rectified in light of current year known performance. Compensation outcomes are symmetric with risk outcomes at the Morgan Stanley Group level.
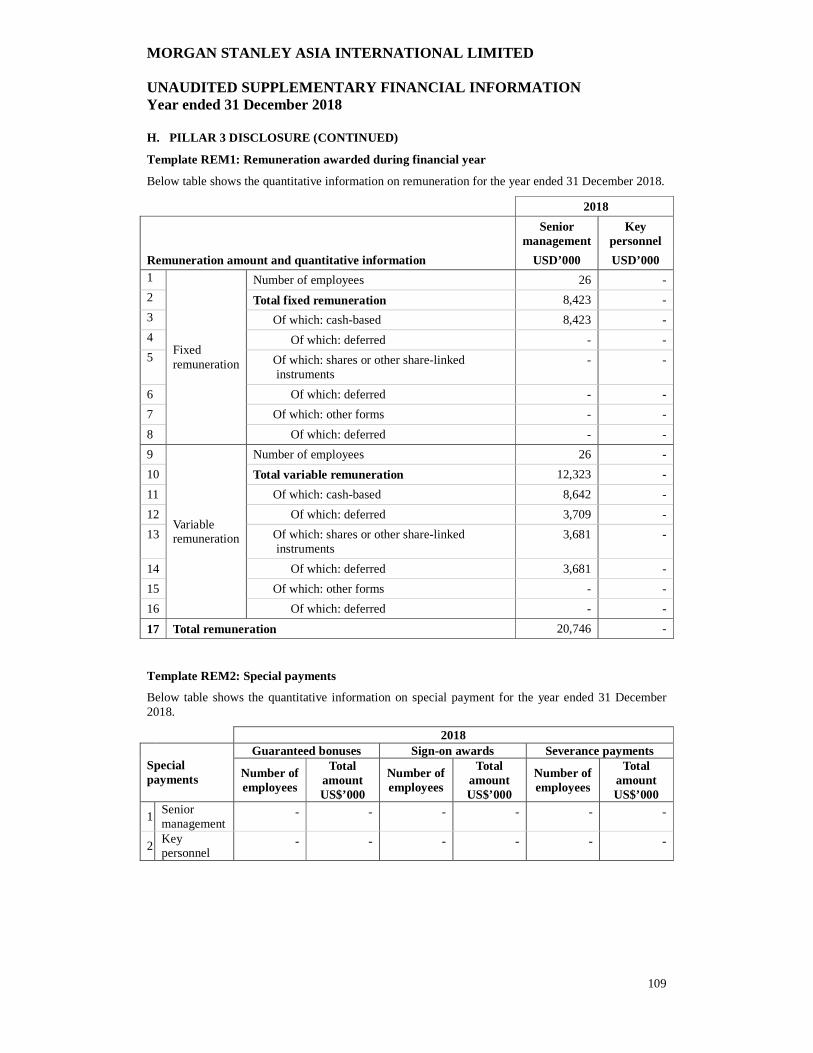
MORGAN STANLEY ASIA INTERNATIONAL LIMITED UNAUDITED SUPPLEMENTARY FINANCIAL INFORMATION Year ended 31 December 2018
109
H. PILLAR 3 DISCLOSURE (CONTINUED)
Template REM1: Remuneration awarded during financial year
Below table shows the quantitative information on remuneration for the year ended 31 December 2018.
2018
Senior
management Key
personnel
Remuneration amount and quantitative information USD’000 USD’000 1
Fixed remuneration
Number of employees 26 -
2 Total fixed remuneration 8,423 -
3 Of which: cash-based 8,423 -
4 Of which: deferred - -
5 Of which: shares or other share-linked instruments
- -
6 Of which: deferred - -
7 Of which: other forms - -
8 Of which: deferred - -
9
Variable remuneration
Number of employees 26 -
10 Total variable remuneration 12,323 -
11 Of which: cash-based 8,642 -
12 Of which: deferred 3,709 -
13 Of which: shares or other share-linked instruments
3,681 -
14 Of which: deferred 3,681 -
15 Of which: other forms - -
16 Of which: deferred - -
17 Total remuneration 20,746 -
Template REM2: Special payments
Below table shows the quantitative information on special payment for the year ended 31 December 2018.
2018 Special payments
Guaranteed bonuses Sign-on awards Severance payments
Number of employees
Total amount US$’000
Number of employees
Total amount US$’000
Number of employees
Total amount US$’000
1 Senior management
- - - - - -
2 Key personnel
- - - - - -

MORGAN STANLEY ASIA INTERNATIONAL LIMITED UNAUDITED SUPPLEMENTARY FINANCIAL INFORMATION Year ended 31 December 2018
110
H. PILLAR 3 DISCLOSURE (CONTINUED)
Template REM3: Deferred remuneration
Below table shows the quantitative information on deferred and retained remuneration.
2018
Deferred and retained remuneration
Total amount of outstanding
deferred remuneration
Of which: Total amount of
outstanding deferred and
retained remuneration exposed to ex post explicit
and/or implicit adjustment
Total amount of amendment
during the year due to ex post
explicit adjustments
Total amount of amendment during the year due to ex
post implicit adjustments
Total amount of deferred
remuneration paid out in the financial year
US$’000 US$’000 US$’000 US$’000 US$’000
1 Senior management
2 Cash 7,001 7,001 (620) (61) 4,810
3 Shares 10,791 10,791 (453) (1,916) 6,555
4 Cash-linked instruments
- - - - -
5 Other - - - - - 6 Key personnel 7 Cash - - - - - 8 Shares - - - - - 9 Cash-linked
instruments - - - - -
10 Other - - - - - 11 Total 17,792 17,792 (1,073) (1,977) 11,365