More trains, more seats Better journeys - Dorset · PDF fileMore trains, more seats Better...
80
More trains, more seats Better journeys Control Period 4 Delivery Plan 2009
Transcript of More trains, more seats Better journeys - Dorset · PDF fileMore trains, more seats Better...

More trains, more seats
Better journeys
Control Period 4 Delivery Plan 2009

Network Rail CP4 Delivery Plan 20092
Network Rail helps bring Britain together. We own, operate and maintain the rail network, delivering improved standards of safety, reliability and efficiency.
Our investment programme to enhance and modernise the network is the most ambitious it has ever been. Delivering a 21st century railway for our customers and society at large.
Every day. Everywhere.
ContentsForeword 21. The context 52. CP4 outputs 123. Our plans for CP4 164. Improving business performance 52Appendices 60
1Network Rail CP4 Delivery Plan 2009
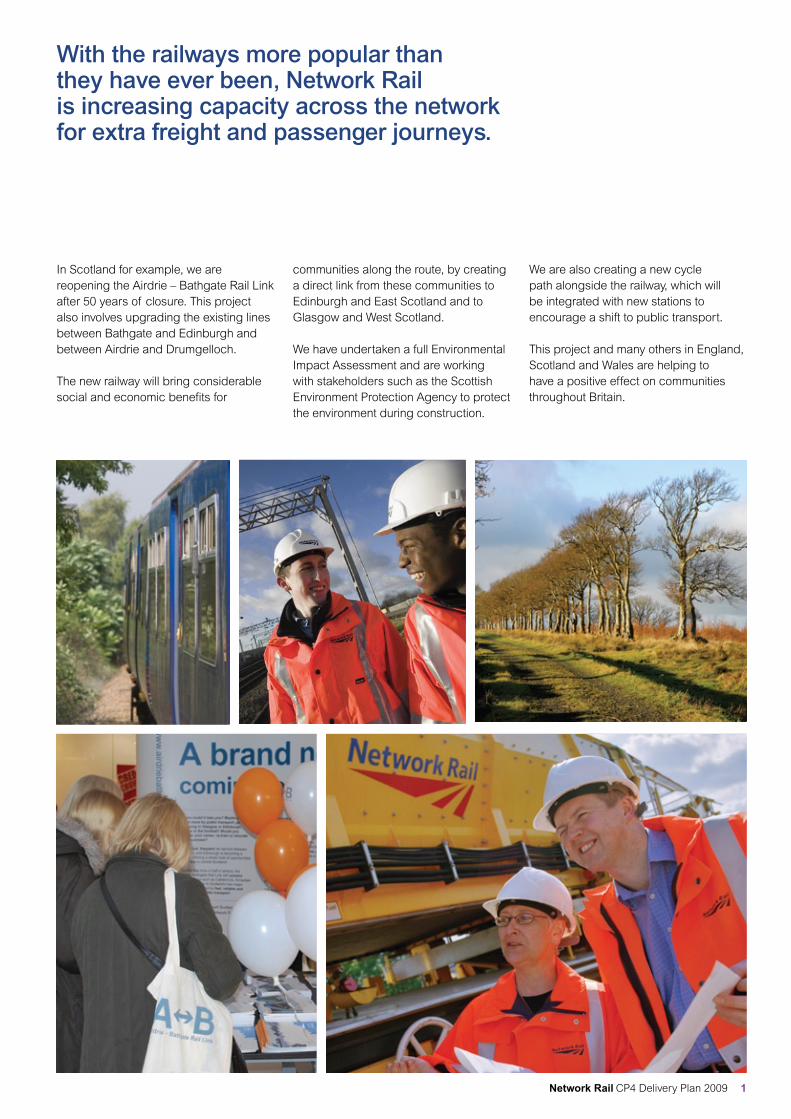
With the railways more popular than they have ever been, Network Rail is increasing capacity across the network for extra freight and passenger journeys.
In Scotland for example, we are reopening the Airdrie – Bathgate Rail Link after 50 years of closure. This project also involves upgrading the existing lines between Bathgate and Edinburgh and between Airdrie and Drumgelloch.
The new railway will bring considerable social and economic benefits for
communities along the route, by creating a direct link from these communities to Edinburgh and East Scotland and to Glasgow and West Scotland.
We have undertaken a full Environmental Impact Assessment and are working with stakeholders such as the Scottish Environment Protection Agency to protect the environment during construction.
We are also creating a new cycle path alongside the railway, which will be integrated with new stations to encourage a shift to public transport.
This project and many others in England, Scotland and Wales are helping to have a positive effect on communities throughout Britain.

Network Rail CP4 Delivery Plan 20092
In this document you can read about our commitment to continue to change our organisation and drive better delivery in all areas of the company. Our aim is to create a way of doing business whereby the needs of rail users and our customers are at the core of what we do; that we are transparent and easy to do business with; and our stakeholders tell us that they have experienced a step-change improvement in the service provided.
We have reached record levels of performance in terms of safety during CP3 and rail is already recognised as the safest form of transport. We will continue to improve both passenger and workforce safety over the next control period.
The improvements we are committing to in CP4 will transform the railway for our customers as well as the end users of both passenger and freight services. Our plan is ambitious. It requires major change across the industry and we should not underestimate the scale and difficulty of the challenge that lies ahead.
Services will be more reliable than ever, with the Public Performance Measure (PPM) planned to reach 92.6 per cent for England and Wales, and 92 per cent for Scotland. Network Rail delay minutes are planned to fall by nearly 25 per cent.
We have embarked on an investment programme that is bigger than at any time since privatisation. It will provide the necessary infrastructure to run more and longer trains when demand is at its greatest, reducing crowding for passengers on their journeys to work into major cities such as London, Birmingham, Manchester, Leeds and Cardiff. The Thameslink Programme is a key component of this but the plan also includes a wider programme of investment in platform lengthening and power supply strengthening, as well as the provision of other infrastructure to get the most out of the new rolling stock planned to be introduced in CP4.
In addition, we will improve links between major cities with significant investment on the main line corridors to increase the capacity of key junctions, provide additional track capacity, enhance power supply, increase linespeeds and lengthen platforms. This includes preparing the infrastructure for the introduction of the new Intercity Express trains on the East Coast and Great Western routes as well as major projects such as the Reading redevelopment, capacity relief on the East Coast and linespeed improvements on the London to Sheffield and Manchester to Leeds routes.
Foreword
We have great ambitions for the future of Network Rail and for improvements in rail services in Great Britain. This document sets out the next phase of our plans for achieving these ambitions during Control Period 4 (CP4) which runs from 2009/10 to 2013/14.
Our aim is to create a way of doing business whereby the needs of rail users and our customers are at the core of what we do.

3Network Rail CP4 Delivery Plan 2009
We will deliver new rail infrastructure in Scotland including the Airdrie to Bathgate and Glasgow Airport Rail Link projects. We are also working with Transport Scotland on the development of its investment programme for the longer term including electrification of parts of the network, major enhancements on the Edinburgh to Glasgow corridor to reduce journey times and improvements to the Highland Main Line to increase service frequency and reduce journey times.
We will take steps toward delivery of a strategic freight network which will provide capacity and capability specifically for freight services. The first stage of this is to provide enhanced capacity between Ipswich and Peterborough and the capability of a diversionary route between Southampton and Basingstoke. This is in addition to the works funded by the Transport Innovation Fund which includes increasing the gauge from Southampton to the West Coast Main Line.
There will be significant improvements to many stations during CP4 including the redevelopment of Birmingham New Street station, and major redevelopment of the stations at Farringdon, Blackfriars and London Bridge delivered by the Thameslink Programme.
The King’s Cross project will provide a new western concourse, allowing improved passenger circulation within the station and better connectivity with London Underground and St Pancras International. Additional peak capacity will be provided with the addition of a new 12-coach platform. It is planned that the project will be completed in 2013.
The National Stations Improvement Programme (NSIP) will deliver improvements to the passenger environment for at least 150 medium sized stations in England and Wales.
The Access for All programme will improve accessibility within stations selected by DfT and Transport Scotland. We will plan to improve access at about 100 stations in CP4.
We are developing more innovative ways to deliver our investment programme aimed at reducing the number and duration of disruptive possessions. For example, by the end of the control period we are aiming to move from a whole weekend engineering possession (54 hours) to possessions of eight and 16 hours for much of our renewals activity. This will allow train operators to run their existing services with less disruption. It will also provide the opportunity to run more services, particularly at weekends and bank holidays, where there is a demand.
In accepting the Office of Rail Regulation’s (ORR) final determinations, our challenge is to deliver all the required outputs while making ever more efficiencies in the cost of our operations and investment programme. To meet the challenge of delivering more value to our customers, our plan will evolve and change during the control period as we identify more efficient ways of delivering the outputs. We have already announced a reprofiling of our track renewal programme within the control period in order to give us the opportunity to use more efficient delivery methods.
We welcome the focus of the determination on the delivery of outputs. We have the flexibility within the regulatory settlement to determine how we will deliver these. We must demonstrate that our plans achieve the outputs and that we are doing the right thing for the longer term.
We could not have developed this plan without the support of our customers and other stakeholders. Similarly we cannot deliver the plan without their support. Our relationship with our customers is one that we must work hard to sustain and develop. We now have a great opportunity to consolidate the industry behind a plan that we will collectively deliver to share in the ongoing success of the railway. We also intend to build on this plan by working more closely with our customers on our plans for Control Period 5 (CP5) and beyond.
We must build on the significant business improvements we have made over the last six years. We have further developed our business transformation programme to focus on developing the railway that the country needs. We are focused on the big things that we know we need to improve based on our understanding of what our customers and other stakeholders demand of us and an assessment of our strengths and weaknesses in meeting these demands. The key requirements are:
• ahighlyreliablerailway;• arailwayavailablesevendaysaweek;• anexcellentjourneyexperience;• aneasilymaintainedrailway;• arailwaythatisenergyefficient;
sustainable and affordable; and• arailwaywithimprovedcapacity
and capability.
Network Rail CP4 Delivery Plan 20094
The transformation programme will drive the necessary improvements required to be a world class company and:
• delivertheoutputsinCP4withintheavailable funding;
• transform‘how’wedothingsaswellas‘what’wedo,increasingthefocuson the service provided to rail users, our customers and other stakeholders; and
• provideastrongfoundationforlongerterm sustainable improvements in affordability and value for money.
In order to finance our plan, our debt will rise from around £21 billion to around £34 billion over the control period. Since the value of our asset base is growing, our debt will still only be 67 per cent of this value, which is less than similarly regulated businesses in the utilities sector. We believe it is right that we seek to move away from a reliance on debt supported by indemnities from government. This will not be possible in the short term and we will have to keep this under review as market conditions and other factors change over the next few years.
We believe that CP4 presents us and the rest of the industry with an enormous challenge, but also a huge opportunity to demonstrate the capabilities of the thousands of dedicated people working in the industry to deliver a railway that will continue to make an ever increasing contribution to the economic, environmental and social welfare of Great Britain.
The recent decision by the Government to progress the development of proposals for a new high speed line and further electrification of the network demonstrates a willingness to promote a longer term growth agenda for the industry. Scottish Government has also recently announced an ambitious programme of further investment in rail infrastructure. We will engage fully with industry and government on all these proposals as we develop our longer term plans beyond the commitments in this document.
We believe that what you will read in the following pages presents a plan to achieve this success jointly with our customers, our funders, our suppliers and our people.
We now have a great opportunity to consolidate the industry behind a plan that we will collectively deliver to share in the ongoing success of the railway.

5Network Rail CP4 Delivery Plan 2009
1. The context
This document is Network Rail’s Delivery Plan for Control Period 4 (CP4) which runs from 2009/10 to 2013/14.
We have accepted the challenge of the Office of Rail Regulation’s (ORR) final determinations and we are committed to delivering the required outputs in CP4 within the funding available, without compromising safety and in a sustainable way.
The CP4 Delivery Plan sets out the outputs we intend to deliver in CP4 and our plans for the operation, maintenance, renewal and development of the network consistent with the achievement of these outputs.
This chapter describes the broader agenda within which the CP4 Delivery Plan must be delivered, the challenges we face in CP4 and how we have developed our plans with our customers and stakeholders to meet these challenges. The document then sets out further detail on our plans for the control period in the following chapters:
• Chapter2:CP4outputs–thisdescribes the outputs we are committing to deliver in CP4;
• Chapter3:OurplansforCP4–thisdescribes our plans for CP4 to deliver the outputs in a sustainable way; and
• Chapter4:Improvingbusinessperformance – this describes our business transformation programme to improve the way we work to deliver better value to our customers and stakeholders.
The appendices provide more detailed projections including the disaggregation of outputs, expenditure and income between England and Wales, and Scotland.
Accompanying this plan are a number of supporting documents:
• arouteplanforeachof the26strategic routes;
• astatementof outputs,scopeandmilestones for the enhancements programme for CP4;
• asummaryof thekeyinitiativesinCP4to deliver the safety outputs;
• asummaryof thekeyinitiativesinCP4to deliver the performance outputs;
• asummaryof thekeyinitiativesinCP4 to deliver the network availability outputs; and
• asummaryof thekeystation-relatedactivities in CP4.
These can all be found on our website at www.networkrail.co.uk
The broader agendaBuilding on successWhen we took over responsibility for the national rail network, we said it would take three to five years to achieve a sustainable level of efficiency and performance. We have substantially achieved this. We now have a stable company structure with standardised processes. This has delivered significant improvements over the last five years including:
• recordlevelsof performanceintermsof safety during CP3 with rail now recognised as the safest form of transport;
• animprovementinPPMfrom81.2percent to 90.5 per cent;
• areductionof 20percentinthenumber of incidents of delay and 50 per cent fewer delay minutes;
• deliveryof theWestCoastprogrammeandthenewDecember2008timetablewhich provides over 1,000 extra weekly services;
• improvedassetconditionincludingmore than halving the incidence of broken rails;
• morethandoublingthequantityof track considered to be in good condition;
• deliveryof over£4.5billionof enhancement expenditure including the West Coast programme, Southern Region power supply, Edinburgh Waverley, and numerous projects funded by the Network Rail Discretionary Fund and Outperformance Fund; and
• thishasallbeenachievedatthesametime as reducing costs by 26 per cent.
We need to build on this success, and the lessons learnt in delivering this, recognising that there are more and bigger challenges ahead in CP4.
The High Level Output SpecificationsThis was the first periodic review since the Railways Act 2005. As a result of this Act, the Secretary of State and Scottish Government were asked to provide a statement of the improvements they wished to be delivered by the rail industry over CP4 and the amount of public funds that were available to secure delivery of these improvements. These documents are referred to as the High Level Output Specification (HLOS) and Statement of Funds Available (SoFA) respectively. Separate HLOSs and SoFAs were produced for England and Wales and for Scotland.
Governments in England, Wales and Scotland all published key strategy documents over the last few years highlighting the importance of an effective rail system in delivering wider economic, social and environmental objectives.
Most recently the Department for Transport (DfT) has outlined its goals for transport, focusing on the challenge of delivering strong economic growth while at the same time reducing greenhouse gas emissions.

Network Rail CP4 Delivery Plan 20096
Following the publication of Scotland’s National Transport Strategy in December 2006, the Scottish Government recently announced a multi-billion pound investment programme for transport in Scotland over the next 20 years.
The demand for rail Passenger demand increased by nearly 45 per cent between 1996/97 and 2006/07 with substantial growth in all market sectors. This growth has been driven significantly by economic growth, with central London employment contributing to additional commuting, and other cities also experiencing strong growth. Rising fuel price trends, increased environmental awareness and road congestion have also improved the competitive position of rail.
In addition to these external factors, passenger demand has grown as a result of initiatives by train operators to enhance service quality, together with commercial marketing and pricing innovations.
In the freight market, traffic volumes expressed in terms of freight tonnage have grown by 50 per cent in the last 10 years. The main contributors have been supplies of coal for power stations and deep sea container movements.
In respect of future passenger demand, our plans have been developed in the context of the achievement of the HLOS capacity outputs and the forecasts of demand these contain.
Forecasts are inevitably sensitive to the assumptions used for future GDP growth and the competition from other modes, and are therefore subject to considerable uncertainty. The current UK economic situation is very different to the prevailing conditions at the time the HLOSs were specified. However, in the longer term, general economic
trends suggest increased demand for rail, driven by underlying economic growth, a trend towards concentration of employment in regional centres, and increased environmental awareness. We therefore believe that the HLOS output requirements and our plans to deliver these will remain generally appropriate, even if demand during CP4 emerges to be lower overall than had been forecast.
Our own planning assessments suggest that greater capacity is required to deal with peak overcrowding even at current levels of demand, and there is evidence that demand is suppressed in the height of the peak with passengers choosing to travel in the shoulder peaks.
The DfT HLOS specifically included targets of demand that the rail industry should plan to accommodate by the end of CP4. These are set out in Appendix 1 and 2 to this document. We have worked with train operators to develop service plans to accommodate the demand within the specified levels of crowding, referred to as load factors, specified. Load factors are defined as the ratio of passengers actually carried by a train compared to the design capacity of the train.
Our obligation is to deliver the enhancements programme set out in our plan. We believe this programme is necessary to facilitate the operation of the service plan that we have agreed with each of the train operators; and that the service plan delivers the necessary train capacity to meet these targets.
Our planning assessments of future freight demand, which underpinned the Freight Route Utilisation Strategy (RUS) and the recommended strategy for future development of the network from the RUS, have informed the development
It is vital that we monitor the right performance measures and manage our business activities to deliver improvements in performance in order to achieve our aims and objectives.

7Network Rail CP4 Delivery Plan 2009
To increase productivity and improve the quality of lifeand the environment within the UK
To deliver an affordable and sustainable rail service, as partof an integrated transport system fit for the 21st century
To provide the leadership and direction necessary todevelop a healthy, viable rail industry
To earn and retain a mandate to lead the GB rail system
Railusers
To satisfyand delight
passengers andfreight users
Our customers
To provideoutstandingservice and
value to TOCs,FOCs and other
customers
Our stakeholders
To earn andmaintain the
trust and respectof fundersand other
stakeholders
Our suppliersTo create
professionaland mutually
beneficialrelationships
with oursupply base
Ourpeople
To inspireand excite ourpeople and to
attract and retainthe right people
The ‘WHAT’A safe, efficient,
reliable andenvironmentally
sustainablerail service
The ‘HOW’To be
responsive,flexible,
innovative,transparentand decisive
National
Network Rail
Figure 1 Network Rail’s aims
of the concept of the strategic freight network. The strategic freight network has been developed in consultation with the same RUS stakeholder group.
Our vision and aimsWe have developed a set of aims for the organisation that recognises and supports the role of rail in a broader national context. These have been distilled into meaningful aims for each of our key stakeholders. The framework of aims is shown in Figure 1.
Our overall aim is to earn a mandate to lead the rail system in Great Britain and provide the leadership and direction necessary to develop a healthy, viable rail industry. To do this we must meet the needs of all our stakeholders.
Managing business performanceIt is vital that we monitor the right performance measures and manage our business activities to deliver improvements in performance in order to achieve our aims and objectives.
We have an established work programme to introduce a new suite of key performance indicators (KPIs) with the explicit objective to provide insights to our leadership team as to what we are doing on a daily basis to meet the needs of our stakeholders and enable our corporate vision to be achieved through fact-based decision making.
Within this framework we can set targets that, if achieved, will provide the levels of performance that will translate into customer and wider stakeholder satisfaction, and the achievement of the outputs required of us in CP4. The measures can be cascaded down through functional and operational measures into team and personal objectives, in order to drive a consistent and common set of decisions and behaviours.
The 15 KPIs are shown in Figure 2. The measures selected create a balanced scorecard that addresses all the key aspects of the business.
We will begin to use this balanced scorecard in 2009/10 to inform key company management processes including Executive and Board meetings, functional management reviews and investment authorisation.
In Chapter 3 we include our projections of the KPIs that relate to the delivery of the regulatory outputs in CP4.

Network Rail CP4 Delivery Plan 20098
The challenge for CP4Our challenge is to deliver what our customers and stakeholders expect of us in terms of safety, punctuality, availability and project delivery. We must do this in a way that offers better value for money and affordability.
Meeting these expectations requires a strategy that recognises that a safe, high-performing and cost-effective railway needs:
• reliableinfrastructureandexcellentoperations to eliminate predictable
failures and meet demand at an affordable price;
• integratedprocessesthat: – deliver consistent high quality
with speed and simplicity; – operate effectively within functions
and across external interfaces; – are subject to continuous
improvement; and – are used as a benchmark for other
organisations and industries;• peoplewho: – live and breathe our values and
behaviours;
Figure 2 Network Rail’s key performance indicators
Travelsafety
PassengerSafety
Indicator
Main assets ingood condition
Asset Stewardship Index
Minimal networkdisruption
Network Availability
Great travelexperience
JourneyExperienceMeasure
Arriveon time
PublicPerformance
Measure
Travel whenyou want
Capacity
ServiceA world class service for our customers
Develop our people
Development
Retain ourkey people
Key Player Retention
Recruit theright people
Recruitment Cycle Time
Healthy workforce and safe workplaceEmployee Health & Safety Index
PeopleGreat people and a great place to work
Sustainableenvironmental
impacts
EnvironmentalSustainability Index
Cost efficientactivities
Cost Efficiency
Excellent financialperformance
Financial Value Added
ValueOutstanding value delivered responsibly
Doing things as quick as possibleCycle Time Reduction
High quality outputs – always right first timeRight First Time
ProcessesRight first time in half the time
Increased performanceand revenue
Customerfocused
Innovateand improve
Improvedefficiency
Reliable infrastructureand excellent
operations
Key:
QuadrantStrategic objectiveKPI

9Network Rail CP4 Delivery Plan 2009
– are highly engaged, accountable, excellent at leading, managing and delivering; and
– are sought after by other organisations.
Developing plans with industrySafetyEach year the Rail Safety and Standards Board (RSSB) publishes a Railway Strategic Safety Plan (RSSP) for the industry, stating the overall industry safety objectives and reporting on safety performance. The RSSP brings together our plans and those of the train operators, showing collectively how we address the key safety risk areas on the railway.
A key part of the RSSP is the development of risk trajectories, showing how the collective safety plans of the industry are predicted to impact on the safety risk profile which is assessed using the industry safety risk model.
RSSB has agreed with the industry that the next published RSSP will run for five years from April 2009 to March 2014, consistent with the timescales for CP4.
An important part of the RSSP process is the cooperation between us and train operators in sharing their plans for managing risk. During 2007 we established safety improvement groups at route level to facilitate the sharing of the development of each other’s safety plans and provide the opportunity for gaps in risk mitigation to be identified.
Our plans for safety improvement between now and the end of CP4 have formed the basis of our input to the developmentof the2008–2010RSSP.RSSB has used this in conjunction with input from train operators to assess the combined industry impact on meeting the safety targets for CP4.
PerformanceIn developing our performance trajectories and underpinning action plans for CP4, we have adopted a process which has involved discussions on an individual basis with train operators and collectively with the industry through the National Task Force.
Our plans have been developed with train operators to meet the output requirements of funders that have been defined in the periodic review. The plans are based on an analysis of the causes of delay, the identification of initiatives to address these causes, and an assessment of the impact of these initiatives on delay minutes.
At the centre of our performance planning process is the development of a portfolio of long-term performance plans (LTPPs) which describe the agreed action plans and forecasts of performance outputs relevant to each franchised operator. It is through the development of LTPPs that we have created a coherent plan to achieve the regulatory outputs.
CapacityRoute plans are developed in consultation with our customers, end users and funders to ensure that they reflect customers’ requirements and are consistent with the funds available. The route plans are published each year as part of our business plan and are updated at intervals through the year.
The strategies set out in route plans are informed by the programme of Route Utilisation Strategies (RUSs) which cover the entire network, as well as a Network RUS which is developing strategies for stations, depots, rolling stock and electrification. RUSs establish the appropriate strategic direction for a route from a systematic analysis of future requirements of the network. Each RUS is supported by a group consisting of key industry stakeholders.
We have engaged with DfT, Transport Scotland and train operators on the development of the rolling stock plan in parallel with the development of the strategies to deliver the additional capacity required in CP4. DfT has committed to orders for over 400 new vehicles so far and discussions continue
Our challenge is to deliver what passengers, freight users, our customers and other stakeholders expect of us, in terms of safety, punctuality, availability and project delivery.
Figure 3 The challenge for CP4
Seven day railwayEarlierLaterWeekendsBank holidays
91% 92% 92.6%
£ £ £ £Delivering investment
Performance
Efficiency
90%
Improving safety

Network Rail CP4 Delivery Plan 200910
on further commitments. There is still more development work required to ensure consistency between the strategies set out in this plan and the emerging rolling stock plan.
A Freight RUS has established a strategy to meet anticipated freight growth. The Freight RUS presents a view of freight growth and changes to traffic flows that could reasonably be expected to occur on the network by 2015. It presents a strategy to address the key issues that arise in accommodating these changes. The Freight RUS considers the future of freight across the entire network. This approach ensures that the freight demand forecasts used within each of the geographical RUSs are consistent and that each RUS adopts a consistent strategy for freight. This strategy will only be revisited if capacity requirements are significantly different when taken alongside demands for the passenger railway.
The DfT’s July 2007 White Paper ‘Deliveringasustainablerailway’proposed the development of a strategic freight network in England and Wales as part of its high level strategy to address the growing demands on the network for moving passengers and freight. The purpose of a strategic freight network is to provide an enhanced core trunk network capable of accommodating more and longer freight trains, with a selective ability to handle bigger and heavier wagons.
Network availabilityWe are developing a programme to improve the availability of the network. There are two key objectives to this programme. Firstly, to allow the operation of the working timetable on a more consistent basis, without routine interruption, diversion or bus substitution.
Secondly, to allow customers to operate trains at times, and on days, which better meet demand. For example, there is a desire amongst train operators to extend the normal operating hours to release suppressed demand, particularly at weekends. We also intend to maintain availability for freight operators including more effective use of diversionary routes.
The strategy is being developed under the stewardship of the industry governance group, which is convened by Network Rail and ATOC, and includes representatives from passenger and freight train operators, and ORR. The purpose of this body is to determine the industry strategy, ensuring that the needs of all affected operators are taken into consideration, to review our plans, and to make recommendations as to which enhancement projects are appropriate for seven day railway funding.
StationsTo support the development of cross-industry work, a Joint Stations Board (JSB) has been established which is similar in composition to the National Stations Improvement Programme (NSIP) Board. This has a wider remit extending to all stations, but its role is facilitative, rather than directive. Reporting to and advising the JSB is a Joint Stations Working Group, with train operator and Network Rail members who work in the station environment.
Local Delivery Groups (LDGs), initially formed under NSIP, now have a wider role across the whole country as the central part of the Integrated Station Planning initiative which aims to optimise the planning and delivery of all station works. The initiative will improve the way we work together and thereby give rail industry and external stakeholders greater confidence that current and future requirements for stations can be properly
considered and effectively delivered by the rail industry.
The LDG will act as a primary focus for ensuring the alignment of all plans relating to stations. It will also enable such plans to meet customer and stakeholder aspirations, within the context of the contractual and legal delivery requirements of the parties involved. It will be expected to consider the prioritisation and allocation of resources across a train operator’s station portfolio.
SustainabilityWe are part of a cross-industry sustainability group, which includes representatives from passenger and freight train operators, RSSB, DfT, Transport Scotland and ORR. The group’s primary purpose has been to share information, build consensus amongst stakeholders and develop long-term strategies that require cross-industry action and to work with government on taking these forward. A key output from this group has been the development of a number of key principles that represent the core values of the rail network and are fundamental to delivering a sustainable railway:
• puttingcustomersattheheartof the railway;
• puttingrailinreachof people;• providingagreatendtoendjourney
experience;• beingagreatplacetowork;• strivingtoreduceourenvironmental
impact;• beingcarbonsmart;• maximisingourenergyefficiency;• supportingtheeconomy;• optimisingtherailsystem’scapability;
and• promotingtransparencyindecision
making.

11Network Rail CP4 Delivery Plan 2009
It is now for the industry as a whole to apply them. Consistent with these principles we have developed our own corporate responsibility plans.
In the spring of 2009 we published our sustainability policy. For Network Rail sustainability is the convergence of three distinct areas: social; economic; and environmental sustainability.
Within each area we have specific goals and targets in order to address our commitment to:
• theworkplace(ourpeople);• themarketplace(passengers,
customers, funders and suppliers);• theenvironment;and• thecommunity.
Throughout CP4 we will produce an annual corporate responsibility report to highlight our progress. Our aim is that the data, structure and content of this document be on a par with leading companies in this field.
The periodic reviewWe have accepted ORR’s final determinations. Our over-riding challenge is to deliver the outputs within the funding available in a sustainable way and without compromising safety. However, our ambitions go beyond this and we intend to drive improvements across all parts of the business throughout CP4 and beyond.
We welcome the emphasis of the final determinations on the regulation of the achievement of outputs in the next control period. This is the first time the new periodic review process has been tested following the Government’s Railways Act 2005, that asks governments in England and Wales, and Scotland, to specify what outputs are to be delivered in CP4 and how much funding is available. We
believe the requirement for governments to specify their required outputs and funding available has been helpful and has reinforced the focus of the review on outputs and funding.
A far wider range of outputs has been specified through this periodic review than those set out in the 2003 Access Charges Review; covering safety, performance, network capability, capacity and availability within a whole industry and system context, as well as specific asset-related measures for stations and depots.
In accepting the final determinations, our challenge is to meet all these outputs while making ever more efficiencies in both the cost of operating and maintaining the network and in our investment programme. All areas of the business will need to deliver greater efficiencies in CP4 than we proposed in our Strategic Business Plan Update in April2008.
To meet this challenge our plan will evolve and change during the control period as we identify more efficient ways of delivering the outputs in a sustainable way.
The plan will need to be adjusted as both our own proposals are refined and as external influences are better understood. This will require a framework that provides both flexibility and rigorous change control. We will ensure that affected customers and funders are consulted as part of this framework.
Our over-riding challenge is to deliver the outputs within the funding available without compromising safety and in a sustainable way.

Network Rail CP4 Delivery Plan 200912
2. CP4 outputs
Safety The target is to achieve a three per cent reduction over the control period in the risk of death or injury from accidents on the railway for passengers and rail workers. The measurement of this risk will be by reference to the Rail Safety and Standards Board’s (RSSB) Safety Risk Model (SRM).
This chapter sets out the top level regulated outputs to be delivered in CP4. Top level regulated outputs are the minimum level of performance specified as obligations in ORR’s final determinations.
The improvements we are committing to in CP4 will transform the railway for our customers, as well as the end users of both passenger and freight services.
The Railway Strategic Safety Plan (RSSP) for2008–2010includesaforecastusingthe SRM of the reduction in risk to both passengers and workforce safety as a consequence of our CP4 plans and those of train operators. This forecast meets the safety targets set for CP4. Further detail of train operator initiatives that contribute to the achievement of these targets is provided in the RSSP. Our initiatives that reduce safety risk are summarised in Chapter 3.
Sector 2009/10 2010/11 2011/12 2012/13 2013/14
Long distance 88.6 89.8 90.9 91.5 92.0
London and south east 91.5 92.0 92.4 92.7 93.0
Regional 90.5 91.0 91.5 91.9 92.0
Total England and Wales 91.0 91.5 92.0 92.3 92.6
Scotland 90.9 91.3 91.7 91.9 92.0
Figure 4 Public Performance Measure (per cent annual average)
Sector 2009/10 2010/11 2011/12 2012/13 2013/14
Long distance 4.9 4.5 4.2 4.0 3.9
London and south east 2.3 2.2 2.1 2.0 2.0
Regional 2.6 2.5 2.4 2.3 2.3
Total England and Wales 2.8 2.6 2.5 2.4 2.3
Figure 5 Cancellations and significant lateness – England and Wales (per cent of services affected)
Sector 2009/10 2010/11 2011/12 2012/13 2013/14
Scotland 2.0 1.9 1.8 1.8 1.7
Figure 6 Cancellations and significant lateness – aspirational target for Scotland (per cent of services affected)
The improvements we are committing to in CP4 will transform the railway for our customers, as well as the end users of both passenger and freight services.

13Network Rail CP4 Delivery Plan 2009
TheSRMwillbeupdatedevery18months as we progress through the control period. This will be supported by the monitoring of our own safety performance as part of our key performance indicator framework.
This framework is explained in more detail in Chapter 3. Our own safety performance will be reported every period in our safety and environment assurance report and in our annual safety report.
PerformanceWe are required by ORR’s final determinations to deliver improvements in the Public Performance Measure (PPM) and also deliver reductions in cancellations and significant lateness at both a national and sector level. Sectors refer to the aggregation of train operator services for long distance services, London and south east services and regional services in England and Wales. In Scotland we are required to deliver a trajectory of improved PPM performance for First ScotRail. Figure 4 sets out the PPM outputs to be delivered in CP4. Figure 5 sets out the sector-level cancellation and significant lateness outputs to be delivered in CP4 in England and Wales.
We have also included in Figure 6 a forecast trajectory for cancellations and significant lateness for Scotland.
We have included this to provide a complete forecast of the network for this measure. This is not a regulated output in Scotland and the forecast is not a commitment. This is therefore described as aspirational.
In addition, we are required not to exceed maximum levels, for each year, of passenger train delay minutes for which we are held accountable in England and Wales, and in Scotland. We have similar maxima for the freight train delay minutes for which we are responsible across the network as a whole. These maxima are normalised for the volume of freight traffic, which tends to fluctuate more than the volume of passenger traffic. These regulated targets are set out in Figures 7 and8.
ORR’s final determinations require us to set out in our CP4 Delivery Plan trajectories for PPM and our own delay minutes disaggregated for each passenger train operator. Individual train operator trajectories are provided in Appendix4and8.Thesetrajectoriesarealso included in long-term performance plans that we have developed with each train operator.
We will continue to work with train operators to develop performance plans for the delivery of performance improvements through CP4. However, it
is unlikely that we will achieve exactly the level of performance shown for each train operator. Some individual train operator trajectories will be better than the targets and some will not be achieved. This is recognised by ORR in its final determinations.
We therefore do not expect failure to meet an individual train operator trajectory, on its own, to constitute a licence breach. We recognise that we must demonstrate that we are taking reasonable steps to achieve these targets and to address areas of poor performance. If we were not meeting an individual target we would work with the relevant train operator to understand the cause of this and develop the appropriate remedial actions consistent with our obligation to meet the top level targets, taking into account the materiality of the shortfall.
We have agreed with train operators and the National Task Force not to define a specific lower bound performance trajectory for each operator. Instead we have agreed a process for monitoring, with thresholds of underperformance that trigger further action consistent with the principles in the Network Code.
We have agreed that ORR would be informed if PPM is one percentage point below target, or delay minutes are 10 per cent above target. Before that threshold is reached, we will develop local agreements with each train operator on the threshold at which remedial actions plans would be developed and agreed with each train operator. There will be reciprocal arrangements for developing remedial action plans if train operators underperform against their own delay minute targets.
A review would take place if the PPM or Network Rail delay minutes were to under perform the planned trajectory on
Sector 2009/10 2010/11 2011/12 2012/13 2013/14
England and Wales 6,270 5,790 5,430 5,190 4,980
Scotland 436 410 391 386 382
2009/10 2010/11 2011/12 2012/13 2013/14
Network total 3.68 3.41 3.18 3.05 2.94
Figure 7 Network Rail total delay minutes – passenger services (000s)
Figure8Freight delay minutes per 100 train kilometres
Network Rail CP4 Delivery Plan 200914
a moving annual average basis for three consecutive periods, consistent with other industry reporting.
It is intended that the appropriateness of these threshold levels will be reviewed at the National Task Force after the first year of CP4.
For freight operators we have published planned trajectories for Network Rail delay minutes per 100 train kilometres which are consistent with each operator’s local output commitment document. These are set out in Appendix 10. We are also discussing with freight operators the development of further performance measures for monitoring purposes. In particular, we are discussing with freight operators a new Freight Performance Measure (FPM). This is a simplified measure based on measuring trains arriving within 10 minutes of the planned arrival time.
We will report delivery against these targets in our Network Performance Period Report.
Capacity We are required by ORR’s final determinations to deliver the projects specified in the HLOSs for England and Wales, and Scotland. We will also deliver other projects which will provide the infrastructure required to meet the disaggregated England and Wales capacity specifications. We have defined the scope, outputs and milestones for the CP4 enhancement programme and these are set out in a supporting document.
The enhancements programme is subject to further development and refinement. Material changes will be subject to consultation and change control as described in the supporting document.
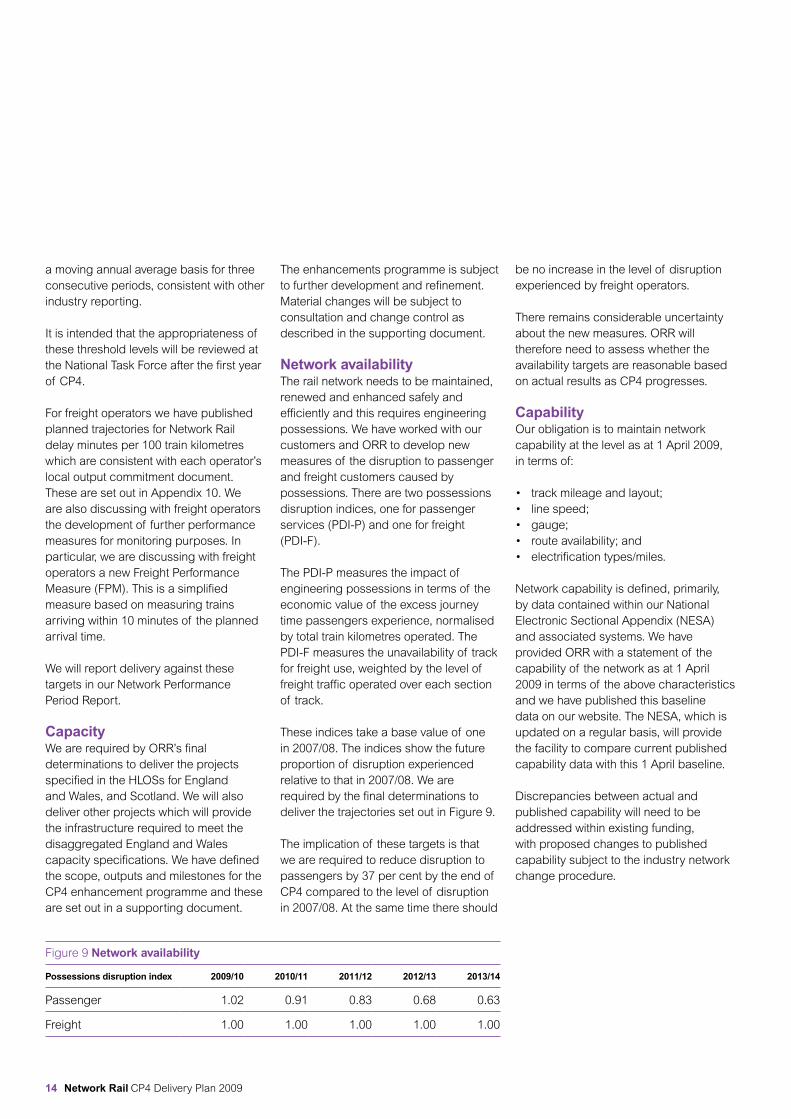
Network availabilityThe rail network needs to be maintained, renewed and enhanced safely and efficiently and this requires engineering possessions. We have worked with our customers and ORR to develop new measures of the disruption to passenger and freight customers caused by possessions. There are two possessions disruption indices, one for passenger services (PDI-P) and one for freight (PDI-F).
The PDI-P measures the impact of engineering possessions in terms of the economic value of the excess journey time passengers experience, normalised by total train kilometres operated. The PDI-F measures the unavailability of track for freight use, weighted by the level of freight traffic operated over each section of track.
These indices take a base value of one in2007/08.Theindicesshowthefutureproportion of disruption experienced relativetothatin2007/08.Wearerequired by the final determinations to deliver the trajectories set out in Figure 9.
The implication of these targets is that we are required to reduce disruption to passengers by 37 per cent by the end of CP4 compared to the level of disruption in2007/08.Atthesametimethereshould
be no increase in the level of disruption experienced by freight operators.
There remains considerable uncertainty about the new measures. ORR will therefore need to assess whether the availability targets are reasonable based on actual results as CP4 progresses.
CapabilityOur obligation is to maintain network capability at the level as at 1 April 2009, in terms of:
• trackmileageandlayout;• linespeed;• gauge;• routeavailability;and• electrificationtypes/miles.
Network capability is defined, primarily, by data contained within our National Electronic Sectional Appendix (NESA) and associated systems. We have provided ORR with a statement of the capability of the network as at 1 April 2009 in terms of the above characteristics and we have published this baseline data on our website. The NESA, which is updated on a regular basis, will provide the facility to compare current published capability data with this 1 April baseline.
Discrepancies between actual and published capability will need to be addressed within existing funding, with proposed changes to published capability subject to the industry network change procedure.
Possessions disruption index 2009/10 2010/11 2011/12 2012/13 2013/14
Passenger 1.02 0.91 0.83 0.68 0.63
Freight 1.00 1.00 1.00 1.00 1.00
Figure 9 Network availability

15Network Rail CP4 Delivery Plan 2009
StationsWe are required to maintain average condition scores within each station category A to F, both in England and Wales and in Scotland. The categories reflect the different sizes and passenger throughput of the stations on the network. The minimum levels of average condition for each station category to be achieved over CP4 are shown in Figure 10.
DepotsFigure 11 sets out the current average depot condition. This is the minimum average score to be achieved over the control period.
Station category Station stewardship measure minimum average score at end of CP4
All network
A 2.48
B 2.60
C 2.65
D 2.69
E 2.74
F 2.71
Scotland
All stations 2.39
Figure 10 Station condition
Light maintenance depots (LMDs) LMD stewardship measure minimum average score at end of CP4
England and Wales 2.22
Scotland 2.73
All LMDs 2.25
Figure 11 Depot condition
Our plans are to maintain the condition of our light maintenance depots over the control period at their current average condition level, which is 2.25 as defined by the depot condition index. We are planning to introduce a revised method of calculating condition in the first year of CP4 and thus the actual condition score reported will be based on the new measure. The new methodology – the depot stewardship measure – adopts an asset weighting approach similar to the stations stewardship measure which was introducedin2007/08.
Customer satisfactionDelivering a specific improvement in stakeholder satisfaction does not form part of the regulated outputs that we are required to deliver. Nonetheless satisfying our customers, users of the railway and other stakeholders should be at the heart of all we do and surveys of customer satisfaction for passenger and freight operators are undertaken each year. Similar surveys are produced for our other stakeholders. In Chapter 1 we described how we monitor the satisfaction of our customers, rail users and other stakeholders within an overall performance management framework.
Other asset stewardship measuresApart from two specific output measures for stations and depots, the condition and reliability of our infrastructure does not form part of the regulated outputs and we are not required to deliver a specified level of asset renewal activity. Nonetheless achieving the specified outputs will require an improvement in overall asset reliability as a key factor in the performance of the rail system and the punctuality of the train service. We are committed to delivering the required outputs in a sustainable way consistent with good long-term stewardship of our assets.
In Chapter 3 we describe our approach to asset management and our plans for CP4. We also describe the suite of key performance indicators we will use to monitor the long-term sustainability and performance of our assets.
Satisfying our customers, users of the railway and other stakeholders should be at the heart of all we do.

Network Rail CP4 Delivery Plan 200916
3. Our plans for CP4
Our plans for CP4 are set out in the following sections:
• overviewof ourexpenditureplans;• operatingandmaintainingour
network;• renewingthenetwork;• enhancingthenetwork;• deliverabilityof theinvestment
programme;• deliveringtheoutputs;• income;• financing;• comparisontoORR’sincomeand
expenditure assumptions; and• monitoringandchangecontrol.
The funding available to us from Periodic Review2008(PR08)isinsufficienttoafford the level of activity and scope contained in our plan at current levels of efficiency. Through our business transformation programme, which is described in Chapter 4, we are identifying and implementing opportunities that will
This chapter summarises our activities and expenditure plans for CP4 to deliver the output commitments set out in Chapter 2. These plans do not represent output commmitments in their own right but they define the way we currently plan to achieve these outputs.
enable us to deliver the outputs within the funding available and, in doing so, provide opportunities to deliver further benefits in the longer term. Our plans for CP4 will be refined and updated as we progress through the control period.
The appendices to this document include our projections of outputs, expenditure and income both at a network level and disaggregated between England and Wales, and Scotland. This split reflects a combination of costs directly incurred in each country, and the application of agreed metrics to allocate expenditure and income that is common to both. All expenditure and income is shown in 2009/10 prices.
Overview of our expenditure plansThe projected cost of operating, maintaining, renewing and enhancing the network during CP4 is summarised in Figure 12. This shows that our overall
Figure 12 Expenditure trend (£bn, 2009/10 prices)
0
1
2
3
4
5
6
8
7
CP3 CP4
2004/05 2005/06 2006/07 2007/08 2008/09 2009/10 2010/11 2011/12 2012/13 20013/14
Final determinationsControllable opexand maintenance
Non-controllable opex Renewals Periodic Review 2008 enhancements
17Network Rail CP4 Delivery Plan 2009
expenditure in CP4 is broadly in line with ORR’s final determinations. It shows that we plan to deliver cost reductions throughout CP4 while also delivering a major programme of enhancement that is significantly larger than was being delivered in CP3.
Our projections are based on detailed plans for 2009/10 together with more high level assumptions for the remainder of the control period.
We must build on the significant overall efficiency improvements of 27 per cent achieved in CP3 and deliver further efficiencies of 21 per cent in CP4.
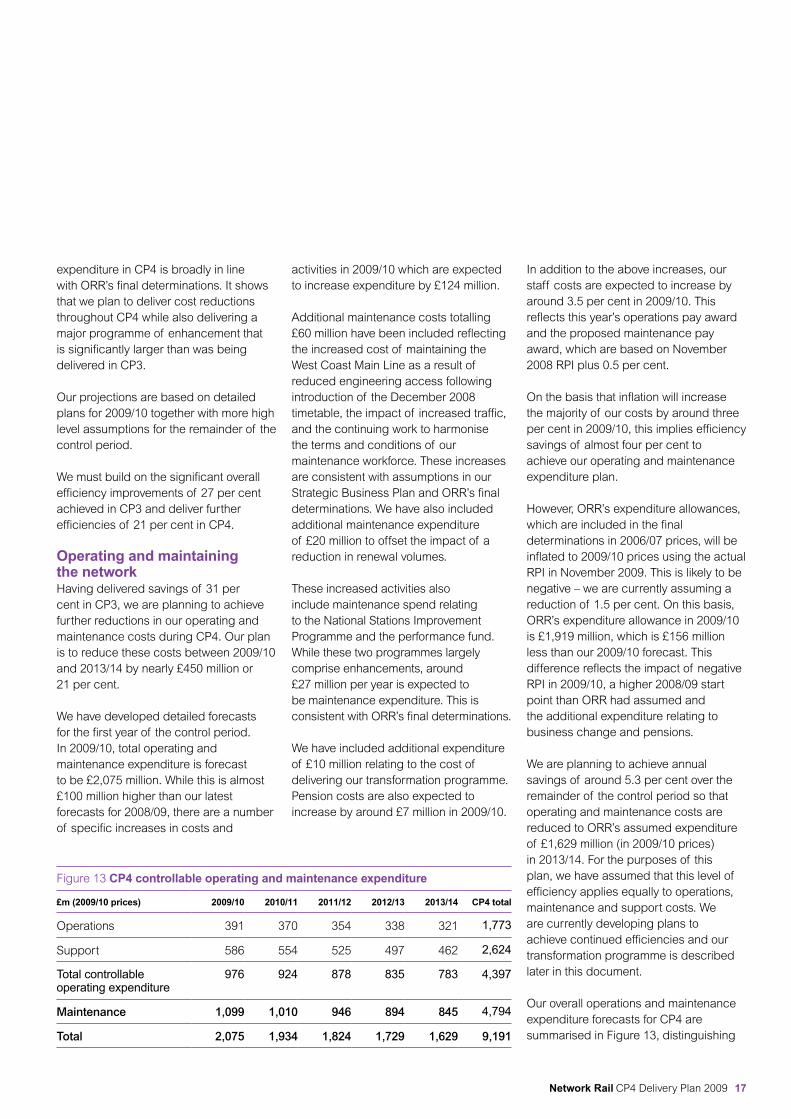
Operating and maintaining the networkHaving delivered savings of 31 per cent in CP3, we are planning to achieve further reductions in our operating and maintenance costs during CP4. Our plan is to reduce these costs between 2009/10 and 2013/14 by nearly £450 million or 21 per cent.
We have developed detailed forecasts for the first year of the control period. In 2009/10, total operating and maintenance expenditure is forecast to be £2,075 million. While this is almost £100 million higher than our latest forecastsfor2008/09,thereareanumberof specific increases in costs and
activities in 2009/10 which are expected to increase expenditure by £124 million.
Additional maintenance costs totalling £60 million have been included reflecting the increased cost of maintaining the West Coast Main Line as a result of reduced engineering access following introductionof theDecember2008timetable, the impact of increased traffic, and the continuing work to harmonise the terms and conditions of our maintenance workforce. These increases are consistent with assumptions in our Strategic Business Plan and ORR’s final determinations. We have also included additional maintenance expenditure of £20 million to offset the impact of a reduction in renewal volumes.
These increased activities also include maintenance spend relating to the National Stations Improvement Programme and the performance fund. While these two programmes largely comprise enhancements, around £27 million per year is expected to be maintenance expenditure. This is consistent with ORR’s final determinations.
We have included additional expenditure of £10 million relating to the cost of delivering our transformation programme. Pension costs are also expected to increase by around £7 million in 2009/10.
In addition to the above increases, our staff costs are expected to increase by around 3.5 per cent in 2009/10. This reflects this year’s operations pay award and the proposed maintenance pay award, which are based on November 2008RPIplus0.5percent.
On the basis that inflation will increase the majority of our costs by around three per cent in 2009/10, this implies efficiency savings of almost four per cent to achieve our operating and maintenance expenditure plan.
However, ORR’s expenditure allowances, which are included in the final determinations in 2006/07 prices, will be inflated to 2009/10 prices using the actual RPI in November 2009. This is likely to be negative – we are currently assuming a reduction of 1.5 per cent. On this basis, ORR’s expenditure allowance in 2009/10 is £1,919 million, which is £156 million less than our 2009/10 forecast. This difference reflects the impact of negative RPIin2009/10,ahigher2008/09startpoint than ORR had assumed and the additional expenditure relating to business change and pensions.
We are planning to achieve annual savings of around 5.3 per cent over the remainder of the control period so that operating and maintenance costs are reduced to ORR’s assumed expenditure of £1,629 million (in 2009/10 prices) in 2013/14. For the purposes of this plan, we have assumed that this level of efficiency applies equally to operations, maintenance and support costs. We are currently developing plans to achieve continued efficiencies and our transformation programme is described later in this document.
Our overall operations and maintenance expenditure forecasts for CP4 are summarised in Figure 13, distinguishing
Figure 13 CP4 controllable operating and maintenance expenditure
£m (2009/10 prices) 2009/10 2010/11 2011/12 2012/13 2013/14 CP4 total
Operations 391 370 354 338 321 1,773
Support 586 554 525 497 462 2,624
Total controllable operating expenditure
976 924 878 835 783 4,397
Maintenance 1,099 1,010 946 894 845 4,794
Total 2,075 1,934 1,824 1,729 1,629 9,191

Network Rail CP4 Delivery Plan 200918
between the cost of operating and maintaining the network and the cost of our supporting activities and central costs. In this plan, the allocation of expenditure between operating and maintenance costs is consistent with our internal reporting rather than the allocations used during the periodic review. We summarise in the following sections the key operating and maintenance activities currently being delivered.
Operating the networkNetwork operations comprises the cost of operating the network and the cost of managing stations. The costs of operating the network are forecast to total £391 million in 2009/10, with a headcount of around8,500.Of thistotal,around£320million(82percent)relatestothecosts of over 7,000 direct operations delivery staff of which over 5,000 are signallers and 2,000 are control staff and local operations teams. A further 1,500 people are employed in management and other support roles.
Signalling staff represent the largest single element within our operating costs. The total number of signallers is dependent on the operating characteristics and signalling technology in the areas controlled, as well as the volume of traffic and hours of operation. Signalling can be a relatively labour intensive activity in areas where mechanical signalling operates in a large number of small signal boxes. Productivity and other efficiency improvements can sometimes be achieved when resignalling schemes are implemented which allow larger areas to be controlled from a single signalling centre.
The main short-term efficiency savings are expected to be achieved by ensuring that support activities within operations deliver value for money in their
contribution to achieving outputs, and by effective day-to-day management of controllable costs.
The Olympic and Paralympic Games are to be held in and around London in 2012. There may be some works, resources or operational measures which the Olympic Delivery Authority (ODA) determines are necessary to support the Olympic Games which will require funding from the ODA as they are not provided for by the periodic review.
Rail operationsThe majority of activities are organised within nine operating routes, each of which is directly responsible at the local level for service delivery to the customers which operate in its geography. In turn, for management purposes, routes are divided into geographical areas, with managers that are responsible for local signalling and operations activities.
The activities managed at route/area level include:
• signalling;• controlcentres(someof whichare
now integrated with TOC control centres);
• mobileoperationsmanagement;• customerrelationshipmanagement
and commercial arrangements;• performanceplanningand
management; and• sponsorshipof enhancements
schemes.
Centrally managed activities include:
• customerservices,includingmanagement of relationships with freight operators;
• operationsplanning,includingaccessplanning, timetabling, performance planning; and
• operationsstandardsandstrategy.
Station servicesWemanage18of thebiggeststationsin Britain. Costs at these managed stations are split into those which can be recovered from operators (qualifying expenditure) and non-recoverable costs. Some of the latter are significantly offset by other income, for example from retail services.
Qualifying expenditure consists of the following cost categories:
• staff costs,comprisingstationmanagement, customer services and security staff, together with other staff-related costs such as training, medicals, travel and expenses;
• utilities,includinggas,waterandelectricity for the “common areas” in these stations;
• maintenanceof buildings,plant,customer information systems, CCTV and track litter picking;
• insurancecosts,coveringthirdpartyliability cover for customers and off-duty staff, and buildings insurance; and
• cleaningcosts,includinggeneralstation cleaning and refuse removal.
Support costsSupportcostsareforecasttototal£586million in 2009/10. This expenditure comprises the operating costs of our support functions and the activities that they manage, together with central costs such as insurance and pensions.
Excluding pensions and insurance costs, support costs are forecast to total £359 million in 2009/10 (after taking into account costs that are capitalised as they are attributable to specific renewals or enhancement activities). The most significant activities are summarised below.
Office accommodation totals £45 million in 2009/10, including leases

19Network Rail CP4 Delivery Plan 2009
and maintenance. We plan to deliver significant efficiencies in this area with the migration to a new national centre in Milton Keynes. This centre, which is expected to open in 2012, will allow us to vacate some of our London offices at the end of their leases, and will also support many of the efficiency programmes by allowing the consolidation and co-location of support activities. In implementing these proposals we will retain the route structure for planning, maintaining and operating the network.
Engineering staff costs total around £66 million, with around 1,400 engineering staff currently employed. Our annual IT operating costs include around £25 million for items such as servers and software licences and around £19 million of staff costs. Our utility costs (electricity, gas and water) for all our properties account for £53 million in 2009/10. We areforecastingtospend£28millionontraining costs which includes the cost of managing the apprenticeship schemes (£7million).Afurther£8millionisspenton safeguarded staff travel expenditure.
Insurance costs are forecast to be £95 million in 2009/10. This is based on our external insurance costs as well as premia paid to our captive insurance company.
Pensions costs are forecast to total £132 million in 2009/10. In common with other organisations, we are experiencing an increase in the cost of funding our pension schemes. We operate three discrete pension schemes: the Network Rail section of the Railway Pension Scheme, a defined contribution scheme, and a new career-average earnings defined benefit scheme.
Non-controllable operating costsNon-controllable operating costs include railway safety, ORR fees and British Transport Police (BTP) charges, electricity for traction (which is mostly recoverable through charges to operators) and cumulo rates.
Non-controllable operating costs in 2009/10 are forecast to be £21 million higherthan2008/09,largelyasaresultof rising electricity prices. While electricity for traction costs are higher than ORR assumed in its final determinations, this is largely offset by a higher income than ORR assumed.
We are currently negotiating with the valuations agencies regarding the 2010 cumulo rating revaluation. For the purposes of the plan, we have assumed that these costs will be consistent with ORR’s determination.
Figure 14 CP4 non-controllable opex expenditure
£m (2009/10 prices) 2009/10 2010/11 2011/12 2012/13 2013/14 CP4 total
Electricity for traction 258 216 252 295 335 1,355
Cumulo rates 73 92 96 96 96 454
British Transport Police 60 60 60 60 60 299
Railway safety charge 8 8 8 8 8 42
ORR fee 20 20 20 20 20 100
Other 0 0 0 0 0 2
Total 420 397 437 480 520 2,253
We must build on the significant overall efficiency improvements of 27 per cent achieved in CP3 and deliver further efficiencies of 21 per cent in CP4.

Network Rail CP4 Delivery Plan 200920
Our forecast for ORR fees is around £3 million per year higher than ORR allowed on the basis of its latest projections. ORR has confirmed that it will fund these costs in CP5.
ORR has assumed that we can achieve savings in the costs of BTP throughout CP4. We have currently assumed that we will be able to achieve these savings and will work with BTP to identify how this might be achieved. As with other costs over which we have limited direct control, we would not generally expect to reduce/relax other budgets if actual costs are above/below the amount funded through the review.
Maintaining the networkThe costs of maintaining the network are forecast to total £1,099 million in 2009/10. This includes the cost of our maintenance function, together with some maintenance activities managed by other functions.
The most significant maintenance expenditure category is staff costs, which represent over 60 per cent of the total maintenance budget. Other significant cost categories include on-track machines, vehicles and fuel, materials and contractors. The total level of expenditure is dependent on the number of operating shifts for equipment such as tampers, stoneblowers, regulators and road railers.
We have planned efficiency measures within our maintenance business plan for 2009/10 which target those areas with the most significant impact on operational costs. Efficiencies identified include:
• reliabilitycentredmaintenanceof signalling equipment;
• improvedrailheadrepairprocessesusing new welding techniques;
• automatedultrasonicinspectionsof track;
• insourcingof activitiessuchasouroperational telecoms maintenance activity, which will increase headcount but reduce overall costs;
• managementof rosteringandovertime; and
• generalproductivityinitiatives,including quality improvements to reduce repeat work.
Efficiency plans for the remainder of the control period are being developed as part of our transformation programme which is described in Chapter 4. As part of this programme we are seeking to identify more cost-effective approaches to asset management.
We have established a new organisational structure for infrastructure maintenance based on 40 front-line delivery units, which are aligned to nine route infrastructure maintenance directors. We have also aligned activities including possession planning, supplies, logistics for maintenance and infrastructure investment to the National Delivery Service (NDS).
A key aspect of the new structure is to provide more direct engineering support for front-line teams to allow greater consistency in the application of asset policies and working methods.
We are continuing the process of developing a common organisational structure through all levels of maintenance activity. This will enable us to benchmark delivery units in terms of outputs, activity levels, unit costs and productivity. At the same time we are actively promoting the sharing and adoption of best practice across delivery units.
The core maintenance activities are the inspection of the rail infrastructure, and planned and reactive maintenance of
A key aspect of our strategy is to drive continuous improvements in the productivity of our maintenance activity.

21Network Rail CP4 Delivery Plan 2009
track, signalling, electrification, telecoms, plant and machinery.
The maintenance function also undertakes some renewals and enhancements works, especially where these can be efficiently delivered in conjunction with core maintenance activities and when resources are available. These works are included within our renewals expenditure.
A key aspect of our strategy is to drive continuous improvements in the productivity of our maintenance activity and to apply the resources that are freed up as a result to the delivery of a larger proportion of our investment programme.
Aspects of maintenance that are not undertaken by the maintenance function include civils inspections, rail-grinding and measurement trains, and corporate property maintenance.
Renewing the network Our planned renewals expenditure for the control period is broadly consistent with ORR’s determination.
We have made four specific adjustments. For a few projects, expenditure was divided between the renewals and enhancements parts of our Strategic Business Plan and ORR’s final determinations. In this delivery plan, we have consolidated the funding for these schemes into one expenditure category, recognising the integrated delivery of renewals and enhancements within these programmes. We have transferred £164 million of renewals expenditure on the King’s Cross (£114 million), Reading(£18million)andNorthLondonLine (£32 million) programmes to enhancements. Further definition of these programmes can be found in the enhancement section of this chapter. Similarly, we have transferred £29 million
of enhancements expenditure for the railway communications system project on freight-only lines to renewals. We have also reduced operational property expenditure on managed stations by £38milliontooffsetanincreaseinthe cost of the King’s Cross station enhancements. Finally, we have reduced renewals by £20 million to offset the increased maintenance expenditure in 2009/10.
In the light of the continuing challenge in delivering significant cost savings, we have reduced the level of renewal expenditure planned for 2009/10 by around 10 per cent on all assets. The development of efficiency initiatives will enable us to deliver higher volumes later in the control period, with the reductions in volumes in the first year added back in the last two years of the control period.
We are planning to deliver renewal efficiency savings of just under 24 per cent by the end of CP4. Our plans have been developed on the basis that we can currently identify around 16 per cent unit
costs savings by the end of CP4 for all assets excluding track. The remaining efficiency savings will be delivered either through further unit cost savings or scope efficiencies.
In this plan we have assumed that the remaining savings will be achieved through sustainable scope efficiencies that enable us to reduce volumes in CP4. During 2009/10 we will develop further analysis of the sustainable activity volumes as part of the transformation programme described in Chapter 4. We will provide an update to planned activity volumes in our 2010 plan update.
For track, we have a major challenge in delivering cost savings. Further work is being done to develop the most efficient plan, targeting both contractor efficiency and new methods of renewal. While this work continues, we are only publishing track renewal volumes for 2009/10 in this plan. We are, however, working with our suppliers to provide reasonable transparency on our emerging plans so that they are able to plan their activities.
Figure 15 CP4 renewals expenditure by asset
£m (2009/10 prices) 2009/10 2010/11 2011/12 2012/13 2013/14 CP4 total
Track 705 721 685 675 640 3,425
Signalling 445 452 398 425 446 2,167
Civils 375 384 341 321 299 1,719
Operational property 274 273 259 231 170 1,207
Electrification 120 151 134 109 99 614
Telecoms 326 320 156 86 74 963
Plant and machinery 141 87 55 56 54 393
IT and other 299 124 149 107 100 780
Expenditure deferred from2008/09
211 0 0 0 0 211
Total 2,896 2,512 2,177 2,011 1,883 11,478

Network Rail CP4 Delivery Plan 200922
We will provide further details in our plan for the rest of the control period in our 2010 plan update.
In the following sections, we outline our plans for each category of renewal.
TrackOver the next five years, high levels of investment in track renewals will continue with over £3 billion being invested. However, as outlined above, we have a major challenge in delivering cost savings on track renewals.
We are therefore planning to deliver a lower volume of conventional, plain line track renewals in the first year, allowing time for new, more efficient ways of working to be developed. We have only deferred work where safety and performance will not be compromised.We are planning to renew over 1,500 total composite kilometres in 2009/10. On top of this, there is a significant opportunity for contractors to win other
track and project related work through the various competitive tenders that will be conducted through the year.
We will, however, continue the focus on high output plain line renewals in 2009/10, with continuing works on the Great Western Main Line, as well as the ongoing ballast cleaning programme on the East Coast Main Line. New high output plant will start operating in 2010, initially being used on the West Coast Main Line. Our plan is to deliver around 70 per cent of primary route renewals using high output techniques.
There will also be a continued focus on switches and crossings (S&C) renewals in 2009/10, driven by immediate performance issues and poor condition that cannot be economically improved through maintenance. As we enter CP4, we will move towards delivering a greater proportion of partial S&C renewals. A new specification for partial renewals is being developed which will deliver life
extensions of up to 10 years for around one third of the cost of full renewal. As well as extending service life, this will help flatten the peak in S&C renewals arising from enhancements and renewal of junctions laid in the 1960s and 1970s. It will also allow us to take advantage of cheaper, quicker renewal techniques using modular S&C in future years.
In CP4, there will also be a major focus on drainage work and this is expected to have a significant impact on whole-life costs. In areas of poor drainage, there will be a strategy to deliver drainage works ahead of the planned track component renewals to stabilise the formation and, where possible, remove the need for renewal.
SignallingOverall activity in CP4 is broadly consistent with current levels, with annual expenditure of around £450 million throughout the control period.
The plan is dominated by conventional (non-ERTMS) resignalling work. In terms of the number of signalling equivalent units (SEUs) commissioned, the key projects in CP4 include:
• Cardiff areasignallingrenewal (652 SEUs);
• WaterOrtonCorridorresignalling (403 SEUs);
• Newportareasignallingrenewalphase 1 (377 SEUs);
• EastKentresignallingphase1 (289SEUs);
• SouthErewashresignalling(274SEUs); and
• Readingstationsignallingenablingworks (227 SEUs).
Figure 16 CP4 track expenditure
£m (2009/10 prices) 2009/10 2010/11 2011/12 2012/13 2013/14 CP4 total
Plain line 429 422 399 394 371 2,016
S&C 149 178 168 166 157 818
Off-track 43 42 41 40 39 203
Other 84 79 77 75 73 388
Total 705 721 685 675 640 3,425
2009/10
Rail (kilometres) 568
Sleeper (kilometres) 447
Ballast (kilometres) 556
S&C (equivalent units) 312
Figure 17 2009/10 track renewal volumes

23Network Rail CP4 Delivery Plan 2009
The total number of SEUs commissioned on these key projects is 2,222 – over 40 per cent of the CP4 total. In 2009/10, planned expenditure on these projects totals around £170 million, equivalent to 70 per cent of the total conventional resignalling expenditure.
We are planning a gradual migration from conventional technology to ERTMS towards the end of CP4, with deployment on the Great Western Main Line a key priority.
We will continue to review our plans for CP4. As well as asset condition considerations, we will be reviewing the prioritisation of schemes to take account of opportunities to improve efficiency and sustainability.
We are also undertaking a number of initiatives to reduce cost and streamline our processes. Firstly, two trials of modular signalling are underway from Norwich to Ely and Shrewsbury to Crewe. The concept is to introduce standard products that involve significantly lower design and construction costs. The primary aim of the trials is to prove the technology in order to deliver a cost effective modern solution to the resignalling of rural routes. Both are expected to be commissioned in early 2012 and, if successful, will pave the way for a much wider programme of modular signalling in the latter part of CP4 and into CP5.
Secondly, over the last year, we have identified several areas of opportunity for improvement to detailed design and construction. We are currently prioritising the implementation of these opportunities in conjunction with our major suppliers and expect the project to result in significant reductions in cost and time.
We are also leading industry working groups to update the Signalling Works Testing Handbook. These working groups are reviewing the testing specification, which was originally developed for relay based signalling systems, in order to remove duplication and streamline testing processes. This review should enable a larger proportion of testing to be undertaken in the factory rather than at the lineside.
CivilsThe overall level of activity in the early years of CP4 will be broadly similar to the later years of CP3, during which activity increased steadily.
However, the final determinations provided for a significantly lower level of activity and expenditure than forecast in our SBP. This reduction has required the reprioritisation of our workbanks, based on risk assessment.
In reprioritising activity, the volume of drainage work has been maintained at the levels in the SBP as consequential damage to earthworks from inadequate drainage represents a significant risk to operational performance. We have also maintained the planned level of activity for tunnels and a number of major structures. The most significant of these is the Forth Bridge where we have made significant changes to the programme of re-painting. This is due to complete in 2012 and to provide a finish that will last for 30 years.
Figure 19 CP4 signalling renewal volumes
Figure18CP4 signalling expenditure
2009/10 2010/11 2011/12 2012/13 2013/14 CP4 total
SEUs (conventional) 604 1,022 905 1,830 962 5,323
SEUs (ERTMS) 0 0 0 0 653 653
Level crossings (no.) 8 19 88 56 47 218
£m (2009/10 prices) 2009/10 2010/11 2011/12 2012/13 2013/14 CP4 total
Resignalling – conventional 235 262 231 197 186 1,111
Resignalling – ERTMS 16 2 2 18 72 110
ERTMS cab fitment 9 23 27 28 55 142
ERTMS development costs 14 12 5 7 6 44
Level crossings 24 32 35 29 31 151
Minor works/life extension 106 87 70 96 54 413
Other 41 35 27 51 42 196
Total 445 452 398 425 446 2,167

Network Rail CP4 Delivery Plan 200924
On our underbridges and overbridges, we will be undertaking a lower level of preventative maintenance works, such as painting and water-proofing than was our initial intention. We will continue to use painting and waterproofing where it is critical to do so, and we do not expect this change to have a marked adverse impact on performance. But we remain concerned that whole-life costs may be higher, affecting expenditure in CP5 and beyond.
In 2009/10, underbridge work includes replacement of Black Rabbit and Peppering bridges in the south east (£6.2 million), strengthening of Barnes River bridge in the south east (£2 million), strengthening of Runcorn Viaduct in thenorthwest(£3.8million),repairstoNorth Seaton Viaduct and Beddlington Viaduct in the north east (£3.1 million) and work to Drumshoreland bridge and Tulloch Viaduct in Scotland (£2.4 million). Overbridge work includes reconstruction of Garriongill intersection bridge in Scotland (£1.5 million) and reconstruction of Barnetby overbridge in the north east (£1.7 million). Earthworks include embankment stabilisation work between Colchester and Ardley (£3.7 million), £7.8millionof workatHeywoodJunction,Tredington, Chipping Sodbury and Kemble in our Western territory and £5 million of earthworks at Medge Hall in the north east.
Over the coming year, we will continue to work on our prioritisation of work to underbridges, overbridges and earthworks for the remainder of the control period.
We have a number of initiatives to reduce the unit costs for civils work. These include greater standardisation of specifications and designs to reduce the time and cost of developing plans and the unit cost of producing components.
Innovative working techniques have achieved bridge replacements within two eight-hour possessions where previous methods required a 54-hour possession. We intend to improve our forward planning of opportunities to use shorter possessions more widely and therefore expect a growing number of these through CP4 and beyond. We are also planning to increase the proportion of activity undertaken in the summer to maximise use of daylight working.
The plan also provides for works to reduce the risks associated with ancient mine workings underneath the railway formation. Collapses of such workings have resulted in significant costs and performance impacts during CP3.
Operational propertyThe largest component of operational property renewals is franchised stations, where our planned expenditure is significantly higher than in CP3, starting to reverse a long period of under-investment in this area. In 2009/10, we are planning to spend around £152 million. The plan includes £3.5 million of expenditure at London Marylebone to renew the covering on the trainshed roof. We will also be investing around £2 million at each of the following stations: Tipton, Derby, Manchester Victoria, Gourock,
Alexandra Palace, Warrington Bank Quay and Halifax. The works consist mainly of renewal and refurbishment of platforms and platform canopies. These schemes represent around 11 per cent of total franchised stations expenditure in 2009/10. Smaller value renewals work will be undertaken at around 160 other franchised stations in 2009/10. The remainder of the expenditure is for inspections, planned preventative maintenance and minor reactive work. Over CP4 as a whole, the schemes with the largest planned expenditure are at PaisleyGilmourStreet(£8.5million),London Marylebone (£7 million), Gourock (£6.8million),WemyssBay(£4.4million)and York (£3.7 million). Smaller value renewals work will be undertaken at around 675 other franchised stations in CP4.
The managed stations portfolio features a large renewals scheme at Edinburgh Waverley where we are planning over £100 million of expenditure in CP4. The works include the replacement of the station roof and extensive repairs to other elements. Major works already underway at Paddington and Victoria will also continue into 2009/10.
Within the light maintenance depot portfolio, there are significant renewals
Figure 20 CP4 civils expenditure
£m (2009/10 prices) 2009/10 2010/11 2011/12 2012/13 2013/14 CP4 total
Underbridges 94 102 99 97 90 483
Overbridges 35 23 42 41 35 175
Earthworks 91 85 69 68 66 379
Major structures 37 53 24 1 0 115
Tunnels 14 11 27 27 23 102
Other 103 111 79 87 85 466
Total 375 384 341 321 299 1,719

25Network Rail CP4 Delivery Plan 2009
at Swansea Landore, Stewarts Lane, Ramsgate and Bounds Green.
The integrated stations planning initiative, which builds on previous cross-industry work and results from a growing need for better integration of station works, is a key part of our plans for delivery of
operational property renewal in CP4. The initiative aims to optimise the planning and delivery of all station works and it is described in more detail in the Stations Delivery Plan supporting document.
TelecomsTelecoms expenditure is dominated by the Railway Communications System (FTN/GSM-R) programme covering the replacement of the fixed telecoms network and the introduction of a new national driver-to-signaller radio network.
Using FTN/GSM-R technology will deliver direct, secure and even safer communication between train drivers and signallers. The system is being installed across the whole network and will see the current analogue systems replaced by a digital system.
Engaging with local communities is at the heart of our delivery plan. Where possible we try to locate communication masts away from schools, hospitals and residential properties. We have also re-planned our programme to reduce the standard height of masts from 29 to 15 metres, bringing benefits to people living near those sites.
We are increasingly working with train operators and rolling stock companies. This programme offers potential benefits to train performance and the commitment of our customers to the new system is crucial. A major step forward is the delivery of the first new cab radio systems in July 2009.
During 2009/10, the operational trial in Scotland will be completed leading to full approval and subsequent rollout of GSM-R on a national basis. Also during 2009/10, approximately 1,000 sites and 2,600 kilometres of line side cable works will be installed predominantly in the south of the country. The remainder of the infrastructure in this area will be completed in 2010/11.
The biggest challenge for the remainder of the telecoms portfolio is the requirement for a significant increase
Figure 21 CP4 operational property expenditure
£m (2009/10 prices) 2009/10 2010/11 2011/12 2012/13 2013/14 CP4 total
Managed stations 75 83 72 52 17 299
Franchised stations 152 149 147 136 118 702
Light maintenance depots 18 15 12 17 10 71
Lineside buildings 16 14 16 15 15 76
NDS depots 1 1 1 1 1 3
MDU buildings 11 12 12 11 10 55
Other 0 0 0 0 0 1
Total 274 273 259 231 170 1,207
Figure 22 CP4 telecoms expenditure
Figure 23 CP4 telecoms renewal volumes
£m (2009/10 prices) 2009/10 2010/11 2011/12 2012/13 2013/14 CP4 total
FTN/GSM-R 268 262 111 44 24 709
SISS 26 22 17 15 20 99
Other operational 32 36 28 26 29 152
Other 0 0 0 2 2 3
Total 326 320 156 86 74 963
2009/10 2010/11 2011/12 2012/13 2013/14 CP4 total
Large concentrators (no.) 6 9 6 7 6 34
Small concentrators (no.) 50 39 8 6 23 126
DOO CCTV (systems) 275 15 16 76 42 424
PETS (no.) 70 12 0 82 9 173
Voice recorders (no.) 0 17 38 33 19 107

Network Rail CP4 Delivery Plan 200926
in the volume of renewals associated with station information and surveillance systems (SISS) assets compared to CP3. Our plan provides for the renewals necessary given the condition of the assets and the need to maintain their capability. The need for this increase was raisedinourPR08submissionsbutORRchose not to make any allowance for it. This increase in planned expenditure has been accommodated by reprioritisation and reduction in scope of other works. In particular, we have reviewed our asset policy for small and medium sized signal post telephone concentrators in the light of improvements in asset information and have extended the expected asset life from 10 to 15 years. Our CP4 workbank features lower levels of full renewal with more partial renewal through life extension work.
Our plan for 2009/10 includes a large volume of renewal of driver-only operation (DOO) CCTV equipment on commuter routes into London. The current equipment uses obsolete technology and will be replaced with the modern, more reliable technology that is available today.
In 2009/10 we are also planning the renewal of 70 public emergency telephone systems (PETS), primarily in the Newcastle and Westbury areas, driven by asset condition.
ElectrificationA key element of our electrification plan is the rewiring of the Great Eastern Main Line from Liverpool Street to Chelmsford during the next three years. The existing system is 60 years old, difficult to maintain, sensitive to high temperatures and has become increasingly unreliable, causing major performance problems. In 2009/10, we plan to spend £41 million, or 34 per cent of total 2009/10 spend, on this project. Over the control period, the projectrepresents18percentof total
Figure 24 CP4 electrification expenditure
Figure 25 CP4 electrification renewal volumes
£m (2009/10 prices) 2009/10 2010/11 2011/12 2012/13 2013/14 CP4 total
GE OLE 41 41 28 2 0 112
Other OLE 15 17 18 18 17 85
Conductor rail 6 6 6 6 7 32
Distribution – AC systems 5 24 19 26 27 102
Distribution – DC systems 43 50 46 45 44 228
SCADA 10 12 17 7 0 46
Other 0 0 0 5 5 9
Total 120 151 134 109 99 614
2009/10 2010/11 2011/12 2012/13 2013/14 CP4 total
OLE
Campaign A (wire runs) 1,295 1,319 1,245 1,230 808 5,897
Rewire (wire runs) 82 156 128 27 20 413
Structure painting (no.) 83 84 80 79 52 377
Conductor rail (km) 45 46 44 43 29 207
AC distribution
AC HV switchgear (no.) 50 51 48 47 31 227
AC GSP transformer (no.) 2 2 2 2 1 10
AC GSP cable (km) 1 1 1 1 0 4
AC GSP switchgear (no.) 0 0 0 0 0 0
Booster transformers (no.) 92 91 86 83 54 407
DC distribution
DC HV switchgear (no.) 108 113 107 107 71 505
DC HV cabling (km) 56 58 55 55 36 259
LV switchgear (no.) 128 133 125 125 82 593
Transformer rectifiers (no.) 44 46 43 43 28 204
LV cabling (km) 27 28 26 26 17 124

27Network Rail CP4 Delivery Plan 2009
electrification expenditure. The project is planned to be completed in time for the London 2012 Olympics.
We will also undertake additional campaign changes and targeted component renewal on the East Coast Main Line overhead line system in order to improve overall reliability and deliver performance benefits on this major route. This will involve expenditure of around £13 million over CP4 as a whole.
The largest area of activity is the renewal of distribution equipment, particularly on the third rail DC network in the south east. Nationally, during the course of CP4 we will replace the large proportion of our oil-filled high voltage (HV) switchgear and HV cables in line with our asset policy. This equipment is around 50 years old and carries a safety risk as well as performance risks. The remaining oil-filled switchgear units will be replaced in CP5 in order that the work is aligned with signalling renewal activity.
We are continuing to develop our plans for the renewal of supervisory control and data acquisition (SCADA) systems. At present, there are four electro-mechanical control systems remaining, all located in the south east of England. In CP4 we will replace all four of these systems with
a modern electronic system. To enable the systems to be replaced, each of the outstations within the control areas will require a remote terminal unit (RTU) to be installed. There are 232 RTUs to be installed during CP4 followed by further RTU renewals in CP5. Additionally, to allow the RTUs to communicate with the new SCADA systems, we will be installing a fibre data communications network for each electro-mechanical area in CP4.
Plant and machineryThe main components of expenditure on fixed plant are point heaters, signalling power supplies and lineside distribution. The plan includes a point heating renewals programme to replace cartridge points heaters with more effective strip heaters across the south east.
We will also be completing the procurement of an additional high output track renewal system, ballast cleaner and support plant (three tamping machines and two ballast regulators). The new ballast cleaner is expected to start operating in April 2010 with the track renewals system entering operation in January 2011. The systems will initially be used on the West Coast Main Line. The use of this equipment is essential to the
Figure 26 CP4 plant and machinery expenditure
£m (2009/10 prices) 2009/10 2010/11 2011/12 2012/13 2013/14 CP4 total
Fixed plant 37 26 27 33 42 166
High output plant 46 22 4 3 0 75
Intelligent infrastructure 12 11 3 3 1 29
Depot plant 7 4 4 4 2 21
Fleet and machinery (NDS) 16 5 2 2 1 26
Other 25 19 14 11 6 76
Total 141 87 55 56 54 393

Network Rail CP4 Delivery Plan 200928
Figure 27 CP4 IT and other expenditure
£m (2009/10 prices) 2009/10 2010/11 2011/12 2012/13 2013/14 CP4 total
IT 120 68 72 69 64 392
Corporate offices 26 10 43 2 1 81
WCML engineering access 68 5 0 2 2 77
Other renewals 85 42 35 35 33 229
Total 299 124 149 107 100 780
delivery of significant volumes of track renewal on primary routes where access needs to be minimised.
Through our intelligent infrastructure programme, we will be introducing remote condition monitoring on a more widespread basis during CP4. Key systems include points condition monitoring, track circuit monitoring of earth leakage detection equipment on signalling cables and wheel impact detection. During 2009/10, we will prioritise installations towards assets where there is the potential for the greatest improvement in train delay. The rollout of this equipment also has the potential to reduce maintenance costs. Staff will be able to plan remedial works in a more efficient manner and, as we increase our knowledge of asset degradation, we will be able to plan interventions in advance of asset failures.
The main components of depot plant expenditure are carriage wash machines and wheel lathes. Our plans for CP4 include the renewal of a large number of wheel lathes installed around 20 years ago.
Our plans also include other spend associated with power supplies and minor depot plant equipment renewals, such as lifting jacks and cranes.
IT and otherOur plan for IT renewals expenditure covers four broad areas – train and traffic management; asset management; enhancements to corporate information systems; and core renewals such as infrastructure capacity upgrades and technology refreshes for software and hardware. During 2009/10, we will focus on supporting the deployment of intelligent infrastructure, the further expansion of the corporate network model, supporting the evolution of traffic management arising from our operating strategy, essential capacity upgrades and technology replacements within our data centres and the transformation of our Oracle information systems.
In 2009/10, we will spend £26 million on our corporate offices. The 2009/10 programme includes major refurbishments totalling £24 million at four of our head offices. The programme for the rest of CP4 is dominated by the fit out of the national centre at Milton Keynes which represents around 70 per cent of the programme for the final four years of CP4 and the actual expenditure will depend partly on how we decide to finance this investment. Much of the remaining expenditure is on minor refurbishments and the replacement of life expired plant, equipment, furniture and fittings. The refurbishments will bring the majority of our corporate office accommodation up to our national standard.
We will be introducing remote condition monitoring on a more widespread basis during CP4.

29Network Rail CP4 Delivery Plan 2009
We are also continuing expenditure on the West Coast Main Line to allow us to maintain the line with the more limited accessavailablesinceDecember2008.The completion of this work involves expenditureof £68millionin2009/10and£77 million over CP4.
We have included an additional £126 million relating to capitalised overheads that were not funded through the periodic review. We have provided further information to ORR and are currently discussing this with ORR.
Other renewals also include our planned expenditure on the modular S&C initiative, our supply chain project to develop a new warehouse for nationally held inventories, and insourcing of telecoms maintenance contracts.
Expenditure deferred from 2008/09There are a number of projects that we hadexpectedtocompletein2008/09that will now continue into next year. As a result we have included additional expenditure of £211 million. This includes £140 million of expenditure on the West Coast Main Line. There will also be work completed at our maintenance depots(£18million),thecompletionof signalling schemes at Water Orton and South Erewash (£14 million) and three electrification schemes (£9 million). These projects have been funded in CP3. We will report these separately from our overall CP4 financial performance.
Enhancing the networkThis section summarises the enhancements programme planned to bedeliveredinCP4.Figure28providesthe profile of planned expenditure in CP4. We have distinguished between funding throughthePeriodicReview2008(PR08)and non-periodic review funding.
PR08 funded projectsThis section summarises the enhancements to be delivered in CP4 that have been funded through the periodic review. A more detailed description of the outputs, scope and milestones for the enhancement programme is provided as a supporting document (Network Rail CP4 Delivery Plan Enhancements programme: statement of scope, outputs and milestones).
OverviewFigure 29 sets out planned expenditure forPR08fundedenhancements.Thephasing of expenditure reflects the current plan for each programme but constrains the available funding to that provided by the final determinations.
There are two exceptions to this approach. The first is the King’s Cross project where we have assumed that, given the advanced stage of the work, there is limited opportunity to reduce the cost of the project to within the funding made available. The forecast cost of the project in CP4 is nearly £40 million above the funding provided by the final
determinations (in 2009/10 prices). We have included the total forecast cost of the project in the plan. The funding for this is offset by a reduction in projected expenditure on the managed stations renewals programme in CP4.
The second exception is the West Coast Main Line (WCML) committed schemes package. The forecast expenditure for this package of projects in CP4 is £252 million (in 2009/10 prices) less than the funding provided for in the review. This is a consequence of our re-assessment of the delivery programme and the timescales required to obtain Transport and Works Act powers for the Stafford/Colwich remodelling project. We recognise the need to carry forward this under spend to CP5 to support delivery of the project in the next control period.
We have also re-allocated expenditure between renewals and enhancements funding to better reflect the integrated delivery of a number of programmes that combine renewals and enhancements activity. The expenditure proposed in Figure 29 for King’s Cross, Reading and North London Line programmes represent the combined renewals and enhancement expenditure planned in CP4.
Programme packagesIn managing our enhancement programme in order to deliver the outputs within the funding available, we have grouped projects into programmes based on their contribution to the outputs required and the synergies and dependencies between projects. The grouping of projects into programmes therefore covers a common geographical area or common type of activity such as platform lengthening.
The packaging of the projects allows us to examine at a programme level the
Figure28CP4 enhancements expenditure
£m (2009/10 prices) 2009/10 2010/11 2011/12 2012/13 2013/14 CP4 total
PR08(EnglandandWales) 1,155 1,433 1,846 1,653 1,525 7,612
PR08(Scotland) 214 114 53 20 8 410
Total PR08 1,370 1,547 1,899 1,674 1,532 8,022
Non-PR08 563 696 777 820 819 3,676
Total 1,933 2,243 2,677 2,494 2,351 11,698

Network Rail CP4 Delivery Plan 200930
Figure 29 PR08 funded enhancements expenditure
£m (2009/10 prices) 2009/10 2010/11 2011/12 2012/13 2013/14 CP4 total
England and Wales
Network Rail Discretionary Fund 50 50 50 50 50 248
National Stations Improvement Programme 22 18 18 21 21 99
Intercity Express Programme 8 24 60 92 90 275
Strategic Freight Network 30 46 38 50 55 220
Performance Fund 22 18 19 20 21 101
Seven day railway 0 52 53 55 56 217
Safety and environment rollover 97 14 5 0 0 116
CP5 development fund 2 4 9 15 24 53
Access for All 49 43 47 49 45 232
King's Cross 126 106 72 11 14 329
Thameslink Programme 541 598 756 517 501 2,913
Birmingham New Street Gateway Project 1 2 16 85 31 135
East Coast Main Line overhead line electrification 2 6 9 10 10 37
St Pancras – Sheffield linespeed improvements 5 30 30 2 0 67
Nottingham resignalling 0 1 1 8 0 11
North London Line capacity enhancement 20 19 24 3 0 67
Station security 5 3 3 4 3 18
Crossrail and Reading* 45 91 146 139 93 514
Platform lengthening – southern 28 68 98 109 47 350
Power supply upgrade 12 23 32 35 29 131
Southern capacity 3 7 6 13 16 45
East Coast Main Line improvements 12 52 133 177 183 557
Western improvements programme 32 41 10 6 5 95
West Coast Main Line committed schemes 25 56 129 105 180 495
Midlands improvements programme 6 13 16 23 25 83
Northern urban centres – Yorkshire 8 27 34 19 0 88
Northern urban centres – Manchester 4 14 22 26 20 87
Liverpool – Leeds linespeed improvements 1 6 8 9 6 30
Total England and Wales 1,155 1,433 1,846 1,653 1,525 7,612 * The amounts shown here only include the Reading element of the integrated Crossrail and Reading programme since Crossrail is not funded through the periodic review.

31Network Rail CP4 Delivery Plan 2009
Figure 29 PR08 funded enhancements expenditure continued
£m (2009/10 prices) 2009/10 2010/11 2011/12 2012/13 2013/14 CP4 total
Scotland
Airdrie – Bathgate 151 50 1 0 0 202
Glasgow Airport Rail Link 40 54 47 14 0 155
Borders Rail 0 0 1 1 1 3
Glasgow to Kilmarnock 15 0 0 0 0 15
Scotland: Tier 3 Development Fund 3 3 3 2 2 14
Scotland Small Projects Fund 4 4 4 4 4 21
Total Scotland 214 111 56 21 8 410
Grand total 1,369 1,544 1,902 1,675 1,532 8,022
opportunities to prioritise projects, and identify efficiencies in terms of costs, scope and delivery. This will enable us to manage the overall portfolio to control costs and to deliver the outputs within the funds available. This will be done in close collaboration with our customers. Figure 29 sets out the packaging we have adopted.
Currently, the forecast aggregate cost of the enhancement portfolio in CP4 funded from the review is significantly in excess of the funding available. The programme with the most significant gap between the funding available and the current estimates of the final cost is the programme to support the train lengthening proposals in London and the south east, where there is currently a funding shortfall of approximately £210 million. However, we are developing these plans and have not provided for the additional current cost estimate in this plan since we intend to manage within the funding available.
In Scotland, ORR will undertake a specific ex post efficiency assessment on GARL, Borders and Glasgow to Kilmarnock to determine the value of expenditure for which we receive funding.
Network Rail’s obligationsIn the supporting enhancements document, we have distinguished between different types of obligation in relation to the projects funded by the review:
• forHLOSspecifiedprojects,weareobliged to deliver the stated scope. These projects include the Thameslink Programme, Access for All, King’s Cross redevelopment, Birmingham New Street, Reading station area redevelopment, projects on the West Coast, Airdrie to Bathgate and Glasgow Airport Rail Link;
• thereareanumberof fundsinCP4such as the Network Rail Discretionary Fund, National Stations Improvement Programme, Strategic Freight Network funds, the CP4 Performance Fund and the Scottish Small Projects Fund for which we are obliged to deliver schemes according to the authorisation process for each fund;
• thereareanumberof schemesthathave been identified as necessary in order to facilitate the operational plans agreed with train operators to deliver the capacity outputs required for England and Wales. In these cases, our obligation is to provide the infrastructure necessary to facilitate the operational plans; and
• thereareschemeswhichhavebeenfunded on the basis of wider criteria other than the HLOS outputs. For these, we must deliver the scheme.
Enhancement projects in England and WalesThe HLOS for England and Wales defines a number of specific schemes to be delivered. It also sets out capacity measures which are to be met for a wider range of specific cities and routes. These capacity measures are explained in Chapter 1 of this document.
We have worked with train operators to agree the operational plans necessary to meet the capacity outputs. These plans are explained in more detail in the supporting route plans. The enhancements programme has been developed to support the implementation of these operational plans.
Set out in Figure 29 is a summary of the major enhancements programme by funding package. Further details are included in the Enhancements programme: statement of scope, outputs and milestones supporting document.
Network Rail Discretionary FundNRDF is provided to fund minor schemes,

Network Rail CP4 Delivery Plan 200932
Figure 30 PR08 enhancements – National
BournemouthBrighton
Exeter
Cardiff
Penzance
Plymouth
Ashford
Bristol
Salisbury
Swindon
Cambridge
Hastings
Milton Keynes
Ramsgate
Southend
Birmingham
Derby Grantham
Crewe
Harwich
Ipswich
Norwich
Barrow
Blackpool
Liverpool
Southport
York
Manchester
Leeds
Carlisle
Chester
Fishguard Harbour
Holyhead
Newcastle
Swansea
Aberdeen
Berwick-on-Tweed
Dundee
Glasgow
Inverness
Scarborough
Stirling
Fort William
Edinburgh
Key
Train lengthening
Linespeed
Capacity
Power supply
New route
Gauge
which can be standalone or linked to renewals. To be eligible, a scheme must have a positive whole-industry business case. The schemes generally result in an increase in capacity or capability of the network.
National Stations Improvement ProgrammeNSIP is a joint industry initiative aiming to deliver station improvements to a minimum of 150 medium sized stations.
Intercity Express Programme IEP outputs include infrastructure ready to accept the operation of the Intercity Express trains being procured under a train service provision contract by the DfT. The scope includes power, platform and gauge works on the East Coast and Great Western Main Line routes.
Strategic Freight NetworkThe objective of this fund is to enhance the network used by freight trains and reduce conflict between freight and passenger traffic. This programme will deliver improved capacity between Ipswich and Peterborough; improved gauge clearance between Southampton and Basingstoke; further operation of freight trains south of London; and a variety of infill gauge and train lengthening schemes on the network.
Performance FundThe objective of the fund is to facilitate performance improvement to deliver the performance targets for PPM and Cancellations and Significant Lateness (CaSL). The fund relates to the achievement of the regulatory outputs for England and Wales.
Seven day railwayThe purpose of this fund is to provide incremental investment and operating expenditure so that we can make progress towards delivering a seven day railway.

33Network Rail CP4 Delivery Plan 2009
Safety and environment rolloverThe determination included a safety and environment rollover fund for specific schemes started in CP3 and programmed for completion early in CP4.
Development fund for CP5 schemesThe fund will be used to develop schemes which are considered likely to be required and funded for delivery during CP5.
Access for AllThe Access for All programme looks to increase the accessibility of about 100 stations by the end of CP4.
King’s CrossThe primary objective of the King’s Cross project is to provide station capacity to handle passengers at peak times by providing a new western concourse containing a mezzanine level to provide retail and leisure facilities. The existing south concourse will be demolished
and the southern square area will be reinstated. A new 12-car platform will be provided within the main trainshed.
Thameslink ProgrammeThe Thameslink Programme will be delivered in three phases. The first of these (Key Output 0) allows for the current levels of train service to run consistently throughout the Thameslink Programme construction periods.
The second phase (Key Output 1) provides an improved train service capacity of up to 16 train paths per hour in each direction between St Pancras International (Low Level) and Blackfriars stations and to allow up to 12-car train length operation between Bedford and Brighton by December 2011.
The key work packages required to deliver this output include major works at Blackfriars and Farringdon stations,
signalling, telecoms, electrification and plant, and permanent way works in the core area; and platform extensions, power upgrade works, route clearance works and some stabling facilities in the outer area.
The final phase (Key Output 2) provides for the completed Thameslink service of up to 24 train paths per hour in each direction between St Pancras International and Blackfriars stations by December 2015. It will also provide new journey opportunities for example between places like Cambridge and Gatwick Airport.
The key work packages required to deliver this output are reconstruction of London Bridge, construction of a new twin-track viaduct at Borough, junction remodelling at Bermondsey and Tanners Hill, a new signalling control centre and further platform extensions, power upgrade works, route clearance works and some stabling facilities in the outer area.
Birmingham New Street Gateway ProjectThe delivery of the Gateway project is being funded in partnership with Advantage West Midlands, Birmingham City Council and Centro. The project will improve passenger capacity and facilities at the station and provide better access into and through the station.
Crossrail and ReadingThe output of this programme is to deliver the scope specified for the Crossrail‘on-networkworks’andtheReading redevelopment project. Although Crossrail is not funded through the periodic review, subject to agreement about funding we propose to manage delivery in conjunction with the Reading project and deliver these projects by an integrated delivery team.
Figure 31 PR08 enhancements – London
Stratford
BarkingMoorgate
Liverpool Street
FenchurchStreet
Kings Cross
St. PancrasEuston
Romford
Upminster
Paddington
Marylebone
CharingCross
Victoria
Enfield
Chingford
Cheshunt
Willesden Junction
Watford Junction
Harrow & Wealdstone Tottenham
Hale
Finsbury Park
AlexandraPalace
Cricklewood
ClaphamJunction
Richmond
Ealing Broadway
Harrow on the Hill
Shepperton
Chessington South
Caterham
East Croydon
Tattenham Corner
EpsomDowns
Sutton
Wimbledon
Weybridge
Hayes
Lewisham
BromleyNorth
BromleySouth
Otford
Sevenoaks
Swanley
Dartford
LondonBridge
Blackfriars
Hampton Court
AC
Waterloo
Cannon Street
Train lengtheningCapacityPower supply upgradeGreater London BoundaryStations
Key

Network Rail CP4 Delivery Plan 200934
The Crossrail project is jointly sponsored by DfT and Transport for London and is being developed by Crossrail Limited. ThenewCrossrailAct2008givesauthority for the railway to be built.
Crossrail aims to provide 24 trains per hour through 23 kilometres of new subsurface railway infrastructure under central London, continuing outwards to the east and west over 76 kilometres of some of the most congested and complex rail infrastructure in the UK. The project is targeting completion in 2017.
Train lengthening – southernThis programme is targeted at allowing the operation of longer trains on key routes within the south east of England. The programme of enhancements within this package, in combination with the Thameslink Programme described earlier, will enable the relevant train operating companies to strengthen and lengthen services in the peak hours to deliver the increased passenger capacity into Fenchurch Street, Liverpool Street, Waterloo, London Bridge and Victoria.
Power supply upgradeThis package consists of a number of power supply upgrade projects in the south east which are necessary to supportthe‘trainlengthening–southern’programme. It also encompasses the regenerative braking power project.
Southern capacityThis programme will provide the necessary passenger capacity at Gatwick airport, East Croydon and Seven Sisters stations as well as improving the operational robustness at Gatwick Airport.
ECML improvementsEast Coast Main Line improvements package consists of projects specified by ORR as required to deliver the passenger
kilometre specification on Strategic Route 8andLondoncapacityspecification.It also contains projects necessary to facilitate the operational plans.
The schemes specified by ORR are:
• capacityrelief totheECMLjointline;• Peterboroughstationareacapacity
enhancements;• AlexandraPalacetoFinsburyPark
third up line;• FinsburyParktoAlexandraPalace
third down line improvements;• ECMLlevelcrossings;• Hitchingradeseparation;• YorkHolgatejunctionfourthline;and• Shaftholmejunctionremodelling.
For many of the above schemes the delivery date is towards the end of the control period. We are currently reviewing the overall programme of ECML projects over the control period.
In addition improvements on the Moorgate branch and First Capital Connect train lengthening schemes are necessary to support the operational plans.
Western improvements programmeThe schemes defined by ORR to be delivered are:
• Barry–Cardiff QueenStreetcorridor;• Cotswoldlineredoubling;and• WesterleighJunctiontoBarntGreen
linespeed improvement.
In addition the Maidenhead and Twyford relief line platform extensions project is necessary to support the operational plans.
WCML committed schemesThis package contains the schemes required to continue to enhance the capacity on the West Coast Main Line

35Network Rail CP4 Delivery Plan 2009
including Bletchley remodelling, power supply upgrade and Stafford/Colwich remodelling.
Midlands improvements programmeThe schemes defined by ORR to be delivered are:
• Bromsgroveelectrification;• Redditchbranchenhancement;and• linespeedimprovementsonthe
Wrexham to London Marylebone route.
In addition train lengthening schemes on Strategic Routes 16, 17 and 19 are necessary to support the operational plans.
Northern urban centres – YorkshireThis will deliver the infrastructure necessary to support the operational plans in the Yorkshire area. It contains a number of infrastructure enhancements including additional platforms, turnback facilities and stabling in order to do this.
Northern urban centres – ManchesterThis will deliver the infrastructure necessary to support the operational plans in the Manchester area. It consists of a programme of train lengthening and stabling with redevelopment of Salford Crescent station and a number of small, value for money, capacity projects.
Enhancement projects in ScotlandThis programme of works encompasses Airdrie – Bathgate, Glasgow Airport Rail Link (GARL), Glasgow – Kilmarnock and the Borders projects.
Airdrie – BathgateAirdrie – Bathgate will provide an electrified railway between Airdrie and Bathgate, capable of operating a minimum of four passenger trains per hour. In order to achieve this there is a wide programme of infrastructure works including new track, electrification,
stations, platforms at existing stations and car parking facilities.
Glasgow Airport Rail LinkThe GARL project will provide infrastructure to support a direct rail service with a 15-minute frequency between Glasgow Central and Glasgow Airport stations with a stop at Paisley Gilmour Street. The works includes the Paisley corridor renewals as well as works to transfer signalling control to the new West of Scotland signalling centre. In addition a third running line on the Paisley corridor and additional platform capacity at Glasgow Central will be provided.
Borders RailwayThe Borders Railway comprises a new railway line connecting Midlothian and Scottish Borders Local Authority areas to central Edinburgh and the national rail network. The Network Rail output is to provide asset protection to the existing network during the project. The precise scope of work required from Network Rail is still subject to discussion with Transport Scotland and the funding provided through the review will be applied to the final scope.
Glasgow to KilmarnockThe Glasgow to Kilmarnock project will provide a twin tracked section of railway between Lugton and south of Stewarton capable of supporting operation of half hourly passenger services between Kilmarnock and Glasgow.
Scotland: Tier 3 Development FundThe fund is primarily aimed at initial development for future schemes that will enhance the network in Scotland and will contribute to the Scottish Government’s target of promoting sustainable economic growth.
Scotland Small Projects FundThis fund is primarily aimed at small schemes that will result in an increase
in the capacity or capability of the network in Scotland. It is expected that most schemes will involve incremental enhancements linked to renewals as this is likely to provide the greatest value for money. However, standalone enhancement schemes are also possible, including those part-funded by third parties.
Non-PR08 funded schemesThereareawiderangeof non-PR08funded schemes proposed for delivery in CP4. These schemes can be funded by any party that wishes to enhance the railway network.
Theprogrammeof non-PR08schemesare subject to individual contractual and funding arrangements with the relevant funding parties in accordance with the investment framework. Therefore, not all the schemes are contractually committed at this stage and in our planning we have to take a view of the probability of the portfolio of schemes progressing for deliverability and financing purposes.
There are a number of government funded schemes that were not included in the funding from the periodic review. In EnglandthisincludestheCrossrail‘on-network works’ (referred to above due to its integration with the Reading scheme). The Welsh Assembly Government is funding investment in station regeneration including at Newport, and frequency enhancements at Maesteg. Transport Scotland are promoting schemes including improvements to the Edinburgh to Glasgow corridor and Highland Main Line.
Where funders wish to fund any of these enhancements through the Regulatory Asset Base (RAB) in accordance with the investment framework established in the periodic review, we will work with them and ORR to satisfy ourselves that the future implications for our charges are sustainable and affordable.

Network Rail CP4 Delivery Plan 200936
Thelargernon-PR08schemesaresummarised below.
Edinburgh to Glasgow improvementsThe Edinburgh to Glasgow Improvements Programme will provide a significant upgrade to central Scotland’s transport links through the delivery of improved rail connections between Edinburgh and Glasgow, providing faster and more frequent services. The potential scope includes:
• anelectrifiedrailwaybetweenEdinburgh and Glasgow Queen Street (including diversion routes), the line via Cumbernauld and lines to Dunblane and Alloa;
• anewstationatGogartoserveEdinburgh Airport (via the tram) and a new curve at Dalmeny to allow Edinburgh to Glasgow services to access the new station;
• sixtrainsperhourbetweenEdinburghand Queen Street with the fastest journey time of around 35 minutes and a mixture of stopping patterns to serve intermediate stations; and
• threetrainsperhourbetweenEdinburgh and Glasgow Central (one stopping service and two semi-fast services) serving both the Shotts and Carstairs routes.
Other schemes in ScotlandTransport Scotland published the Strategic Transport Projects Review (STPR)inDecember2008consideringoptions for improvement to the transport infrastructure in Scotland beyond 2012. The proposals include 11 major packages of work targeted at improvements in rail infrastructure. Network Rail and Transport Scotland will continue to work together to develop these options to increase capacity and improve capability on the network. The Scotland project development fund will be available in CP4
to begin the initial development of these projects.
Current growth predictions suggest that platform extensions will also be required to permit longer trains to operate in Ayrshire. Glasgow to Ayr and Largs lines will have the platforms extended to seven-car length with a passive provision for eight-car using selective door opening technology. The Inverclyde route will also benefit from extended platforms to facilitate the introduction of the new rolling stock with selective door opening technology to facilitate seven-car trains. Options for delivering these extensions were included in the Scotland RUS and are being progressed.
On the Highlands route additional infrastructure may be required to facilitate increased line capacity and reduced journey time between Aberdeen and Inverness. In addition, the RUS included the option to enhance the infrastructure between Perth and Inverness to permit an increased frequency and reduced journey time. Network Rail has now been commissioned by Transport Scotland to develop this proposal further. It is primarily focused on journey time reductions and frequency improvements through linespeed enhancements and redoubling of sections of track.
London 2012 OlympicsThere are a number of projects falling into a programme of works being delivered for the Olympic Delivery Authority (ODA). They are designed to enhance the railway infrastructure in order to accommodate the demand forecast during the 2012 Olympic and Paralympic games and beyond. Schemes included in the ODA sponsored works are:
• AngelLanefreightloop;
• StratfordRegionalStationupgrade–an enhancement to Stratford station encompassing platform widening, reopening a derelict subway, constructing additional lifts and stairs to aid passenger circulation around the station and a variety of power and telecoms enhancements;
• additionalLondonUndergroundCentral line platform at Stratford station; and
• GospelOaktoBarkingcapacityenhancements.
AirtrackThe Airtrack project is in development, currently sponsored by BAA. The scheme aims to provide two trains per hour from Reading, Waterloo and Guildford to Heathrow Terminal 5 (T5) via a new section of railway from Staines to the airport. In addition, BAA is keen to provide a two trains per hour shuttle service between T5 and a new bay platform at Staines by extending the Heathrow Express service south from the airport. We are developing the timetable, signalling and power design plus the on-network rail infrastructure.
Infrastructure specified for the project includes a new chord and a new bay platform at Staines and about four kilometres of new track from a junction off the Windsor line just north of Staines through to the new station at T5 where two platforms are to be fitted out for Airtrack services. In addition, the scheme will benefit from a new Platform 4c at Reading to be funded and provided as part of the Reading station redevelopment project, and also from capacity improvements planned at Waterloo station as part of the project to bring the disused International Terminal platforms into use for domestic services.

37Network Rail CP4 Delivery Plan 2009
Evergreen 3This is a proposed link at Bicester to connect the London Marylebone – Birmingham Snow Hill line with the route between Oxford and Bicester Town. This project is third party funded and delivered but will become a Network Rail asset on completion.
Transport Innovation FundThe Transport Innovation Fund (TIF) was announced in the DfT’s 2004 White Paper‘TheFutureof Transport’.Projectsbeing funded through TIF in CP4 are the Southampton to West Coast Main Line W10 project; Peterborough to Nuneaton W10 project; Chat Moss gauge enhancement and four tracking in the Camden Road area to benefit freight.
Peterborough to Nuneaton W10 projectThis project involves gauge clearance of the route from Peterborough to Nuneaton to W10 gauge. There will be the provision of a grade separated link at Nuneaton for trains from the Leicester direction to the Trent Valley line. The project will also provide capacity enhancements in the Bury St. Edmunds – Kennett area to enable up to eight intermodal trains per day in each direction, in addition to other
traffic types. There are already some intermodal services on this route and those are within the target of eight trains per day figure. Commissioning is due to take place at the end of 2011.
Southampton to West Coast Main Line W10 projectThis scheme will provide a W10 gauge cleared route from Southampton to Nuneaton and Birmingham. It is due to complete mid 2011. The project will include work on approximately 50 separate structures including tunnels, overbridges and stations.
Chat Moss gauge enhancementThe gauge enhancement scheme will increase gauge to W10 on the Chat Moss route to Edgehill and Earlestown route. It is part of the Olive Mount Chord scheme and should be complete in 2009/10.
Figure 32 Investment expenditure trend (£bn, 2009/10 prices)
0
1
2
3
4
5
2004/05 2005/06 2006/07 2007/08 2008/09 2009/10 2010/11 2011/12 2012/13 20013/14
Renewals expenditure Enhancements expenditure
1.0 0.5 0.6 1.11.5
1.92.2
2.5 2.42.7
3.0 2.9 2.9 2.9 3.2 2.7 2.5 2.2 2.0 1.9

Network Rail CP4 Delivery Plan 200938
Four tracking in the Camden Road areaThis project would give four running lines between Camden Road east and west junctions. The principal benefit is intended to be for freight movements. In particular the enhancement may be expected to provide one additional eastbound freight path per hour. The robustness of the route in times of disruption will also be improved.
Deliverability of the investment programmeThis section describes the plans in place to enable us to deliver the capital investment programme described above.
The scope of the challenge to deliver investment is significantly greater in CP4 than in CP3. This is predominantly driven by an increase in enhancements expenditure of around £7 billion compared to CP3. This is shown in Figure 32.
Our profile of enhancements expenditure is smoother than was assumed in the final determinations with less activity in the first two years. The most significant reason for this is reprofiling of the Thameslink Programme due to later phasing of activity as the programme is firmed up and reduced estimates of TOC compensation. Other programmes, particularly on the East and West Coast Main Lines have been re-phased in light of further assessment of programmes and planning processes.
By their nature, enhancement projects are generally more complex to manage and deliver than renewals schemes. Enhancements tend to be more multi-disciplinary and have a greater number of interfaces and dependencies to manage. The programme includes a number of large, complex on-network projects being delivered in the south east of England including the Thameslink Programme,
London 2012 Olympics-related projects and Crossrail.
We have assessed the deliverability challenges this portfolio of work presents and developed a robust strategy for mitigating the risks and delivering the commitments set out in this plan. Our delivery strategy will enable us to deliver the forecast renewals and enhancement volumes within defined time periods and to a defined efficiency profile.
We have reviewed our capacity to deliver each key category of spend and made an assessment of key activities such as specification, design, installation and commissioning. We believe the supply market in most areas is capable to supporting delivery of our investment programme in CP4 and we will proactively manage our key challenges.
Key challengesWe have assessed the risks of us not having sufficient internal capacity or capability to deliver the CP4 investment programme. The key challenges identified include:
• ensuringclearandtimelyremitsandproject definitions;
• managingthecomplexityandinterdependencies between programmes and projects and within complex projects in terms of both scope and schedule;
• developingrobustprojectplanswhich adequately reflect these dependencies and other issues such as stakeholder management and planning consents;
• prioritisationanddeploymentof critical scarce resources across the programme and ensuring sufficient capacity to deliver the volume of work;
• managingthedemandforaccesstothe operational railway that balances the need to deliver the volume of work
The scope of the challenge to deliver investment is significantly greater in CP4 than in CP3.
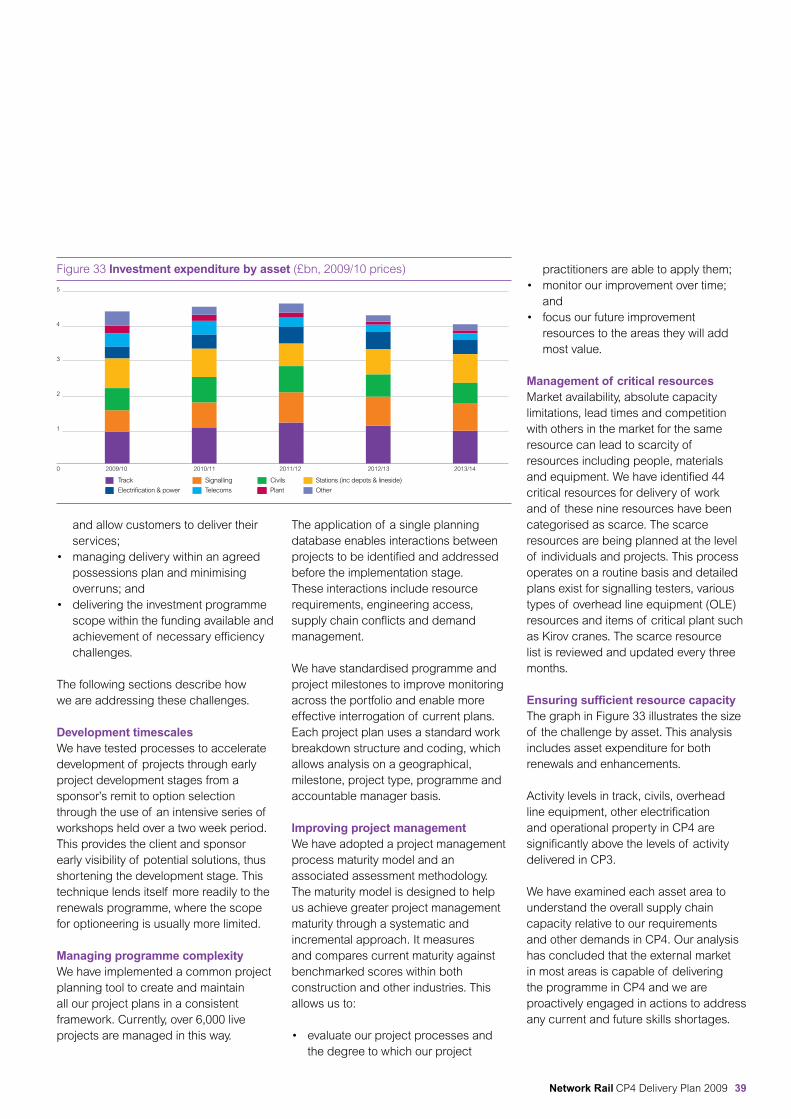
39Network Rail CP4 Delivery Plan 2009
and allow customers to deliver their services;
• managingdeliverywithinanagreedpossessions plan and minimising overruns; and
• deliveringtheinvestmentprogrammescope within the funding available and achievement of necessary efficiency challenges.
The following sections describe how we are addressing these challenges.
Development timescalesWe have tested processes to accelerate development of projects through early project development stages from a sponsor’s remit to option selection through the use of an intensive series of workshops held over a two week period. This provides the client and sponsor early visibility of potential solutions, thus shortening the development stage. This technique lends itself more readily to the renewals programme, where the scope for optioneering is usually more limited.
Managing programme complexityWe have implemented a common project planning tool to create and maintain all our project plans in a consistent framework. Currently, over 6,000 live projects are managed in this way.
The application of a single planning database enables interactions between projects to be identified and addressed before the implementation stage. These interactions include resource requirements, engineering access, supply chain conflicts and demand management.
We have standardised programme and project milestones to improve monitoring across the portfolio and enable more effective interrogation of current plans. Each project plan uses a standard work breakdown structure and coding, which allows analysis on a geographical, milestone, project type, programme and accountable manager basis.
Improving project managementWe have adopted a project management process maturity model and an associated assessment methodology. The maturity model is designed to help us achieve greater project management maturity through a systematic and incremental approach. It measures and compares current maturity against benchmarked scores within both construction and other industries. This allows us to:
• evaluateourprojectprocessesandthe degree to which our project
practitioners are able to apply them;• monitorourimprovementovertime;
and• focusourfutureimprovement
resources to the areas they will add most value.
Management of critical resourcesMarket availability, absolute capacity limitations, lead times and competition with others in the market for the same resource can lead to scarcity of resources including people, materials and equipment. We have identified 44 critical resources for delivery of work and of these nine resources have been categorised as scarce. The scarce resources are being planned at the level of individuals and projects. This process operates on a routine basis and detailed plans exist for signalling testers, various types of overhead line equipment (OLE) resources and items of critical plant such as Kirov cranes. The scarce resource list is reviewed and updated every three months.
Ensuring sufficient resource capacityThe graph in Figure 33 illustrates the size of the challenge by asset. This analysis includes asset expenditure for both renewals and enhancements.
Activity levels in track, civils, overhead line equipment, other electrification and operational property in CP4 are significantly above the levels of activity delivered in CP3.
We have examined each asset area to understand the overall supply chain capacity relative to our requirements and other demands in CP4. Our analysis has concluded that the external market in most areas is capable of delivering the programme in CP4 and we are proactively engaged in actions to address any current and future skills shortages.
Figure 33 Investment expenditure by asset (£bn, 2009/10 prices)
0
1
2
3
4
5
2009/10 2010/11 2011/12 2012/13 2013/14
Track
Electrification & power
Signalling
Telecoms
Civils
Plant
Stations (inc depots & lineside)
Other

Network Rail CP4 Delivery Plan 200940
TrackIt is expected that our plain line track renewal activity in CP4 will not be significantly above the annual peak we delivered in 2006/07 of 2,600 composite kilometres of renewal. Several major enhancements such as Airdrie – Bathgate, GARL and Crossrail create an increase in plain line track volumes in CP4. This additional demand has been assessed and we do not foresee any significant constraints.
The greater increase in activity volumes relates to switches and crossings (S&C). The CP4 investment programme includes installation of up to 600 units per year compared with a current installation capacity of 490 units. Manufacturing capability is not considered to be a constraint as current capacity is around 800unitsperyear.
The constraints on S&C installation will be addressed by a combination of:
• theincreaseduseof modularS&C;• lifeextensionof afurther50S&Cunits
per year using heavy maintenance; • designstandardisationinorderto
enable faster design throughput; and • carefulmanagementof signalling
testers.
SignallingInstallation of signalling equipment is currently planned to increase to a peak of approximately 2,750 SEUs in 2012/13 from2,200SEUsin2007/08.Thisspikewill need to be smoothed as plans are refined. The long development period associated with signalling projects aids the smoothing of the delivery programme.
The move to smaller, multiple stage works, rather than big blockades, will avoid resource demand peaks at bank holidays. There is also a cross-industry project to reduce the lifecycle of a signalling
project so that project throughput can be increased.
Enhancement projects make up approximately 40 per cent of the signalling programme and there will be economies of scale to be realised by delivering some elements of this as an integrated programme with planned renewals works. This is currently under review.
Signalling testers are a critical resource. We now manage the signalling tester pool across the supply chain with resource requirements planned in detail and named individuals assigned against testing shifts to ensure that the resource is available.
CivilsOur view is that the construction market is well able to meet our demand for construction activity in CP4. There is significant activity focussed in the south east with a clustering of projects such as those related to the London 2012 Olympics, Thameslink, Crossrail and major property developments. However, such major projects represent less than 15 per cent of the total construction market in the region and we do not believe the construction market is a risk to delivery.
TelecomsThere is adequate resource to meet demand in this market. There is significant capacity in the market with suppliers for whom Network Rail is currently not a customer but could be in future.
Electrification and plant – overhead line equipment (OLE)OLE installation will be ramped up significantly in CP4, with over 50 per cent growth at the CP4 peak. There will be a shift towards larger projects and programmes, for example replacement
of OLE on the East Coast Main Line. This change in activity will help suppliers to plan and deliver work. We will also address the increase in activity by:
• usinglargercontractpackagesto simplify procurement and improve productivity. This has been demonstrated on the Great Eastern Main Line replacement project;
• refurbishingoursecondre-wiringtrainfor use from 2010;
• utilisingourmaintenanceorganisationto deliver small renewals and enhancement projects;
• closelymanagingOLEresourceacross Network Rail at the level of specific individuals; and
• developingourin-housecapabilitytosupport existing resource.
Electrification and plant – distribution and plantThere is a large increase in activity in CP4. However, it is well within the capacity of the market and is below the level of volumes that have been delivered previously (for example, on the southern power supply upgrade).
The concentration of work in the south east may create localised pressure on resources. Therefore, wherever practicable, we will allocate work to contractors and internal resource outside the south east.
Access planning and possession managementPoor planning of the use of possessions can cause possession opportunities to be lost. This reduces delivery volumes, causes delay and erodes efficiencies. We have developed a major programme of improvements addressing shortcomings in risk, site and supply chain management and communications. This has culminated in the release of new processes in
41Network Rail CP4 Delivery Plan 2009
each of these areas adopted by all projects requiring possessions on the operational railway. Possession planning is now managed by a single integrated planning group. Through this group we will package worksites together to maximise the efficient use of access. The ability to examine the possession and project planning constraints on the same planning system is an important contributor to removing access conflicts and minimising overall engineering access.
Supply chain managementWe have implemented a supplier account management process with key partners whichaccountforapproximately80percent of our external expenditure. We need to be a more market focused client, including:
• usingcategorymanagementtogivespecific markets very early warning of work volumes;
• sharingourinvestmentplanswithsuppliers at the earliest opportunity;
• preparingtenderlistsandsharingdesign and programme information earlier in the procurement process;
• havingshortertenderliststoreducethe estimating and engineering resource needed in the bid process;
• creatingnetworksof suppliersforthe programmes of work, working more closely with the supply chain for repeatable activity; and
• utilisingotherassetsframeworkswhere they can be demonstrated to be cost effective.
By implementing these initiatives we will grow the capability of specific markets to ensure security of supply. With strategic use of tendering for bespoke projects and closer supplier involvement we will create a suitable environment to drive efficiency for this programme.
Contracting strategySimilar works with a generally common supply base have been grouped together into categories. We are using category management in order to align and coordinate our sourcing and purchasing.
Strategic sourcing is a framework to manage procurement requirements across the company in a consistent way. Using category management in conjunction with strategic sourcing we are able to produce a structured, comprehensive and action oriented plan of action for major areas of expenditure.
Each delivery programme has developed a specific commercial strategy which is being implemented to support delivery in CP4. There are three main procurement routes:
• directcontract;• categoryframework;and• enhancementframework.

Network Rail CP4 Delivery Plan 200942
Internal capacity and capabilityOur forecast of internal headcount requirement by type of project is shown in Figure 34. Initiatives in place to deliver the required increase in headcount include:
• redeploymentof WestCoastRouteModernisation staff;
• recruitmentcurrentlyrunningat around 45 staff per period;• headhuntingof appropriatecalibre
staff for the higher banded roles;• increasingawarenessintheexternal market of Network Rail as a project delivery organisation;•on-lineadvertisingonspecialist
websites;• ‘homegrown’recruitmentand
conversion of engineers to project delivery roles;
• crossassetdeliveryof schemesbyasset type, utilising existing teams;
• matrixmanagementof ourresourcesas a pool of like-roles across assets; and
• graduaterecruitmentprogrammesincluding MSc programmes at Warwick University and University College London, and general graduate recruitment.
Internal organisationWe are changing the structure of our delivery organisation. The old structure was designed to facilitate the implementation of a common way of working and standardisation of delivery processes as we sought to deliver efficiencies during CP3. However, the scale and the complexity of the investment portfolio in CP4 will require a more flexible organisation. We are adopting a matrix approach to our delivery organisation. This will provide:
• animprovedfocusondelivery;• agreaterapplicationof ourresource
management techniques;• acultureof deliveryalignedto
commercial needs; and• clearaccountabilityasacore
principle.
Resource management will be more robust:
• aProgrammeManagementOfficewill facilitate, plan and review project delivery;
• theresourcepoolwillbemanagedin terms of practices of people with similar competencies and knowledge such as engineering, planning, and project management;
Figure 34 Investment programme resource requirement (headcount)
0
1,000
2,000
3,000
4,000
5,000
2009/10 2010/112007/08 2008/09 2011/12 2012/13 20013/14
Construction
Thameslink (inc King’s Cross)
SP&C (inc ERTMS)
Crossrail (inc Reading)
Track
WCRM
FTN/GSM-R
Programme controls & HSQE
Enhancements
The scale and the complexity of the investment portfolio in CP4 will require a more flexible organisation.

43Network Rail CP4 Delivery Plan 2009
• practiceleaderswillberesponsiblefor defining and assuring excellence, people management and providing a focus on capability, process and performance; and
• programmedeliveryteamswillallbeassigned senior resource planners.
Delivering the outputsIn this section we summarise how the plans described above contribute to the achievement of the top-level regulated outputs described in Chapter 2 and meet the needs of our customers and wider stakeholders.
A safer railwaySafety on the railway depends largely on the proper design, construction, maintenance and operation of the network. Most safety improvements will come from more effective and efficient development and management of the network, rather than from specific safety initiatives. The health and safety plan for CP4 is therefore based to a large extent on the impact that our asset and route strategies will have on overall safety performance.
Appendices 14 and 15 set out the forecast of our internal passenger and workforce safety measures that will contribute to the achievement of the three per cent reduction in safety risk that the we are required to deliver.
Our internal passenger safety index measures risk associated with our activity and underpins the industry passenger safety metric on which the top-level regulated outputs are based. The measure is a forecast of the risk of fatalities and weighted injuries normalised per billion passenger kilometres.
The workforce measure is a forecast risk of our workforce, including contractors, fatalities and weighted injuries per million hours worked.
The largest contributor to the reduction in passenger risk is station-related through improved design, signage and lighting, surveillance and CCTV initiatives, staff training and emergency planning. This is expected to account for just over 90 per cent of the passenger related risk reduction.
The second largest contribution (2.4 per cent) is the reduction in track faults including less broken rails, improved geometry and fewer gauge faults.
The third biggest contributor (two per cent) is the reduction in level crossing risk through renewal including updates to modern standards, technology improvements, closure programmes as well as media campaigns.
The biggest contributors to improved workforce safety are system design including improved tools and equipment, risk planning and control, leadership actions, competence management, safety communications and assurance. These account for over 93 per cent of the reduction in workforce safety risk. The next biggest contributor at nearly four per cent is improved station environments.
We operate formal change management arrangements to control the introduction of change and to confirm that all safety risks are identified, systematically addressed and controlled. These arrangements are defined in our Health & Safety Management System and supporting standards and procedures. These arrangements will be applied, where appropriate, to initiatives implemented during CP4.
Further detail of the initiatives to improve safety performance in CP4 can be found in the Safety Delivery Plan supporting document.
A high performing railwayThe key initiatives contributing to the improvement in the Public Performance Measure (PPM) in CP4 are:
• morerobustandrealistictimetables,through the introduction of new systems and improved modelling (+0.6 per cent PPM);
• managementandprocessimprovements, including maintenance benchmarking and network availability initiatives (+0.4 per cent PPM);
• measurestopreventincidentswhichimpact on performance, for example remote condition monitoring, rail grinding and the new measurement train (+0.3 per cent PPM);
• improvedcontrolinitiatives,includingincident management arrangements and contingency planning (+0.3 per cent PPM);
• performancebenefitsfromtheassetrenewals programme (+0.1 per cent PPM); and
• performancebenefitsresultingfrom the implementation of the enhancements programmes (+0.1 per cent PPM).
Accurate and robust timetables are critical to performance. Major timetable changes are proposed over the next few years for several routes, including Great Western, Trans-Pennine, East Coast, Brighton Main Line, North London Line, West Coast, Cross Country and North Kent. We will work with the operators on these routes to use this opportunity to carry out a fundamental timetable review with the aim of improving overall route performance.
Our analysis has also identified 900 out of 20,000 individual train paths for which PPM is less than 70 per cent. We have carried out similar analysis for each TOC to assess where the timetabled paths do not appear to be robust. As a result we

Network Rail CP4 Delivery Plan 200944
are proposing to work with operators to understand the underlying causes so that we can implement an improved timetable.
We have introduced benchmarking of the performance of maintenance delivery units. The quality league table compares the performance of delivery units’ ability to maintain the infrastructure by comparing normalised failures of track, signals, points, track circuits and repeat failures. Local managers will identify and implement a series of small projects and initiatives aimed to close the differential in productivity and reliability performance of delivery units. The effectiveness of infrastructure initiatives to improve performance will be reviewed every four weeks by route reliability review groups. These groups have recently been established and involve senior representatives from our maintenance, renewals and engineering activities.
Other key asset management initiatives include the installation of remote condition monitoring equipment to points, track circuits, power supplies, level crossings and flood telemetry systems. This will reduce the number of asset failures through effective prediction, improve response times and allow better long-term planning.
The most significant contribution to improved service performance from our asset renewals programme is the renewal of plain line and S&C track. This will deliver benefits on both the primary and secondary routes on the network.
We will deliver a number of enhancements, primarily aimed at providing additional network capacity. There are two enhancement schemes specifically aimed at improving reliability and punctuality. These are the East Coast Main Line (ECML) overhead line improvement works and the Cotswold line
redoubling. Both of these projects deliver improvements to the long distance sector.
In order to achieve the top-level performance outputs in England and Wales, a specific CP4 performance fund has been created for specific performance focused initiatives. These funds will be initially allocated to routes proportionally to the size of the performance challenge within each route. The fund will be used to deliver PPM and cancellation and significant lateness benefits in the most cost effective way to the industry. Industry engagement will be through the joint performance process to agree which schemes will be delivered.
Further detail of the initiatives to improve service performance in CP4 can be found in the Performance Delivery Plan supporting document.
Greater availabilityThe plan to deliver enhanced network availability is built around a set of activities which change the way in which engineering possessions are planned and implemented.
The overall programme to reduce the level of disruption caused by possessions and improve the availability of the network is driven by a set of discrete but interdependent plans which both improve possession productivity and reduce the time required to undertake maintenance and renewals tasks. The core initiatives and activities which will improve network availability are:
• amoveawayfromlongpossessionsat weekends which currently close the network to traffic for one or two days;
• changestoworkingpracticesand methods which allow existing maintenance and renewals activities to take place during a series of shorter possessions;
• provisionof newequipment,accesspoints and infrastructure to enable shorter possessions;
• considerationof opportunitiestooperate trains on one line of a two line railway while engineering work takes place on the adjacent line, using existing infrastructure;
• provisionof newsinglelineworkingopportunities through the provision of new crossovers and associated signalling;
• exploitationof existingdiversionaryroutes; and
• enhancingroutes,forexamplebyproviding additional clearance, to provide additional diversionary opportunities.
During CP3 we made significant progress in moving towards a seven day railway on the West Coast Main Line, enabling the significant increase in network availability which was required to operate the December2008timetable.Asaresultthere are over 60,000 extra seats per day available on over 1,000 extra weekly services.
We are now developing a programme that will move towards meeting our customers’ future aspirations for network availability on other routes where benefits can be demonstrated. The industry has been working together to understand what a seven day railway would actually mean for each route, and to define the enabling interventions which would be required. We have, in conjunction with train operators, identified eight priority routes on which seven day railway investment would deliver the greatest benefit. These routes are:
• EastCoastMainLine;• GreatEasternMainLine;• GreatWesternMainLine;• MidlandMainLine;• CrossCountry;

45Network Rail CP4 Delivery Plan 2009
• SouthWestMainLine(London–Weymouth);
• WestAnglia;and• SouthHumbersidefreight.
Since this initial assessment, further candidate routes for intervention have been identified, particularly where benefits from national maintenance and renewals initiatives can be secured. These include the Kent and Sussex routes.
Further detail of the initiatives to improve network availability in CP4 can be found in the Network Availability Delivery Plan supporting document.
Sound asset stewardship Apart from two specific output measures for stations and depots, the condition and reliability of our infrastructure does not form part of the regulated outputs and we are not required to deliver a specified level of asset renewal activity. Nonetheless achieving the specified outputs will require an improvement in overall asset reliability as a key factor in the performance of the rail system and the punctuality of the train service. We are committed to delivering the required outputs in a sustainable way consistent with good long-term stewardship of our assets.
We have moved to a risk-based approach to the development of our asset management strategies. This has led to an increased focus on the role of the assets in supporting the safe delivery of the required train service reliability. It has provided us with an increased ability to target more precisely local asset condition and reliability objectives.
We have continued to refine the condition and reliability metrics that we are using to target our asset management teams and to measure progress against these
targets. Detailed condition and reliability monitoring is supplemented by measures to assess the overall condition of our infrastructure, in part to confirm our ability to deliver the required outputs in a sustainable manner in future control periods. Our key asset condition and reliability projections are set out in Appendix 16.
We have developed overall stewardship indicators that are based on weighted averages of specific condition and reliability measures for each asset. We have developed projections for these based on the underlying condition and reliability stewardship forecasts to provide us with a measure of the effectiveness of our asset stewardship, and to help us target appropriate remedial action when necessary. Forecasts for these indicators are shown in Appendix 17.
The overall asset stewardship indicator combines the individual indicators and provides an assessment of the overall condition of the network. For the first time we have weighted changes in condition by route type, so that an improvement in condition or reliability on a busy commuter route would generally score more heavily than a similar improvement on a more lightly used route.
Our projections for CP4 show that the overall condition of the network is expected to improve by approximately 7.5 per cent. The slightly lower improvement in the indicator for Scotland reflects the fact that much of our activity in CP4 will be on improving the condition of the high speed, high traffic density routes. These routes represent a slightly smaller proportion of the network in Scotland than in England and Wales.
It should be noted that these condition and reliability forecasts reflect our current view of what is needed to support the
The plan to deliver enhanced network availability is built around a set of activities which change the way in which engineering possessions are planned and implemented.

Network Rail CP4 Delivery Plan 200946
delivery of reduced train delays in CP4. However, we are currently reviewing our asset policies, which may result in a number of changes to our condition and reliability forecasts. A key principle that will underpin this review will be to identify efficiency savings that do not adversely impact on the longer term costs of delivering outputs in future control periods.
We are funded to maintain the capability of the network as published on 1 April 2009. This includes track mileage and layout, linespeed, gauge, route availability and electrification type. We are in the process of completing the verification of our published data against actual capability and we have identified a number of mismatches. We are developing a plan to address this and will need to do so within existing funding available. Any changes to the published information will be modified through established industry processes.
InteroperabilityOur policy in respect of European Union (EU) interoperability requirements is to maintain compliance with the Railways Interoperability Regulations 2006 and seek to influence the development of the EU standards that interoperability mandates. We do this through participating in the drafting of these standards so that we understand and influence what is required to achieve compliance.
The other obligation placed on us by interoperability is that we should not do anything in an enhancement project that makes the future achievement of interoperability more difficult. For this reason when we re-gauge or replace structures we do so to UK1 gauge. This is checked as part of the company’s safety verification arrangements.
Environmental awarenessAs part of our commitment to a policy of sustainable development and to enable measurable improvement in our environmental performance, we operate an environmental management system. We have developed projections for key elements of our environmental management system, including those related to CO
2 and recycling. A number
of other measures are still under development and will be introduced later in the control period. The environmental stewardship index provides an overall measure of achievement against this suite of targets, identifying the number of individual measures where the target has been met. Our projections for these measuresareshowninAppendix18.
Achieving sustainable consumption and production relies on buying the right product in the right volume and disposing of end of life products and materials at the end of their lives in such a way that any value is recovered. Our sustainable material assessment focuses on seven materials; wood for sleepers, bearers and longitudinal bearers, ballast, concrete, steel rail, fuels, oils and paper. Our programme will involve working directly with our suppliers to determine what improvements in the sustainability of these materials have been and can be achieved. We have recently begun trials on the use of waste material recycled to form new sleepers which will replace timber ones along some of the rural lines on the network. Our target is that by the end of CP4 25 per cent of our spend is on sustainable materials.
We continue to strive towards recycling 100 per cent of the waste that arises from the railway network and divert from landfill 60 per cent of waste arising from managed stations, our maintenance delivery units and corporate offices by the end of CP4.

47Network Rail CP4 Delivery Plan 2009
We are also targeting the re-use of water removed from the Mersey and Severn tunnels and are working with water supplierstoenable85percentof ittobere-used by 2014.
To reduce carbon emissions we will need to reduce energy demand and consider alternative energy supply options. The reduction measures have been generally considered in terms of:
• humanfactors–howenergyiscurrently used and how we can reduce demand;
• technologyfactors–howcurrentchoices of technology can be used to reduce demand, for example movement sensor lighting; and
• energysupplyoptions–localand on-site generation.
Our target is to reduce our carbon impact associated with energy use at managed stations, our maintenance delivery units and corporate offices by 20 per cent by the end of CP4 compared to 2006/07.
In addition we are working with our industry partners to develop and implement a programme of installing meters on electric trains. This will provide better information for both ourselves and train operators to help reduce consumption by looking at how we operate the network and employing energy efficient driver techniques. Metering itself is expected to reduce carbon dioxide emissions by around 112,000 tonnes per year. Changes in driving techniques and network operation will improve this further.
We are also focused on improving our Sites of Special Scientific Interest (SSSIs) and have agreed with Natural England that 95 per cent of these sites will have positive status by 2010. We are also looking at how rail corridors can be
Figure 35 Income summary
£m (2009/10 prices) 2009/10 2010/11 2011/12 2012/13 2013/14 Total
Incentive regimes
Schedule8 0 0 0 0 0 0
Schedule 4 (177) (173) (176) (142) (135) (803)
Schedule 4 access charge supplement
187 160 162 130 123 762
Total 11 (13) (14) (13) (13) (41)
Franchised access charges
Variable track access 129 125 128 128 129 640
Electric asset usage 8 7 8 8 8 38
Electric traction income 242 202 237 278 315 1,275
Capacity charge 147 143 143 144 145 721
Station income (incl. QX) 83 83 83 83 83 415
Station long-term charge 151 146 145 145 145 732
Depots income 49 49 49 49 49 244
Total 808 755 793 835 873 4,064
Other single till
Freight income 55 64 65 67 70 322
Open access income 19 19 19 19 19 94
Property income 192 192 192 192 192 962
Property sales 10 9 36 66 76 197
Other income 8 8 8 8 8 39
Total 284 293 320 352 365 1,613
Fixed track access 822 832 804 953 1,228 4,638
Network grant 3,759 3,646 3,641 3,459 3,154 17,659
Total income 5,683 5,513 5,544 5,586 5,607 27,933

Network Rail CP4 Delivery Plan 200948
developed to create specific habitats for at-risk species of insects, small animals and birds.
IncomeMuch of our income in CP4 is set by ORR’s final determinations for CP4. This sets the levels of network grants and fixed track access charges which account for 80percentof ourtotalincome.
ORR has also determined the variable charge rates that will be applied to all users of the network, franchised passenger, freight and other open access services. The income forecasts set out here reflect these determined rates and the forecast level of traffic. We currently expect that the emerging recession will have an adverse impact on demand, with some significant reductions in freight flows already evident. The full impact on demand in CP4 is unclear.
The variable usage charge rates determined by ORR are on average 50 per cent lower than those that applied in CP3, so forecast income from this charge issubstantiallylowerthanin2008/09.
Lower levels of usage should also result in reduced maintenance costs, though in the short term this impact is not symmetrical.
Income from capacity charges is expected to be lower than the level assumed in ORR’s determination as it did not allow for the impact of the new weekend discount, which reduces weekend charge rates by 25 per cent. ORR has confirmed that we will be funded for this shortfall in CP5.
The other charges are all determined by ORR. The long-term charges for stations were set in line with the assumed efficient level of expenditure, while fixed track charges and network grants are
balancing items to cover the revenue requirement not covered by access charges or other single till income.
As a result of ORR’s determination of lower variable charge rates, freight income is expected to be around one third lower than CP3 for the same level of traffic. As noted above, there is also a significant level of uncertainty about freight demand in the short term. In 2009/10 we have assumed annual income from freight services will be around £20 million lower than was reflected in ORR’s final determinations. There is clearly a risk that this will continue throughout the control period, but have only assumed that freight income will be £10 million per year lower than the final determinations for the remainder of the control period.
Our annual access charges and network grants are indexed each year by the Retail Prices Index (RPI). So that this does not have to be based on a forecast, this is based on the previous year’s RPI. ORR has now determined the inflation figuresthatshouldbeusedfor2008/09and 2009/10. These are higher than the actual/expected RPI in those years, and as a result we expect our income to be around £250 million higher than ORR assumed in the final determinations. For this plan, we have assumed that RPI will decrease by 1.5 per cent in 2009/10, and then increase by 2.2 per cent in 2010/11 and 2.75 per cent per year thereafter.
We are forecasting that train performance will be in line with the regulatory targets and that there will therefore be no net Schedule8incomeorcost.Weareforecasting that Schedule 4 costs will be around £10 million per year higher than ORR assumed as the freight cost was assumed to be included in our investment costs. We have reduced our planned renewals expenditure to offset this increase.

49Network Rail CP4 Delivery Plan 2009
We will continue to generate rental and sales income from our property portfolio. However, given the current economic climate, there is considerable uncertainty in the projected level of property income. In its final determinations, ORR accepted that these income sources were likely to be adversely affected by economic conditions, and used our most recent forecast of property rental income. Property sales income was, however, based on our forecasts in the SBP update, re-phased on the assumption of a recovery in market conditions in the last two years in the control period.
Given the uncertainty in the property market, it is likely that CP4 property income will be lower than ORR’s final determination. However, the extent of any shortfall is difficult to assess at this stage. For the purposes of this plan, we have therefore assumed that we will be able to achieve levels of income that are consistent with ORR’s assumptions.
The improvement of stations that results from commercial development activity is a valuable component of our stations enhancement strategy. We expect additional station renewal and enhancement works totalling £115 million to be delivered as a result of development activity – this is realised as hypothecated gains, and incremental to our other funded developments.
Further plans exist to undertake major developments at Euston and Victoria stations, with associated station enhancements. We do not, however, expect the benefits of these developments to be realised during CP4.
CP4 financing plan Given the nature of the final determinations and its challenges, coupled with current market conditions, we will not be able to raise corporate
debt (debt without the support of the government indemnities) over the next few years. However, we believe it is right that we seek to move away from a reliance on debt supported by indemnities from government. We will keep this under review as market conditions and other factors change over the next few years.
For the time being, we will continue to finance our business by raising debt supported by the government Financial Indemnity Mechanism (FIM). Our financing requirements for CP4 are projected to be:
• debtissuanceof nearly£12billion;• capitalaccretiononourinflationlinked
bonds of £1 billion; and• therefinancingof atleast£6billionof
bonds which mature during CP4.
Our base assumption is that we will be raising all debt through our Debt Issuance Programme (DIP). The DIP is structured as a platform for the issuance of multiple types of debt including bonds, commercial paper and loan facilities. In practice, we expect substantially all our long-term debt to be financed by a mix of nominal and inflation linked bond issues in a variety of currencies and tenors. Since our debut bond issue in March 2004,wehaveissuednearly£28billionof bonds in sterling, US dollar, euro and a number of other currencies.
As at 1 April 2009, we have nearly £12 billion of nominal debt (hedged sterling equivalent) and £9 billion of index linked debt. We are targeting to raise at least £5 billion of further sterling inflation linked issuance in CP4, subject to market conditions. The remainder of our funding each year will be principally through nominal bonds in three major currencies (US dollar, sterling and euro).
We believe it is right that we seek to move away from a reliance on debt supported by indemnities from government.
Network Rail CP4 Delivery Plan 200950
As is our practice, we expect to adopt slightly different issuance strategies for nominal and inflation linked debt over CP4. For inflation linked issuance, we remain committed to our policy of creating large, liquid benchmarks through regular tap issues and the launch of new benchmarks as appropriate. For nominal issuance, individual short-dated benchmarks are likely to predominate.
The DIP is rated AAA/AAa/AAA by Standard and Poor’s, Moody’s and Fitch. Bondholders, lenders and other indemnified creditors (such as swap counterparties) under the DIP are fully guaranteed by an unconditional, irrevocable and unlimited financial indemnity from government.
Bonds and other debt under the DIP are largely issued through our special purpose financing company, Network Rail Infrastructure Finance plc. Proceeds are then lent on to Network Rail Infrastructure Limited to finance capex and working capital as required.
We also expect to maintain sufficient short-term facilities and/or investments to cover at least the next 12 months’ funding requirements (excluding refinancings). For this reason, we supplement our medium and long-term bonds with a variety of short-term facilities. These include:
• a£4billioneuroandUSdollarcommercial paper programme which has ratings of A1+/P1/F1+. The programme is guaranteed by the financial indemnity from government and supported by a £750 million dedicated bank liquidity facility;
• a£1billionworkingcapitalfacility;• a£50millionuncommittedoverdraft
and money market facility; and• a£4billionstandbyfacilityfromthe
Secretary of State for Transport.
We also expect to continue our existing policy of hedging 100 per cent of exposure to exchange rate changes on any debt denominated in foreign currency;andatleast80percentof forecast interest rate exposure through the life of a control period.
Comparison to ORR expenditure and income assumptionsOur overall projections are very close to the assumptions made by ORR in its final determinations. The variances are summarised in Figure 36 which adjusts the assumptions made by ORR for changes in inflation so that all figures are expressed in 2009/10 prices since this is the first year of the plan. The analysis excludes variances in the latest estimates for the cost of enhancement projects since we are either seeking to manage these projects within the funding available or (in the case of Stafford) the funding provided in CP4 will need to be retained to pay for deferred expenditure in CP5. It also excludes differences that result from amendments to ORR’s final determinations that we expect to be made in the next periodic review, including adjustments to the capacity charge, seven day railway fund, funding of capitalised overheads and ORR fees. This analysis also excludes expenditure deferredfrom2008/09asthatwasfunded in CP3.
As explained above our forecasts for operating and maintenance costs, including non-controllable costs, are above the level assumed by ORR partly due to the impact of past inflation which feeds into salaries even though the current rate of inflation is now significantly lower. The overall difference over the control period is £320 million or 3.2 per cent of the total.
We will monitor delivery of our obligations and report progress on a routine basis to our customers and stakeholders.

51Network Rail CP4 Delivery Plan 2009
Figure 36 Comparison to ORR expenditure and income assumptions
£m (2009/10 prices) England and Wales Scotland Total
Operating and maintenance costs (300) (20) (320)
Electric traction costs (9) (1) (10)
Renewals
Re-allocation to additional 2009/10 maintenance 18 2 20
Operational property 38 0 38
Other renewals (45) (5) (50)
Enhancements (38) 0 (38)
Schedule 4 45 5 50
Freight income (53) (7) (60)
Access charges and grants 224 26 250
Total variance (before interest) (120) 0 (120)
Interest and FIM fee 68
Total variance (52)
This variance is largely offset by the increased income arising from the ORR final determinations when this is also expressed in 2009/10 prices. The net position is an adverse variance of £120 million (or 0.4 per cent) of ORR’s expenditure assumptions over the control period.
Interest costs are also lower than assumed by ORR. This is partly due to changes in the assumed profile of expenditure and partly due to an assumption that we will not proceed with corporate debt at least initially. However, the impact of continuing to rely on the Financial Indemnity Mechanism is limited because of the fee which is paid to government in return for this indemnity. As noted above, we also intend to keep this under review to see whether we can proceed with corporate debt as circumstances change.
The overall net effect is a small variance of £52 million (or around 0.2 per cent) of ORR’s overall assumptions. However, there are also significant uncertainties in our plan including further work to develop our investment plans and uncertainty about the impact of the economy on our property income.
We will measure our overall financial performance with our new financial value added KPI, which will compare our overall income and expenditure to our delivery plan. If our actual results are in line with this plan, overall financial value added would be recorded as zero. The calculation will adjust for any additional funding provided outside the review and variations in non-controllable costs.
We will also measure the level of efficiency that we are achieving with a new cost efficiency KPI that covers all operating, maintenance and renewals
expenditure. We are currently finalising our projections for this KPI.
Monitoring and change control We will monitor delivery of our obligations and report progress on a routine basis to our customers and stakeholders. As we refine our plans, we will consult customers on changes and seek their endorsement to material changes to our obligations and outputs.
The enhancements programme is subject to change control which requires industry consultation. There are already bespoke change control processes in place for programmes such as Thameslink and existing governance arrangements for programmes such as NSIP and SFN. Programmes to deliver the HLOS capacity metrics will be subject to industry consultation and analysis of the impact on the achievement of the capacity metrics of any proposed changes. This will be provided to ORR for approval as appropriate. A similar consultation process will apply to changes to other enhancement projects not governed by other industry agreed processes.
Except for enhancements, our plans described in this chapter are not subject to change control but we will provide a formal update of the plan on an annual basis. Any material changes during the year will be posted on our website.
Network Rail CP4 Delivery Plan 200952
4. Improving business performance
Our transformation programme symbolises a significant commitment to continue to change our organisation and drive better delivery in all areas of the company.
The need for changeThe previous chapter described our plans to deliver the outputs in CP4. The funding available to us is insufficient to afford the level of activity and scope described in our plan at current levels of efficiency. In order to deliver the CP4 outputs within the funding available we need to develop our plan such that we find more cost-effective ways of delivering the outputs without compromising the long-term sustainability of the network. We will achieve this by reducing the unit cost of our activities and by identifying alternative ways to achieve the same level of outputs at lower cost.
The purpose of the business transformation programme is to deliver the necessary improvements required to:
• achievetheoutputsinCP4withintheavailable funding;
• transform‘how’wedothingsaswellas‘what’wedo,increasingthefocuson the service provided to rail users, customers and other stakeholders; and
• provideastrongfoundationforlongerterm sustainable improvements in affordability and value for money.
The transformation programmeWe have built the transformation programme around the areas we know we need to improve based on our understanding of what our customers and other stakeholders demand of us and an assessment of our strengths and weaknesses in meeting these demands.
This chapter describes our plans to improve the performance of the business and in particular the business transformation programme we are embarking on.
Twoworkstreamsaddress‘how’wedobusiness to make us more responsive, flexible, innovative, transparent and decisive. These are the service culture and organisational effectiveness workstreams. These workstreams will impact all aspects of our plan for CP4.
Fourworkstreamsaddress‘what’wedoand will examine opportunities to develop our plans such that we can deliver the outputs more cost-effectively. These are:
• assetpolicy;• assetinformation;• efficientinfrastructuredelivery;and• networkoperations.
The structure of the programme is shown in Figure 37. The transformation programme contains a central programme office and communications workstream. The supporting workstreams, which span the transformation programme, are needed to ensure that we have a consistent approach to our people, our processes and our use of technology.
Towards implementationOur recent focus has been on prioritising opportunities in preparedness for the implementation of projects in the next phase, resourcing the project teams and establishing the overall programme, project dependencies and controls.
Service culture The objective of the programme is to change the culture within Network Rail to createonewhichrecognisesthat‘how’we do business with all our customers, suppliers and other stakeholders is asimportantas‘what’wedo.Thisprogramme is fundamentally about changing mindsets and behaviours rather

53Network Rail CP4 Delivery Plan 2009
than investing expenditure in changes to process and systems. In particular, we intend to drive a better understanding across the business of how we can work with our immediate customers to provide a better service both to them and to the end user – passengers and freight users.
To achieve our aims and objectives, we need to gain the support and advocacy of all our customers and stakeholders. Whilst they acknowledge the progress we have made in the last five years, there is much more to do to turn them into advocates who are willing to publicly support and promote our business. Our ambition is for stakeholders to say: “Network Rail is a great company to do business with; its people behave professionally, demonstrating a determination and passion for delivering great service; and the company does what it says it will do”.
We need to understand better the service proposition that our customers want and how we can deliver it. This proposition needs to identify not only what we promise to deliver but how we will deliver it and how our customers and stakeholders will feel about that service. It is also critical that we are able
to demonstrate how we balance the often conflicting needs of various stakeholders.
We need to enhance the customer experience by being responsive and pre-emptive to our customers needs. We also need to address the way we handle the times when we don’t deliver the promise. Our customers and stakeholders understand that things do not always go to plan and will judge us on how we handle those situations.
The initial phase will be completed shortly and will result in specific actions which will begin to deliver real change.
It is essential that all the other elements of the transformation programme, starting with organisational effectiveness, are planned and implemented with a clear focus on service culture. Each element of the programme provides a major opportunity to begin to embed the right service culture into our people, processes and systems.
We have already taken steps to improve the focus on the needs of our customers but we need to do more. It is difficult to predict how long it will take to change the culture but this will clearly extend
beyond the next five years. We also know that the judgement of success will not be made by us but by our customers and stakeholders. We will therefore continue our programme of regular surveys of each stakeholder group to understand how we are progressing and inform what further actions are required.
Organisational effectivenessThe objective of this workstream is to improve the effectiveness and reduce the cost of the organisation. We will achieve this by:
• pushingaccountabilityfordeliveryandfinancial performance to the lowest practical level;
• creatingtheoptimalbalancebetweencentral decision making and local delivery;
• minimisingtheinterfacebetweenvarious parts of the organisation that, at present, introduce time into the decision making process; and
• supportingdeliveryof ourservicemodel.
The organisational effectiveness workstream has three distinct, but linked elements:
• implementationof anewprocessmodel;
• creationof thenationalcentre;and• organisationaldelayering.
Figure 37 Network Rail’s transformation programme structure
Assetpolicy
Asset information
Efficient infrastructure
delivery
Network operations
The ‘WHAT’
Supporting
workstreams
The ‘HOW’
Service Culture
Organisational effectiveness
Co
mm
un
icat
ion
s
Service culture
Systems & data
People
ProcessP
rog
ram
me
man
agem
ent

Network Rail CP4 Delivery Plan 200954
Having adopted a functional organisation in 2004, we will now evolve this into an organisation based upon our core and supportprocessesshowninFigure38.
Our organisational structure will be adapted to align to this business process map. For each core and support process, we will consider the interfaces between the processes, as well as the roles, responsibilities and accountabilities at national, regional (route), and local (e.g. delivery unit) level. In implementing these proposals we will retain the route structure for planning, maintaining and operating the network.
In order to maximise effectiveness at the national level, we will create a new centre, based in Milton Keynes, which will bring together all the national elements of individual delivery functions.
Thiswillcreatea‘NationalControlCentre’, combining the existing centres that oversee and monitor investment, operations, information management and logistics activities. It will also become the hub of passenger information together with information about engineering and investment issues. It is expected that the national centre will become operational in 2012.
Asset managementThe transformation programme includes three inter-dependent workstreams that form the core elements to improve our overall approach to asset management. Figure 39 highlights the relationship between the asset policy, asset information and efficient infrastructure delivery workstreams in achieving our commitment to deliver the outputs within the funding available.
Asset policyThe primary objective of the asset policy workstream is to implement changes to the maintenance and renewal workbanks to deliver the required outputs at reduced cost. This will be achieved by delivering route outputs required by our customers and funders at the lowest whole-life, whole-system cost.
The programme approach builds on traditional engineering good practice but has a number of distinguishing features:
• itexplicitlyfocusesmaintenanceand renewal activities on delivering sustainable outputs valued by customers, funders and other key stakeholders at the lowest whole-life cost;
• itplaceswholelife-cyclecostingatthe
Figure38Process-led organisation
PLANfor the railwayof the future
SPECIFYchanges to railway
of the future
CHANGEthe railway
infrastructure
MANAGEthe railway
infrastructure
OPERATEthe railway
infrastructure
Manage information technology Provide logistics services Provide assurance
Manage people Manage financial resources
Manage procurementDevelop corporate vision
and strategyManage external relationships
and reputation
Manage improvement and change Manage non-core property
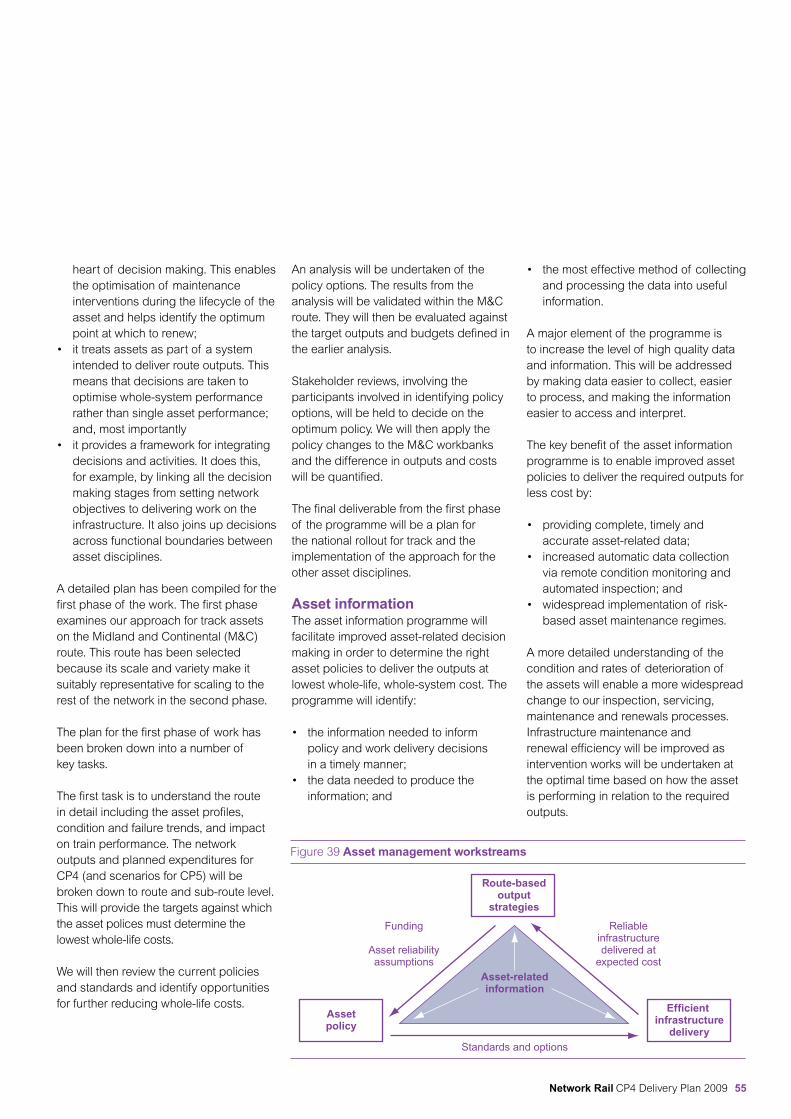
55Network Rail CP4 Delivery Plan 2009
heart of decision making. This enables the optimisation of maintenance interventions during the lifecycle of the asset and helps identify the optimum point at which to renew;
• ittreatsassetsaspartof asystemintended to deliver route outputs. This means that decisions are taken to optimise whole-system performance rather than single asset performance; and, most importantly
• itprovidesaframeworkforintegratingdecisions and activities. It does this, for example, by linking all the decision making stages from setting network objectives to delivering work on the infrastructure. It also joins up decisions across functional boundaries between asset disciplines.
A detailed plan has been compiled for the first phase of the work. The first phase examines our approach for track assets on the Midland and Continental (M&C) route. This route has been selected because its scale and variety make it suitably representative for scaling to the rest of the network in the second phase.
The plan for the first phase of work has been broken down into a number of key tasks.
The first task is to understand the route in detail including the asset profiles, condition and failure trends, and impact on train performance. The network outputs and planned expenditures for CP4 (and scenarios for CP5) will be broken down to route and sub-route level. This will provide the targets against which the asset polices must determine the lowest whole-life costs.
We will then review the current policies and standards and identify opportunities for further reducing whole-life costs.
An analysis will be undertaken of the policy options. The results from the analysis will be validated within the M&C route. They will then be evaluated against the target outputs and budgets defined in the earlier analysis.
Stakeholder reviews, involving the participants involved in identifying policy options, will be held to decide on the optimum policy. We will then apply the policy changes to the M&C workbanks and the difference in outputs and costs will be quantified.
The final deliverable from the first phase of the programme will be a plan for the national rollout for track and the implementation of the approach for the other asset disciplines.
Asset informationThe asset information programme will facilitate improved asset-related decision making in order to determine the right asset policies to deliver the outputs at lowest whole-life, whole-system cost. The programme will identify:
• theinformationneededtoinformpolicy and work delivery decisions in a timely manner;
• thedataneededtoproducetheinformation; and
• themosteffectivemethodof collectingand processing the data into useful information.
A major element of the programme is to increase the level of high quality data and information. This will be addressed by making data easier to collect, easier to process, and making the information easier to access and interpret.
The key benefit of the asset information programme is to enable improved asset policies to deliver the required outputs for less cost by:
• providingcomplete,timelyandaccurate asset-related data;
• increasedautomaticdatacollectionvia remote condition monitoring and automated inspection; and
• widespreadimplementationof risk-based asset maintenance regimes.
A more detailed understanding of the condition and rates of deterioration of the assets will enable a more widespread change to our inspection, servicing, maintenance and renewals processes. Infrastructure maintenance and renewal efficiency will be improved as intervention works will be undertaken at the optimal time based on how the asset is performing in relation to the required outputs.
Figure 39 Asset management workstreams
Assetpolicy
Efficient infrastructure
delivery
Route-basedoutput
strategies
Asset-relatedinformation
Funding
Asset reliabilityassumptions
Reliableinfrastructuredelivered at
expected cost
Standards and options

Network Rail CP4 Delivery Plan 200956
The asset information programme comprises three major workstreams. The first workstream identifies what data needs to be collected. This is a key input into the asset policy and efficient infrastructure delivery programmes, since these programmes will generate business benefits based upon the asset information provided.
The second key workstream seeks to identify and implement the most effective method of collecting the required data.
The third key workstream is to implement processes that will enable efficient data collection and processing, and provision of information to end users.
The asset information programme is currently in the mobilisation phase. Workstreams will be delivered in phases based upon scale of benefit and ease of implementation. This will provide the greatest opportunity for successful implementation and embedding of the changes. The first phase of initiatives will be ready to start the implementation process in May.
Efficient infrastructure deliveryThe aim of the efficient infrastructure delivery programme is to reduce both the cost and time to deliver our maintenance and investment programme. It will integrate opportunities across a number of areas including:
• short/long-termdeliveryplanning;• efficientpossessionandresource
utilisation;• effectiveon-sitedeliverymethods;• bestvaluesustainablewhole-life
decision making; and• ‘leadandlag’efficiencyreporting.
The efficient infrastructure delivery programme will be the catalyst for, and enable the achievement of, the efficiency
gains that need to be achieved in the delivery of maintenance, renewal and enhancement activity in CP4 and beyond.
The efficient infrastructure delivery programme comprises four major workstreams described below.
Aligned and consolidated planningVisibility and flexibility in workbank planning will enable integrated and consistent planning, and allow effective access management. This will be a key enabler to other efficiency projects through long-term workload visibility and the potential for more efficient workloads.
By locking-down the scope and plan for larger projects at GRIP Stage 3 andbyconcludingdetaileddesign18months prior to start on site, the forward visibility of the workbank along with its resource requirements and constraints will be improved. This allows us and our suppliers to more efficiently schedule, package and consolidate work and will drive efficiency in mobilisation costs and utilisation rates of resources. It will provide market visibility of long-term committed volumes and facilitate a greater number of fixed price packaged contracts which are competitively bid, thus driving down costs.
The visibility of access requirements will be enhanced enabling greater efficiency in the scoping of possessions which, when combined with improvements in possession management, will drive the need for fewer but more productive and less disruptive possessions.
Efficient on-site deliveryCombining standardisation of process and equipment through modular initiatives with lean construction and manufacturing approaches, process waste will be reduced enabling faster on-site delivery and shorter access windows within which
work is delivered. This in turn will enable greater utilisation rates for plant and labour and an increase in the proportion of work which can be delivered via overnight mid-week possessions. Lower design and production costs can be realised in signalling, switches and crossings, components, stations and, particularly, in plain line track renewals.
An increase in workforce productivity will be achieved by standardisation of delivery methods and adoption of standard methods, use of lean techniques to deliver work within optimal timescales and improving unit cost information. Improving works planning and scheduling will enable plans to be more efficiently programmed and provide sufficient work to fill each shift. Introduction of new welding equipment, along with the development of additional plant and equipment, will increase automation, reduce activity cycle times and improve quality of delivery.
Effective resource utilisationThe aim is to achieve an increase in the balance of work performed in the summer. Site works in the summer benefit from higher productivity, improved safety, less material waste and improved quality of workmanship. Contracts will be awarded a year or more in advance to allow contractors to optimise their programmes with respect to seasonal impact.
The introduction of matrix management will enable central discipline teams to be developed to focus on their discipline’s people, process and performance for optimal effectiveness and performance while enabling the asset programmes to focus on delivery.
Performance and efficiency managementThis workstream will enable the ability to plan, make proactive decisions and track

57Network Rail CP4 Delivery Plan 2009
subsequent efficiency performance as a consequence of these actions. It will also enable the business to better understand what “sustainable best value” looks like, in order to act as a benchmark for future investment decisions. This will be achieved through development of a cost model to inform decisions on whole-life operational costs in repairing, renewing and replacing.
Network operationsThe network operations programme will transform the way in which the railway is operated and controlled to achieve improved service performance at reduced cost with significantly improved whole journey information to the end customer.
The programme will transform current information and signalling control systems into one integrated traffic management platform, through the phased implementation of enhanced, streamlined, operational control technology.
The benefits of the network operations programme are:
• improvedprocessdesign,reducingcosts;
• minimisedimpactof disruptionwhilstmaximising capacity in a highly utilised railway;
• timelyandaccuratewholejourneyinformation provided by the rail industry to customers; and
• contributiontoimprovedserviceperformance and network availability outputs.
This programme is complex and it will take significant time to realise the full benefits across the entire network. However, clarity around the opportunity and a clear roadmap to deployment will maximise opportunities for year on year benefit realisation. The current phase will
achieve an agreed detailed definition of the approach to design, development and delivery, including early deployment, of all aspects of the strategy. The work is being done through eight workstreams:
• operatingcentres–designingthefuture world class operating centres for our people and industry partners to control and manage the network, including the possibility of adapting existing centres or building new ones;
• trafficmanagement– the design and development of industry-leading operational signalling and control systems for managing the network;
• electricalcontrol–thedesignanddevelopment of industry-leading operating control systems for managing the electrical power to the network;
• signallingtechnology– the simplification of the design and development of increased standardisation and pre-fabrication in signalling systems, and improved methods of delivery on the ground;
• passengerinformation–transformingthe accuracy and quality of the whole journey information along with the way in which it is provided and disseminated to the passenger;
• rulebooksimplification– redesigning our operating rules to simplify the processes by which we operate, maintain and renew the network. This will enable enhanced knowledge retention and compliance delivering improved safety and efficiency outputs;
• peopleandprocesses–definingthefuture roles, organisation and specific support for our people necessary to migrate to the new model and fully realise the benefits offered by the technical developments, rule book simplification and process redesign; and
Our transformation programme symbolises a significant commitment to continue to change our organisation and drive better delivery in all areas of the company.

Network Rail CP4 Delivery Plan 200958
• programmeintegrationandimplementation – the provision of the decision-making and planning framework, to determine the optimal plan for deployment of technology across different parts of the network, and the creation of the benefit realisation plan.
Supporting programmesThree workstreams have been established that support delivery of change and enable the intended benefits of the core workstreams described above.
PeopleThe over-riding purpose of the people programme continues to be to create the right framework within which our employees perform to increasingly high standards, and to improve their understanding, skills and behaviours to meet a rapidly changing organisation.
Key elements of the people programme will focus on supporting three processes – performance management, talent management and employee engagement. Our commitment to invest in outstanding new entrant programmes, such as the unique apprenticeship programme, remains at the core of introducing a new generation of first rate employees to the rail industry. We will continue to work closely with our university partners, Warwick and University College London, to produce world class performance. Investment in all levels of technical training will introduce new technology, work practices and streamline our processes. Retraining and redeployment of employees to enhance the quality of their jobs, and drive productivity improvement across the company will be essential.
Process In order to meet our objectives, we must understand, prioritise and optimise our operations and processes, to remove wasted effort, errors and delays.
The process programme is a key enabler to improving performance through the optimisation of key business processes. Individual projects to improve processes will be delivered through the transformation programme, with the process workstream providing skills, tools, training and information to enable successful project delivery including:
• implementingaframeworkforongoing process measurement and improvement;
• facilitatingprocessimprovementprojects and workstreams;
• performingprocesshealthchecks;• developinglocalcapabilityforprocess
teams;• deliveringtrainingforprocess
improvement and process management tools and methods; and
• buildinganddevelopingcross-functional process information including process models, process and organisational relationships and process metrics.
Systems and dataInformation management systems will be critical enablers of the transformation programme. Delivery of much of the business change identified by the programme requires significant systems change and investment. The systems and data supporting workstream will therefore enable the six core workstreams by providing those system capabilities, capacity and enterprise architecture in conjunction with robust and reliable system support services in a sustainable manner.

59Network Rail CP4 Delivery Plan 2009
The systems and data programme will comprise the following activities:
• definitionof thesystemanddatarequirements for all elements of the transformation programme;
• costandbenefitstatementof delivering these requirements;
• resourceplanstoimplementandsupport the prioritised and emerging requirements;
• five-yearsystemsanddatadeliveryroadmap; and
• dataandbusinessarchitectureblueprints covering services and architecture.
Long-term planningThe programme outlined above will transform the business over the next decade. It will therefore be fundamental to delivery of our plans for CP4 as well as preparing for CP5 and beyond. At the same time, however, we have to begin now our preparations for the next control period and Periodic Review 2013.
The opportunity is for us to build on the progress made in this review in working with the rest of the industry on the development of these plans. Our
objective is to inform decisions which governments will have to make in around 2012 about the outputs they want to buy in CP5 such that we can then respond with a well developed, integrated and affordable plan as an input to the next periodic review.
In developing these plans we will need to look well beyond CP5 in order to understand the implications for what needs to be done in CP5. We will build on a number of existing initiatives, such as the Route Utilisation Strategies, our developing plans for electrification, High Speed 2, the new lines programme and work on the strategic freight network. We are already discussing with ATOC, owning groups, freight operators and government how we will bring these and other initiatives together into an overall plan and will set out our views on this in more detail later in the spring.
As part of this work we will also be working to improve our own planning capability. Again this will build on progress made during CP3 in our ability to forecast future levels of activity volumes, expenditure and outputs. However, we recognise that we need to
make further significant improvements so that we can improve the quality of our plans based on challenging but realistic, evidence-based targets and projections.Many of the activities in our business transformation programme will help us to improve our planning capability. The development of our asset policies will be reflected in improved forecasting of activity volumes in our business planning tool, the Infrastructure Cost Model. We will use the improved unit cost information to cost those activities. We will also focus on improving our understanding of the relationships between planned activity levels and the impact on asset reliability, train performance and other outputs. Our aim is to be able to identify more readily alternative activity and expenditure options to achieve different levels of outputs.
In developing evidence to underpin our strategic business plan for CP5 and beyond, we will particularly focus on benchmarking both internally and with external organisations. We are already carrying out an increasing amount of international benchmarking, which we must use more effectively to underpin our planning assumptions.
We have set out our commitment to transform our organisation still further, building upon the significant track record built over CP3. The scale and ambition of this programme is immense. Our aim is to create a way of doing business whereby we place the needs of rail users and our customers at the core of what we do. In achieving this, the improvements we are committing to in CP4 will transform the railway for all of our customers and stakeholders.
60 Network Rail CP4 Delivery Plan 2009
Appendices
1. DfT HLOS total demand to be accommodated by urban area in England and Wales
2. DfT HLOS total demand to be accommodated by strategic route in England and Wales
3. Public Performance Measure (per cent annual average)
4. PPM – TOC share of sector-level targets (per cent annual average)
5. Cancellations and significant lateness – England and Wales (per cent of services affected)
6. Cancellations and significant lateness – aspirational targets for Scotland (per cent of services affected)
7. Network Rail total delay minutes – passenger services (000s)
8. Network Rail delay minutes TOC share of network total (000s)
9. Freight delay minutes per 100 train kilometres
10. Network Rail delay minutes FOC share of network total (per 100 train kilometres)
11. Network availability
12. Station condition
13. Depot condition
14. Passenger safety index
15. Employee health and safety index
16. Condition forecasts for the network
17. Asset stewardship indicator (Network)
18. Environmental sustainability index
19. Expenditure (Network)
20. Operating expenditure (Network)
21. Renewals expenditure by asset (Network)
22. PR08 funded enhancements expenditure
23. Income (Network)
24. Asset stewardship indicator (England and Wales)
25. Expenditure (England and Wales)
26. Operating expenditure (England and Wales)
27. Renewals expenditure by asset (England and Wales)
28. Income (England and Wales)
29. Asset stewardship indicator (Scotland)
30. Expenditure (Scotland)
31. Operating expenditure (Scotland)
32. Renewals expenditure by asset (Scotland)
33. Income (Scotland)
34. Franchised stations maintenance and renewals expenditure by station facility owner

61Network Rail CP4 Delivery Plan 2009
Appendix 1 DfT HLOS total demand to be accommodated by urban area in England and Wales
Peak three hours High-peak hours
City Forecast demand in 2008/09
Extra demand to be met
by 2013/14
Maximum average load factor at end
CP4 (per cent)
Forecast demand in 2008/09
Extra demand to be met
by 2013/14
Maximum average load factor at end
CP4 (per cent)
Birmingham 32,000 4,600 48 15,400 2,400 55
Cardiff 8,500 900 39 4,000 600 43
Leeds 23,400 5.100 64 11,300 2,700 70
Manchester 22,100 4,100 45 10,700 2,200 49
Other urban areas 27,700 3,600 41 12,300 2,000 46
London terminus
Blackfriars 21,900 3,500
67
11,200 1,200
76
Euston 23,800 3,400 10,600 1,600
Fenchurch Street 26,000 2,500 13,900 1,600
King’s Cross 18,300 2,300 8,000 1,100
Liverpool Street 74,300 10,600 36,700 4,900
London Bridge 127,600 12,600 65,200 7,800
Marylebone 9,100 1,000 4,600 600
Moorgate 13,000 700 7,400 400
Paddington 24,100 2,900 11,500 1,400
St Pancras 25,900 10,900 13,100 5,700
Victoria 58,700 5,300 29,300 2,800
Waterloo 74,300 9,200 36,800 4,900

62 Network Rail CP4 Delivery Plan 2009
Strategic route Annual passenger km forecast in 2008/09
(millions)
Additional passenger km to be accommodated by
2013/14 (millions)
1. Kent 3,350 333
2. Brighton Main Line and Sussex 4,681 536
3. South West Main Line 5,012 706
4. Wessex Routes 431 58
5. West Anglia 1,561 482
6. North London Line and Thameside 1,047 118
7. Great Eastern 2,775 319
8. East Coast Main Line 6,375 975
9. North East Routes 156 13
10. North Trans-Pennine, North and West Yorkshire 1,189 189
11. South Trans-Pennine, South Yorkshire and Lincolnshire 741 113
12. Reading to Penzance 1,178 158
13. Great Western Main Line 4,327 637
14. South and Central Wales and Borders 328 29
15. South Wales Valleys 153 13
16. Chilterns 661 98
17. West Midlands 1,862 258
18. West Coast Main Line 5,737 913
19. Midland Main Line and East Midlands 2,655 498
20. North West Urban 1,141 157
21. Merseyrail 337 18
22. North Wales and Borders 223 26
23. North West Rural 153 12
Appendix 2 DfT HLOS total demand to be accommodated by strategic route in England and Wales

63Network Rail CP4 Delivery Plan 2009
Sector 2009/10 2010/11 2011/12 2012/13 2013/14
Long distance 88.6 89.8 90.9 91.5 92.0
London and south east 91.5 92.0 92.4 92.7 93.0
Regional 90.5 91.0 91.5 91.9 92.0
Total England and Wales 91.0 91.5 92.0 92.3 92.6
Scotland 90.9 91.3 91.7 91.9 92.0
TOC 2009/10 2010/11 2011/12 2012/13 2013/14
First TransPennine Express 91.7 92.2 93.2 93.8 94.0
National Express East Anglia 90.8 91.8 92.1 92.3 92.8
Northern Rail 90.1 90.7 91.2 91.7 91.8
First Great Western 90.7 91.3 92.2 92.7 93.0
First Capital Connect 91.7 92.1 92.4 92.7 92.9
Cross Country 90.0 90.2 90.6 90.9 91.3
London Midland 87.8 89.1 89.9 90.5 90.6
London Overground 92.5 93.1 94.0 94.4 94.6
East Midlands Trains 88.1 88.7 89.4 89.9 90.2
First ScotRail 90.9 91.3 91.7 91.9 92.0
National Express East Coast 86.6 88.2 89.5 90.5 91.1
Merseyrail 94.8 94.9 95.1 95.2 95.2
Virgin Trains 85.0 87.8 90.3 90.6 90.9
Arriva Trains Wales 92.7 92.9 93.2 93.4 93.5
Chiltern 95.1 95.3 95.6 95.8 95.9
c2c 94.8 95.1 95.2 95.3 95.3
Southeastern 91.4 91.9 92.2 92.5 92.8
Southern 90.7 90.9 91.1 91.6 91.9
South West Trains 92.3 92.5 92.8 93.1 93.3
Appendix 3 Public Performance Measure (per cent annual average)
Appendix 4 PPM – TOC share of sector-level targets (per cent annual average)
Sector 2009/10 2010/11 2011/12 2012/13 2013/14
Long distance 4.9 4.5 4.2 4.0 3.9
London and south east 2.3 2.2 2.1 2.0 2.0
Regional 2.6 2.5 2.4 2.3 2.3
Total England and Wales 2.8 2.6 2.5 2.4 2.3
Appendix 5 Cancellations and significant lateness – England and Wales (per cent of services affected)

64 Network Rail CP4 Delivery Plan 2009
Sector 2009/10 2010/11 2011/12 2012/13 2013/14
Scotland 2.0 1.9 1.8 1.8 1.7
Sector 2009/10 2010/11 2011/12 2012/13 2013/14
England and Wales 6,270 5,790 5,430 5,190 4,980
Scotland 436 410 391 386 382
Appendix 6 Cancellations and significant lateness – aspirational target for Scotland (per cent of services affected)
Appendix 7 Network Rail total delay minutes – passenger services (000s)
TOC 2009/10 2010/11 2011/12 2012/13 2013/14
First TransPennine Express 238 221 206 198 191
National Express East Anglia 526 511 497 493 473
Northern Rail 852 805 763 739 718
First Great Western 575 534 463 431 410
First Capital Connect 199 186 177 166 156
Cross Country 454 437 418 405 392
London Midland 417 379 358 344 329
London Overground 65 68 92 90 88
East Midlands Trains 300 278 256 242 229
First ScotRail 436 410 391 386 382
National Express East Coast 180 161 142 125 116
Merseyrail 55 54 52 51 49
Virgin Trains 526 484 459 436 415
Arriva Trains Wales 285 276 258 249 238
Chiltern 83 78 74 71 68
c2c 40 37 35 34 33
Southeastern 394 374 359 320 300
Southern 477 445 420 391 369
South West Trains 468 440 407 374 355
Grand Central 17 16 15 14 13
Heathrow Express 23 21 19 18 17
First Hull Trains 19 17 15 15 14
Wrexham & Shropshire 19 18 17 16 15
Appendix 8 Network Rail delay minutes TOC share of network total (000s)

65Network Rail CP4 Delivery Plan 2009
2009/10 2010/11 2011/12 2012/13 2013/14
Total 3.68 3.41 3.18 3.05 2.94
Possessions disruption index 2009/10 2010/11 2011/12 2012/13 2013/14
Passenger 1.02 0.91 0.83 0.68 0.63
Freight 1.00 1.00 1.00 1.00 1.00
FOC 2009/10 2010/11 2011/12 2012/13 2013/14
DB Schenker 3.49 3.24 3.04 2.92 2.82
Freightliner 4.34 4.00 3.73 3.56 3.42
First GB Railfreight 3.50 3.19 2.92 2.77 2.64
Direct Rail Services 2.13 1.97 1.84 1.77 1.70
Appendix 9 Freight delay minutes per 100 train kilometres
Appendix 11 Network availability
Appendix 10 Network Rail delay minutes FOC share of network total (per 100 train kilometres)
Station category Station stewardship measure minimum average score at end of CP4
All network
A 2.48
B 2.60
C 2.65
D 2.69
E 2.74
F 2.71
Scotland
All stations 2.39
Light maintenance depots (LMDs) LMD stewardship measure minimum average score at end of CP4
All network
England and Wales 2.22
Scotland 2.73
All LMDs 2.25
Appendix 12 Station condition
Appendix 13 Depot condition

66 Network Rail CP4 Delivery Plan 2009
Control Period 3 Control Period 4
2008/09 2009/10 2010/11 2011/12 2012/13 2013/14
Workforce fatalities and weighted injuries 0.137 0.098 0.096 0.094 0.092 0.090
Appendix 15 Employee health and safety index
Appendix 16 Condition forecasts for the network
Control Period 3 Control Period 4
2008/09 2009/10 2010/11 2011/12 2012/13 2013/14
Track
Good track geometry 135.3% 135.3% 135.3% 135.4% 135.5% 135.6%
Poor track geometry 2.63% 2.62% 2.58% 2.54% 2.50% 2.47%
Intervention/immediate action geometry faults per 100km 44.7 43.0 41.2 39.5 37.7 35.9
Rail breaks and immediate action defects per 100km 9.04 8.96 8.89 8.82 8.74 8.64
Civils
Assets subject to special investigation or inspection 1,458 1,458 1,444 1,429 1,415 1,401
TSRs imposed as a result of condition (severity index) 113 113 112 111 110 108
Operational property
Station stewardship measure 2.71 2.71 2.71 2.71 2.71 2.71
LMD stewardship measure 2.25 2.25 2.25 2.25 2.25 2.25
Signalling
Signalling condition 2.4 2.4 2.4 2.4 2.4 2.4
Electrification
Sub station and contact systems condition 2.69 2.69 2.69 2.69 2.69 2.69
Telecoms
Telecoms condition 0.83 0.83 0.83 0.83 0.83 0.83
Reliability forecasts
Signalling failures causing train delays of more than 10 mins 19,473 16,130 15,319 14,637 13,985 13,544
Points failures 7,522 6,200 5,000 4,000 3,242 2,857
Track circuit failures 6,544 5,561 5,000 4,500 4,000 3,838
Track failures 7,771 6,994 6,750 6,580 6,400 6,238
Power incidents causing train delays 110 94 89 85 81 77
Telecom failures causing train delays of more than 10 mins 1,017 1,017 991 943 903 879
Control Period 3 Control Period 4
2008/09 2009/10 2010/11 2011/12 2012/13 2013/14
Network 0.258 0.248 0.246 0.244 0.242 0.240
Appendix 14 Passenger safety index

67Network Rail CP4 Delivery Plan 2009
Appendix 18 Environmental sustainability index
Indicator Description 2009/10 2010/11 2011/12 2012/13 2013/14
Operational recycling Stations, office and depot waste mass recycled or re-used
30% 40% 50% 55% 60%
Network Rail CO2 emissions Carbon emissions relating to managed stations offices and depots
-5% -10% -15% -17% -20%
Infrastructure recycling Renewals and enhancement activity waste mass recycled or re-used
95% 95% 95% 95% 97%
Environmental incidents Number of environmental incidents (e.g. spillages) considered to have lead to serious damage
6 6 6 6 6
Land management Network Rail owned SSSIs rated favourable or recovering status
75% 95% 95% 95% 95%
Water recovery Volume of ground or spring water recovered and sold on or used from tunnels as a percentage of total (deployable) water removed from tunnel
14% 14% 14% 14% 85%
Environmental sustainability index 6 7 8 9 9
2009/10 2010/11 2011/12 2012/13 2013/14
Track 0.012 0.025 0.039 0.053 0.067
Structures 0.000 0.010 0.020 0.031 0.045
Operational property 0.000 0.000 0.000 0.000 0.000
Signalling 0.069 0.085 0.099 0.113 0.122
Electrification and plant 0.061 0.081 0.097 0.112 0.128
Telecoms 0.000 0.013 0.036 0.056 0.068
Asset stewardship indicator 0.026 0.039 0.051 0.063 0.075
Appendix 17 Asset stewardship indicator (Network)
Control Period 3 Control Period 4
£m (2009/10 prices) 2007/08 2008/09 2009/10 2010/11 2011/12 2012/13 2013/14 CP4 total
Controllable opex 867 855 976 924 878 835 783 4,397
Non-controllable opex 306 399 420 397 437 480 520 2,253
Total opex 1,174 1,254 1,396 1,321 1,315 1,315 1,303 6,650
Maintenance 1,134 1,091 1,099 1,010 946 894 845 4,794
Renewals 2,949 3,163 2,685 2,512 2,177 2,011 1,883 11,267
Enhancements 754 1,288 1,370 1,547 1,899 1,674 1,532 8,022
Total PR08 funded expenditure 6,011 6,796 6,549 6,389 6,337 5,894 5,564 30,733
Expenditure deferred from 2008/09 0 0 211 0 0 0 0 211
Non PR08-funded enhancements 323 193 563 696 777 820 819 3,676
Total expenditure 6,334 6,989 7,323 7,085 7,115 6,714 6,383 34,620
Appendix 19 Expenditure (Network)

68 Network Rail CP4 Delivery Plan 2009
Control Period 3 Control Period 4
£m (2009/10 prices) 2007/08 2008/09 2009/10 2010/11 2011/12 2012/13 2013/14 CP4 total
Track 936 904 705 721 685 675 640 3,425
Signalling 485 428 445 452 398 425 446 2,167
Civils 389 429 375 384 341 321 299 1,719
Operational property 228 229 274 273 259 231 170 1,207
Electrification 95 93 120 151 134 109 99 614
Telecoms 192 231 326 320 156 86 74 963
Plant and machinery 93 128 141 87 55 56 54 393
IT and other 152 195 299 124 149 107 100 780
Expenditure deferred from 2008/09 0 0 211 0 0 0 0 211
Total 2,571 2,638 2,896 2,512 2,177 2,011 1,883 11,478
Appendix 21 Renewals expenditure by asset (Network)
Control Period 3 Control Period 4
£m (2009/10 prices) 2007/08 2008/09 2009/10 2010/11 2011/12 2012/13 2013/14 CP4 total
Controllable opex
Operations 390 386 391 370 354 338 321 1,773
Support 478 469 586 554 525 497 462 2,624
Total 867 855 976 924 878 835 783 4,397
Non-controllable opex
Electric traction 149 228 258 216 252 295 335 1,355
Cumulo rates 69 69 73 92 96 96 96 454
British Transport Police 67 75 60 60 60 60 60 299
Railway safety charge 4 7 8 8 8 8 8 42
ORR fee 18 19 20 20 20 20 20 100
Other 0 0 0 0 0 0 0 2
Total 306 399 420 397 437 480 520 2,253
Total opex 1,174 1,254 1,396 1,321 1,315 1,315 1,303 6,650
Appendix 20 Operating expenditure (Network)

69Network Rail CP4 Delivery Plan 2009
Appendix 22 PR08 funded enhancements expenditure
£m (2009/10 prices) 2009/10 2010/11 2011/12 2012/13 2013/14 CP4 total
England and Wales
Network Rail Discretionary Fund 50 50 50 50 50 248
National Stations Improvement Programme 22 18 18 21 21 99
Intercity Express Project 8 24 60 92 90 275
Strategic Freight Network 30 46 38 50 55 220
Performance Fund 22 18 19 20 21 101
Seven day railway 0 52 53 55 56 217
Safety and environment rollover 97 14 5 0 0 116
CP5 development fund 2 4 9 15 24 53
Access for All 49 43 47 49 45 232
King’s Cross 126 106 72 11 14 329
Thameslink Programme 541 598 756 517 501 2,913
Birmingham New Street Gateway Project 1 2 16 85 31 135
East Coast Main Line overhead line electrification 2 6 9 10 10 37
St Pancras – Sheffield linespeed improvements 5 30 30 2 0 67
Nottingham resignalling 0 1 1 8 0 11
North London Line capacity enhancement 20 19 24 3 0 67
Station security 5 3 3 4 3 18
Crossrail and Reading* 45 91 146 139 93 514
Platform lengthening – southern 28 68 98 109 47 350
Power supply upgrade 12 23 32 35 29 131
Southern capacity 3 7 6 13 16 45
East Coast Main Line improvements 12 52 133 177 183 557
Western improvements programme 32 41 10 6 5 95
WCML committed schemes 25 56 129 105 180 495
Midlands improvements programme 6 13 16 23 25 83
Northern urban centres – Yorkshire 8 27 34 19 0 88
Northern urban centres – Manchester 4 14 22 26 20 87
Liverpool – Leeds linespeed improvements 1 6 8 9 6 30
Total England and Wales 1,155 1,433 1,846 1,653 1,525 7,612
Scotland
Airdrie – Bathgate 151 50 1 0 0 202
Glasgow Airport Rail Link 40 54 47 14 0 155
Borders Rail 0 0 1 1 1 3
Glasgow to Kilmarnock 15 0 0 0 0 15
Scotland: Tier 3 Development Fund 3 3 3 2 2 14
Scotland Small Projects Fund 4 4 4 4 4 21
Total Scotland 214 111 56 21 8 410
Grand total 1,369 1,544 1,902 1,675 1,532 8,022
* The amounts shown here only include the Reading element of the integrated Crossrail and Reading programme since Crossrail is not funded through the periodic review.

70 Network Rail CP4 Delivery Plan 2009
2009/10 2010/11 2011/12 2012/13 2013/14
Track 0.012 0.025 0.038 0.052 0.067
Structures 0.000 0.009 0.020 0.030 0.045
Operational property 0.000 0.000 0.000 0.000 0.000
Signalling 0.074 0.090 0.104 0.117 0.126
Electrification and plant 0.060 0.077 0.093 0.110 0.127
Telecoms 0.000 0.011 0.035 0.055 0.067
Asset stewardship indicator 0.027 0.040 0.052 0.064 0.076
Appendix 24 Asset stewardship indicator (England and Wales)
Control Period 3 Control Period 4
£m (2009/10 prices) 2007/08 2008/09 2009/10 2010/11 2011/12 2012/13 2013/14 CP4 total
Incentive regimes
Schedule 8 78 38 0 0 0 0 0 0
Schedule 8 access charge supplement 5 4 0 0 0 0 0 0
Schedule 4 (208) (191) (177) (173) (176) (142) (135) (803)
Schedule 4 access charge supplement 94 97 187 160 162 130 123 762
Total (30) (52) 11 (13) (14) (13) (13) (41)
Franchised access charges
Variable track access 247 256 129 125 128 128 129 640
Electric asset usage 32 37 8 7 8 8 8 38
Electric traction income 156 226 242 202 237 278 315 1,275
Capacity charge 8 9 147 143 143 144 145 721
Station income (incl. QX) 75 78 83 83 83 83 83 415
Station long-term charge 239 242 151 146 145 145 145 732
Depots income 52 51 49 49 49 49 49 244
Total 810 899 808 755 793 835 873 4,064
Other single till
Freight income 92 91 55 64 65 67 70 322
Open access income 68 54 19 19 19 19 19 94
Property income 222 206 192 192 192 192 192 962
Property sales 66 45 10 9 36 66 76 197
Other income 3 3 8 8 8 8 8 39
Total 450 399 284 293 320 352 365 1,613
Fixed track access 1,552 901 822 832 804 953 1,228 4,638
Network grant 3,331 3,957 3,759 3,646 3,641 3,459 3,154 17,659
Total income 6,113 6,105 5,683 5,513 5,544 5,586 5,607 27,933
Appendix 23 Income (Network)

71Network Rail CP4 Delivery Plan 2009
Control Period 3 Control Period 4
£m (2009/10 prices) 2007/08 2008/09 2009/10 2010/11 2011/12 2012/13 2013/14 CP4 total
Controllable opex 782 777 886 837 795 755 707 3,980
Non-controllable opex 282 370 388 365 402 443 480 2,079
Total opex 1,064 1,146 1,274 1,203 1,197 1,198 1,187 6,059
Maintenance 1,030 995 1,006 921 860 810 763 4,360
Renewals 2,669 2,885 2,400 2,222 1,916 1,721 1,643 9,902
Enhancements 729 1,182 1,155 1,433 1,846 1,653 1,525 7,612
Total 5,492 6,208 5,835 5,779 5,819 5,383 5,118 27,934
Appendix 25 Expenditure (England and Wales)
Control Period 3 Control Period 4
£m (2009/10 prices) 2007/08 2008/09 2009/10 2010/11 2011/12 2012/13 2013/14 CP4 total
Controllable opex
Operations 357 354 356 336 321 306 289 1,608
Support 425 422 529 501 474 449 418 2,372
Total 782 777 886 837 795 755 707 3,980
Non-controllable opex
Electric traction 140 216 243 204 237 277 315 1,276
Cumulo rates 62 62 65 82 85 85 85 403
British Transport Police 60 68 54 54 54 54 54 270
Railway safety charge 3 7 8 8 8 8 8 38
ORR fee 16 17 18 18 18 18 18 90
Other 0 0 0 0 0 0 0 2
Total 282 370 388 365 402 443 480 2,079
Total opex 1,064 1,146 1,274 1,203 1,197 1,198 1,187 6,059
Appendix 26 Operating expenditure (England and Wales)

72 Network Rail CP4 Delivery Plan 2009
Control Period 3 Control Period 4
£m (2009/10 prices) 2007/08 2008/09 2009/10 2010/11 2011/12 2012/13 2013/14 CP4 total
Track 852 827 641 661 628 590 556 3,075
Signalling 426 380 422 431 368 390 411 2,022
Civils 329 355 300 309 268 251 235 1,364
Operational property 216 205 246 212 198 173 148 977
Electrification 90 87 116 147 130 91 82 565
Telecoms 160 212 275 272 136 80 73 837
Plant and machinery 89 119 128 79 51 50 48 356
IT and other 135 179 271 113 137 96 90 707
West Coast Route Modernisation 371 520 0 0 0 0 0 0
Total 2,669 2,885 2,400 2,222 1,916 1,721 1,643 9,902
Appendix 27 Renewals expenditure by asset (England and Wales)

73Network Rail CP4 Delivery Plan 2009
Control Period 3 Control Period 4
£m (2009/10 prices) 2007/08 2008/09 2009/10 2010/11 2011/12 2012/13 2013/14 CP4 total
Incentive regimes
Schedule 8 74 32 0 0 0 0 0 0
Schedule 8 access charge supplement 5 4 0 0 0 0 0 0
Schedule 4 (194) (176) (167) (162) (165) (133) (127) (753)
Schedule 4 access charge supplement 87 89 176 151 153 122 115 717
Total (29) (51) 9 (11) (12) (11) (11) (37)
Franchised access charges
Variable track access 235 244 119 116 118 119 119 591
Electric asset usage 31 35 7 7 7 7 7 35
Electric traction income 149 217 228 190 223 262 296 1,200
Capacity charge 8 9 144 140 141 142 142 710
Station income (incl. QX) 70 73 77 77 77 77 77 386
Station long-term charge 218 221 136 131 130 130 130 657
Depots income 46 46 43 43 43 43 43 217
Total 757 844 755 705 740 780 816 3,795
Other single till
Freight income 82 82 47 56 57 59 61 281
Open access income 68 54 19 19 19 19 19 94
Property income 207 192 180 180 180 180 180 900
Property sales 60 42 9 9 35 64 76 193
Other income 2 2 7 8 8 8 8 37
Total 419 372 264 271 298 329 343 1,506
Fixed track access 1,406 741 710 720 684 715 956 3,785
Network grant 2,965 3,598 3,366 3,264 3,270 3,209 2,944 16,053
Total income 5,518 5,504 5,104 4,949 4,980 5,022 5,048 25,103
Appendix 28 Income (England and Wales)
2009/10 2010/11 2011/12 2012/13 2013/14
Track 0.009 0.019 0.032 0.041 0.050
Structures 0.000 0.022 0.001 0.030 0.030
Operational property 0.000 0.000 0.000 0.000 0.000
Signalling 0.021 0.040 0.057 0.072 0.082
Electrification and plant 0.072 0.144 0.144 0.144 0.144
Telecoms 0.000 0.023 0.046 0.065 0.077
Asset stewardship indicator 0.014 0.032 0.038 0.051 0.057
Appendix 29 Asset stewardship indicator (Scotland)

74 Network Rail CP4 Delivery Plan 2009
Control Period 3 Control Period 4
£m (2009/10 prices) 2007/08 2008/09 2009/10 2010/11 2011/12 2012/13 2013/14 CP4 total
Controllable opex 80 79 90 87 83 80 76 417
Non-controllable opex 24 29 31 31 34 37 40 174
Total opex 105 108 122 118 118 117 116 591
Maintenance 104 97 94 89 86 84 82 434
Renewals 280 274 285 289 261 289 240 1,365
Enhancements 24 107 214 114 53 20 8 410
Total 513 585 714 610 518 511 446 2,800
Control Period 3 Control Period 4
£m (2009/10 prices) 2007/08 2008/09 2009/10 2010/11 2011/12 2012/13 2013/14 CP4 total
Controllable opex
Operations 33 32 34 33 33 32 32 165
Support 48 47 56 53 50 48 44 252
Total 80 79 90 87 83 80 76 417
Non-controllable opex
Electric traction 9 13 14 12 15 18 20 80
Cumulo rates 7 7 8 10 11 11 11 52
British Transport Police 6 7 6 6 6 6 6 29
Railway safety charge 0 1 1 1 1 1 1 4
ORR fee 2 2 2 2 2 2 2 10
Other 0 0 0 0 0 0 0 0
Total 24 29 31 31 34 37 40 174
Total opex 105 108 122 118 118 117 116 591
Appendix 30 Expenditure (Scotland)
Appendix 31 Operating expenditure (Scotland)

75Network Rail CP4 Delivery Plan 2009
Control Period 3 Control Period 4
£m (2009/10 prices) 2007/08 2008/09 2009/10 2010/11 2011/12 2012/13 2013/14 CP4 total
Track 84 76 64 60 57 85 83 349
Signalling 59 45 23 22 29 35 35 145
Civils 60 74 74 75 73 69 64 355
Operational property 12 24 28 61 61 58 22 230
Electrification 5 6 4 4 4 18 18 49
Telecoms 32 19 51 47 21 6 1 126
Plant and machinery 4 9 13 8 4 6 6 37
IT and other 17 17 28 11 12 11 10 73
West Coast Route Modernisation 8 5 0 0 0 0 0 0
Total 280 274 285 289 261 289 240 1,365
Appendix 32 Renewals expenditure by asset (Scotland)
Control Period 3 Control Period 4
£m (2009/10 prices) 2007/08 2008/09 2009/10 2010/11 2011/12 2012/13 2013/14 CP4 total
Incentive regimes
Schedule 8 5 6 0 0 0 0 0 0
Schedule 8 access charge supplement 0 0 0 0 0 0 0 0
Schedule 4 (14) (14) (10) (11) (11) (9) (9) (50)
Schedule 4 access charge supplement 8 8 11 10 10 8 7 46
Total (1) (1) 2 (2) (2) (1) (1) (5)
Franchised access charges
Variable track access 12 12 10 10 10 10 10 49
Electric asset usage 2 2 1 1 1 1 1 3
Electric traction income 7 9 14 12 14 17 19 75
Capacity charge 0 0 2 2 2 2 2 11
Station income (incl. QX) 5 5 6 6 6 6 6 29
Station long-term charge 21 21 16 15 15 15 15 76
Depots income 6 6 5 5 5 5 5 27
Total 53 55 53 50 53 56 58 269
Other single till
Freight income 10 10 7 8 8 8 9 41
Open access income 0 0 0 0 0 0 0 0
Property income 15 15 12 12 12 12 12 61
Property sales 6 3 1 1 1 1 0 4
Other income 0 0 0 0 0 0 0 1
Total 31 28 20 21 22 22 21 107
Fixed track access 146 160 112 112 120 237 272 853
Network grant 365 359 392 382 371 250 210 1,605
Total income 594 601 579 564 564 564 559 2,830
Appendix 33 Income (Scotland)
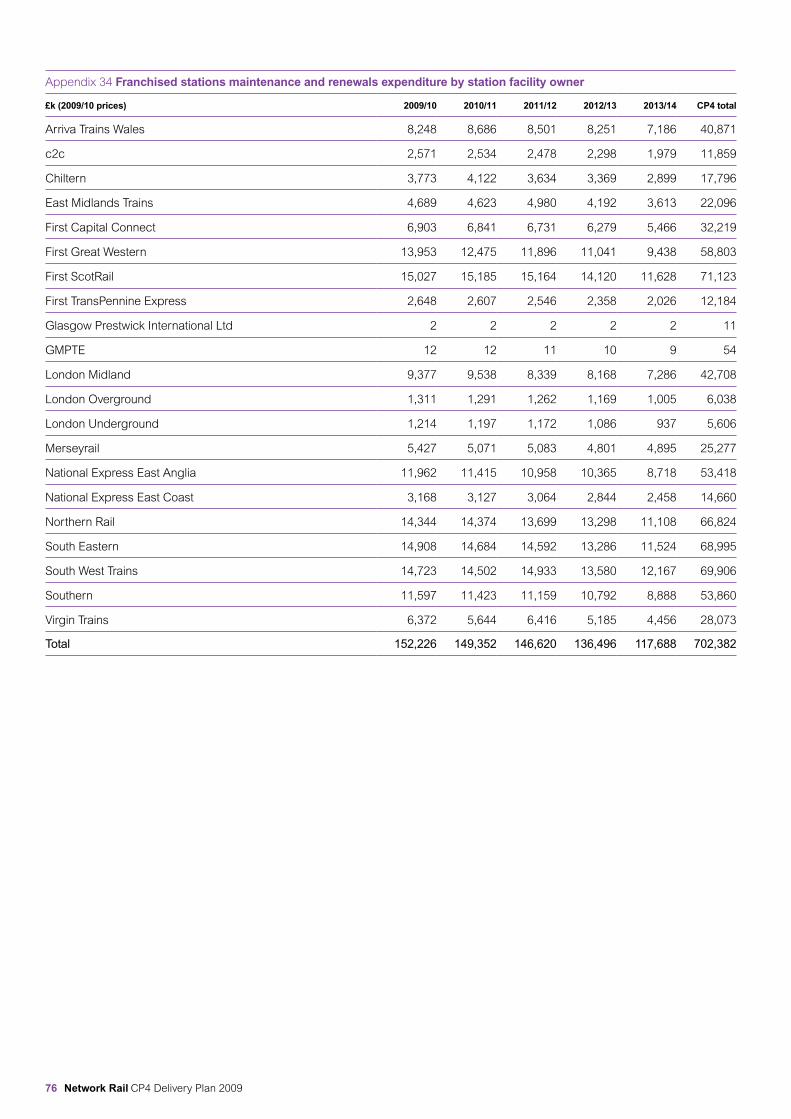
76 Network Rail CP4 Delivery Plan 2009
£k (2009/10 prices) 2009/10 2010/11 2011/12 2012/13 2013/14 CP4 total
Arriva Trains Wales 8,248 8,686 8,501 8,251 7,186 40,871
c2c 2,571 2,534 2,478 2,298 1,979 11,859
Chiltern 3,773 4,122 3,634 3,369 2,899 17,796
East Midlands Trains 4,689 4,623 4,980 4,192 3,613 22,096
First Capital Connect 6,903 6,841 6,731 6,279 5,466 32,219
First Great Western 13,953 12,475 11,896 11,041 9,438 58,803
First ScotRail 15,027 15,185 15,164 14,120 11,628 71,123
First TransPennine Express 2,648 2,607 2,546 2,358 2,026 12,184
Glasgow Prestwick International Ltd 2 2 2 2 2 11
GMPTE 12 12 11 10 9 54
London Midland 9,377 9,538 8,339 8,168 7,286 42,708
London Overground 1,311 1,291 1,262 1,169 1,005 6,038
London Underground 1,214 1,197 1,172 1,086 937 5,606
Merseyrail 5,427 5,071 5,083 4,801 4,895 25,277
National Express East Anglia 11,962 11,415 10,958 10,365 8,718 53,418
National Express East Coast 3,168 3,127 3,064 2,844 2,458 14,660
Northern Rail 14,344 14,374 13,699 13,298 11,108 66,824
South Eastern 14,908 14,684 14,592 13,286 11,524 68,995
South West Trains 14,723 14,502 14,933 13,580 12,167 69,906
Southern 11,597 11,423 11,159 10,792 8,888 53,860
Virgin Trains 6,372 5,644 6,416 5,185 4,456 28,073
Total 152,226 149,352 146,620 136,496 117,688 702,382
Appendix 34 Franchised stations maintenance and renewals expenditure by station facility owner

Printed on Revive Pure White Silk, a 100% recycled paper. Produced at a mill accredited with the ISO14001 standard for environmental management.

Network Rail Kings Place 90 York Way London N1 9AG
Tel: 020 3356 9595
www.networkrail.co.uk CD
S00
9/M
arch
200
9