More Than Words: Quantifying Language to Measure Firms ...
31
THE JOURNAL OF FINANCE • VOL. LXIII, NO. 3 • JUNE 2008 More Than Words: Quantifying Language to Measure Firms’ Fundamentals PAUL C. TETLOCK, MAYTAL SAAR-TSECHANSKY, and SOFUS MACSKASSY ∗ ABSTRACT We examine whether a simple quantitative measure of language can be used to predict individual firms’ accounting earnings and stock returns. Our three main findings are: (1) the fraction of negative words in firm-specific news stories forecasts low firm earnings; (2) firms’ stock prices briefly underreact to the information embedded in negative words; and (3) the earnings and return predictability from negative words is largest for the stories that focus on fundamentals. Together these findings suggest that linguistic media content captures otherwise hard-to-quantify aspects of firms’ fundamentals, which investors quickly incorporate into stock prices. Language is conceived in sin and science is its redemption —W. V. Quine, The Roots of Reference A VOLUMINOUS LITERATURE EXAMINES the extent to which stock market prices in- corporate quantitative information. Although few researchers study the im- pact of qualitative verbal information, there are compelling theoretical and empirical reasons to do so. 1 Theoretically, efficient firm valuations should be equal to the expected present discounted value of their cash flows conditional on investors’ information sets, which include qualitative descriptions of firms’ business environments, operations, and prospects in the financial press. Empir- ically, substantial movements in firms’ stock prices do not seem to correspond to changes in quantitative measures of firms’ fundamentals (e.g., Shiller (1981), Roll (1988), and Cutler, Poterba, and Summers (1989)), suggesting that quali- tative variables may help explain stock returns. ∗ Tetlock is with the Finance Department and Saar-Tsechansky is with the Information, Risk, and Operations Management Department at the University of Texas at Austin, McCombs School of Business. Macskassy is with Fetch Technologies. The authors are grateful for assiduous re- search assistance from Jie Cao and Shuming Liu. We appreciate helpful comments from Brad Barber, John Griffin, Alok Kumar, Terry Murray, David Musto, Terrance Odean, Chris Parsons, Mitchell Petersen, Laura Starks, Jeremy Stein, and Sheridan Titman, and from seminar par- ticipants at Barclays, Goldman Sachs, INSEAD, the Texas Finance Festival, University of Cal- ifornia at Berkeley, University of Oregon, and University of Texas at Austin. We also thank two anonymous referees. Finally, we are especially grateful to the editor, Cam Harvey, and an anonymous associate editor for their excellent suggestions. The authors are responsible for any errors. 1 In Section I, we discuss several recent studies that examine qualitative verbal information. 1437
Transcript of More Than Words: Quantifying Language to Measure Firms ...
THE JOURNAL OF FINANCE • VOL. LXIII, NO. 3 • JUNE 2008
More Than Words: Quantifying Languageto Measure Firms’ Fundamentals
PAUL C. TETLOCK, MAYTAL SAAR-TSECHANSKY, and SOFUS MACSKASSY∗
ABSTRACT
We examine whether a simple quantitative measure of language can be used to predictindividual firms’ accounting earnings and stock returns. Our three main findingsare: (1) the fraction of negative words in firm-specific news stories forecasts low firmearnings; (2) firms’ stock prices briefly underreact to the information embedded innegative words; and (3) the earnings and return predictability from negative wordsis largest for the stories that focus on fundamentals. Together these findings suggestthat linguistic media content captures otherwise hard-to-quantify aspects of firms’fundamentals, which investors quickly incorporate into stock prices.
Language is conceived in sin and science is its redemption
—W. V. Quine, The Roots of Reference
A VOLUMINOUS LITERATURE EXAMINES the extent to which stock market prices in-corporate quantitative information. Although few researchers study the im-pact of qualitative verbal information, there are compelling theoretical andempirical reasons to do so.1 Theoretically, efficient firm valuations should beequal to the expected present discounted value of their cash flows conditionalon investors’ information sets, which include qualitative descriptions of firms’business environments, operations, and prospects in the financial press. Empir-ically, substantial movements in firms’ stock prices do not seem to correspond tochanges in quantitative measures of firms’ fundamentals (e.g., Shiller (1981),Roll (1988), and Cutler, Poterba, and Summers (1989)), suggesting that quali-tative variables may help explain stock returns.
∗Tetlock is with the Finance Department and Saar-Tsechansky is with the Information, Risk,and Operations Management Department at the University of Texas at Austin, McCombs Schoolof Business. Macskassy is with Fetch Technologies. The authors are grateful for assiduous re-search assistance from Jie Cao and Shuming Liu. We appreciate helpful comments from BradBarber, John Griffin, Alok Kumar, Terry Murray, David Musto, Terrance Odean, Chris Parsons,Mitchell Petersen, Laura Starks, Jeremy Stein, and Sheridan Titman, and from seminar par-ticipants at Barclays, Goldman Sachs, INSEAD, the Texas Finance Festival, University of Cal-ifornia at Berkeley, University of Oregon, and University of Texas at Austin. We also thanktwo anonymous referees. Finally, we are especially grateful to the editor, Cam Harvey, andan anonymous associate editor for their excellent suggestions. The authors are responsible forany errors.
1 In Section I, we discuss several recent studies that examine qualitative verbal information.
1437

1438 The Journal of Finance
In this paper we quantify the language used in financial news stories in aneffort to predict firms’ accounting earnings and stock returns. Our study takesas a starting point Tetlock (2007), who examines how qualitative information—in particular, the fraction of negative words in a widely read news column aboutthe stock market—is incorporated in aggregate market valuations. We extendthat analysis to address the impact of negative words in all Wall Street Journal(WSJ) and Dow Jones News Service (DJNS) stories about individual S&P 500firms from 1980 to 2004.2 In addition to studying individual firms’ stock returns,we investigate whether negative words can be used to improve expectations offirms’ future cash flows. Overall, this study sheds light on whether and whyquantifying language provides novel information about firms’ earnings andreturns.
Before delving into our tests, we call attention to two significant advantagesto using the language in everyday news stories to predict firms’ earnings andreturns. First, by quantifying language, researchers can examine and judgethe directional impact of a limitless variety of events, whereas most studiesfocus on one particular event type, such as earnings announcements, mergers,or analysts’ recommendations. Analyzing a more complete set of events that af-fect firms’ fundamental values allows researchers to identify common patternsin firm responses and market reactions to events. Equally important, exam-ining all newsworthy events simultaneously limits the scope for “dredging foranomalies”—the phrase used by Fama (1998) to describe running event studieson different types of events until one obtains “significant” results.
Second, linguistic communication is a potentially important source of in-formation about firms’ fundamental values. Because very few stock marketinvestors directly observe firms’ production activities, they get most of theirinformation secondhand. Their three main sources are analysts’ forecasts,quantifiable publicly disclosed accounting variables, and linguistic descriptionsof firms’ current and future profit-generating activities. If analyst and account-ing variables are incomplete or biased measures of firms’ fundamentals, lin-guistic variables may have incremental explanatory power for firms’ futureearnings and returns.
As an example of our linguistic quantification method, consider a January 8,1999 DJNS article entitled “Consumer Groups Say Microsoft Has Overchargedfor Software.” We hypothesize that the fraction of negative words containedin the article is related to the impact of the news event on Microsoft’s marketvalue (Tetlock (2007)). The article’s second sentence is: “The alleged ‘pricingabuse will only get worse if Microsoft is not disciplined sternly by the antitrustcourt,’ said Mark Cooper, director of research for Consumer Federal of Amer-ica.” Based on the classification dictionary that we use, this sentence’s fractionof negative words ranks in the 99th percentile of sentences within our news
2 As in Tetlock (2007), we use negative words from the General Inquirer’s Harvard-IV-4 clas-sification dictionary to measure qualitative information. Our results are similar for alternativemeasures that include positive words from this same dictionary. See Section II for further discus-sion.

More Than Words: Quantifying Language 1439
database.3 In this case, the abundance of negative words is consistent withan intuitive reading of the story, and with Microsoft’s abnormally poor stockreturns around the news event.4
We do not claim that our crude quantitative measure of language subsumes ordominates traditional accounting measures of firms’ fundamentals. Rather, weinvestigate whether the fraction of negative words in firm-specific news storiescan improve our understanding of firms’ cash flows and whether firms’ stockmarket prices efficiently incorporate linguistic information. Insofar as negativeword counts are noisy measures of qualitative information, the coefficients inour regressions should be biased toward zero, understating the true importanceof qualitative information.
Despite this large measurement error, our first main result is that negativewords convey negative information about firm earnings above and beyond stockanalysts’ forecasts and historical accounting data. In other words, qualitativeverbal information does not merely echo easily quantifiable traditional mea-sures of firm performance. We also test whether stock market prices rationallyreflect the effect of negative words on firms’ expected earnings. Our secondresult is that stock market prices respond to the information embedded in neg-ative words with a small, one-day delay. As a result, we identify potential profitsfrom using daily trading strategies based on the words in a continuous intradaynews source (DJNS), but not from strategies based on a news source updatedless frequently (WSJ). Accounting for reasonable transaction costs could elim-inate the profitability of the high-frequency trading strategy, suggesting thatshort-run frictions play an important role in how information is incorporatedin asset prices. To interpret these results further, we separately analyze neg-ative words in news stories whose content focuses on firms’ fundamentals. Wefind that negative words in stories about fundamentals predict earnings andreturns more effectively than negative words in other stories. Collectively, ourthree findings suggest that linguistic media content captures otherwise hard-to-quantify aspects of firms’ fundamentals, which investors quickly incorporateinto stock prices.
The layout of the paper is as follows. In Section I we conduct a brief review ofrelated research on qualitative information. Section II discusses the propertiesof the news stories used in this study. Sections III and IV present the maintests for whether negative words predict firms’ earnings and stock returns,respectively. In Section V, we assess whether earnings and return predictabilityis strongest for timely (DJNS) news articles that focus on firms’ fundamentals.In Section VI, we present our conclusions and outline directions for furtherresearch on media content.
3 There are five negative words (alleged, abuse, worse, sternly, and antitrust) among the 29 totalwords in the sentence, or 17.2%, which exceeds the cutoff for the 99th percentile of our 1998 newsstory data. The tone of the sentence is representative of the entire article, which also ranks in thetop decile for 1998.
4 Microsoft’s cumulative abnormal stock returns were –42, –141, and –194 basis points for thethree trading days surrounding the news event.

1440 The Journal of Finance
I. Research on Qualitative Information
To create a quantitative variable from text documents such as news stories,one must devise a representation of the unstructured text. The most commonrepresentation is the Bag-of-Words scheme, which represents all words appear-ing in news stories as a document-term matrix—for example, a row could be the1/8/99 Microsoft story above, and columns could be the terms “alleged,” “abuse,”“worse,” “happy,” and “neutral.” The matrix elements are designed to capturethe information value of each word in each news story, which could be the rel-ative frequencies of the 5 words within the 29-word excerpt: [1/29, 1/29, 1/29,0/29, 0/29]. The challenge in text analysis is to translate this term−documentmatrix into a meaningful conceptual representation of the story, such as thedegree to which the story conveys positive or negative information.
In this paper, we collapse the document-term matrix into just two columnsusing domain knowledge from the positive and negative word categories in theHarvard-IV-4 psychosocial dictionary. For reasons explained below, our primaryfocus is the negative column. We make the simplifying assumption that all neg-ative words in the predetermined dictionary are equally informative, and otherwords are uninformative. As in the example above, we measure a story’s nega-tivity according to the relative frequency of negative words in each news story.These procedures conform to Tetlock (2007) and many psychological studiesusing the Harvard-IV-4 dictionary. A well-known and widely used text analysisprogram called the General Inquirer features this same dictionary.5
A more sophisticated alternative to our approach would entail estimatingthe information value of each word’s occurrence in a story, and determiningwhich words are most likely to appear in negative stories. Unfortunately, thesenuances have significant drawbacks. First, subjective human judgment maybe necessary to assess whether a story is negative. Second, determining whichwords are more likely to have negative meanings requires the estimation ofpotentially thousands of likelihoods ratios—one for every word used in clas-sification. By contrast, we rely on extensive psychological research to identifynegative words, thereby avoiding this daunting estimation task and the needfor subjective human judgment. Our resulting word count measures are parsi-monious, objective, replicable, and transparent. At this early stage in researchon qualitative information, these four attributes are particularly important,and give word count measures a reasonable chance of becoming widely adoptedin finance.
In addition to Tetlock (2007), several new research projects investigate theimportance of qualitative information in finance. Our study is most closely re-lated to concurrent work by Li (2006) and Davis, Piger, and Sedor (2006), whoanalyze the tone of qualitative information using objective word counts fromcorporate annual reports and earnings press releases, respectively. Whereas
5 The Harvard-IV-4 dictionary on the General Inquirer’s Web site lists each word in the negativecategory: http://www.webuse.umd.edu:9090/tags/TAGNeg.html. See Riffe, Lacy, and Fico (1998) fora survey of content analysis and its application to the media.

More Than Words: Quantifying Language 1441
Davis, Piger, and Sedor (2006) examine the contemporaneous relationships be-tween earnings, returns, and qualitative information, Li (2006) focuses on thepredictive ability of qualitative information as we do.
Li (2006) finds that the two words “risk” and “uncertain” in firms’ annualreports predict low annual earnings and stock returns, which the author in-terprets as underreaction to “risk sentiment.” Our study differs from Li (2006)in that we examine qualitative information in news stories at daily horizonsrather than qualitative information in annual reports at annual horizons. Ourpredictability tests use over 80 quarters of earnings and over 6,000 days of re-turns data, as compared to 12 years of earnings and 12 years of returns data inLi (2006). Other differences between our studies, such as the measures used,do not seem to be as important. When we use the words “risk” and “uncertain”rather than the entire negative words category to measure qualitative informa-tion, we find similar albeit slightly weaker earnings and return predictability.
Some prior and contemporaneous research analyzes qualitative informationusing more sophisticated subjective measures, rather than simple objectiveword counts. However, most of this work focuses on firms’ stock returns andignores firms’ earnings. For example, Antweiler and Frank (2004) and Dasand Chen (2006) design algorithms to reproduce humans’ “bullish,” “neutral,”or “bearish” ratings of internet chat room messages and news stories. Nei-ther study finds any statistically significant return predictability in individualstocks. A recent study by Antweiler and Frank (2006), which uses an algorithmto identify news stories by their topic rather than their tone, does find some re-turn predictability. For many of their topic classifications, Antweiler and Frank(2006) find significant return reversals in the 10-day period around the news,which they interpret as overreaction to news regardless of its tone.
II. Stylized Facts about Firm-Specific News Stories
We concentrate our analysis on the fraction of negative words in DJNS andWSJ stories about S&P 500 firms from 1980 through 2004. We choose theS&P 500 constituent firms for reasons of importance and tractability. Firms inthe S&P 500 index encompass roughly three-quarters of the total U.S. marketcapitalization, and appear in the news sufficiently often to make the analysisinteresting.
We obtain S&P index constituents and their stock price data from the Centerfor Research on Security Prices (CRSP), analyst forecast information from theInstitutional Brokers’ Estimate System (I/B/E/S), and accounting informationfrom Compustat. Merging the news stories and the financial information for agiven firm requires matching firms’ common names used in news stories to theirpermnos, CUSIPs, or gvkeys used in the above financial data sets. Althoughfirms’ common names usually resemble the firm names appearing in financialdata sets, perfect matches are rare.
To obtain the common names that we use as search strings for news stories,we begin with the company name variable in the CRSP data for all S&P 500index constituents during the relevant time frame. We use the CRSP company
1442 The Journal of Finance
name change file to identify situations in which a firm in the index changesits name. We focus on news stories featuring the company name most directlyrelated to the stock. Thus, for conglomerates, we use the holding company name,not the subsidiary names—for example, PepsiCo, Inc., or Pepsi for short, ratherthan Gatorade or Frito-Lay. This means that we may miss news stories aboutsome firms’ major products, possibly weakening our results.
Our source for news stories is the Factiva database. To find the name thatmedia outlets use to refer to a firm, we use a combination of four differentmethods that are described in detail in the Appendix. Because of the largenumber of firms and news stories, we implement an automated story retrievalsystem. For each S&P 500 firm, the system constructs a query that specifiesthe characteristics of the stories to be retrieved. The system then submits thequery and records the retrieved stories.
In total, we retrieve over 350,000 qualifying news stories—over 260,000 fromDJNS and over 90,000 from WSJ—that contain over 100,000,000 words. Wefind at least one story for 1,063 of 1,110 (95.8%) of the firms in the S&P 500from 1980 to 2004 (see the Appendix for details). We include a news story inour analysis only if it occurs while the firm is a member of the S&P indexand is within our 25-year time frame. We also exclude stories in the first weekafter a firm has been newly added to the index to prevent the well-known priceincrease associated with a firm’s inclusion in the S&P 500 index from affectingour analysis (Shleifer (1986)).
Each of the stories in our sample meets certain requirements that we imposeto eliminate irrelevant stories and blurbs. Specifically, we require that eachfirm-specific story mentions the firm’s official name at least once within thefirst 25 words, including the headline, and the firm’s popular name at leasttwice within the full story. In addition, we require that each story containsat least 50 words in total, and at least 5 words that are either “Positive” or“Negative,” where at least 3 of the 5 must be unique. We impose these threeword count filters to eliminate stories that contain only tables or lists withcompany names and quantitative information, and to limit the influence ofoutliers on the negative words measure described below.
Following Tetlock (2007), our primary measure of media content is the stan-dardized fraction of negative words in each news story. In unreported tests, wefind very similar results using combined measures of positive (P) and negative(N) words, such as (P − N)/(P + N) and log((1 + P)/(1 + N)). However, us-ing positive words in isolation produces much weaker results, especially aftercontrolling for negative words. These results are consistent with the generalanalysis of word categories in Tetlock (2007). That study shows that negativewords summarize common variation in the entire set of General Inquirer wordcategories better than any other single category, including positive words—that is, negatives are most highly correlated with the first eigenvector of theN by N variance-covariance matrix for all N word categories. Tetlock (2007)also finds that negative words have a much stronger correlation with stockreturns than other words. These results are also consistent with a large bodyof literature in psychology—for example, Baumeister et al. (2001) and Rozinand Royzman (2001)—that argues negative information has more impact and

More Than Words: Quantifying Language 1443
is more thoroughly processed than positive information across a wide range ofcontexts.
Before counting instances of negative words, we combine all qualifying newsstories for each firm on a given trading day into a single composite story. Westandardize the fraction of negative words in each composite news story bysubtracting the prior year’s mean and dividing by the prior year’s standarddeviation of the fraction of negative words. Formally, we define two measuresof negative words:
Neg = No. of negative wordsNo. of total words
(1)
neg = Neg − µNeg
σNeg, (2)
where µNeg is the mean of Neg and σNeg is the standard deviation of Neg overthe prior calendar year. The standardization may be necessary if Neg is non-stationary, which could happen if there are regime changes in the distributionof words in news stories—for example, the DJNS or WSJ changes its coverageor style. The variable neg is the stationary measure of media content that weemploy in our regression analyses.
Before analyzing the predictive power of linguistic media content, we doc-ument an important stylized fact: There are many more firm-specific newsstories in the days immediately surrounding a firm’s earnings announcement.For each firm-specific news story, we calculate the number of days until thefirm’s next earnings announcement and the number of days that have passedsince the firm’s previous earnings announcement. We plot a histogram of bothvariables back-to-back in Figure 1. Thus, each story is counted exactly twicein Figure 1, once after the previous announcement and once before the nextannouncement, except the stories that occur on the earnings announcementday.
Figure 1 provides striking evidence that news stories concentrate aroundearnings announcement days, as shown by the three adjacent spikes repre-senting the firm-specific news stories one day before, on the same day as, andone day after a firm’s earnings announcement. This finding suggests that newsstories could play an important role in communicating and disseminating in-formation about firms’ fundamentals. In the next three sections, we providefurther support for this interpretation of Figure 1.
III. Using Negative Words to Predict Earnings
We now formally investigate whether the language used by the media pro-vides new information about firms’ fundamentals and whether stock marketprices efficiently incorporate this information. In order to affect stock returns,negative words must convey novel information about either firms’ cash flows orinvestors’ discount rates (Campbell and Shiller (1987)). Our tests in this sectionfocus on whether negative words can predict earnings, a proxy for cash flows,

1444 The Journal of Finance
Figure 1. Media coverage around earnings announcements. This figure depicts the rela-tionship between the number of firm-specific news stories and the number of days away from afirm’s earnings announcement. All stories included in the figure are about S&P 500 firms, appearin either Dow Jones News Service or The Wall Street Journal from 1980 through 2004, and meetbasic minimum word requirements (see text for details). For each news story, we calculate the num-ber of days until the firm’s next earnings announcement and the number of days that have passedsince the firm’s last earnings announcement. We plot a histogram of both variables back-to-backin Figure 1. Thus, each story is counted twice in Figure 1, once before and once after the nearestannouncement, except the stories occurring on the earnings announcement day.
and therefore permanent changes in prices. The return predictability tests inSection IV address the possibility that negative words proxy for changes ininvestors’ discount rates, and therefore lead to return reversals. The idea un-derlying our earnings predictability tests is that negative words in a firm’snews stories prior to the firm’s earnings announcement could measure other-wise hard-to-quantify unfavorable aspects of the firm’s business environment.
We use two measures of firms’ quarterly accounting earnings as dependentvariables in our predictability tests, as the quarterly frequency is the highestfrequency for earnings data. Our main tests compute each firm’s standardizedunexpected earnings (SUE) following Bernard and Thomas (1989), who use aseasonal random walk with trend model for each firm’s earnings:
UEt = Et − Et−4 (3)
SUEt = UEt − µUEt
σUEt
, (4)

More Than Words: Quantifying Language 1445
where Et is the firm’s earnings in quarter t, and the trend and volatility ofunexpected earnings (UE) are equal to the mean (µ) and standard deviation(σ ) of the firm’s previous 20 quarters of unexpected earnings data, respectively.As in Bernard and Thomas (1989), we require that each firm have nonmissingearnings data for the most recent 10 quarters and assume a zero trend for allfirms with fewer than 4 years of earnings data.
We also use standardized analysts’ forecast errors (SAFE) as an alternativemeasure of firms’ earnings to ensure robustness. SAFE is equal to the medianstock analyst’s earnings forecast error divided by earnings volatility (σ ), whichis the same as the denominator of SUE. We use the median analyst forecastfrom the most recent statistical period in the I/B/E/S summary file prior to 3days before the earnings announcement.6 We winsorize SUE and all analystforecast variables at the 1% level to reduce the impact of estimation error andextreme outliers, respectively. Despite the well-known biases in stock analysts’earnings forecasts, we find remarkably similar results using SUE and SAFE.7
We attempt to match the frequency of our news measure to the frequency ofour quarterly earnings variable. Our measure of negative words (neg−30,−3) isthe standardized number of negative words in all news stories between 30 and3 trading days prior to an earnings announcement divided by the total num-ber of words in these news stories. That is, we construct the measure exactlyanalogous to the story-specific measure (neg) defined earlier, where we treat allthe words in the [–30,–3] time window as though they form a single compositenews story. We standardize neg−30,−3 by subtracting the prior year’s mean anddividing by the prior year’s standard deviation.
The timing of neg−30,−3 is designed to include news stories about the upcomingquarter’s earnings announcement. Because 30 trading days is roughly one-halfof a trading quarter, it is likely that most of the news stories in the [–30,–3] timewindow focus on the firm’s upcoming announcement rather than its previousquarter’s announcement. In addition, we allow for 2 full trading days betweenthe last news story included in this measure and the earnings announcementbecause Compustat earnings announcement dates may not be exact. None ofour qualitative results change if we set the beginning of the time window to20 or 40 trading days before the announcement, or set the ending of the windowto 1 or 5 trading days before the announcement.
In all earnings predictability regressions, we include control variables basedon a firm’s lagged earnings, size, book-to-market ratio, trading volume, threemeasures of recent stock returns, analysts’ earnings forecast revisions, andanalysts’ forecast dispersion. We measure firms’ lagged earnings using lastquarter’s SUE or SAFE measure, depending on which of these two variables is
6 Based on our conversations with Wharton Research Data Services representatives, the medianforecast comes from the distribution that includes only the most up-to-date forecasts from eachbrokerage.
7 Several studies argue that analyst earnings forecasts are too optimistic (e.g., Easterwood andNutt (1999)), overreact to certain pieces of information (e.g., De Bondt and Thaler (1990)), andunderreact to other information (e.g., Abarbanell and Bernard (1992)), among other biases.

1446 The Journal of Finance
the dependent variable in the regression.8 We measure firm size (Log(MarketEquity)) and book-to-market (Log(Book/Market)) at the end of the precedingcalendar year, following Fama and French (1992). We compute trading volumeas the log of annual shares traded divided by shares outstanding (Log(ShareTurnover)) at the end of the preceding calendar year.
Our three control variables for a firm’s past returns are based on a simpleearnings announcement event study methodology.9 We estimate benchmarkreturns using the Fama-French (1993) three-factor model with an estimationwindow of [–252,–31] trading days prior to the earnings announcement. We in-clude two control variables for a firm’s recent returns, the cumulative abnormalreturn from the [–30,–3] trading day window (FFCAR−30,−3) and the abnormalreturn on day –2 (FFCAR−2,−2). These return windows end 1 trading day afterour [–30,–3] news story time window to ensure that we capture the full priceimpact of the news stories. Our third control variable, FFAlpha−252,−31, is theestimated intercept from the event study regression that spans the [–252,–31]time window. We interpret the FFAlpha−252,−31 measure as the firm’s in-samplecumulative abnormal return over the previous calendar year, skipping the mostrecent month. The FFAlpha−252,−31 variable is related to the Jegadeesh and Tit-man (1993) return momentum effect, which is based on firms’ relative returnsover the previous calendar year excluding the most recent month.
In all our earnings regressions, we include control variables for the mediananalyst’s quarterly forecast revision and analysts’ quarterly forecast dispersion.We compute the median analyst’s 3-month earnings forecast revision (ForecastRevisions) following Chan, Jegadeesh, and Lakonishok (1996). We use 3-monthrevision periods rather than 6-month periods because these revisions capturenew information after the forecast preceding last quarter’s earnings announce-ment, which is already included in our regressions as a separate control. Thisrevision variable is equal to the 3-month sum of scaled changes in the mediananalyst’s forecast, where the scaling factor is the firm’s stock price in the priormonth. We compute analysts’ forecast dispersion (Forecast Dispersion) as thestandard deviation of analysts’ earnings forecasts in the most recent time pe-riod prior to the announcement scaled by earnings volatility (σ )—that is, thedenominator of SUE and SAFE. We construct both of these control variablesusing quarterly analyst forecasts to match our dependent variables, which arebased on quarterly earnings measures. Because analysts’ quarterly forecastsare unavailable from I/B/E/S between 1980 and 1983 and for firms withoutanalyst coverage, the earnings predictability regressions that we report do notinclude these observations.10
Even though the stock return control variable (FFCAR−30,−3) includes all ofthe information embedded in news stories during the [–30,–3] time window, it
8 The inclusion of additional lags of the dependent variables does not change the results.9 Controlling for alternative measures of past returns such as raw event returns and the past
calendar year’s return does not change our qualitative results.10 If we omit the two analyst variables and include these remaining observations in our regres-
sions, we find very similar results.

More Than Words: Quantifying Language 1447
is possible that these stories are more recent than the most recent analyst fore-cast data. Indeed, many WSJ and DJNS news stories explicitly mention stockanalysts, suggesting negative words in these stories may draw some predictivepower from analysts’ qualitative insights. To guard against the possibility thatnegative words predict returns solely because they appear more recently thanthe quantitative analyst forecasts, we also calculate a “Before Forecasts” nega-tive words measure (neg−30,−3) that includes only the stories that occur at least1 trading day prior to the date of the most recent consensus analyst forecast.11
We estimate the ability of negative words (neg−30,−3) to predict earnings (SUEor SAFE) using pooled ordinary least squares (OLS) regressions and standarderrors clustered by calendar quarter (Froot (1989)). The rationale is that thedependent variable (SUE or SAFE) is already standardized to remove any firmeffect, but does exhibit a time effect because firms’ realized earnings are un-doubtedly correlated within calendar quarters. We confirm this reasoning usingseveral diagnostic checks following Petersen (2007). These tests also suggestthat, if anything, our coefficients and standard errors are conservative relativeto a wide range of alternative estimation techniques.12
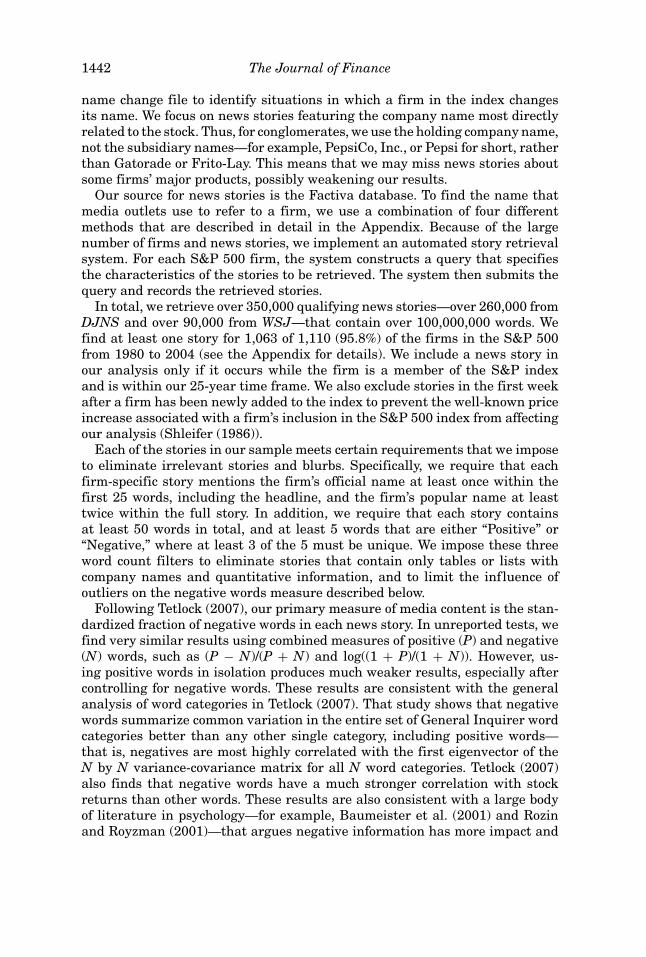
Table I reports estimates of the ability of negative words (neg−30,−3) to pre-dict quarterly earnings using six OLS regressions: two different dependentvariables (SUE; SAFE) regressed on negative words computed based on foursets of news stories (DJNS, WSJ, “Before Forecasts,” and “All Stories”). Thekey result is that negative words (neg−30,−3) consistently predict lower earn-ings, regardless of whether we use the SUE or SAFE measure, and regardlessof whether we use stories from DJNS or WSJ or from the time period beforestock analysts state their earnings forecasts.
Although negative words (neg−30,−3) from WSJ stories appear to predict SUEslightly better than neg−30,−3 from DJNS stories, the WSJ coefficient estimatesof neg−30,−3 are not statistically different from the DJNS estimates. All six es-timates of the dependence of earnings on negative words are negative and sta-tistically significant at the 99% level. Because the independent and dependentvariables are standardized, the rough economic interpretation of the “All Sto-ries” SUE estimate is that the conditional expectation of SUE is 4 × (0.064) =0.255 standard deviations lower as neg−30,−3 increases from two standard de-viations below to two standard deviations above its mean value.
We now analyze the SUE and SAFE regressions that compute negative wordsusing stories from both news sources in greater detail. Columns 4 and 6 in
11 Because I/B/E/S reviews and updates the accuracy and timing of analyst forecasts even afterthe consensus forecast date, it is unlikely that news stories from one trading day earlier containinformation not reflected in the consensus. In addition, allowing three trading days does not changeour qualitative results.
12 If we use fixed-effects models instead, the point estimates of the key coefficients increase andthe standard errors remain similar. This robustness is comforting because fixed-effects estimatorsand pooled OLS estimators for dynamic panel data models with lagged dependent variables showopposite small sample biases (see Nickell (1981)). We also find qualitatively similar estimatesusing quarterly cross-sectional Fama-MacBeth (1973) regressions and Newey-West (1987) standarderrors for the coefficients. Including yearly time dummies in the pooled OLS regressions also doesnot affect our results.
1448 The Journal of Finance
Table IPredicting Earnings Using Negative Words
This table shows estimates of the ability of negative words (neg−30,−3) to predict quarterly earn-ings (SUE or SAFE) using ordinary least squares (OLS) regressions. We display the regressioncoefficients and summary statistics from six regressions below: two different dependent variables(SUE and SAFE) regressed on negative words computed based on four sets of news stories (DowJones News Service (DJNS), The Wall Street Journal (WSJ), “Before Forecasts,” and “All Stories”).SUE is a firm’s standardized unexpected quarterly earnings; and SAFE is the standardized an-alysts’ forecast error for the firm’s quarterly earnings. The negative words variable (neg−30,−3) isthe standardized number of negative words in the news stories from 30 to 3 trading days prior toan earnings announcement divided by the total number of words in these news stories. The DJNSand WSJ regressions use only stories from these sources to compute neg−30,−3. The two “BeforeForecasts” regressions compute neg−30,−3 using only stories that occur 1 trading day before themost recent consensus analyst forecast. All regressions include control variables for lagged firmearnings, firm size, book-to-market, trading volume, recent and distant past stock returns, and an-alysts’ quarterly forecast revisions and dispersion (see text for details). Following Froot (1989), wecompute clustered standard errors by calendar quarter. The robust t-statistics are in parentheses.
SUE SAFE
Before All Before AllStories Included DJNS WSJ Forecasts Stories Forecasts Stories
neg−30,−3 −0.0584 −0.1083 −0.0640 −0.0637 −0.0192 −0.0197(−4.42) (−5.28) (−3.95) (−4.69) (−3.79) (−4.44)
Lag(Dependent Var) 0.2089 0.2082 0.2042 0.2101 0.2399 0.2523(11.82) (11.83) (11.90) (11.98) (7.82) (8.74)
Forecast Dispersion −0.9567 −1.0299 −0.9634 −0.9373 −0.2984 −0.3076(−9.84) (−9.59) (−9.21) (−10.20) (−5.34) (−6.34)
Forecast Revisions 20.2385 18.0394 20.4855 19.5198 0.5111 0.7580(8.89) (7.91) (8.51) (8.94) (0.68) (1.19)
Log(Market Equity) −0.0071 0.0003 −0.0043 −0.0037 0.0258 0.0289(−0.40) (0.01) (−0.24) (−0.21) (4.79) (5.32)
Log(Book/Market) 0.0173 0.0182 0.0221 0.0204 −0.0162 −0.0110(0.62) (0.56) (0.77) (0.75) (−1.97) (−1.41)
Log(Share Turnover) −0.1241 −0.1348 −0.1095 −0.1261 0.0274 0.0254(−3.09) (−2.90) (−2.75) (−3.20) (2.69) (2.61)
FFAlpha−252,−31 1.9784 1.9711 1.9770 2.0015 0.2199 0.2382(9.14) (9.90) (10.01) (9.50) (4.17) (4.36)
FFCAR−30,−3 0.0119 0.0129 0.0117 0.0116 0.0062 0.0071(6.76) (6.33) (6.28) (6.64) (10.17) (11.38)
FFCAR−2,−2 0.0104 0.0103 0.0177 0.0118 0.0053 0.0037(1.65) (1.37) (2.40) (1.91) (2.30) (1.89)
Observations 16755 11192 13722 17769 12907 16658Clusters 80 79 78 80 78 79Adjusted R2 0.1177 0.1204 0.1158 0.1187 0.1163 0.1244
Table I display the coefficient estimates for all independent variables in thesetwo regressions. As one would expect, several control variables exhibit strongexplanatory power for future earnings. For example, lagged earnings, variablesbased on analysts’ forecasts, and recent stock returns (FFCAR−30,−3) are allpowerful predictors of earnings.

More Than Words: Quantifying Language 1449
To gain intuition on the importance of language in predicting fundamen-tals, we compare the abilities of negative words in firm-specific news stories(neg−30,−3) and firms’ recent stock returns (FFCAR−30,−3) to predict future earn-ings. The logic of this comparison is that both variables capture potentially rel-evant firm-specific information over the same time horizon—their correlationis –0.05, and strongly statistically significant. This is a particularly challengingcomparison for language because the firm’s abnormal return measures the rep-resentative investor’s interpretation of firm-specific news, which is undoubtedlybased on a more sophisticated reading of the linguistic content that we quantify.In this respect, it is surprising that quantified language has any explanatorypower above and beyond market returns. Indeed, one could view a firm’s ab-normal return (FFCAR−30,−3) measured over the time horizon in which there isnews ([–30,–3]) as an alternative quantification of the tone of news (e.g., Chan(2003)).
Surprisingly, Columns 4 and 6 in Table I reveal that negative words andrecent stock returns have almost the same statistical impact and comparableeconomic impacts on future earnings. After standardizing the coefficients toadjust for the different variances of the independent variables, we find thatthe economic impact of past returns is 0.127 SUE and the impact of negativewords is 0.063 SUE—roughly half as large. We infer that incorporating directlyquantified language in earnings forecasts significantly improves upon usingstock returns alone to quantify investors’ reactions to news stories.
The “Before Forecasts” columns (3 and 5) in Table I show that negative words(neg−30,−3) robustly predict both SUE and SAFE even after we exclude wordsfrom the most recent stories. Surprisingly, the respective neg−30,−3 coefficientschange in magnitude by less than 3% relative to Columns 4 and 6, and bothremain strongly significant at any conventional level (p-values < 0.001).
In additional unreported tests, we run separate regressions for two sub-periods, pre-1995 and 1995 to 2004, based on the idea that media coveragechanged significantly in 1995 with the introduction of the Internet—for exam-ple, the WSJ officially launched WSJ.com on April 29, 1995. The main find-ing is that the significance and magnitude of all our results are quite similarfor both subperiods. In summary, the evidence consistently shows that even acrude quantification of qualitative fundamentals (neg−30,−3) can predict earn-ings above and beyond more recent measures of market prices and analysts’forecasts.
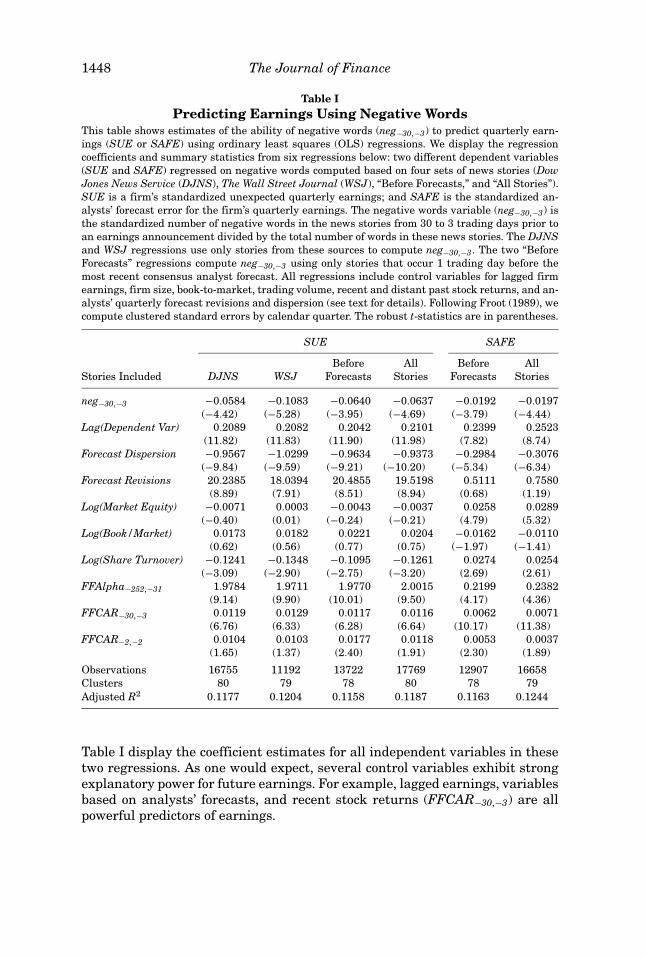
We now examine the long-run time-series behavior of earnings surroundingthe release of negative words in firm-specific news stories. Figure 2 comparesthe earnings of firms with negative and positive news stories from 10 fiscalquarters prior to an earnings announcement up to 10 fiscal quarters afterthe earnings announcement. The dependent variable in Figure 2 is a firm’scumulative SUE beginning 10 quarters prior to the earnings announcementwhen the news was released. Our cumulative SUE computation does notdiscount earnings in different time periods. Using a positive discount ratewould make the effect of negative words on earnings appear larger and morepermanent.
1450 The Journal of Finance
Figure 2. Firms’ fundamentals around positive and negative news stories. In this figure,we graph firms’ cumulative standardized unexpected earnings (SUE) from 10 fiscal quarters pre-ceding media coverage of an earnings announcement to 10 quarters after the media coverage. Wedefine media coverage of the announcement as positive (negative) when it contains a fraction ofnegative words (Neg−30,−3) in the previous year’s top (bottom) quartile. The measure of negativewords (Neg−30,−3) is the fraction of words that are negative in the news stories from 30 trading daysprior up to 3 trading days prior to an earnings announcement. We separately analyze the firmswith positive and negative media coverage prior to their earnings announcements. We computethe cumulative SUE for both sets of firms, beginning 10 quarters prior to the news and ending 10quarters after the news. To compute SUE values after the news stories, we use only unexpectedearnings benchmarks known at the time of the news—that is, those based on earnings prior toquarter zero (see text for details).
To compute SUE values after the news stories in Figure 2, we use only bench-marks for unexpected earnings that are known at the time of the news—that is,those based on earnings information prior to quarter zero. We use the matchingseasonal earnings figure from before quarter zero to compute unexpected earn-ings after quarter zero—for example, we subtract E−3 from E1, E5, and E9 toobtain UE1, UE5, and UE9. To obtain SUE measures, we standardize theseunexpected earnings values using the mean and volatility of unexpected
More Than Words: Quantifying Language 1451
earnings as measured in quarter zero.13 We define positive (negative) newsas news in which the variable Neg−30,−3 is in the bottom (top) quartile of theprevious year’s distribution of Neg−30,−3.14
Figure 2 shows that firms with negative news stories before an earningsannouncement experience large negative shocks to their earnings that endurefor at least 4 quarters after the news. Although there are noticeable differ-ences between firms with positive stories and those with many negative storiesthat appear before the news is released (0.772 cumulative SUE), the greatestdiscrepancy between the cumulative earnings of the two types of firms (1.816cumulative SUE) appears in the sixth fiscal quarter after the news event. Itappears as though most of the impact of negative words on cumulative earningsis permanent—1.764 cumulative SUE after 10 quarters, which is 0.992 cumu-lative SUE more than prior to the news. However, it is difficult to judge themagnitude and duration of the effect based on just 10 independent 10-quarterperiods.
From the analysis above, we conclude that negative words in firm-specificstories leading up to earnings announcements significantly contribute to a use-ful measure of firms’ fundamentals. One view is that this result is surprisingbecause numerous stock analysts and investors closely monitor the actions ofS&P 500 firms. Yet even after controlling for recent stock returns, analyst fore-casts and revisions, and other measures of investors’ knowledge, we find thata rudimentary linguistic measure of negative news still forecasts earnings.Furthermore, as we will demonstrate in Section V, it is possible to improvesubstantially upon this basic negative word count measure.
An alternative view is that negative words are informative measures of firms’fundamentals because they do not suffer from the same shortcomings as thequantitative variables that one can use to forecast earnings. For example, it iswidely known that stock analysts’ earnings forecasts exhibit significant biasesthat limit their forecasting power. In addition, stock market returns reflectrevisions in investors’ expectations of the present value of all future earningsas opposed to just next quarter’s earnings, which is the dependent measurein our regressions. Even if investors and stock analysts are fully aware of theinformation embedded in negative words, negative words may have significantincremental explanatory power for future earnings because readily availablequantitative variables are not accurate representations of investors’ expecta-tions.
13 We correct for the longer time intervals (T years) between the benchmark and unexpectedearnings using the seasonal random walk assumption that the mean of unexpected earnings scaleslinearly (µT) and the volatility increases with the square root of the time interval (σT1/2). Tomitigate any benchmarking biases, we also rescale SUE in each quarter so that its unconditionalmean is zero, which affects the level of the lines in Figure 2 but has no impact on the differencebetween them.
14 As one would expect, the fractions of positive and negative words in news stories are negativelycorrelated (–0.18, p-value < 0.001). For this reason, defining positive stories as those with relativelyfew negative words also produces stories with relatively more positive words.

1452 The Journal of Finance
IV. Using Negative Words to Predict Stock Returns
We subject the two competing views described above to empirical scrutiny inour return predictability tests. Having established that negative words in newsstories can predict firms’ fundamentals, we now examine whether they providenovel information not already represented in stock market prices. Unfortu-nately, we cannot test this conjecture by looking at contemporaneous marketreturns. Although there is a significant negative relationship between negativewords and concurrent market returns, it is difficult to know which variablecauses the other. Instead, we hypothesize that investors do not immediatelyrespond in full to the news embedded in negative words. To test this theory, weexplore whether negative words predict firms’ future stock returns.
A. Predicting Returns in Story Event Time
In this subsection, we focus on OLS regression estimates of the effect of neg-ative words on future stock returns in event time relative to the release of thenews story. We use daily returns and news stories because these are the highestfrequencies for which both data are reliably available—that is, all firms havedaily returns for the entire sample, and the WSJ is a daily publication. Otherbenefits of this choice are that the news and return data frequency match eachother and match the data frequency in Tetlock (2007).
Our main test assesses whether standardized fractions of negative words infirm-specific news stories on day zero predict firms’ close-to-close stock returnson day one. For all DJNS stories, we obtain precise time stamp data to excludestories that occur after 3:30 pm on day zero—that is, 30 minutes prior to marketclosing. To be conservative, we use the last time stamp for each story, whichindicates when the story was most recently updated. Thus, in many cases, thenegative words in DJNS stories became known to investors much earlier, of-ten by 1 hour, than we assume. This ensures that traders have at least 30minutes, and usually much longer, to digest and trade on the information inthese stories. For all WSJ stories, we assume that stories printed in the morn-ing’s WSJ are available to traders well before the market close on the sameday.
In each regression, we include several standard control variables to as-sess whether negative words predict returns above and beyond already-knownsources of predictability, including both firms’ characteristics (Daniel et al.(1997)) and firms’ covariances with priced risk factors (Fama and French(1993)). We include all of the characteristic controls in the earnings predictabil-ity regressions, except the two analyst earnings forecast variables.15 That is,we include the firm’s most recent earnings announcement (SUE), along with its
15 When we include the two analyst forecast variables, we find that both revisions and dispersionare statistically and economically insignificant predictors of returns in our sample. The coefficientson the key variables do not change materially. Thus, we omit the analyst variables to include anyS&P 500 firms without analyst coverage and the first 4 years of our sample in the regressionresults.

More Than Words: Quantifying Language 1453
close-to-close abnormal returns on the day of the news story (FFCAR0,0), eachof the previous 2 trading days (FFCAR−1,−1 and FFCAR−2,−2), the previousmonth (FFCAR−30,−3), and the previous year (FFAlpha−252,−31). These controlsare designed to capture return predictability from past earnings (e.g., Ball andBrown (1968)) and past returns (e.g., Jegadeesh and Titman (1993)), whichmay be distinct phenomena (e.g., Chan, Jegadeesh, and Lakonishok (1996)). Inaddition, we control for firm size and book-to-market ratios using each firm’slog of market capitalization and log of book-to-market equity measured at theend of the most recent June. These controls mimic the variables that Fama andFrench (1992) use to predict returns. We also control for trading volume usingthe log of share turnover.
We run two sets of regressions to ensure that firms’ return covariances withpriced risk factors do not drive our results. In the first set of regressions, weuse each firm’s next-day abnormal return as the dependent variable, where theFama-French three-factor model is the benchmark for expected returns.16 Toensure that our results do not depend heavily on the benchmarking process, werun a second set of regressions in which we use each firm’s next-day raw returnas the dependent variable.
Table II reports the results from six OLS regressions, two different depen-dent variables (raw and abnormal next-day returns) regressed on each of threedifferent negative words measures (DJNS, WSJ, and “All Stories”). The tableshows the coefficients on negative words in firm-specific news stories and theirassociated t-statistics. We compute clustered standard errors (Froot (1989)) toaccount for the correlations between firms’ stock returns within trading days.The reasons for choosing OLS regression estimates and standard errors clus-tered by time period are analogous to those discussed in Section III and arenot repeated here. Table II reports the number of clusters—that is, tradingdays—and the adjusted R2 for each regression.
The main result in Table II is that negative words in firm-specific news sto-ries robustly predict slightly lower returns on the following trading day. Thecoefficients on negative words (neg) are consistently significant in all four ofthe regressions where news stories from DJNS are included. The magnitude ofthe DJNS regression coefficient on neg, which is already standardized, impliesthat next-day abnormal returns (FFCAR+1,+1) are 3.20 basis points lower aftereach one-standard deviation increase in negative words.
Interestingly, the coefficients on negative words are less than half as largeand statistically insignificant in the two regressions where only WSJ storiesare included. One interpretation is that DJNS releases intraday stories withextremely recent information before the information is fully priced. By contrast,many morning WSJ stories are recapitulations of the previous day’s events—some of which appeared in the DJNS—that may already be incorporated inmarket prices.
16 We also find that including time dummies for each trading day—that is, demeaning returnsby trading day—does not change our results, suggesting an omitted common news factor is notdriving our results.

1454 The Journal of Finance
Table IIPredicting Returns Using Negative Words
This table shows the relationship between standardized fractions of negative words (neg) in firm-specific news stories and firms’ stock returns on the following day (Return+1,+1 or FFCAR+1,+1).The coefficients on neg−30,−3 and summary statistics from six regressions are displayed below: twodifferent dependent variables (Return+1,+1 and FFCAR+1,+1) regressed on negative words fromeach of three sets of news stories (Dow Jones News Service [DJNS], The Wall Street Journal [WSJ],and all stories). We exclude stories that occur after 3:30 pm (30 minutes prior to market closing).We assume that WSJ stories printed in the morning’s WSJ are available to traders before themarket close on the same day. The two dependent variables are the firm’s raw close-to-close return(Return+1,+1) and the firm’s abnormal return (FFCAR+1,+1). We use the Fama-French three-factormodel with a [−252,−31] trading day estimation period relative to the release of the news story asthe benchmark for expected returns. The key independent variable is neg, the fraction of negativewords in each news story standardized using the prior year’s distribution. Each regression alsoincludes control variables for the firm’s most recent earnings announcement (SUE), market equity,book-to-market equity, trading volume, and close-to-close returns on the day of the news story,each of the previous two trading days, and the previous calendar year. Following Froot (1989), wecompute clustered standard errors by trading day. The robust t-statistics are in parentheses.
Return+1,+1 FFCAR+1,+1
Stories Included DJNS WSJ All DJNS WSJ All
neg −0.0277 −0.0105 −0.0221 −0.0320 −0.0102 −0.0253(−3.67) (−1.24) (−3.72) (−4.83) (−1.37) (−4.88)
FFCAR0,0 0.0285 0.0229 0.0246 0.0259 0.0224 0.0226(5.28) (2.92) (5.43) (5.00) (2.94) (5.19)
FFCAR−1,−1 −0.0272 −0.0154 −0.0222 −0.0254 −0.0106 −0.0190(−3.63) (−2.17) (−4.21) (−3.86) (−1.68) (−4.13)
FFCAR−2,−2 −0.0215 −0.0094 −0.0179 −0.0207 −0.0104 −0.0183(−3.16) (−1.10) (−3.39) (−3.10) (−1.22) (−3.60)
FFCAR−30,−3 −0.0005 0.0016 −0.0002 0.0004 0.0018 0.0005(−0.30) (0.73) (−0.13) (0.28) (0.85) (0.38)
FFAlpha−252,−31 0.0559 0.1470 0.1046 0.1201 0.1686 0.1465(0.57) (1.29) (1.27) (1.36) (1.67) (2.02)
Earnings (SUE) 0.0160 0.0082 0.0125 0.0152 0.0055 0.0115(2.84) (1.33) (2.68) (3.46) (1.09) (3.25)
Log(Market Equity) −0.0152 −0.0159 −0.0154 −0.0120 −0.0121 −0.0109(−2.02) (−1.99) (−2.39) (−2.19) (−1.97) (−2.51)
Log(Book/Market) −0.0027 0.0087 −0.0010 −0.0246 −0.0061 −0.0201(−0.18) (0.60) (−0.08) (−2.12) (−0.52) (−2.22)
Log(Share Turnover) −0.0324 −0.0278 −0.0300 −0.0189 −0.0167 −0.0145(−1.66) (−1.43) (−1.76) (−1.35) (−1.16) (−1.27)
Observations 141541 84019 208898 141541 84019 208898Clusters (Days) 6260 6229 6272 6260 6229 6272Adjusted R2 0.0024 0.0014 0.0018 0.0026 0.0014 0.0019
We now analyze the Return+1,+1 and FFCAR+1,+1 regressions that includestories from the DJNS (in Columns 2 and 5 of Table II) in greater detail. As onewould expect in an efficient market, very few control variables predict next-dayreturns, which is why the R2 statistics in Table II are so low. Aside from thedaily news and returns variables, only firms’ earnings (SUE) have predictivepower at the 1% level.

More Than Words: Quantifying Language 1455
Figure 3. Firms’ valuations around positive and negative news stories. In this figure, wegraph a firm’s abnormal event returns from 10 trading days preceding a news story’s release to 10trading days following its release. All news stories focus on S&P 500 firms and come from eitherDow Jones News Service or The Wall Street Journal between 1980 and 2004 inclusive. For all DJNSstories, we exclude stories that occur after 3:30 pm (30 minutes prior to market closing). For allWSJ stories, we assume that stories printed in the morning’s WSJ are available to traders wellbefore the market close on the same day. We use the Fama-French three-factor model with a [−252,−31] trading day estimation period relative to the release of the news story as the benchmark forexpected returns. We label all news stories with a fraction of negative words (Neg) in the previousyear’s top (bottom) quartile as negative (positive) stories. We separately examine the market’sresponse to positive and negative DJNS and WSJ stories. We also compute the difference betweenthe reaction to positive and negative news stories for each source.
One pattern in these regressions is somewhat analogous to the main resultin Chan (2003). He shows that stocks in the news experience annual returncontinuations, whereas those not in the news experience annual return rever-sals. Although Table II examines daily horizons, the interpretation of the day 0(day-of-news), and day –1 and –2 (usually not news days) returns coefficients isquite similar. The positive coefficient on FFCAR0,0 shows that news-day returnscontinue on the next day, whereas the negative coefficients on FFCAR−1,−1 andFFCAR−2,−2 show that non-news-day returns reverse themselves.
We now examine the market’s apparently sluggish reaction to negative wordsin the 4 weeks surrounding the story’s release to the public. Figure 3 graphs afirm’s abnormal returns from 10 trading days before a story’s release to 10 trad-ing days after its release. Again, we use the Fama-French three-factor model to

1456 The Journal of Finance
estimate abnormal returns. We label all news stories with a fraction of negativewords (Neg) in the previous year’s top (bottom) quartile as negative (positive)stories. We separately examine the market’s response to positive and negativeDJNS and WSJ stories. We also compute the difference between the reactionto positive and negative news stories for each source.
Although Figure 3 shows that the market reacts quite efficiently to positiveand negative news, there is some delayed reaction, particularly for the DJNSnews stories. From the top line in Figure 3, one can see that the 12-day marketreaction, from day –2 to day 10, to WSJ stories is virtually complete after thefirst 2 trading days—7.5 basis points (bps) of underreaction after day 1 andonly 2.4 bps after day 2. By contrast, the second line in Figure 3 shows thatmore of the 12-day market reaction to DJNS stories persists beyond the first 2days—16.8 bps after day 1 and 6.2 bps after day 2.
The DJNS lines in Figure 3 show the day 1 delayed reaction to positive DJNSnews stories (6.6 bps) is somewhat larger than the delayed reaction to negativestories (4.0 bps).17 Although the total day 1 delayed reaction to DJNS newsstories is 10.6 bps (see the difference line), this magnitude is relatively small(17.2%) as a percentage of the total 12-day reaction of roughly 61.6 bps. Themarket appears even more efficient in its reaction to WSJ stories, where the1-day delayed reaction (5.2 bps) is only 7.1% of the 12-day reaction (73.3 bps).However, there may be additional underreaction to WSJ stories within thetrading day that encompasses the morning release of the newspaper.
B. Predicting Returns in Calendar Time
The lingering difference between the abnormal returns of firms with positiveand negative DJNS news stories suggests that a simple trading strategy couldearn positive risk-adjusted profits. In this section, we explore this possibility,focusing on the apparent short-run underreaction to negative words in theDJNS.
Specifically, at the close of each trading day, we form two equal-weightedportfolios based on the content of each firm’s DJNS news stories during theprior trading day.18 We use the same definitions for positive and negative storiesas before. We include all firms with positive DJNS news stories from 12:00 amto 3:30 pm on the prior trading day in the long portfolio, and put all firmswith negative stories in the short portfolio. We hold both the long and shortportfolios for 1 full trading day and rebalance at the end of the next tradingday. To keep the strategy simple, we exclude the rare days in which either thelong or the short portfolio contains no qualifying firms. Ignoring trading costs,the cumulative raw returns of this long-short strategy would be 21.1% per year.
17 The contemporaneous reactions to positive news stories are also larger. We observe the oppositeasymmetry for the positive and negative news stories about fundamentals that we examine inSection IV.
18 Forming two story-weighted or value-weighted portfolios produces very similar results.

More Than Words: Quantifying Language 1457
Table IIIRisk-Adjusted News-Based Trading Strategy Returns
This table shows the daily risk-adjusted returns (Alpha) from a news-based trading strategy forthree different time periods (1980 to 1994, 1995 to 2004, and 1980 to 2004). The first three regres-sions use the Fama-French (1993) three-factor model to adjust the trading strategy returns for theimpact of contemporaneous market (Market), size (SMB), and book-to-market (HML) factors. Thelast three regressions use the Carhart (1997) four-factor model to account for incremental impactof the momentum factor (UMD). Table III reports the alpha and loadings from the time-series re-gression of the long-short news-based portfolio returns on each of the four factors. We assemble theportfolio for the trading strategy at the close of each trading day. We form two equal-weighted port-folios based on the content of each firm’s Dow Jones News Service stories during the prior tradingday. We label all news stories with a fraction of negative words in the previous year’s top (bottom)quartile as negative (positive) stories. We include all firms with positive news stories in the longportfolio and all firms with negative news stories in the short portfolio. We hold both the long andshort portfolios for one full trading day and rebalance at the end of the next trading day. We ex-clude the rare days in which there are no qualifying firms in either the long or the short portfolio.We compute all coefficient standard errors using the White (1980) heteroskedasticity-consistentcovariance matrix. The robust t-statistics are in parentheses.
1980–1994 1995–2004 1980–2004 1980–1994 1995–2004 1980–2004
Alpha 0.0919 0.1175 0.1031 0.0952 0.1131 0.1013(2.83) (3.93) (4.55) (2.81) (3.78) (4.38)
Market −0.0994 −0.1087 −0.0983 −0.0831 −0.1001 −0.0999(−0.93) (−1.99) (−1.86) (−0.75) (−1.87) (−1.87)
SMB −0.0767 0.0475 −0.0081 −0.0647 0.0341 −0.0128(−0.35) (0.70) (−0.08) (−0.29) (0.49) (−0.12)
HML −0.1869 −0.2590 −0.2372 −0.1819 −0.2500 −0.2365(−1.24) (−2.81) (−2.94) (−1.20) (−2.75) (−2.93)
UMD −0.0911 0.0930 0.0444(−0.74) (2.01) (0.90)
Trading Days 3398 2497 5895 3398 2497 5895Adjusted R2 0.0003 0.0081 0.0026 0.0004 0.0106 0.0027
Table III shows the risk-adjusted daily returns from this daily news-basedtrading strategy for three different time periods (1980 to 1994, 1995 to 2004,and 1980 to 2004). We use the Fama-French three-factor (1993) and Carhartfour-factor (1997) models to adjust the trading strategy returns for the returnsof contemporaneous market, size, book-to-market, and momentum factors. Ta-ble III reports the alpha and factor loadings from the time series regression ofthe long-short news-based portfolio returns on the four factors. The first threecolumns report the results with the Fama-French benchmark, whereas the lastthree columns use the Carhart benchmark. We compute all coefficient standarderrors using the White (1980) heteroskedasticity-consistent covariance matrix.
Consistent with Table II, Table III shows that the daily news-based tradingstrategy would earn substantial risk-adjusted returns in a frictionless worldwith no trading costs or price impact. Specifically, the average excess return(Fama-French alpha) from news-based trading would be 9.2 bps per day from1980 to 1994 and 11.8 bps per day from 1995 to 2004. Using any return bench-mark, the alpha from the trading strategy is highly significant in all three

1458 The Journal of Finance
Figure 4. Distribution of daily abnormal returns for the news-based trading strategy.For the 25 years from 1980 to 2004, the figure depicts the distribution of the average daily abnormalreturns for the news-based trading strategy described below. Each frequency bin encompasses a5% range of abnormal returns described by the two numbers adjacent to the bin—for example, thefrequency of the leftmost return bin (4 years) is the number of years in which the trading strategy’saverage daily return is between –5 basis points and zero basis points. We assemble the portfoliofor the news-based trading strategy at the close of each trading day. We form two equal-weightedportfolios based on the content of each firm’s Dow Jones News Service stories during the priortrading day. We label all news stories with a fraction of negative words in the previous year’s top(bottom) quartile as negative (positive) stories. We include all firms with positive news stories inthe long portfolio and all firms with negative news stories in the short portfolio. We hold both thelong and short portfolios for 1 full trading day and rebalance at the end of the next trading day. Weexclude the rare days in which either the long or the short portfolio contains no qualifying firms.To adjust the returns for risk, we use the full-sample estimates of the Fama-French three-factorloadings of the news-based portfolio displayed in Table III.
time-periods. Interestingly, the returns from news-based trading are notstrongly related to any of the Fama-French factors or the momentum factor.19
The very low R2 statistics show that nearly all of the trading strategy risk isfirm-specific, as one might expect because we focus on firm-specific news stories.
For the 25 years between 1980 and 2004, Figure 4 depicts the distribution ofthe average daily abnormal returns for the news-based trading strategy. In the
19 The strategy’s negative loading on HML is a minor exception, possibly driven by the numerouspositive news stories about growth firms during the late 1990s.
More Than Words: Quantifying Language 1459
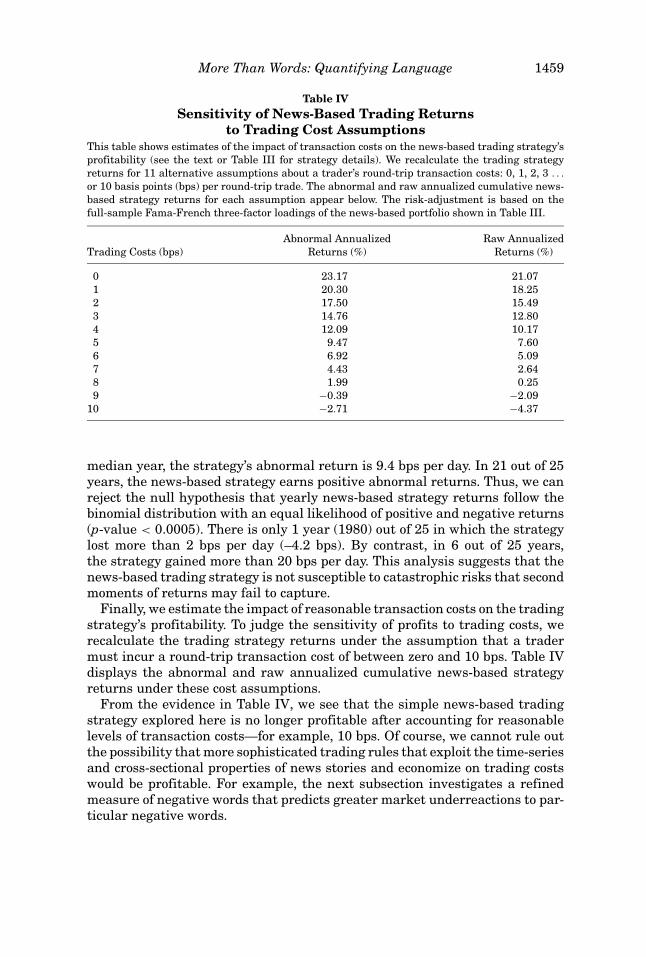
Table IVSensitivity of News-Based Trading Returns
to Trading Cost AssumptionsThis table shows estimates of the impact of transaction costs on the news-based trading strategy’sprofitability (see the text or Table III for strategy details). We recalculate the trading strategyreturns for 11 alternative assumptions about a trader’s round-trip transaction costs: 0, 1, 2, 3 . . .
or 10 basis points (bps) per round-trip trade. The abnormal and raw annualized cumulative news-based strategy returns for each assumption appear below. The risk-adjustment is based on thefull-sample Fama-French three-factor loadings of the news-based portfolio shown in Table III.
Abnormal Annualized Raw AnnualizedTrading Costs (bps) Returns (%) Returns (%)
0 23.17 21.071 20.30 18.252 17.50 15.493 14.76 12.804 12.09 10.175 9.47 7.606 6.92 5.097 4.43 2.648 1.99 0.259 −0.39 −2.09
10 −2.71 −4.37
median year, the strategy’s abnormal return is 9.4 bps per day. In 21 out of 25years, the news-based strategy earns positive abnormal returns. Thus, we canreject the null hypothesis that yearly news-based strategy returns follow thebinomial distribution with an equal likelihood of positive and negative returns(p-value < 0.0005). There is only 1 year (1980) out of 25 in which the strategylost more than 2 bps per day (–4.2 bps). By contrast, in 6 out of 25 years,the strategy gained more than 20 bps per day. This analysis suggests that thenews-based trading strategy is not susceptible to catastrophic risks that secondmoments of returns may fail to capture.
Finally, we estimate the impact of reasonable transaction costs on the tradingstrategy’s profitability. To judge the sensitivity of profits to trading costs, werecalculate the trading strategy returns under the assumption that a tradermust incur a round-trip transaction cost of between zero and 10 bps. Table IVdisplays the abnormal and raw annualized cumulative news-based strategyreturns under these cost assumptions.
From the evidence in Table IV, we see that the simple news-based tradingstrategy explored here is no longer profitable after accounting for reasonablelevels of transaction costs—for example, 10 bps. Of course, we cannot rule outthe possibility that more sophisticated trading rules that exploit the time-seriesand cross-sectional properties of news stories and economize on trading costswould be profitable. For example, the next subsection investigates a refinedmeasure of negative words that predicts greater market underreactions to par-ticular negative words.
1460 The Journal of Finance
V. Interpreting the Earnings and Return Predictability
The key stylized facts documented thus far are: (1) news stories about firmsare concentrated around their earnings announcements; (2) negative wordsin firm-specific stories predict low firm earnings in the next quarter; and (3)negative words about firms predict low firm stock returns on the next tradingday. In this section, we explore further whether the ability of negative words topredict returns comes from underreaction to news about firms’ fundamentalsthat is embedded in language.
Our specific hypothesis is that negative words in news stories that mentionthe word stem “earn” contain more information about firms’ fundamentals thanother stories. If this is the case, we should observe three effects. First, negativewords in stories that include the word stem “earn” should be better predictorsof earnings. Second, the contemporaneous relationship between negative wordsand returns should be stronger for stories that contain the word stem “earn.”Third, because these stories better capture news about hard-to-quantify funda-mentals, the magnitude of the market’s underreaction to negative words shouldbe greater for stories that contain the word stem “earn.”20
Before testing these three predictions, we establish an intuitive property ofthis measure of fundamentals: the news stories near earnings announcements(see the spike in Figure 1) are far more likely to mention the word stem “earn”—for example, the word “earnings” or any form of the verb “earn.” We constructa dummy variable (Fund) that indicates whether a news story contains anywords beginning with “earn.” We find that only 18.9% of the stories more than1 day away from an earnings announcement contain the word stem “earn,”compared to 72.5% of the stories within a day of an announcement.
We test whether negative words in stories containing the word stem “earn”predict earnings better than negative words in other stories. We add two newindependent variables to the regressions for SUE and SAFE shown earlier inColumns 4 and 6 of Table I. The first new variable (Fund−30,−3) is the total num-ber of words in news stories between day −30 and day −3 that contain the wordstem “earn” divided by the total number of words in all news stories betweenday −30 and day −3. This measure is designed to capture the fraction of wordsbetween day −30 and day −3 that are likely to provide relevant informationabout firms’ fundamentals. The second new variable (neg−30,−3
∗ Fund−30,−3) isthe interaction between Fund−30,−3 and the negative words measure (neg−30,−3).The coefficient on the interaction term measures the extent to which negativewords “about” fundamentals are more useful predictors of firms’ earnings thanother negative words.
Table V shows that the coefficients for both of the new independent variablesin the SUE and SAFE regressions are strongly negative and statistically sig-nificant. The coefficient on the interaction term (neg−30,−3
∗ Fund−30,−3) in theSUE regression shows that negative words that are “about” fundamentals are
20 Pritamani and Singhal (2001) document a fact that may be related to this third hypothesis.Although they do not examine the tone of news stories, they do find return momentum followingmarket reactions to earnings-related news stories.

More Than Words: Quantifying Language 1461
Table VPredicting Earnings Using Negative Words about Fundamentals
This table reports the results from two OLS regressions with different dependent variables (SUEand SAFE) regressed on negative words (neg−30,−3), fundamental words (Fund−30,−3), and the in-teraction between these words (neg−30,−3
∗ Fund−30,−3). SUE is a firm’s standardized unexpectedquarterly earnings; SAFE is the standardized analysts’ forecast error for the firm’s quarterly earn-ings. Both regressions include all news stories from both news sources (Dow Jones News Serviceand The Wall Street Journal) over the time period from 1984 through 2004. The measure of negativewords (neg−30,−3) is the standardized fraction of words that are negative in the news stories from30 trading days prior up to 3 trading days prior to an earnings announcement. Fundamental words(Fund−30,−3) is the fraction of words that are contained in news stories that mention the wordstem “earn” from 30 trading days prior up to 3 trading days prior to an earnings announcement.All regressions include control variables for lagged firm earnings and numerous firm characteris-tics (see text for details). To allow for correlations among announced firm earnings within the samecalendar quarter, we compute clustered standard errors (Froot (1989)). The robust t-statistics arein parentheses.
SUE SAFE
neg−30,−3 −0.0167 −0.0072(−1.19) (−1.65)
neg−30,−3∗ Fund−30,−3 −0.3192 −0.0824
(−8.00) (−5.48)Fund−30,−3 −0.4676 −0.1033
(−7.27) (−5.59)Lag(Dependent Var) 0.2080 0.2517
(12.22) (8.69)Forecast Dispersion −0.9280 −0.3049
(−10.32) (−6.35)Forecast Revisions 19.1856 0.7068
(9.06) (1.11)Log(Market Equity) −0.0062 0.0285
(−0.36) (5.31)Log(Book/Market) 0.0126 −0.0127
(0.48) (−1.60)Log(Share Turnover) −0.1086 0.0299
(−2.89) (3.08)FFAlpha−252,−31 1.9760 0.2317
(9.59) (4.30)FFCAR−30,−3 0.0102 0.0067
(5.74) (11.20)FFCAR−2,−2 0.0110 0.0036
(1.81) (1.87)
Observations 17769 16658Clusters 80 79Adjusted R2 0.1282 0.1285
much better predictors of firms’ earnings. Because the Fund−30,−3 variable isa fraction that ranges from zero to one, the regression coefficients have mean-ingful economic interpretations. The sum of the coefficient on the interaction(neg−30,−3
∗ Fund−30,−3) and the coefficient on negative words alone (neg−30,−3)
1462 The Journal of Finance
estimates the dependence of firm earnings on negative words for announce-ments in which all (Fund−30,−3 = 1) of the news stories between day −30 andday −3 contain the stem “earn.” The coefficient on negative words (neg−30,−3)now estimates the dependence of firm earnings on negative words when none(Fund−30,−3 = 0) of the news stories between day −30 and day −3 containthe stem “earn.” Also, one can recover the direct effect of negative words ina typical set of news stories, where 26.3% of the words are about earnings(Fund−30,−3 = 0.263), by computing (coefficient on neg−30,−3) + 0.263 × (coeffi-cient on neg−30,−3
∗ Fund−30,−3). This last quantity is directly comparable to thesimple coefficients on neg−30,−3 that appear in Table I.
The point estimate of the sum of the interaction term and the neg−30,−3 co-efficient (−0.3359 SUE) is over 10 times greater than the neg−30,−3 coefficient(−0.0167 SUE), suggesting that negative words derive almost all of their pre-dictive power for SUE from earnings-related stories. Negative words in storiesunrelated to earnings (see coefficients on neg−30,−3) only weakly predict lowerearnings, and are much less important in economic terms. Yet the direct effectof negative words on earnings in a “typical” set of stories with 26.3% earnings-related words remains strongly statistically and economically significant at−0.0167 + 0.263 × (−0.3192) = −0.1006 SUE. Similarly, negative words inearnings-related stories can predict analyst forecast errors (SAFE) better byan order of magnitude.
We now test the other two predictions of our hypothesis: Contemporaneousmarket reactions and subsequent market underreactions should be larger forstories that mention the word stem “earn” than for other stories. As before,we use pooled OLS regressions with clustered standard errors to estimate therelationship between negative words and returns. We also use the same set offirm characteristic and stock return control variables. To conserve space, wereport only the results where we use firms’ abnormal returns as the depen-dent variable and negative words in firm-specific stories from DJNS as thekey independent variable. Again, we use the DJNS stories that occur morethan 30 minutes before the market closes to explore the underreaction hypoth-esis because Table II reveals that there is only minimal underreaction to WSJstories.
Column 1 in Table VI reports the contemporaneous (same-day) relationshipbetween abnormal returns (FFCAR+0,+0) and negative words (neg). There aretwo new independent variables in these regressions: the dummy variable that isequal to one if a story mentions the word stem “earn” (Fund) and the interaction(neg ∗ Fund) between this dummy variable and standardized negative words(neg).
Column 1 in Table VI reveals that not only is there a strong relationshipbetween negative words (neg) and contemporaneous returns (FFCAR+0,+0), butalso that this relationship is much stronger in stories that contain the “earn”word stem dummy. The sum of the coefficient on neg by itself (−8.57 bps) andthe coefficient on the neg ∗ Fund term (−31.27 bps) provides an estimate ofthe contemporaneous market response to negative words in news stories thatmention earnings (−39.84 bps). In economic terms, the coefficient magnitudes

More Than Words: Quantifying Language 1463
Table VIFirms’ Returns and Negative Words about Fundamentals
This table shows the relationship between negative words in firm-specific news stories (neg) andfirms’ close-to-close abnormal stock returns on the same day (FFCAR+0,+0) and the followingday (FFCAR+1,+1). The stories include all Dow Jones News Service articles from 1980 through2004, but exclude stories that occur after 3:30 pm (30 minutes prior to market closing). The coeffi-cients and summary statistics from two OLS regressions using two different dependent variables(FFCAR+0,+0 and FFCAR+1,+1) appear below. The key independent variable is negative words(neg), which is the fraction of negative words in each news story standardized using the prior year’sdistribution. The independent variable Fund is a dummy indicating whether a story mentions theword stem “earn”; and neg ∗ Fund is the interaction between negative words (neg) and this dummy.All regressions include numerous control variables for lagged firm returns and other firm char-acteristics (see text for details). To allow for correlations among firms’ returns within the sametrading day, we compute clustered standard errors (Froot (1989)). The robust t-statistics are inparentheses.
FFCAR+0,+0 FFCAR+1,+1
neg −0.0857 −0.0161(−11.16) (−2.35)
neg ∗ Fund −0.3127 −0.1036(−10.75) (−4.52)
Fund −0.3250 −0.0342(−12.84) (−1.96)
FFCAR+0,+0 0.0255(4.91)
FFCAR−1,−1 0.0181 −0.0256(2.23) (−3.89)
FFCAR−2,−2 −0.0220 −0.0209(−2.72) (−3.13)
FFCAR−30,−3 0.0020 0.0004(1.17) (0.23)
FFAlpha−252,−31 −0.1425 0.1136(−1.36) (1.29)
Earnings (SUE) 0.0234 0.0146(4.16) (3.33)
Observations 141633 141541Clusters 6260 6260Adjusted R2 0.0045 0.0028
mean that the market response to negative words in earnings-related storiesis five times larger than the response to other negative words. This evidencesupports the hypothesis that negative words convey otherwise hard-to-quantifyinformation about firms’ fundamentals.21
In Column 2 of Table VI, we repeat the previous regression, except we usefirms’ next-day abnormal returns (FFCAR+1,+1) as the dependent variable. Themain result is that the same variables that elicit the greatest contemporaneousmarket responses also predict the greatest subsequent market underreaction.
21 The negative market responses to the presence of earnings-related words (Fund) could repre-sent earnings warnings from firm management prior to earnings announcements.

1464 The Journal of Finance
For example, the coefficient on the interaction term (neg ∗ Fund) is highly neg-ative (Column 2 in Table VI), showing that negative words in earnings-relatedstories predict greater market underreactions than negative words in other sto-ries (neg). In fact, the market’s underreaction to negative words in stories notmentioning earnings is only one-seventh as large as its underreaction to nega-tive words in stories about earnings (−1.61 bps vs. −11.97 bps = −1.61–10.36).The estimate of underreaction to negative words in “typical” stories that men-tion earnings with probability 28.0% lies between the two previous values at−4.33 bps = −1.61 bps + 0.280 × (−10.36) bps, and remains highly statisticallysignificant.
We can gauge the degree of underreaction by comparing the sizes of the 1-day and 2-day reactions to negative words. Table VI allows us to make thiscomparison for negative words in earnings-related stories and those in otherstories. The coefficients on neg in the first column (−8.57 bps) and second col-umn (−1.61 bps) measure the day 0 and day 1 reactions for negative wordsunrelated to earnings. The sums of the coefficients on neg and neg ∗ Fund in thefirst column (−39.84 bps) and second column (−11.97 bps) measure the day 0and day 1 reactions for earnings-related words. From this, we can infer that themarket’s initial 1-day reaction to negative words comprises the vast majorityof its 2-day reaction for stories unrelated (84.2%) and related (76.9%) to earn-ings. One interpretation is that investors remain almost equally attuned to theimportance of linguistic information about fundamentals even during earningsannouncements, when there is compelling quantitative information.
All three tests in this section suggest that negative words in stories aboutfirms’ fundamentals are driving the earnings and return predictability results.Although news stories that do not mention earnings can weakly forecast earn-ings and are associated with contemporaneous market returns, these storieshave very little ability to forecast future market returns. Negative words inearnings-related stories evoke much greater initial market responses presum-ably because these stories are better predictors of firms’ subsequent earnings.However, the initial market responses to negative words in earnings-related sto-ries are insufficiently large to prevent return continuations on the next tradingday. Investors seem to distinguish between earnings-related stories and oth-ers, but do not fully account for the importance of linguistic information aboutfundamentals.
VI. Conclusion
Our first main result is that negative words in the financial press forecast lowfirm earnings. That is, the words contained in news stories are not redundantinformation, but instead capture otherwise hard-to-quantify aspects of firms’fundamentals. Our second result is that stock market prices incorporate theinformation embedded in negative words with a slight delay. We demonstratepotential profits from using a simple trading strategy based on the words ina timely news source (DJNS), but find that these profits could easily vanishafter accounting for reasonable levels of transaction costs. Finally, we show that

More Than Words: Quantifying Language 1465
negative words in stories about fundamentals are particularly useful predictorsof both earnings and returns.
Our overall impression is that the stock market is relatively efficient withrespect to firms’ hard-to-quantify fundamentals. The market’s underreactionto negative words after day 0 is typically small as compared to the market’sinitial reaction to negative words on day 0. Even if economists have neglectedthe possibility of quantifying language to measure firms’ fundamentals, stockmarket investors have not.
Nevertheless, we do find that market prices consistently underreact to neg-ative words in firm-specific news stories, especially those that relate to funda-mentals. Although frictionless asset pricing models may not be able to explainthese findings, models in which equilibrium prices induce traders to acquirecostly information—for example, Grossman and Stiglitz (1980)—are broadlyconsistent with our results. Without some slight underreaction in market prices,traders would have no motivation to monitor and read the daily newswires.Future research on quantifying language has the potential to improve our un-derstanding of how information is incorporated in asset prices.
Appendix
To match firms’ names in CRSP with their common names used in the media,we employ a combination of four methods. Our first method works well for firmsthat are currently members of the S&P 500 index. We download common namesfor these firms from the “S&P constituents” spreadsheet posted on Standardand Poor’s Web site, http://www.standardpoor.com/. We match these commonnames to CRSP name strings, which we use in our Factiva news queries for the473 firms in the S&P at the end of our data period (December 31, 2004) thatremained in the index on the date that we downloaded the spreadsheet. Weidentify the common names of the other 27 S&P 500 firms at the end of 2004using the methods described below.
The other three methods entail matching the CRSP name strings with com-mon firm names from one of three Web-based data sources: Mergent Online, theSecurities and Exchange Commission (SEC), or Factiva. For all companies thatexist after 1993, we use the Mergent Online company search function to iden-tify firms’ common names (336 firms). For the few post-1993 companies withoutMergent data, we use the SEC company name search function (20 firms). Fi-nally, we identify the common names of firms prior to 1993 using the Factivacompany name search function (285 firms).
In many cases, we manually tweak the CRSP names to improve the qualityof the company search. For example, if we do a company search for the CRSPname string “PAN AMERN WORLD AWYS INC,” Factiva returns no results.Logically, we look for “Pan American,” which seems to retrieve the appropri-ate company name: “Pan American World Airways Inc.” Although this match-ing process introduces the possibility of minor judgment errors, our searchesuniquely identify matching firms in all cases, suggesting our methods are rea-sonable.

1466 The Journal of Finance
We construct search queries for news stories using the common names thatwe match to the CRSP name string. We spot-check all stories that mentionS&P 500 firms in the DJNS and WSJ to ensure that our search criteria do notexclude too many stories that are relevant for firm valuation. For all firms withfewer than 10 news stories retrieved by our automatically constructed searchqueries, we manually search for common names using the Internet and otherresources.
Ultimately, our search methods retrieve at least one news story for 1,063 of1,110 (95.8%) of the firms in the S&P 500 from 1980 to 2004. In addition, we loseanother 80 of the 1,063 firms with news stories (7.5%) because these firms didnot make the news during the time in which they were in the S&P 500 between1980 and 2004, which may be quite brief if a firm exits the S&P index shortlyafter 1980. Also, Factiva’s coverage of news stories from 1980 to 1984 appearssomewhat incomplete, possibly leading to missing news stories. Finally, afterdeleting all stories with fewer than three unique positive and negative words orfewer than five total positive and negative words, we lose another three firms,leaving us with 980 qualifying firms. The median firm has 156 news stories,and 929 of 980 firms have at least 10 news stories.
It is possible that we retrieve no news stories for the missing 47 of the initialset of 1,110 S&P 500 firms because of errors in our matching algorithm. Fortu-nately, although the exact magnitude of our results depends on the matchingmethodology employed, the sign and significance of all key coefficients does notchange for the firms that have been matched using each of the four differentprocesses. Thus, we infer that it is unlikely that matching errors introduce suf-ficient systematic errors in our tests that would significantly change the results.Moreover, our key results depend on cross-sectional and time-series variationin earnings and returns but not the levels of these variables, which could beaffected by survivorship bias.
REFERENCESAbarbanell, Jeffrey S., and Victor L. Bernard, 1992, Tests of analysts’ overreaction/underreaction to
earnings information as an explanation for anomalous stock price behavior, Journal of Finance47, 1181–1207.
Antweiler, Werner, and Murray Z. Frank, 2004, Is all that talk just noise? The information contentof Internet stock message boards, Journal of Finance 59, 1259–1294.
Antweiler, Werner, and Murray Z. Frank, 2006, Do U.S. stock markets typically overreact to cor-porate news stories? Working paper, University of British Columbia.
Ball, Ray, and Philip Brown, 1968, An empirical examination of accounting numbers, Journal ofAccounting Research 6, 159–178.
Baumeister, Roy F., Ellen Bratslavsky, Catrin Finkenauer, and Kathleen D. Vohs, 2001, Bad isstronger than good, Review of General Psychology 5, 323–370.
Bernard, Victor L., and Jacob K. Thomas, 1989, Post-earnings-announcement drift: Delayed priceresponse or risk premium, Journal of Accounting Research 27, 1–36.
Campbell, John Y., and Robert J. Shiller, 1987, Cointegration and tests of present value models,Journal of Political Economy 95, 1062–1088.
Carhart, Mark M., 1997, On the persistence of mutual fund performance, Journal of Finance 52,57–82.
Chan, Louis K. C., Narasimhan Jegadeesh, and Josef Lakonishok, 1996, Momentum strategies,Journal of Finance 51, 1681–1713.

More Than Words: Quantifying Language 1467
Chan, Wesley S., 2003, Stock price reaction to news and no-news: Drift and reversal after headlines,Journal of Financial Economics 70, 223–260.
Cutler, David M., James M. Poterba, and Lawrence H. Summers, 1989, What moves stock prices?Journal of Portfolio Management 15, 4–12.
Daniel, Kent D., Mark Grinblatt, Sheridan Titman, and Russ Wermers, 1997, Measuring mutualfund performance with characteristic-based benchmarks, Journal of Finance 52, 1035–1058.
Das, Sanjiv, and Mike Chen, 2006, Yahoo! for Amazon: Sentiment extraction from small talk onthe web, Working paper, Santa Clara University.
Davis, Angela K., Jeremy M. Piger, and Lisa M. Sedor, 2006, Beyond the numbers: An analysis ofoptimistic and pessimistic language in earnings press releases, Working paper, Federal ReserveBank of St. Louis.
De Bondt, Werner F. M., and Richard H. Thaler, 1990, Do security analysts overreact? AmericanEconomic Review 80, 52–57.
Easterwood, John C., and Stacey R. Nutt, 1999, Inefficiency in analysts’ earnings forecasts: Sys-tematic misreaction or systematic optimism? Journal of Finance 54, 1777–1797.
Fama, Eugene F., 1998, Market efficiency, long-term returns, and behavioral finance, Journal ofFinancial Economics 49, 283–306.
Fama, Eugene F., and Kenneth R. French, 1992, The cross-section of expected stock returns, Journalof Finance 47, 427–465.
Fama, Eugene F., and Kenneth R. French, 1993, Common risk factors in the returns of stocks andbonds, Journal of Financial Economics 33, 3–56.
Fama, Eugene F., and James MacBeth, 1973, Risk and return: Some empirical tests, Journal ofPolitical Economy 81, 607–636.
Froot, Kenneth A., 1989, Consistent covariance matrix estimation with cross-sectional dependenceand heteroskedasticity in financial data, Journal of Financial and Quantitative Analysis 24,333–355.
Grossman, Sanford J., and Joseph E. Stiglitz, 1980, On the impossibility of informationally efficientmarkets, American Economic Review 70, 393–408.
Jegadeesh, Narasimhan, and Sheridan Titman, 1993, Returns to buying winners and selling losers:Implications for stock market efficiency, Journal of Finance 48, 65–91.
Li, Feng, 2006, Do stock market investors understand the risk sentiment of corporate annualreports? Working paper, University of Michigan.
Newey, Whitney K., and Kenneth D. West, 1987, A simple positive semi-definite, heteroskedasticityand autocorrelation consistent covariance matrix estimator, Econometrica 55, 703–708.
Nickell, Stephen J., 1981, Biases in dynamic models with fixed effects, Econometrica 49, 1417–1426.Petersen, Mitchell A., 2007, Estimating standard errors in finance panel data sets: Comparing
approaches, Working paper, Northwestern University.Pritamani, Mahesh, and Vijay Singal, 2001, Return predictability following large price changes
and information releases, Journal of Banking and Finance 25, 631–656.Quine, Willard VanOrman, 1974, The Roots of Reference (Open Court Publishing Company, La
Salle, Illinois).Riffe, Daniel, Stephen Lacy, and Frederick G. Fico, 1998, Analyzing Media Messages: Using Quan-
titative Content Analysis in Research (Lawrence Erlbaum Associates, London).Roll, Richard W., 1988, R-squared, Journal of Finance 43, 541–566.Rozin, Paul, and Edward B. Royzman, 2001, Negativity bias, negativity dominance, and contagion,
Personality and Social Psychology Review 5, 296–320.Shiller, Robert J., 1981, Do stock prices move too much to be justified by subsequent changes in
dividends? American Economic Review 71, 421–436.Shleifer, Andrei, 1986, Do demand curves for stocks slope down? Journal of Finance 41, 579–590.Tetlock, Paul C., 2007, Giving content to investor sentiment: The role of media in the stock market,
Journal of Finance 62, 1139–1168.White, Halbert, 1980, A heteroskedasticity-consistent covariance matrix and a direct test for het-
eroskedasticity, Econometrica 48, 817–838.