Full responsibility for business decisions In charge of where teams money goes.
MORE THAN MONEY: HIGHER EDUCATION DECISIONS
OF LOW-INCOME AND MINORITY STUDENTS
by
TIFFANY GURLEY-ALLOWAY
Presented to the Faculty of the Graduate School of
The University of Texas at Arlington in Partial Fulfillment
of the Requirements
for the Degree of
DOCTOR OF PHILOSOPHY
THE UNIVERSITY OF TEXAS AT ARLINGTON
August 2009

Copyright © by Tiffany Gurley-Alloway 2009
All Rights Reserved

DEDICATION
I dedicate this research first to God, for calling and empowering me to change
lives through education. Husband, thank you for “showing me the deer,” and for your
undying love, encouragement, support, and sacrifices. You are truly selfless, and I
could not have earned this degree without you and our son championing me. My
dreams could have never taken flight without your prayers lifting them, or without your
commitment to our family. Even the defense was on our wedding anniversary. Thanks
for being my best friend: F&B ☺ Son, thank you for showing patience when I could
not take you to the park or McDonald’s. I am grateful to be a mommy again, and to
enjoy this wonderful life with you, my doctorate child. I hope our efforts will make
your life smoother than ours were. I hope you do earn your 136 Ph.D.s. My two boys
(husband and son), we earned this degree together. 3054 Family, you always believed
that I would reach my goals – great and small. Thanks for your help, love, strength,
prayers, foundation, wisdom, and wonderful memories. You breathed life into my
being. Sis, thanks for the babysitting while I finished my paper.

ACKNOWLEDGEMENTS
I must acknowledge my wonderful professors for making this research and
degree possible. Dr. Edith Barrett, my Chair, whom I met during my first semester in
SUPA, thank you for your constant fine-tuning and persistence. Your commitment to
excellence was felt through the multiple revision suggestions that strengthened the
quality of this current study. You are exact in all of your work, and I have become
stronger through working with you. Dr. Maria Martinez-Cosio, thank you for your
whispered encouragement along this journey. Thank you also for your editing advice,
and suggested additional readings. I continue to learn much from you, and appreciate
your passion for marginalized voices. Dr. Sherman Wyman, you gave me clarity. Your
voice was the loudest at the onset of “defining the problem.” Even at 3:00 AM, you
answered my accidental phone calls. Thank you for your coaching throughout this
dissertation process. I am grateful for all of my UTA SUPA professors for sharing their
expertise, and guiding me through completion of this terminal degree.
Participants, I appreciate your honesty and willingness to share your experiences
with the education community and me. I pray every day for your lives and goals. May
the heights you reach be immeasurable. I hope this research will be a solid step toward
reaching equity in education for students like you – like us! I thank the case study
organization for providing me access to resources, including your invaluable students.
June 29, 2009
iv
ABSTRACT
MORE THAN MONEY: HIGHER EDUCATION DECISIONS
OF LOW-INCOME AND MINORITY STUDENTS
Tiffany Gurley-Alloway, Ph.D.
The University of Texas at Arlington, 2009
Supervising Professor: Edith Barrett
A gap persists in K-12 academic achievement, high school persistence, college
attendance, and educational attainment by income level and race/ethnicity. Issues of
race and ethnicity in education are often intertwined with those of economic status
because African Americans and Latinos are more likely to live in poverty and have
lower median household incomes than are Whites in US. Much of the literature
regarding the achievement gap focuses on barriers faced by low-income and minority
students; two barriers in particular are low student motivation and inadequate academic
preparation. In addition to these individual level barriers, schools as institutions
perpetuate and reward the possession of cultural capital, which low-income minority
students often lack, thereby alienating low-income minority students from the learning
process.
v
To explore the college attendance decisions of low-income minority students, a
case study was conducted of a not-for-profit organization committed to improving
college readiness and increasing college access for underserved populations. The
current study focused on the college attendance decisions, including the decision of
whether to attend college, made by low-income African American and Latino students
when they had successfully completed high school, and were guaranteed scholarships to
pay for college tuition. The current study analyzed the factors that influenced their
higher education decisions, including the perceived barriers that limited their higher
education choices and college access.
The literature consistently asserts that a lack of money threatens the academic
pursuits of low-income minority students. Levine and Levine (1995), for example,
found that insufficient funding for tuition, a shift in federal aid from grants to loans,
rising tuition costs, and higher college entrance standards were barriers to educational
attainment for low-income minority students. However, the current study found that
decisions regarding college attendance were shaped as much by other variables (e.g.
student motivation; academic preparation; achievement ideology, levels of capital), in
addition to tuition expenses and funding sources.
The findings of this study suggest that although money is important, it is not
sufficient to remedy inequities in college access. It is not just a lack of money that
negatively affects college attendance for low-income minority students. Findings
indicate that social and cultural preparation for college were more important than
financial preparation in predicting college attendance for low-income minority students.
vi

vii
Respondents who felt academically, socially, and culturally prepared to attend and
graduate college were more likely to attend college, and to attend four-year colleges and
universities, compared to those who did not feel prepared. Because of the pervasive
poverty and denied access to quality academic and other resources, social and cultural
preparation were found to be more important than money in promoting college access
for low-income minority students. More than money is necessary to parity college
access for low-income minority students.

TABLE OF CONTENTS
ACKNOWLEDGEMENTS ................................................................................................ iv
ABSTRACT ........................................................................................................................ v LIST OF ILLUSTRATIONS .............................................................................................. xi LIST OF TABLES ............................................................................................................ xii Chapter Page
I. THE PROBLEM……………………………………..………..….. .................... 1
Statement of the Problem ............................................................................. 1
Background of the Problem ......................................................................... 1
Benefits of Obtaining a Higher Education ................................................... 7
Purpose of the Study .................................................................................. 11
II. THE REVIEW OF LITERATURE .................................................................. 12
Achievement Gap ...................................................................................... 12
Barriers to College Access ......................................................................... 17
Achievement Ideology ............................................................................... 34
The Role of Capital .................................................................................... 36
Social Integration and Cultural Relevance ................................................ 43
Summary .................................................................................................... 46
Research Questions .................................................................................... 47
viii

III. THE METHODS AND PROCEDURES ........................................................ 49
Research Design ...................................................................................... . 49
Overview of “The Program” .................................................................... . 50
Program Participant Population ................................................................. 60
Research Method ....................................................................................... 62
Independent Variables ............................................................................... 65
Dependent Variables .................................................................................. 75
Description of Sample ............................................................................... 75
Instrumentation .......................................................................................... 78
Summary .................................................................................................... 82
IV. THE FINDINGS ............................................................................................. 84
Dependent Variable-College Attendance .................................................. 84
Enrollment Status ....................................................................................... 85
Motivation and Educational Goals ............................................................ 86
Parent Marital Status and Highest Education Level .................................. 93
Respondents’ Perceived Academic, Cultural and Social Preparation to Attend College ....................................................... 97
Tuition Costs and Funding ....................................................................... 103
The Influence of College Characteristics, College Academics and Majors, College Recruitment, and Information Sources ...... 110
Perceived Barriers to College Access ...................................................... 121
Why Respondents Attended Four-Year or Two-Year Colleges .............. 127
ix
Satisfaction with Higher Education Decisions ........................................ 130 Respondents’ Recommendations for the Program and Public
Schools to Better Prepare Students for College ........................... 137
Summary .................................................................................................. 139
V. THE DISCUSSION ....................................................................................... 142
Key Findings ............................................................................................ 145
Implications for Policy ............................................................................ 158
Assumptions and Limitations .................................................................. 167
Recommendations for Future Studies ...................................................... 169
Appendix
A. SURVEY I – FOR RESPONDENTS WHO ARE CURRENTLY ATTENDING COLLEGE .............................................. 174
B. SURVEY II – FOR RESPONDENTS WHO ARE
NOT CURRENTLY ATTENDING COLLEGE ..................................... 186 C. E-MAIL INTRODUCTION OF THE SURVEY ........................................... 197
REFERENCES ................................................................................................................ 199 BIOGRAPHICAL INFORMATION ............................................................................... 209
x

LIST OF ILLUSTRATIONS
Figure Page 1 Mean SAT Scores by Race/Ethnicity: 1996-2007 .......................................................... 14
xi

LIST OF TABLES
Table Page 1 Graduation Rates by District Type .................................................................................. 4
2 College Attendance Rates ................................................................................................ 7
3 High School Demographics – Total High School Enrollment ...................................... 62
4 Characteristics of the Program Participants (HS graduates), College Attendees, and Respondent Sample ......................................................... 77
5 Currently Attending College – Item Description ........................................................... 79
6 Not Currently Attending College - Item Description .................................................... 80
7 Crosstabulation of College Type and Personal Motivation ........................................... 87
8 Crosstabulation of When Participant First Considered College and Type of College Attended ...................................................................................... 88
9 Why Participants Desired a College Education ............................................................. 89
10 Crosstabulation of Educational Goal and Type of College Attended ........................... 91
11 Highest Education Level of Parent with the Highest Education .................................. 96
12 SAT and ACT Scores of Respondents who Attended College, by Quintile ............................................................................................................. 98
13 Crosstabulation of Perceived Cultural Preparedness to Enter College
and College .......................................................................................................... 101
14 Likelihood of Attending College without College Planning Assistance From Program ...................................................................................................... 102
15 Perceived Preparation to Enter and Graduate College ............................................... 103
xii
16 Importance of Financial Factors to Higher Education Decision ................................ 106
17 Financial Factors that Influenced College Attendance Decision, In Order of Importance ........................................................................................ 107
18 How College Attendance Would Differ Financially Without Program Funding ................................................................................... 110
19 How College Attendance Would Differ Structurally
Without Program Funding ................................................................................... 110 20 Importance of College Characteristics, College Academics
and Majors, and College Recruitment ................................................................. 116 21 All Information Sources Used and the Most Important
Information Sources ............................................................................................. 118 22 Importance of the Advice Received ........................................................................... 121
23 Barriers that Influenced Higher Education Choices ................................................... 126
24 Why Respondents Attended Four-Year or Two-Year Colleges ................................. 130
25 Satisfaction with Higher Education Decisions Decision to Attend College ................................................................................................. 132
26 Reasons for Satisfaction and Dissatisfaction with
Higher Education Decisions ................................................................................ 134 27 Reasons for Wanting to Attend a Different College ................................................... 136
28 Student Recommendations to Improve the Program and Public Schools to Better Prepare Students for College ................................. 138
xiii

CHAPTER I
THE PROBLEM
Statement of the Problem
Low-income and minority students attend college at rates disproportionately
lower than do their wealthier and White counterparts, and lower than their
representation in the U.S. population would suggest. The reasons why this is the case
remain to be explored.
Background of the Problem
American colleges and universities were opened in the 1640s for the purpose of
educating upper class White men to serve in positions of power in the new world
(Thelin, 1996). In the late 1770s, women won the right to attend college, and in 1772,
Salem College was opened in North Carolina as the first American women’s college. It
would be nearly another century until Blacks in the US would even be recognized as
citizens, much less be allowed admission into such an exclusive institution as the
university. In 1837, Cheney University in Pennsylvania became the first Black college.
In the 1890s, shortly after the end of slavery, Black land-grant colleges (HBCUs) were
created through federal grants for educating the newly freed Blacks. These colleges and
universities served many Blacks and non-Blacks over the years, but little by little,
minority students were allowed access to predominantly white universities as well.
1

Indeed, by the mid 1990s, historically Black colleges and universities (HBCU) enrolled
only 16 percent of African American college students (NCES, 1996). The majority of
today’s African American students attend predominantly white institutions (PWIs).
In the mid-1960s, Title V of the Higher Education Act began providing federal
grants to support education at Hispanic Serving Institutions (HSIs), that is, institutions
with at least 25 percent Hispanic/Latino enrollment (HACU, n.d.). HSIs that are
provided Title V funds may use the funds to enhance the education offered, in ways
such as improving technology and infrastructure, increasing academic offerings,
strengthening academic rigor, managing outreach to K-12 schools to foster a college
going culture, and expanding internet connectivity for communication and distance
learning. Approximately 50 percent of today’s Latino undergraduate students attend
HSIs, although many do so without the deliberate intent to enroll at an HSI, and often
without the knowledge that their chosen institution is classified as such (HACU, n.d.).
Latino students, when considering location, cost, and accessibility, gravitate toward low
cost colleges that are close to home, producing a concentration of Latino students at
particular colleges (Excelencia in Education, 2007). Because HSIs are named as such
de facto, the student demographic profiles on many campuses have resulted in the
subsequent labeling of colleges as HSIs, by definition. Despite integration of PWIs, and
the development and support of HBCUs and HSIs, African Americans and Latinos are
still underrepresented (by population) in higher education.
Socioeconomic and racial/ethnic disparities persist in U.S. educational
attainment, even when students are academically prepared to enter college. Low-
2
income and minority students continue to be less likely than their more affluent and
White peers are to attend college. For example, low-income students with the highest
standardized test scores (top quartile) attend college at the same rate as high-income
students with the lowest scores (bottom quartile) (U.S. Department of Education, 2006).
Not only does educational attainment vary by economic status, it varies also by race.
Today, Whites are earning college degrees at nearly twice the rate of African
Americans, and three times the rate of Latinos, when controlling for income.
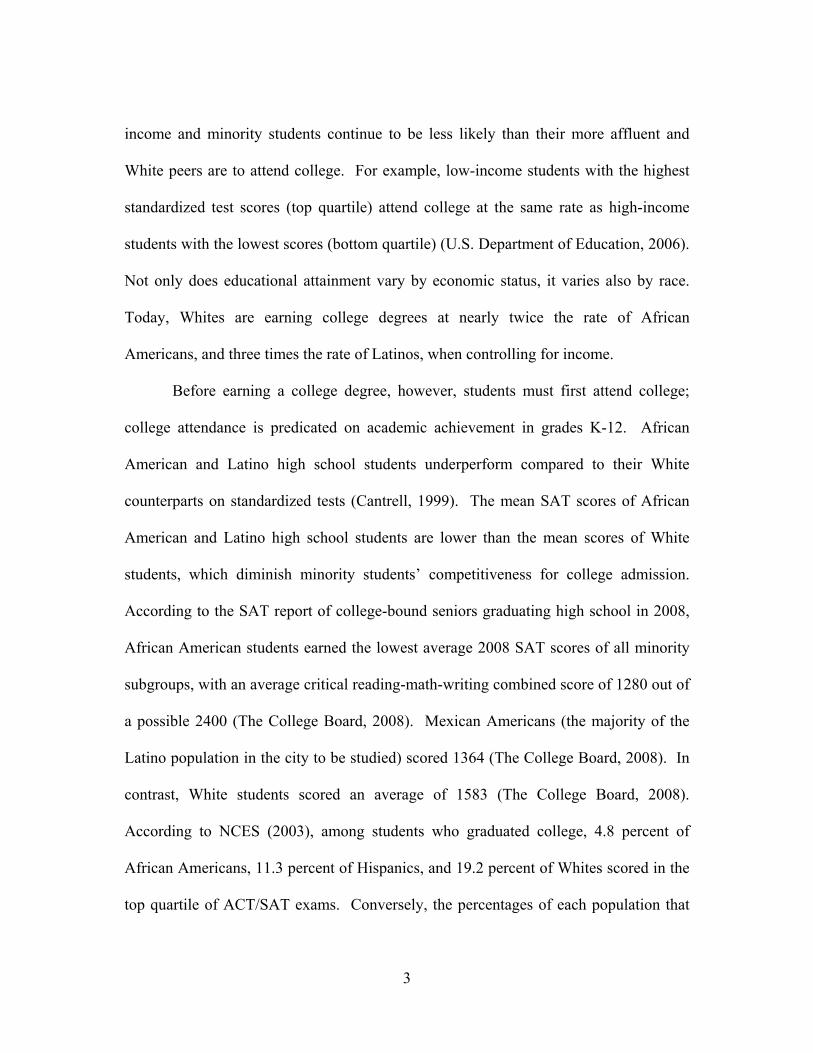
Before earning a college degree, however, students must first attend college;
college attendance is predicated on academic achievement in grades K-12. African
American and Latino high school students underperform compared to their White
counterparts on standardized tests (Cantrell, 1999). The mean SAT scores of African
American and Latino high school students are lower than the mean scores of White
students, which diminish minority students’ competitiveness for college admission.
According to the SAT report of college-bound seniors graduating high school in 2008,
African American students earned the lowest average 2008 SAT scores of all minority
subgroups, with an average critical reading-math-writing combined score of 1280 out of
a possible 2400 (The College Board, 2008). Mexican Americans (the majority of the
Latino population in the city to be studied) scored 1364 (The College Board, 2008). In
contrast, White students scored an average of 1583 (The College Board, 2008).
According to NCES (2003), among students who graduated college, 4.8 percent of
African Americans, 11.3 percent of Hispanics, and 19.2 percent of Whites scored in the
top quartile of ACT/SAT exams. Conversely, the percentages of each population that
3

scored in the bottom quartile were 44.2, 26.1, and 16.9, respectively. Among all U.S.
public high school students, 40 percent of White, 23 percent of African American, and
20 percent of Latino students graduate from high school and meet average general
admission requirements to a four-year college (Alliance for Excellent Education, 2008).
U. S. high school graduation rates are low, averaging 68 percent. Lower still are
the rates at which Latino and African American students are graduating from high
school. In 2001, 53 percent and 50 percent respectively, of Latino and African
American students who entered ninth grade graduated with a high school diploma
within four years (graduating on time) (Orfield, Losen, Wald, & Swanson, 2004).
White students graduated high school at a rate of 75 percent. According to Orfield et al.
(2004), districts with high poverty, located in central cities, that have high percentages
of students with disabilities, or with high percentages of English-language-learners are
more likely to have low graduation rates (p. 5). The school district represented in the
current study is a district with all of these characteristics, so we can expect ethnic and
socioeconomic disparities, with high school graduation rates that are lower than the
national averages reported in Table 1.
Table 1. Graduation Rates by District Type (Orfield et al., 2004, p. 5)
District type Cumulative promotion index
graduation rate Racial composition Majority White 74.1% Majority minority 56.4%
Limited English proficiency (LEP) participation Low (<9percent) 70.3% High (>9percent) 60.1%
4

Table 1 (continued)
Free/reduced lunch Low (<38percent) 76.0% High (>38percent) 57.6%
Special education Low (<13percent) 69.7% High (>13percent) 65.0%
Location Central city 57.5% Suburb 72.7% Town 69.1% Rural 71.9%
Educational goals have been found to vary by socioeconomic status. According
to the U.S. Department of Education (2005), which calculates SES based on a
combination of income, parent’s education, and parent’s occupation, 22 percent of low
SES students, compared to 31 percent of middle SES, and 53 percent of high SES
students expect to earn at least a bachelor’s degree. This most probably means that
although minority students have higher educational ideologies than do White students,
along the way they adjust their goals to meet reality (Mickelson, 1990). Therefore,
although minority students may have a high desire to achieve, they are not as likely to
turn those dreams into reality.
Some researchers suggest that minorities, particularly African American
students, have higher educational goals than do their White peers, when holding
household income constant (Mickelson, 1990; Portes & Wilson, 1976; Jencks 1972).
These goals reflect the ideologies or educational desires of students. However, although
their goals are higher, they reach their goals at a much lower rate than do their White
classmates, as the data presented in this chapter has shown. Some reasons for African
5
American and Latino students’ relatively low rates of educational attainment will be
presented in Chapter 2.
Regardless of their educational goals, African Americans and Latinos are less
likely than are Whites to attend college. To illustrate, 49 percent of African Americans
ages 25-29 attended at least some college; 19 percent of African American adults have a
bachelor’s degree or higher (U.S. Census Bureau, 2007). Thirty-four percent of Latinos
aged 25-29 have attended at least some college; 12 percent of Latino adults have a
bachelor’s degree or higher (U.S. Census Bureau, 2007). In comparison, 58 percent of
Whites ages 25-29 have attended some college; 30 percent of White adults have a
bachelor’s degree or higher (U.S. Census Bureau, 2007).
African Americans and Latinos are less likely than Whites are to hold a
baccalaureate degree. Although Latino and African American adults account for 13
percent and 12 percent, respectively, of the U.S. adult population, they represent only
5.6 percent and 7.5 percent, of all adults who have earned at least a baccalaureate
degree. In contrast, White adults account for 83.6 percent of bachelor’s degree holders.
If there were educational equality, educational attainment for these minority students
would reflect the larger population's demographics. College graduation rates for all
populations are low, especially for Latino and African American college students.
Within five years of entering college, 18 percent of Latino and 17 percent of African
American students earned a bachelor’s degree, compared to 27 percent of White
students (U.S. Department of Education, 2004).
6

Educational attainment is disparate by socioeconomic status also. Low-income
students, with annual household incomes under $36,000, are less likely than high-
income students (annual household incomes over $94,000) are to attend college and
earn a college degree. Within eight and a half years, only 36 percent of low-income
students compared to 81 percent of high-income students who graduate from high
school complete college (U.S. Department of Education, 2006). This disparity may be
partially attributable to lower-income students' lack of access to information about how
to enroll in college and the culture of college (U.S. Department of Education, 2006;
UNC, 2007; NCAN, 2009).
Table 2. College Attendance Rates. Source: National College Access Network (2009) Average standardized test
scores by quartiles
SES
Low High High 78% 97% Low 36% 77%
Benefits of Obtaining a Higher Education
Obtaining a higher education is becoming increasingly important for
participation in the labor force (Bureau of Labor Statistics, 2008). The percentage
distribution of jobs in America that are available with a high school diploma is
decreasing, as the percentage distribution of jobs that require at least some college is
increasing. By 2016, jobs that require at least some college are projected to account for
57percent of available jobs (BLS, 2008). These data indicate an increasing likelihood
that jobs in US will demand that employees have a higher education.
7

A strong correlation between education and earnings also confirms the
importance of a college degree. Adult workers (aged 18 and over) who completed only
high school earned approximately 13.5 percent lower wages than did workers whose
highest education was some college (U.S. Census Bureau, 2001). Likewise, adults who
reported only some college education earned approximately 38 percent less than did
those who earned a bachelor’s degree or higher. In 2001, the average annual salary of
bachelor’s degree holders was $46,000, compared to $27,000 for those who completed
only high school (U.S. Census Bureau, 2001).
Income disparities are exacerbated by race/ethnicity. According to the U.S.
Department of Education (2006), within the same education level (highest level
attained), income differs by race and ethnicity. In 2006, the median annual full-time
earnings for the total population of bachelor’s degree holders were $43,700. Median
earnings for White, Latino, and African American bachelor’s degree holders were
$44,700, $40,600, and $38,600 respectively (U.S. Dept. of Education, 2006). This fact
emphasizes how critical earning a higher education is for minority students, to
ameliorate inequalities.
Educational attainment correlates strongly and inversely with poverty. Among
bachelor’s degree holders, the poverty rate is 4 percent, compared to 12 percent for
those who completed only high school; the latter group is three times more likely to live
in poverty than are college graduates (U.S. Census Bureau, 2008). Therefore, earning a
college degree can increase earnings and decrease the likelihood of living in poverty.
8

Recent challenges to affirmative action have made it increasingly important for
universities to recruit qualified, diverse student applicants. Without doing so, Latino
and African American students may have reduced access to higher education. As 2008
SAT scores reflected, increased reliance on college entrance exams, without
consideration for diversity, might result in denial of access to higher education for
African American and Latino students (Cantrell, 1999; The College Board, 2008).
Campus diversity is another benefit of promoting college access for low-income
minority students. Diversity is not only necessary for educational and economic
empowerment, but also essential to strengthen society in general. Many educational
organizations, including National Association of Student Personnel Administrators,
American Association for Higher Education, College and University Personnel
Association, Golden Key International Honour Society, ACT, and The College Board,
endorse the American Council on Education’s (1999) message on diversity in higher
education. The following is an excerpt from that statement.
Diversity enriches the educational experience . . .
It promotes personal growth—and a healthy society.
Diversity challenges stereotyped preconceptions; it encourages critical
thinking; and it helps students learn to communicate effectively with
people of varied backgrounds.
It strengthens communities and the workplace.
Education within a diverse setting prepares students to become good
citizens in an increasingly complex, pluralistic society.
9

It enhances America's economic competitiveness.
Sustaining the nation's prosperity in the 21st century will require us to
make effective use of the talents and abilities of all our citizens, in work
settings that bring together individuals from diverse backgrounds and
cultures (American Council on Education, 1999).
Equity is perhaps the most important reason for promoting college access for
low-income students. College and university student enrollments should be more
reflective of the U.S. population (Magner, 1991). Without equity, persisting education
gaps could continue to exacerbate economic disparities among U.S. citizens, resulting in
citizens’ unequal abilities to participate in democracy. Education equity is vital not just
for today’s students, but also because the benefits of education extend to future
generations. If some U.S. populations are precluded from participating in higher
education, they could be relegated to substandard lives for themselves, their families,
and communities. Levin (1994) wrote,
In all human populations there will be some variance in
talents and attainments, even when all members are provided
with exceptional opportunities to develop their talents. What that
variance will be is certainly open to debate. More questionable,
though, are the differences in educational attainments among
populations born into different social, economic, and racial
circumstances due to inadequate opportunities for human
10

11
development. A reasonable criterion is that we have obtained
educational equity when representatives of different racial,
gender, and socioeconomic origins have about the same probabilities
of reaching different educational outcomes (Dowd, 2003, p. 93).
Purpose of the Study
The purpose of this study was to explore the college attendance decisions of
low-income minority students, including the decision to attend college. This study
explores the important factors in the college decision, and the barriers to college access
that low-income Latino and African American students face. Educators and counselors
could benefit from understanding why some students do not pursue college, and why
others choose to attend the colleges they do. Furthermore, studying students’ higher
education decisions may help educators diminish college access barriers over which
they can have some control. Increasing college attendance and graduation rates of low-
income, minority students will promote equity in education.
Chapter 2 will present a detailed discussion of the literature regarding the gap in
college attendance and educational attainment, barriers to college access, and factors
that promote college attendance. Chapter 3 will describe the research methods and
procedures utilized, and provide background information about the case study
institution and research participants. Chapter 4 will present a summary of the research
findings. Finally, Chapter 5 will discuss the findings, implications, and
recommendations for future research.

CHAPTER II
THE REVIEW OF LITERATURE
This chapter examines the literature regarding educational attainment for low-
income and minority students, the barriers that threaten that attainment, and the
resources necessary to mitigate those barriers. This research focuses on African
American and Latino students in the P-16 continuum, particularly emphasizing
students’ experiences in grades K-12. The chapter is divided into the following
sections: (a) background on the achievement gap, (b) barriers to minority educational
attainment, (c) achievement ideology, (d) the role of capital, (e) social integration and
cultural relevance, and (f) research questions.
Achievement Gap
There is a gap in academic achievement, persistence, college attendance, and
educational attainment by income level and race/ethnicity. African Americans and
Latinos are more likely to live in poverty than are Whites, and they have lower median
household incomes than do Whites. For example, the median household income for
African Americans is equal to 60 percent of that for Whites, and African Americans’
median wealth is equal to 10 percent of Whites’ median wealth. Even among
bachelor’s degree holders, the median annual earnings of African Americans and
Latinos are equal to only 86 percent and 91 percent, respectively, of Whites’ median
annual earnings (U.S. Department of Education, 2006). Therefore, disparities in income
12

account for some of the disparities in educational attainment (JBHE, 1999). However,
the achievement gap is not attributable to income only. Even within the same income
groups, racial/ethnic disparity exists between the educational attainment of Whites and
of Latinos and African Americans (JBHE, 1999).
Low-income and minority students drop out of high school at higher rates than
do middle-and high-income students and White students. Furthermore, low-income and
minority students enroll in college at lower rates than do their counterparts, and they are
less likely than are middle- and high-income, and White students to graduate from
college. The literature on the achievement gap is presented in order of the continuum
from academic achievement, to high school persistence, through college attendance, and
finally educational attainment.
Gaps in educational attainment are often predicated on racial/ethnic gaps in
academic achievement measured by the two most commonly administered college
entrance exams: SAT and ACT; these gaps continue to grow each year. Average
combined SAT scores were compared by race/ethnicity in Chapter 1 of this study. The
composite scores for the ACT were similar to the SAT. Composite ACT scores were
22.1, 18.7, and 16.9 out of a maximum 36 points, respectively for Whites, Latinos, and
African Americans (ACT, 2009).
Although the mean combined SAT scores (critical reading-math-writing) have
increased for Latinos, African Americans, and Whites over the last 11 years, the
increases for Latinos and African Americans were smaller than for Whites, according to
aggregated SAT data. (Figure 1 shows scores over time for three racial/ethnic groups).
13
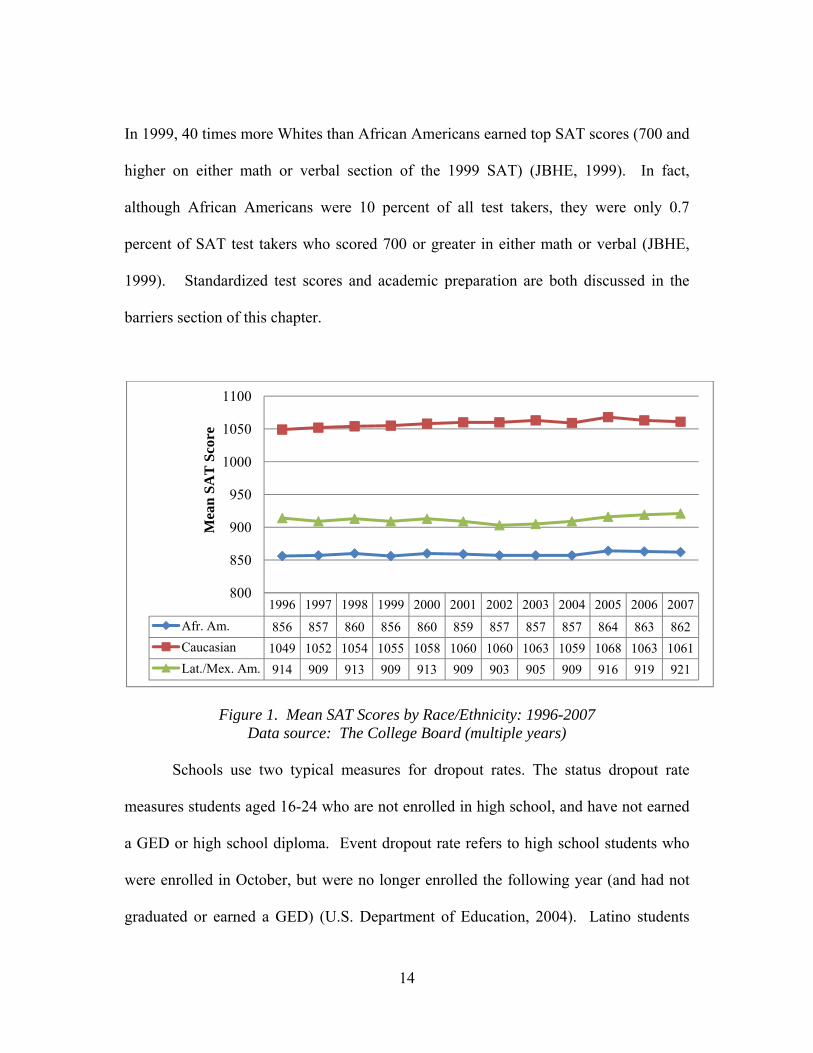
In 1999, 40 times more Whites than African Americans earned top SAT scores (700 and
higher on either math or verbal section of the 1999 SAT) (JBHE, 1999). In fact,
although African Americans were 10 percent of all test takers, they were only 0.7
percent of SAT test takers who scored 700 or greater in either math or verbal (JBHE,
1999). Standardized test scores and academic preparation are both discussed in the
barriers section of this chapter.
1996 1997 1998 1999 2000 2001 2002 2003 2004 2005 2006 2007Afr. Am. 856 857 860 856 860 859 857 857 857 864 863 862Caucasian 1049 1052 1054 1055 1058 1060 1060 1063 1059 1068 1063 1061Lat./Mex. Am. 914 909 913 909 913 909 903 905 909 916 919 921
800
850
900
950
1000
1050
1100
Mea
n SA
T S
core
Figure 1. Mean SAT Scores by Race/Ethnicity: 1996-2007 Data source: The College Board (multiple years)
Schools use two typical measures for dropout rates. The status dropout rate
measures students aged 16-24 who are not enrolled in high school, and have not earned
a GED or high school diploma. Event dropout rate refers to high school students who
were enrolled in October, but were no longer enrolled the following year (and had not
graduated or earned a GED) (U.S. Department of Education, 2004). Latino students
14
have the highest status dropout rates compared to African American and White students
(U.S. Department of Education, 2008). In 2006, the status dropout rate for Latino
students was 22%, compared to 11% for African Americans and 6% for Whites (U.S.
Department of Education, 2008). Latino immigrants account for much of the high
Latino status dropout rate. Latino immigrants represent 28% of the Latino status
dropout, yet they only account for 7% of the 16-24 year old Latino population.
The U.S. Department of Education calculates event dropout rates by household
income, divided into three income levels. Low-income is the bottom 20 percent of
income distribution; middle-income is the middle 60 percent, and high-income is the
top 20 percent. Low-income students were much more likely to drop out of high school
(10.4%) than were middle-income (4.6%) and high-income (2.5%) students (U.S.
Department of Education, 2004). Event dropout rates were four times higher for low-
income students than for high-income students. A comparison of event dropout rates by
race in the same year found that Latinos had the highest event dropout rate (8.9%),
compared to African Americans (5.7%) and Whites (3.7%) (U. S. Department of
Education, 2004).
Among students who graduate from high school, there remain significant ethnic
and economic gaps in college attendance. The highest achieving (top quartile on
standardized tests) low-income students are attending college at the same rate as the
lowest achieving (bottom quartile on standardized tests) high-income students (NCAN,
2009; U.S. Department of Education, 2006). In addition, within eight and a half years,
only 36 percent of low-income students compared to 81 percent of high-income
15
students who graduate high school complete college (U.S. Department of Education,
2006). Racial/ethnic disparities also persist in the rate of students (aged 16-24) who
attend college immediately after graduating from high school. Entering college directly
from high school is important because students who begin college at age 17 or 18 are
more likely to graduate from college within five years compared to students who enter
later (National Science Foundation, 2002). In 2006, 58 percent of Latinos and 55
percent of African Americans compared to 69 percent of Whites enrolled in college
during the fall semester after spring graduation (U.S. Department of Education, 2001).
This direct-from-high school college attendance rate is significantly related to
parents’ highest education levels (U.S. Department of Education, 2001). In 1999, the
direct-from-high school college attendance rate was 36 percent for students of parents
without a high school diploma, and 54 percent for students of parents with only a high
school diploma, compared to 82 percent for students of parents with a bachelor’s degree
or higher (U.S. Department of Education, 2001). The higher education data are
especially alarming for Latino and African American students. Among all high school
graduates, 27 percent of parents do not have any post-secondary education; this
subpopulation is most likely to have the lowest income level, and is more likely to be
African American or Latino than any other race or ethnicity (U.S. Department of
Education, 2001).
Even when Latinos and African Americans do attend college, they are less likely
to graduate than are Whites. In 1996, 17 percent of African Americans and 18 percent
of Latinos completed a bachelor’s degree within five years of enrolling in college. In
16

the same year, 27 percent of Whites had completed a bachelor’s degree within five
years (U.S. Department of Education, 2004).
We know that for students to earn a college degree, they must first be admitted
to college. Before that, academic preparation in grades K-12 is critical, as are a desire to
attain a college education and a belief in one’s ability to do so. The next section
reviews the literature regarding barriers that limit educational attainment for low-
income minorities, followed by a review of factors that promote college attendance, and
a presentation of the research questions that guide this study. While low-income
minority students lag behind their peers in both college attendance and college
graduation rates, college access is the primary focus of this research.
Barriers to College Access
Many barriers limit the educational pursuits and subsequent attainment of low-
income and minority students. It is difficult to distinguish fully the barriers attributable
to income levels from those attributable to race and ethnicity. Although low-income
students have limited financial resources, disparities in educational attainment do not
result solely from a lack of money. We must therefore understand the financial barrier
and its role in conjunction with other barriers that must be overcome to improve
educational attainment for low-income and minority students. Understanding the
barriers that influence low-income minority students’ higher education decisions will
allow educators to alleviate the barriers over which they can have some control. This
section presents researcher-identified barriers to educational attainment, categorized by
17

the primary level at which each barrier hinders educational attainment. The three
categories are individual/family, institution, and society.
Individual Level Barriers
Scholars have identified low student motivation and inadequate academic
preparation as two barriers that limit educational attainment for minority and low-
income students. The two are not unrelated; low motivation can result in inadequate
preparation. Diminished motivation to try hard in school results when students do not
feel intimately connected to the school environment through classroom and co-
curricular activities (Cammorata, 2007; Dumais, 2002; Feagin, Vera, & Imani, 1996).
Feeling connected to school and being motivated to achieve therein are directly related.
First, this section presents literature regarding diminished motivation of low-income
minority students. Then, literature related to inadequate academic preparation of low-
income minority students is presented.
Student motivation. There are individual and institutional reasons why students
do not connect with school. This section focuses on the individual reasons why some
low-income minority students lack the motivation to succeed academically.
Institutional barriers are discussed later in this chapter.
Researchers agree that low motivation is a barrier to educational attainment for
low-income minority students, but they have found different reasons why that is the
case. First, Cammorata (2007) conducted a case study of Latino students who were at
risk of failing or dropping out of an Arizona public high school. Because the students
were unmotivated and failing, they were sorted into remediation classes designed for
18
low performing students, which offered little academic challenge. Cammorata (2007)
found that students who had lost their motivation to try hard in school were later
reengaged through a more challenging and relevant curriculum. Once they became
reengaged in the learning process, they were motivated and became academically
successful. The students graduated high school and a majority of them attended
college.
Low-income minority students who have negative feelings and perceptions
about school in grades K-12 generally do not pursue a college education. Even students
who pursue college can feel estranged from the college experience (Feagin et al., 1996).
Feagin (1996) conducted a case study of African American college goers at
predominantly white institutions (PWIs) and found that African American college goers
reported feeling frustrated by the college experience at PWIs, where they felt pushed
out due to racism and hostile campus climates. When college goers in the study
experienced negative campus climates, they spread that message to their peers and
family members at home.
In a similar case study, and Radhakrishnan (2003) conducted survey research
with over 1400 African American, Asian, Latino, and White college students, and found
that minority college goers had more negative feelings about college campus climate
than did Whites. However, they found that these feelings were not based primarily on
the perceived racial climate or the actual race of the student, but were based primarily
on the perceived academic climate (Reid & Radhakrishnan, 2003). Reid and
Radhakrishnan (2003) studied correlations between perceived general campus climate
19
(dependent variable) and racial climate, academics, and student race (independent
variables). They found that African American and Latino students’ perceptions about
the academic climate were more important to their feelings of general campus climate
than were their perceptions of the racial climate. The actual race of the student was the
least important independent variable. African American and Latino students reportedly
had negative perceptions about the academic climate because they felt that their peers
and instructors had low perceptions of their academic ability. Therefore, Reid and
Radhakrishnan (2003), while finding that African American and Latinos had negative
perceptions of general campus climate, attributed the negative perceptions to the
academic culture, and not simply to the fact that they were African American and
Latino students.
Another related issue that can affect motivation is what Steele (1997) labeled
“stereotype threat.” Steele (1997) described stereotype threat as the circumstance that
affects a student when, in a given situation, a negative stereotype has been formed about
the student, and the student fears his or her performance in that situation will prove the
negative stereotype. Students who are exposed continually to stereotypes (e.g., African
Americans are academically inferior to Whites) can become anxious and can begin to
see themselves as academically weak and not of college-bound caliber. The anxiety
then limits the students’ performance. Because motivation and achievement drive each
other, motivation then diminishes and performance suffers further. Unfortunately, the
resulting poor academic performance is consistent with the negative stereotypes.
Stereotype threat is a barrier to educational attainment for low-income minorities
20

because it diminishes motivation and subsequent academic preparation for college
(discussed in the next section) (Steele, 1997).
As we can see from the literature, students need affirming relationship with
schools to maintain the motivation to succeed in school (Reid and Radhakrishnan, 2007;
Feagin et al., 1996; Steele, 1997). Through his studies of high school students, Steele
(1997) found that students would succeed in a domain, such as a school, to the degree
that they identify with the domain. However, Steele (1997) found that too often
minority students do not identify with school and therefore lose the motivation to
succeed. Because of weak domain identity, educational attainment for minority
students can lag behind that of Whites. There are a number of reasons why students do
not connect to school, including, as will be discussed later in this chapter, because as
institutions, schools perpetuate cultural capital by rewarding its possession. Low-
income minority students, however, often lack cultural capital (Dumais, 2002). This
and other institutional level barriers to college access are presented later in this chapter.
A connection between student and school (or lack thereof) is not the only factor
related to student motivation; one’s outlook on life is another factor. Motivation is also
promoted through understanding of what it takes to succeed, and being able and willing
to do what is necessary for success. According to McDonald and McMillen (2007),
those who value the benefits of education over the sacrifices needed to obtain it will
make investments in human capital, including obtaining a higher education. African
American and other minority children, however, have shorter life expectancies than do
White children (McDonald and McMillen, 2007). African American and Latino
21

students have seen in their environments examples of peers who have died early, and
therefore, they do not always see positive futures for themselves. Without the ability to
envision a positive future, therefore, these students often do not see the need to invest in
human capital; neither do they see examples of others around them making such
investments (McDonald and McMillen, 2007). Medical and socioeconomic issues
contribute to this low life expectancy. Increased heart attacks and infant mortality are
two medical issues that shorten the life expectancy of low-income minorities (Levine et
al., 2001).
Some of the socioeconomic issues that challenge students are embedded within
neighborhood issues. African American and Latino children are more likely to live in
homogeneously poor neighborhoods than are White children (Acevedo-Garcia, Osypuk,
McArdle, & Williams, 2008). African American and Latino children are more likely to
live in low-income families as well. In fact, 17 percent of African American children
compared to 20 percent of Latino children and 1 percent of White children live in both
low-income families and predominantly poor neighborhoods. This scenario is called
double jeopardy (Acevedo-Garcia et al., 2008). As a result, African Americans and
Latinos are also more likely to be subjected to societal ills like drugs, crime, and
homicide (McDonald and McMillen, 2007; Levine et al., 2001). These children,
subsequently, may think that the opportunity costs of pursuing higher education are too
great when they cannot envision a long future for themselves. With prolonged exposure
to negative elements within their neighborhoods, low-income minority children can
begin to develop a perspective of immediacy, devaluing short-term sacrifices for long-
22

term gain (McDonald and McMillen, 2007). This mentality can manifest as low
motivation toward education, the result of which is minority students’
disproportionately low participation in higher education.
Academic preparation. As stated previously, students’ lack of motivation in
school can diminish preparation for college. Not taking the prerequisite college
preparatory courses (whether by choice or unavailability of such classes) can also
diminish student preparation for college. So too, systematic denial of access to quality
schools can result in inadequate preparation, as will be discussed in the next section
(Steele, 1997).
Academic preparation for college is predicated on the college readiness courses
taken in high school. College readiness, based on students taking appropriate courses to
prepare for college-level work, is low nationally. Only 30 percent of U.S. public high
school ninth graders graduate from high school and are college ready by twelfth grade
(Alliance for Excellent Education, 2008). While this rate is low, it is even lower for
minority students. Only 20 percent of Latinos and 23 percent of African Americans,
compared to 40 percent of Whites, are college ready upon high school graduation
(Alliance for Excellent Education, 2008).
Students who have taken advanced and honors courses in the core subjects of
math, literature and composition, science, and social studies are more likely to be
prepared for college, and to score higher on college entrance exams than are students
who have not taken those courses (JBHE, 1999). Comparing SAT takers by
race/ethnicity reveals differences in the number of higher-level high school courses
23

taken. This variance in courses taken results in disproportionate rates of college
readiness by race, as measured by the SAT (JBHE, 1999). For example in math, 25
percent of Whites and 13 percent of African Americans took calculus; 52 percent of
Whites and 40 percent of African Americans took trigonometry; 31 percent of Whites
and 18 percent of African Americans took honors math. Forty percent of Whites
compared to 28 percent of African Americans took honors English. The White and
African American rates of taking honors science were 31 and 19 percent, respectively;
honors social studies rates were 31 compared to 20 percent. As these patterns reflect,
minority students take advanced and honors level courses at lower rates than do their
White students. A positive relationship exists between content mastery in core courses
considered college preparatory (e.g. trigonometry, calculus, grammar, American
literature, and honors level courses), and the likelihood of attending college (NCAN,
2009). Therefore, academic preparation for college is disparate by race/ethnicity
(JBHE, 1999).
Academic achievement is shaped not only by student motivation, but also by
social class structure (Steele, 1997; Yan, 1999). As discussed previously, Latinos and
African Americans are more likely than Whites are to be members of the lower social
class in US. Even if low-income minority students had taken the same courses in high
school, they would be less likely to take test prep courses that could make their scores
more competitive (JBHE, 1999). SAT and ACT test prep workshops are offered by
companies such as Princeton Review and Kaplan, and are designed to help students
learn how to take the tests, so they can improve their test scores. Minority students,
24

however, with incomes equal to only a fraction of Whites’ incomes, are least able to
afford preparation workshops for college entrance exams, averaging $700 per workshop
(JBHE, 1999). Without equal access to these workshops, low-income minority students
are disadvantaged, and they underperform on the tests compared to their White
counterparts (Cantrell, 1999; Steele, 1999). African Americans and Latinos earn the
lowest SAT and ACT scores among students of all races/ethnicities (College Board,
2008; ACT, 2008; Cantrell, 1999; Steele, 1999). Increased reliance on these scores for
college admission can therefore result in unequal access to higher education (Cantrell,
1999; Steele, 1997; Levine and Levine, 1995). Along with lower test scores, poor
academic preparation also results in increased dropout rates from high school, and
limits the higher education choices and college attendance for low-income and minority
students (Fuller, 2002; Opp, 2001; Steele, 1997; Feagin et al., 1996; Levine and
Levine, 1995). In addition to the individual level barriers discussed previously, schools
also play a role in the inadequate preparation of low-income minority students.
Institutional Level Barriers
Schools can create barriers to college access for low-income minority students.
Economic status affects K-12 school choice, based on neighborhood location and school
cost (Fuller, 2002). For low-income minority students, economic status results in
limited access to quality schools (Fuller, 2002). Minority students are
disproportionately likely to attend public schools with (a) concentrated poverty (50
percent or more students receiving free or reduced lunch), (b) high concentrations of
25
minority students, and (c) low graduation rates (Alliance for Excellent Education, 2008;
Kahlenberg, 2006; Picus, 2000; Grissmer et al., 1997; Lang, 1992).
Furthermore, low SES school districts typically have (a) lower quality schools
with lower test scores (which can be biased measures), (b) lower attendance, (c) inferior
amenities (library, recreation facilities, technology), and (d) more transient students
than do wealthy school districts (Picus, 2000). For example, 47 percent of central city
residences are renter-occupied compared to 37 percent of suburban residences
(McDonald and McMillen, 2007). Higher rental and student mobility rates can lead to
cyclical knowledge mismatch, resulting in spatial skills mismatch between the residents
in the city (Bartik, 2000). Spatial mismatch is a societal level barrier to college access
for low-income minority students, and is discussed later in this chapter. This section
focuses on public K-12 schools and two barriers they create that hinder college access
for low-income minority students, namely (a) inadequate preparation, and (b) persistent
gaps in social and cultural capital.
Inadequate preparation. The previous discussion presented literature regarding
inadequate preparation as an individual level barrier. This section presents literature
regarding how schools, institutionally, inadequately prepare low-income minority
students for college. Education researchers, through case studies and ethnographies,
have found that low SES school districts do not hire and retain the most qualified
teachers, those who test highest on content certification exams (Kahlenberg, 2006;
Kozol, 2001). Additionally, teachers in low SES school districts are often less
dedicated to their content areas of expertise (teaching one content area only) compared
26
to teachers in middle class school districts. Moreover, many good teachers are attracted
away from low SES school districts to teach in middle class school districts, where they
have better amenities, and students with better preparation and fewer disciplinary
problems (Kahlenberg, 1996; Kozol, 2001). Carl Boyd wrote, “No one rises to low
expectations.” Teachers and administrators in low SES school districts are more likely
to have lower expectations of the students they teach compared to teachers and
administrators in middle class districts. The former may not expect students to succeed,
and therefore may not encourage academic excellence (Kahlenberg, 2006; Fuller, 2002;
Meier, Wrinkle, & Polinard, 1999). Consequently, they may not be dedicated to
preparing students for college.
The U.S. Department of Health, Education, and Welfare commissioned a
comprehensive, federal longitudinal study of race, income, and school opportunity. The
findings of the study were presented in a report entitled, Equality of Educational
Opportunity (Coleman et al., 1966). The study found that low SES school districts
generally have low academic achievement, as measured by standardized tests (Coleman
et al., 1966; Kahlenberg, 2006). In addition to low standardized test scores, students in
low SES school districts have generally low high school graduation rates (Lang, 1992;
Grissmer et al., 1997; Alliance for Quality Education, 2008; Kahlenberg, 2006).
Moreover, within these schools, the grades assigned by teachers are weak indicators of
academic achievement compared to middle class schools (Kahlenberg, 2006). For
example, an average grade of A within a low SES school was found to be equivalent to
27

an average grade of C in the same subject within a middle class school district, when
correlating grades with standardized test scores (Kahlenberg, 2006).
At the primary levels, inner-city schools lack sufficient academic resources to
prepare minority students to excel in secondary school (Lang, 1992; Fuller, 2002).
After struggling many years, those students, unfortunately, are likely to dropout
(McDonald & McMillen, 2007). School districts with low property wealth have smaller
tax bases than do districts with greater property wealth (Mikesell, 2003). As a result,
residents in low-income districts are often assessed a higher tax rate for public
education than are residents in property rich districts. Unfortunately, although the tax
rates are higher, the schools provide fewer amenities than do more affluent school
districts (Mikesell, 2003). Because of the low tax base, low SES school districts often
offer substandard “exposure to learning and enrichment experiences . . . outside of
school” compared to their private school counterparts (Lang, 1992, p. 516). As a result,
these schools lack sufficient amenities to provide rich academic and co-curricular
educational opportunities (Picus, 2000). Unfortunately, these are the experiences
assessed by college admissions tests such as SAT and ACT (Lang, 1992).
Denied access to quality schools and education in grades K-12 negatively
influences test scores of minority and low SES students; subsequently, their scores are
not always true indicators of their abilities (Steele, 1997). Because they are
insufficiently prepared for these exams, many low-income and minority students
underperform on standardized tests and are ultimately ill prepared for higher education
(Cantrell, 1999; Steele, 1997). Disproportionately attending low SES school districts
28
with low achievement renders low-income minority students inadequately prepared for
college, which is a barrier to college access for low-income minority students (Fuller,
2002; Kahlenberg, 2006; Mikesell, 2003).
Persistent gaps in social and cultural capital. Institutionally, schools perpetuate
gaps in cultural capital by rewarding the possession of dominant cultural capital
(Kahlenberg, 2006; Dumais, 2002). However, low-income minority students usually
have low levels of such capital due to their low socioeconomic status. As a result, low-
income minority students are distanced from the capital system that is rewarded by
schools, and subsequently do not build an affinity with school. The lack of affinity with
schooling subsequently distances low-income minority students from the learning
processes that should take place (Dumais, 2002).
Low SES school districts concentrate poverty in schools. In doing so, they
distance low-income students from the values of middle class students. Case studies of
income integration in education institutions found that middle class schools exhibited
the following advantages over low-income schools: (a) better conduct, (b) more
parental involvement (e.g., social capital), (c) less mobility, and (d) stronger goal setting
and planning to achieve those goals (Kahlenberg, 2006). By isolating low-income
students in low SES schools without exposure to middle class values, schools create
barriers to college access for low-income minority students. This isolation relates to
both social and cultural capital. Literature regarding the role of capital in educational
attainment is presented later in this chapter.
29

Segregated schools. The preceding sections described the negative effects of
segregation in schools. Issues of racial segregation are intertwined with issues of
economic segregation in schools. Brown v. Board of Education was the landmark court
decision that outlawed segregation in public schools, ruling that separate facilities for
Blacks and Whites was unconstitutional. Fifty-five years since that ruling, public
schools remain separate and unequal today. Over 70 percent of Latino and African
American students still attend class in schools with mostly minority student bodies
(Alliance for Excellent Education, 2008). Even middle class African American students
are likely to attend segregated schools and live in segregated neighborhoods (JBHE,
1999). Because of this segregation, “they are not taught the pathways and modes of
thinking that are embedded in White culture and are reflected in standardized tests”
(JBHE, 1999, p. 97). Segregation in elementary and secondary schools results in
disparate educational experiences by race (Lang, 1992).
In addition to segregation by race, over 60 percent of minority students are
segregated by income, attending schools with concentrated poverty (Alliance for
Excellent Education, 2008; Grissmer et al., 1997). A concentration of academic failure
is pervasive in these schools. Less than 60 percent of minority students will graduate
high school on time (Alliance for Excellent Education, 2008). Furthermore, minority
students are five times less likely than are White students to graduate high school
(Alliance for Excellent Education, 2008).
30
Societal Level Barriers
Racially and economically segregated environments are institutional level
barriers to college access for low-income minority students. This segregation isolates
low-income minority students from the capital that aids educational attainment, and
inadequately prepares them for college. At a societal level, economic segregation
begets racial segregation within cities, removing poor urban minorities from the means
of production and the capital to support educational attainment. Economic shifts,
investment in suburban amenities, and capital deficits have weakened the education of
poor urban minorities. This section reviews the literature related to the broader, societal
causes and ramifications of such segregation on college attendance for low-income
minority students.
Economic shifts. Minority and low-income students concentrated in central
cities suffer from poor educational opportunities (McDonald & McMillen, 2007).
William Julius Wilson (1996), a leading sociologist on race relations and urban poverty,
has spent decades studying urban economics and demographics. From his studies, he
found that a concentration of poor urban minorities is not just a function of where they
live; it is also due to significant shifts in employment and economic sectors (Wilson,
1996). These shifts represented (a) scientific shifts toward technology, (b) sociological
shifts in required skill sets, (c) industry shifts from labor-intensive to service related
jobs, and (d) physical shifts away from the city core to suburban areas. Unemployment
of urban Blacks, in particular, resulted from these economic shifts and the declining
U.S. economy during the 1970s and 1980s, with labor productivity growing just 0.8
31

percent per year (Wilson, 1990, p. 44). By analyzing 1960s and 1970s census data,
Wilson (1979) found that labor jobs moved to the suburbs as the economy shifted to
service and technical jobs (McDonald & McMillen, 2007, p. 415). As a result, the
availability of labor employment was declining for poor urban minorities.
Spatial mismatch ensued as the distance between the supply and demand of low
skill jobs increased, exacerbating racial and economic segregation (Bartik, 2000). As
people migrated to the suburbs, they demanded new schools to support their children.
When these newly suburban families required new amenities, such as public schools,
money was divested from central city upkeep, and was shifted to suburban new
development (Massey & Denton, 1993). The government support of new school
development took money away from existing inner-city schools (Gillham, 2002).
Ihlanfeldt (1997) conducted empirical studies of Atlanta’s economy and demographics
from 1980-1990, and found similar shifts in the economy. Jobs in the northern suburbs
increased significantly during the same period when the population of Blacks in the
southern suburbs rose at a rapid pace. The evidence reflected a changing economic
industry with which poor urban minorities, especially young Blacks, were not keeping
pace as the economy moved around them (p. 254-255).
Capital deficits. Additionally, when African American middle class residents
migrated from the urban core to the suburbs, they left low-income African American
residents without role models in the inner city (Wilson, 1990). Lack of mobility for the
poor, along with economic policies that allowed middle-class African Americans to
move away resulted in a concentration of poor African Americans in the city center.
32
This segregation has resulted in physical, sociological, and economic isolation of poor
urban minorities (Massey & Denton, 1993).
A recent research study of geographic dispersion in major U.S. metropolitan
areas analyzed census tract data to study the effects of geographic dispersion and
segregation on children’s access to health, education, finances, and other resources
(Acevedo-Garcia et al., 2008). The study found that African American and Latino
students suffer from double jeopardy. “Not only are Black and Hispanic children more
likely to live in poor families than other children are, but they also experience
neighborhoods with unfavorable socioeconomic environments” (Acevedo-Garcia et al.,
2008, p. 327). Summarizing the findings of Acevedo-Garcia et al. (2008),
Philanthropist News Digest published the following,
“segregated, disadvantaged neighborhoods limit economic
advancement for minorities due to limited job and educational
opportunities, as well as a poor return on housing investment;
expose minorities to violent crime, environmental hazards,
poor municipal services, and a lack of healthy food options;
and lead to segregated and poorer quality healthcare settings.”
Many epidemiological issues are pervasive within U.S. neighborhoods that
disenfranchise low-income minority children (Acevedo-Garcia et al., 2008; McDonald
& McMillen, 2007; Bartik, 2000; Massey and Denton, 1993; Wilson, 1990).
Subsequently, low-income minority students, particularly African Americans and
33

Latinos, have great systemic challenges that limit their academic achievement, college
access, and educational attainment.
Low-income African American residents in the city core were also left without
African American leaders to assist them in decision-making, resource finding, and
securing political representation. When much of the social, cultural, and human capital
migrated to the suburbs, the resulting culture of poverty was isolated from the
mainstream societal culture, values, and political acumen necessary to improve their
economic condition (Massey & Denton, 1993; Wilson, 1990). The role that capital
plays in college attendance is discussed later in this chapter.
Achievement Ideology
Portes and Wilson (1976) studied the interaction between race and educational
attainment, educational aspirations, self-esteem, family structure, crime, and academic
achievement. In analyzing the role of U.S. stratification on college access, they found
that when holding parental status and mental ability equal, African Americans, followed
by Latinos, had the highest educational attainment goals of all races/ethnicities. They
achieved those goals at much lower rates than did others, however.
Goldsmith (2004) studied 1998 National Education Longitudinal Study (NELS)
survey data of 25,000 eighth graders nationwide to understand the factors that
contribute to achievement disparities between African Americans, Latino, and Whites.
Goldsmith (2004) found that African American students had the highest achievement
ideologies of all students, followed by Latino students. Achievement ideology refers to
students’ beliefs about their educational aspirations and occupational expectations, in
34
addition to attitudes toward school (Goldsmith, 2004, p. 121). Goldsmith (2004) made
two significant findings when comparing achievement ideology by race. First, African
American and Latino students had the highest educational aspirations and occupational
expectations. Second, African Americans had the most positive attitudes toward school
(especially when they were attending segregated-minority schools with minority
teachers).
African Americans and Latinos were found to have higher educational
aspirations and lower peer aversion to education compared to Whites, yet they attained
higher education at a lower rate than did Whites (Portes & Wilson, 1976; Goldsmith,
2004; Jencks, 1972). If minority students had the highest levels of achievement
ideology, why did they reach their educational goals at the lowest rates of all
racial/ethnic groups? Some educators have said that minority students’ high
achievement ideology is irrational due to unrealistic assessments of their potential and
mobility processes (Goldsmith, 2004). Portes and Wilson (1976) found that African
Americans were classified as outsiders in a path to educational attainment. For
outsiders, subjective variables such as determination were more strongly correlated to
attainment than objective variables such as academic achievement in grades K-12.
While these are two potential explanations, Mickelson’s (1990) explanation (I.e.
concrete vs. abstract ideas about goal attainment) was applied to this current study
because it relates to socioeconomic status and mobility.
In a study involving approximately 1,100 high school seniors in Los Angeles,
Mickelson (1990) found that when African American students did not see examples of
35

academic success in their environments (e.g. families, communities), their behaviors
and subsequent outcomes were not likely to be affected by their beliefs. Mickelson
(1990) theorized, therefore, that African American students had abstract ideas of
achievement, formed through thoughts (versus experience) and intangible ideas
(Mickelson, 1990; Kao & Tienda, 1998). They are rooted in the American dream belief
that a college education can provide social and economic mobility (Mickelson, 1990).
Mickelson (1990) found that concrete ideas were better predictors of achievement (such
as the connection between academic achievement and educational attainment) than were
abstract ideas. Concrete ideas of achievement are formed through experience and are
connected and relevant to a student’s life. They are based on a student’s expected
returns from a college education, as evidenced within their families and communities
(Mickelson, 1990). Because low SES and minority students did not generally see the
same returns on education investment as did their peers, their behaviors were
inconsistent with their high achievement ideologies, and goal attainment was hindered
(Mickelson, 1990). This is a barrier to college access for low-income minority students.
The next section presents literature related to capital development, and its promotion of
academic achievement and college access.
The Role of Capital
Capital, in the context of this research, refers to the resources a student
possesses and can activate to reach his or her educational goals. Yan (1999) identified
three types of capital that families provide, which aid college access and educational
attainment: financial capital, social capital, and cultural capital.
36

Financial Capital
Financial capital is measured by household income and wealth. In this research,
financial capital represents the financial resources a student has available to pay for
college. Latinos and African Americans have lower levels of financial capital than do
Whites because Latinos and African Americans earn lower incomes and are more likely
to live in poverty than are Whites. In 2007, average household income for Whites was
$54,940 compared to $38,679 for Latinos and $33,916 for African Americans (U.S.
Census Bureau, 2008). Moreover, poverty is more pervasive for Latinos (22.5%) and
African Americans (24.4%) than for Whites (8.2%) (U.S. Census Bureau, 2004).
Because they have relatively low levels of financial capital, low-income students
disproportionately cannot or believe they cannot afford college (Tierney, 1999).
Financial capital, along with social capital and cultural capital promote academic
achievement and college access (Yan, 1999). The following sections describe the roles
of social capital and cultural capital in promoting college access and educational
attainment for low-income minority students.
Social Capital
Social capital, as treated in educational literature, refers to a student’s
integration within the school community (Tierney, 1999). This integration is aided by
relationships that can help students reach their educational goals (Yan, 1999). Social
capital is largely dependent on family variables that determine and indicate the types
and amount of interaction within families. Parent education and income are directly
related to parental involvement, and they serve as predictors of academic success and
37

subsequent educational attainment of children (Yan, 1999). Ethnicity, socioeconomic
status, and family structure also affect social capital. There are multiple measures of
socioeconomic status as a variable in social capital. Portes and Wilson (1976) included
parent occupation and education (as measures of parental involvement), as well as the
number of books and the number of rooms in a home, to measure socioeconomic status.
Similarly, Teachman (1987) included the number of books in the home, in addition to
whether a student had a specific place to study, as measures of socioeconomic status, to
measure social capital.
Yan (1999) defined four dimensions of social capital: (a) parent-teen
interactions, (b) parent-school interactions, (c) parent-parent interactions, and (d) family
norms. First, parent-teen interactions refer to communication between parent and teen,
centered on topics that are of interest to the teen, particularly education plans. It also
includes joint participation in cultural events (Yan, 1999). Second, parent-school
interaction refers to a parent’s involvement in organized school activities, and a parent’s
knowledge of their child’s in-school experiences and plans. Third, parent-parent
interactions are measured by the level of parent engagement and relationships shared
with parents of their child’s peers, particularly focused on students’ educational plans.
Finally, family norms are the rules, expectations, and positive relationships with
children (Yan, 1999, p. 8). Yan (1999) analyzed NELS data for a representative sample
of U.S. eighth grade students, to compare parental involvement between African
American and White families. In particular, Yan (1999) studied how social capital
38

factors differed between successful African American students, successful Caucasian
students, and unsuccessful African American students.
Yan’s study yielded three important findings. First, African American parents
had lower household incomes than did White parents. Second, African American
parents had lower levels of education than White parents did. Third, African American
parents were more likely than White parents were to raise children in single parent
households (Yan, 1999). The latter is important because Yan (1999) found that (a)
single parenting indicates family disruption at some point in time, and (b) single parents
on average had less opportunity to interact with children than married parents did;
consequently, they transmitted lower levels of social capital to their children than did
married parents.
The difference in social capital transmitted is most likely due to differences in
bonding capital. Bonding capital, in this study, refers to the time spent in parent-teen
interactions focused particularly on children’s’ educational goals. Providing nurturing
and spending time with children are important to building bonding capital. Bonding
capital is horizontal capital that connects people with others who have similar social
status (Putnam, 2000). Bonding capital helps us feel connected to our communities and
each other, but does not help us to move from one social class to another (Putnam,
2000).
Furthermore, Yan (1999) concluded that social capital was essential for
educational attainment, because it relates directly to enforcing education and setting
high academic expectations. Bonding capital is one type of social capital, another
39
important type of social capital is bridging capital (Putnam, 2000). Bridging capital
refers to the relationships, group affiliations, and social networks one can use to connect
with others who possess high levels of cultural capital. Setting high academic
expectations and connecting students with others who can help them reach their goals is
the essence of bridging capital (Putnam, 2000). Low-income minority student have
disproportionately low levels of bridging capital, which may be one factor attributable
to their disproportionately low rates of college attendance and educational attainment.
Bridging capital helps us build vertical relationships. Regardless of marital status,
bridging ties can be established that allow parents to learn from others the processes
necessary to apply, attend, and finance higher education. Bridging capital promotes the
upward mobility of children through higher education (Putnam, 2000).
The good news is that social capital was found to be the easiest of the three
family-provided forms of capital (financial, social, and cultural) to strengthen (Yan,
1999). Even with low financial capital, high academics and social capital can be
attained by placing high values on education (Duran & Weffer, 1992; Yan, 1999).
Setting high expectations for academic achievement can help promote the development
of social capital, which in turn can aid college access and educational attainment (Yan,
1999; Duran & Weffer, 1992).
Cultural Capital
Bourdieu (1986) defined cultural capital as the “set of linguistic and cultural
competencies individuals usually inherit and sometimes learn” (p. 246). There are three
types of cultural capital that one can possess (Bourdieu, 1986). First, embodied capital
40
refers to the appreciation of things valued by the dominant class. An appreciation of the
arts is an example of embodied capital. Embodied capital, as the name implies, is
internal and engages one’s mind and body. Objectified capital is the second type of
cultural capital. Objectified capital refers to the possession, for utility and appreciation,
of things valued by the dominant class. Owning a Renoir impressionist painting is an
example of objectified capital. As the name implies, objectified capital refers to objects
external to the body. Third, institutionalized capital refers to the accumulation of
credentials conferred through intuitions valued by the dominant class. A college degree
is a form of institutionalized capital, and parents who have earned a college degree are
better able to teach their children from experience how to navigate the processes
necessary to attend college and obtain conferred credentials. Cultural capital therefore
generally measures the alignment of one’s values, ideologies, and possessions with
those of the elite or dominant class, and the sensibility to appreciate them, as well as
one’s knowledge and educational credentials (Bourdieu, 1986).
The concept of habitus is central to Bourdieu’s (1986) cultural capital
framework. Habitus refers to the internal view of one’s place in the world, and is driven
largely by one’s affiliation with a social class and its traditions and expectations of
success. This social class orientation is communicated through family. The complete
framework involves “one’s resources (capital) and the orientation one has toward using
those resources (habitus)” (Dumais, 2002, p. 45).
“Academic success is directly dependent upon cultural capital and on the
inclination to invest in the academic market” (Bourdieu, 1973, p. 96). This idea
41
parallels McDonald & McMillen’s (2007) finding of low investments in education by
low-income minorities in poor neighborhoods, due to low life expectancy. According
to Swartz (1997), investing in education depends on a class system and awareness of
one’s place therein. Lower-class students have low levels of cultural capital, and
therefore, make only small investments in the education system. Additionally, lower
class students may feel a need for financial security, and therefore not allow themselves
to consider abstract college majors, or even the thought of attending college. Instead,
students in lower social classes may focus on vocational training or employment to fill
an immediate financial need (Swartz, 1997).
Schools perpetuate differences in cultural capital between students of varied
social classes (Swartz, 1997). To the extent that students possess the cultural capital of
the elite class, their values will align with those that the school is reinforcing and
rewarding, resulting in academic success and educational attainment (McDonough,
1997). Students who possess high levels of cultural capital (resources and awareness)
tend to do well in school compared to those who do not. Students with high cultural
capital have better results in school because they are most comfortable with the values
and formal language of academia due to their immersion within the dominant culture,
from which they extract knowledge. They also achieve better results because of their
increased communication with teachers who are from similar social classes (Dumais,
2002). However, low-income and minority students do not possess sufficient cultural
capital (elite values and resources) to identify and therefore engage with the values that
elites possess and schools reinforce (McDonough, 1997). Cultural capital theory and its
42
relevance to educational achievement parallel domain identity theory (Steele, 1997).
Low levels of both domain identity and cultural capital can limit college access and
educational attainment for low-income minority students.
Social Integration and Cultural Relevance
Social scientists have agreed that low levels of financial, social, and cultural
capital reduce the academic achievement and subsequent college access and educational
attainment of low-income minority students (Feagin et al., 1996; Tierney, 1999;
Cammorata, 2007; Reid & Radhakrishnan, 2003; Williamson, 1999; Bourdieu, 1986;
McDonough, 1997; Tinto, 1987; Portes & Wilson, 1976; Dumais, 2002). Research
studies in education have consistently found that culture is important for academic
achievement and preparation for college; a student is expected to succeed academically
to the extent that the curriculum is relevant to his or her culture. Researchers do not
agree, however, on the best ways to strengthen low-income minority students’
identification and subsequent connection to the institution of school.
According to Tinto’s (1987) theories of college student retention, African
American students should assimilate to the culture and values of the institution in order
to succeed. Williamson (1999) disavowed this notion. Williamson (1999) studied the
experiences of African American students at PWIs in the 1960s and 1970s. The
students in the study faced racism and discrimination, and felt ostracized because they
did not readily identify with the culture of their universities. Instead of committing
what Tierney (1999) referred to as cultural suicide, discarding their shared experiences
and values, the students created the social networks they needed for academic success
43
(Williamson, 1999). African American students created or insisted upon the creation of
Black student unions, Black studies departments, and Black student organizations, and
succeeded on their own terms. Williamson (1999) found that African American
students, by injecting their culture into their college environments, met their own needs
and thereby redefined academic success. Tierney (1999) also found that schools could
adapt their curricula to become socially relevant to their students.
Researchers have found that when schools, as institutions, reflect the cultures of
the students they educate, schools aid academic success (Cammorata, 2007; Tierney,
1999; Williamson, 1999; Meier et al., 1999). These researchers found that social
integration could be enhanced by increasing the cultural relevance of curricula to low-
income minority students, thus increasing academic success and ultimately educational
attainment for these populations (Cammorata, 2007; Dumais, 2002; Tierney, 1999;
Williamson, 1999). Intentionally building cultural relevance into curricula and into the
fabric of academic institutions can promote the social integration and academic success
of low-income minority students (Cammorata, 2007).
Cammorata (2007) studied a pilot curriculum with a social justice approach to
learning that integrated core subjects with complex analyses of current social issues.
The curriculum was created for low-achieving Latino high school juniors and seniors at
risk of failing or dropping out of high school. These students had been tracked for
failure and sorted into remedial level courses, in which they demonstrated little
motivation to learn.
44

The pilot curriculum required students to complete a college-level, critical
theory curriculum in lieu of the remedial education. In particular, lessons were taught
using a critical theory primer, and required students to analyze the challenges of their
everyday existence (crime, poverty, etc.) in light of what they were learning in their
core courses (e.g. social studies, government, and math). The result of social infusion
and increased academic challenge was that the students excelled above all expectations:
88 percent of students at-risk of failure graduated high school and 58 percent of the
students attended college (Cammorata, 2007).
Students who completed the pilot curriculum became acutely aware of their
SES, and the negative issues they would continue to face if they remained uneducated
and socially immobile. By being aware of the world and their place in it (developing
their habitus), the students were able to control and shape their learning experiences,
understanding how their academics were culturally relevant to their lives. This example
underscores the connection between cultural relevance and curriculum in promoting
academic success and subsequent educational attainment for minority students.
The current research study focused primarily on college access for low-income
minority students and the barriers that limit that access. To this point, the actual cost of
attending college has not been addressed as a barrier to college access for low-income
minority students. College costs have kept some students from attending college.
However, the decision of whether to attend college is determined by other variables
(e.g. student motivation; academic preparation; achievement ideology, levels of capital)
45

before a student is faced with the actual cost of attendance. Notwithstanding, college
cost is an important consideration, worthy of further discussion.
Levine and Levine (1995) have collectively spent 60 years as practitioners and
researchers of critical issues in urban education, including the issue of educational
attainment for minority students. Their areas of expertise are urban schools and their
interactions with other social institutions. Levine and Levine (1995) found that
insufficient funding for tuition, a shift in federal aid from grants to loans, rising tuition
costs, and higher college entrance standards were barriers to educational attainment for
low-income minority students. Rising tuition costs (Lang, 1992) and shifts in federal
aid from grants to loans (Levine & Levine, 1995) reduce the affordability of college and
the number and type of colleges that low-income students can consider attending (Lang,
1992).
Summary
Understanding how to promote access to higher education for lower income
minority populations is central to narrowing the gap in educational achievement, which
has significant consequences for labor force participation, economic empowerment, and
equity. To achieve equity in US, all subpopulations will need to participate equally in
education and have equal access to the opportunities that education affords. With
improved education, one can benefit in many ways. In addition to the benefits detailed
in Chapter 1, common literature promotes the following benefits of obtaining a higher
education: improved access to healthcare, better housing choices, decreased crime and
incarceration, increased political power, improved social mobility, and lengthened life
46

span. All U.S. populations should have fair access to these benefits, and more
importantly, to the opportunities to reach the full measure of their potential.
Of course, the first step toward obtaining a college degree is the decision to go
to college in the first place. While we know that low-income and minority students
attend college at rates disproportionately lower than their wealthier and White
counterparts, we know little about what goes into their decision about whether to attend
college or not. To achieve educational equity, low-income minority students must first
enter college at rates comparable to their peers; then they will need to graduate college
at much higher rates than they do today.
The purpose of this research was to understand how low-income and minority
students, particularly Latinos and African Americans, make higher education decisions,
including the decision of whether to attend college. Four questions guided this
research. Chapter 3 describes the research methods and procedures.
Research Questions
1. How important are academic, cultural, and social preparation in the college
attendance decision for low-income minority students?
2. How important are college tuition costs and funding in the college attendance
decision for low-income minority students?
3. When academic preparation (graduation from high school completing a
comprehensive curriculum) and funding (scholarships) are secure, what factors
do low-income minority students consider when making their college attendance
decisions? Which factors are most important?
47

48
4. What barriers do low-income minority students perceive limit their choices for
higher education? Why do a disproportionate number of low-income minority
students select two-year colleges over four-year colleges, even when tuition has
been guaranteed?
CHAPTER III
THE METHODS AND PROCEDURES
Research Design
The purpose of this research was to explore the college attendance decisions of
low-income minority students, and to identify the barriers that threaten that attendance.
To accomplish this, the researcher completed a multi-ethnic case study of a not-for-
profit organization with a mission to improve college readiness and increase college
attendance for underserved students. The organization is hereafter referred to as “the
program.” All students surveyed as part of this study were participants in the program.
The program’s goal is to graduate students from high school prepared to successfully
enter and graduate college. The program provides comprehensive college planning for
students in low SES, urban, public schools.
Survey research was used to learn how students made their college attendance
decisions, including the decision of whether to attend college. Survey research gave the
researcher the potential to reach every student in the described population of program
participants, who dispersed geographically throughout the country after graduating from
high school. Survey research was ideal because this study assessed students’ behavior,
attitudes, and past decisions, in addition to family background and other socioeconomic
student characteristics (Singleton & Straits, 2005). Using survey research for this case
study also minimized researcher influence by allowing respondents to complete the
49

survey on their own, without interacting with the researcher (in most cases). In addition
to survey data collected from participants, this study also utilized student academic data
from the program’s databases.
Overview of “The Program”
Alleviating Barriers
The program provides opportunities for students who are traditionally
underrepresented in higher education (mostly low-income and minority students) to
earn a higher education. Furthermore, the program ensures tuition funding for all its
graduates who choose to attend college. Program participants are required to apply for
college and financial aid and scholarships (with the assistance of program advisors) to
alleviate the burden of college attendance costs, including tuition, housing, and other
expenses and fees. Two program advisors, who are employed by the program, work
full-time at each high school the program serves. Currently, the program operates in
three public high schools and two public middle schools within a large, southwestern
U.S. city.
Insufficient funding for college is an obvious barrier to college attendance for
low-income students. This research sought, among other goals, to explore barriers
beyond finances, which limit college attendance. A significant characteristic of the
program is the dedication of internal and external resources to provide financial
assistance to its students. By providing tuition scholarships to program graduates, the
program endeavors to alleviate the financial burden of attending college. In addition to
funding, the program helps to manage college planning for students who decide to
50

attend college. Actively assisting students through college planning over four years in
high school increases program participants’ knowledge of college culture and admission
processes.
The program has five main goals intended to parity college attendance and
educational attainment for underserved students. The five goals are to (a) prevent high
school dropout, (b) prepare students for college, (c) guide students through college
admission processes, (d) help students secure funding for college, and (e) prepare
students to graduate college. To achieve these five goals, three critical types of student
support are offered. The next section discusses the three critical support areas (e.g.,
academic support, social support, and cultural support) as well as specific program
components within each area.
Academic support. First, program advisors provide academic support and
supplement the work of high school counselors, whose caseloads averaged 275-450
students in the schools where the program operates. (Average caseloads are calculated
as the total number of students divided by the total number of counselors.) Having two
program advisors dedicated to each campus full-time increases student participants’
access to college counseling services.
Program advisors provide many forms of academic support to program
participants. Program advisors routinely monitor students’ grades, and work with
counselors and teachers to help ensure that program participants receive tutoring as
necessary. Program advisors also promote tutoring sessions for standardized tests, and
register junior and senior program participants to take SAT and ACT exams. Program
51
advisors maintain ongoing communicate with students and counselors to help ensure
that students are taking appropriate courses for college readiness. In addition to the
aforementioned, the program also offers incentives to motivate students to excel
academically; for example, one such incentive was an SAT/ACT exam contest that
awarded financial prizes for top scorers at each school. Other incentives include
academic celebrations each semester, which honor students who make the honor as well
as students who achieve perfect attendance. The program advisors invite all students
within each school to attend the academic celebrations, and all students of the school
are eligible to receive awards and prizes, even if they do not participate with the
program. Some of the high tech prizes that are awarded, such as iPods and laptops, are
intended to close the digital divide between upper- and lower- economic classes.
Students work with program advisors to complete financial aid applications,
including the Free Application for Federal Student Aid (FAFSA), and college admission
applications, both of which are required for students to remain in the program. The
program also requires students to complete private and community grant and
scholarship applications, with the help of program advisors, to secure external funding
for college, in addition to the scholarships (gap funding) offered by the program.
Social support. Social support is the second critical area in which the program
assists participants. The program provides social support through group affiliation. The
program utilizes peer influence in a positive way to create a camaraderie that supports
academic excellence, as well as group affiliation within each high school. Group
affiliation is enhanced through program meetings and field trips, as well as through
52
academic celebrations and through branding of apparel and other merchandise that is
given to all program participants. The program also provides social support by teaching
participants how to interact with members of the college community, especially
professors, staff, and students who can support and aid program participants’ success in
college. To accomplish this, the program provides college campus visits, and
encourages communication between students and college advisors about students’
educational goals. During the campus visits, student participants also learn about the
many resources that are available on college campuses, including writing labs and math
labs, in addition to other academic support services that can help the students succeed.
In addition to teaching students how to communicate with the college
community, the program offers a number of ongoing programs and activities that
provide social support to program participants. Some of the ongoing programs include
essay writing workshops, résumé writing assistance, and mock interview sessions,
focused on college admission and job interviews. Additional field trips to local
hospitals, corporations, and not-for-profit agencies provide hands-on opportunities for
students to explore career interests. The program also offers full-time, paid summer
internship opportunities for rising high school juniors and seniors, in partnership with
city officials. The internships promote the development of professional work habits,
skills, and communication styles. In addition to helping students strengthen their verbal
and written communication skills, the program also facilitates interaction (thereby
promoting relationship development) between students and the external not-for-profit
and business communities. Finally, attending receptions and other programs hosted by
53
community organizations allows program participants to meet and network with people
who have the knowledge and resources to assist them in reaching their goals, thereby
developing their social capital. Cultural capital is increased through this engagement as
well, as described in the next section.
Cultural support. Cultural support is the third critical area of support offered to
program participants. Bourdieu (1986) described three types of cultural capital; they
are embodied capital (appreciation of things that are valued by the dominant class), (b)
objectified capital (owning things that are valued by the dominant class), and (c)
institutionalized capital (earning credentials through institutions valued by the dominant
class). The ultimate goal of the program is to develop participants’ institutionalized
capital through the attainment of a college degree; embodied capital is the primary form
of cultural capital that the program tries to strengthen to accomplish this goal.
A series of life skills workshops is a major component of the program designed
to increase students’ cultural capital. Program advisors offer life skills workshops twice
each month: one session for freshmen and sophomores and a second session for juniors
and seniors. Program advisors facilitate life skills workshops; sometimes, external
presenters or content materials are involved in the workshops. The purpose of the
workshops is to teach students the norms, values, and beliefs of the dominant class so
they will know how to align their values and behaviors with those taught. Topics vary
by grade level, and focus on themes like managing time, investing in the stock market,
taking notes, setting goals, academic honesty, planning personal finances, making
decisions, exploring careers, and selecting a college. Program participants are required
54

to attend at least six of eight monthly life skills workshops each academic year. The
workshops are offered as lunch programs during the school day and as after-school
programs immediately after school, and do not interfere with regular academic classes.
Parents and guardians also commit to attending workshops each year, although the lack
of parent/guardian participation does not harm a student’s ability to qualify for tuition
funding.
The program provides cultural support also by assisting parents and students in
understanding the processes of applying for college admission and financial aid, and
exposing students to the values of the dominant class to aid their integration into
academic and professional communities. As mentioned in the discussion on social
capital, students also attend luncheons and dinners, and a multitude of receptions hosted
by community organizations. These interactions not only increase students’ social
capital, but also their cultural capital. By engaging with professionals in the greater
community, program participants are exposed to the values (punctuality), norms
(professional appearance), and customs (dining etiquette) of the dominant class. As
program participants become familiar with, and adopt the values and customs of the
dominant class, they develop embodied capital, which will aid their integration within
dominant society.
The program also educates students on issues related to intellectual life and fine
arts. One of the ongoing initiatives focused on cultural support includes organizing
student field trips to view films debuting during film premiers. Through the program’s
partnership with nationally renowned film organizations, students regularly attend film
55
premiers that included in-person chat sessions with film creators. This is a direct
attempt to expose participants to the fine arts, and subsequently increase their embodied
capital, by increasing their awareness and appreciation of the arts.
Currently in its infancy, the cultural support component will further develop to
include trips to local museums, live theaters, and major financial institutions. In all
cases, the program hopes to expose program participants to the types of experiences
usually reserved for middle- and upper-class students, in hopes that they will pursue a
higher education and be culturally prepared to enter and graduate college. As an aside,
most of the aforementioned field trips were taken in the evenings, during weekends, and
during the summer, with a few taking place during the regular school day with school
administrators’ permission.
Program Participation
Program advisors recruited the high school graduating class of 2008 during the
students’ freshman year in high school (2004-2005). All program graduates remained
involved over four years, with the exception of a few students who were admitted by
exception during their junior or senior years of high school due to special circumstances
such as transferring to a participating school after the freshman year of high school, or
demonstrating outstanding student conduct only late in the high school tenure.
Each year, program advisors invite all first year high school students to
participate in the program with no regard to their academic accomplishments, financial
need, or race/ethnicity. Program advisors give classroom presentations and provide
information during lunch periods and in the hallways. Recruitment efforts inform
56

students and school staff about program components, requirements, and benefits, which
include financial incentives for program participation and academic excellence, public
recognition, technology incentives (e.g., iPod, video game, and laptop), as well as
financial assistance to attend college. All students who actively engage with the
program will be eligible for financial awards for college tuition, if needed. If a student
secures full tuition funding through other external scholarships or grants, the student
receives a technology package (laptop and printer) for college.
Program participants are required to complete a high school curriculum that
includes three credits of science, four credits each of math, social studies/economics,
and English/Language Arts, and a minimum of two years of the same foreign language,
along with arts, technology, and electives as required by the state for graduation.
Students are strongly encouraged to enroll in pre-AP (advanced placement) and AP
courses whenever available. For full funding eligibility, participants are required to
remain actively engaged in school, with a maximum of three unexcused absences, two
disciplinary referrals, and no suspensions each school year from grades 9 through 12.
In other words, the students need to commit wholeheartedly their time and energy
through diligent involvement with the program, in order to maximize the benefits of
being involved in the program, while preparing (with the help of program advisors) to
enter college.
In previous years, the programs’ initiatives were focused solely on high school
students in grades 9-12, and although the students in this study were already in high
school at the time, in fall 2008, the program implemented a middle school component
57
for grades 6-8. In fall 2008, program advisors began cultivating relationships with
middle school students, through weekly roundtable discussions and academic
celebrations. Upon entering high school, those affiliated students and others will be
invited to join the program.
Selection of “The Program” as the Case Study Organization
As highlighted in Chapter 2, the literature consistently found that three of the
issues that hinder low-income and minority students’ college attendance are (a)
inadequate academic preparation, (b) little understanding of college admission
processes, and (c) insufficient financial resources. The students in the program,
however, have three major advantages over their peers. First, they prepare
academically by completing a college preparatory curriculum. Second, they receive
pro-active, long-term guidance through the college admission process, working with
program advisors throughout high school. Third, they are guaranteed the financial
resources needed for college tuition. Because of the myriad of services offered by the
program, this case study is able to analyze the higher education decisions that students
make when high school preparedness, college planning, and college costs are secured.
The program is particularly valuable as a case study institution because it
reduces two key barriers to college attendance for low-income minority students; these
barriers are insufficient college acumen and limited financial resources to attend
college. By providing academic, social, and cultural support to program participants,
the program seeks to alleviate other barriers that have traditionally prevented low-
income and minority students from attending college.
58

According to Yin (1993), case study research is a preferred method for social
science research when the researcher does not control behavior and events, and the
issues being researched are contemporary, and provided current, real-life analyses (Yin,
1993). This research seeks perspectives of multi-ethnic students on sensitive issues,
based on socioeconomics, race/ethnicity, and higher education decision processes. Case
study research provides a contained context within which a complex phenomenon is
inextricable. Such a strategy allows focused analysis of an otherwise infinite issue,
inequities in education.
Equally important, using case study for this research provides convenient access
for the researcher to the subjects of this study, because the researcher has a relationship
with the case study organization. Through mutual relationships with the case study
organization, the researcher and respondents share a common platform. This
commonality helps the researcher to establish credibility and familiarity with the
participants of this case study. Having access to students and program data allow the
researcher to strengthen the quality of analyses, by merging academic and demographic
student data (from program records) with students’ responses.
In addition to the structural positives of the program for the purposes of this
study, the researcher believes in its comprehensive programming and mission to parity
educational attainment. The program philosophically recognizes that low-income
students do not have disproportionately low levels of educational attainment relative to
their peers simply because they lack the money to attend college. The program instead
acknowledges and endeavors to alleviate the additional pervasive barriers to college
59
attendance and educational attainment that result from persistent deficits in capital for
students with low socioeconomic status. The program does not attempt to parity
education by just throwing money at the problem; instead, it provides holistically rich
opportunities for program participants to learn and develop networking skills and work
ethics (e.g., internship) that promote the development of social and cultural capital
necessary to alleviate a variety of barriers that result from low financial capital.
Moreover, the program holds students accountable for their outcomes by requiring
students to work pro-actively with program advisors, and teaches them how to advocate
on their own behalf. Therefore, the program is ideal for a case study because it allows
the researcher to examine the college attendance decisions that low-income and
minority students make when they are presumably prepared academically to attend
college, and have funding for tuition.
Program Participant Population
The population included all students who were members of the program and
who graduated high school in the spring of 2008. Two hundred eighteen program
participants began as seniors in high school during the 2007-2008 academic year; 189
of them graduated in the spring of 2008. The remaining 29 students either (a)
transferred to a school not served by the program, (b) did not graduate on time (repeated
grade 12), or (c) dropped out of high school. (Unfortunately, program documents do
not have data available for these 29 students.) Out of the 189 graduating seniors, 145
attended some form of postsecondary school immediately in the fall semester after
graduating high school. Program participants attended college at much higher rates
60

(77%) than did other students in the state (52%) and the school district in which the
program operates (36%). By the spring of 2009, 149 program graduates who graduated
in the spring of 2008 were enrolled in college.
According to high school transcripts, the 2008 graduates were diverse by
race/ethnicity and gender; approximately 70 percent of graduates were Latino, 25
percent were African American, and 5 percent were Asian, Caucasian, or other races.
There were more slight males (52%) than females (48%) in the program. Household
income was not available, but free and reduced lunch rates at each high school will
serve as a proxy for household income. Participants graduated from one of three inner-
city high schools; 79 percent of all students in the three participating high schools
received free or reduced-price lunch. Therefore, the program participant population is
presumed to be largely low-income. Table 3 presents demographic information for
each participating high school.
The sampling plan was to reach all 189 of the program participants who
graduated in the spring of 2008. The researcher used program documents to locate e-
mail addresses and phone numbers of program participants in the 2008 graduating class.
The researcher was able to locate contact information for 134 of the 189 students in the
population. The resulting sample was drawn from the 134 students, and not the full
189. Over the course of four weeks, five e-mail attempts and one phone call were made
to each of the 134 eligible students in the sample, resulting in 70 students who
completed the survey. The response rate was 52 percent of students for whom contact
information was located, or 37 percent of all graduating program participants.
61
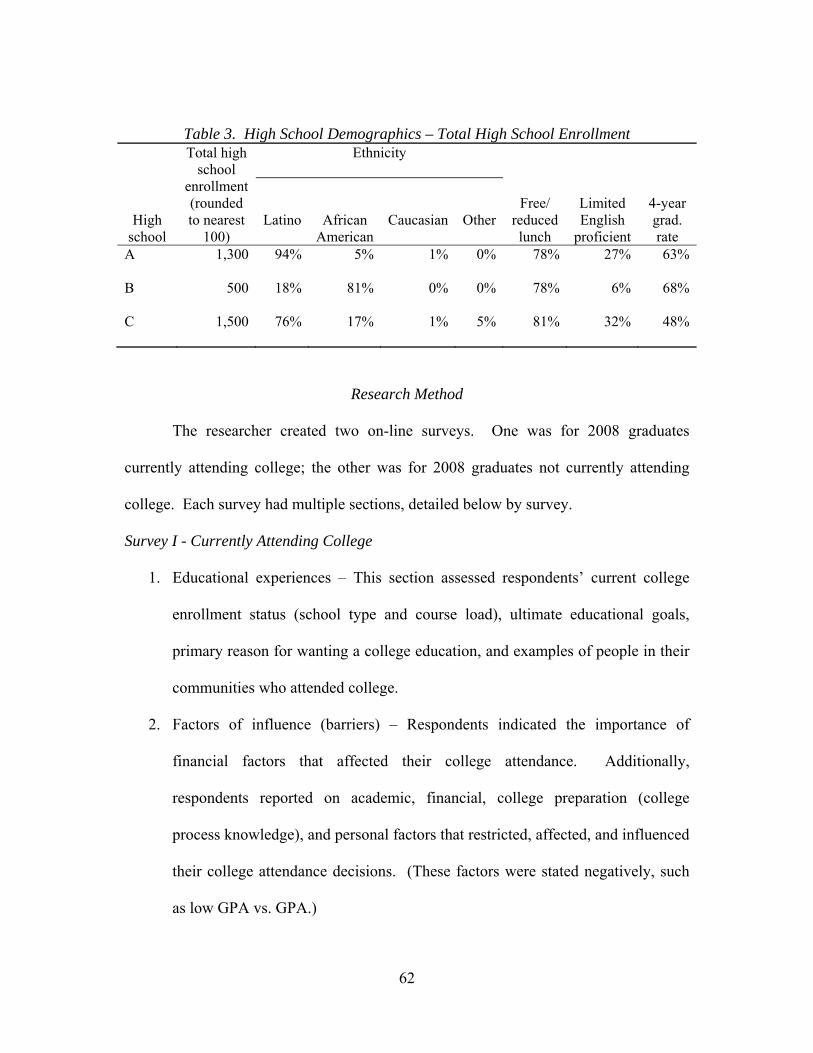
62
Table 3. High School Demographics – Total High School Enrollment
High school
Total high school
enrollment (rounded to nearest
100)
Ethnicity
Free/ reduced lunch
Limited English
proficient
4-year grad. rate
Latino African American
Caucasian Other
A 1,300 94% 5% 1% 0% 78% 27% 63%
B 500 18% 81% 0% 0% 78% 6% 68%
C 1,500 76% 17% 1% 5% 81% 32% 48%
Research Method
The researcher created two on-line surveys. One was for 2008 graduates
currently attending college; the other was for 2008 graduates not currently attending
college. Each survey had multiple sections, detailed below by survey.
Survey I - Currently Attending College
1. Educational experiences – This section assessed respondents’ current college
enrollment status (school type and course load), ultimate educational goals,
primary reason for wanting a college education, and examples of people in their
communities who attended college.
2. Factors of influence (barriers) – Respondents indicated the importance of
financial factors that affected their college attendance. Additionally,
respondents reported on academic, financial, college preparation (college
process knowledge), and personal factors that restricted, affected, and influenced
their college attendance decisions. (These factors were stated negatively, such
as low GPA vs. GPA.)

3. Decision-making – Respondents rated the importance of information and
information sources, as well as variables related to college characteristics,
college academics and majors, college recruitment, and advice received.
Respondents reported each variable in terms of the importance of each in the
college attendance decision.
4. Satisfaction – Section 4 asked respondents to consider how satisfied they were
with their college attendance decisions, considering the type of college attended
(public/private; 4-year/2-year, etc.), choice of major, and specific college
attended. Respondents also shared their satisfaction with the decision to attend
college.
5. Preparation and recommendations – In addition to social and cultural
preparation for college, each respondent rated his/her perceived academic
preparation for college and the likelihood that (s)he would graduate college.
This section also asked respondents how their higher education decisions would
have differed without the resources and guidance offered through specific
components of the program.
6. Demographic information – Included gender, members in household, parents’
education, and contact information. (See Appendix A for the complete survey.)
63
Survey II - Not Currently Attending College
Survey II is very similar to survey I, and many of the questions are the same as
those posed in Survey I. Because the surveys are so similar, the next section highlights
only important differences between the surveys. With the exceptions noted below,
Survey II items parallel Survey I items, by section heading.
1. Educational experiences – This section asked respondents why they did not
attend college. This section also asked respondents to identify reasons why
people might attend college.
2. Factors of influence – Respondents were asked about the academic, financial,
college preparation (college process knowledge), and personal factors that
contributed to their decision to not attend college. The decision-making section
was omitted in Survey II.
3. Satisfaction – Survey II omitted items from Survey I regarding college choice
(type of school, specific school, and major). The omission effectively reduced
this section to a query of satisfaction and dissatisfaction with the decision not to
attend college, in addition to a query of whether the participant would have
chosen to attend college if they could have chosen again. Furthermore, it asked
what college they would have attended had they attended directly from high
school.
4. Preparation and recommendations – Survey II did not ask participants how their
plans would have differed without the resources of the program. Survey II
64

65
asked respondents’ future higher education plans and timelines for those plans.
Other items in this section paralleled those of Survey I.
5. Demographic information – Included gender, household structure, and contact
information. (See Appendix B for the complete survey.)
Independent Variables
Preparation
Participants in this study rated their perceived preparation to enter and graduate
college. Preparation was rated in four categories: academic (achieving academically
and mastering core content), financial (having enough money to pay for college – see
financial section), social (understanding how to interact within the college community
to aid student success), and cultural (knowing how to plan for college and manage the
college admission process). Perceived preparation scores ranged from one (very
unprepared) to five (very prepared). The five-point scale was recoded to a three-point
scale, with response categories including unprepared, somewhat prepared, and prepared
because it simplified statistical analysis, and logically, either the respondents felt
prepared or unprepared, with no definable difference between feeling, for example, very
unprepared and unprepared. Additionally, SAT and ACT scores, which are widely used
by colleges to make admission decisions, were included as measures of students’
academic preparation for college; these scores were obtained through program records.

Motivation
Low personal motivation to attend college has been identified in the literature as
a second individual barrier to college attendance for low-income minority students
Cammorata, 2007; Dumais, 2002; Feagin et al., 1996). To learn if this was the case for
program participants as well, respondents were asked to rate their perceived level of
motivation to attend college from one (not motivated) to three (very motivated).
Additional measures of respondent motivation included (a) ultimate educational goals,
(b) reasons for attending college, and (c) grade level when the student first considered
college attendance. These measures were included because they represent the
educational goals of respondents as well as how they believe college will help them to
reach those goals.
First, possible responses for ultimate educational goals ranged from earning a
training certificate to earning a graduate degree. In addition to knowing their
educational goals, knowing the reason why students are attending college can reveal
internal and external motivations (reasons) behind their educational goals. Reasons for
attending college included personal desire, family expectations, and social and
economic mobility. The amount of time that a student has been committed to obtaining
a higher education can also indicate the level of planning they have engaged in to reach
their goals. Respondents could choose one of three grade levels to represent the period
in their education when they first considered attending college: elementary (K-5),
middle (6-8), and high school (9-12).
66

Student motivation can also relate to achievement ideology (I.e., educational
aspirations, occupational expectations, and attitudes toward school) as well as goals one
sets for oneself and reasons for pursuing them (Goldsmith, 2004, p. 121). Mickelson
(1990) found that although minority students have high achievement ideologies
regarding college attendance, they lack the examples of people in their communities
who have achieved a college education. Even when they have such examples, they may
not see the benefits that others have received as a result of attending college as readily
as would non-minority students (e.g., minority college graduates, on average, do not
earn wages that are comparable to non-minority college graduates with the same
degree) (Mickelson, 1990). Therefore, although minority students were found by some
scholars to have higher achievement ideologies than did on-minorities, the achievement
was actualized at lower rates than non-minorities. Achieving a higher education
requires behaving in a manner that is consistent with reaching one’s goals (Mickelson,
1990). Mickelson (1990) found that without visible examples of the benefits of a
college education, minority students are not inclined to behave in ways that are
consistent with goal attainment. To measure their examples of college attendance,
respondents were asked if they knew someone in their community who attended
college, and if so, who (family, friends, etc.).
Social and Cultural Capital
The program aims to strengthen the social and cultural capital of its participants.
Both forms of capital were reflected in the item that asked respondents’ perceived
preparation to attend and graduate college. Social capital represents the
67
communication, relationships, and networking that participants engage in that help them
integrate into education institutions, and that can further their educational pursuits
(Tierney, 1999). In addition to the two items that asked participants their perceived
social preparation to enter and graduate college, social capital was measured by whether
respondents had a mentor and by the marital status of their parents. It may be the case
that single parents transfer lower levels of social capital to their children than do
married parents, mostly because single parents are unable to spend as much time with
children as married parents can spend (Yan, 1999). Therefore, it is important to know
the marital status of respondents’ parents as an indicator of the level of social capital
that may have been transmitted between parent and student. As an indicator of parents’
marital status, respondents indicated with whom they lived most of their childhood
years (such as mother, father, both mother and father, grandparents, etc.).
Individuals who have high cultural capital possess the values and materials of
the dominant class (Bourdieu, 1986). According to Bourdieu (1986), cultural capital is
largely predicated on parents’ education. Although schools do not create cultural
capital, as institutions they promote and reward the possession of cultural capital
(Kahlenberg, 2006; Dumais, 2002). Students with high levels of cultural capital
communicate better with teachers, and are therefore more comfortable and identify
more strongly with school than do students with low cultural capital (Dumais, 2002).
High levels of cultural capital promote college attendance as well (Dumais, 2002;
Bourdieu, 1986). However, low-income minority students are often distanced from the
dominant cultural capital system within schools (Dumais, 2002). Parents’ highest
68
education level served as one measure of cultural capital in this research; respondents
were asked to indicate the highest level of education for both their mother and father,
separately. Parent education was measured also because previous research has shown
that children whose parents have attended college are themselves more likely to attend
college (Bourdieu, 1973). Possible responses ranged from elementary school to
graduate school (or unknown). Program components focused on cultural capital
included college planning assistance and monthly life skills workshops. Respondents
were asked to indicate how likely they would have been to attend college had they not
had this support from the program. The five-point response scale ranged from
“definitely would have attended” to “definitely would not have attended.”
Financial Considerations
Financial considerations of attending college included cost of attendance and
sources of funding. Participants were asked the importance they put on the cost of
attending college, and sources of funding to meet that cost. First, cost of attendance
was separated into four components: books/supplies, campus housing, tuition, and
technology. Participants ranked the importance of each of those variables, in
conjunction with financial needs (grants, loans, and income). The relative importance
of each of the seven items was ranked in relation to each other, with one being the most
important, and seven being the least important.
The importance of financial considerations in the higher education decision was
evaluated additionally through independent ratings of several financial components.
Participants rated the importance of both tuition and housing costs, in addition to four
69

forms of financial aid (grants, scholarships, loans, and work-study), to their higher
education decisions. Each component was rated from one (not important) to three (very
important). Additionally, participants were asked how important program-provided
funding was to their college attendance decisions, using the same scale.
To measure the importance of funding and its impact on the decision to attend
college, three additional items asked participants who were currently attending college
to speculate how the absence of funding would have affected their college attendance
decisions. The first item asked how likely participants would have been to attend
college without program funding. Responses ranged from one (definitely would not
have attended college) to five (definitely would have attended college). The second
item asked participants to speculate about how they would have otherwise paid for
college without program provided funding. Respondents were allowed to choose
multiple responses, including (a) no change; I received full external funding through
scholarships, (b) would have borrowed from family members, (c) would have paid cash
from family savings, (d) would have taken more parent loans, (e) would have taken
more student loans, (f) would have delayed college attendance, and (g) would not have
attended college.
Finally, participants were asked how the actual decision to attend college would
have changed without program provided funding. The following statements were used
to explore their alternative higher education decisions: (a) would have attended a 2-
year college vs. a 4-year college, (b) would have attended college closer to home, (c)
would have attended college in state vs. out of state, (d) would have lived at home vs.
70
campus housing, and (e) would not have attended college. The survey items regarding
alternative plans for college funding and college attendance also allowed respondents to
provide their own alternative responses.
Influence of College Characteristics, Academics and Majors, Recruitment, and Advice Received
To understand more fully, how low-income minority students make their college
attendance decisions, it is helpful to know the information sources they sought, factors
they considered, and the importance they placed on each. First, respondents were asked
about the information sources they used, including the internet, college/university visits,
media, and other people. Respondents were asked to select all of the sources, from a
list of 18, which they used when making their college attendance decisions. In addition,
the item allowed participants to fill in other sources not listed.
Knowing the factors considered by respondents provided additional insight into
the information that was important to respondents as prospective college students, and
how they sought the information that they needed to make their college attendance
decisions. A broad spectrum of individual variables was grouped into five categories:
(a) college characteristics, (b) college academics and majors, (c) college recruitment, (d)
advice received, and (e) financial factors (previously discussed). Respondents indicated
the importance of variables within each category to their decisions about higher
education, assigning one of three ratings to each variable: not important, somewhat
important, and very important. College characteristic variables included variables
directly related to college campuses, such as (a) campus appearance, (b) average class
71
size, (c) distance from home, (d) ethnic/racial diversity on campus, (e) number of
students enrolled, and (f) physical size of campus. College academics and majors
variables included (a) assistance for undecided majors, (b) GPA requirements, (c)
availability of desired major, (d) ranking of the major, (e) ranking of the
college/university, and (f) SAT/ACT requirements. College recruitment variables
considered by respondents included the recruitment methods used by
colleges/universities to attract prospective students.
Respondents also rated the importance of (a) brochures, (b) college visits, (c)
college fairs, (d) admission representatives at the high school, (e) early admission
decisions, and (f) general websites. Advice received variables asked respondents about
the people who gave them advice and the importance they placed on the advice.
Respondents were asked to rate the importance of advice they received from multiple
sources as follows: (a) church leader, (b) program advisor, (c) employer, (d) family, (e)
friend, (f) school counselor, and (g) mentor. In addition to the responses previously
mentioned (not important, somewhat important, and very important), respondents could
select not applicable (N/A) for advice they did not receive. (For example, if
respondents did not receive advice from their friends, they could select N/A for this
source.)
Barriers to College Access
Respondents were asked about potential barriers to college attendance. Although
the word “barriers” did not appear on either of the two surveys, participants were asked
to identify all of the factors that may have restricted, affected, and influenced their
72
college attendance decision. Three barrier categories (in addition to the previously
mentioned financial barriers) were presented in separate questionnaire items; the three
categories were academic barriers, college preparation barriers, and personal barriers.
All barrier items allowed respondents to write in their own barriers, and or select “none
of the above.” All barriers were stated negatively (such as low high school GPA) to
minimize misinterpretation. Academic barriers included (a) insufficient credits in core
curriculum, (b) low GPA, (c) low SAT/ACT scores, and (d) low state-administered
standardized content exam score.
College preparation barriers that may have affected higher education decisions
included (a) lack of knowledge about admission processes, (b) limited knowledge of
education options, (c) inadequate college planning and preparation, and (d) poor
guidance through the college admission process. To learn which personal barriers (or
limitations) students faced, respondents were asked to indicate all of the statements with
which they agreed. The following statements were included as item choices to
summarize the personal factors that may have limited higher education decisions.
1. Family/parent(s) wanted me to stay close to home
2. I wanted to stay close to home
3. I did not want to attend college
4. I wanted to work full-time
5. Family/parent(s) did not want me to attend college
6. Responsibility to help parents/family
7. Responsibility to raise child(ren) of my own
73
The barriers section included factors that may have limited respondents’ college choices
and access. Some circumstances, such as a desire to stay close to home, might not have
been seen as barriers by the respondents; yet, we know that even these variables can
limit the educational options considered by respondents.
Satisfaction with College Attendance Decisions
Unlike the other measures in this survey, which assessed the processes that led
up to the decision to attend college, this item attempted to measure respondents’
thoughts about their college attendance decisions after the decisions were made.
Satisfaction and dissatisfaction with their college attendance decisions could indicate a
student’s likelihood of persisting through college to degree completion. Satisfaction
was measured in three areas, including the decision to attend college, the college
attended, and the academic major chosen. A five-point scale was used for this variable;
the scale ranged from very dissatisfied to very satisfied, with “unsure” at the middle of
the scale.
Respondents were also asked to share, in textual summaries, the reasons for their
satisfaction and dissatisfaction with their higher education decisions. Respondents
further indicated whether they would have chosen to attend a different college if given a
chance to choose again. They also shared whether they would have changed the
decision to/not to attend college at all. Both of the preceding items were coded as
dichotomous (yes or no) variables. Finally, another dichotomous variable asked
whether the respondents’ current college was their first choice. Responses to this item
could indicate the likelihood of transferring to another college, or could indicate that
74
additional barriers may have prevented respondents from attending their first choice
colleges.
Dependent Variables
At the onset, this research sought to understand the variables related to college
attendance (attending or not attending). The respondents in the sample, however, had a
93 percent college attendance rate. Because the majority of respondents did attend
college, the primary dependent variable in this research is the type of college attended:
four-year college/university, or two-year/community college. Primary analysis is
performed on the type of college (2-year vs. 4-year) because the sample size of
respondents not attending college was insufficient for comparative analysis. Secondary
analysis is performed, comparing the independent variables to college attendance
(attending or not attending).
Description of Sample
Sample Demographics
Program records identified students’ race and ethnicity for comparative analyses
of these variables; survey instruments did not ask students to identify their race and
ethnicity. Identifying data, including name, gender, high school attended, and family
status, was missing for 14 of the 70 respondents. Out of the 56 respondents who
provided identifying information, 24 (43%) attended high school A, 8 (14%) attended
high school B, and 24 (43%) attended high school C. The respondent sample was
representative of the program participants by gender (near 50:50), with males
representing 45 percent of the sample, and females representing 55 percent of the
75

sample. Male students attended college at a higher rate (82%) than did female students
(76%). Analyzing the respondent sample by race finds that most (77%) of the
respondents were Latino, consistent with population demographics; the sample was 18
percent African American, 3 percent Asian, and 2 percent Caucasian. Table 4 details
race/ethnicity, gender, high school attended, and college type for all program
participants who began the senior year in fall of 2007, graduating class of 2008 (189),
149 program participants who were attending college during the spring of 2009, in
addition to the 70 survey respondents.
Further analysis revealed that in the final respondent sample, school B (a
predominantly African American school) was undersampled, as were African
Americans. School B enrolled 24 percent of college goers, but only 14 percent of
School B’s students responded to the survey. Likewise, African Americans accounted
for 27 percent of college goers, and only 18 percent of respondent sample.
Consequently, Latino students were over sampled in the respondent sample. In contrast
to school B, school A was oversampled; school A enrolled 29 percent of the program’s
students yet 43 percent of respondents were from school A. The respondent sample was
generally representative of the program’s college going population by type of college
attended. Refer to Table 4 for program population and sample demographics.
76

77
Table 4. Characteristics of the Program Participants (HS graduates), College Attendees, and Respondent Sample
Characteristic
High school graduates Fall 2007
N=189
College attendees
Spring 2009 N=149
Respondent sample (70 respondents; 14
missing information)
N=56 High School Attended A B C
29% (55) 24% (46) 47% (88)
29% (43) 24% (36) 47% (70)
43% (24) 14% (8) 43% (24)
Gender Male Female
42% (80) 58% (109)
44% (66) 56% (83)
45% (25) 55% (31)
Race/Ethnicity African American Asian Caucasian Latino Other race
25% (47) 3% (5) 1% (2)
71% (134) 1% (1)
27% (40) 3% (4)
<1% (1) 70% (104)
0% (0)
18% (10) 3% (2) 2% (1)
77% (43) 0% (0)
College Type Not attending Technical school Community college 4-yr college/university
21% (40) 2% (4)
42% (80) 33% (65)
0% (0) 2% (4)
54% (80) 44% (65)
7% (5) 0% (0)
49% (34) 44% (31)
Note. Program records were not available for the 40 high school graduates who did not attend college.
Enrollment Status
The majority (93%) of respondents attended college; more respondents attended
community colleges (40%) than four-year colleges (44%); 7 percent of respondents did
not attend college. With 93 percent of participants currently attending college, college
attendees were oversampled in this research; the program’s college attendance rate was

77 percent. Participants who were attending college were completing the second
semester of their freshman year at the time of this survey. Most of the students who
were currently attending college (72%) were enrolled full-time; 16 (25%) of them
enrolled in 15 or more semester credit hours. Eighteen (28%) were enrolled part-time;
six (9%) of them enrolled in six or fewer semester credit hours. SAT scores were
available for 46 participants; the mean combined critical reading, math, and writing
SAT score was 1233, with a possible range of 600 to 2400. ACT scores were available
only for 11 college attendees; the mean ACT score was 18, with a possible range of 1 to
36.
Instrumentation
This study invited respondents to complete one of two surveys. The “currently
attending college” survey contained five sections noted in the research method section.
The survey was an on-line questionnaire with 40 items in addition to a demographic
section. There were 34 closed-ended items, many of which included a fill in box for
student-generated responses, in addition to six open-ended items with textboxes for
brief student narratives. Table 5 and Table 6 detail the items in each section of the two
questionnaires.
Table 5. Currently Attending College – Item Description
Section heading Item description Closed-or open-ended
I. Educational experiences
Educational status closed with “other” box
Why attended chosen college open Ultimate educational goal closed
78

79
Why desire college education closed with “other” box
Education of parents closed Community members who attended college
closed with “other” box
II. Factors of influence
Most important information sources closed with “other” box
Relative rank of factors considered closed with “other” box
Academic barriers closed with “other” box
College preparation barriers closed with “other” box
III. Decision-making
Information resources used closed College; relationship; academic; financial; college admission factors
closed - Likert
Presence of mentor yes or no IV. Satisfaction Satisfaction with decision to attend
college, college attended, major chosen closed - Likert
Satisfaction with higher education decisions
open – text boxes
Dissatisfaction with higher education decisions
open – text boxes
Desire for different choices yes or no Changes desires open – text boxes
V. Preparation and recommendations
Grade level when decided about college closed Preparation to enter and graduate college closed - Likert Motivation closed – Likert Importance of financial awards closed - Likert How college plans would have differed without program
closed
Likelihood of attending college without program
closed – Likert
Recommendations open – text boxes VI. Demographic information Name, address, family status varied
Table 5 (continued)
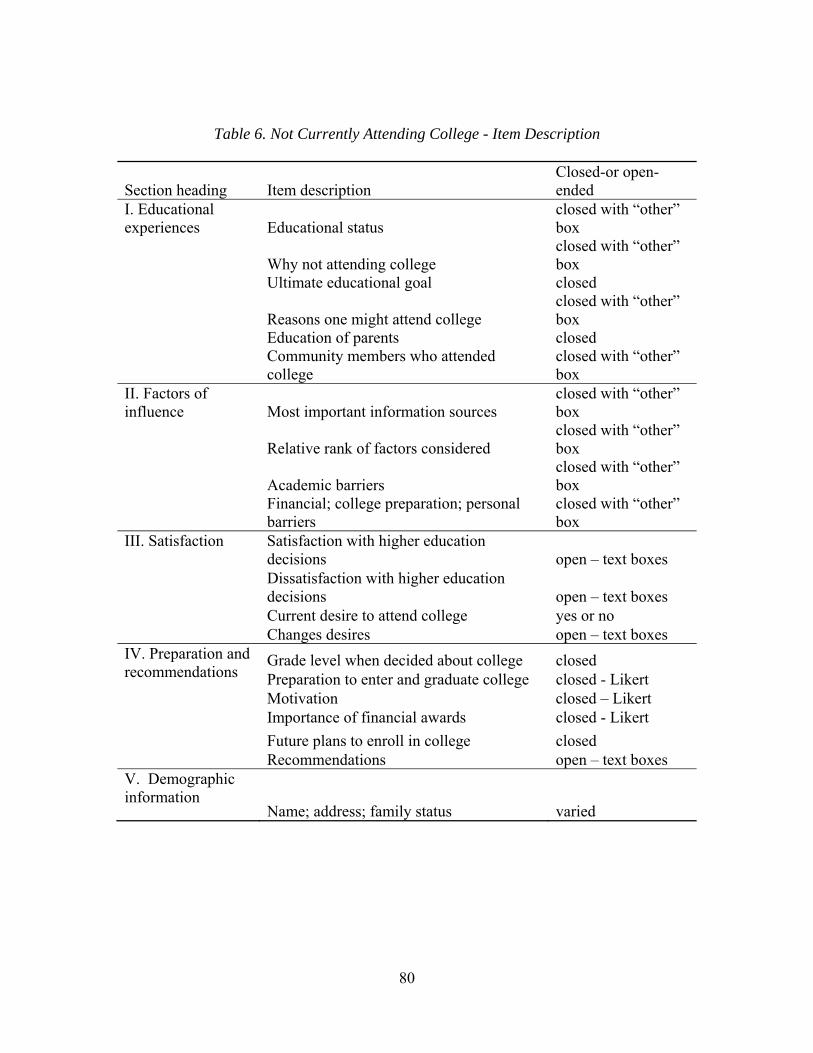
Table 6. Not Currently Attending College - Item Description
Section heading Item description Closed-or open-ended
I. Educational experiences Educational status
closed with “other” box
Why not attending college closed with “other” box
Ultimate educational goal closed
Reasons one might attend college closed with “other” box
Education of parents closed Community members who attended college
closed with “other” box
II. Factors of influence Most important information sources
closed with “other” box
Relative rank of factors considered closed with “other” box
Academic barriers closed with “other” box
Financial; college preparation; personal barriers
closed with “other” box
III. Satisfaction Satisfaction with higher education decisions open – text boxes Dissatisfaction with higher education decisions open – text boxes Current desire to attend college yes or no Changes desires open – text boxes
IV. Preparation and recommendations
Grade level when decided about college closed Preparation to enter and graduate college closed - Likert Motivation closed – Likert Importance of financial awards closed - Likert Future plans to enroll in college closed Recommendations open – text boxes
V. Demographic information
Name; address; family status varied
80

Program administrators familiar with the content of the program provided
information on educational attainment goals. The program aims to increase educational
attainment for its students by focusing on college readiness, social and cultural
competence, financial awards, college access, and college retention. Literature
regarding college attendance and educational attainment and the barriers to college
access faced by low-income minorities was reviewed. In addition to literature, the
researcher obtained and reviewed program documents, such as strategic plans, student
contracts, course outlines, and students’ standardized test scores. A review of the
literature and institutional documents served as the bases for the development of the
survey instrument.
To maximize survey completion rates, the researcher introduced the study to
program participants via e-mail. The introduction explained the research goals,
methods, and procedures; the introduction also requested student participation (see
Appendix C). The introductory e-mail message contained links to both of the surveys,
and was sent initially to 134 of the 189 program graduates for whom e-mail addresses
were available. The brief introductory script informed program participants about the
purpose of the study and requested their participation in the study. The introduction
further informed program participants of their rights not to participate, and that whether
they participated had no impact on their status with the program. Finally, the
introduction assured program participants that their confidentiality would be maintained
when reporting research results. No names or identifying elements were kept attached
to participants’ responses.
81
The researcher offered incentives to increase the response rate of the survey. A
$25 Wal-Mart gift card was given to all respondents who provided their contact
information via the on-line survey instrument. The introductory e-mail also informed
program participants that they would receive the $25 gift card if they participated in the
survey. When tracking responses, the researcher recorded a “Y” next to the name of
each student who participated and provided contact information for the gift card. This
tracking allowed the researcher to make additional attempts to reach students who had
yet to complete the survey. The researcher sent weekly e-mail reminders to all non-
respondents. In addition, during weeks two, three, and four of the survey, the
researcher made phone calls to students to solicit their participation. When called by
phone, students were asked for a valid e-mail address to receive the survey via e-mail,
and some students chose to complete the survey by phone. During the final week of
data collection, the researcher promoted via e-mail three $100 Visa gift card drawings.
All students who participated in the research and provided their contact information
were eligible. When students provided their names and contact information at the end
of the survey [for purposes of receiving the gift card(s)], the researcher omitted their
names from their responses for analysis so that students’ responses were not associated
with identifying information. The University of Texas at Arlington Institutional Review
Board approved the study.
Summary
This chapter presented the research method for the current case study, as well as
the variables being measured and descriptions of how each was measured. Chapter 4
82
83
presents the findings of this case study. In chapter 4, responses of the 70 survey
participants are combined with program record data in order to analyze the higher
education decisions that respondents made, including the decision of whether to attend
college, and which type of college to attend (four-year college or community college).
Chapter 4 analyzes the relationships between independent variables and the dependent
variables, college attendance and type of college attended. Finally, in chapter 4,
research questions are answered regarding how low-income minority students made
their college attendance decisions. Chapter 4 also explores how prepared students felt
to enter college, and the factors they considered to make their college attendance
decisions. In Chapter 4, the role of funding in the college attendance decision is
presented, followed by a discussion of barriers to college attendance, and the reasons
why low-income minority students in the study attended a community college more
often than a four-year college.

CHAPTER IV
THE FINDINGS
Dependent Variable – College Attendance
The purpose of this research was to understand how low-income minority
students made their college attendance decisions, including the decision of whether to
attend college. To answer the research questions, a case study of participants in a
college readiness and college access program was conducted, using survey research.
Almost all respondents in this study (93%) were college attendees; 49 percent attended
a two-year/community college and 44 percent attended a four-year college/university.
The respondent sample was mostly Latino (77%) and African American (18%). The
respondent sample was 45% male and 55% female. All respondents had attended one
of three high schools in which the program operated during the 2007-2008 school year.
Over 79 percent of students in the three schools received free or reduced lunch,
indicating that they were from low-income households.
This chapter first presents descriptive statistics of four independent variables, (a)
enrollment status, (b) student motivation, (c) educational goals, and (d) parental marital
status and education, as they relate to the dependent variable, college attendance (and
college type). Then, it explores how the conceptual independent variables [e.g. (a)
preparedness, (b) financial considerations, (c) factors considered, and (d) perceived
84

85
barriers] related to college attendance. Because the overwhelming majority of
respondents were currently attending college, college attendance, for the purpose of this
research, was measured in two ways: whether a respondent attended college and the
type of college attended (i.e., 2-year/community college or 4-year
college/university). The latter was the primary measurement of this dependent variable.
Finally, the summary integrates the findings to answer the four research questions
presented in chapter 2. Findings are presented using descriptive statistics and, when
applicable, chi-square tests and t-tests to determine relationships between independent
and dependent variables.
Enrollment Status
The college attendance rate of the program far exceeded that of the school
district in which it operates; 77 percent of program graduates attended college compared
to 52 percent of all high school graduates in the state, and 36 percent of high school
graduates in the school district where the program operates. Program participants had
one main advantage over their peers who were not in the program. All program
participants were guaranteed full tuition funding for in state, public colleges and
universities. Although almost all respondents attended college, 49 percent attended
community college, compared to 44 percent who attended four-year colleges. The
reasons why respondents chose community college over a four-year college are
explored in this chapter. Female students (62%) were more likely to attend a four-year
86
college than were male students (42%), although no statistical relationship was found
between gender and college type [χ2 (1, N=52) =1.88, p= .171].
The majority of all college attendees were enrolled full-time; 72 percent were
taking 12 or more semester credit hours. Students enrolled in four-year
colleges/universities (M=14.03, SD= 1.6) took significantly more credit hours during
the semester than those attending two-year/community colleges (M=10.09, SD= 3.5115)
[t (63) = 5.72, p <.01]. Although all college attendees were expected to enroll full-time
to remain eligible for unconditional funding renewal from the program, students
attending four-year colleges were much more likely to be enrolled full-time compared
to students enrolled in a community college. In fact, all of the four-year college
students were enrolled full-time; only 47 percent of community college students were.
Some part-time students were permitted to remain eligible in the program after
undertaking a successful review process. A statistically significant relationship was
found between the number of credit hours taken each semester and the type of college
attended [χ2 (2, N=65) = 22.70, p <.01].
Motivation and Educational Goals
Motivation promotes the attainment of educational goals for minority students
(Goldsmith, 2004; Portes & Wilson, 1976), and a lack of student motivation has been
named as a barrier to educational attainment for minority students (Cammorata, 2007;
Dumais, 2002; Feagin et al., 1996; Steele, 1997; McDonald & McMillan, 2007).
Notwithstanding, 68 percent of participants in this study, including those who were not

87
currently attending college, reported being very motivated to attend college. An
analysis of the relationship between motivation and college type (Table 7) showed that
a slightly higher percentage of respondents attending four-year colleges were reportedly
very motivated (74%) compared to respondents attending two-year colleges (64%) or
no college (50%). The findings were notable, but not statistically significant.
Table 7. Crosstabulation of College Type and Personal Motivation (N=56)
Motivation rating College type
4-yr 2-yr No college
Not motivated 4% (1)
0% (0)
0% (0)
Somewhat motivated 22% (6)
36% (9)
50% (2)
Very motivated 74% (20)
64% (16)
50% (2)
Although study participants reported high motivation to attend college, their
goals were recently formed. Most participants reported coming to the desire for a higher
education only during their high school years. Participants attending two-year (48%)
and four-year colleges (52%) were equally likely to respond that they first began
considering college while they were in high school. On the other hand, among those
who had considered college before high school, 48 percent of them attended four-year
colleges and 41 percent attended two-year colleges, compared to 11 percent who did not
attend college. Refer to Table 8. Nonetheless, when respondents first considered
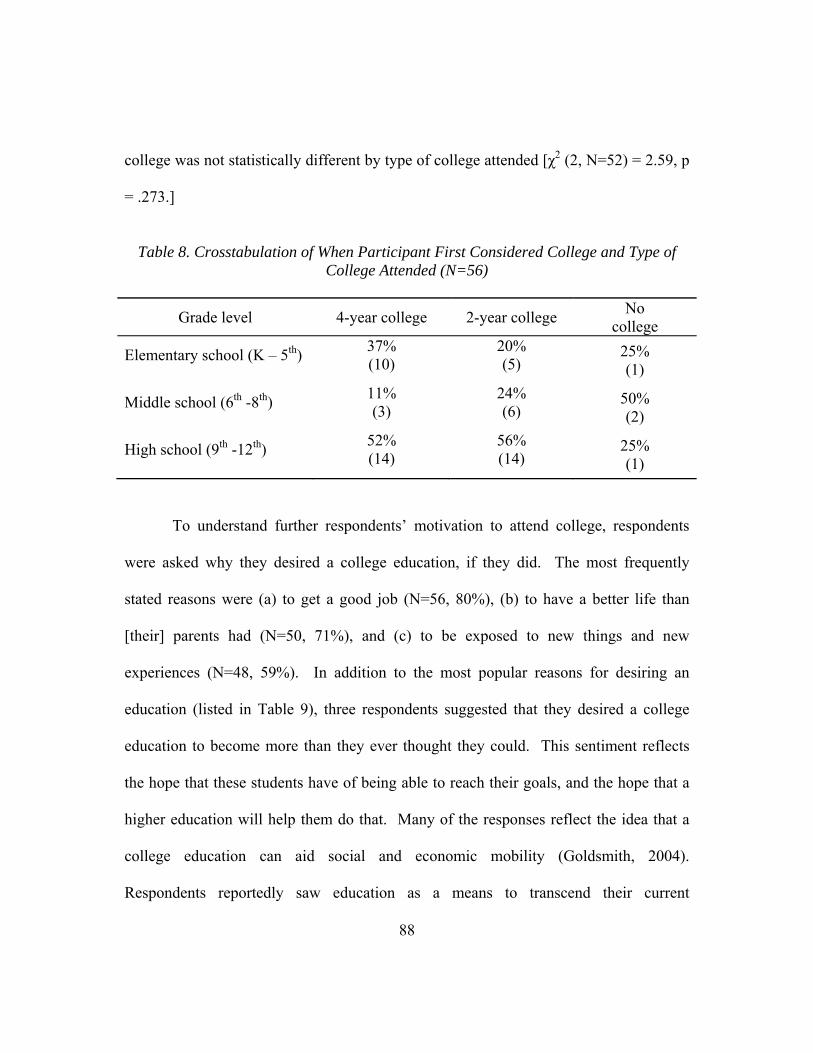
88
college was not statistically different by type of college attended [χ2 (2, N=52) = 2.59, p
= .273.]
Table 8. Crosstabulation of When Participant First Considered College and Type of
College Attended (N=56)
Grade level 4-year college 2-year college No college
Elementary school (K – 5th) 37% (10)
20% (5)
25% (1)
Middle school (6th -8th) 11% (3)
24% (6)
50% (2)
High school (9th -12th) 52% (14)
56% (14)
25% (1)
To understand further respondents’ motivation to attend college, respondents
were asked why they desired a college education, if they did. The most frequently
stated reasons were (a) to get a good job (N=56, 80%), (b) to have a better life than
[their] parents had (N=50, 71%), and (c) to be exposed to new things and new
experiences (N=48, 59%). In addition to the most popular reasons for desiring an
education (listed in Table 9), three respondents suggested that they desired a college
education to become more than they ever thought they could. This sentiment reflects
the hope that these students have of being able to reach their goals, and the hope that a
higher education will help them do that. Many of the responses reflect the idea that a
college education can aid social and economic mobility (Goldsmith, 2004).
Respondents reportedly saw education as a means to transcend their current
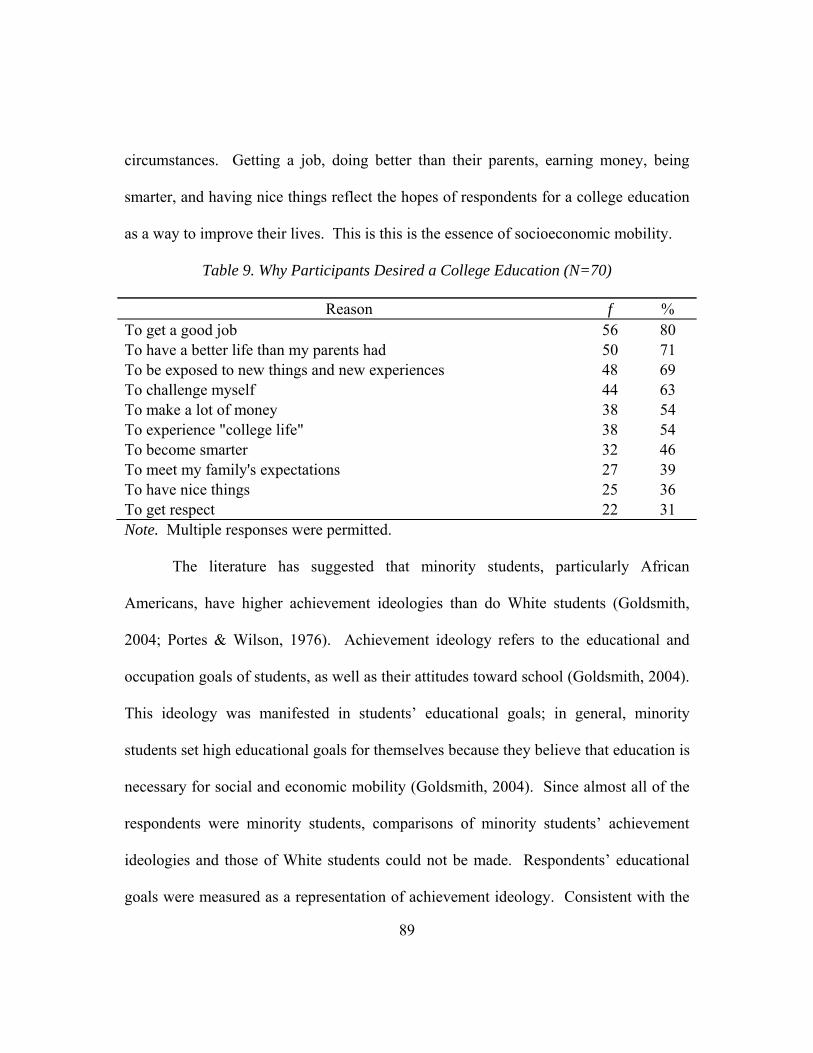
89
circumstances. Getting a job, doing better than their parents, earning money, being
smarter, and having nice things reflect the hopes of respondents for a college education
as a way to improve their lives. This is this is the essence of socioeconomic mobility.
Table 9. Why Participants Desired a College Education (N=70)
Reason f % To get a good job 56 80 To have a better life than my parents had 50 71 To be exposed to new things and new experiences 48 69 To challenge myself 44 63 To make a lot of money 38 54 To experience "college life" 38 54 To become smarter 32 46 To meet my family's expectations 27 39 To have nice things 25 36 To get respect 22 31 Note. Multiple responses were permitted.
The literature has suggested that minority students, particularly African
Americans, have higher achievement ideologies than do White students (Goldsmith,
2004; Portes & Wilson, 1976). Achievement ideology refers to the educational and
occupation goals of students, as well as their attitudes toward school (Goldsmith, 2004).
This ideology was manifested in students’ educational goals; in general, minority
students set high educational goals for themselves because they believe that education is
necessary for social and economic mobility (Goldsmith, 2004). Since almost all of the
respondents were minority students, comparisons of minority students’ achievement
ideologies and those of White students could not be made. Respondents’ educational
goals were measured as a representation of achievement ideology. Consistent with the

90
literature, the participants in this study had high educational goals. Almost 95 percent
of all participants, including those who were not attending college, reportedly desired to
earn a bachelor’s degree or higher. No significant difference was found between the
stated educational goals of four-year college students and those of community college
students. Further, there was no significant difference between males and females in
their desire to earn a college degree; 93 percent of females and 100 percent of males
desired a bachelor’s degree or higher. African American students (60%) were
somewhat more likely than were Latino students (51%) to desire a bachelor’s degree,
but a greater percentage of Latino students (46%) desired to earn a graduate degree
compared to African American students (30%), although these goals were not
significantly different. Students attending college at four-year institutions (100%) and
two-year institutions (93%) had almost equal goals of earning a bachelor’s degree or
higher, with one obvious and logical exception: none of the four-year college students
intended to earn a training certificate or associate’s degree. (See Table 10.) Regardless
of where they began college (community college or four-year college), respondents
reportedly intended to achieve the same levels of education.
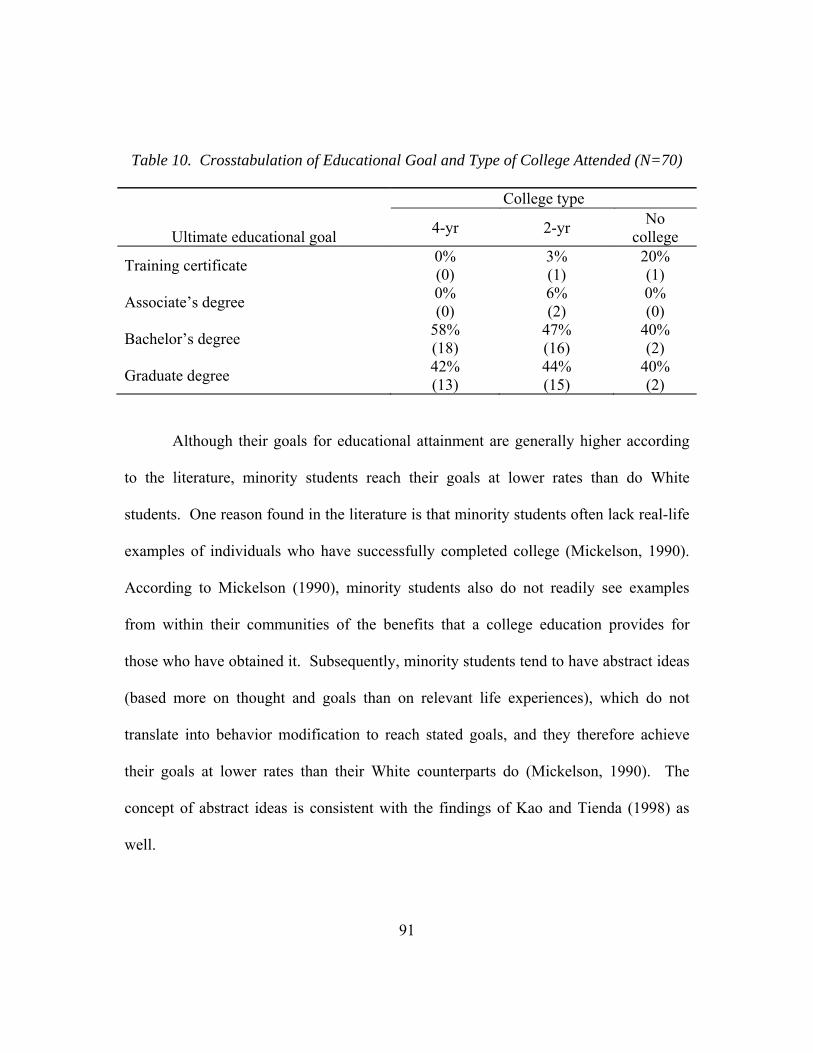
91
Table 10. Crosstabulation of Educational Goal and Type of College Attended (N=70)
Ultimate educational goal
College type
4-yr 2-yr No college
Training certificate 0% (0)
3% (1)
20% (1)
Associate’s degree 0% (0)
6% (2)
0% (0)
Bachelor’s degree 58% (18)
47% (16)
40% (2)
Graduate degree 42% (13)
44% (15)
40% (2)
Although their goals for educational attainment are generally higher according
to the literature, minority students reach their goals at lower rates than do White
students. One reason found in the literature is that minority students often lack real-life
examples of individuals who have successfully completed college (Mickelson, 1990).
According to Mickelson (1990), minority students also do not readily see examples
from within their communities of the benefits that a college education provides for
those who have obtained it. Subsequently, minority students tend to have abstract ideas
(based more on thought and goals than on relevant life experiences), which do not
translate into behavior modification to reach stated goals, and they therefore achieve
their goals at lower rates than their White counterparts do (Mickelson, 1990). The
concept of abstract ideas is consistent with the findings of Kao and Tienda (1998) as
well.
92
Mickelson (1990) found that White and middle- to high-income students,
conversely, have concrete ideas, formed by experience, with everyday examples of
people who have benefitted from a college education; subsequently, they reach their
goals at higher rates than do low-income minorities. To measure whether respondents
formed their educational aspirations based on experience (concrete ideas), the current
study asked participants if they knew people in their communities who attended college,
and if so, who. Most of the respondents (80%) knew someone who had attended
college, although few of them (20%) knew close family members who attended college.
Community college students (87%) were more likely than four-year college students
(80%) to report knowing someone who attended college.
Almost all of the respondents in this survey reported having friends who
attended college. Few of them had family members who had attended college. Having
friends who attended college may have contributed to the high college attendance rate
within the respondent group (93%) and within the sample at large (77%). A possible
explanation for higher college attendance rates for this group is the development of
social networks through the program with established group norms and expectations of
college attendance. Social capital is strengthened through relationships, networks, and
group affiliation (Putnam, 2000). Bourdieu found that academic achievement and
educational attainment were dependent on the expectations a student holds for people
within their social class (Swartz, 1997). As mentioned in Chapter 2, group affiliation
and peer support are two ways that the program strengthens the social capital of its
93
students. Seeing people from the same social class who attended college probably
made respondents’ goals of educational attainment more concrete and relevant to their
actual experiences, and aided college attendance for the respondents in this study.
Concrete ideas of achievement have been found to aid goal attainment
(Mickelson, 1990). Although low-income minority students have disproportionately
low college attendance rates, the majority of respondents (56%) who knew someone
who attended college, themselves attended four-year colleges and universities. The
findings of this study were consistent with the literature, finding that the majority of
students who knew someone who attended college also attended college. Differences
by college type were not significant.
Parent Marital Status and Highest Education Level
Parents’ marital status and educational attainment influence social and cultural
capital, and subsequently the social and cultural capital of their children. As the
literature illustrated, both social and cultural capital promote academic achievement,
college attendance, and educational attainment. Attending college and earning a college
degree exposes people to the values, norms, customs, and possessions of the dominant
class. Possessing high levels of cultural capital, through their own education, would
strengthen parents’ knowledge of college preparation, admission, and funding
processes, and help parents to assist their children in these processes.
Without strong cultural capital, however, parents rely on social capital to
promote their children’s educational pursuits. The literature found that social capital
94
was the easiest of all capital types for parents to build to aid their students’ educational
attainment. Even if parents have not attended college, and have low levels of cultural
capital, they could establish strong bridging capital to promote higher education for
their children (Putnam, 2000). Bridging capital includes the relationships, group
affiliations, and social networks that connect parents to others who possess higher levels
of cultural capital. Through bridging capital, parents can be exposed to the cultural
knowledge needed to promote upward socioeconomic mobility for their children.
Yan (1999) found that single parents on average had less opportunity to interact
with children than did married parents. Social capital is transmitted by parents to
children and is strengthened through increased interaction between parent and child,
particularly when that interaction is focused on their children’s goals and other issues
that are relevant to children (Yan, 1999). Because of the limited parent-teen interaction,
Yan (1999) found that single parents transmit lower levels of social capital to their
children than do married parents. This finding most likely implies that bonding capital
may be lower for single parent households than for two parent households, because two
parents would generally have more time to spend with their children (Yan, 1999).
Single parenting was found to be one of many limitations to social capital building for
low-income minority students (Yan, 1999).
The current study found a direct relationship between living with both parents
and attending college. Respondents who lived with both parents were more likely to
attend college, and more likely to attend four-year colleges than respondents who did

95
not live with both parents. Respondents who attended college (42%) were more likely
to live with both parents than were respondents who did not attend college (20%).
Additional analysis found that of all respondents who lived with both parents, 54
percent attended a four-year college, 43 percent attended a community college, and 3
percent did not attend college. Respondents who lived with both parents were most
likely to attend a four-year college, and least likely to not attend college. Although the
current study found a relationship between parents’ marital status and their children’s
education, the reasons for this should be explored further. The current study does not
imply that single parents cannot successfully promote and support college attendance
for their children.
Previous research has found that children whose parents have attended college
are themselves more likely to attend college (Bourdieu, 1973). This is because these
parents possess higher levels of cultural capital compared to parents who have not
attended college. Participants were asked their parents’ highest education level
attained. Only six percent of parents held a bachelor’s degree (one 4-yr. college parent
and three 2-yr. college parents); no parents had education beyond the bachelor’s degree.
Almost a third (31%) of parents had not completed high school; 43% of parents who
had not completed high school did not even attend high school. (Refer to Table 11.)
Parents of four-year college attendees had slightly higher levels of education (M = 2.65,
SD = 1.684) than did parents of two-year college students (M = 2.44, SD = 1.618). The
parents in this study had low levels of cultural capital, as measured by a lack of college

96
credentials. Notwithstanding, the majority of respondents in this study attended college.
Regardless of their dominant cultural capital, parents can develop bridging capital to
move students beyond the traditional outlook of their social class. The participants in
this study, as with post-war African Americans, saw education as a way for upward
mobility, and pursued it although people of their social class were not expected to do so
(Swartz, 1997).
Parents can strengthen their children’s social capital by setting high educational
goals and expectations, and supporting the same. In order for parents to increase
students’ social capital, therefore, they must communicate with their child about their
educational goals. When asked about the highest education level of their parents,
however, 13 percent of respondents in this study did not know. The fact that some
participants did not know the highest education level of each parent could indicate that
the respondents did not know both parents (single parent), or that education was not
discussed often in the household. If education is not discussed often in the household, it
could therefore weaken social capital development.
Table 11. Highest Education Level of Parent with the Highest Education (N=70)
Education level f % Did not finish HS 22 31 Graduated from HS 24 34 Some college 11 16 Bachelor's degree 4 6 Unknown 9 13

97
Respondents’ Perceived Academic, Cultural and Social Preparation to Attend College
The literature suggests that students with high academic achievement as well as
financial, social, and cultural capital are more likely to attend college than are students
without such capital (Dumais, 2002, Yan, 1999; Bourdieu, 1986; Portes & Wilson,
1976). Having sufficient funding and the ability to succeed academically are important
to college access. It is also important that students are able to build and maintain
relationships that can aid their success (social capital), and that they understand the
culture and processes of college (cultural capital).
Academic Preparedness
Poor academic preparation and underperformance on standardized tests are
barriers to college access, and subsequent educational attainment for minority students
(Fuller, 2002; Opp, 2001; Cantrell, 1999; Steele, 1997; Feagin et al., 1996; Levine and
Levine, 1995). SAT and ACT scores and student perceived preparation were measures
of academic preparedness in the current case study. SAT and ACT are two college
entrance exams designed to predict first year college success; the tests are widely used
by colleges to measures students’ academic preparation for college, and to make
admission decisions. Academic records maintained by the program that included
program participants’ SAT and ACT exam scores were accessed for this study. The
average combined critical reading, math, and writing SAT score for respondents who
attended college (1246) was higher than for respondents who did not attend college
(1092). [Note. The maximum possible score is 2400.] Likewise, respondents at four-
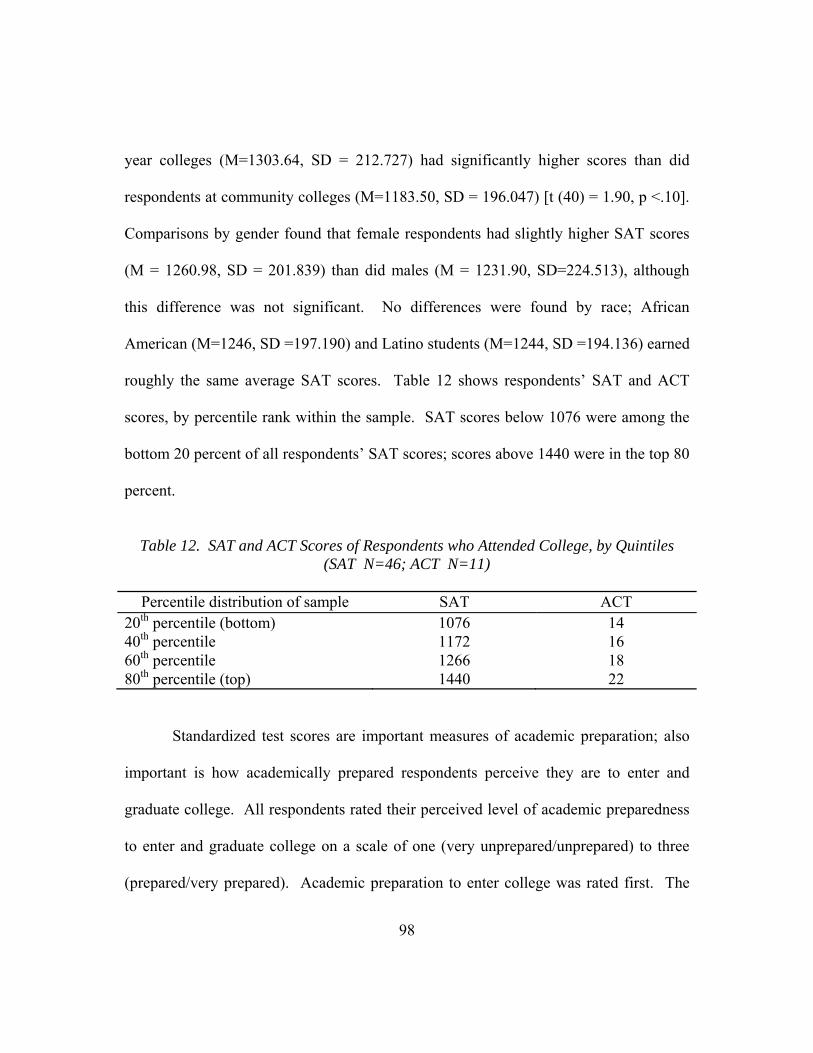
98
year colleges (M=1303.64, SD = 212.727) had significantly higher scores than did
respondents at community colleges (M=1183.50, SD = 196.047) [t (40) = 1.90, p <.10].
Comparisons by gender found that female respondents had slightly higher SAT scores
(M = 1260.98, SD = 201.839) than did males (M = 1231.90, SD=224.513), although
this difference was not significant. No differences were found by race; African
American (M=1246, SD =197.190) and Latino students (M=1244, SD =194.136) earned
roughly the same average SAT scores. Table 12 shows respondents’ SAT and ACT
scores, by percentile rank within the sample. SAT scores below 1076 were among the
bottom 20 percent of all respondents’ SAT scores; scores above 1440 were in the top 80
percent.
Table 12. SAT and ACT Scores of Respondents who Attended College, by Quintiles
(SAT N=46; ACT N=11)
Percentile distribution of sample SAT ACT 20th percentile (bottom) 1076 14 40th percentile 1172 16 60th percentile 1266 18 80th percentile (top) 1440 22
Standardized test scores are important measures of academic preparation; also
important is how academically prepared respondents perceive they are to enter and
graduate college. All respondents rated their perceived level of academic preparedness
to enter and graduate college on a scale of one (very unprepared/unprepared) to three
(prepared/very prepared). Academic preparation to enter college was rated first. The
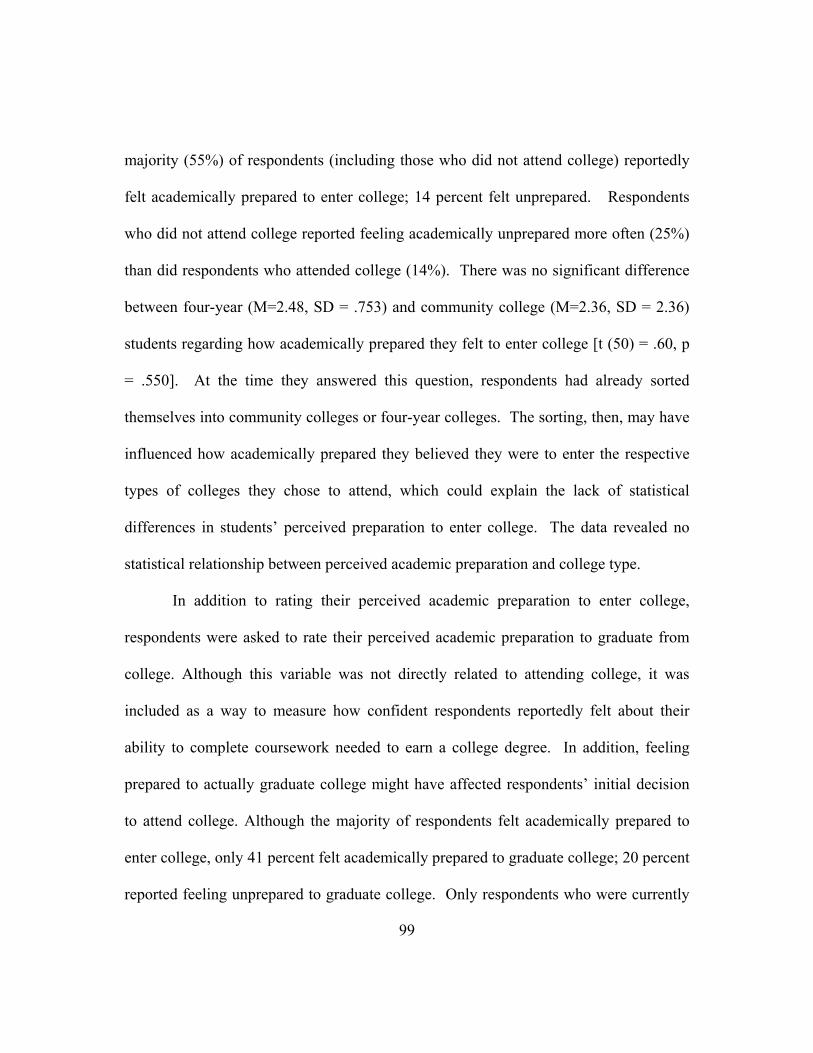
99
majority (55%) of respondents (including those who did not attend college) reportedly
felt academically prepared to enter college; 14 percent felt unprepared. Respondents
who did not attend college reported feeling academically unprepared more often (25%)
than did respondents who attended college (14%). There was no significant difference
between four-year (M=2.48, SD = .753) and community college (M=2.36, SD = 2.36)
students regarding how academically prepared they felt to enter college [t (50) = .60, p
= .550]. At the time they answered this question, respondents had already sorted
themselves into community colleges or four-year colleges. The sorting, then, may have
influenced how academically prepared they believed they were to enter the respective
types of colleges they chose to attend, which could explain the lack of statistical
differences in students’ perceived preparation to enter college. The data revealed no
statistical relationship between perceived academic preparation and college type.
In addition to rating their perceived academic preparation to enter college,
respondents were asked to rate their perceived academic preparation to graduate from
college. Although this variable was not directly related to attending college, it was
included as a way to measure how confident respondents reportedly felt about their
ability to complete coursework needed to earn a college degree. In addition, feeling
prepared to actually graduate college might have affected respondents’ initial decision
to attend college. Although the majority of respondents felt academically prepared to
enter college, only 41 percent felt academically prepared to graduate college; 20 percent
reported feeling unprepared to graduate college. Only respondents who were currently
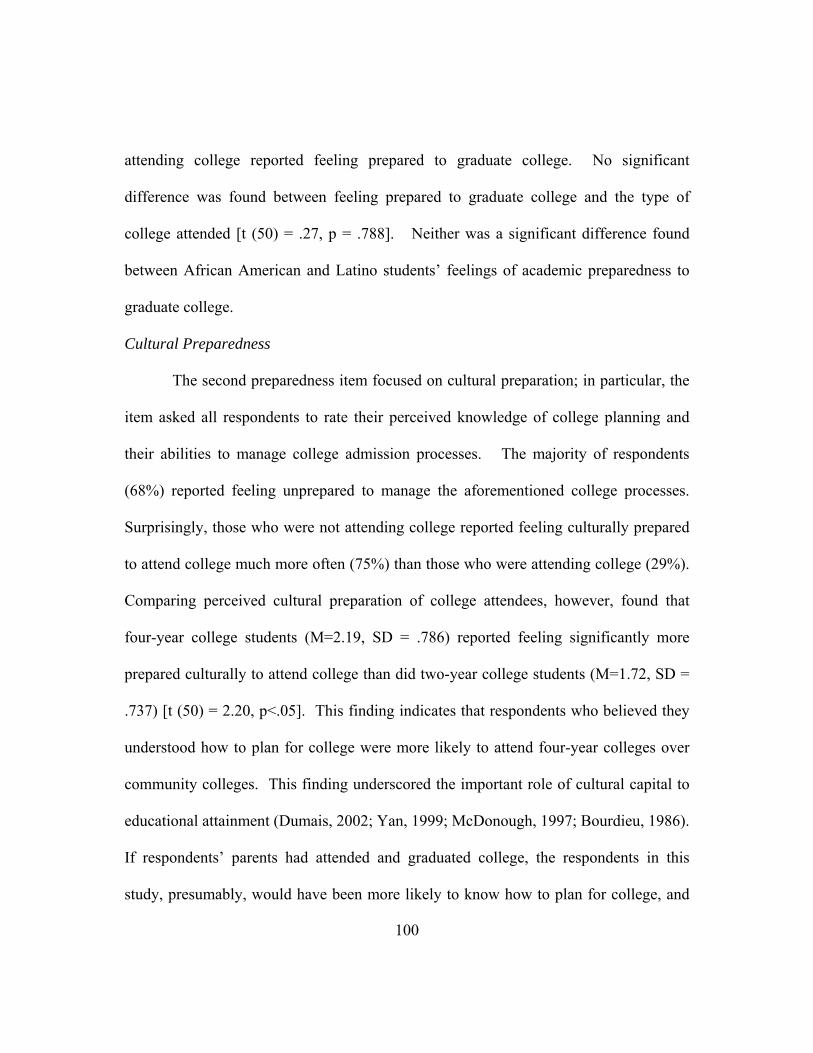
100
attending college reported feeling prepared to graduate college. No significant
difference was found between feeling prepared to graduate college and the type of
college attended [t (50) = .27, p = .788]. Neither was a significant difference found
between African American and Latino students’ feelings of academic preparedness to
graduate college.
Cultural Preparedness
The second preparedness item focused on cultural preparation; in particular, the
item asked all respondents to rate their perceived knowledge of college planning and
their abilities to manage college admission processes. The majority of respondents
(68%) reported feeling unprepared to manage the aforementioned college processes.
Surprisingly, those who were not attending college reported feeling culturally prepared
to attend college much more often (75%) than those who were attending college (29%).
Comparing perceived cultural preparation of college attendees, however, found that
four-year college students (M=2.19, SD = .786) reported feeling significantly more
prepared culturally to attend college than did two-year college students (M=1.72, SD =
.737) [t (50) = 2.20, p<.05]. This finding indicates that respondents who believed they
understood how to plan for college were more likely to attend four-year colleges over
community colleges. This finding underscored the important role of cultural capital to
educational attainment (Dumais, 2002; Yan, 1999; McDonough, 1997; Bourdieu, 1986).
If respondents’ parents had attended and graduated college, the respondents in this
study, presumably, would have been more likely to know how to plan for college, and

101
consequently would have felt better prepared culturally to enter college. Table 13
compares perceived cultural preparedness by college type.
Table 13. Crosstabulation of Perceived Cultural Preparedness to Enter College and
College Type (N=52)
Cultural preparedness rating *
College type 4-yr
N=27 2-yr
N=25
Unprepared/very unprepared 22% (6)
44% (11)
Somewhat unprepared 37% (10)
40% (10)
Prepared/very prepared 41% (11)
16% (4)
* p < .05.
Respondents who were attending college were asked how likely they would
have been to attend college without college planning assistance provided by the
program. College planning components focused on (a) career exploration, (b) life skills
training, (c) college advisement, (d) SAT/ACT test preparation and registration, and (e)
college admission process navigation. Ongoing college planning was designed to
strengthen participants’ familiarity with the expectations and culture of college.
Disturbingly, almost half (48%) of respondents reportedly would not have attended
college without the college planning assistance offered by the program, even with
guaranteed tuition funding. (See Table 14.) This finding underscores a very important
point: more than money is needed to parity college access for low-income students.
This research found that other factors (e.g., social and cultural capital, achievement

102
ideology) are also necessary to improve college access for low-income minority
students.
Table 14. Likelihood of Attending College without College Planning Assistance from
Program (N=52)
Response f %Definitely would have attended college 12 23Probably would not have attended college 4 8Might/not have attended college 11 21Probably would have attended college 19 36Definitely would not have attended college 6 12
Social Preparedness
Student success in college does not happen in a vacuum. Successful students
must manage relationships with peers, faculty, staff, and other members of the college
community who can assist them with reaching their goal of obtaining a college degree.
All respondents were asked to rate their perceived ability to comfortably interact with
the college community (social preparedness) to enter college. The social preparedness
item measured respondents’ ability to interact with the college community in ways that
would foster their academic success (such as social networking). Less than half (43%)
of all respondents believed they were socially prepared to enter college; almost the
same number (39%) believed they were socially prepared to graduate college.
Respondents who attended four-year colleges (M=2.26, SD = .859) and community
colleges (M=2.16, SD = .800) did not differ significantly in how socially prepared they
felt for college [t (50) = .43, p = .669]. Table 15 compares perceived academic,

103
cultural, and social preparedness of all respondents (including respondents who did not
attend college).
Table 15. Perceived Preparation to Enter and Graduate College (N=56)
Category Prepared/very prepared to enter Prepared/very prepared to graduate Academic 31 23Cultural 18 27 Social 24 22
Respondents who attended four-year colleges/universities rated their perceived
cultural preparation for college much higher than respondents who attended community
college. Respondents who did not attend college perceived that they had extremely
low levels of social preparedness for college; none of the respondents who were not
attending college reported feeling socially prepared to attend college. Of the three
preparedness categories, respondents perceived that they were better prepared
academically to enter college than they were socially or culturally. Cultural
preparedness, however, was much more significant than academic or social
preparedness to the type of college attended.
Tuition Costs and Funding
A financial preparedness item, similar in purpose to the preceding preparedness
items, was intended to measure respondents’ feelings of having sufficient financial
resources to pay for college. The financial preparedness item used the same rating scale
as the academic, social, and cultural preparedness items; all respondents were asked

104
about financial preparation to enter and graduate college. Overall, respondents
indicated that they did not feel financially prepared to enter college. Among the four
preparation categories surveyed (academic, social, cultural, and financial), respondents
reported feeling least prepared financially to enter and graduate college; this is despite
the program’s guarantee of full tuition for college. Only 30 percent of all respondents
said they felt financially prepared to enter college. Surprisingly more (34%) felt
financially prepared to graduate college. Significant differences were not found when
comparing by college type, race/ethnicity, or gender. This finding emphasizes how
important college costs are to respondents’ decisions to attend college; even when
tuition is covered, other costs like housing and books that are associated with the cost of
attendance can create additional barriers for low-income minority students. Because
cost is so important, the belief that they have insufficient funding for college is also
important.
To measure the importance of college tuition costs and funding in the college
attendance decision for low-income minorities, respondents who were currently
attending college were asked to rate the importance of college attendance costs (tuition
cost and housing cost) and financial aid sources (grants, scholarships, student loans, and
work-study) to their higher education decisions. Scholarships were the most important
factor, rated very important by 90 percent of respondents. Scholarships were followed
by tuition cost (81%) and grants (72%), in order or importance. Because respondents
rated scholarships as more important than tuition costs, scholarships seemed to have

105
alleviated some of the concern about tuition and student loans. The mean rating for the
aggregate of the financial factors was not significant to the type of college attended [χ2
(2, N=58) = 4.08, p = .130]. However, analyzing each factor independently found that
scholarships were rated most important of all financial factors, (90% rated very
important), but was not statistically significant to college type [χ2 (2, N=58) = .93, p =
.627.]. A statistically significant relationship was found between the type of college
attended and both housing costs [χ2 (2, N=58) = 8.45, p<.05] and grants [χ2 (2, N=58) =
5.37, p <.10]. Housing costs were very significant to the decision of college type such
that housing costs were significantly more important to four-year students (M=2.39, SD
= .832) than two-year students (M=1.77, SD = .817) [t (56) = .05, p<.01]. Grants were
also a more important consideration for four-year students (M=2.82, SD = .476) than for
two-year students (M=2.40, SD = .814) [t (56) = 2.39, p <.05], most likely because
college attendance costs are highest at four-year colleges. The final three variables,
student loans [χ2 (2, N=58) = 3.98, p = .137], tuition cost [χ2 (2, N=58) = 3.63, p =
.163], and work-study [χ2 (2, N=58) = .02, p = .991] were not statistically significant to
college attendance by college type. Table 16 depicts the rating of importance given for
each financial factor.

106
Table 16. Importance of Financial Factors to Higher Education Decision (N=58)
Factor Not important Somewhat important Very important
Scholarships 3% (2)
7% (4)
90% (52)
Tuition cost 5% (3)
14% (8)
81% (47)
Grants (need-based) * 12% (7)
16% (9)
72% (42)
Work-study program 21% (12)
36% (21)
43% (25)
Housing cost** 34% (20)
24% (14)
41% (24)
Student loans 38% (22)
26% (15)
36% (21)
Note. Not all rows total 100% due to rounding. * p < .05. ** p < .01.
Rising tuition costs and a shift from grants to loans have been cited as barriers to
educational attainment for minority students (Levine & Levine, 1995). Student loans
were rated unimportant by 38 percent of respondents in this study. For some
respondents, the program’s guarantee of full tuition financing (through gap funding
scholarships) may have alleviated the financial burdens of tuition and student loans,
mitigating barriers created by college costs, and making college cost considerations
secondary to funding considerations. If so, program-provided funding would therefore
expand college choice for participants. Respondents who were currently attending
college ranked the importance of multiple financial needs relative to each other: (a)
tuition cost, (b) housing cost, (c) book cost, (d) technology cost, (e) loan needs, (f) grant
needs, and (g) income needs. The ranking was from one (most important) to seven
(least important).
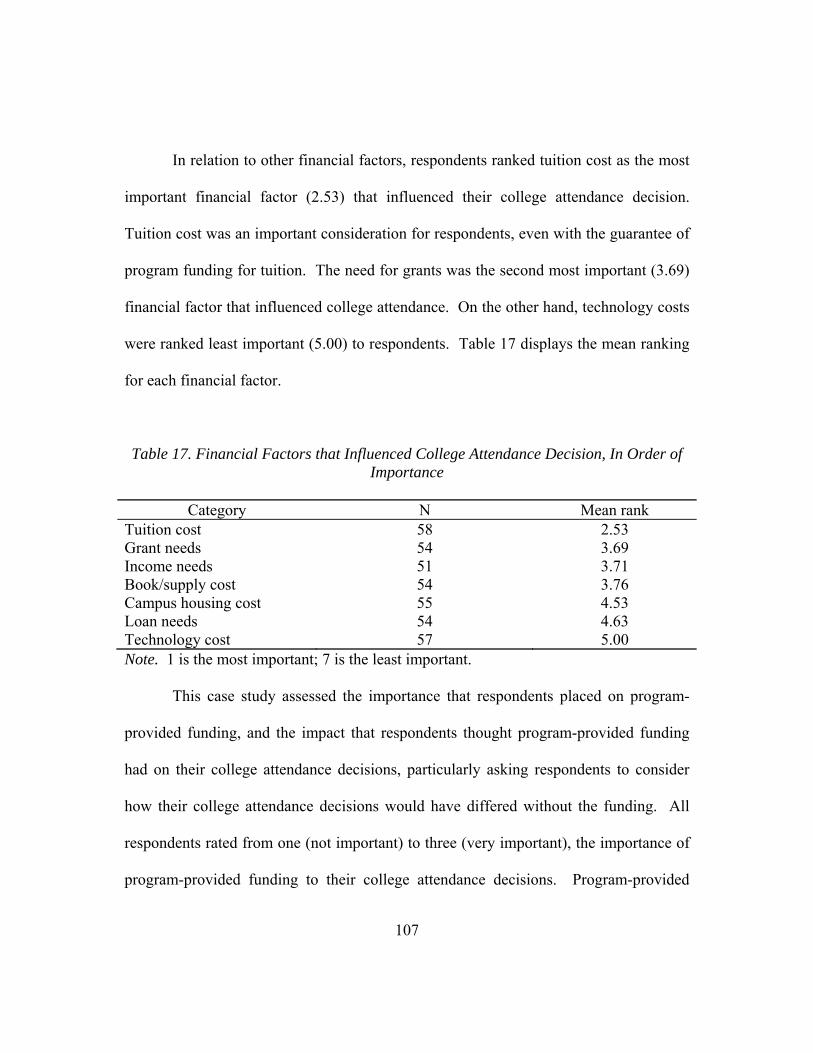
107
In relation to other financial factors, respondents ranked tuition cost as the most
important financial factor (2.53) that influenced their college attendance decision.
Tuition cost was an important consideration for respondents, even with the guarantee of
program funding for tuition. The need for grants was the second most important (3.69)
financial factor that influenced college attendance. On the other hand, technology costs
were ranked least important (5.00) to respondents. Table 17 displays the mean ranking
for each financial factor.
Table 17. Financial Factors that Influenced College Attendance Decision, In Order of Importance
Category N Mean rank
Tuition cost 58 2.53 Grant needs 54 3.69 Income needs 51 3.71 Book/supply cost 54 3.76 Campus housing cost 55 4.53 Loan needs 54 4.63 Technology cost 57 5.00 Note. 1 is the most important; 7 is the least important. This case study assessed the importance that respondents placed on program-
provided funding, and the impact that respondents thought program-provided funding
had on their college attendance decisions, particularly asking respondents to consider
how their college attendance decisions would have differed without the funding. All
respondents rated from one (not important) to three (very important), the importance of
program-provided funding to their college attendance decisions. Program-provided
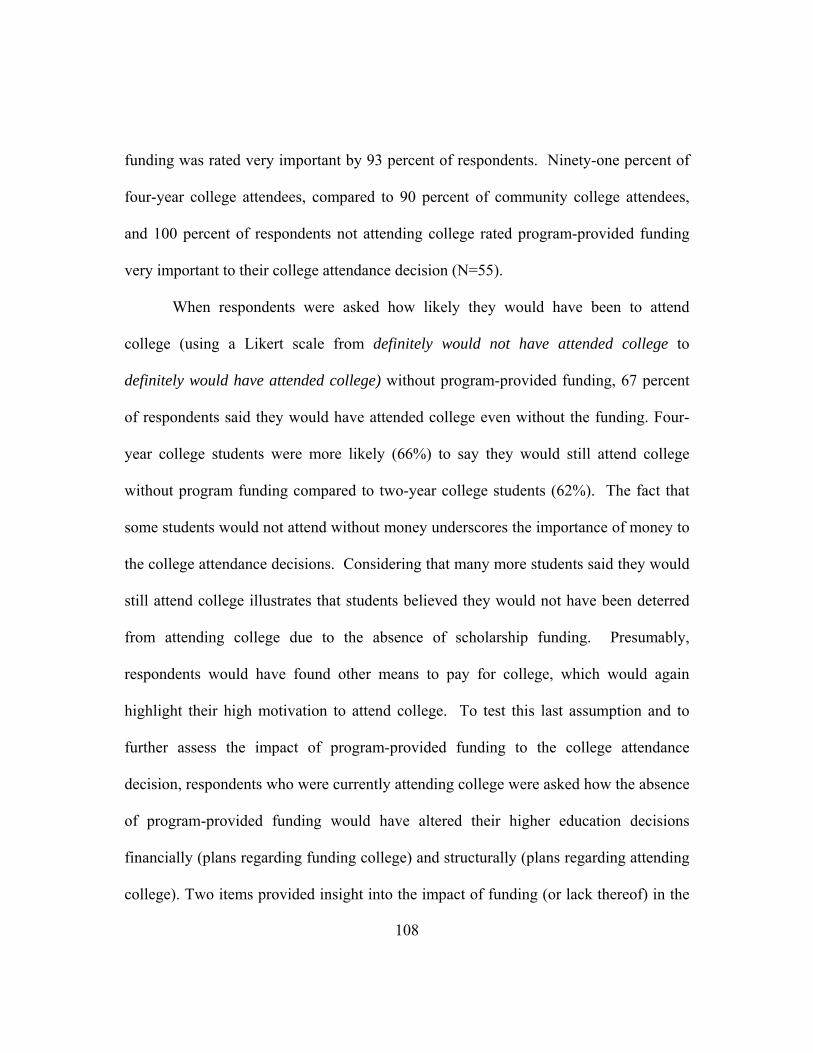
108
funding was rated very important by 93 percent of respondents. Ninety-one percent of
four-year college attendees, compared to 90 percent of community college attendees,
and 100 percent of respondents not attending college rated program-provided funding
very important to their college attendance decision (N=55).
When respondents were asked how likely they would have been to attend
college (using a Likert scale from definitely would not have attended college to
definitely would have attended college) without program-provided funding, 67 percent
of respondents said they would have attended college even without the funding. Four-
year college students were more likely (66%) to say they would still attend college
without program funding compared to two-year college students (62%). The fact that
some students would not attend without money underscores the importance of money to
the college attendance decisions. Considering that many more students said they would
still attend college illustrates that students believed they would not have been deterred
from attending college due to the absence of scholarship funding. Presumably,
respondents would have found other means to pay for college, which would again
highlight their high motivation to attend college. To test this last assumption and to
further assess the impact of program-provided funding to the college attendance
decision, respondents who were currently attending college were asked how the absence
of program-provided funding would have altered their higher education decisions
financially (plans regarding funding college) and structurally (plans regarding attending
college). Two items provided insight into the impact of funding (or lack thereof) in the
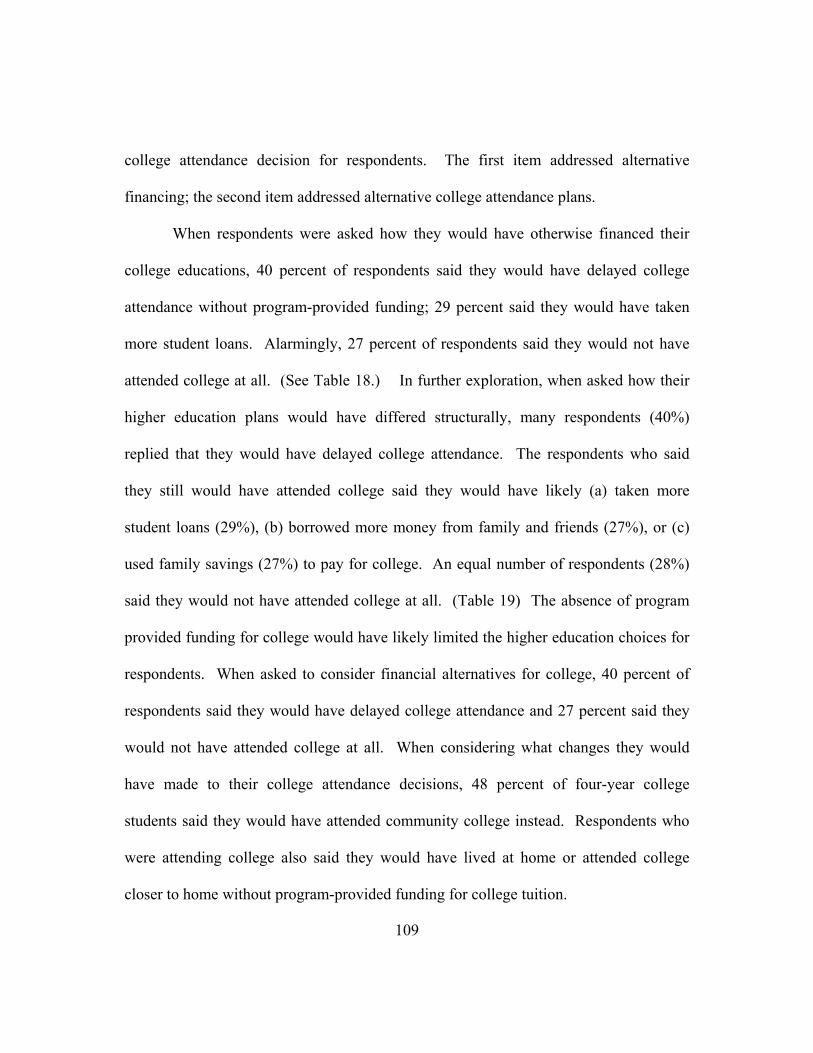
109
college attendance decision for respondents. The first item addressed alternative
financing; the second item addressed alternative college attendance plans.
When respondents were asked how they would have otherwise financed their
college educations, 40 percent of respondents said they would have delayed college
attendance without program-provided funding; 29 percent said they would have taken
more student loans. Alarmingly, 27 percent of respondents said they would not have
attended college at all. (See Table 18.) In further exploration, when asked how their
higher education plans would have differed structurally, many respondents (40%)
replied that they would have delayed college attendance. The respondents who said
they still would have attended college said they would have likely (a) taken more
student loans (29%), (b) borrowed more money from family and friends (27%), or (c)
used family savings (27%) to pay for college. An equal number of respondents (28%)
said they would not have attended college at all. (Table 19) The absence of program
provided funding for college would have likely limited the higher education choices for
respondents. When asked to consider financial alternatives for college, 40 percent of
respondents said they would have delayed college attendance and 27 percent said they
would not have attended college at all. When considering what changes they would
have made to their college attendance decisions, 48 percent of four-year college
students said they would have attended community college instead. Respondents who
were attending college also said they would have lived at home or attended college
closer to home without program-provided funding for college tuition.
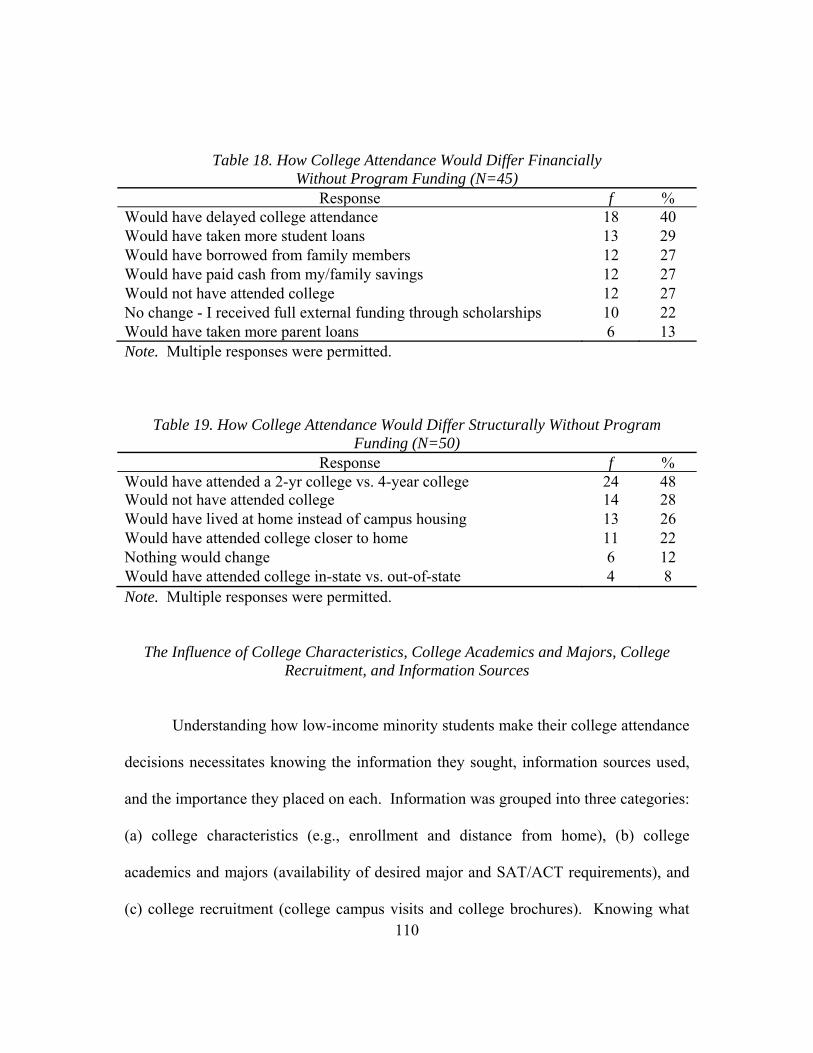
110
Table 18. How College Attendance Would Differ Financially Without Program Funding (N=45)
Response f %Would have delayed college attendance 18 40Would have taken more student loans 13 29 Would have borrowed from family members 12 27 Would have paid cash from my/family savings 12 27 Would not have attended college 12 27 No change - I received full external funding through scholarships 10 22 Would have taken more parent loans 6 13 Note. Multiple responses were permitted.
Table 19. How College Attendance Would Differ Structurally Without Program Funding (N=50)
Response f %Would have attended a 2-yr college vs. 4-year college 24 48Would not have attended college 14 28 Would have lived at home instead of campus housing 13 26 Would have attended college closer to home 11 22 Nothing would change 6 12 Would have attended college in-state vs. out-of-state 4 8 Note. Multiple responses were permitted.
The Influence of College Characteristics, College Academics and Majors, College
Recruitment, and Information Sources
Understanding how low-income minority students make their college attendance
decisions necessitates knowing the information they sought, information sources used,
and the importance they placed on each. Information was grouped into three categories:
(a) college characteristics (e.g., enrollment and distance from home), (b) college
academics and majors (availability of desired major and SAT/ACT requirements), and
(c) college recruitment (college campus visits and college brochures). Knowing what
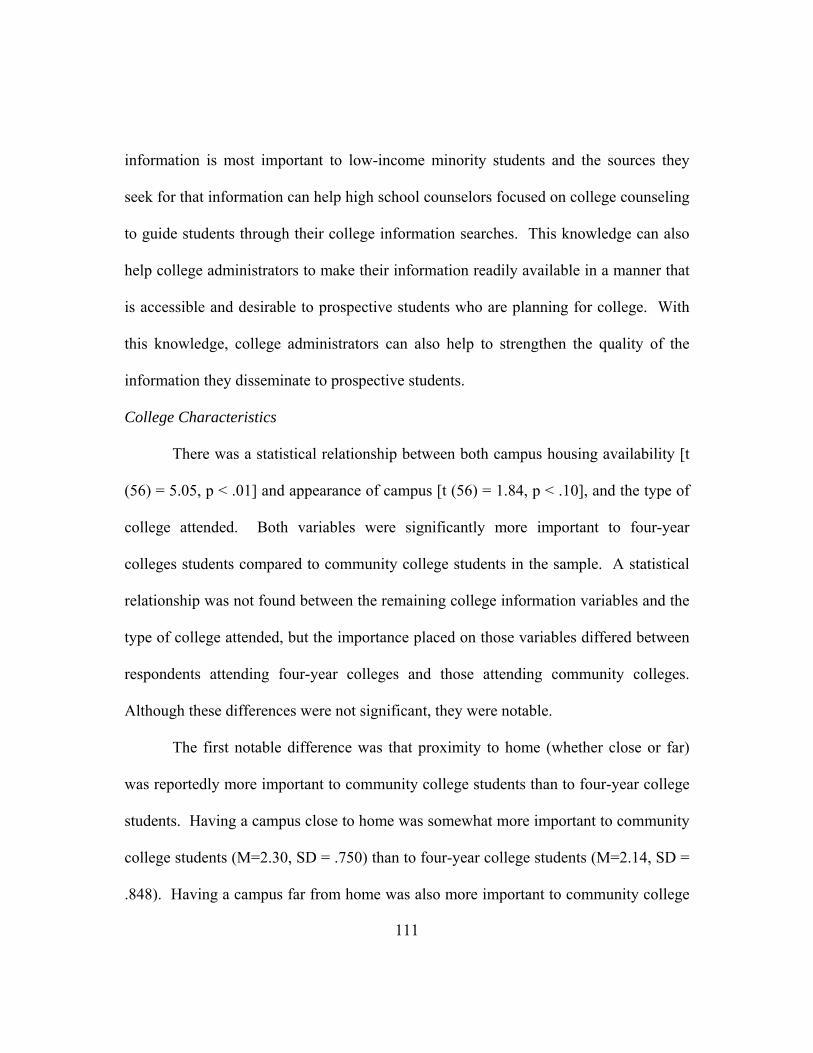
111
information is most important to low-income minority students and the sources they
seek for that information can help high school counselors focused on college counseling
to guide students through their college information searches. This knowledge can also
help college administrators to make their information readily available in a manner that
is accessible and desirable to prospective students who are planning for college. With
this knowledge, college administrators can also help to strengthen the quality of the
information they disseminate to prospective students.
College Characteristics
There was a statistical relationship between both campus housing availability [t
(56) = 5.05, p < .01] and appearance of campus [t (56) = 1.84, p < .10], and the type of
college attended. Both variables were significantly more important to four-year
colleges students compared to community college students in the sample. A statistical
relationship was not found between the remaining college information variables and the
type of college attended, but the importance placed on those variables differed between
respondents attending four-year colleges and those attending community colleges.
Although these differences were not significant, they were notable.
The first notable difference was that proximity to home (whether close or far)
was reportedly more important to community college students than to four-year college
students. Having a campus close to home was somewhat more important to community
college students (M=2.30, SD = .750) than to four-year college students (M=2.14, SD =
.848). Having a campus far from home was also more important to community college

112
students (M=2.07, SD = .740) than to four-year college students (M=1.96, SD = .744).
Considering the fact that some respondents attended community college out of town
could explain this unexpected finding. For these respondents, it could be the case that
they were determined to attend a community college, regardless of campus location. It
is generally accepted that students who attend community college do so for one of three
major reasons: feeling unprepared academically, feeling unprepared financially, or
desiring to stay close to home. Considering that attending a community college away
from home costs more than attending a community college near home (additional out
of county tuition fees, and housing costs) suggests that financial considerations were not
most important; obviously neither was staying close to home. In such cases, other
variables (such as perceived academic, social, and cultural preparation) appear to have
played a more important role in the college attendance decision.
The second notable finding (although not statistically significant) is that average
class size, rated very important by 41 percent of respondents, was reportedly more
important to four-year college students (M=2.39, SD = .737) than community college
students (M=2.10, SD = .712). Ethnic diversity of both students and staff were equally
rated very important by 12 percent of respondents; the ethnic diversity variables were
most important to four-year college students. Finally, physical size of campus and
student enrollment were rated very important by only 9 percent of respondents; both
variables were more important to four-year college students than to community college
students. (Table 20)

113
College Academics and Majors
This category of variables related to the academic majors offered by colleges, as
well as the reputation of those majors and the colleges themselves, in addition to
colleges’ SAT/ACT and GPA requirements. Only two variables, SAT/ACT
requirement and college major offered, were significant to the type of college attended,
although they were both rated very important less often than all other variables in this
category. The SAT/ACT requirement variable had the most significant relationship to
the type of college attended, and was reportedly more important to community college
students (M=2.37, SD = .669) than four-year college students (M=2.00, SD = .609) [t
(56) = -2.18, p< .05]; 22 percent of respondents said this variable was very important.
College major offered was rated more important by four-year students (M=2.68, SD =
.670) than community college students (M=2.33, SD = .711) [t (56) = 1.90, p< .10].
This variable was also most often considered to be very important (62%), compared to
other variables in this category. Other variables that were not significant to the type of
college attended were (a) GPA requirements, (b) college ranking, (c) academic major
ranking, and (d) assistance for undecided majors.
GPA requirement was reportedly very important to half of the respondents; four-
year college students (M=2.43, SD = .690) and community college students (M=2.43,
SD = .568) rated it equally important. Assistance for undecided majors, rated very
important least often (22%) of all the college academics and majors variables, was also
said to be more important to four-year college students (M=2.07, SD = .766) than to
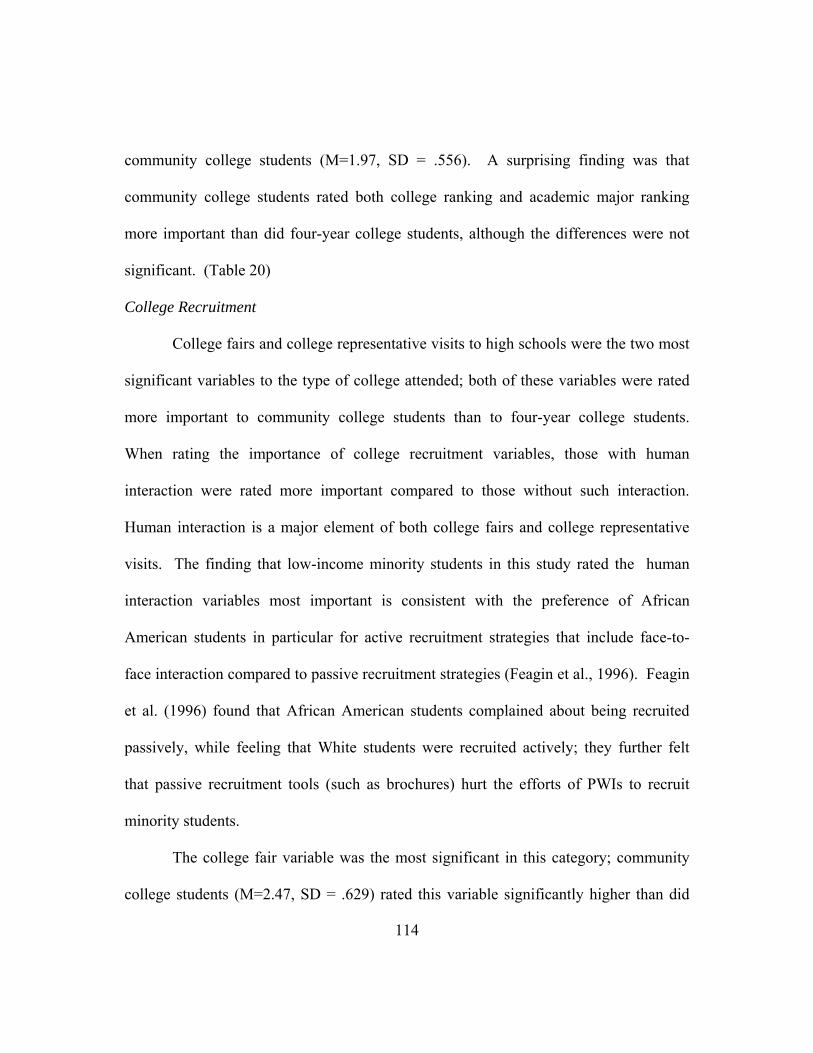
114
community college students (M=1.97, SD = .556). A surprising finding was that
community college students rated both college ranking and academic major ranking
more important than did four-year college students, although the differences were not
significant. (Table 20)
College Recruitment
College fairs and college representative visits to high schools were the two most
significant variables to the type of college attended; both of these variables were rated
more important to community college students than to four-year college students.
When rating the importance of college recruitment variables, those with human
interaction were rated more important compared to those without such interaction.
Human interaction is a major element of both college fairs and college representative
visits. The finding that low-income minority students in this study rated the human
interaction variables most important is consistent with the preference of African
American students in particular for active recruitment strategies that include face-to-
face interaction compared to passive recruitment strategies (Feagin et al., 1996). Feagin
et al. (1996) found that African American students complained about being recruited
passively, while feeling that White students were recruited actively; they further felt
that passive recruitment tools (such as brochures) hurt the efforts of PWIs to recruit
minority students.
The college fair variable was the most significant in this category; community
college students (M=2.47, SD = .629) rated this variable significantly higher than did
115
four-year college students (M=2.11, SD = .786) [t (46) = -1.93, p < .10]. The
importance of college representative visits to the high school also differed significantly
between community college (M=2.17, SD = .791) and four-year college students
(M=1.82, SD = .612) [t (56) = -1.85, p < .10]. The other college recruitment variables
were not statistically significant to the type of college attended, although they were
important to respondents, especially four-year college students.
Respondents rated college campus visits most important (52%) among all
college recruitment variables. As the next section discusses, college campus visits were
also reportedly among the three most frequently used sources of information. Early
admission was rated very important by 40 percent of respondents, and, as expected,
most important to respondents who attended a four-year college. Early admission gives
prospective students an opportunity to receive admission decisions before the priority
admission application deadline (when most prospective students apply to colleges).
This early admission allows prospective students to plan, receive financial aid awards,
and to commit to their chosen college early, if admitted. Early admission is binding on
the college and the student; selected students must attend the first college to which they
are admitted, and universities must guarantee their spot in the entering class. Early
action, in contrast, has many of the same benefits and is not binding on the college or
the student. Both early admission and early action are referred to generically as early
admission. College websites (29%), college brochures (21%), and other websites (10%)

116
were the least important variables in the college recruitment category, and incidentally,
were passive recruitment variables. (Table 20)
Table 20. Importance of College Characteristics, College Academics and Majors, And College Recruitment (N=58)
College characteristics Not
important Somewhat important
Very important
Campus close to home 22% (13)
33% (19)
45% (26)
Average class size 17% (10)
41% (24)
41% (24)
Campus housing availability** 29% (17)
34% (20)
36% (21)
Appearance of campus x 22% (13)
45% (26)
33% (19)
Campus far from home 26% (15)
47% (27)
28% (16)
Ethnic diversity of students 40% (23)
40% (23)
21% (12)
Ethnic diversity of staff 43% (25)
36% (21)
21% (12)
Physical size of campus 45% (26)
40% (23)
16% (9)
Student enrollment 47% (27)
38% (22)
16% (9)
College academics and majors Not
important Somewhat important
Very important
College major offered x 12% (7)
26% (15)
62% (36)
GPA requirements 7% (4)
43% (25)
50% (29)
Ranking of college/university 12% (7)
45% (26)
43% (25)
Ranking of academic major 14% (8)
45% (26)
41% (24)
SAT/ACT requirements* 14% (8)
53% (31)
33% (19)

Table 20 (continued)
Assistance for undecided majors
21% (12)
57% (33)
22% (13)
College recruitment Not
important Somewhat important
Very important
College campus visits 14% (8)
34% (20)
51% (30)
College fairs x 16% (9)
40% (23)
45% (26)
Early admission decisions 12% (7)
48% (28)
40% (23)
College website 24% (14)
47% (27)
29% (17)
College representative at high school x
26% (15)
48% (28)
26% (15)
College brochures 24% (14)
55% (32)
21% (12)
Other websites 48% (28)
41% (24)
10% (6)
Note. Due to rounding, not all rows equal 100%. X p < .10. * p < .05. **p < .01.
Information Sources
All respondents (attending and not attending college) were asked which
information sources they used to make their college attendance decisions, and which of
the sources were most important to those. Respondents said that program-provided
advisors (86%), parents and family (48%), and college campus visits (34%) were used
most often. In contrast to the most widely used sources, the three least used sources
were (in descending order) internet search engines, Princeton Review website, and
television; these sources are incidentally void of human interaction. These findings
117
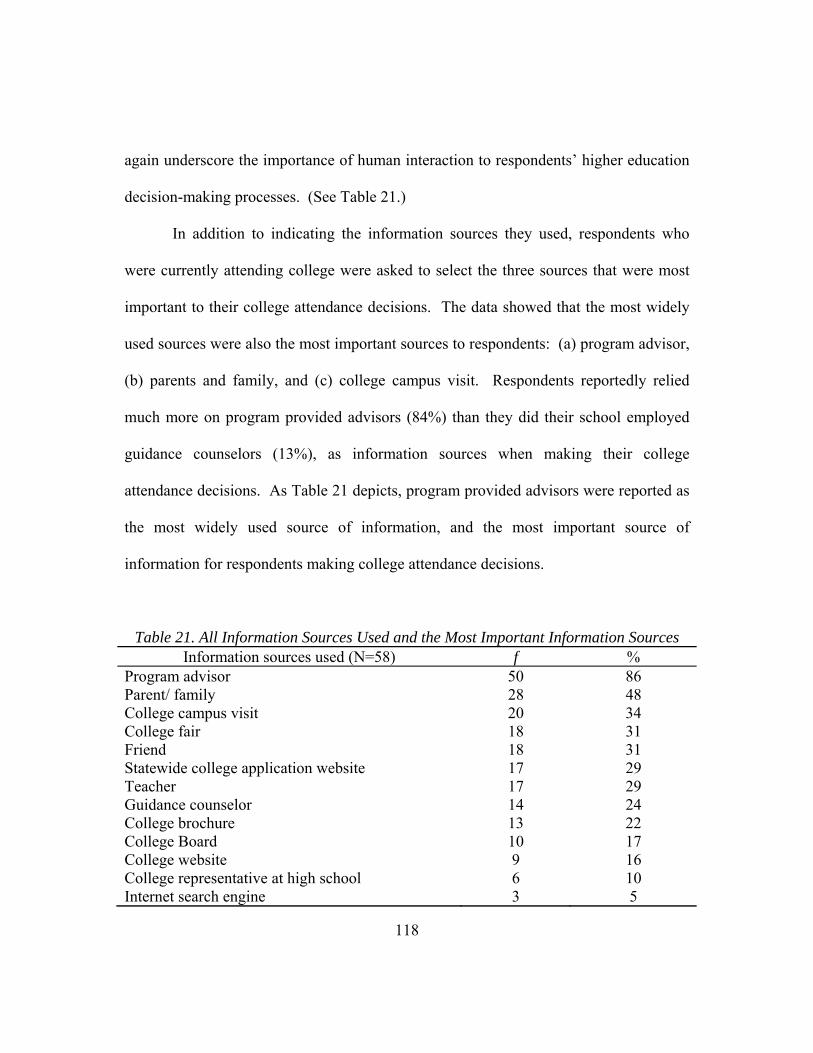
118
again underscore the importance of human interaction to respondents’ higher education
decision-making processes. (See Table 21.)
In addition to indicating the information sources they used, respondents who
were currently attending college were asked to select the three sources that were most
important to their college attendance decisions. The data showed that the most widely
used sources were also the most important sources to respondents: (a) program advisor,
(b) parents and family, and (c) college campus visit. Respondents reportedly relied
much more on program provided advisors (84%) than they did their school employed
guidance counselors (13%), as information sources when making their college
attendance decisions. As Table 21 depicts, program provided advisors were reported as
the most widely used source of information, and the most important source of
information for respondents making college attendance decisions.
Table 21. All Information Sources Used and the Most Important Information Sources Information sources used (N=58) f %
Program advisor 50 86 Parent/ family 28 48 College campus visit 20 34 College fair 18 31 Friend 18 31 Statewide college application website 17 29 Teacher 17 29 Guidance counselor 14 24 College brochure 13 22 College Board 10 17 College website 9 16 College representative at high school 6 10 Internet search engine 3 5
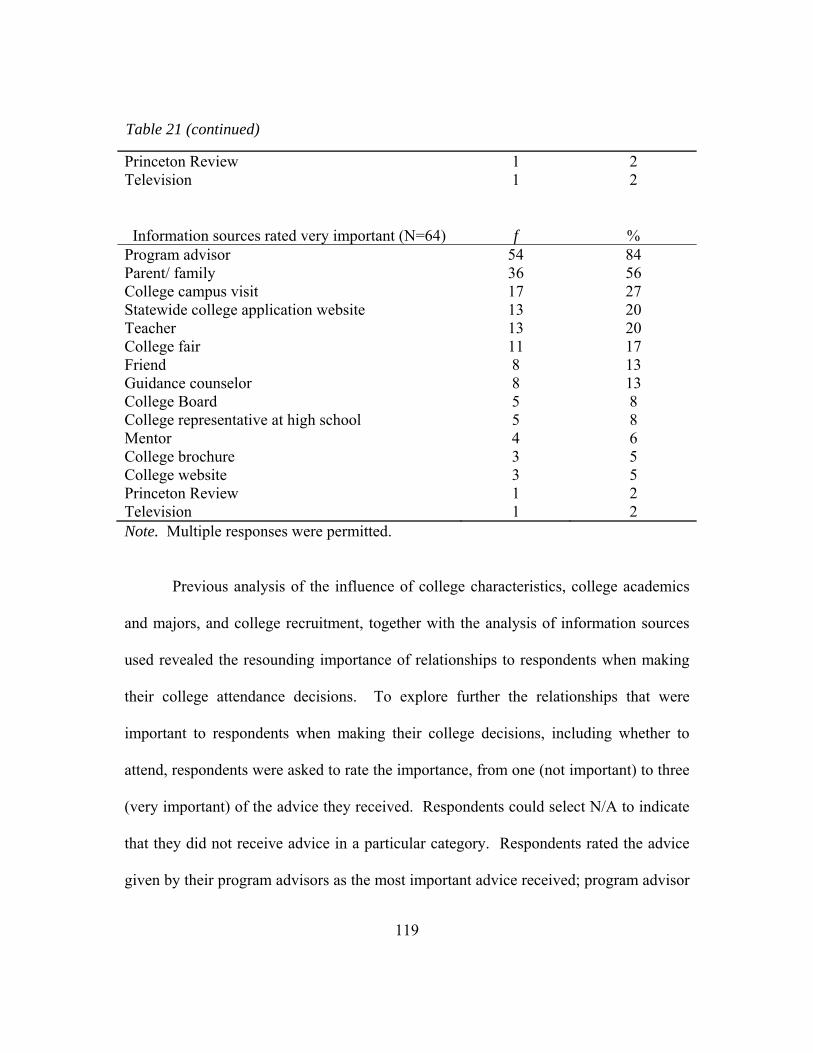
119
Table 21 (continued)
Princeton Review 1 2 Television 1 2
Information sources rated very important (N=64) f
%
Program advisor 54 84 Parent/ family 36 56 College campus visit 17 27 Statewide college application website 13 20 Teacher 13 20 College fair 11 17 Friend 8 13 Guidance counselor 8 13 College Board 5 8 College representative at high school 5 8 Mentor 4 6 College brochure 3 5 College website 3 5 Princeton Review 1 2 Television 1 2 Note. Multiple responses were permitted.
Previous analysis of the influence of college characteristics, college academics
and majors, and college recruitment, together with the analysis of information sources
used revealed the resounding importance of relationships to respondents when making
their college attendance decisions. To explore further the relationships that were
important to respondents when making their college decisions, including whether to
attend, respondents were asked to rate the importance, from one (not important) to three
(very important) of the advice they received. Respondents could select N/A to indicate
that they did not receive advice in a particular category. Respondents rated the advice
given by their program advisors as the most important advice received; program advisor

120
advice was rated very important by 84 percent of respondents. Family member advice
was rated very important by 78 percent of respondents. The advice of school-employed
guidance counselors was rated very important much less often (47%) than was the
advice of program advisors (84%).
Next, advice ratings were analyzed for the significance of each source of advice
received, to respondents’ selection of a four-year college or a community college. The
data found that high school guidance counselor advice was the variable most
statistically significant to the type of college attended, and was more important to four-
year college students (M=2.48, SD = .770) than to community college students
(M=2.07, SD = .828) [t (53) = 1.90, p < .10]. In contrast to guidance counselor advice,
family members’ advice was significantly more important to community college
students (M=2.87, SD = .434) than four-year college students (M=2.52, SD = .790) [t
(51) = -1.89, p <.10]. (Table 22) A separate item asked respondents if they had an
adult mentor; 67 percent of community college students had a mentor, compared to 63
percent of four-year students. The most underserved participants in the program were
most likely to need and therefore receive a formal mentor by assignment. Participants
also had informal mentors through their employment, church, neighborhood, or
program-provided internships.

121
Table 22. Importance of the Advice Received
Advice source Not
important Somewhat important
Very important Not used N
Program advisor 3 5 47 1 56 Family x 5 5 43 2 55 High school counselor x 13 15 27 2 57 Mentor 13 10 21 10 54 Friend 5 29 21 1 56 Employer 20 14 9 11 54 Church leader 23 11 5 15 54 x p < .10.
Perceived Barriers to College Access
The current research studied the college attendance decisions of low-income
minority students, to understand how they made their college attendance decisions,
including the decision of whether to attend college, and to understand the barriers that
limited college access for this population. The research has uncovered some barriers,
such as respondents’ feelings of being unprepared culturally and financially to enter
college, that limit college access for low-income minority students. In addition to those
barriers already mentioned, all respondents were asked to tell about the academic,
college preparation, and personal barriers that may have limited their college choices
and access.
Three survey items were designed to reflect the concept of barriers without
using the word barrier in the survey instruments, for three reasons. First, the word
barrier was not used in the survey process because it has a negative connotation that
could cause respondents to feel ashamed of the circumstances they faced (such as

122
needing to provide financial support for their parents). Second, the researcher has
interpreted variables to be things that limit higher education choices as such, and did not
want to project that bias onto the respondents. Third, some circumstances, such as a
desire to stay close to home, might not have been considered as barriers by the
respondents, and therefore, might not have been selected when asked to identify
barriers they faced; yet, we know that even these variables can limit the educational
options considered by respondents. All respondents were asked about the barriers that
affected their higher education decisions.
The barriers items asked respondents to identify the academic, financial (see
cost and funding section), college preparation, and personal factors that restricted,
affected, and influenced (respectively) their higher education decisions. Items were
stated negatively (such as low GPA instead of GPA), and multiple-responses and
respondent-generated responses were permitted. Table 23 details the barriers faced.
Respondents who were attending college, and those who were not, indicated that
their college decisions were influenced by similar factors. Respondents did not
generally perceive academic barriers to college attendance; 63 percent of respondents
indicated that none of the academic barriers affected them. This finding is consistent
with respondents’ general perception of being academically prepared to attend college.
(Refer to the preparedness section.) Among all identified barriers, low SAT and ACT
scores were reportedly the biggest academic barrier, faced by 30 percent of respondents.
Having a low high school GPA was reportedly a barrier for 10 percent of respondents.

123
An additional five percent of respondents felt that they had insufficient credits in the
core academic subjects, and three percent faced low state-administered exit exam
scores. (Table 23)
College preparation barriers, such as limited knowledge about college or the
admission processes, affected the higher education decisions of respondents, although
47 percent of respondents believed they faced no such barriers. The most pervasive
barrier was limited knowledge about college. Even though they felt like their
knowledge about college was limited, respondents did not seem to hold their program
advisors and counselors accountable for this limitation; only five percent of respondents
believed they received poor guidance to aid them in that area. Lack of knowledge about
college or admission processes was a barrier for many students; 25 percent of
respondents said they had limited family knowledge of the aforementioned and 23
percent of respondents said they themselves lacked such knowledge. This finding was
consistent with respondents’ low levels of perceived cultural preparation to enter
college.
With low levels of cultural capital, bridging capital is necessary for a person to
advance from one position of status to a higher position of status. According to Putnam
(2000), the social ties that one makes with another through networking and interacting
for common social, political, and economic purposes create bridging capital. The
parents in this study, however, had limited exposure to higher education, and seemingly
limited social connections to others who could strengthen their understanding of college
124
admission and funding processes. Thus, they were unable to provide strong bridging
capital or guidance to help their students attend college. Inadequate college planning
and preparation was a barrier for 22 percent of respondents. (Table 23)
Factors beyond a student’s control can limit college access and educational
attainment (Steele, 1997). Personal factors had important influences on the college
selection of participants. Although proximity to home is not necessarily a barrier, the
desire to stay near home can limit the number and type of colleges that a student would
consider attending. In this study, 39 percent of respondents reported that a desire to
stay close to home influenced their higher education decisions.
The most pervasive personal barrier that limited choices for higher education
was a responsibility to help parents and family; 27 percent of respondents felt
responsible for helping their parents and families. This finding is most likely due to the
low economic status of the study participants. The need to provide for their families
indicated a need for increased income in the household. This finding also suggests that
financial barriers hindered college attendance or, in the future, could hinder educational
attainment for these students. Respondents’ need to provide for their families (parents,
siblings, etc.) most likely limited the colleges that they considered attending because
they would have most likely needed to attend college near home, and needing to work
might have reduced the number of credit hours they enrolled in each semester.
In the chapter section on college characteristic variables, respondents expressed
that they placed importance on distance from home when considering colleges. That
125
finding was consistent with the barriers section that found family and parents’ desire for
respondents to stay close to home limited the choices for 21 percent of respondents.
Interestingly, when asked about the personal factors that affected college attendance,
four students (7%) indicated that they did not want to attend college; however, all four
of those students were currently attending college. Few of the respondents indicated a
need to raise their own children (5%) as a barrier to their college attendance. Very few
respondents said that a need to work full-time influenced their college attendance.
Having family members and parents who did not want respondents to attend college
was a personal barrier reported by only a couple of respondents.
(Table 23)
Examining the barriers that influenced respondents’ college attendance decisions
found that money, limited knowledge about college, and family needs and expectations
influenced their higher education decisions. A lack of money was expressed through a
stated need to provide for the family, and a need to work full-time. Limited knowledge
about college has been a consistent finding of this research study. Without the
understanding of how colleges work, or how to plan properly to enter college, students
may face cultural and academic challenges later in their college tenures. Some
respondents have already felt that poor academic preparation has affected their college
attendance decisions, particularly due to low SAT and ACT scores.
Family considerations restricted higher education decisions in many ways. First,
a lack of family and personal knowledge about college and admission processes

126
negatively affected higher education choices. Second, respondents felt a responsibility
to provide financial resources for their parents and families, which most likely resulted
in students attending college as inexpensively as possible. Further, this barrier may
threaten the educational attainment of respondents if their families continue to rely on
them for financial security. Third, a few respondents needed to care for their own
children, a responsibility that might reduce the amount of time and money dedicated to
college. Fourth, respondents reported that many of their family members and parents
wanted them to attend college near home, or did not want them to attend college at all.
Table 23. Barriers that Influenced Higher Education Choices (N varies)
Academic barriers (N=63) f %None of the above 40 63Low SAT/ACT score 19 30 Low high school GPA 6 10 Insufficient credits in core academic subjects 3 5 Low state exit exam score 2 3
College preparation barriers (N=64) f %
None of the above 30 47Lack of family knowledge of college or admission 16 25 Little personal knowledge of various education options 15 23 Inadequate college planning and preparation 14 22 Poor guidance through the college admission process 3 5
Personal barriers (N=56) f % I wanted to stay close to home 22 39Responsibility to help parents/family 15 27 None of the above 13 23 Family/parent(s) wanted me to stay close to home 12 21 I did not want to attend college 4 7 Responsibility to raise child(ren) of my own 3 5

127
Table 23 (continued)
I wanted to work full-time 2 4 Family/parent(s) did not want me to attend college 2 4 Note. Multiple responses were permitted
The current case study explored the reasons why respondents did not attend
college by asking respondents who were not attending college to select all the reasons
they did not attend college. (Multiple responses were permitted.) Financial issues
presented the most pervasive barriers for the five participants who were not currently
attending college. A majority of respondents (60%) believed that they did not have
enough money to attend college. An equal number of respondents (60%) needed to
work full-time, and therefore believed they could not attend college. In either case,
finances were very important in the decision not to attend college. College costs were
perceived to be too high, and funding sources were perceived inadequate for students to
go to college. Respondents provided three additional variables that they believe
explained why they did not attend college: (a) having inadequate knowledge of the
college admission process, (b) being unprepared academically to attend college, and (c)
lacking sufficient transportation to attend college. Sadly, even when tuition funding
was secured through the promise of financial awards and scholarships, a lack of
financial capital was still clearly a barrier to these respondents’ college access.
Why Respondents Attended Four-Year or Two-Year Colleges
In addition to surveying barriers to college access, this research sought to
identify the variables related to respondents’ selection of a two-year/community college
128
or a four-year college/university. This research has highlighted differences between
respondents who attended four-year colleges and respondents who attended community
colleges. Most notably, community college students expressed the lowest levels of
perceived academic and cultural preparation to attend college; they also expressed the
lowest perceived financial preparation to attend college. In addition, two-year college
students were most likely to be raised by single parents, which could limit interaction
between parent and child, and thus social capital transmission between parent and child
(Yan, 1999). A desire to stay close to home and a need to provide financially for
parents and families were two additional reasons why respondents say they attended
community colleges over four-year colleges.
This research has found many variables related to choosing a four-year or
community college. In addition to those discovered, this study wanted to learn directly
from respondents the reasons why they chose one college type over another.
Respondents attending four-year colleges were asked why they chose to attend a four-
year college over a community college. The most popular reason given was that the
college/university offered the respondents’ desired major (21%). The second most
popular reason (15%) was to reach educational goals they had set for themselves.
Almost as important were (a) the reputation of the college, (b) the desire to experience
college life, and (c) a desire for a better job and better pay than they thought they could
get through attending community college. Each of these reasons accounted for 12
percent of all responses. (Table 24)

129
Likewise, community college students were asked why they chose to attend a
community college over a four-year college. The most common response (30%) was to
complete core courses (basics) before transferring to a four-year college. This finding
was consistent with the high educational goals set by all respondents, regardless of the
type of college they were currently attending. Being able to attend college close to
home was stated as a reason why 20 percent of respondents attended community
college. Three additional reasons explained why respondents attended community
college: (a) community college was less expensive than a university, (b) transportation
was limited, and (c) students wanted to save money; each of these three reasons
accounted for 10 percent of all responses.
In general, the reasons why four-year college students made their choice were
crouched in optimism, such as reaching one’s goals, finding a good fit between the
college and the student, and getting a better education than one’s parents. Conversely,
the reasons why community college students said they made their choice were, in
general, less optimistic, and included the language of barriers, such as having limited
transportation or needing to save money. If students were academically qualified to
attend a four-year college, and had sufficient funding to do so, the reasons why they
would attend a community college must be explored deeper. Chapter 5 presents
recommendations for educators to increase college access for low-income minority
students, especially focusing on helping students to attend a four-year
college/university. (Table 24)

130
Table 24. Why Respondents Attended Four-Year or Two-Year Colleges Why respondents attended four-year colleges (N=34) f
Academic major offered 7 To reach educational goals 5 Reputation of college 4 To experience “college life” 4 To get a good job and good pay 4 The college was a good fit 3 To improve self 2 To go to school away from home 1 To have a better education than parents did 1 To meet family expectations 1 Took advantage of a good opportunity 1 Program advisor advice 1 Scholarships offered 1
Why respondents attended community colleges (N=30)
f
To complete core courses (basics) 9 College was close to home 6 College was less expensive than a university 3 Limited transportation 3 To save money 3 Denied admission to a university 1 Need to support family 1 Only option available 1 To earn an associate's degree 1 To try college first 1 Plan to join the military after community college 1
Satisfaction with Higher Education Decisions
After respondents had made their college decisions, and had lived with the
results of those decisions, they were asked what satisfaction and dissatisfaction they had
with their higher education decisions, including the decision of whether to attend

131
college. Additionally, respondents were asked whether they would have changed their
initial decision to attend college if they had a chance to choose again. Although this
research segment was focused primarily on college access, satisfaction was included as
a predictor of the likelihood that students would persist through college graduation
(educational attainment) or even enroll in college later if they were not currently
attending college.
Improving educators’ understanding of how low-income minority students feel
about the higher education decisions they have made will allow them to share
meaningful information (from previous students’ experiences) to aid other low-income
minority students in making the best higher education decisions they can, for
themselves. Educators in particular can help low-income students who are
academically prepared to attend four-year colleges/universities directly from high
school. Educators can do so by mitigating the barriers over which they have some
control [e.g., academic, social (parent-school interactions), and cultural preparedness to
enter college] that can limit college access for low-income minority students. Chapter 5
discusses college matching further.
Satisfaction of Respondents Who Were Currently Attending College
Current college students shared their satisfaction and dissatisfaction with three
decisions: (a) the decision to attend college, (b) the particular college attended, and (c)
the academic major chosen. Respondents were generally satisfied with their higher
education decisions in all three areas. An overwhelming majority of respondents (89%)
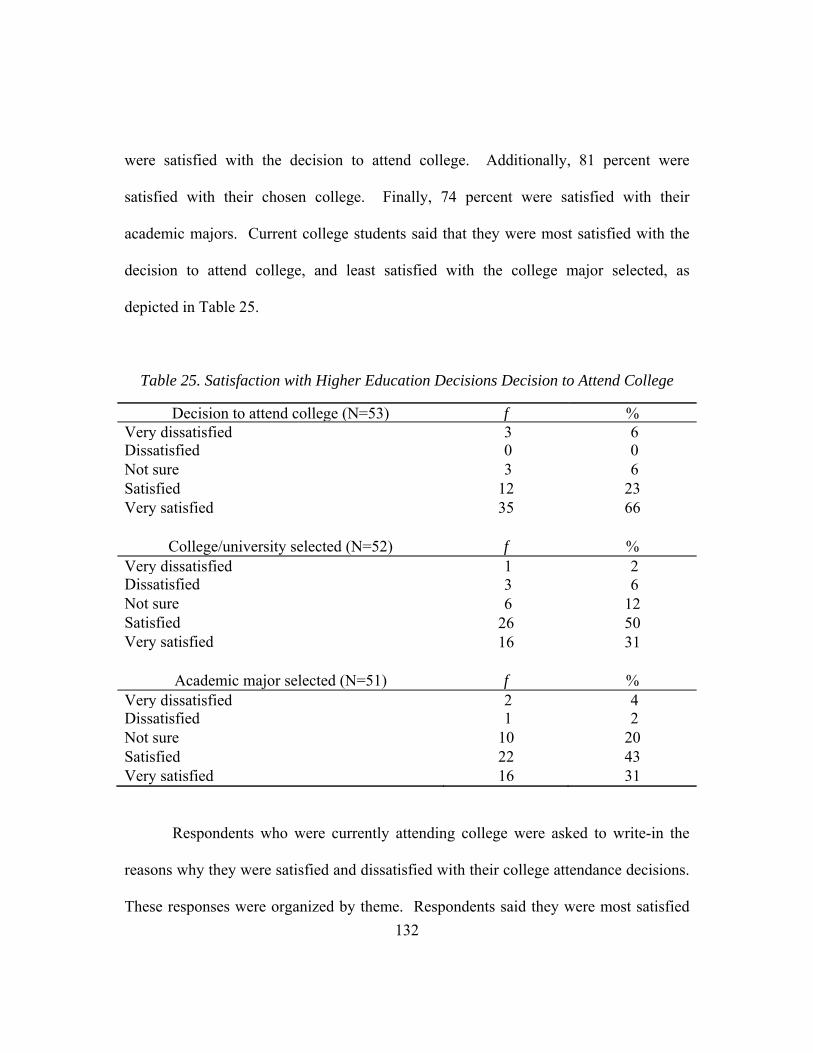
132
were satisfied with the decision to attend college. Additionally, 81 percent were
satisfied with their chosen college. Finally, 74 percent were satisfied with their
academic majors. Current college students said that they were most satisfied with the
decision to attend college, and least satisfied with the college major selected, as
depicted in Table 25.
Table 25. Satisfaction with Higher Education Decisions Decision to Attend College
Decision to attend college (N=53) f % Very dissatisfied 3 6 Dissatisfied 0 0 Not sure 3 6 Satisfied 12 23 Very satisfied 35 66
College/university selected (N=52) f %
Very dissatisfied 1 2 Dissatisfied 3 6 Not sure 6 12 Satisfied 26 50 Very satisfied 16 31
Academic major selected (N=51) f %
Very dissatisfied 2 4 Dissatisfied 1 2 Not sure 10 20 Satisfied 22 43 Very satisfied 16 31
Respondents who were currently attending college were asked to write-in the
reasons why they were satisfied and dissatisfied with their college attendance decisions.
These responses were organized by theme. Respondents said they were most satisfied

133
(28%) with acquiring new knowledge. Additionally, respondents were apparently
satisfied because they were experiencing a new environment (22%), and setting goals
for themselves (22%). The three most popular reasons for student satisfaction centered
on the themes of new experiences (new knowledge, new environment) and goal setting.
Equal satisfaction was expressed with (a) the decision to attend college, (b) the choice
of academic major, and (c) the opportunity to improve their lives (socioeconomic
mobility). Each of these satisfaction reasons accounted for 20% of all responses. (Table
26)
Respondents who were currently attending college also shared the reasons why
they were dissatisfied with their college attendance decisions. The primary reason for
dissatisfaction (26%) was the heavy workload (homework, studies, and exams) to which
the respondents were unaccustomed, although they had been admitted to college and
were presumably college ready. (Remember that Kahlenberg (2006) found that grades
given by teachers in low-income school districts were weak indicators of academic
achievement compared to middle class schools.) Respondents’ dissatisfaction with the
heavy workload is a contrast to their stated beliefs that they were academically prepared
to enter college. However, respondents did cite low SAT and ACT scores (designed to
predict academic success during the first year of college) as a factor that restricted their
higher education decisions. In addition to the workload, almost as many respondents
(20%) said they were dissatisfied with their choice of college. Respondents were
equally dissatisfied with their choice of academic major (15%) and distance from home

134
(15%). Concern for money was an additional source of dissatisfaction for current
college attendees (15%). (Table 26)
Table 26. Reasons for Satisfaction and Dissatisfaction
with Higher Education Decisions Satisfaction theme (N=54) f
Knowledge gained 15 Experiences in a new environment 12 Having goals set for one's self 12 Making the decision to go to college 11 Opportunity to improve one’s life 11 Choice of college 11 Choice of major and/or classes 9 Distance of the campus from home 8 Learned to become more responsible and independent 7 Social relationships made 6 Made the family proud 6 Affordability of college 4 Others 7 Total responses 119
Dissatisfaction theme (N=46) f
Heavy workload 12 Choice of college 9 Choice of major and/or classes 7 Distance of the campus from home 7 Financial concerns 7 Having a job 4 Dislike for the professors 4 Stress that college brings 3 Regrets about going to college 3 Preparedness for college 3 Lack of "college life" experience 3 Personal reasons 3 Others 5 Total responses 70 Note. Multiple responses were permitted.
135
To explore further respondents’ satisfaction with the decision to attend college,
respondents who were currently attending college were asked whether they would
switch colleges if they could choose again. This satisfaction item found that 81 percent
of respondents expressed satisfaction with the college they chose (Table 25), although
38 percent said they would have chosen to attend a different college if given a chance to
choose again, for the reasons shown in Table 27. Perhaps even respondents who were
satisfied think they could be even more satisfied at a different institution. Furthermore,
51 percent of current college attendees said their current college was not their first
choice when they graduated from high school. An assumption could be made that
either (a) the remaining 23 percent are working to make good their initial college
choice, (b) they do not believe another college would satisfy them more than the current
one does, or (c) the decision cost of switching colleges is greater than the cost of
staying. Finally, current college students overwhelmingly (96%) said they would not
choose to forego college if given a chance to choose again. Overall, respondents were
much more satisfied with the decision to attend college than with the particular college
or academic major they chose.
When asking respondents if they would have chosen to attend a different college
than their current one, 38 percent responded, “yes”. Those respondents were asked why
they would have chosen a different college. Two responses were provided more
frequently than all others were. First, 23 percent said that their current college lacked a
sense of college life. Remember that a desire to experience college life was a reason
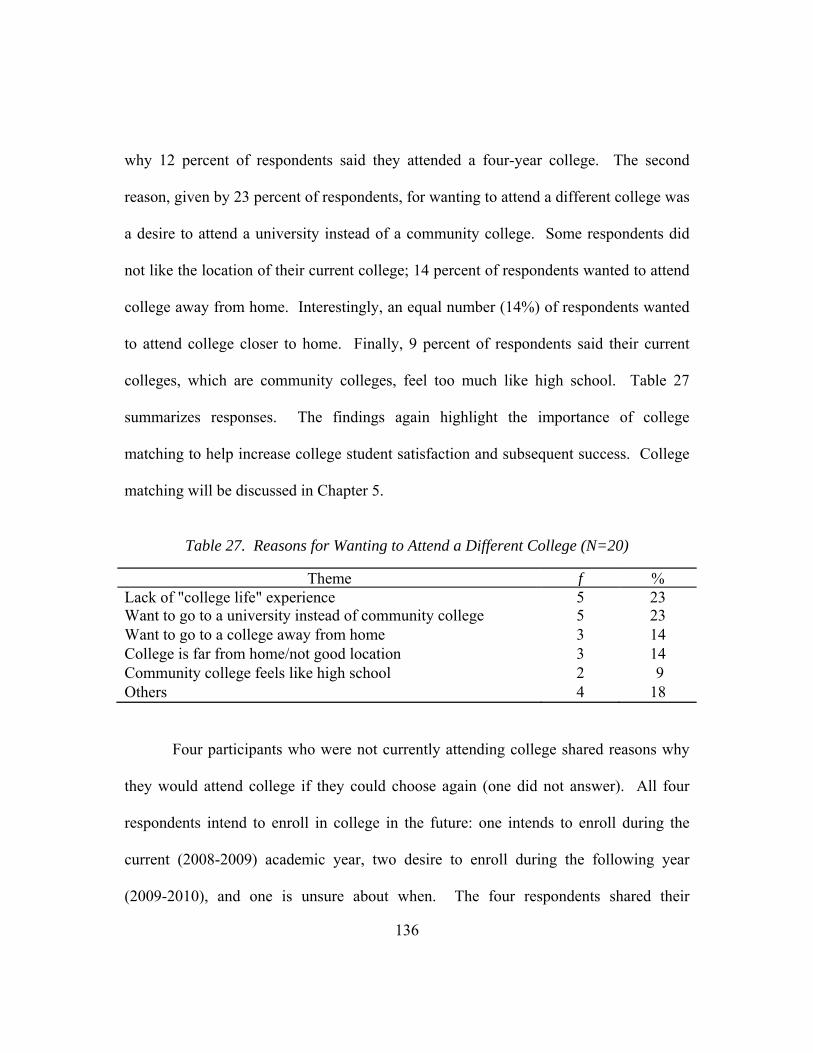
136
why 12 percent of respondents said they attended a four-year college. The second
reason, given by 23 percent of respondents, for wanting to attend a different college was
a desire to attend a university instead of a community college. Some respondents did
not like the location of their current college; 14 percent of respondents wanted to attend
college away from home. Interestingly, an equal number (14%) of respondents wanted
to attend college closer to home. Finally, 9 percent of respondents said their current
colleges, which are community colleges, feel too much like high school. Table 27
summarizes responses. The findings again highlight the importance of college
matching to help increase college student satisfaction and subsequent success. College
matching will be discussed in Chapter 5.
Table 27. Reasons for Wanting to Attend a Different College (N=20)
Theme f %Lack of "college life" experience 5 23Want to go to a university instead of community college 5 23 Want to go to a college away from home 3 14 College is far from home/not good location 3 14 Community college feels like high school 2 9 Others 4 18
Four participants who were not currently attending college shared reasons why
they would attend college if they could choose again (one did not answer). All four
respondents intend to enroll in college in the future: one intends to enroll during the
current (2008-2009) academic year, two desire to enroll during the following year
(2009-2010), and one is unsure about when. The four respondents shared their
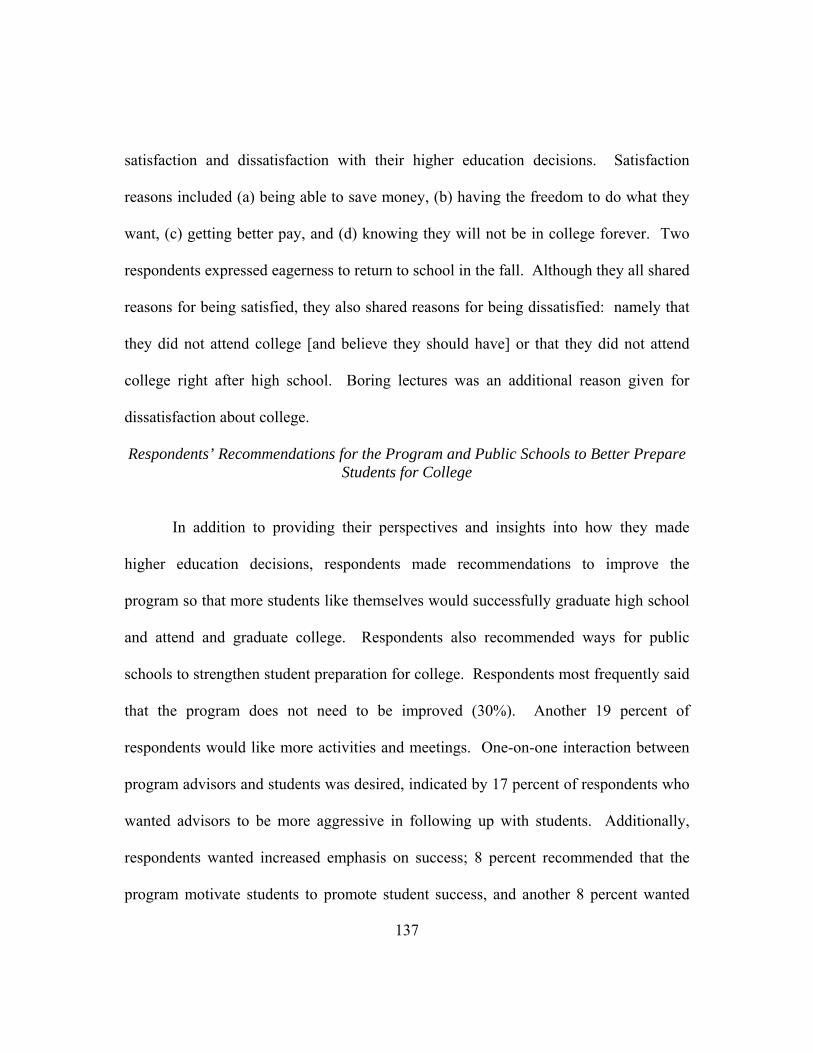
137
satisfaction and dissatisfaction with their higher education decisions. Satisfaction
reasons included (a) being able to save money, (b) having the freedom to do what they
want, (c) getting better pay, and (d) knowing they will not be in college forever. Two
respondents expressed eagerness to return to school in the fall. Although they all shared
reasons for being satisfied, they also shared reasons for being dissatisfied: namely that
they did not attend college [and believe they should have] or that they did not attend
college right after high school. Boring lectures was an additional reason given for
dissatisfaction about college.
Respondents’ Recommendations for the Program and Public Schools to Better Prepare Students for College
In addition to providing their perspectives and insights into how they made
higher education decisions, respondents made recommendations to improve the
program so that more students like themselves would successfully graduate high school
and attend and graduate college. Respondents also recommended ways for public
schools to strengthen student preparation for college. Respondents most frequently said
that the program does not need to be improved (30%). Another 19 percent of
respondents would like more activities and meetings. One-on-one interaction between
program advisors and students was desired, indicated by 17 percent of respondents who
wanted advisors to be more aggressive in following up with students. Additionally,
respondents wanted increased emphasis on success; 8 percent recommended that the
program motivate students to promote student success, and another 8 percent wanted
138
the program to emphasize the importance of academic achievement in high school.
(Table 28)
Respondents also recommended ways for public schools to better prepare
students for college. The most common responses were that teachers should better
teach students and that schools should plan more college fairs for students; each
response yielded 12 percent of all responses. Two additional recommendations were to
expand the program into other schools (10%) and to plan earlier to prepare students for
the financial, social, and emotional demands of college (10%). The program,
incidentally, has noticed the same need in public schools, and plans to expand its into
one additional high school and three additional middle schools in the 2009-2010
academic year. At that time, the program would be operating in four high schools and
five middle schools, all within the same school district. Table 28 summarizes student
recommendations for the program and for public schools.
Table 28. Student Recommendations to Improve the Program and Public Schools
to Better Prepare Students for College (N varies)
Ways to improve “the program” (N=47) f
Nothing/everything is good 14 Have more activities and meetings 9 Aggressively follow-up with the students 8 Motivate students to succeed 4 Emphasize the importance of doing well in school 4 Have more staff to assist students 3 Start intervention before high school 3 Better organize programs and events 2

139
Table 28 (continued)
Ways to improve public schools (N=49) f
Teachers need to teach better 6 Plan college visits/fairs 6 Expand “the program” to more public schools 5 Plan early with students (freshman year) to be academically, mentally, and financially ready for college
5
Teachers should be involved more with students 4 Encourage students to take Advanced Placement (AP) classes 4 Have more activities and information for students 4 Encourage students to apply for scholarships 3 Improve curriculum/subject areas 3 Prepare students mentally for college 3 Motivate students to go to college 3 Students and counselors should talk more often 2 Stress independence 1 Note. Multiple responses were permitted.
Summary
Levine and Levine (1995) found that insufficient funding for tuition, a shift in
federal aid from grants to loans, rising tuition costs, and higher college entrance
standards were barriers to educational attainment for low-income minority students. So
too, respondents in this study said that these factors influenced their college attendance
decisions. The participants in this study were guaranteed college tuition funding
through the program, provided in hopes of increasing college access for populations that
have been underrepresented in higher education. Even when tuition funding was
guaranteed, respondents still said they based college attendance decisions in part on
financial factors, such as housing costs and grants availability. Respondents said that

140
college attendance costs and income needs were important factors when deciding
whether to attend a two-year or a four-year college.
The participants in this study reported considering many important financial
factors when making their higher education decisions. Lack of money and uncertainty
about how to pay for college tuition were important financial considerations, even when
college tuition funding was guaranteed. However, it was more than money that
explained why some students, with the guarantee of tuition funding, chose to attend
two-year colleges, or not to attend college at all. Academic, social, and cultural
preparation, in addition to financial preparation, all were essential to college attendance.
The majority of respondents attended a two-year/community college, however,
although they said they felt academically prepared for college and despite having
guaranteed college tuition funding through the program. Participants perceived that low
SAT/ACT scores limited their higher education choices (although they generally
reported feeling academically prepared for college). Additionally, a desire to stay near
home and a need to provide for parents and family were reportedly important factors
that affected participants’ higher education decisions.
Low cultural preparedness to enter college was pervasive among study
participants. A poor understanding of the processes of planning for college and
applying for college admission were said to be a major barrier to college access.
Participants generally reported feeling better prepared academically and socially than
they did financially and culturally to attend college. The strong relationship between
cultural preparedness and college type indicates a perceived barrier that limits college
attendance for low-income minority students. Namely, students reported feeling ill
prepared to navigate the college admission processes. Additionally, feeling culturally
unprepared could explain why a disproportionate number of low-income minority
students in this study selected two-year colleges over four-year colleges, or did not
attend college at all. Advice received, especially the advice of program-provided
advisors and family members, was said to be very important to respondents.
Additionally, of the many sources of information used, those that required human
interaction (e.g., college campus visits) were rated more important than were those
without such interaction (e.g., college brochures and websites).
The literature was consistent in its assertion that financial, social, and cultural
capital played critical roles in promoting educational attainment. Unfortunately, low-
income minority students have been generally found to have relatively low levels of
such capital, presenting a formidable barrier to college access and educational
attainment (Dumais, 2002, Yang, 1999; Bourdieu, 1986; Portes & Wilson, 1976).
Chapter 5 presents a discussion of these findings, implications for education, and
recommendations for future research.
141
142
CHAPTER V
THE DISCUSSION
The rates at which low-income and minority students attend college are
disproportionately low compared to their wealthier and White counterparts. Latino and
African American students in particular attend college at rates lower than their
representation in the U.S. population would suggest. As the U.S. populations of Latinos
and African Americans continue to grow, the need for these populations to earn a higher
education will become increasingly important to parity in educational attainment.
The reasons for the gap between the educational attainment of low-income and
minority students and that of their wealthier and White counterparts have been debated
in the literature. Some of the literature has focused on racial and ethnic disparities in
educational attainment. The literature found that minority students lack the motivation
and academic preparation needed to attend and graduate college. Other literature has
focused on socioeconomic disparities, and has found that because low-income students
live in underserved communities, they do not attend quality K-12 schools, and are
therefore academically unprepared to enter college. The current case study
acknowledges that issues related to economic status are intertwined with those related to
race and ethnicity. With that acknowledgement, this research provides an

143
understanding about which of the barriers found in the literature affected the respondent
sample, and how these barriers influenced college attendance decisions.
Previous studies have focused primarily on financial and academic barriers to
educational attainment for low-income minorities. The current study found that
financial and academic barriers to college access are important; equally if not more
important is the need for students to be socially and culturally prepared to enter and
graduate college. To alleviate the pervasive gaps in academic achievement, college
access, and educational attainment, this research focused on the college attendance
decisions that low-income minority students made when they had successfully
completed high school, and were guaranteed scholarships to pay for college tuition.
The purpose of this study was to understand how low-income minority students made
their higher education decisions, including the decision to attend college, and to learn
the factors that influenced those decisions, including the barriers that students perceived
limited their higher education choices and college access.
To fulfill the research purpose, the researcher performed a case study of a not-
for-profit organization that is committed to improving college readiness and increasing
college access for underserved populations. The researcher completed a survey with the
population of program participants who graduated from one of three urban, low SES,
public high schools in the spring of 2008. The case study organization was chosen, in
part, because it has a history of successfully combating two of the most pervasive
barriers to college attendance for low-income and minority students: inadequate

144
academic preparation, and insufficient funding for college tuition. Additionally, by
providing academic, social, and cultural support to program participants, the program
has had positive results; the program’s high school graduation rate was 87 percent with
a college attendance rate of 77 percent; the latter is more than twice the college
attendance rate of the school district in which the program operates (36%).
Contribution to the Literature
This study contributes to the literature by furthering the exploration of barriers
and other variables, such as inadequate social preparation for college, that affect low-
income minority students’ college attendance decisions. These decisions include the
choices of (a) whether to attend college, (b) what type of college to attend, and (c)
which specific college to attend. This study is also significant because it provides low-
income minority students’ first-hand perspectives on issues of college access and
college attendance decisions. This study is significant to college access literature also
because it expands upon previous research, and analyzes college attendance for low-
income minority students who had two main advantages over their peers: (a) they had
completed a college preparatory high school curriculum and (b) they were guaranteed
funding for tuition upon enrolling in college. Yet, many of the issues highlighted in the
literature were also present in the current research findings as well. Educators and
counselors could benefit from understanding why some students do not pursue college,
and why others choose to attend two-year colleges over four-year colleges. This
understanding can help educators better prepare students for college. Additionally,

145
understanding the cultural and social barriers, in addition to economic barriers, that
limit college access for low-income minority students can help educators alleviate those
barriers over which they can have some control.
Key Findings
Low motivation and inadequate academic preparation have been blamed for the
disproportionately low college attendance rates of low-income minority students
(Cammorata, 2007; Dumais; 2002; Feagin et al., 1996; Alliance for Excellent
Education, 2008; JBHE, 1999; Cantrell, 1999). In contrast to the literature, students in
this study reported being very motivated to attend college. Achievement ideology was
high too; respondents reported having high goals of earning a bachelor’s or graduate
level degree, and the goals were universal, even among respondents who did not attend
college. The desire for social and economic mobility was apparent in the reasons why
respondents wanted a college education. Getting a good job was the most common
reason. Other reasons frequently mentioned by respondents were (a) to have a better
life than my parents had, (b) to be exposed to new things and new experiences, (c) to
challenge myself, and (d) to make a lot of money. Even though respondents had high
educational goals, the goals were recent; in most cases, the students did not formulate
those goals until high school. Planning early for college can help students to prepare
adequately for college.
In addition to personal motivation, parents’ social capital (measured in part by
marital status and relationships with others that are focused on students’ educational

146
goals) and cultural capital (measured by educational attainment, occupation, and
appreciation and possession of things valued by the dominant class) have been found to
play a role in their children’s college attendance and educational attainment (Dumais,
2002; Swartz, 1997; Bourdieu, 1986; Yan, 1999; Portes and Wilson, 1976). This
section discusses three important connections between parents and children regarding
educational goals. First, the literature suggested that children of single parents were
likely to have lower levels of social capital (which aid educational attainment)
compared to students who lived with both parents, because single parents were limited
in the amount of time they had available to strengthen social capital through parent-teen
and parent-school interactions. The current study found a direct relationship between
living with both parents and college attendance. Students who lived with both parents
were more likely to attend college, and to attend four-year colleges. In addition, a
greater percentage of respondents attending four-year college lived with both parents,
compared to respondents attending community college and respondents not attending
college. Although these findings suggest a relationship between parents’ marital status
and college attendance, causality is not stated or implied. The range of reasons why this
is the case should continue to be explored.
Second, the literature found that children whose parents had college degrees
were themselves likely to earn a college degree. Almost all participants in this sample,
however, were enrolled in college, despite the fact that their parents did not have
college degrees. Only six percent of parents had a bachelor’s degree, and nearly one

147
third of parents did not finish high school (many did not even attend high school).
Since most respondents (regardless of college type) had parents without college
degrees, there were no significant differences found in parental education by type of
college attended. Social networks and peer influence between students, however, can
explain the high college attendance rate of both the sample and case study populations.
Third, the majority of parents in this survey did not attend college; they
reportedly had limited levels of cultural capital. Strong cultural capital would have
provided parents with the knowledge needed to navigate the college application,
admission, enrollment, and funding processes necessary for college attendance and
educational attainment. Without strong cultural capital, parents were unable to dispense
such college knowledge to their children. Subsequently, as is explained in the
following section, respondents reportedly felt unprepared culturally to enter college.
Academic, Cultural, and Social Preparation to Attend College
Motivation and preparation, as discussed in chapter 2, are often related as
barriers to college access for low-income minority students. The current study defined
three additional types of preparedness for college, in addition to academic preparation:
cultural preparation, social preparation, and financial preparation. (Financial
preparation is discussed in the following section on tuition costs and funding.) The
main research question centered on the importance of academic, social, and cultural
preparation in the college attendance decision for low-income minority students. This
study found that all three forms of preparation were important to the college attendance
148
decision. This research measured ACT and SAT scores and perceived academic
preparation as separate measures, and found inconsistency between the two. For
example, SAT scores were significantly higher for four-year college students than for
community college students, and students who scored highest were most likely to attend
four-year colleges. Although the scores were significantly different, there was no
difference in students’ perceived academic preparation for college by the type of college
(4-year vs. 2-year) they ultimately chose. However, students who did not attend college
generally reported feeling academically unprepared to attend college. Those who did
attend college identified low SAT scores as a barrier (see barrier section). SAT/ACT
scores were probably a better estimate of perceived academic competitiveness than was
GPA.
Misalignment between stated perceived and test-measured academic preparation
is most likely due to high grades earned in school that failed to correlate with high
scores on standardized college entrance exams. Nonetheless, feeling academically
prepared resulted in a 93 percent college attendance rate within the respondent sample.
Perceived academic preparation was not statistically significant to the decision to attend
college or the type of college attended, and was the least significant of all preparedness
measures. However, the research found a statistically significant relationship between
SAT/ACT scores and college attendance.
Although students reported feeling academically prepared to enter college, many
of them reported feeling overwhelmed academically upon enrolling in college. They

149
reported being dissatisfied with the heavy workload of homework and exams, which
they were not accustomed to undertaking. The misalignment between perceived and
actual preparation might be explained by Kahlenberg (2006), who found that grades in
low SES schools were not always indicative of academic preparedness, because an
average grade of “A” in low SES schools yielded the same results on standardized tests
as a grade of “C” in middle-class schools. This finding would imply that low SES
school grades might be inflated, thereby overestimating students’ academic
achievement, and giving students a false sense of academic preparation for college.
Additionally, courses may be less rigorous in low SES schools. Analysis of student
records found many instances in which program participants with A and B averages (at
low SES schools) scored in the bottom fiftieth percentile on the SAT and ACT exams.
Cultural preparation related to students’ knowledge of college application,
admission, enrollment, attendance, and funding processes. In this study, cultural
preparation was the most significant preparation variable related to the type of college
attended. Only 32 percent of respondents reportedly felt prepared culturally to enter
college; respondents reportedly felt less prepared culturally than academically (55%) or
socially (43%) to attend college. Even students who reportedly felt financially prepared
to attend college said they felt uninformed about how to navigate college application,
enrollment, and attendance processes. Students who reportedly felt culturally prepared
for college, and reportedly did not face college planning barriers such as limitations in
their knowledge of college admission processes, were more likely to enroll at four-year

150
colleges. The majority of respondents reportedly felt unprepared culturally to attend
college. Parents’ low levels of educational attainment are most likely the reason. If
parents had attended and graduated college, they would have been knowledgeable about
college application, enrollment, and funding processes that would aid their children’s
higher education decision-making. Throughout this study, however, respondents
indicated that they were not prepared culturally to attend college and that limited
knowledge about college admission and higher education choices was a barrier to their
educational pursuits (see barrier section).
As the section on cost and funding will demonstrate, cultural components were
rated more important than program funding. Almost half of respondents felt that
cultural preparation was so essential to their college attendance decisions that they
reportedly would not have attended college without the program components designed
to familiarize students with the culture of college. In contrast, approximately 28 percent
of respondents said they would not have attended college without program funding.
More than money is required to promote college attendance for low-income minority
students.
Less than half of students felt socially prepared to interact and communicate
with faculty, staff, students, and others in the college community. This type of
interaction is crucial to establishing social networks that could help students reach their
goals of obtaining a college degree. Feeling socially unprepared was universal, such
151
that no group of students was significantly more likely than another group to report
feeling socially prepared for college.
Tuition Costs and Funding
Funding and tuition costs were very important to the college decision; of the
two, funding was most important. Housing costs and grants were the financial issues
most significant to college type, and they were both considered more important to four-
year college students than to two-year college students. Ironically, although much of
the literature focuses on academic and financial barriers to college, students in this
study reported feeling most prepared academically (55%) and financially (30%), and
least prepared socially (43%) and culturally (21%). Respondents’ rated scholarships as
the most important financial variable; tuition was a close second. Loans were least
often rated important. Guaranteed tuition seemingly alleviated some concern for tuition
costs, and largely, the burden of student loans, which has traditionally limited college
attendance for other low-income minority students. Respondents placed equal
importance on scholarships and loans, with no significant differences by college type.
Although 93 percent of respondents attended college, many felt unprepared in any way;
this could signal potential future barriers to college retention and educational
attainment, issues that are beyond the immediate scope of this research.
Almost all respondents believed that funding was very important, and
approximately 27 percent speculated that they would not have attended college without
program funding. Without program funding, respondents said they would have most

152
likely increased their borrowing for college. Although one third of college students said
they would not have attended college without program funding, one-half of students
said they would not have attended without the program’s college planning assistance.
Funding is very important, but not the most important consideration in the college
attendance decision. The fact that over 60 percent thought they would still attend
college without the funding illustrates that money was not thought to be the most
important consideration for low-income minority students seeking a college education.
The Influence of College Characteristics, College Academics and Majors, College Recruitment, and Advice Received
Knowing the factors related to college characteristics, college academics and
majors, college recruitment, and advice received can deepen our understanding of how
low-income minorities make college attendance decisions. Students at four-year
colleges were significantly more likely to say that appearance of campus and campus
housing (expected) were important. Other variables were not significant to college
type, but were very important to the college admission decision. Distance from home
was important, especially to community college students, who are most likely to live at
home while attending college. Average class size was also important, especially to four-
year students. Factors that differentiate one college from another were significantly
more important to four-year students, namely the availability desired of college major,
and housing, and the appearance of campus. However, whether the college offered
students’ desired college major was said to be important to all respondents.
153
College characteristics, as a category, were more important than college
academics and majors or college recruitment variables. Regarding college academics
and majors, only the SAT/ACT requirements variable was significant to college type.
Community college students (who had the lowest SAT scores) were more likely than
four-year students to place importance on SAT and ACT requirements. This
consideration is most likely a reflection of community college students adjusting their
college choices to match their low SAT scores, which they believed was an academic
barrier to college attendance (described in barriers sections).
College recruitment variables that fostered human interaction were rated most
important by all college attendees. The most important college recruitment variables
were reportedly college fairs, college representative visits to the high school, and
college campus visits. College fairs and campus visits were most important to two-year
students. In contrast, college brochures and websites were the least important
recruitment variables.
Program advisors were named as the most widely used information source, and
the most important information source, followed by parents and family. Interestingly,
the ratings that respondents gave to teachers and counselors as important information
sources were similar to the importance ratings they gave for non-human information
sources, and those with one-way communication driven by the student. In a separate
item, respondents rated the importance of the advice they received; the most important
advice received was reportedly from program advisors, family, and high school

154
counselors. Community college students were significantly more likely to receive
advice from family; four-year students were significantly more likely to receive advice
from high school counselors.
Perceived Barriers to College Access
Although many respondents reported that they did not face barriers that limited
their higher education choices, some respondents reported the academic, financial (see
cost and funding section), college preparation, and personal factors that restricted,
affected, and influenced their higher education decisions. Low SAT/ACT score was the
most frequently stated academic barrier, and was most pervasive with community
college students; this was probably because they made an effort to select a college into
which they could be admitted with their low-perceived scores. The majority of students
did not report facing academic barriers, which is consistent with the general feeling of
being academically prepared to enter college. Low SAT/ACT scores were found to be
one reason why low-income minority students in this study attended community college
more often than four-year colleges and universities.
College preparation barriers were faced more often than were academic barriers.
Limited knowledge of education options and college admission processes was the most
common college preparation barrier; this barrier was a limitation of the students
themselves, and of their families, which had limited abilities to assist respondents in
college planning. Consistent with that finding, college preparation barriers were the
most significant to college type. [Refer to the discussion on bridging (social) capital
155
and cultural capital.] The most pervasive personal limitation to college options
considered were a desire to stay close to home (2-year students) and a responsibility to
provide for parents and family. These factors may have limited the options considered
to those that were close to home. The respondents who expressed a need to provide for
their parents and family might have been less likely to enroll full-time, or to have
adequate time to commit to studies because of their jobs. Personal barriers were by far
the most universally recognized type of barriers, and were the least significant to the
type of college attended.
As stated previously, a disproportionate number of low-income minorities in this
study chose community colleges over four year colleges for a number of stated reasons.
First, students with low SAT/ACT scores were most likely to attend community college
over four-year colleges. Second, community college students also had the lowest levels
of perceived cultural and financial preparation to enter college. Third, a desire to stay
close to home seemingly limited the number and types of colleges they considered
attending. Fourth, they had a more pervasive need to provide financially for parents and
family. Finally, they were most likely to be raised by single parents.
Most students who chose a community college did so to complete their core
courses (basics) in hopes of transferring to a university. Others said they wanted to try
out college, a point that reflects a need for stronger academic and cultural preparation
before enrolling at a four-year college. (Unfortunately, students who transfer are likely
to take longer to graduate, and increased graduation time decreases the likelihood of

156
graduating.) In addition, by attending community college, students may not be
immersed within the college culture as quickly or as deeply as if they have attended
four-year colleges and universities at the onset.
Maslow’s (1943) hierarchy of needs postulates that the most immediate and
fundamental needs of a person (e.g., shelter, safety, and food) must be met before a
person can strive to meet higher-level needs (e.g., self-actualization synonymous with
obtaining a college degree). Many respondents in this current study communicated
immediate needs, such as providing for their families and needing income. It appears as
though, consistent with the literature, those needs took priority over the more long-term
goal of educational attainment, and explained a financial reason why some respondents
chose to attend community colleges over four-year universities, despite their stated
goals of obtaining a bachelor’s degree or higher. The following response from a
community college student captures the economic need and responsibility to care for
parents that limited some respondents’ higher education choices.
My mother was at home struggling to pay the bills and get my little brother
through school, so I decided to stay home for two years and help out, besides
I can get all my basic classes out [of] the way.
Respondents who were attending four-year colleges used more positive tones when
explaining why they chose to attend four-year colleges. Four of the most common
reasons given for attending a four-year college were (a) the desired major was offered,

157
(b) a desire to reach educational goals, (c) the reputation of the college, and (d) to
experience college life.
Satisfaction with Higher Education Decisions
In addition to the four research questions, this study explored satisfaction and
dissatisfaction with the college decision once it was made, as an indicator of the
likelihood to persist through (bachelor’s) degree completion. Students were most
satisfied with the actual decision to attend college because they are acquiring new
knowledge, experiencing a new environment, and setting goals for themselves. A
majority were satisfied with the college attended, although some reportedly satisfied
students said they would switch colleges if they could. Students were reportedly least
satisfied with their chosen academic major. Knowing how current college students feel
about their previous college choices is meaningful for educators to share with
prospective college students, to assist them in the matching process. Respondents were
also dissatisfied with the heavy workload of academic assignments (readings;
homework; class work; and exams). This finding contrasts with respondents’ perceived
academic preparedness to enter college; a slight majority of respondents indicated that
they faced no academic limitations, and perceived that they were academically prepared
to enter college. Although they initially felt academically prepared to enter college,
they may now be feeling academically unprepared to succeed.

158
Implications for Policy
Academic, social, cultural, and financial preparation are central to low-income
minority students’ decisions about whether to attend college and the type of college to
attend. Education policies should offer increased grant and scholarship support for
college, and must include social and cultural components to bridge the cultural deficits
of low-income minority students, who are not well informed in maneuvering the
application, admission, and funding processes necessary to attend college. Any
initiative or policy that has financial resources attached must focus also on social and
cultural capital of the students. Without social and cultural capital, low-income
minority students will still be unlikely to attend college (and to graduate).
Students who demonstrate high academic achievement and a desire to attend
college should be steered into four-year colleges and universities whenever possible.
Beginning at a four-year college, instead of “trying out college” (as some respondents
said) at a community college, familiarizes students with the rigors of college at the
onset, and immerses them in the college culture, thus improving graduation rates.
Minimizing transfers also promotes continuity and thereby increases the likelihood of
graduating from college. Low-income minority students who are academically
prepared to enter four-year colleges and universities should be aided to do so. As the
current study found, academically qualified, low-income minority students often attend
community colleges instead of four-year colleges/universities because they do not feel
financially, socially or culturally prepared to enter college, or to be successful therein.
159
Financial Preparation
Increasing funding for college attendance is an essential step toward realizing
parity in higher education. A universal tuition forgiveness program should be
implemented to increase college access, and improve college retention and educational
attainment for low-income students. The best way to implement a comprehensive,
standardized program is through the federal government, managed by the U.S.
Department of Education. The proposed tuition forgiveness program would provide an
established percentage of credit (or refund) for each semester in which students certified
as low-income are enrolled full-time, with additional credits given for (a) enrolling in
continuous long semesters (fall and spring) without interruption, (b) maintaining at least
at 2.75 GPA, and (c) pursuing career tracks most needed to boost the U.S. economy.
The national tuition credit program would promote student success by aligning student
enrollment with college retention and college success indicators. Whether managed by
the federal government or higher education institutions, the program would help to
promote enrollment benchmarks and the academic standards that colleges promote,
providing a mutual benefit to students, colleges, and the national economy. In addition
to offering tuition credits, properly matching students with the appropriate financial
resources is crucial to broaden the higher education considerations of academically
prepared students. A lack of financial resources was found to be a barrier to college
attendance for low-income and minority students who desired to attend college.
160
Social and Cultural Preparation
Students. African American and Latino students were found to have high
educational and career goals, but they reach those goals at much lower rates than do
their White counterparts. One theory is that these students have more abstract ideas of
educational attainment and lack relevant examples of the benefits of educational
attainment; therefore, they do not generally align their behaviors with those required to
reach their stated educational goals. Over 94 percent of respondents in this study
reportedly desired to obtain a college degree, yet more than 70 percent of them reported
feeling unprepared socially and culturally to enter college. In addition to course
content, enriching experiences that can connect current high school students with
college campuses will strengthen the relevance and connectedness of their goals, and
will therefore make their ideas of achievement more concrete.
One way to expose low-income minority students to real-life examples of
college goers is by using current college attendees as mentors for high school students.
Mentors from the same high school can help students plan for college and can give
advice on what is important when selecting a college. This program is envisioned as a
joint collaboration between the college and the high school, which would communicate
to students and school administrators the notion that high school and college are
connected in the P-16 continuum that should provide a smooth and successful transition
for students. Mentoring high school students would promote the retention of the college
mentors, by guiding others to discover the tools that will aid their success. Colleges

161
should provide service-learning credit for the mentors, and high schools should provide
social studies, general elective, career planning, or vocational credit for participating
students.
Another reason to facilitate interaction between high school students and college
goers is that through immersion, high school students will increase their familiarity with
the culture of college, and begin to adopt the values and norms of the dominant class,
from which many of these students are often segregated. Facilitating interaction
between students and the college community will promote meaningful communication
and interaction to strengthen students’ social capital.
Parents. Parents should be included in college visit and college planning
activities to strengthen their college knowledge, and learn about college culture,
requirements (e.g., academic and financial), in order to have realistic expectations. The
overwhelming majority of parents in this study were not college educated, and had low
levels of dominant cultural capital, lacking the knowledge about college preparation that
their students were trying to acquire. The limited ability of parents to help their
children reach their goals signified diminished parent-teen social capital transmission.
Therefore, to promote parent-teen, parent-school, and parent-parent interactions for
social capital development, parents must learn enough about college to understand their
student’s goals, and to work with schools and universities to assist their students in
reaching their goals.
162
Community organizations and not-for-profit agencies must engage parents in
cultural and educational field trips and training programs focused on higher education.
Because low-income minority students’ parents generally have low levels of dominant
cultural capital, interaction between low-income parents, community leaders, and
school administrators must help parents to build bridging capital. Bridging capital is
needed to connect low-income families with community resources and other people
who can assist them as they navigate within the school and college communities.
Respondents in this survey felt that their higher education choices were limited by
insufficient knowledge about college options; moreover, they felt that their parents’
limited knowledge about college admission processes further restricted their higher
education decisions. Parents must receive training to advocate on their students’
behalves, and to change their family norms by expecting academic excellence and
college attendance, thus strengthening parent-teen forms of social capital. If parents
acquire this knowledge, they will be better able to help their students to attend college.
Getting a college education can improve the social and economic mobility of the
students. It can also indirectly improve the lives of their families because the college-
educated students can better support their families financially than without such an
education.
Academic Preparation
To reduce academic deficits, policy must be implemented to provide enrichment
opportunities to level the playing field for students who are suffering from knowledge

163
mismatch and academic deficits. Such support should be in the form of summer
enrichment academies, extended day programs, or weekend programs to provide
student-centered learning in core academic areas as well as standardized testing. The
enrichment academies must be implemented in Title I (low SES) schools, which
educate the majority of low-income and minority public school students in US.
Offering supplemental workshops focused on standardized tests would provide
tremendous support for African American and Latino students who historically have the
lowest mean SAT and ACT scores of all races/ethnicities nationwide. Low standardized
test scores act as gatekeepers to college in general, and to four-year colleges
specifically. SAT and ACT preparation workshops would familiarize students with the
content, language, structure, and mental demands of the exams, as well as strategies to
improve performance. Such knowledge would provide low-income minority students a
fairer chance to compete against other students for competitive college admission. Test
preparation would also help students to be realistic about their academic preparation for
better college matching.
As a precursor to standardized testing however, a concerted effort must be made
to enroll low-income students in college preparatory curricula before entering high
school. Not taking, and having limited access to advanced level and honors courses
were presented in the literature as two additional barriers (via SAT/ACT) to college
access for low-income minority students, as was limited knowledge about college
planning processes. As Cammorata (2007) found, low-income minority students are no

164
less capable than other students are to handle academic challenges; they just need
proper guidance and high relevancy to their everyday lives.
Some literature suggests that students have decided by grade 10 whether they
will attend college, and most at that point expect to attend (Ingels et al., 2005).
Therefore, high school curriculum planning must begin during the middle school years.
Early formation of goals allows time for necessary behavior alignment for goal
achievement. If a student does not formulate higher education goals until late in high
school, and does not take the necessary advanced and honors level courses to prepare
for college, the high school years could be too late to remedy the cumulative gaps in
instruction and learning. Steering low-income minority students into advanced and
honors courses will familiarize them with the challenging content tested by SAT/ACT
and will promote academic preparation for college. Tracking students early will also
promote the importance of planning to obtain long-term goals.
Other ways to help students to understand the academic requirements of college,
are through college course auditing, dual credit enrollment (I.e. taking college-level
courses for credit in high school and college, while in high school), and international
baccalaureate academic programs. All of these programs would give low-income
minority students an early indication of the rigorous academics of college so they know
the academic requirements at the onset. Knowing the academic requirements for
college admission and college graduation can help students prepare to meet those
expectations, while still in high school.
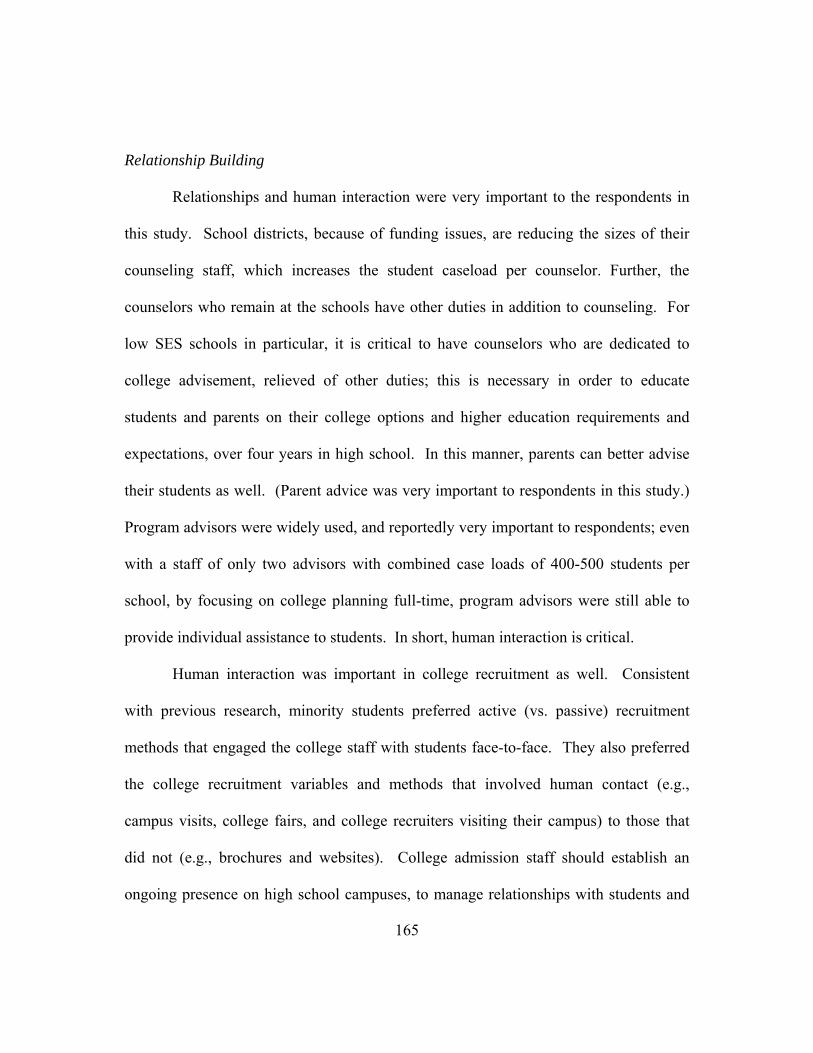
165
Relationship Building
Relationships and human interaction were very important to the respondents in
this study. School districts, because of funding issues, are reducing the sizes of their
counseling staff, which increases the student caseload per counselor. Further, the
counselors who remain at the schools have other duties in addition to counseling. For
low SES schools in particular, it is critical to have counselors who are dedicated to
college advisement, relieved of other duties; this is necessary in order to educate
students and parents on their college options and higher education requirements and
expectations, over four years in high school. In this manner, parents can better advise
their students as well. (Parent advice was very important to respondents in this study.)
Program advisors were widely used, and reportedly very important to respondents; even
with a staff of only two advisors with combined case loads of 400-500 students per
school, by focusing on college planning full-time, program advisors were still able to
provide individual assistance to students. In short, human interaction is critical.
Human interaction was important in college recruitment as well. Consistent
with previous research, minority students preferred active (vs. passive) recruitment
methods that engaged the college staff with students face-to-face. They also preferred
the college recruitment variables and methods that involved human contact (e.g.,
campus visits, college fairs, and college recruiters visiting their campus) to those that
did not (e.g., brochures and websites). College admission staff should establish an
ongoing presence on high school campuses, to manage relationships with students and

166
staff, and educate students about admission requirements while steering them toward
scholarship opportunities. Additionally, inviting high school students to college
campuses for special programming with extended immersion (such as a weeklong
academy) or special prospective or other student programs would increase academic
success of the students in high school and college.
Properly matching students to colleges, as stated previously, is critical for
promoting enrollment at four-year colleges/universities; it is also important to promote
the satisfaction of the student long-term, and the student’s likelihood of persisting to
graduation. There are many on-line tools available to match students’ variables;
variables include (a) academic achievement, (b) standardized test scores, (c) academic
majors desired, (d) educational goals, (e) desired location, and (f) college cost, to help a
student find a college that is an ideal fit. Students in the survey, even those who said
they were satisfied with their current college choice overall, indicated that they would
transfer colleges if they could, due to some level of dissatisfaction with the current
college choice. Switching colleges often causes students to lose the transferability of
credits for courses taken, however, which can increase the time necessary to earn a
college degree. As we know, the longer a student takes to complete a college degree,
the less likely the student is to earn a degree. Some survey participants were
dissatisfied with the college they chose to attend; others were dissatisfied with their
college majors. By sharing their experiences of satisfaction and dissatisfaction, college
attendees (in addition to profile matching) can assist with the college matching process.
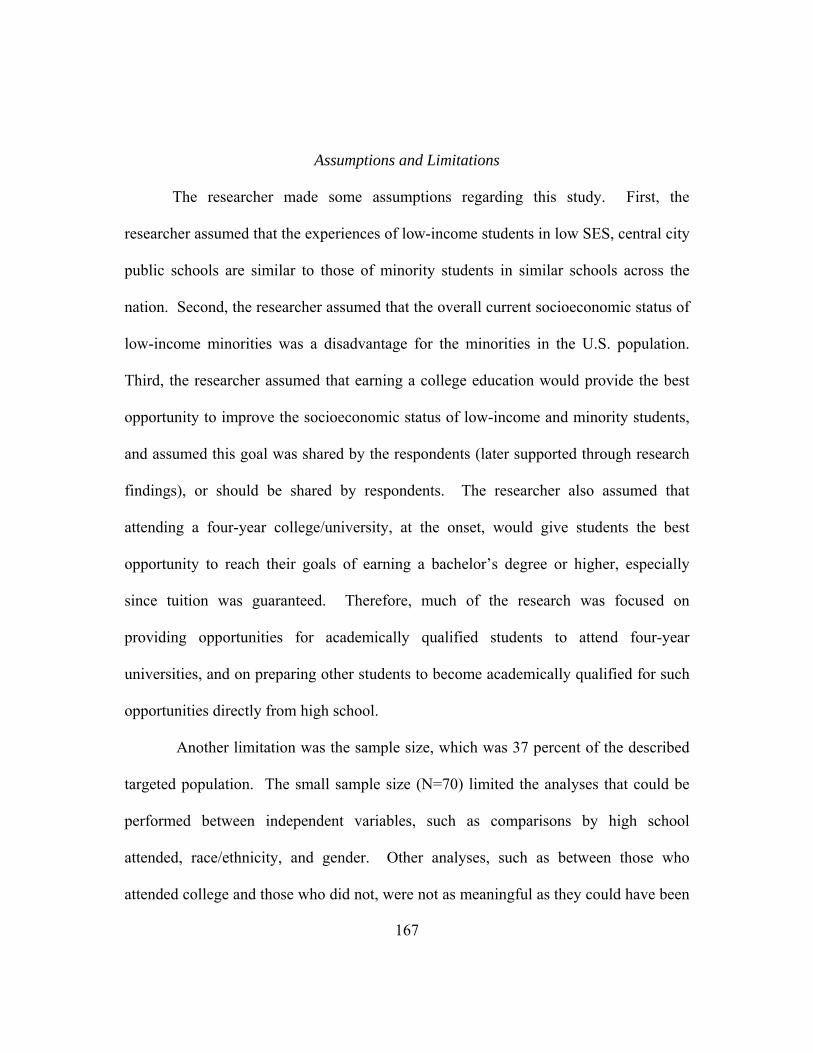
167
Assumptions and Limitations
The researcher made some assumptions regarding this study. First, the
researcher assumed that the experiences of low-income students in low SES, central city
public schools are similar to those of minority students in similar schools across the
nation. Second, the researcher assumed that the overall current socioeconomic status of
low-income minorities was a disadvantage for the minorities in the U.S. population.
Third, the researcher assumed that earning a college education would provide the best
opportunity to improve the socioeconomic status of low-income and minority students,
and assumed this goal was shared by the respondents (later supported through research
findings), or should be shared by respondents. The researcher also assumed that
attending a four-year college/university, at the onset, would give students the best
opportunity to reach their goals of earning a bachelor’s degree or higher, especially
since tuition was guaranteed. Therefore, much of the research was focused on
providing opportunities for academically qualified students to attend four-year
universities, and on preparing other students to become academically qualified for such
opportunities directly from high school.
Another limitation was the sample size, which was 37 percent of the described
targeted population. The small sample size (N=70) limited the analyses that could be
performed between independent variables, such as comparisons by high school
attended, race/ethnicity, and gender. Other analyses, such as between those who
attended college and those who did not, were not as meaningful as they could have been

168
if more non-attendees had participated in the survey. Offering a financial incentive to
the students who responded likely helped to increase the sample size; however, it may
have diminished the integrity of responses. In other words, some students may have
just rushed through the survey, without thoughtfulness to their answers, to earn the $25
gift card. A couple of respondents completed the survey multiple times; they were
counted only once in the results. It is interesting, though, that some such students did
not match their responses on all versions of the completed questionnaire. The
researcher chose to keep the first completed questionnaire and to discard subsequent
versions because the researcher believed that the first response was probably the most
accurate and honest. The subsequent responses may have been an attempt to earn more
gift cards, but the researcher cannot be sure of the reasons. In addition, because there
were only 70 respondents, and all of them were involved in a not-for-profit college
readiness and college access program that guaranteed tuition funding, the findings may
not be generalizeable to the entire U.S. population of low-income minority students.
However, the insight that this study provides is valuable for furthering analysis and
dialogue.
Survey research, although it has many positive qualities, such as increasing the
possible reach, reducing active researcher influence, and providing anonymity, is also
limited. Two major limitations of survey method are the potential for misinterpretation
and the lack of clarification possibilities (Babbie, 2001). The researcher cannot be sure
that the questions, as asked, had the same meaning for the respondents as for the

169
researcher. For example, one item asked respondents if they knew someone who
attended college, and if so, who. Several respondents selected “yes,” and then later
after being provided a list of possible people (such as parents, friends, neighbors) and an
“other” box for write-ins, wrote in “no one.” The respondents either knew someone
who was not on that list and did not see the “other” box, or incorrectly answered the
first item. In these cases, the researcher assumed that the first responses should have
been “no”. Another respondent, on the same question, selected “other” and wrote in
that her boyfriend attended college; this response was recoded as “friend”.
Respondents may have felt guided in their responses by knowing that the
research was conducted by someone who has a close relationship with the program. For
example, in asking which information sources they utilized, respondents almost
unanimously selected program advisors. It is the mission of program advisors to meet
regularly with all students in their caseload; however, because of the large caseloads,
this may not have been the case. Nonetheless, almost 90 percent of respondents said
that it was.
Recommendations for Future Studies
This study presented a snapshot of students who graduated from high school and
were involved in a not-for-profit college access program. This research was valuable
because it provided insight into the higher education decisions of low-income minority
students, and how program provided funding and guidance may have mitigated barriers
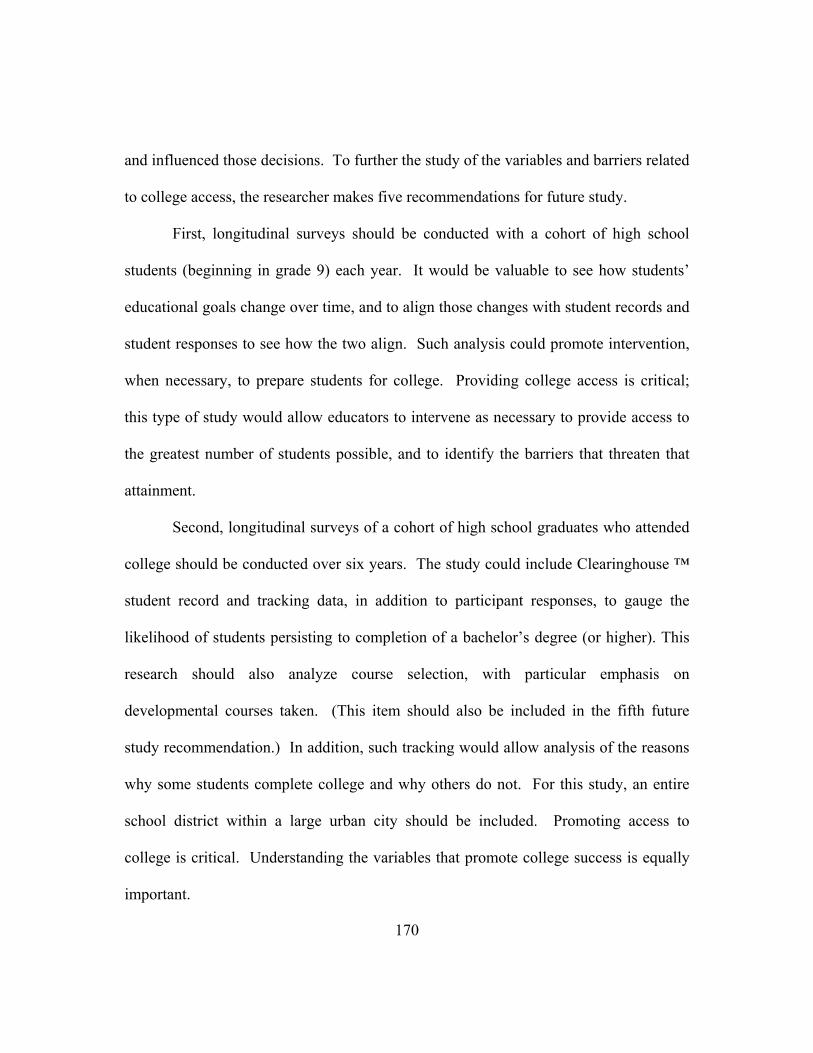
170
and influenced those decisions. To further the study of the variables and barriers related
to college access, the researcher makes five recommendations for future study.
First, longitudinal surveys should be conducted with a cohort of high school
students (beginning in grade 9) each year. It would be valuable to see how students’
educational goals change over time, and to align those changes with student records and
student responses to see how the two align. Such analysis could promote intervention,
when necessary, to prepare students for college. Providing college access is critical;
this type of study would allow educators to intervene as necessary to provide access to
the greatest number of students possible, and to identify the barriers that threaten that
attainment.
Second, longitudinal surveys of a cohort of high school graduates who attended
college should be conducted over six years. The study could include Clearinghouse ™
student record and tracking data, in addition to participant responses, to gauge the
likelihood of students persisting to completion of a bachelor’s degree (or higher). This
research should also analyze course selection, with particular emphasis on
developmental courses taken. (This item should also be included in the fifth future
study recommendation.) In addition, such tracking would allow analysis of the reasons
why some students complete college and why others do not. For this study, an entire
school district within a large urban city should be included. Promoting access to
college is critical. Understanding the variables that promote college success is equally
important.
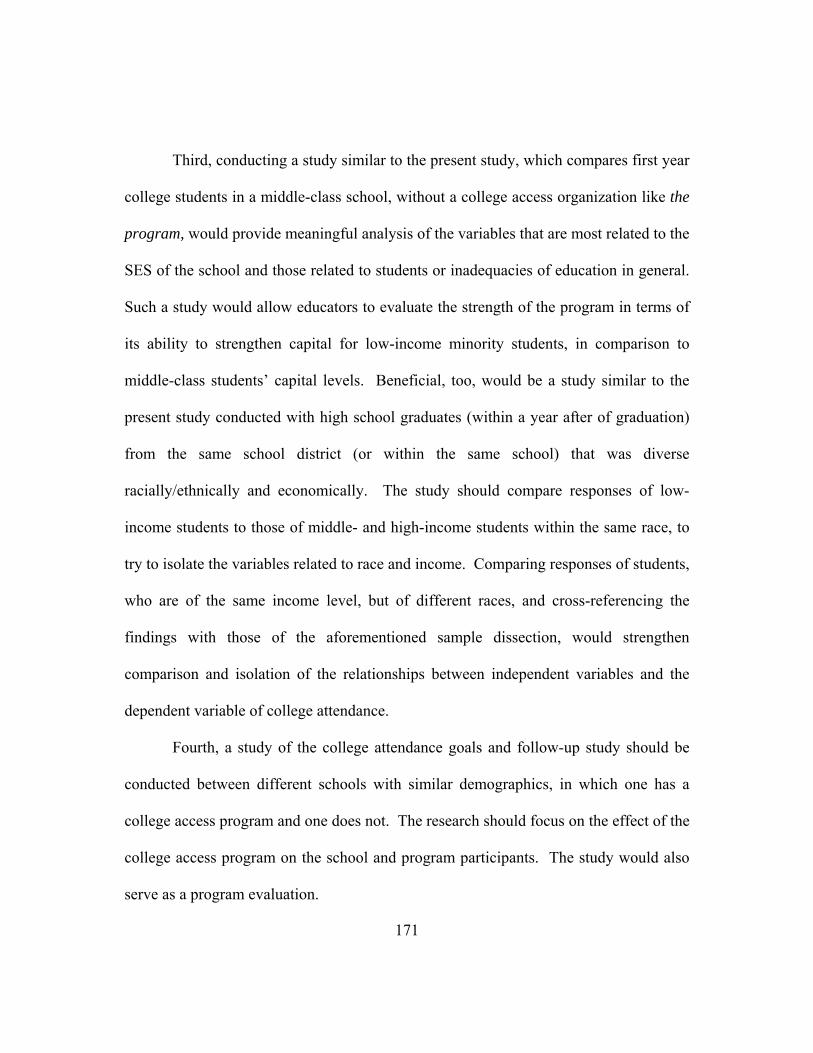
171
Third, conducting a study similar to the present study, which compares first year
college students in a middle-class school, without a college access organization like the
program, would provide meaningful analysis of the variables that are most related to the
SES of the school and those related to students or inadequacies of education in general.
Such a study would allow educators to evaluate the strength of the program in terms of
its ability to strengthen capital for low-income minority students, in comparison to
middle-class students’ capital levels. Beneficial, too, would be a study similar to the
present study conducted with high school graduates (within a year after of graduation)
from the same school district (or within the same school) that was diverse
racially/ethnically and economically. The study should compare responses of low-
income students to those of middle- and high-income students within the same race, to
try to isolate the variables related to race and income. Comparing responses of students,
who are of the same income level, but of different races, and cross-referencing the
findings with those of the aforementioned sample dissection, would strengthen
comparison and isolation of the relationships between independent variables and the
dependent variable of college attendance.
Fourth, a study of the college attendance goals and follow-up study should be
conducted between different schools with similar demographics, in which one has a
college access program and one does not. The research should focus on the effect of the
college access program on the school and program participants. The study would also
serve as a program evaluation.

172
Finally, a follow-up survey each year for the next six years should be conducted
with two components of analyses. First, a case study with the same students from this
present case study should be conducted. Each year, as students matriculate (or not), the
survey would give insight into the key variables that might have changed for the
respondents. One of the variables that might have changed is educational status (e.g.,
enrolled/not enrolled/graduated; 4-year or 2-year college; full-time or part-time).
Perceived academic, cultural, social, and financial preparedness to graduate college may
have changed as well. Social and cultural capital development should be tracked over
time, also. Changing motivation and goals should be researched, as well as changes in
perceived barriers. In addition, satisfaction and dissatisfaction with higher education
choices should be explored as it evolves over time, and may provide insight into the
likelihood of college students persisting to college graduation.
The second layer of analysis should attempt to reach all 189 students in the
described population for this survey. The expanded research would include the same
variables as the current survey, and the proposed survey above, but would provide
greater insight into the variables that are most significant for college graduation. Both
phases of this proposed research should include, in addition to questionnaires, focus
groups, in-person interviews, and written and multimedia ethnographies when possible.
Another benefit of this research design is that including insight from a larger sample
would allow testing of the internal validity of the current survey.

173
This research study was intended to understand (a) how low-income minority
students made their college attendance decisions, and (b) the perceived barriers that
limited their choices for higher education. The current study furthered dialogue with
low-income students about their educational goals and the resources that were available
(and those that were still necessary) to help them reach their goals. Understanding how
low-income minority students make their college attendance decisions can help
educators to provide meaningful, timely, and accurate information in the media (e.g.,
organizational web pages, social networking websites, campus visits, and college
brochures) in which students are most likely to receive it. Understanding the barriers
these students faced (and have overcome) can allow educators to mitigate those barriers
over which they can have some control. Increasing access to higher education for
underserved populations can also increase subsequent educational attainment for these
populations. Increasing both will promote equity in higher education, and hopefully
equitable access to the distribution of benefits associated with it. The words of George
Washington Carver should remind us, “Education is the key to unlock the golden door
of freedom.”

174
APPENDIX A
SURVEY I – FOR RESPONDENTS WHO ARE
CURRENTLY ATTENDING COLLEGE
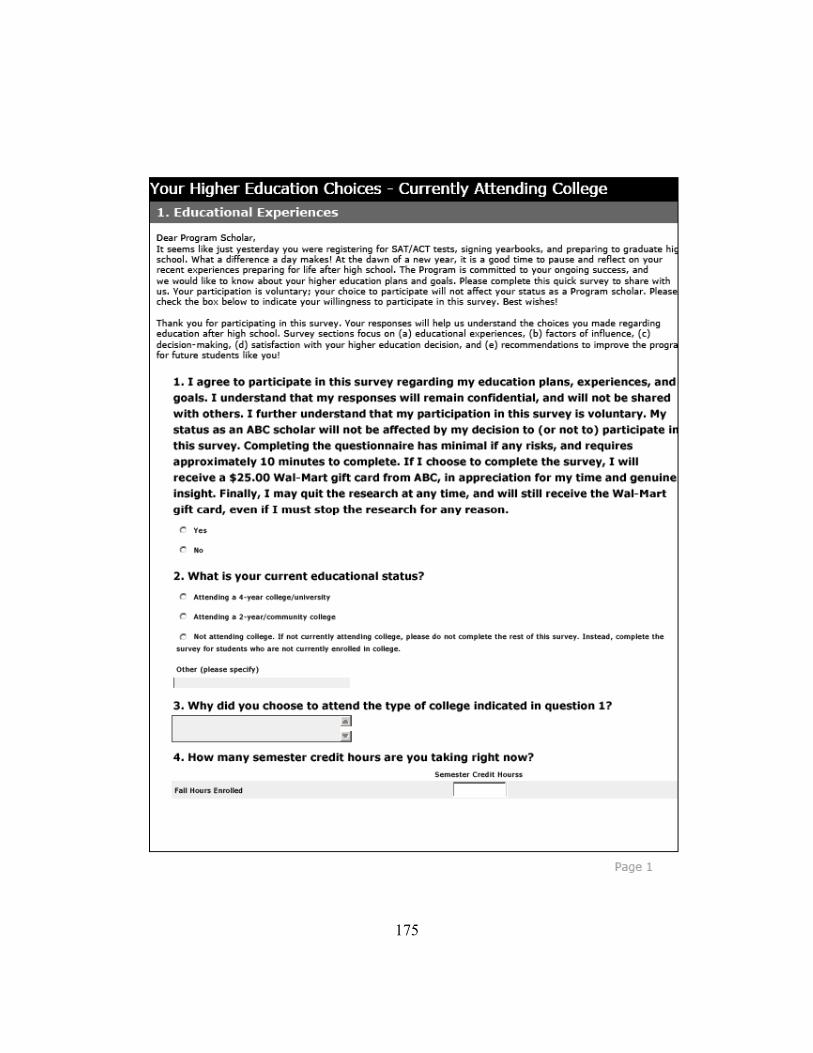
175
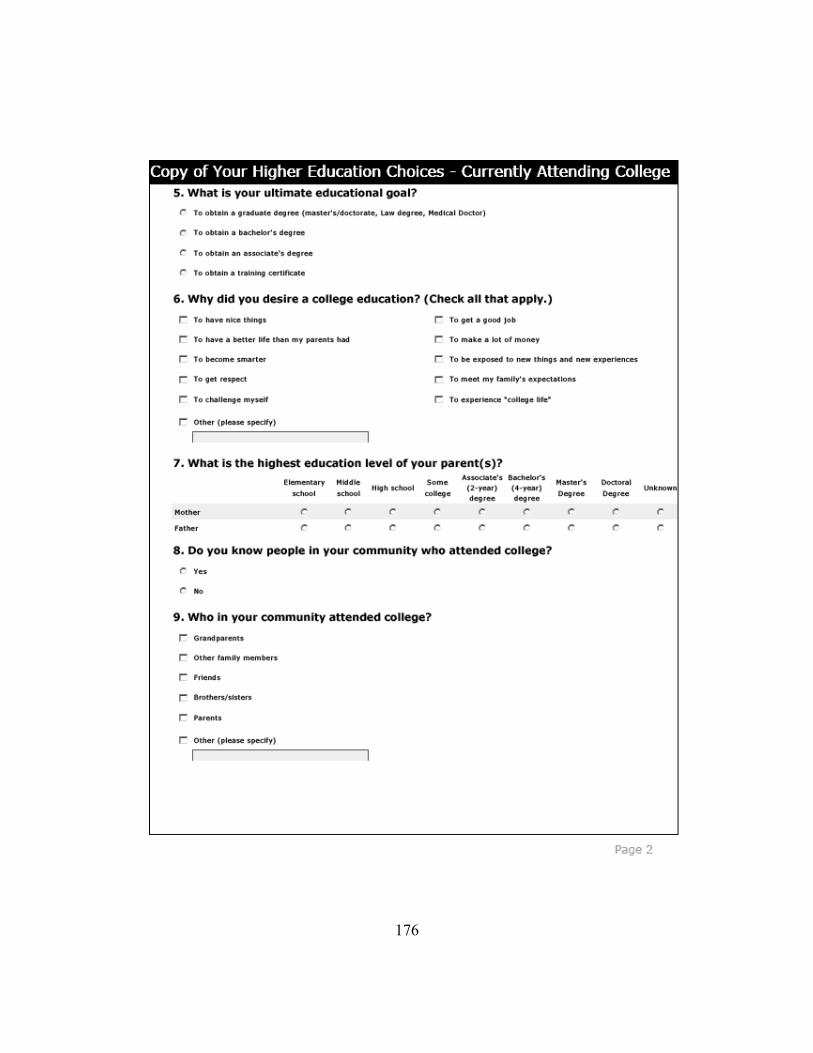
176
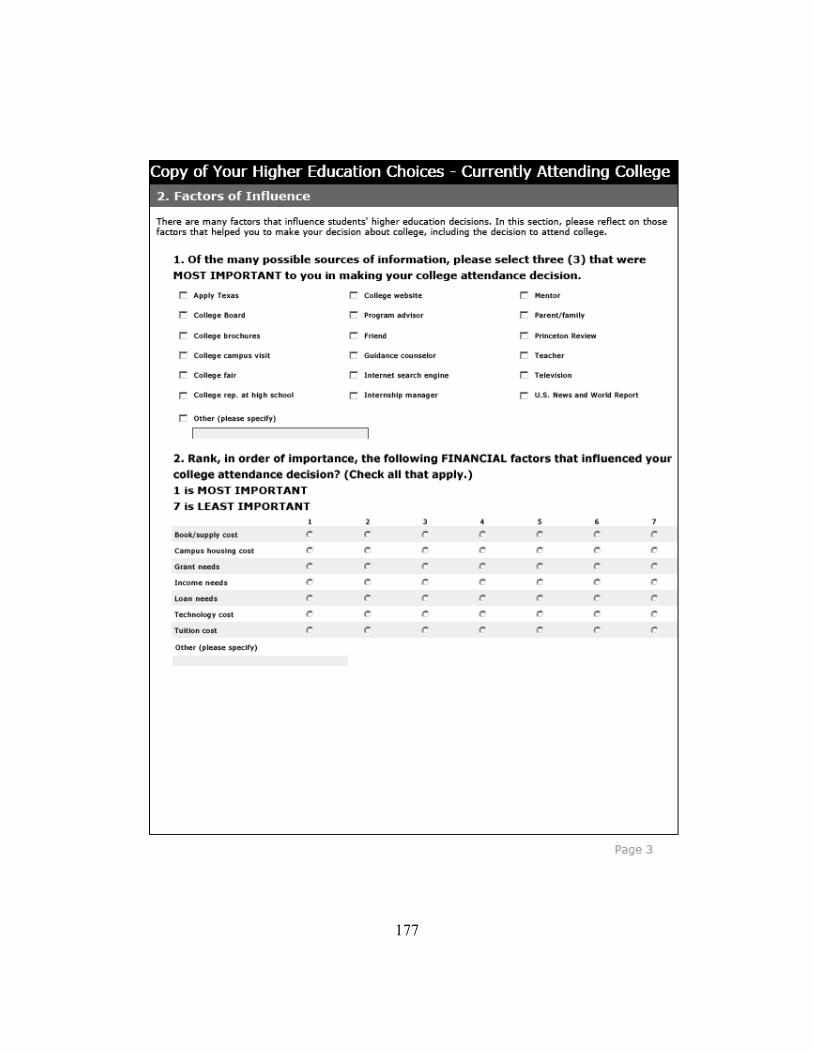
177
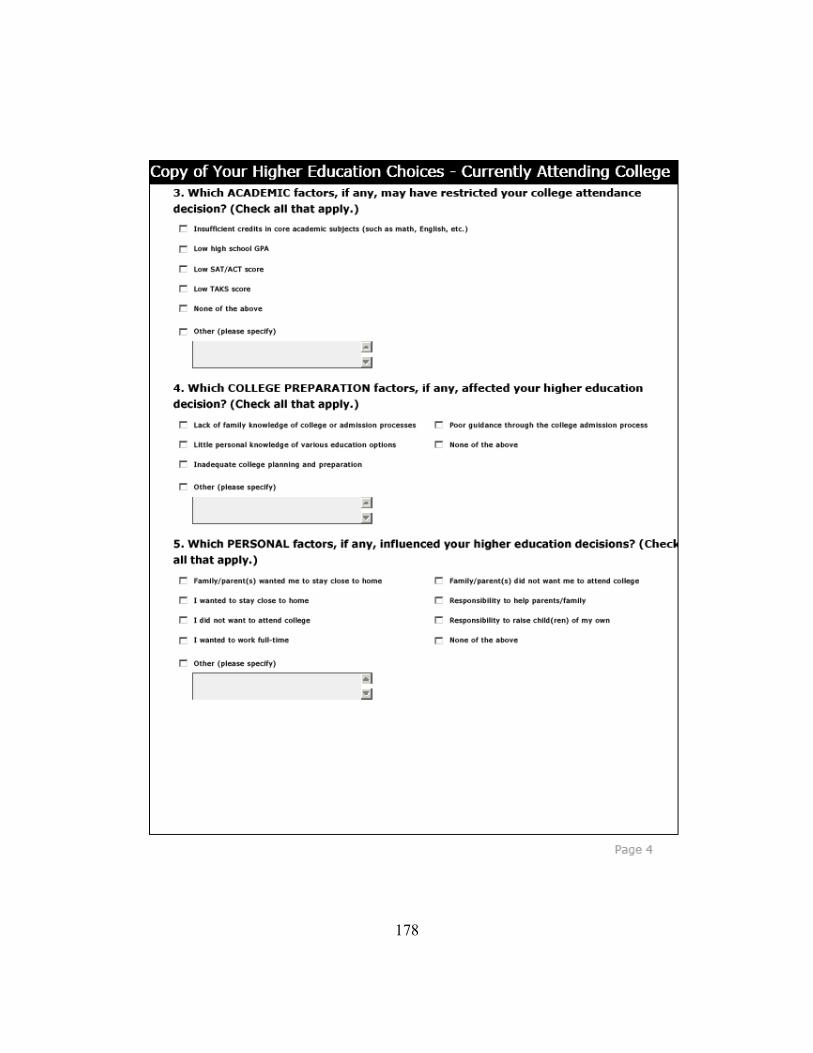
178
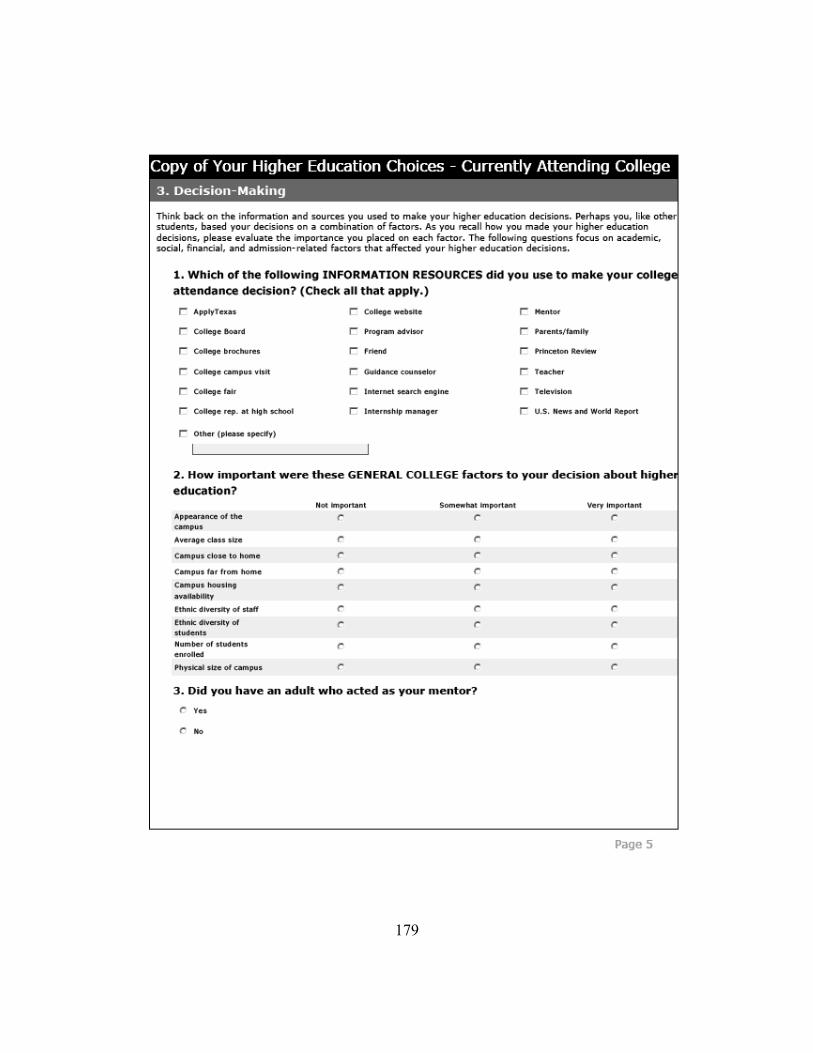
179
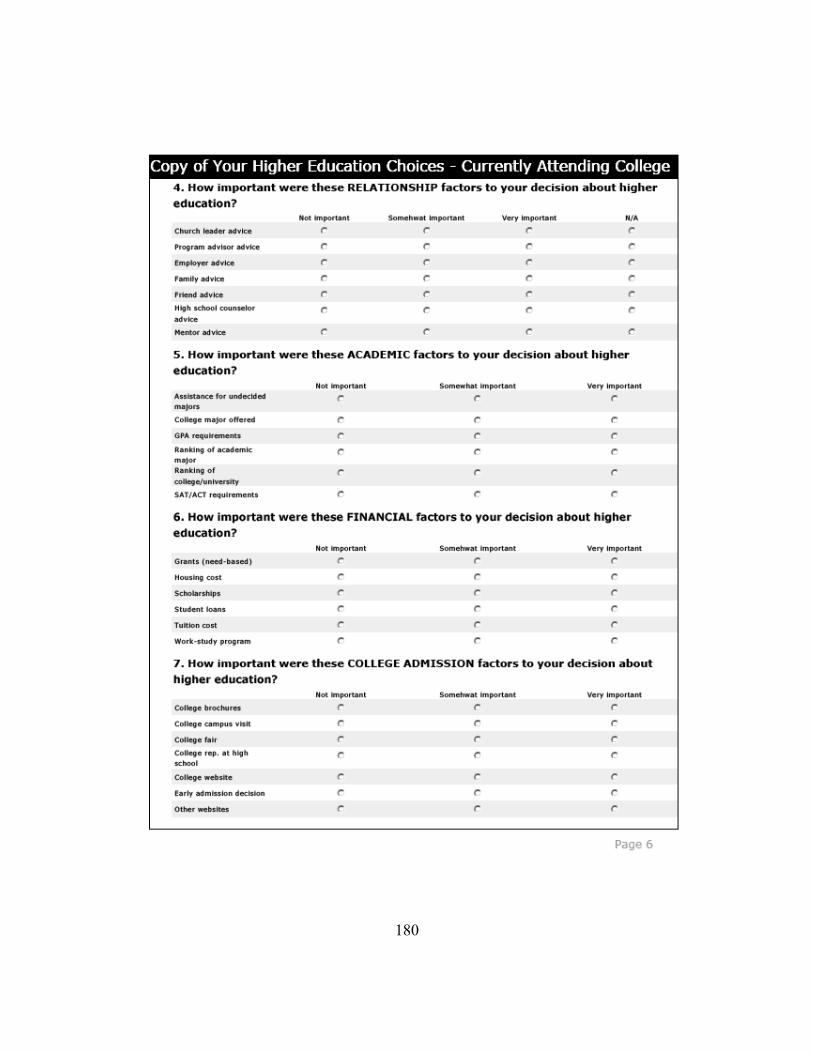
180

181

182

183
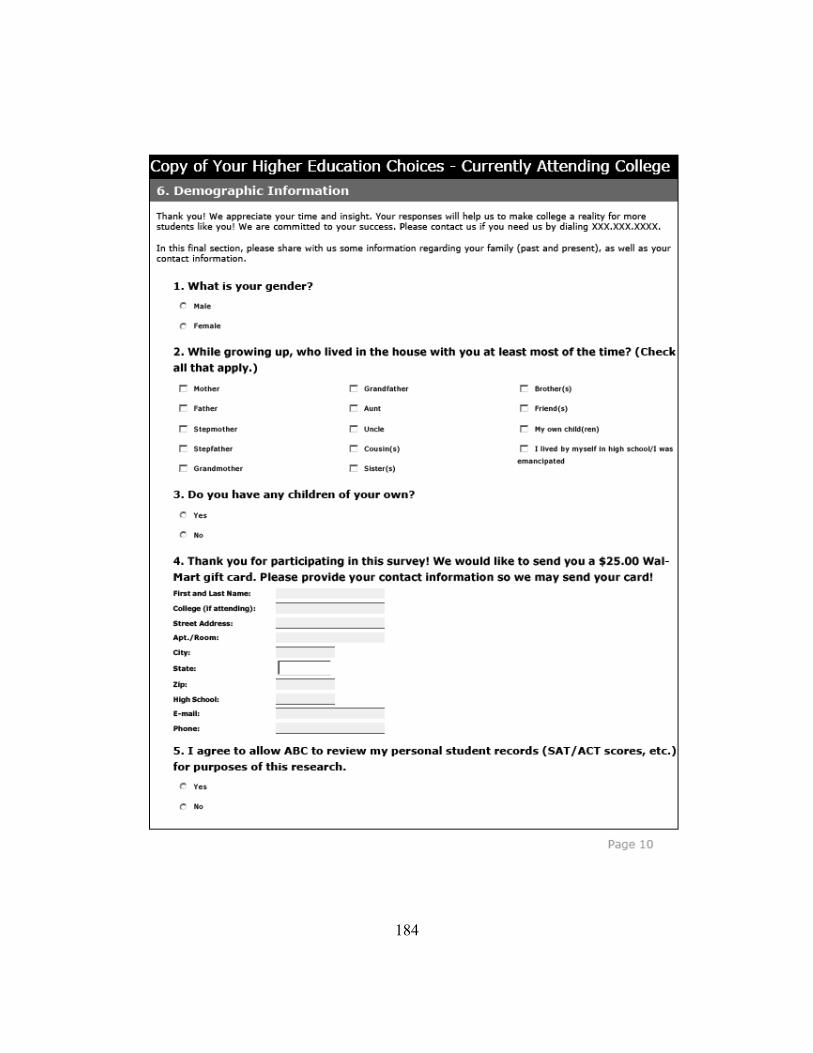
184

185

186
APPENDIX B
SURVEY II – FOR RESPONDENTS WHO ARE NOT CURRENTLY ATTENDING COLLEGE
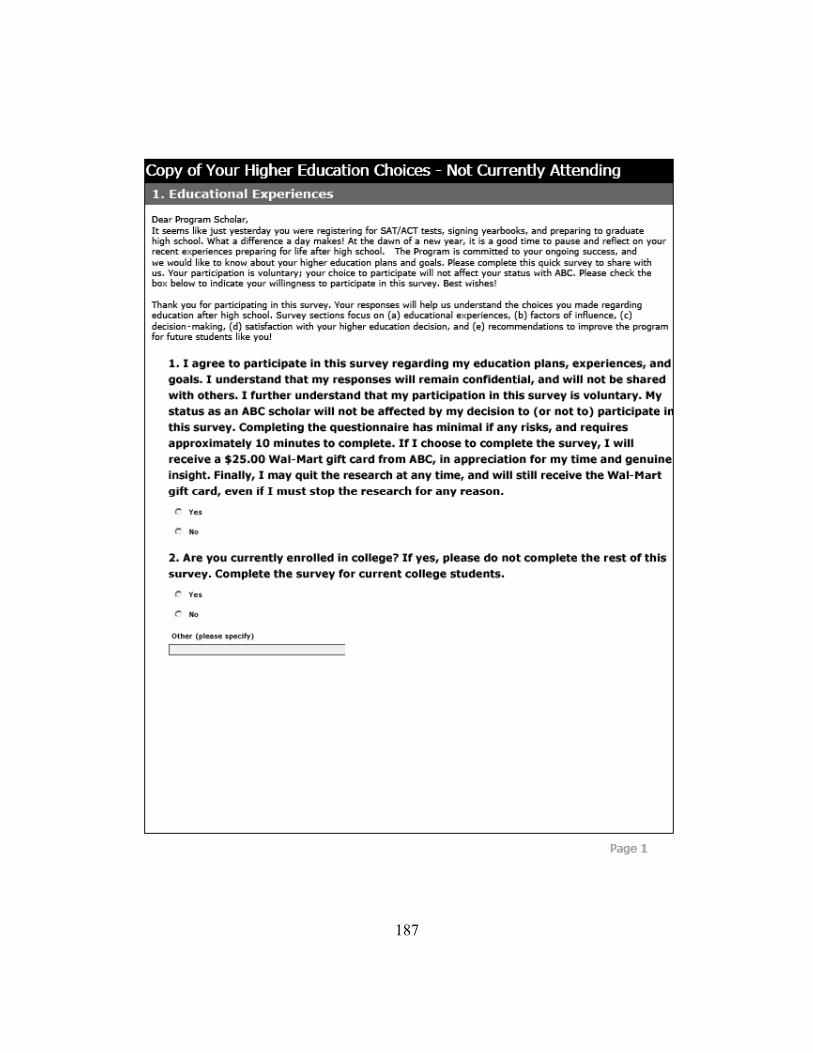
187
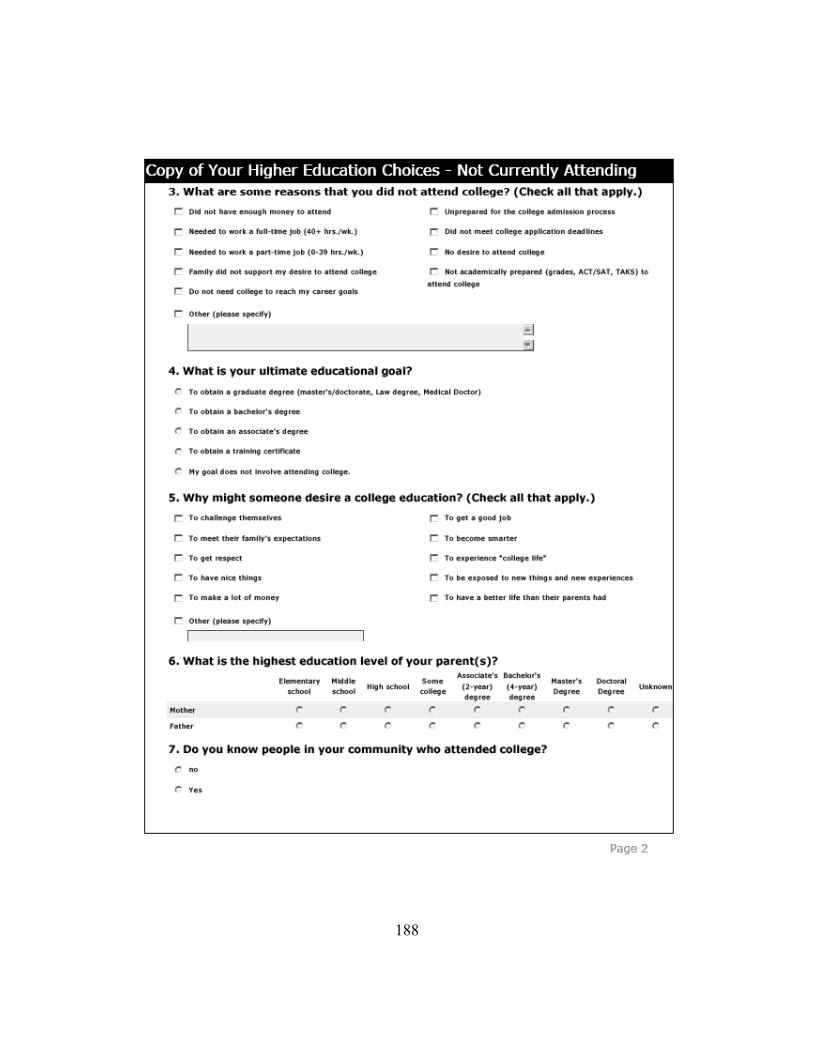
188

189
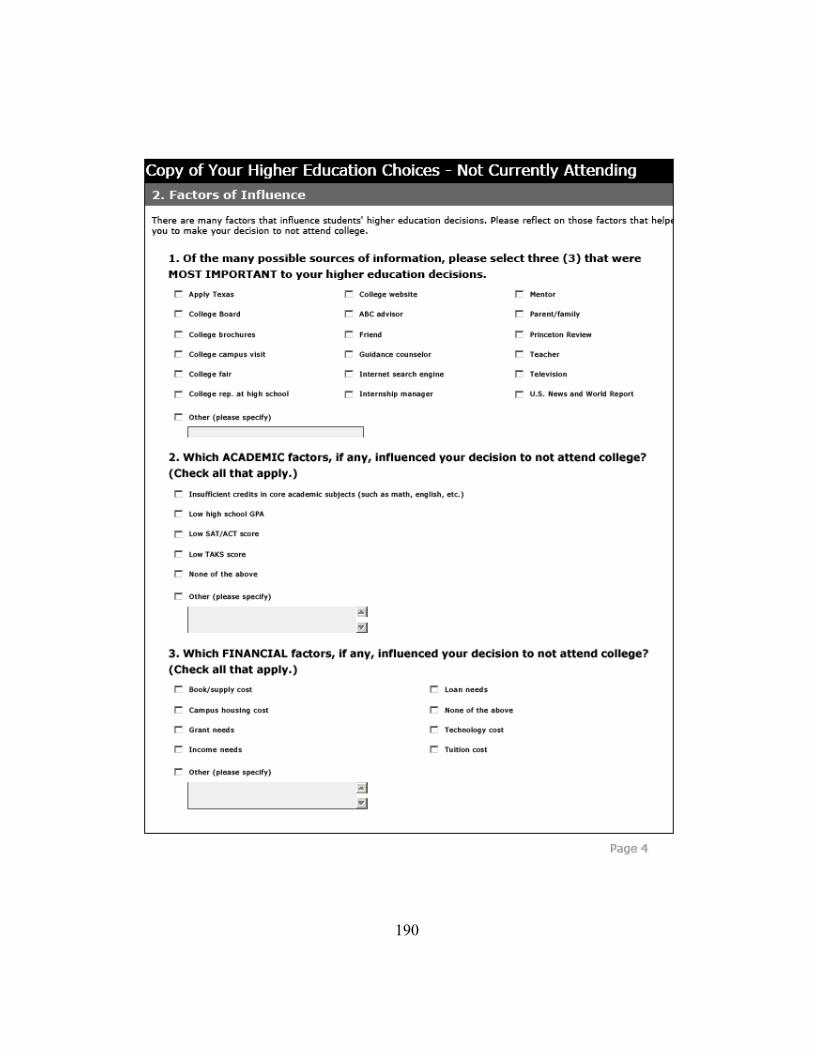
190
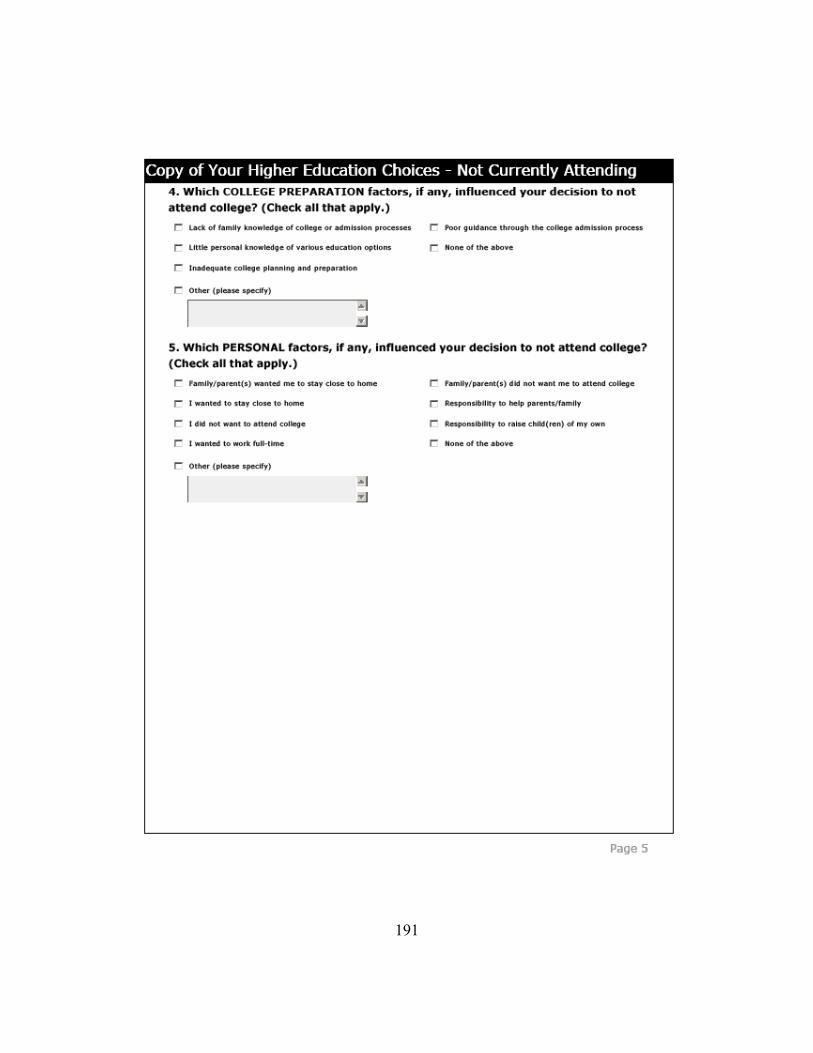
191

192

193
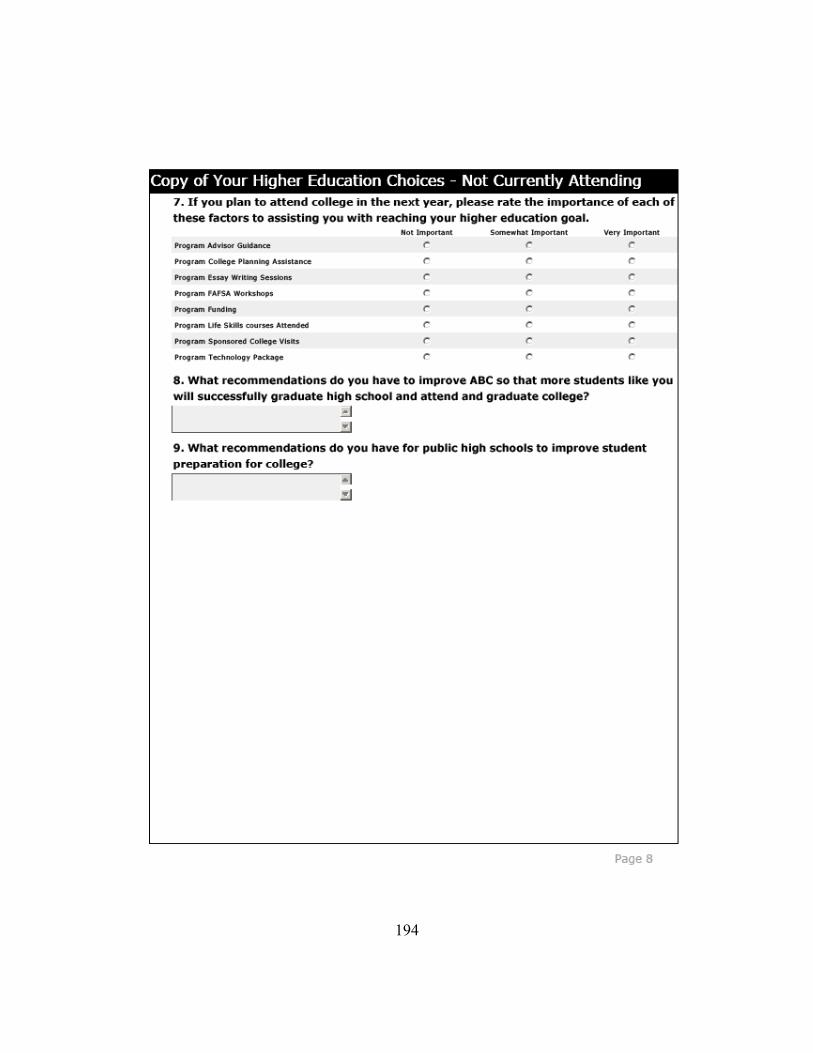
194

195
196

197
APPENDIX C
E-MAIL INTRODUCTION OF THE SURVEY

Dear Program Student, What an exciting time! Just a few months ago, you were completing your senior year of high school. At that time, you were probably trying to decide what to do after high school, deciding which college to attend, what major to study, and possibly what job to take. At this point, many of you have completed your first semester of college. Others have been gainfully employed or taken other avenues. The Program Team would like to know how things are going for you. We have created a survey to allow you an opportunity to reflect on your higher education decisions, including deciding whether to attend college. Please take a few minutes and complete the survey. It is easy to do, and your opinions and insight are invaluable to us. Our goal is to learn more about how you made your education decisions after high school graduation. Knowing this will give us some perspective to improve our program for future students like you! Your responses will remain confidential; we will summarize all responses, and will not identify you individually in any way. If you have any questions, please contact Tiffany Gurley-Alloway, by e-mail or phone. Please complete the survey by 20 April 2009. *** As a bonus, we will send you a $25.00 Wal-Mart gift card for completing the survey by 20 April 2009. Thank you! Click below for the link to your survey. Thanks again. ☺ Sincerely, Your Program Team
198
REFERENCES
Acevedo-Garcia, D., Osypuk, T. L., McArdle, N., & Williams, D. R. (2008). Toward A
policy-relevant Analysis of geographic and racial/ethnic disparities in child
health. Health Affairs, 27, 321-333.
ACT, Inc. (2009). ACT national and state scores for 2008. Retrieved February 17,
2009, from http://www.act.org/news/data/08/charts/text.html#one
Alliance for Excellent Education. (2008, October 27). Facts for education advocates.
Retrieved January 13, 2009, from
http://www.all4ed.org/files/Facts_For_Education_Adv_Oct2008.pdf
Babbie, E. (2001). The Practice of social research. Belmont, CA: Wadsworth/Thomson
Learning.
Black, D., & Henderson, V. (1999, April). A theory on urban growth. The Journal of
Political Economy, 16, 252-284.
Bourdieu, P. (1986) The forms of capital. In J. Richardson (Ed.), Handbook of theory
and research for the sociology of education (pp. 241-258). New York:
Greenwood.
Bourdieu, P. (1973). Cultural reproduction and social reproduction. In R. Brown (Ed.),
Knowledge, education, and cultural change: Papers in the sociology of
education (pp. 71-112). London: Tavistock.
199

Bowen, W. G., & Bok, D. (1998). Why race-conscious admissions make sense. The
College Board Review, 186, 8-12.
Bureau of Labor Statistics. (2008, June 13). Occupational projections and training
data, 2008-09 edition. Retrieved March 27, 2009, from Bureau of Labor
Statistics: http://www.bls.gov/emp/optd/optd.pd
Cammorata, J. (2007). A social justice approach to achievement: Guiding Latina/o
students toward educational attainment with a challenging, socially relevant
curriculum. Equity & Excellence in Education, 40(1), 87-96.
Cantrell, C. E. (1999, January). The legal implications of using standardized tests in
admissions. Paper presented at the annual meeting of the Southwest Educational
Research Association, San Antonio, TX. (ERIC Document Reproduction
Service No. ED 429 085)
Coleman, J., E. Campbell, C. Hobson, J. McPartland, A. Mood, F. Weinfield, and R.
York. 1966. Equality of education opportunity. Washington, DC: U.S.
Government Printing Office.
College Board. (2008). 2008 College-bound seniors: Total group profile report. New
York: Author.
Dowd, A. C. (2003). From access to outcome equity: Revitalizing the democratic
mission of the community college. Annals of the American Academy of Political
and Social Science, 586(Community Colleges: New Environments, New
Directions), 92-119.
200
Dumais, S. A. (2002). Cultural capital, gender, and school success: The Role of
Habitus. American Sociological Association, 75(1), 44-68.
Duran, B. J., & Weffer, R. E. (1992). Immigrants’ aspirations, high-school process, and
academic outcomes. American Educational Research Journal, 29,163-81.
Excelencia in Education. (2007, August 17). Choosing HSIs media final. Retrieved
April 1, 2009, from
http://www.edexcelencia.org/pdf/Choosing_HSIs_Media_Final.pdf
Feagin, J. R., Vera, H., & Imani, N. (1996). The agony of education. New York:
Routledge.
Fuller, H. (2002). Educational choice, a core freedom. The Journal of Negro Education,
71(1/2), 1-4.
Gillham, O. (2002). The limitless city: A primer on the urban sprawl debate.
Washington, DC: Island Press.
Goldsmith, P. A. (2004). Schools’ racial mix, students' optimism, and the Black-White
and Latino-White achievement gaps. American Sociological Association, 77(2),
121-147.
Grissmer, D., Flanagan, A., & Williamson, S. (1997). Does money matter for minority
and disadvantaged students? Assessing the new empirical evidence. Retrieved
September 20, 2004, from http://nces.ed.gov/pubs98/dev97/98212d.asp
Hispanic Association of Colleges and Universities. (n.d.). Hispanic-Serving Institution
Definitions. Retrieved March 1, 2009, from
http://www.hacu.net/hacu/HSI_Definition_EN.asp?SnID=2
201

Hussar, W. J., & Bailey, T. M., National Center for Education Statistics, Institute of
Education Sciences. (2008). Projections of education statistics to 2017. (NCES
2008-078). U.S. Department of Education, Washington, D.C.
Ihlanfeldt, K. R. (1997). Information on the spatial distribution of job opportunities
within metropolitan areas. In R. W. Wassmer (Ed.), Readings in urban
economics: Issues and public policy (pp. 252-273). Malden, MA: Blackwell.
Ingels, S. J., Burns, L. J., Chen, X., Cataldi, E. F., and Charleston, S., National Center
for Education Statistics. (2005). A Profile of the American high school
sophomore in 2002: Initial results from the base year of the education
longitudinal study of 2002. (NCES 2005– 338). U.S. Department of Education,
Washington, DC.
JBHE. (1999). This wasn't supposed to happen: The Black-White SAT gap is actually
growing larger. (1999). The Journal of Blacks in Higher Education, (25), 95-
100.
Jencks, C., Smith, M., Acland, H., Bane, M.J., Cohen, D., Gintis, H., Heynes, B., &
Mickelson, R. (1972). Inequality. New York: Harper & Row.
Kahlenberg, R. D. (2006). Integration by income. American School Board Journal,
193(4), 51-52.
Kao, G., & Tienda, M. (1998). Educational aspirations of minority youth. American
Journal of Education, 106(3), 3439-384.
Kozol, J. (2001). Ordinary resurrections: Children in the years of hope. New York:
HarperCollins.
202

Landon, D. R., & Radhakrishnan, P. (2003). Race matters: The relation between race
and general campus climate. Cultural Diversity and Ethnic Minority
Psychology, 9(3), 263-275.
Lang, M. (1992). Barriers to African Americans' educational achievement in higher
education: A statistical and conceptual review. Journal of African American
Studies, 22(4), 510-522.
Levin, H. L. 1994. The necessary and sufficient conditions for achieving educational
equity. In R. Berne & L. O. Picus (Eds.), Equity outcomes in education.
Thousand Oaks, CA: Concin.
Levine, D., & Levine, R. (1995). Society and education (9th ed.). Boston: Allyn &
Bacon.
Levine, R. S., Foster, J. E., Fullilove, R. E., Fullilove, M. T., Briggs, N. C., Hull, P. C.,
et al. (2001, September-October). Black-White inequalities in mortality and life
expectancy, 1933–1999: Implications for healthy people 2010. Public Health
Reports, 474-483.
Magner, D. K. (1991, February 27). Wisconsin struggles in effort to recruit minority
students. The Chronicle of Higher Education, A27.
Maslow, A. H. (1943). A theory of human motivation. Psychological Review , 50, 370-
396.
Massey, D. S., & Denton, N. (1993) American apartheid: Segregation and the making
of the underclass. Cambridge, MA: Harvard University Press.
203
McDonald, J. F., & McMillen, D. P. (2007). Urban economics and real estate theory
and policy (1st ed.). Needham Heights, MA: Blackwell Publishing.
Meier, K.J., Wrinkle, R.D., & Polinard, J.L. (1999). Representative bureaucracy and
distributional equity: addressing the hard question. The Journal of Politics, 61,
1025-39.
Mickelson, R. A. (1990). The Attitude-achievement paradox among Black adolescents.
Sociology of Education , 63(1), 44-61.
Mikesell, J. L. (2003). Fiscal administration (6th ed.). Belmont, CA: Wadsworth
Publishers.
National College Access Network. (2009). Retrieved January 5, 2009, from
http://www.collegeaccess.org/
National Science Foundation, Division of Science Resources Statistics. Women,
minorities, and persons with disabilities in science and engineering: 2002. NSF
03-312 (Arlington, VA 2003).
Opp, R. D. (2001). Enhancing recruitment success for two-year college students of
color. Community College Journal of Research and Practice, 25(2), 71-86.
Orfield, Losen, Wald, & Swanson, 2004
Planty, M., Hussar, W., Snyder, T., Provasnik, S., Kena, G., Dinkes, R., Kewal Ramani,
A., and Kemp, J., National Center for Education Statistics, Institute of Education
Sciences, U.S. Department of Education (2008). The condition of education
2008. (NCES 2008-031). Washington, DC.
204

Portes, A., & Wilson, K. L. (1976). Black-White differences en Educational attainment.
American Sociological Review, 41(3), 414-431.
Putnam, R. D. (2000). Bowling Alone: The collapse and revival of American
community. New York: Simon & Schuster.
Reid, L., & Radhakrishnan, P. (1995). Race matters: The relation between race and
general campus climate. Cultural Diversity and Ethnic Minority Psychology,
9(3), 263-275.
Roscigno, V. J. (2000). Family/school inequality and African-American/Hispanic
achievement. Society for the Study of Social Problems, 47(2), 266-290.
Roscigno, V. J. (1998). Race and the reproduction of educational disadvantage. Social
Forces, 76(3), 1033-1061.
Sanders, M. G. (1998). The effects of school, family, and community support on the
academic achievement of African American adolescents. Urban Education, 33,
385-409.
Steele, C. M. (1997). A Threat in the Air: How stereotypes shape intellectual identity
and performance. American Psychologist, 52(6), 613-629.
Swartz, D. 1997. Culture and Power: The sociology of Pierre Bourdieu. Chicago:
University of Chicago Press.
Szymanski, A. (1976). Racial discrimination and white gain. American Sociological
Association, 41(3), 403-414.
205

Thelin, J. R. (1996). Historical overview of American higher education. In S. R.
Komives & D. B. Woodard, Jr. (Eds.), Student services: A handbook for the
profession (3rd ed., pp. 1-42). San Francisco: Jossey-Bass.
The University of North Carolina at Chapel Hill. (2007, September). Our community.
Retrieved March 20, 2009, from Helping College Dreams Come True:
http://www.unc.edu/community/chancellors_column_09_07.html
Tierney, W. G. (1999). Models of minority college-going and retention: Cultural
integrity versus cultural suicide. The Journal of Negro Education, 68(1), 80-91.
Tinto, V. (1987). Leaving college: Rethinking the causes and cures of student attrition.
Chicago: The University of Chicago Press.
U.S. Census Bureau. (2008). Educational attainment. Retrieved March 15, 2009, from
American Fact Finder: http://factfinder.census.gov/servlet/STTable?_bm=y&-
geo_id=01000US&-qr_name=ACS_2007_3YR_G00_S1501&-
ds_name=ACS_2007_3YR_G00_
U.S. Census Bureau. (2007, December 27). Table 2. Educational attainment of the
population 25 years and over, by Selected characteristics: 2007. Retrieved
March 1, 2009, from Educational Attainment in the United States: 2007 Detailed
Tables:
http://www.census.gov/population/www/socdemo/education/cps2007.html
U.S. Census Bureau. (2006). Selected population profile in the United States: Black or
African American. Retrieved September 1, 2008, from American Community
Survey: http://factfinder.census.gov/servlet/IPTable?_bm=y&-
206

reg=ACS_2006_EST_G00_S0201:005;ACS_2006_EST_G00_S0201PR:005;A
CS_2006_EST_G00_S0201T:005;ACS_2006_EST_G00_S0201TPR:005&-
qr_name=ACS_2006_EST_G00_S0201&-
qr_name=ACS_2006_EST_G00_S0201PR&-qr_name=ACS_2006_E
U.S. Census Bureau. (2001). Census 2000 data for the United States: General
demographic characteristics. Retrieved October 20, 2008, from
http://factfinder.census.gov/servlet/QTTable?ds_name=DEC_2000_SF1_U&geo
_id=01000US&qr_name=DEC_2000_SF1_U_DP1
U.S. Department of Education, National Center for Education Statistics. (2006). The
condition of education 2006 (NCES 2006-071). Washington, DC: U.S.
Government Printing Office.
U. S. Department of Education. (2006). Table 7.3. Median annual earnings of full-time,
full-year wage and salary workers ages 25–34, by highest level of educational
attainment and race/ethnicity: 2006 . Retrieved September 12, 2008, from
Status and Trends in the Education of American Indians and Alaska Natives:
http://nces.ed.gov/pubs2008/nativetrends/tables/table_7_3.asp
U.S. Department of Education, National Center for Education Statistics. (2005). The
condition of education 2005 (NCES 2005–094). Washington, DC: U.S.
Government Printing Office.
U.S. Department of Education, National Center for Education Statistics. (2004). The
Condition of Education 2004 (NCES 2004–077). Washington, DC: U.S.
Government Printing Office.
207
208
U.S. Department of Education, National Center for Education Statistics. (2003).
Baccalaureate and beyond longitudinal study. Retrieved on September 1, 2008
from http://nces.ed.gov/datalab/quickstats/createtable.aspx
U.S. Department of Education, National Center for Education Statistics, (2001). The
condition of education 2001 (NCES 2001–072). Washington, DC: U.S.
Government Printing Office .
Williamson, J. A. (1999). In defense of themselves: The Black student struggle for
success and recognition at predominantly white colleges and universities. The
Journal of Negro Education, 68(1), 92-105.
Wilson, W. J. (1996). When work disappears: The world of the new urban poor.
Princeton, NJ: Princeton University Press.
Wilson, W. J. (1990). The truly disadvantaged: The inner city, the underclass, and
public policy. Chicago: University of Chicago.
Yan, W. (1999). Successful African American students: The role of parental
involvement. Journal of Negro Education, 68(1), 5-22.
Yin, R. K. (1993). Applications of case study research. Newbury Park, CA: Sage.
BIOGRAPHICAL INFORMATION
Dr. T. Gurley-Alloway began her career in the private sector, in marketing
research management. After seeking an opportunity to apply her business acumen
and knowledge of resource management (e.g., human, financial, technological, and
other) to help others, God allowed her to earn an M.Ed. in higher education. T.
Gurley-Alloway has spent the last 10 years in education, working in university
business services, college admission, and as a certified math teacher in urban, Title I
school districts. Tiffany is currently an education program director. She has
conducted research on the following topics: (a) predicting student success on
standardized tests, (b) education access and equity, (c) public school funding, (d)
efficiency in college admission, and (e) effects of the Tiebout Model of local
expenditures (and public choice theory) on education. Dr. T. Gurley-Alloway
remains committed to changing lives through education! She is also committed to
promoting equity through access and excellence in education!
209