MORE THAN JUST FOOD: MUSSELS AS BIOMONITORS OF ...
171
MORE THAN JUST FOOD: MUSSELS AS BIOMONITORS OF MICROPLASTIC POLLUTION IN THE KWAZULU-NATAL COASTAL ENVIRONMENT GEMMA GERBER A research dissertation submitted in fulfilment of the academic requirements for the degree of Master of Science in Biological Sciences. School of Life Sciences College of Agriculture, Engineering and Science University of KwaZulu-Natal Westville South Africa December 2017 As the candidate‘s supervisor(s) I have approved this dissertation for submission. Signed: _________________ Mr. G.K. Moodley Supervisor 4 December 2017 Signed: _________________ Dr. D.V. Robertson-Andersson Co-supervisor 4 December 2017
Transcript of MORE THAN JUST FOOD: MUSSELS AS BIOMONITORS OF ...

MORE THAN JUST FOOD: MUSSELS AS BIOMONITORS OF
MICROPLASTIC POLLUTION IN THE KWAZULU-NATAL
COASTAL ENVIRONMENT
GEMMA GERBER
A research dissertation submitted in fulfilment of the academic requirements for the
degree of
Master of Science
in Biological Sciences.
School of Life Sciences
College of Agriculture, Engineering and Science
University of KwaZulu-Natal
Westville
South Africa
December 2017
As the candidate‘s supervisor(s) I have approved this dissertation for submission.
Signed: _________________
Mr. G.K. Moodley
Supervisor
4 December 2017
Signed: _________________
Dr. D.V. Robertson-Andersson
Co-supervisor
4 December 2017

i
PREFACE
The research contained in this dissertation was completed by the candidate while
based in the Discipline of Biological Sciences, School of Life Sciences of the College
of Agriculture, Engineering and Science, University of KwaZulu-Natal, Westville,
South Africa. The financial assistance of the National Research Foundation (NRF)
towards this research is hereby acknowledged. Opinions expressed and conclusions
arrived at, are those of the author and are not necessarily to be attributed to the NRF.
The contents of this work have not been submitted in any form to another university
and, except where the work of others is acknowledged in the text, the results
reported are due to investigations by the candidate.
________________________
Signed: Mr. G.K. Moodley (Supervisor)
Date: 4 December 2017
________________________
Signed: Dr. D.V. Robertson-Andersson (Co-supervisor)
Date: 4 December 2017

ii
DECLARATION 1: PLAGIARISM
I, Gemma Gerber, declare that:
(i) the research reported in this dissertation, except where otherwise indicated or
acknowledged, is my original work;
(ii) this dissertation has not been submitted in full or in part for any degree or
examination to any other university;
(iii) this dissertation does not contain other persons‘ data, pictures, graphs or
other information, unless specifically acknowledged as being sourced
from other persons;
(iv) this dissertation does not contain other persons‘ writing, unless specifically
acknowledged as being sourced from other researchers. Where
other written sources have been quoted, then:
a) their words have been re-written but the general
information attributed to them has been referenced;
b) where their exact words have been used, their writing has
been placed inside quotation marks, and referenced;
(v) where I have used material for which publications followed, I have indicated in
detail my role in the work;
(vi) this dissertation is primarily a collection of material, prepared by myself,
published as journal articles or presented as a poster and oral
presentations at conferences. In some cases, additional material
has been included;
(vii) this dissertation does not contain text, graphics or tables copied and pasted
from the Internet, unless specifically acknowledged, and the source
being detailed in the dissertation and in the References sections.
________________________
Signed: Gemma Gerber
Date: 4 December 2017

iii
DECLARATION 2: PUBLICATIONS
Details of contribution to publications that form part and/or include research
presented in this dissertation:
Publication 1: Gerber, G., Kunnen, T.H., Coote, M.W., Moodley, G.K., and
Robertson-Andersson, D.V. A novel macro-based methodology for accurate
estimation of microplastic fibre uptake in mussels under laboratory conditions (In
preparation).
Author contributions: Study conception and design: Gerber, Kunnen, Moodley, and
Robertson-Andersson. Acquisition of data: Gerber. Analysis and interpretation of
data: Gerber. Drafting of manuscript: Coote, Gerber, and Kunnen. Critical revision:
Gerber, Kunnen, Moodley, and Robertson-Andersson.
Publication 2: Gerber, G., Moodley, G.K., and Robertson-Andersson, D.V.
Microplastic pollution distribution in selected KwaZulu-Natal temporarily open/closed
estuaries during an open mouth phase (In preparation).
Author contributions: Study conception and design: Gerber, Moodley, and
Robertson-Andersson. Acquisition of data: Gerber. Analysis and interpretation of
data: Gerber. Drafting of manuscript: Gerber. Critical revision: Gerber, Moodley, and
Robertson-Andersson.
Publication 3: Gerber, G., Moodley, G.K., and Robertson-Andersson, D.V.
Microplastic pollution in beach sediment near three temporarily open/closed estuaries
during an open mouth phase, KwaZulu-Natal (In preparation).
Author contributions: Study conception and design: Gerber, Moodley, and
Robertson-Andersson. Acquisition of data: Gerber. Analysis and interpretation of
data: Gerber. Drafting of manuscript: Gerber. Critical revision: Gerber, Moodley, and
Robertson-Andersson.

iv
Publication 4: Gerber, G., Moodley, G.K., and Robertson-Andersson, D.V. Rapid
bioassessment of microplastic pollution in KwaZulu-Natal coastal environments using
the brown mussel, Perna perna (Linneaus, 1758) (In preparation).
Author contributions: Study conception and design: Gerber, Moodley, and
Robertson-Andersson. Acquisition of data: Gerber. Analysis and interpretation of
data: Gerber. Drafting of manuscript: Gerber. Critical revision: Gerber, Moodley, and
Robertson-Andersson.
Presentation 1: Gerber, G.*, Mkhize, M., Moodley, G.K., and Robertson-
Andersson, D.V. 2016. The potential for biomonitoring microplastic
pollution along the KwaZulu-Natal coastline using marine
invertebrates: implications for human health. eThekwini University
Research Symposium (EURS) 2016. Durban, South Africa. (Oral
presentation).
Presentation 2: Gerber, G.*, Moodley, G.K., and Robertson-Andersson, D.V.,
2016. Microplastics in mussels: what should the consumer know?
Symposium of Contemporary Conservation Practices (SCCP).
Howick, KwaZulu-Natal, South Africa. November 2016. (Oral
presentation)
Nominated for KwaZulu-Natal Premier’s Award
First place for KwaZulu-Natal Premier’s Award
Presentation 3: Gerber, G.*, Moodley, G.K., and Robertson-Andersson, D.V.,
2016. Ingestion of microplastics by Perna perna (L.): implications
for human health? College of Agriculture, Engineering and
Sciences Postgraduate Research Day. University of KwaZulu-
Natal. Westville Campus, South Africa. October 2016. (Poster
presentation)
First place award for School of Life Sciences student poster
presentation

v
Presentation 4: Gerber, G.*, Moodley, G.K., and Robertson-Andersson, D.V.,
2016. Microplastics in mussels: what should the consumer know?
South African Marine Science Symposium (SAMSS). Port
Elizabeth, South Africa. July 2017. (Poster presentation).
Presentation 5: Gerber, G.*, Moodley, G.K., and Robertson-Andersson, D.V.,
2017. More than just food: Mussels as biomonitors of microplastic
pollution in the KwaZulu-Natal coastal environment. College of
Agriculture, Engineering and Sciences Postgraduate Research
Day. University of KwaZulu-Natal. Westville Campus, South Africa.
October 2017. (Poster presentation)
Presentation 6: Gerber, G.*, Moodley, G.K., Robertson-Andersson, D.V. 2017.
More than just food: Mussels as biomonitors of microplastic
pollution in the KwaZulu-Natal coastal environment. Symposium of
Contemporary Conservation Practices (SCCP). Howick, KwaZulu-
Natal, South Africa. November 2017. (Oral presentation)

vi
ABSTRACT
Microplastics are small plastic particles (< 5 mm in longest dimension) and originate
as manufactured small particles and from the fragmentation of larger plastic items.
Microplastic pollution has recently become the subject of a large body of research
due to the ubiquity throughout the marine environment and potential devastating
ecosystem-wide impacts. As microplastic pollution theoretically cannot be totally
eliminated from marine environments, one of the few available options is to monitor
the scope and extent of microplastic pollution. Coastal marine microplastic pollution
in South Africa is thought to originate from point sources such as estuaries. To date,
there are no standardised protocols for microplastic pollution monitoring and limited
information regarding microplastic pollution in South African estuaries and coastal
environments. A recent development of microplastic pollution monitoring is using
rocky shore invertebrate mussels as biomonitors of microplastic pollution in a
particular area. Mussels are already used to successfully monitor heavy metal
pollution along the South African coastline (SANCOR Mussel Watch Programme).
Building on these principles, this study aimed to (1) Determine if a novel, macro-
based automated counting feature could be used as a viable time-saving alternative
to manual counting of microplastic fibres (microfibres) ingested by the rocky shore
bivalve, Perna perna under laboratory conditions; and to assess microplastic
pollution in (2) three temporarily open/closed KwaZulu-Natal estuaries, (3) beach
sediment at sites up to 2 km North and South of each estuary mouth on the adjacent
coastlines and (4) Perna perna (L.) at rocky shore sites up to 2 km North and South
of each estuary mouth on the adjacent coastlines. The results of the novel, macro-
based automated counting feature showed that the time taken to count microfibres in
images was significantly reduced using the automated counting and measurement
method (1.00 ± 0.14 minutes) as opposed to the manual counting and measuring
method (23.91 ± 7.68 minutes). The findings showed that this novel counting
methodology for microfibre uptake in mussels under laboratory conditions is as
effective and reliable as manual microscopy, but resulted in significant reductions in
microscopy time analysis. The environmental studies found that that Bilanhlolo
Estuary had the highest microplastic pollution levels of the studied estuaries in both
surface water (surface water (5.98 ± 0.46 microplastics.m-2) and sediment (4.22 x 10⁴

vii
± 2.17 x 10³ microplastics.m-2). Mhlangeni Estuary and Kongweni Estuary displayed
lower levels of microplastic pollution in surface water (Mhlangeni Estuary: 4.50 ± 0.59
microplastics.m-2; Kongweni Estuary: 2.34 ± 0.23 microplastics.m-2) and in sediment
(Mhlangeni Estuary: 1.33 x 10⁴ ± 1.52 x 10³ microplastics.m-2; Kongweni Estuary:
1.89 x 10⁴ ± 2.31 x 10³ microplastics.m-2). The study investigating microplastic
pollution in beach sediment adjacent to each estuary mouth showed that microplastic
abundances (microplastics.m-2) were greater at sites nearer to each estuary mouth
than at beach sites further away. Perna perna in the sampled areas contained an
average of 2.22 ± 0.79 microplastics.g-1 tissue w/w. Mussels nearer to each estuary
mouth contained greater quantities of microplastics than sites further away. The
results showed that microplastics were abundant in all sampled estuaries, beach
sediment sites, and mussels. Microplastic fibres were the most dominant microplastic
type in all samples. This study provides baseline data for the selected estuaries and
adjacent coastal environments. The uptake of microplastic in P. perna in marine
environments indicates that mussels may be used as biomonitors of marine
microplastic pollution. The application of the results in our country will eventually
build a clearer picture of microplastic pollution along our coastline, its threats to
ecosystem health, and how we could potentially mitigate the impacts to ensure
marine conservation.

viii
ACKNOWLEDGMENTS
As a primary acknowledgement, I would like to thank the National Research
Foundation (NRF) for the financial assistance which made this research possible, in
addition to the University of KwaZulu-Natal (UKZN), Westville Campus, for providing
the necessary facilities and resources required for the research study.
To my supervisors, Mr. G.K. Moodley and Dr. D.V. Robertson-Andersson: thank you,
for not only your individual and invaluable inputs in to this research, but for pushing
me to develop in my capacity as a researcher, academic, and well-rounded person.
Your combined efforts in to my career and personal development above and beyond
academic supervision requirements are a true testament to your individual
characters, for which I will always be grateful.
To my fellow colleagues and friends, for not only the physical assistance with sample
collection and processing, but for the emotional assistance during times of personal
turmoil. Thank you to my colleague and friend, Matthew Coote, for his perpetual
willingness to assist in all aspects of this research. A special mention needs to be
made to Daniel Barr for his support from conception to conclusion of this dissertation.
Thank you to my friends outside of academia, who are never too sure of what I am
researching or why I am still studying, but support me without question.
Finally, thank you and love to my parents Reg and Giulia, and my sister, Raine, for
your exceptional tolerance and patience with me throughout this journey. This
dissertation is dedicated to you.

ix
TABLE OF CONTENTS
PREFACE ......................................................................................................................... i
DECLARATION 1: PLAGIARISM .................................................................................... ii
DECLARATION 2: PUBLICATIONS ............................................................................... iii
ABSTRACT .................................................................................................................... vi
ACKNOWLEDGMENTS ............................................................................................... viii
TABLE OF CONTENTS ................................................................................................. ix
LIST OF TABLES .......................................................................................................... xii
LIST OF FIGURES ....................................................................................................... xiii
LIST OF ABBREVIATIONS ..........................................................................................xvii
LIST OF UNITS AND SYMBOLS .................................................................................. xx
CHAPTER 1: INTRODUCTION ....................................................................................... 1
1.1. Preamble .................................................................................................................. 1
1.2. Problem Statement ................................................................................................... 2
1.3. Purpose and significance of study ............................................................................ 3
1.4. Research aims and objectives .................................................................................. 4
1.5. Scope and limitations................................................................................................ 7
1.6. Ethical considerations ............................................................................................... 8
1.7. Chapter overviews .................................................................................................... 8
1.8. Study sites ................................................................................................................ 9
CHAPTER 2: LITERATURE REVIEW ........................................................................... 13
2.1. Microplastics: definitions and sources .................................................................... 13
2.2. Microplastics in the marine environment ................................................................. 14
2.3. Microplastic pollution in South Africa ...................................................................... 17
2.4. Factors affecting microplastic abundances in coastal zones near estuaries .......... 18
2.5. Microplastic pollution in South African estuaries ..................................................... 19

x
2.6. Microplastic sampling and quantification methodology ........................................... 20
2.7. Pollutant biomonitoring ........................................................................................... 22
2.8. Mussels: potential of marine microplastic pollution monitoring ............................... 24
2.9. Conclusion .............................................................................................................. 26
CHAPTER 3: METHODOLOGY REVIEW ..................................................................... 27
3.1. Introduction ............................................................................................................. 27
3.2. Research techniques and instruments ................................................................... 28
3.3. Conclusion .............................................................................................................. 41
CHAPTER 4: A NOVEL MACRO-BASED METHODOLOGY FOR ACCURATE
ESTIMATION OF MICROPLASTIC FIBRE UPTAKE IN MUSSELS ............................. 42
4.1. Abstract .................................................................................................................. 42
4.2. Introduction ............................................................................................................. 43
4.3. Methods and Materials ........................................................................................... 46
4.4. Results .................................................................................................................... 49
4.5. Discussion .............................................................................................................. 51
4.6. Conclusion .............................................................................................................. 54
CHAPTER 5: MICROPLASTIC POLLUTION DISTRIBUTION IN SELECTED
KWAZULU-NATAL TEMPORARILY OPEN/CLOSED ESTUARIES DURING AN
OPEN MOUTH PHASE. ................................................................................................ 55
5.1. Abstract .................................................................................................................. 55
5.2. Introduction ............................................................................................................. 56
5.3. Methods and Materials ........................................................................................... 58
5.4. Results .................................................................................................................... 62
5.5. Discussion .............................................................................................................. 74
5.6. Conclusion .............................................................................................................. 78
CHAPTER 6: TEMPORARILY OPEN/CLOSED ESTUARIES AS SOURCES OF
MICROPLASTIC POLLUTION TO KWAZULU-NATAL COASTAL ENVIRONMENTS .. 79
6.1. Abstract .................................................................................................................. 79

xi
6.2. Introduction ............................................................................................................. 80
6.3. Methods and Materials ........................................................................................... 81
6.4. Results .................................................................................................................... 84
6.5. Discussion .............................................................................................................. 93
6.6. Conclusion .............................................................................................................. 95
CHAPTER 7: RAPID BIOASSESSMENT OF MICROPLASTIC POLLUTION IN
KWAZULU-NATAL COASTAL ENVIRONMENTS USING THE BROWN MUSSEL,
PERNA PERNA (LINNEAUS, 1758) .............................................................................. 97
7.1. Abstract .................................................................................................................. 97
7.2. Introduction ............................................................................................................. 98
7.3. Methods and Materials ......................................................................................... 100
7.4. Results .................................................................................................................. 103
7.5. Discussion ............................................................................................................ 113
7.6. Conclusion ............................................................................................................ 117
CHAPTER 8: CONCLUSIONS AND RECOMMENDATIONS FOR FUTURE
RESEARCH ................................................................................................................. 118
8.1. Major findings ....................................................................................................... 118
8.2. Challenges and shortcomings .............................................................................. 120
8.3. Recommendations for future research.................................................................. 122
REFERENCES ............................................................................................................ 125
APPENDIX A ............................................................................................................... 143
APPENDIX B: PERMIT ............................................................................................... 145

xii
LIST OF TABLES
Table 2.1: Typical plastic polymer densities (g.cm-3) compared to densities of
water (g.cm-3) at various salinities (GESAMP, 2015; Avio et al., 2017)
........................................................................................................ 15
Table 3.1: Morphological characterization of microplastics (Hildago-Ruz et al.,
2012; Naidoo et al., 2015; Coyle et al., 2016; Gallagher et al., 2016;
Helm, 2017, Rodríguez-Seijo and Pereira, 2017) ............................ 36
Table 3.2: Description of common microplastic types (Hildago-Ruz et al., 2012;
Coyle et al., 2016; Li et al., 2016; Helm, 2017; Rodríguez-Seijo and
Pereira, 2017) ................................................................................. 37
Table 3.3: Guideline for visual identification of microplastics under
magnification. .................................................................................. 40
Table 7.1: Attributes of a good indicator (UNEP 2016) and relevance to P. perna
as biomonitors of microplastic pollution ......................................... 116
Table A 1: Ecological categories of South African estuaries based on Present
Ecological State (PES) (DWA, 2013). 143
Table A 2: Geographic co-ordinates of sample stations. Estuary names noted as
MH (Mhlangeni Estuary), KO (Kongweni Estuary) or BL (Bilanhlolo
Estuary). Direction from estuary mouth noted as N (North) or S
(South). Number denotes distance (m) away from estuary mouth.
*No rocky shore present. ............................................................... 144

xiii
LIST OF FIGURES
Figure 1.1: Location of KwaZulu-Natal province in South Africa (A) and Ugu
District Municipality (B). Locations of Mhlangeni Estuary, Kongweni
Estuary and Bilanhlolo Estuary (C). (Source: Google™ Earth Pro;
adapted by Gerber, 2017) ............................................................... 12
Figure 3.1: The completed manta trawl, the "Manta-Reg" ................................. 30
Figure 4.1: Comparisons of mean microfibre counts (microfibres.mussel-1) (a),
mean microfibre length (µm) (b), mean microfibre width (µm) (c), and
mean time taken (seconds) to count images for one mussel sample
(d) between manual and automated counting methodologies (n = 5
volunteers). Lowercase letters indicate significant differences
between data (p < 0.05). Error bars represent ± 1 standard deviation
(SD). ................................................................................................ 50
Figure 4.2: Micrograph showing plastic microfibre (A) and non-plastic cotton fibre
(B) under ultra-violet (UV) illumination at 20X magnification. Scale
bar represents 1000 µm. ................................................................. 52
Figure 4.3: Marine sediment spiked with microplastics of six different polymer
types, dyed with Nile Red, and filtered on to a Whatman GF/F filter.
Photo taken with blue light (450 – 510 nm) and orange filter (529 nm)
(Maes et al., 2017). ......................................................................... 53
Figure 5.1: Mean microplastic abundance (microplastics.m-2) in estuarine
surface water (n = 5) (a) and sediment (n = 10) (b) of Mhlangeni
Estuary, Kongweni Estuary, and Bilanhlolo Estuary. Lowercase
letters indicate Tukey HSD post hoc significant differences among
estuaries. Error bars indicate ± 1 standard deviation (SD). ............. 64
Figure 5.2: Overall microplastic type composition (%) (combined surface water
and sediment) between Mhlangeni Estuary, Kongweni Estuary, and
Bilanhlolo Estuary. Lowercase letters indicate PERMANOVA

xiv
pairwise comparison significant differences in microplastic
composition (%) among sites. ......................................................... 65
Figure 6.1: Mean microplastic abundance (microplastic.m-2) in beach sediments
at increasing distances (m) North (N) and South (S) away from each
estuary mouth (n= 5). Uppercase letters indicate significance
differences between estuarine systems. Lowercase letters indicate
Tukey HSD post hoc significance differences between sites within
each estuary system. Error bars represent ± 1 SD.......................... 85
Figure 6.2: Overall microplastic type composition (%) in beach sediment sites
near each estuary (Mhlangeni Estuary, Kongweni Estuary, and
Bilanhlolo Estuary). Lowercase letters indicate PERMANOVA
pairwise comparison significant differences. ................................... 86
Figure 6.3: Microplastic type composition (%) in beach sediment from sites at
increasing distances (500 m, 1000 m, and 2000 m) North (N) and
South (S) away from each estuary mouth. Mhlangeni Estuary sites
(a), Kongweni Estuary sites (b) and Bilanhlolo Estuary sites (c).
Uppercase letters indicate PERMANOVA significant differences
between sites North and South. Lowercase letters indicate significant
PERMANOVA pairwise comparison significant differences between
sites at increasing distance (500 m, 1000 m, 2000 m) away from
each estuary mouth. ........................................................................ 88
Figure 6.4: Overall microplastic size class (µm) distribution (%) (sites at
increasing distance North and South of estuary mouth combined) in
beach sediment samples near estuary (Mhlangeni Estuary,
Kongweni Estuary, and Bilanhlolo Estuary). Lowercase letters
indicate PERMANOVA pairwise comparison significant differences.
........................................................................................................ 90
Figure 6.5: Microplastic size class (µm) distribution (%) in beach sediment from
sites at increasing distances (500 m, 1000 m, and 2000 m) North (N)
and South (S) away from each estuary mouth. Mhlangeni Estuary
sites (a), Kongweni Estuary sites (b) and Bilanhlolo Estuary sites (c).

xv
Uppercase letters indicate PERMANOVA significant differences
between North and South stations. Lowercase letters indicate
PERMANOVA pairwise comparison significant differences between
stations at increasing distances North and South away from each
estuary mouth. ................................................................................ 92
Figure 7.1: Mean microplastic abundance (microplastic.m-2) in Perna perna
specimens at increasing distances (m) North (N) and South (S) away
from each estuary mouth (n = 5). Uppercase letters indicate
significance differences between estuarine systems. Lowercase
letters indicate Tukey HSD post hoc significance differences between
sites within each estuary system. Error bars represent ± 1 SD. No
data at site 500 m North of Kongweni Estuary mouth due to absence
of rocky shores. ............................................................................. 104
Figure 7.2: Coefficients of variance (%) of microplastic abundances in mussels
(n = 85) and sediment (n = 90). Lowercase letters indicate significant
differences (ANOVA). .................................................................... 105
Figure 7.3: Overall microplastic type composition (%) in Perna perna from rocky
shore sites at increasing distances (500 m, 1000 m, and 2000 m)
North and South of estuary mouth combined (Mhlangeni Estuary,
Kongweni Estuary, and Bilanhlolo Estuary). Lowercase letters
indicate significant differences in microplastic type composition (%)
(PERMANOVA). ............................................................................ 106
Figure 7.4: Microplastic type composition (%) in Perna perna from sites at
increasing distances (500 m, 1000 m, and 2000 m) North (N) and
South (S) away from each estuary mouth (Mhlangeni Estuary sites
(a), Kongweni Estuary sites (b), and Bilanhlolo Estuary sites (c)).
Uppercase letters indicate significant differences between North and
South sites (PERMANOVA pairwise comparison). Lowercase letters
indicate significant differences between sites at increasing distances
away from each estuary mouth within North and South groups

xvi
(PERMANOVA pairwise comparison). No data at site 500 m North of
Kongweni Estuary mouth due to absence of rocky shores. ........... 108
Figure 7.5: Overall microplastic size class (µm) distribution (%) (sites at
increasing distance North and South of estuary mouth combined) in
Perna perna samples near estuary (Mhlangeni Estuary, Kongweni
Estuary, and Bilanhlolo Estuary). Lowercase letters indicate
significant differences (PERMANOVA). ......................................... 110
Figure 7.6: Microplastic size class (µm) distribution (%) in Perna perna from sites
at increasing distances (500 m, 1000 m, and 2000 m) North (N) and
South (S) away from each estuary mouth. Mhlangeni Estuary sites
(a), Kongweni Estuary sites (b) and Bilanhlolo Estuary sites (c).
Uppercase letters indicate significant differences between North and
South sites (PERMANOVA pairwise comparison). Lowercase letters
indicate significant differences between sites at increasing distances
away from each estuary mouth within North and South groups
(PERMANOVA pairwise comparison). No data at site 500 m North of
Kongweni Estuary mouth due to absence of rocky shores. ........... 112

xvii
LIST OF ABBREVIATIONS
3D Three Dimensional
ANOVA Analysis of Variance
DAPI 4‘6-diamidino-2-phenylindole
DTI Department of Trade and Industry
DWA Department of Water Affairs
E East
EC Ecological Categories
EDF Extended Depth of Field
FTIR Fourier Transform Infrared spectroscopy
GDP Gross Domestic Product
GESAMP Joint Group of Experts on Scientific Aspects of Marine
Environment Protection
HClO4 Perchloric acid
HNO3 Nitric acid
ICES International Council of the Exploration of the Sea
IPP Image Pro Plus
IR Infrared
KOH Potassium hydroxide
KZN KwaZulu-Natal
LADI Low-Tech Aquatic Debris Instrument
MPA Marine Protected Area

xviii
MPRP Marine Pollution Research Programme
MSFD Marine Strategy Framework Directive
MWP Mussel Watch Program
N North
NaCl Sodium chloride
NaI Sodium iodide
NDF Neutral Density Filter
NOAA National Oceanic and Atmospheric Administration
NR Nile Red
PA Polyamide
PAH Polycyclic Aromatic Hydrocarbon
PBDE Polybrominated Diphenyl Ether
PCB Polychlorinated Biphenyl
PE Polyethylene
PERMANOVA Permutational analysis of variance
PES Present Ecological State
PET Polyethylene Terephthalate
pMAR Present day Mean Annual Runoff
POP Persistent Organic Pollutant
PP Polypropylene
PRIMER Plymouth Routines in Multivariate Ecological Research

xix
PS Polystyrene
PVA Polyvinyl Alcohol
PVC Polyvinylchloride
S South
SANCOR South African Network for Coastal and Oceanic Research (post
1993)
SD Standard deviation
SIMPER Similarity Percentage Analysis
SOP Standard Operating Procedure
TOCE Temporarily Open/Closed Estuary
UNEP United Nations Environment Programme
UV Ultra-violet
VBA Visual Basic for Application
WWTW Waste Water Treatment Works

xx
LIST OF UNITS AND SYMBOLS
% Percentage
< Less than
> Greater than
± Plus/minus
≈ Approximately
⌀ Diameter
°C Degree(s) Celsius
µm Micrometre
¼ Quarter
articles.L-1 Article(s) per Litre
cm Centimetre
g Gram
g.cm-3 Grams per cubic centimetre
items/g Items per gram
km Kilometre
km2 Square kilometre
L Litre
m Metre
M Moles
m2 Square metre

xxi
m3 Cubic metre
mg.L-1 Milligram(s) per litre
microfibres.mussel-1 Microfibres per mussel
microplastics.g-1 tissue Microplastics per gram of soft tissue
microplastics.m-2 Microplastics per square metre
mL Millilitre
mm Millimetre
nm Nanometre
particles.m-2 Particles per square metre
particles.m-3 Particles per cubic metre
psu Practical Salinity Units
s Second(s)
v:v volume/volume
w/w Wet weight

Chapter 1
1
CHAPTER 1: INTRODUCTION
1.1. Preamble
Plastics can be defined as synthetic organic polymers which are derived from
monomers extracted from oil, coal, and gas (Thompson et al., 2009) and are used in
every sector within South Africa (Verster et al., 2017). The plastic manufacturing
industry contributes 16.5 % to South Africa‘s total manufacturing industry (Plastics
SA, 2016) and a total of 1.9 % to South Africa‘s gross domestic product (GDP)
(Plastics SA, 2016). The economic contribution to South Africa via import profits and
increase in local employment rates has caused the South African government to
identify the national plastic industry as a priority sector (Plastics SA, 2016). The
increase of South Africa‘s production and consumption of plastic products has
unfortunately led to large quantities of plastic waste, of which 72 % is not recovered
(Department of Trade and Industry (DTI), 2016). Lack of maintained infrastructure
and inadequate waste disposal methods largely contribute to the increasing plastic
waste accumulation in aquatic environments. Whilst the majority of research has, in
the past, focused on larger plastic items and their negative impacts on environmental
health (Andrady, 2011; Setälä et al., 2014), comparatively less attention has been
placed on microplastics and microplastic pollution, both globally and in South Africa
(Andrady, 2011; Naidoo et al., 2015).
Microplastics are plastic particles smaller than 5 mm in maximum size dimension
(Lusher et al., 2017) and have recently become the focus of a large amount of
research. Microplastics can be classified based on the origin: primary microplastics
are manufactured to be of a small size (Andrady, 2011), and secondary microplastics
are as the result of fragmentation of larger plastic items in the environment (Carr et
al., 2016). Due to the small size of microplastics, as well as their longevity and
ubiquity through the marine environment, they become available for ingestion to a
variety of marine organisms (Van Cauwenberghe et al., 2015). Ingested microplastics
may cause physical damage to the organisms, such as gut blockage/damage, false
sense of satiation, malnutrition, and even death (Wright et al., 2013). Toxicological
damage may occur from adsorbed toxicants transferring from the microplastics to the

Chapter 1
2
organism (Chua et al., 2014). These organisms may be consumed by larger,
predator organisms, leading to a potential bioaccumulation of toxicants along the
food web (Ivar do Sul and Costa, 2014). These potential impacts of microplastics on
marine organisms may be an issue for humans, as not only may marine food
resources decline as a result, but this also opens up the possibility of toxicant
transfer from organisms to humans (Vandermeersch et al., 2015). It is therefore of
paramount importance to monitor the scope of microplastic pollution in the
environment as well as determine any remediation methodologies available to curb
the widespread impact of microplastic pollution.
1.2. Problem Statement
There have been a large number of recent publications highlighting the global
distribution of microplastic pollution in freshwater environments, marine
environments, and within organisms (Mahon et al., 2017). Despite the fact that
approximately 80 % of plastic and microplastic pollution in marine environments is
derived from land-based sources (Andrady, 2011), there are still enormous
knowledge gaps regarding the impacts on ecological and human health of freshwater
microplastic pollution and consequently transport to marine environments via
estuaries (Eerkes-Medrano et al., 2015; Cheung et al., 2016). As microplastic
pollution is a relatively new threat to environmental and human health, methodology
is limited and unharmonized. The limitations and disharmony of methodology does
not allow for the accurate reporting of microplastic pollution loads, nor the accurate
comparison of microplastic reporting between studies (Eerkes-Medrano et al., 2015).
South Africa, as a developing country, has a slow economic growth and as such,
development, growth and poverty reduction receive prioritization ahead of ecological
issues such as microplastic pollution (Verster et al., 2017). With the plastic industry
greatly stimulating the economy (Verster et al., 2017), it is unlikely that plastic
production and plastic waste generation will decrease in the near future. In South
Africa, there are currently few published reports of microplastic pollution (Ryan, 1988;
Ryan and Moloney, 1990, Naidoo et al., 2015; Nel and Froneman, 2015, Nel et al.,
2017; Nel et al., 2018). The lack of knowledge of the status of microplastic pollution
in South Africa is worrying. Whilst the prioritization of economic and social

Chapter 1
3
development is vital for the well-being of the people of South Africa, the potential
risks posed by microplastics to human health and ecological integrity cannot be
ignored. From an ecological perspective, South Africa is considered to be one of the
most bio diverse regions in the world. The potential impacts of microplastic pollution
on biota may decrease the natural biodiversity of South Africa, further negatively
impacting the ecological integrity of the country.
1.3. Purpose and significance of study
The purpose of the study is to investigate microplastic pollution in selected
temporarily open/closed estuaries (TOCEs) along the KwaZulu-Natal (KZN)
coastline, the inputs of microplastics into the nearby coastal environment from these
identified estuaries, and the microplastic pollution present in the indigenous rocky
shore bivalve, Perna perna (L.), at rocky shore sites near these identified estuaries.
The significance of the study includes the presentation of microplastic pollution in
previously unstudied estuarine and beach environments, as well as a novel
methodology of microplastic pollution estimation along South African coastlines by
using P. perna mussels as biomonitors. As there are many different types of
microplastics, biomonitoring allows for the identification of microplastics that are most
likely to be ingested by mussels and therefore, pose the most threat to the mussels.
The identification of microplastics in mussels is not only useful from a microplastic
monitoring perspective, but as mussels are an important subsistence food source for
a large social sector (Richir and Gobert, 2016), it is important to quantify the
microplastics in P. perna in order to identify the relevant risks they may pose to an
already vulnerable population. The information presented in this study has the
potential to add significant value to the knowledge of microplastic pollution in South
Africa, as well as providing new insight in the field of microplastic pollution analysis
and quantification on a global scale.
There are currently limited methodologies available for sampling, processing and
analysis of microplastics within samples. As microplastic pollution is an enormous
threat to global ecosystems, it is imperative that microplastic pollution is rapidly
reported and published. To date, the microscopy techniques used to identify
microplastics in samples frequently involve manual counting of particles. Manual

Chapter 1
4
counting is slow and is incredibly sensitive to human errors due to lack of skills,
fatigue, and underlying physiological issues. The study also aimed to create a novel
methodology to count and measure microplastics within samples using an automated
macro-based computer technique.
1.4. Research aims and objectives
The aims and objectives for each study chapter are outlined below:
Chapter 4
Aim: Determine if a novel, macro-based automated counting feature could be used
as a viable time-saving alternative to manual counting of microplastic fibres
(microfibres) ingested by the rocky shore bivalve, Perna perna under
laboratory conditions.
Objective 4.1: Compare microfibre counts and measurements of microfibres
ingested by mussels between data captured manually by volunteers
and data captured using the automated macro-based methodology.
HA: There is a significant difference in microfibre counts and
measurements between manual and automated macro-based
methodologies.
Objective 4.2: Compare time taken to count and measure microfibres between
manual data capture and automated macro-based methodologies.
HA: There is a significant difference in data capture time between
the manual and automated macro-based methodologies.
Chapter 5
Aim: Determine and compare spatial differences in microplastic pollution between
selected TOCEs (Mhlangeni Estuary, Kongweni Estuary, and Bilanhlolo
Estuary) in open mouth phases during a summer season (wet season).

Chapter 1
5
Objective 5.1: Compare microplastic abundances (microplastics.m-2) in surface
water and sediment between Mhlangeni Estuary, Kongweni Estuary,
and Bilanhlolo Estuary in open mouth phases during a summer
season.
HA: There is a significant difference in microplastic abundance
(microplastics.m-2) in surface water and sediment between
Mhlangeni Estuary, Kongweni Estuary, and Bilanhlolo Estuary
in open mouth phases during a summer season.
Objective 5.2: Compare microplastic type composition (%) in surface water and
sediment between Mhlangeni Estuary, Kongweni Estuary, and
Bilanhlolo Estuary in open mouth phases during a summer season.
HA: There is a significant difference in microplastic type composition
(%) in surface water and sediment between Mhlangeni Estuary,
Kongweni Estuary, and Bilanhlolo Estuary in open mouth
phases during a summer season.
Objective 5.3: Compare microplastic size class (µm) distribution (%) in surface
water and sediment between Mhlangeni Estuary, Kongweni Estuary,
and Bilanhlolo Estuary in open mouth phases during a summer
season.
HA: There is a significant difference in microplastic size class (µm)
distribution (%) in surface water and sediment between
Mhlangeni Estuary, Kongweni Estuary, and Bilanhlolo Estuary
in open mouth phases during a summer season.
Chapter 6
Aim: Determine and compare spatial differences in beach sediment microplastic
pollution originating from selected TOCEs (Mhlangeni Estuary, Kongweni
Estuary, and Bilanhlolo Estuary) during open mouth phases at increasing
distance 500 m, 1000 m, and 2000 m North and South on the coastline
adjacent to each estuary mouth.

Chapter 1
6
Objective 6.1: Compare microplastic abundances (microplastics.m-2) in beach
sediment at stations 500 m, 1000 m, and 2000 m North and South on
the coastline adjacent to each estuary mouth during an open mouth
phase.
HA: There is a significant difference in microplastic abundances
(microplastics.m-2) in beach sediment at stations 500 m, 1000
m, and 2000 m North and South on the coastline adjacent to
each estuary mouth during an open mouth phase.
Objective 6.2: Compare microplastic type composition (%) in beach sediment at
stations 500 m, 1000 m, and 2000 m North and South on the
coastline adjacent to each estuary mouth during an open mouth
phase.
HA: There is a significant difference microplastic type composition
(%) in beach sediment at stations 500 m, 1000 m, and 2000 m
North and South on the coastline adjacent to each estuary
mouth during an open mouth phase.
Objective 6.3: Compare microplastic size class (µm) distribution (%) in beach
sediment at stations 500 m, 1000 m, and 2000 m North and South on
the coastline adjacent to each estuary mouth during an open mouth
phase.
HA: There is a significant difference in microplastic size class (µm)
distribution (%) in beach sediment at stations 500 m, 1000 m,
and 2000 m North and South on the coastline adjacent to each
estuary mouth during an open mouth phase.
Chapter 7
Aim: Determine and compare spatial differences in microplastic pollution in the
mussel species, Perna perna, originating from selected TOCEs (Mhlangeni
Estuary, Kongweni Estuary, and Bilanhlolo Estuary) during an open mouth
phase at increasing distance 500 m, 1000 m, and 2000 m North and South
on the coastline adjacent to each estuary mouth.
Chapter 1
7
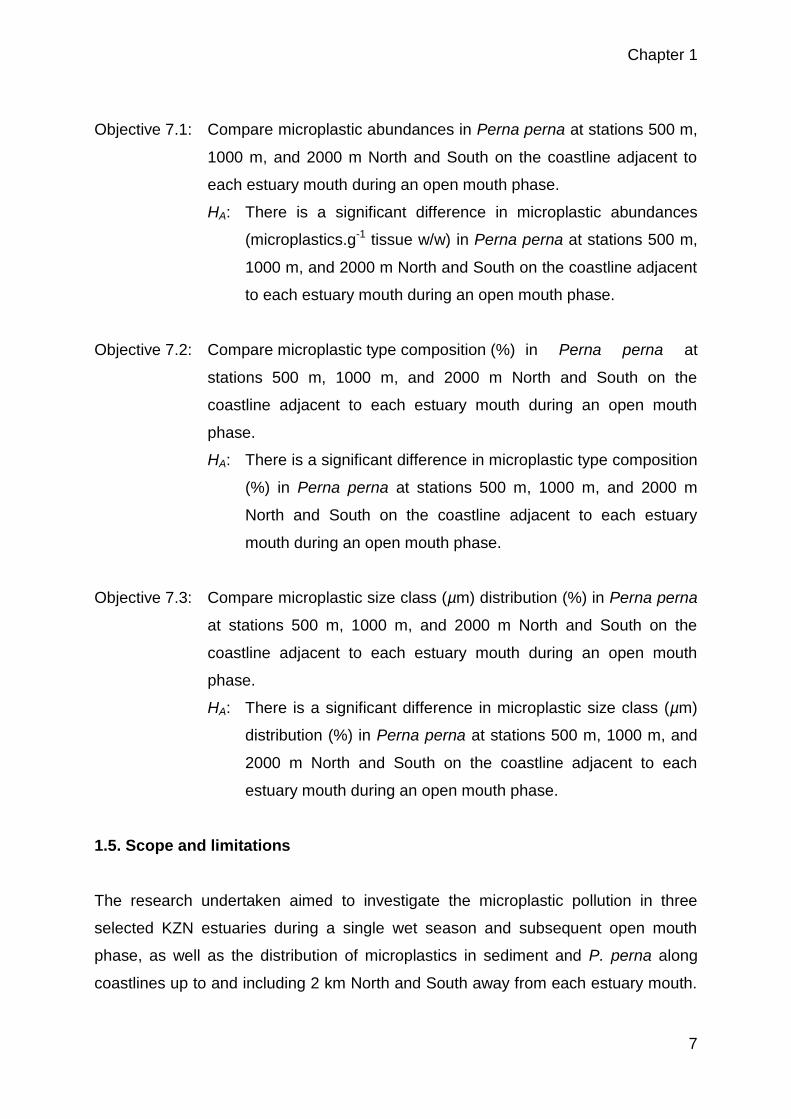
Objective 7.1: Compare microplastic abundances in Perna perna at stations 500 m,
1000 m, and 2000 m North and South on the coastline adjacent to
each estuary mouth during an open mouth phase.
HA: There is a significant difference in microplastic abundances
(microplastics.g-1 tissue w/w) in Perna perna at stations 500 m,
1000 m, and 2000 m North and South on the coastline adjacent
to each estuary mouth during an open mouth phase.
Objective 7.2: Compare microplastic type composition (%) in Perna perna at
stations 500 m, 1000 m, and 2000 m North and South on the
coastline adjacent to each estuary mouth during an open mouth
phase.
HA: There is a significant difference in microplastic type composition
(%) in Perna perna at stations 500 m, 1000 m, and 2000 m
North and South on the coastline adjacent to each estuary
mouth during an open mouth phase.
Objective 7.3: Compare microplastic size class (µm) distribution (%) in Perna perna
at stations 500 m, 1000 m, and 2000 m North and South on the
coastline adjacent to each estuary mouth during an open mouth
phase.
HA: There is a significant difference in microplastic size class (µm)
distribution (%) in Perna perna at stations 500 m, 1000 m, and
2000 m North and South on the coastline adjacent to each
estuary mouth during an open mouth phase.
1.5. Scope and limitations
The research undertaken aimed to investigate the microplastic pollution in three
selected KZN estuaries during a single wet season and subsequent open mouth
phase, as well as the distribution of microplastics in sediment and P. perna along
coastlines up to and including 2 km North and South away from each estuary mouth.

Chapter 1
8
While sources of microplastics may be inferred by the results, the study does not
investigate sources of microplastic pollution into the studied estuaries.
1.6. Ethical considerations
The marine invertebrate mollusc P. perna is not defined as an ―experimental animal‖
in the National Ethics Guidelines Act of 1990; therefore no ethical clearance for this
study was required. Mussel samples were collected in accordance with the field
permit [RES2017/71] for the purposes of scientific investigations or practical
experiment in terms of Section 83 of the Marine Living Resource Act (Act No. 18 of
1998) issued by the Department of Agriculture, Forestry and Fisheries of the
Republic of South Africa (Appendix B).
1.7. Chapter overviews
This dissertation comprises of eight chapters. This current chapter (Chapter 1)
presents a brief topic background of microplastic pollution in a South African context,
identifies the problems which motivated the study, places the motivation (rationale)
and approach of the study into context for the study, states the aims and objectives
of the study, states the underlying assumptions, limitations, and scope of the study.
Chapter 2 is a review of the relevant literature regarding microplastic pollution, the
current scope of microplastic pollution research in South Africa, the effects of
microplastics on organisms, and a special focus on P. perna as potential biomonitors
of microplastic pollution in marine environments.
Chapter 3 is a secondary literature review of the current global methodological
approaches and limitations of microplastic pollution research in estuaries, marine
environments and within organisms. The information presented in Chapter 3 was
largely used to derive the overall methodological approach of the study.
Chapter 4 presents a manuscript of a novel macro-based methodology for accurate
estimation of microplastic fibre uptake in mussels under laboratory conditions using
automated macros as compared to manual microscopy methods.

Chapter 1
9
Chapter 5 presents a manuscript of a baseline study of microplastic pollution in three
temporarily open/closed estuaries in KwaZulu-Natal during an open mouth phase.
Chapter 6 presents a manuscript on microplastic pollution in beach sediment near
three selected temporarily open/closed estuaries during an open mouth phase.
Chapter 7 presents a manuscript on the rapid assessment of microplastic pollution in
marine environments using the brown mussel, P. perna, as biomonitors.
Chapter 8 concludes the study, describing major findings, discusses the challenges
and limitations of the study findings, and presents the recommendations for future
research of microplastic pollution.
1.8. Study sites
Three study sites were selected for investigation in this study (Chapter 5, 6, and 7)
(Mhlangeni Estuary, Kongweni Estuary, and Bilanhlolo Estuary) (Figure 1.1). The
study sites were selected based on the following four criteria: (1) Described as a
TOCE and open for approximately 50 % of the year, (2) The presence of rocky
shores along the adjacent coastline of each estuary mouth for at least 2 km, (3) study
sites needed to be geographically close, but not overlap in distance, allowing
differences in climatic conditions be similar between study sites, and (4) Present
Ecological State (PES) as described by Department of Water Affairs (DWA), 2013
(Appendix A: Table A 1). Estuaries are all located within the Ugu District
Municipality, KZN. Geographic co-ordinates of individual sample sites are listed in
Table A 2 (Appendix A).
Mhlangeni Estuary
The Mhlangeni Estuary (30°49‘06‘‘ S; 30°24‘22‘‘ E) (Figure 1.1) is a TOCE in the
Ugu District Municipality, KZN (DWA, 2013) near the coastal town of Margate. The
Mhlangeni Estuary mouth has an average depth of 1 m (DWA, 2013) and is open to
the sea approximately 47 % of the year (DWA, 2013). Recreational activities that

Chapter 1
10
take place in the Mhlangeni Estuary include boating and recreational fishing (DWA,
2013). The Mhlangeni river has a catchment area of 37.2 km2 (DWA, 2013). The
present day Mean Annual Runoff (pNAR) is 9.6 million m3 per annum (DWA, 2013).
The PES of Mhlangeni Estuary is characterised as C (moderately modified)
(Appendix A: Table A 1). The adjacent coastline is characterised by rocky shores up
to 2 km north and south of the Mhlangeni Estuary mouth. Mhlangeni Estuary is
surrounded by dense residential areas (DWA, 2013). Several restaurants are located
in close proximity to the Mhlangeni Estuary mouth. During the sampling period, very
few macroplastic items were observed in the near vicinity, except for a few plastic
bottle tops and one polystyrene cup.
Kongweni Estuary
The Kongweni Estuary (30°51‘39‘ ‘S 30°22‘19‘‘ E) (Figure 1.1) is a TOCE on the
KZN coastline (Whitfield and Baliwe, 2013) near the coastal town of Margate.
Kongweni Estuary mouth has an average depth of 2 m (DWA, 20113), and is open
approximately 49 % of the year (DWA, 2013). Kongweni Estuary serves a catchment
area of 7.9 km2 and displays a pMAR of 2.95 million m3 per annum (DWA, 2013).
Kongweni Estuary receives a daily volume of approximately 4998 m3 of sewage
effluent (approximately 1.825 x 10⁶ m3 per year) from the nearby Margate waste
water treatment works (WWTW) (DWA, 2013). Despite the direct input of treated
sewage, recreational activities still take place in Kongweni Estuary which include
swimming and paddle-boating (DWA, 2013). Developmental pressures have resulted
in the loss of mangroves from the Kongweni Estuary (Van Niekerk and Turpie, 2012).
The condition of the estuary has been described as poor as a result of the dense
surrounding urban area and being highly degraded (Whitfield and Baliwe, 2013). The
PES has been categorized as D (Largely modified. A loss and change of natural
habitat, biota and ecosystem functions and processes have occurred) (Appendix A:
Table A 1) (DWA, 2013). The surrounding habitats are characterized as sandy
shores for approximately 600 m north of the estuary mouth, and as rocky shores 2
km north and south of the estuary mouth. At the time of sampling the estuary water
was heavily silted, and had a foul smell. Observed commercial activities that
surround Kongweni Estuary include restaurants and accommodation venues. No
large plastic items were visible during the sampling period.

Chapter 1
11
Bilanhlolo Estuary
The Bilanhlolo Estuary (30°53‘21‘‘S 30°20‘58‘‘E) is a TOCE (Figure 1.1) on the KZN
coastline. The Bilanhlolo Estuary mouth is approximately 1 m in depth (DWA, 2013)
and is open to the sea usually 47 % of the year (DWA, 2013). Bilanhlolo Estuary
serves a catchment area of 19.8 km2 (DWA, 2013) and has a pMAR of approximately
4.98 million m3 per annum (DWA, 2013). The Bilanhlolo Estuary is cited as having
important recreational value (DWA, 2013) and is frequently used for leisure activities
such as swimming, angling and boating (DWA, 2013). The PES of Bilanhlolo Estuary
is characterized as C (moderately modified) (Appendix A: Table A 1) (DWA, 2013).
The surrounding coastal habitats are characterized as rocky shores for over 2 km
north and south of the estuary mouth. Several popular restaurants and
accommodation facilities surround Bilanhlolo Estuary. Various large plastic items
were observed floating in the water, including plastic bags and pieces of unidentified
fragmented plastic.

Chapter 1
12
Figure 1.1: Location of KwaZulu-Natal province in South Africa (A) and Ugu
District Municipality (B). Locations of Mhlangeni Estuary, Kongweni Estuary
and Bilanhlolo Estuary (C). (Source: Google™ Earth Pro; adapted by Gerber,
2017)
A B
C

Chapter 2
13
CHAPTER 2: LITERATURE REVIEW
2.1. Microplastics: definitions and sources
The National Oceanic and Atmospheric Administration (NOAA) describe
microplastics as plastic particles smaller than 5 mm in their longest dimension
(Rocha-Santos and Duarte, 2015; Lusher et al., 2017) and can be classified as either
primary or secondary microplastics according to their origin (Cole et al., 2011).
Primary microplastics are manufactured to be smaller than 5 mm in maximum
dimension, commonly used as virgin material in plastic injection moulding, domestic
uses such as exfoliants in face washes, industrial uses such as ‗sand-blasting‘, as
well as vectors for drug delivery (Ivar do Sul and Costa, 2014; Luís et al., 2015).
These particles directly enter the marine environment via rivers, terrestrial runoff as
well as domestic and industrial waste effluents (Lima et al., 2015; Luís et al., 2015;
Gallagher et al., 2016). Secondary microplastics are those which are derived from
breakdown of larger plastic items through a number of degradation processes (Ivar
do Sul and Costa, 2014; Carr et al., 2016). These include fragmentation via wave
and tidal action (Ivar do Sul and Costa, 2014), photodegradation due to exposure of
ultraviolet (UV) rays from the sun (Syberg et al., 2015) as well as biodegradation by
fouling organisms and other biological pathways (Barnes et al., 2009). Another
prominent source of secondary microplastics results from synthetic polymer clothing
being washed in washing machines (Rocha-Santos and Duarte, 2015). Microplastic
fibres are stripped from the clothing items, enter waterways and eventually the
marine environment. According to Thompson et al. (2004), a single piece of synthetic
polymer clothing can release as many as 1900 microplastic particles per washing
machine cycle. Considering that the majority of manufactured clothing is composed
of synthetic polymer blends (Napper and Thompson, 2016), this can translate to
continually increasing inputs of large amounts of microfibres into the marine
environment.

Chapter 2
14
2.2. Microplastics in the marine environment
2.2.1. The role of polymer density in microplastic transport
The most commonly produced plastic polymer types include polyethylene (PE),
polypropylene (PP), polystyrene (PS), polyvinylchloride (PVC), polyamide (PA),
polyethylene terephthalate (PET), and polyvinyl alcohol (PVA) (Avio et al., 2015). It
can therefore be inferred that the majority of microplastic debris found in marine
environments will consist of a mosaic of these types of polymers. Once these
microplastic particles are released into the marine environment, their fate will largely
be determined by their inherently different density properties (Table 2.1) as well as
retention time in the marine environment (Carr et al., 2016; Wang et al., 2016; Avio et
al., 2017). Microplastic density plays a significant role in the transport of these
particles as well as settlement and resuspension (Avio et al., 2017). Lower density
microplastics, such as PP and PE, will often remain in the water column and higher
density microplastics, such as PVC and PET will sink and accumulate in the
sediment (Dekiff et al., 2014; Van Cauwenberghe et al., 2015). The density of
microplastics in the marine environment may increase with an increase in residence
time (Wang et al., 2016). The increase in density may be due to the accumulation of
proteins and bacterial colonization (biofouling) on the microplastic surfaces, making
microplastic particles less hydrophobic and more neutrally buoyant, allowing the
particles to remain in the water column for longer periods of time (Lobelle and
Cunliffe, 2011). The density changes allow for greater transport distances of the
microplastics, and increased availability for ingestion by pelagic organisms (Lobelle
and Cunliffe, 2011). Microplastic particles that have settled out of the water column
into the sediment may be susceptible to ingestion by benthic organisms and
thereafter resuspended into the water column via the production of faeces and
pseudofaeces (Wright et al., 2013). In addition, settled microplastics are
resuspended into the water column via events such as storms (Wegner et al., 2012).
This benthic-pelagic coupling may result in the repeated exposure of microplastics
and their associated toxicants to pelagic organisms (Wegner et al., 2012; Canesi et
al., 2015).

Chapter 2
15
Table 2.1: Typical plastic polymer densities (g.cm-3) compared to densities of
water (g.cm-3) at various salinities (GESAMP, 2015; Avio et al., 2017)
Matrix Density range (g.cm-3)
Distilled water 1.000
Brackish water 1.005 – 1.012
Seawater 1.025 – 1.027
Polyethylene (PE) 0.91 – 0.98
Polypropylene (PP) 0.89 – 0.92
Polystyrene (PS) 1.01 – 1.11
Polyvinyl chloride (PVC) 1.16 – 1.45
Polyamide (PA) 1.13 - 1.5
Polyethylene terephthalate (PET) 1.34 - 1.39
Polyvinyl alcohol (PVA) 1.19 - 1.35
Cellulose acetate 1.22 – 1.24
2.2.2. Microplastic pollution effects in marine organisms and ecosystems
Due to their small size, microplastics are an environmental concern as they become
available for ingestion to a large number of marine organisms (Van Cauwenberghe
and Janssen, 2014) and can potentially be passed along the food web (Setälä et al.,
2014). Filter feeders and organisms near the bottom of the food chain may be
primarily affected by these microplastic particles (Zarfl et al., 2011). These organisms
have limited selective capacity with regards to food selection and will therefore
consume most particulate matter that is of an appropriate size (Wright et al., 2013).
Previous laboratory experiments have shown that microplastics are ingested by a
wide variety of benthic invertebrates, such as lugworms, barnacles, amphipods and
mussels (Setälä et al., 2014). The uptake of microplastics by organisms is
determined by a number of factors including: size, density and shape of the particles
(Van Cauwenberghe et al., 2015). Microplastics have been shown to have numerous
physiological effects on marine organisms, such as gut blockage, false satiation,

Chapter 2
16
decrease of fitness and malnutrition (Luís et al., 2015). More worryingly, recent
evidence has suggested that microplastics may act as vectors of chemical pollutants
being transferred to organisms (Chua et al., 2014). Microplastics may contain toxic
chemicals which are initially used as additives in the manufacturing process (Luís et
al., 2015). These include, but are not limited to, polybrominated diphenyl ethers
(PBDEs), a component of flame retardants, and phthalates which act as plastic
softeners. Moreover, chemical pollutants may adhere and accumulate on the
microplastic surface in quantities much greater than those detected in the
surrounding environment (Avio et al., 2015). The relatively large surface area to
volume ratio and hydrophobic nature of microplastic particles facilitates the formation
of a biofilm on the microplastic surface, further enabling the adsorption of persistent
organic pollutants (POPs) such as polychlorinated biphenyls (PCBs), polycyclic
aromatic hydrocarbons (PAHs) and heavy metals to the microplastic (Rochman et al.,
2015). Organisms that ingest biofilmed microplastics may be consumed by larger
predatory organisms, leading to a potential bioaccumulation of toxicants along the
food web (Ivar do Sul and Costa, 2014). Persistent organic pollutants and heavy
metals may result in fertility problems, stunted growth and possibly even death in
marine invertebrates (Liu et al., 2012).
2.2.3. Potential implications for human health
The direct risks posed by microplastics to humans are as a result of the ingestion of
microplastics by organisms which are utilized as marine food resources (Santana et
al., 2016). As the majority of fisheries are located in microplastic ‗hotspots‘ near
coastal areas (Mathalon and Hill, 2014), microplastics are becoming an increasing
concern for human health (Vandermeersch et al., 2015). Microplastics may be a
vector for toxicant transfer from the marine environment to humans in concentrations
much greater than those detected in the environment (Ziccardi et al., 2016). Studies
reporting ingestion of microplastics by marine species (Moore, 2008; Van
Cauwenberghe and Janssen, 2014) indicate that microplastics are indeed entering
the food web, which may be a concern for human health (Van Cauwenberghe and
Janssen, 2014). To date, there is limited published literature on in vitro and in vivo
toxicity studies of human ingestion of microplastics (Vandermeersch et al., 2015). Not
much is known on the physical and toxicological effects of microplastic ingestion in

Chapter 2
17
humans. However, the uptake and translocation of microplastics across the
mammalian gut has previously been demonstrated (Carr et al., 2012). Additionally,
Carr et al. (2012) demonstrated that PS microspheres (240 nm) could be taken up in
the placenta and cross the placental border in rodents, but this has yet to be shown
to occur in humans. The transfer of adsorbed toxicants from microplastics to humans
is still to be demonstrated in human trials, but has been shown in various marine
invertebrates commonly utilized as a food resource (Batel et al., 2016; Ziccardi et al.,
2016). The transfer of absorbed toxicants to various marine invertebrates poses a
risk for the transfer of these toxicants from the flesh of the organisms to humans who
ingest them.
2.3. Microplastic pollution in South Africa
A large number of recent publications have highlighted the widespread distribution of
microplastic pollution (Nel and Froneman, 2015), with reports of microplastics being
found in sediment (Stolte et al., 2015; Van Cauwenberghe et al., 2015; Alomar et al.,
2016), in both freshwater and marine systems (Wagner et al., 2014; Naidoo et al.,
2015), as well as within organisms (Van Cauwenberghe et al., 2015; Naidoo et al.,
2016) throughout the globe. It has been reported that the highest concentrations of
microplastics can be found in ocean gyres (Lebreton et al., 2012) as well as
anthropogenically impacted estuaries (Browne et al., 2011; Luís et al., 2015). In
comparison with global investigations, there have been limited investigations
regarding the distribution of microplastic pollution in South Africa. The first report of
microplastic pollution in South Africa was published by Ryan (1988), who reported
microplastic concentrations of 3.64 particles.m-3 in the sea-surface waters off the
coast of the south-western Cape Province. Ryan and Moloney (1990) reported plastic
debris as small as 2 mm in beach sediment on the South African southern and
western coastline between 1985 and 1989. An investigation by Lamprecht (2013)
found an average microplastic concentration of 30.9 ± 17.2 articles.L-1 in beach
sediment of Milnerton Beach, Cape Town. More recently, Nel and Froneman (2015)
investigated microplastic pollution in both sediments and water surfaces along the
south-eastern coastline of South Africa, reporting microplastic particle densities
ranging from 688.9 – 3308 particles.m-2 in beach sediment and 257.9 – 1215
particles.m-3 in sea-surface water samples, respectively. Naidoo et al. (2015)

Chapter 2
18
reported microplastic concentrations in areas of Durban Bay, located on the eastern
coast of South Africa, as high as 70.3 ± 119.3 particles per 10,000 L in surface water
and 159.9 ± 271.2 particles per 500 mL in sediment. These reports regarding
microplastic pollution in South Africa are concentrated on the south-western
coastlines, with little information of microplastic pollution along the eastern coastlines
aside from those by Naidoo et al. (2015) and Nel et al. (2017).
2.4. Factors affecting microplastic abundances in coastal zones near estuaries
2.4.1. Human populations and anthropogenic activities
Land-based microplastic pollution is transported into the marine environment
predominantly by freshwater drainage systems and their associated estuaries
(Cheung et al., 2016). This phenomenon was highlighted by Rech et al. (2014), who
found a similarity between plastic litter sampled in the upper courses of a Chilean
river system and plastic litter sampled in coastal areas located near the associated
estuary mouths. As there is a positive relationship between plastic abundance and
human population size (Depledge et al., 2013), it can be expected that higher
abundances of microplastics will be found in estuaries surrounded by larger
populations of people than estuaries surrounded by smaller populations, such as
Marine Protected Areas (MPA‘s) (Alomar et al., 2016). However, Zhao et al. (2015)
argued that this apparent correlation may not be the case, as economic structure
may also determine quantities of microplastic pollution in estuarine complexes.
Nevertheless, an increase in human population will most probably result in an
increase in microplastic pollution in the environment (Rocha-Santos and Duarte,
2015). In addition to human population size and economic structure, microplastic
abundances in estuaries will depend on the different activities leaching effluent into
each estuary. This was shown in a recent study by Naidoo et al. (2015) who found
high concentrations of microplastics (159.9 ± 271.2 particles per 500 mL) in the
densely populated and highly industrialized area of Durban harbour, KZN, but lower
microplastic concentrations (13.7 ± 5.6 particles per 500 mL) in ILovu estuary, KZN,
which receives no effluents from industrial activities and is surrounded by a relatively
less dense population.

Chapter 2
19
2.4.2. Seasonality
Estuaries can be classified as permanently open, temporarily open/closed, estuarine
lake systems, estuarine bays and river mouths (Whitfield, 1992). Temporarily
open/closed estuaries (TOCEs) are usually closed in the dry winter seasons and
open in the wet summer seasons in KZN (Scharler, 2012). The opening and closing
of an estuary‘s mouth is reliant on the freshwater input from the drainage system, the
estuary inlet dimensions as well as sand bar width (Scharler, 2012). As TOCEs are
only intermittently open to the marine environment, the effluents derived from these
estuaries are only transported into the marine environment in seasonal periods of
increased rainfall (wet season). Several studies have shown a positive relationship
between periods of rainfall and plastic abundance on beaches as well as in estuaries
(Ivar du Sol and Costa, 2013; Cheung et al., 2016). As TOCEs are subjected to
seasonal variations of freshwater riverine inputs, it is important to seasonally monitor
microplastic pollution in the near coastal zone originating from these estuaries, as
sampling in any particular season may result in inaccurate reports of microplastic
abundances. This seasonal variation of microplastics originating from estuaries was
investigated by Cheung et al. (2016), who noted significantly greater plastic (and
microplastic) abundances in wet seasons on beaches located near the Pearl River
Estuary on the western shores of Hong Kong than in dry seasons. Seasonal
sampling can allow for identification of potential spatial and temporal patterns of
microplastic pollution from estuaries, which eventually could be used to identify major
point sources of microplastic pollution into individual estuaries.
2.5. Microplastic pollution in South African estuaries
In South Africa, approximately 71 % of estuaries are temporarily open/closed
estuaries (TOCEs), with a far smaller proportion being permanently open to the sea
(Scharler, 2012). The eastern province of KwaZulu-Natal (KZN), boasts 73 TOCEs
(Begg, 1978), making up the predominant type of estuary in this region. Estuaries in
KZN, as in most parts of South Africa, are increasingly under stress as a result of
rapid urban development, mismanagement of water resources, increasing levels of
effluents and habitat destruction (Department of Water Affairs (DWA), 2013). As
estuaries transport nutrients into the near inter-tidal environment, the health of the

Chapter 2
20
marine organisms that reside in these areas can potentially be affected by the
effluents and microplastics released by these estuaries. A large social sector on the
coast extensively harvests marine food resources in KZN inter-tidal zones (Calvo-
Ugarteburu et al., 2017). Due to the potential impacts of microplastic ingestion by
organisms and transfer to humans (as outlined in Section 2.2.3), it is imperative that
the state of microplastic pollution in these areas is investigated. To date, only one
report has been published regarding microplastic pollution in KZN, focussing on
microplastic pollution in five eThekwini estuaries and their surrounding coastlines
(Naidoo et al., 2015). As data are limited, levels of microplastic pollution in South
African estuaries are currently not used in the determination of estuarine health
(DWA, 2013). In South Africa, estuaries can be broadly classified in terms of health
into categories (excellent, good, fair, or poor) based on their condition in terms of
functionality or viability as well as the degree of anthropogenic disturbances
(Whitfield and Baliwe, 2013). The South African Department of Water Affairs (DWA)
further categorises the health of an estuary into six Ecological Categories (EC)
(Appendix A: Table A 1) to determine the Present Ecological State (PES) of the
estuary, which is the degree to which the current estuarine conditions differ from
‗natural‘ baseline conditions (DWA, 2013). Estuaries near larger human populations
may have a lower health status than those estuaries in more pristine areas. As
microplastic pollution is purely an anthropogenically produced problem, it may be
assumed that higher microplastic pollution loads will be present in estuaries and
associated effluents into the marine environment in areas with a higher human
population. The health status of an estuary may potentially be used as an indicator of
microplastic pollution.
2.6. Microplastic sampling and quantification methodology
2.6.1. The need for microplastic monitoring protocols
As discussed in Sections 2.2.2 and 2.2.3, microplastic pollution poses a suite of
physiological and toxicological threats to marine organisms, ecosystems, as well as
potentially to humans. This provides good reasoning for microplastic mitigation
procedures to be developed and utilized in areas of high microplastic abundance.
However, simply removing microplastic debris from the environment is not a viable

Chapter 2
21
option, due to the unmanageably small sizes and large abundances of these particles
(Eerkes-Medrano et al., 2015). A more appropriate approach would be to reduce
microplastic input into the environment (Eerkes-Medrano et al., 2015). This has
already been implemented by some global corporate cosmetic companies, such as
Colgate-Palmolive (Pty. Ltd), which halted the manufacture of microbeads for use in
cosmetic scrubbers in 2014 (Rochman et al., 2015). There have also been legal
cases made, encouraging the adoption of legal policies to ban the use of
microplastics in personal care products sold by all corporate cosmetic companies in
California, United States of America (Doughty and Eriksen, 2014). However, this will
not decrease microplastic abundance in marine environments, as the longevity of
plastic polymers will ensure their persistence for many years (Eerkes-Medrano et al.,
2015). In addition, fragmentation of larger plastic debris into smaller plastic particles
within the marine environment will continue to occur (Avio et al., 2017). This continual
breakdown of plastic debris into microplastics has been described as ‗legacy inputs‘
(Eerkes-Medrano et al., 2015). Therefore, it is important to monitor the spatial and
temporal patterns of microplastic pollution to determine whether input reduction
strategies are in place, and if so, whether they are functional.
2.6.2. Lack of standardization of microplastic monitoring protocols
As marine microplastic pollution is a relatively new field of research, methods of
sampling, extraction and enumeration of microplastic abundances are relatively
limited and unharmonized throughout the literature (Besley et al., 2017). Microplastic
abundances have traditionally been investigated in water column, water surfaces and
sediments (Santana et al., 2016). Due to the large differences in methodology and
sampling procedures utilized, microplastic reportings cannot successfully be
compared and contrasted between studies (Van Cauwenberghe et al., 2015).
Microplastic pollution monitoring protocols often result in inaccurate representations
of microplastic pollution due to the limitations of sampling equipment (Hildago-Ruz et
al., 2012; Wesch et al., 2016). As a result of the rapidly developing number of
sampling and extraction techniques for detecting microplastics in natural
environments, and a lack of any form of standard operating procedure (SOP),
inconsistencies between methodologies used in sediment sampling and extraction of
microplastics become glaringly obvious (Hildago-Ruz et al., 2012; Besley et al.,

Chapter 2
22
2017). These include, but are not limited to, differences in lower and upper size limits
used, extraction technique efficiency and sensitivity, as well as overall differences in
sampling techniques utilized (Van Cauwenberghe et al., 2015). Due to the enormous
quantity of available literature of microplastic pollution detection, it was inherently
important that the literature was reviewed and the study methodology designed in
such a way as to ensure the comparison of the results of this study to global studies.
As the lack of standard microplastic pollution detection protocols is of such
importance, an entire chapter has been dedicated to the review of the available
methods (Chapter 3).
2.6.3. Influence of abiotic factors
Patterns of microplastic pollution in the water column and sediments are erratic as
they are influenced by a number of abiotic factors such as wind, tidal actions, and
ocean currents (Santana et al., 2016). Microplastics may accumulate in sediment in
densities far greater than those in the water column and these values cannot be used
to extrapolate microplastic abundances for what is available to organisms for
ingestion. The limitations and lack of standardisation throughout previously used
methodologies highlight the need for a SOP for microplastic sampling, or the
development of a new rapid and accurate procedure of microplastic sampling. Many
options have been explored, including the biomonitoring of microplastics using filter-
feeding marine invertebrates (Santana et al., 2016).
2.7. Pollutant biomonitoring
2.7.1. Marine pollutant biomonitoring
Marine pollution biomonitoring involves the use of biological material and organisms
to indicate the presence of pollutants in the marine environment (Anandraj et al.,
2002; Santana et al., 2016). Several marine invertebrate species have already been
used as bioindicators for a number of pollutants. These include fish and lugworms
(Tao et al., 2012) as well as polychaetes, barnacles and bivalves (Amoozadeh et al.,
2014). Invertebrates are commonly used as bioindicators as they are key
components of most marine ecosystems and their health and survival are constantly

Chapter 2
23
threatened by increasing levels of marine pollutants (Tosti and Gallo, 2012). Although
the use of fish as biomonitors for pollution has yielded some results, this is not
considered to be useful since some fish are highly mobile, and as such, cannot be
used to monitor spatial differences in pollution concentrations across different areas
(Vermeulen and Wepener, 1999).
2.7.2. Mussels as biomonitors of marine pollutants
Bivalve molluscs, including mussels, have been used worldwide as indicators of
multiple marine pollutants for more than 40 years (Degger et al., 2011). Mussels are
sedentary filter-feeders commonly found on rocky shores near estuary mouths where
they are susceptible to greater concentrations of pollution carried into the ocean via
rivers that lead into estuaries (Chiarelli and Roccheri, 2014; Dahms et al., 2014).
Mussels are ecologically important as they provide a variety of microhabitats, niches
and resources for other organisms, allowing for the co-habitation of a variety of
intertidal species, increasing biodiversity in rocky shore populations (Jungerstam et
al., 2014). Besides their ecological and economic importance, mussels are
considered to be one of the best biological indicators of environmental degradation
(Kacar et al., 2016). This is due to their filter-feeding strategy, as well their sedentary
lifestyle which causes them to accumulate pollutants, such as heavy metals, yet
remain resilient to natural fluctuations of environmental conditions (Vosloo et al.,
2012, Kacar et al., 2016). An international Mussel Watch Program (MWP) was
originally developed by Goldberg (1975) to monitor the scope of coastal zone
pollution, which has since led to the widely recognized and accepted use of mussels
as marine pollution monitors by many international organisations (Besada et al.,
2011). Mussels have been used in biomonitoring of marine environmental quality in
South Africa since 1974 (Degger et al., 2011, Greenfield et al., 2014) due to their
wide geographic range, size, sessile behaviour, ease of accessibility as well as
economic importance to both commercial and subsistence sectors in South Africa
(Resgalla et al., 2007, Vosloo et al., 2012; Martínez-Gómez et al., 2017). The South
African National Committee for Oceanographic Research (SANCOR) (reconstituted
in 1993 as the South African Network for Coastal and Oceanic Research) initiated a
Marine Pollution Research Programme (MPRP) for the South African coastal zone in
1985 (SANCOR, 1985) to provide relevant data and scientific input to management

Chapter 2
24
authorities on pollution loads in the coastal environment, successfully utilising a MWP
(Wepener and Degger, 2012; Sparks et al., 2014). Monitoring of marine pollutants by
MWP‘s in South Africa almost exclusively focuses on heavy metal pollution, as water
and sediment sample analysis for heavy metals is unreliable (Greenfield et al., 2014).
2.8. Mussels: potential of marine microplastic pollution monitoring
2.8.1. Effects of microplastics on mussels
As a result of their filter-feeding nature, bivalves are susceptible to the ingestion of
tiny microplastic particles (Gerber, 2015). Numerous laboratory-based investigations
(Browne et al., 2008; Von Moos et al., 2012) as well as field investigations (Van
Cauwenberghe et al., 2015) have shown that mussels are capable of microplastic
ingestion. This is a cause for concern, as mussels are not only ecologically important,
but are an important resource for both subsistence and commercial harvesting (Richir
and Gobert, 2016). Previous investigations have found an average of between 0.2
and 0.5 microplastic particles per gram of mollusc tissue, which translates to
approximately 1 microplastic particle per individual (De Witte et al., 2014; Van
Cauwenberghe and Janssen, 2014). A number of studies have documented the
effect of microplastic ingestion on mussel physiology. Gerber (2015) determined that
P. perna decrease filtration rates of microfibre particles (10 – 100 µm) with an
increase in microfibre concentrations from 1 mg.L-1 to 5 mg.L-1. Conversely, the
mussels adapted within 24 hours and increased feeding rates of microfibres with an
increase in microfibre concentration. This suggests that mussels may be able to filter
greater loads of microplastics in the natural environment. A long-term exposure
investigation by Rist et al. (2016) found that respiration rates and byssus production
of Perna viridis exposed to PVC microplastics decreased with an increase in
microplastic concentration after 44 days of exposure. After 91 days of exposure,
median mussel mortality rates increased when exposed to higher concentrations of
PVC microplastic particles. Von Moos et al. (2012) concluded that Mytilus edulis
ingested microplastics of size < 80 µm, that these microplastics trans-located into the
cells and tissue of the mussels, and that the ingested microplastics produced
significant histological changes in the gut of the mussel.

Chapter 2
25
2.8.2. The use of mussels as biomonitors of microplastic pollution
Most land-derived effluent reaches rocky shore habitats, where populations of
mussels are concentrated (Greenfield et al., 2014) via rivers and estuaries. Marine
mussels on rocky shores can therefore be used to monitor microplastic pollution from
effluent derived from nearby estuaries. The use of mussels as biomonitors of
microplastic pollution enables the identification of the relevant risks of certain
microplastics to the mussels (Santana et al., 2016), as well as the potential risk these
mussels pose to humans who utilize the mussels as a food source. As mussels‘
lifespans can reach 10 years, as well as being exposed to microplastic pollution
throughout their lifetimes (Rist et al., 2016), mussels may accumulate high quantities
of microplastics and associated toxicants in their tissues. Thus, human exposure to
microplastic pollution via the ingestion of mussels is cause for concern. However, this
relatively long life span, combined with the sedentary lifestyle, allows for variations in
spatial and temporal microplastic pollution patterns to be identified (Degger et al.,
2011; Greenfield et al., 2014).
Numerous studies have investigated microplastic content in several species of wild
mussels (De Witte et al., 2014; Mathalon and Hill, 2014; Van Cauwenberghe and
Jannsen 2014; Van Cauwenberghe et al., 2015). However only one study to date has
successfully used P. perna as an indicator of microplastic pollution in inter-tidal zones
(Santana et al., 2016). The mussel P. perna, belonging to the family Mytilidae, is
indigenous to South Africa (Zardi et al., 2006) and dominates the KwaZulu-Natal
coast line along inter-tidal zones (Zardi et al., 2006). Perna perna typically have
quicker growth rates than other mussel species (Oliveira et al., 2016) and are
harvested from natural populations on the KZN coast by subsistence fishermen
throughout the year (Yap et al., 2004). The use of P. perna as biomonitors of
microplastic pollution in coastal environments originating from estuaries in KZN
seems promising, offering an attractive alternative to ‗traditional‘ microplastic
monitoring procedures.

Chapter 2
26
2.9. Conclusion
The growing body of knowledge on microplastic pollution has highlighted the ubiquity
of microplastic pollution throughout the globe. Microplastic pollution is mostly as a
result of land-based anthropogenic activity, and is transported to marine
environments via freshwater systems and their associated estuaries. While
microplastic pollution has become a focus for a large body of research, there are still
numerous gaps in knowledge regarding microplastic pollution in areas such as South
Africa, as well as the potential effects microplastic pollution may have on global
ecology and marine seafood resources. To date, microplastic pollution is difficult to
compare between studies as a result of the lack of standardization of methodologies
and unit reporting. However, this should not limit the research on microplastic
pollution, but should stimulate further research in the field to ensure that microplastic
pollution can be adequately reported and potential impacts mitigated. The use of
mussels, in particular P. perna, as biomonitors of microplastic pollution monitoring
offers an attractive alternative to more ‗traditional‘ methods of microplastic pollution
monitoring and should be further investigated.

Chapter 3
27
CHAPTER 3: METHODOLOGY REVIEW
3.1. Introduction
Microplastic pollution is regarded as a relatively new field of research and as a result
there are currently no global standard operating procedures (SOP‘s) regarding data
collection, analyses and unit reporting of microplastic pollution in waters, sediments,
and in organisms (Eerkes-Medrano et al., 2015; Rocha-Santos and Duarte., 2015;
Helm, 2017). Despite the rapid growth in the number of published studies regarding
global microplastic pollution distributions, there still remains a lack of consistency
between sampling methods for the collection, extraction, identification and
enumeration of microplastic pollution from field collected samples (Besley et al.,
2017). Since the methods selected to sample and analyze microplastic samples have
a direct interaction with which microplastics are detected in samples (Joint Group of
Experts on Scientific Aspects of Marine Environmental Protection (GESAMP), 2015),
the differences in research methods limit the potential of resulting data to be
compared and contrasted between studies. The limited comparability potentially
prevents any meaningful comparison of microplastic abundances between studies
and limits the identification of spatial and temporal microplastic pollution distributions
in the marine environment (Eerkes-Medrano et al., 2015).
Although some efforts have been made to standardize research methods suitable for
microplastic pollution monitoring (Marine Strategy Framework Directive (MSFD),
2013; GESAMP, 2015; United Nations Environment Programme (UNEP), 2016), it
has been argued that standardized protocols for microplastic pollution monitoring
may not be applicable in every situation (Rochman et al., 2017). Each study
investigating microplastic pollution may have specific circumstances in which
harmonized approaches may not be appropriate. Regional differences in terms of
weather, accumulation of plastic and availability of resources may limit the extent to
which local study methodologies of microplastic pollution monitoring may mirror
global approaches (Lusher et al., 2017). However, these differences should not limit
the comparisons between studies, provided that the methods used are similar to
previously used methods and any differences between methods are described
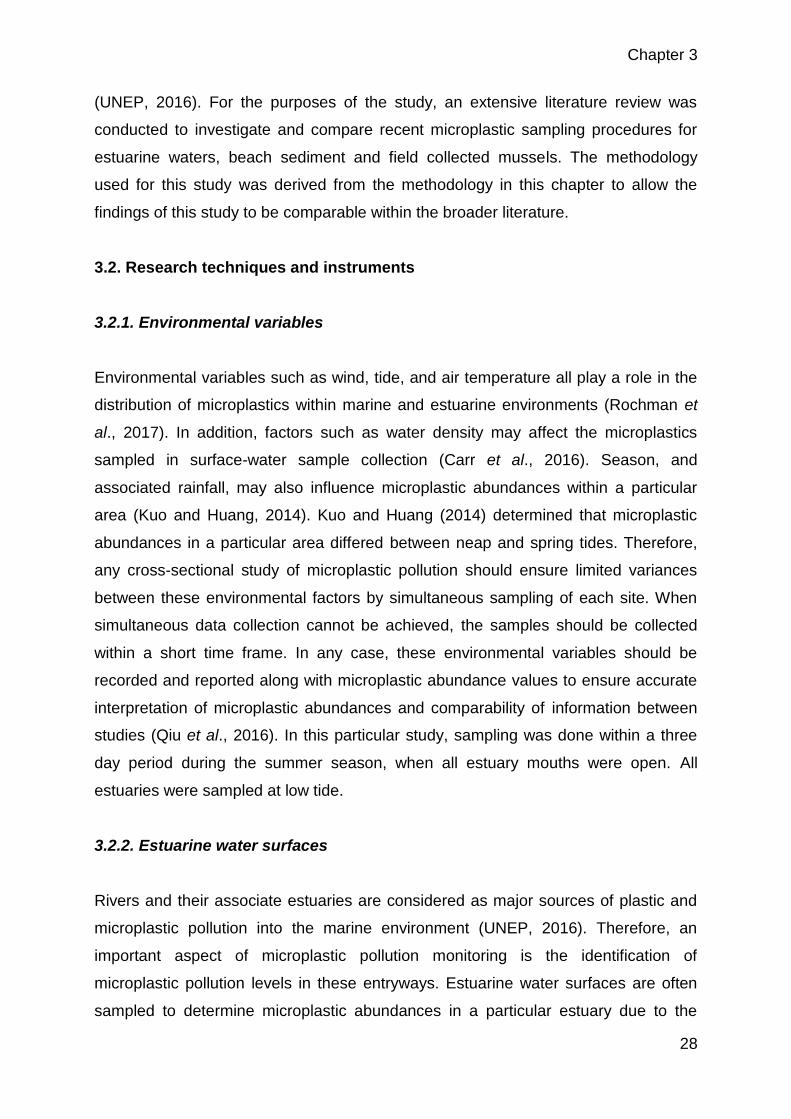
Chapter 3
28
(UNEP, 2016). For the purposes of the study, an extensive literature review was
conducted to investigate and compare recent microplastic sampling procedures for
estuarine waters, beach sediment and field collected mussels. The methodology
used for this study was derived from the methodology in this chapter to allow the
findings of this study to be comparable within the broader literature.
3.2. Research techniques and instruments
3.2.1. Environmental variables
Environmental variables such as wind, tide, and air temperature all play a role in the
distribution of microplastics within marine and estuarine environments (Rochman et
al., 2017). In addition, factors such as water density may affect the microplastics
sampled in surface-water sample collection (Carr et al., 2016). Season, and
associated rainfall, may also influence microplastic abundances within a particular
area (Kuo and Huang, 2014). Kuo and Huang (2014) determined that microplastic
abundances in a particular area differed between neap and spring tides. Therefore,
any cross-sectional study of microplastic pollution should ensure limited variances
between these environmental factors by simultaneous sampling of each site. When
simultaneous data collection cannot be achieved, the samples should be collected
within a short time frame. In any case, these environmental variables should be
recorded and reported along with microplastic abundance values to ensure accurate
interpretation of microplastic abundances and comparability of information between
studies (Qiu et al., 2016). In this particular study, sampling was done within a three
day period during the summer season, when all estuary mouths were open. All
estuaries were sampled at low tide.
3.2.2. Estuarine water surfaces
Rivers and their associate estuaries are considered as major sources of plastic and
microplastic pollution into the marine environment (UNEP, 2016). Therefore, an
important aspect of microplastic pollution monitoring is the identification of
microplastic pollution levels in these entryways. Estuarine water surfaces are often
sampled to determine microplastic abundances in a particular estuary due to the

Chapter 3
29
tendency of buoyant microplastics to accumulate at the water‘s surface (Gago et al.,
2016). Large volumes of water, in relation to water samples used for standard
chemical analysis (1 - 100 L), are often sampled due to the relatively low
concentrations of microplastics in water bodies in comparison to microplastic
concentrations in sediment (GESAMP, 2015; Löder and Gerdts, 2015). Manta trawl
tows are the most commonly used methods for sampling microplastics on water
surfaces (Hildago-Ruz et al., 2012). The use of manta trawls allow for large volumes
of water to be rapidly sampled while retaining a volume-reduced sample (Gago et al.,
2016). The most commonly used net mesh size is 333 - 335 µm (GESAMP, 2015;
Rocha-Santos and Duarte, 2015) and net aperture sizes (mouth opening of net)
range between 0.03 - 2 m2 (Gago et al., 2016; UNEP, 2016). The use of a net for
microplastic sampling is limited by the net‘s mesh size and often results in
underestimations of microplastic particles smaller than the mesh size. Conversely,
the use of smaller mesh sizes may result in net resistance, clogging and potential
ripping of the mesh, leading to underestimates of microplastic abundance (MSFD,
2013). In light of the underestimations of microplastic abundances by trawl sample
collection, surface grab samples have been used to collect microplastic abundance
data in particular water bodies (Barrows et al., 2017). Grab sampling involves
collection of a sample of water in a vessel and subsequent filtration under vacuum
filter. This method allows for the identification of smaller microplastics that are
possibly not sampled using manta trawl tows. Barrows et al. (2017), comparing the
effectiveness of a 0.335 mm neuston net tow and a 1 L surface grab, found that grab
samples collected three orders of magnitude more microplastics per volume of water
than a neuston net tow. However, the large variances of microplastic abundances
between grab samples does not allow for the environmentally relevant microplastic
abundances to be reported (Barrows et al., 2017). Therefore, manta trawls remain
the standard data collection techniques for surface water microplastic pollution
sampling. For the purposes of this study, the use of a manta trawl to collect estuarine
surface water samples for microplastic analysis was considered to be the most
appropriate and repeatable sample collection strategy.
Standard manta trawls are often constructed from aluminium or stainless steel,
allowing the manta trawl to be towed for long distances and to be used almost
indefinitely (Coyle et al., 2016). However, the construction of a standard aluminium or

Chapter 3
30
stainless steel manta trawl is limited by the cost and technical difficulty in
construction, and is therefore almost exclusively available to researchers with
appropriate funding. Standard manta trawls have also been cited as heavy and
difficult to transport (Coyle et al., 2016). For the purposes of this study, a manta trawl
was constructed largely based on the open source design for the Low-tech Aquatic
Debris Instrument (LADI) (Coyle et al., 2016).
Figure 3.1: The completed manta trawl, the "Manta-Reg"
The manta trawl (Figure 3.1), was constructed with low cost and readily available
hardware supplies. The mouth of the manta trawl (mouth size 0.28 m length x 0.32 m
width) was constructed using marine plywood, coated with a marine-grade wood
sealant. The ‗wings‘ were constructed with equal lengths of PVC pipe and sealed
with cap ends and PVC weld. The wings allowed the manta trawl mouth to float on
the water surface with half of the mouth submerged. The net of the manta trawl was
constructed from 300 µm mesh (Dawning Filters) and nylon ripstop fabric. The manta
trawl was designed such that the net may be changed with another net. The cod end
of the manta trawl is clamped on using standard hose clamps, which can be removed
to obtain samples collected by the manta trawl whenever needed.

Chapter 3
31
Once data is collected, microplastic pollution in surface water samples is preferred to
be reported as abundance when determining ecological significance (GESAMP,
2015). Microplastic abundance in surface water samples are most commonly
reported in number of items per area (m2) or volume (m3) sampled (MSFD, 2013;
Löder and Gerdts, 2015). However, reporting surface water microplastic abundance
as number of items per m3 may be an inaccurate measurement, as surface water
sample collection does not allow for the exact volume of water sampled to be
recorded. As such, water surface microplastic pollution may only be accurately
reported as number of items per m2. The reporting of microplastics per unit area of
surface water was used in this study to ensure the accurate representation of data
collected as the extrapolation of microplastics per unit volume may result in
underestimations or overestimations of volume filtered.
3.2.3. Microplastic sampling and extraction from sediment
Techniques of microplastic pollution monitoring have often involved the sampling and
analysis of microplastics deposited in benthic sediments which has been successfully
applied to beach, estuarine and sea-floor sediments (Solomon and Palanisami,
2016). Microplastic deposition on sandy beaches has previously been used to
extrapolate microplastic pollution levels in a particular coastal area (Nel and
Froneman, 2015). Microplastic abundances are commonly investigated in sandy
beaches due to the ease of accessibility (Van Cauwenberghe et al., 2015). Floating
microplastics from the ocean are primarily deposited in inter-tidal zones of beaches,
most commonly on strand or drift lines (Moreira et al., 2016). However, the deposition
and distribution of microplastics along beach profiles is not considered to be uniform
(Turra et al., 2014). Turra et al. (2014) determined that the majority of microplastics in
the upper inter-tidal zone are limited to the sediment surface, while microplastics
were concentrated in the backshore up to a 2 m depth. However, Besley et al. (2017)
found no significant distributional patterns of microplastics between inter-tidal zones,
high-tide marks, and supralittoral zones. Nonetheless, patterns of microplastic
distributions in beach sediment are subject to numerous influencing factors and are
therefore considered highly dynamic (Besley et al., 2017). The evaluation of
microplastics found in the inter-tidal zone would therefore be appropriate to
determine the amount of microplastic input from the ocean (Moreira et al., 2016) and

Chapter 3
32
not necessarily the amount of accumulated microplastics over time. When an estuary
mouth is open, the water flowing from the estuary will mix with the ocean water, often
resulting in the pollution of the nearby coastal environments. For this reason, the
analysis of sediment samples collected from the inter-tidal zone of sandy beaches
near estuary mouths may be useful to determine the input of microplastic pollution
from estuaries into the nearby coastal environments.
While sediment has often been sampled for microplastics, techniques of sediment
collection are often varied and specific to each study (Hildago-Ruz et al., 2012;
Besley et al., 2017). Beach sediment samples for microplastic analysis have
previously been collected using grab samplers (Löder and Gerdts, 2015), such as an
Ekman grab. During sample collection, grab-samplers mix sediment layers, thereby
preventing the identification of microplastic depositions at specific sediment depths
(Löder and Gerdts, 2015). In addition, the mixing of sediment layers collected does
not allow for consistency of the quantity of sediment sampled, potentially leading to
inaccurate reporting of microplastics within those sediment samples. The problem is
easily solved with the use of sediment corers. Sediment corers allow the collection of
sediment at specific depths and prevent the mixing of sediment layers (Löder and
Gerdts, 2015). Sediment sample depths range from 20 – 100 mm, forming the basis
of the recommendations put forward by MSFD (2013) to sample the upper 50 mm of
beach sediment, ensuring comparability of results between studies (MSFD, 2013;
Besley et al., 2017). For the purposes of this study, beach sediment samples for
microplastic analysis were collected to a depth of 5 cm from the high tide mark at
each site using sediment corers to ensure comparability among previous and future
studies.
In order to quantify microplastics in sediment samples microplastics need to be
separated from sediment and other biotic particles. Techniques previously used
involved floatation, filtration and sieving (Rocha-Santos and Duarte, 2015). Density
separation procedures have been shown as an effective method for microplastic
quantification in sediments (Claessens et al., 2013; Van Cauwenberghe et al., 2015).
This is based on the inherently different density properties of sediments and
microplastics. Sediment density has been approximated at 2.65 g.cm-3 (Rocha-
Santos and Duarte, 2015) and this density difference can be utilized to separate the

Chapter 3
33
microplastics from sediment. Microplastic extraction from sediments has commonly
involved the use of a hypersaturated sodium chloride (NaCl) solution (density 1.2
g.cm-3) which allows the lower density microplastics to float out of the higher density
sediment. The use of NaCl solution has been highly recommended because of the
low cost and eco-friendly nature (MSFD, 2013; Solomon and Palanisami, 2016). The
use of NaCl solution in density separation of microplastics from sediments has been
successfully demonstrated in a number of investigations (Naidoo et al., 2015;
Kedzierski et al., 2016). However, microplastics with a higher density such as
polyvinylchloride (PVC, density 1.14 - 1.56 g.cm-3) and polyethylene terephthalate
(PET, density 1.32 – 1.41 g.cm-3) possibly may not be extracted using this
methodology, resulting in underestimations of microplastics present in the sample
(Van Cauwenberghe et al., 2015). To overcome this potential shortfall Claessens et
al., (2013) suggested the use of a hypersaturated sodium iodide (NaI) solution
(density 1.6 - 1.8 g.cm-3). This was demonstrated by Nuelle et al. (2014) who
obtained higher extraction efficiencies of PVC and PET than the more frequently
used NaCl solution. However, the relative cost of NaI is much greater than NaCl, and
the higher density of NaI solution may also float interfering substances such as small
sediment particles (Qiu et al., 2016). Taking the previous recommendations for
microplastic extraction from sediment into consideration, this study used a pre-filtered
(to remove potential microplastic contaminants) saturated NaCl solution to separate
microplastics from sediment to ensure comparability of the study results with
previous studies, as well as to minimize financial resources required to carry out this
study and any future investigations. Microplastic abundances in sediment have
previously been reported as number of items per area (m2), per volume (L or m3), or
per dry sediment weight (g) (Löder and Gerdts, 2015). In this study, the data
collection of microplastic abundances in sediment was reported as number of items
per area (m2) for increased comparability with previous studies (Besley et al., 2017).
3.2.4. Microplastic sampling and extraction from mussels
As mussels are ecologically important and a major seafood resource (Li et al., 2015),
it is important to classify microplastics in mussels in the interest of ecosystem and
human health (Vandermeersch et al., 2015; Phuong et al., 2017). Mussels may also
be useful to monitor smaller microplastics which recommended procedures may

Chapter 3
34
underestimate (Lusher et al., 2017). Procedures of microplastic extraction and
quantification from field collected mussel samples previously described in literature
are limited and not harmonized (Claessens et al., 2013; Vandermeersch et al., 2015)
and as such, the comparison between studies are often unsuccessful.
Collection of bivalve molluscs, such as P. perna, from study sites is often simply
achieved by hand collection (Li et al., 2016). Once collected, the individual samples
are normally preserved until further analysis (Lusher et al., 2017). The fixative used
to preserve animals prior to microplastic analysis has always been dependent upon
the research questions asked (Lusher et al., 2017). Common fixatives, such as 4 %
formalin, have been used to preserve animal tissue, however, chemical fixatives
have the potential to degrade microplastic particles within biotic samples (Catarino et
al., 2016). Cyro-preservation (i.e. cold storage) is frequently used to minimize the
potential of microplastic degradation within samples (Lusher et al., 2017; Phuong et
al., 2017).
Previously, the presence of microplastics in marine invertebrate tissue was
determined by dissection of the animal gut and visual identification (Lusher et al.,
2017). However, microplastics have been shown to translocate from the gut of
mussels to the circulatory system (Browne et al., 2008), therefore the extraction
analysis of microplastics throughout the organism tissue is required (Phuong et al.,
2017). To minimize time of visual analysis and potential of misidentification of
microplastics, digestion techniques have been developed to eliminate or reduce the
quantity of organic matter, whilst ensuring the preservation of microplastics in the
samples (Karami et al., 2016; Phuong et al., 2017). Extraction of microplastics from
field collected organisms has previously been achieved by acid/alkaline or enzymatic
digestion procedures (Lusher et al., 2017), which removes organic tissues, leaving
the microplastics behind. Enzymatic digestion of mussel tissues has only been
demonstrated in a handful of studies (Cole et al., 2014; Catarino et al., 2016), with
the vast majority of studies relying on chemical digestion procedures
(Vandermeersch et al., 2015). The extraction of microplastics from field collected
samples using chemical digestion often involved strong acids or bases to remove
organic matter (Claessens et al., 2013). However some plastic particles may be
partially degraded or destroyed as a result of the strong acids/bases and high

Chapter 3
35
temperatures used (Catarino et al., 2016). This may lead to underestimated
microplastic levels within biota (Dehaut et al., 2016). Claessens et al. (2013)
compared the extraction efficiencies as well as polymer degradation of microplastics
using different digestion techniques. The most efficient acid digestion technique was
using nitric acid (HNO3) (22.5 M) followed by boiling (± 100 °C) for 2 hours
(Claessens et al., 2013). However, the use of HNO3 to digest biological sample tissue
has been shown to degrade a number of polymer types (Dehaut et al., 2016). More
recently, the International Council of the Exploration of the Sea (ICES) released a
preliminary protocol for the extraction and identification of microplastic particles in
fish guts (Vandermeersch et al., 2015). This includes a HNO3:HClO4 4:1 v:v mixture
as it digests both tissues and other organic matter, such as detritus. A more recent
and comprehensive report by Dehaut et al. (2016) compared the extraction
efficiencies and microplastic degradation using a number of previously reported
acidic, alkaline and enzymatic digestion procedures. The use of a 10 % potassium
hydroxide (KOH) solution at 60 ⁰C for 24 hours was recommended to digest mussel
tissue due to the high tissue digestion efficiency with no resulting degradation of
microplastic particles (Dehaut et al., 2016). Similar results were found by Phuong et
al. (2017), who demonstrated that the use of a 10 % w/w KOH solution resulted in the
greatest reduction of mussel tissue with the least microplastic damage. For the
purposes of this study, the digestions of mussel tissue with a 10 % w/w KOH solution
was chosen to minimize the loss of microplastics and maximize the digestion
efficiency of mussel tissue. Once samples have been digested, the resulting liquid is
filtered and analysed (Phuong et al., 2017). Microplastic abundances within biota is
recommended to be reported in reference with wet weight of biota tissue
(microplastics.g-1 w/w) to avoid invalid extrapolations of this value to relative
quantities in the environment (GESAMP, 2015; Phuong et al., 2017).
3.2.5. Microplastic identification, enumeration and analysis
To identify quantities and trends of microplastic pollution within the environment,
microplastic particles need to be counted and analysed to determine relative
abundances, potential sources and potential threats to exposed organisms
(Rodríguez-Seijo and Pereira, 2017). Perhaps the most obvious and important step
in determining microplastic abundances within samples is to distinguish between

Chapter 3
36
plastic and non-plastic particles. To date, there is no standard procedure for
microplastic polymer characterization (GESAMP, 2015). Multiple methods of
microplastic characterization have been previously described (Eerkes-Madrano et al.,
2015) which can be broadly divided into visual identification and chemical analysis
techniques. Visual identification of microplastics is considered to be one of the most
rapid and technically simple methods (Lusher et al., 2017). Visual identification of
microplastics is most commonly used to sort microplastics from non-plastics and are
thereafter categorized into groups based on morphological differences (Table 3.1)
which most commonly include size (longest dimension) (Lusher et al., 2017), colour,
degree of erosion, and type (Table 3.2) (Gallagher et al., 2016; Gago et al., 2016).
Table 3.1: Morphological characterization of microplastics (Hildago-Ruz et al.,
2012; Naidoo et al., 2015; Coyle et al., 2016; Gallagher et al., 2016; Helm, 2017,
Rodríguez-Seijo and Pereira, 2017)
Category Description
Source Primary microplastics: raw resin pellets, cosmetic scrubbers
Secondary microplastics: degradation of larger plastic items
Type/Shape Fragment (angular, subangular, subrounded, rounded), pellet
(cylindrical, ovoid, disk, flat), microbead, fibre, thread, foam,
film, other (e.g. cigarette butts, rubber)
Size < 5 mm in longest dimension
Erosion Weathering, biofilms, cracking, grooves, ridges
Colour Wide range, subjective to researcher
General Irregular, elongated, rough, broken edges

Chapter 3
37
Table 3.2: Description of common microplastic types (Hildago-Ruz et al., 2012;
Coyle et al., 2016; Li et al., 2016; Helm, 2017; Rodríguez-Seijo and Pereira,
2017)
Type Shape description Potential Source
Fragment Isolated, often fragmented
particle. No definitive shape
Broken off from a larger
plastic particle
Pellet ± 4 mm in diameter. Cylindrical,
disc or rectangular in shape
Raw materials for plastic
injection moulding
Microbead Very small, almost perfectly
spherical. Often brightly coloured
Cosmetic scrubbers,
industrial airblasting
Fibre Slender, elongated Synthetic fabrics
Thread Thread-like user plastics Nylon line, fishing line,
packaging straps
Foam Foamed user plastics Polystyrene packaging, or
polyurethane from
construction foam
Film Thin, sheet-like user plastic Plastic bags, foils, candy
wrappers
Other Plastic-like, but do not fit into any
other category
Cigarette butts, rubber,
elastics
The reporting of microplastic sizes and shapes within environments enables the
identification of potential microplastic sources and the potential physical and/or
chemical harm the microplastics pose to organisms (Rodríguez-Seijo and Pereira,
2017). Within each microplastic shape category, it has been recommended that
microplastics be further categorized based on degree of weathering, erosion, shape
of fragments as well as colour (Helm, 2017). The more specific categorization of
microplastics allows for the identification of the relative abundance of particular
microplastics in the environment, as well as the understanding of potential sources of
the microplastics (Helm, 2017; Lusher et al., 2017). Microplastic colour has
previously been used for preliminary identification of microplastic composition

Chapter 3
38
(Rodríguez-Seijo and Pereira, 2017). Visual identification of microplastics, on its own,
is open to multiple sources of bias such as the person counting the microplastics,
microscope magnification and quality, the sample matrix being examined, and is
limited to larger microplastics (Löder and Gerdts, 2015). The MSFD (2013)
recommended that visual identification of microplastics be combined with further
analytical procedures for microplastic polymer analysis to negate the shortcomings of
visual identification alone. Visual identification of microplastics > 500 mm is
considered appropriate (Dehaut et al., 2016), but subsamples of microplastics
smaller than 500 mm are recommended to be further analyzed (Lusher et al., 2017).
To further determine the polymer composition of microplastics, a number of chemical
analyses have been used to confirm polymer identity (Helm, 2017). Fourier
Transform Infrared spectroscopy (FTIR) has commonly been used for the chemical
analysis of microplastic particles and is considered the most reliable method of
plastic polymer identification to date (Hildago-Ruz et al., 2012). The use of FTIR to
determine polymer types of microplastics has been widely recommended (MSFD,
2013; GESAMP, 2015; UNEP, 2016). Using FTIR, polymer composition can rapidly
be identified by comparing the unique spectral signal of each polymer type to a
library of known polymer spectral signals. FTIR has been successfully utilized in a
number of investigations (Naidoo et al., 2015; Song et al., 2015; Vandermeersch et
al., 2015; Carr et al., 2016) as a means for polymer identification in addition to visual
identification. This method allows for the composition analysis of particles which
visibly identify as microplastic but may in fact not be microplastics. For example,
Eriksen et al. (2013) found that many particles initially identified as microplastics
were actually aluminum silicates which made up approximately 20 % of the 0.355 – 1
mm particle size fraction in samples. However, due to the high cost and level of
technicality of FTIR analysis, it is recommended that FTIR only be used when a few
samples are to be analysed (Rodríguez-Seijo and Pereira, 2017). An alternative and
perhaps the simplest method of microplastic identification is the ‗hot needle test‘ or
the ‗hot point test‘ (Lusher et al., 2017). The hot needle test involves a hot needle
being placed near a microparticle and observed under a microscope (De Witte et al.,
2014). If the particle reacts by bending or melting, the particle is classified as a
plastic. If the particle does not react, it is considered to be of a non-plastic origin and
hence omitted from the results (De Witte et al., 2014). While the hot needle test is an

Chapter 3
39
effective and low-tech method to identify microparticles as plastic, the test does not
allow for the specific polymer composition of the particle to be identified (Lusher et
al., 2017). In the context of this study, the ‗hot needle test‘ was determined as the
most efficient in terms of time and available resources.
To aid in the identification of microplastics from non-plastic particles in this study, a
simplified dichotomous key was developed using previously mentioned
recommendations of microplastic visual analysis (Table 3.3). Microplastics were
distinguished from non-plastics by following guidelines outlined in Table 3.3. Once a
particle had been identified as plastic, the maximum size dimension of each particle
was recorded in µm (Lusher et al., 2017), as well as microplastic type, colour, and
state of degradation (Coyle et al., 2016).

Chapter 3
40
Table 3.3: Guideline for visual identification of microplastics under
magnification.
Visual property Present? Reference
1. Particle < 5 mm Yes (See 2.) Arthur et al., (2009)
No (Not a microplastic)
2. Cellular or organic structures present
(excluding surface biofouling)
Yes (Not a
microplastic)
No (Fibre – See 3.
Other – see 6.)
Norén (2008)
Coyle et al., (2016)
Qiu et al., (2016)
3. Fibres equally thick throughout length Yes (See 4.)
No (Not a microplastic)
Norén (2008)
Coyle et al., (2016)
Qiu et al., (2016)
4. Fibre split/frayed Yes (See 5.)
No (Not a microplastic)
5. Particle homogenous in colour Yes (Microplastic)
No (See 6.)
Norén (2008)
Qiu et al., (2016)
6. Particle positively reacts to hot needle test Yes (Microplastic)
No (Not a microplastic)
De Witte et al., (2014)
3.2.6. Precautions and quality control
In modern times, a multitude of plastic products are used on a daily basis, therefore
the use of plastic products is often unavoidable. In microplastic sampling, this
translates to the omnipresent possibility of sample contamination with airborne
microplastics and clothing (Löder and Gerdts, 2015). As with any investigation,
precautions need to be taken to minimize sample contamination. Post-sample
contamination of samples with microplastics has previously been shown to be

Chapter 3
41
minimized by using non-plastic equipment such as glass (Nel and Froneman, 2015).
Contamination of microplastic samples by airborne microplastics in another recurring
issue in microplastic research (Van Cauwenberghe and Janssen, 2014). To avoid
airborne microplastic contamination, it has been recommended that laboratory
procedures take place in a fume cupboard and all samples covered when not in use
(Nel and Froneman, 2015). Clothing made from synthetic materials such as nylon
and polyester are commonly worn and as such, may provide a source of microfiber
contamination in samples (Woodall et al., 2015). As such, it is recommended that
personnel involved in laboratory procedures of microplastic investigations wear
protective clothing made from 100 % natural materials, such as cotton, to avoid any
microfibre contamination of samples. Procedural blanks should be included in
investigations to account for contamination by airborne microplastics (Catarino et al.,
2016).
3.3. Conclusion
There are numerous methodologies available for microplastic pollution monitoring,
however, this limits the extent to which microplastic pollution levels can be compared
and contrasted among global studies. A number of low cost sample collection and
identification methods have been identified in the relevant literature for the use in
estuarine, beach and mussel microplastic monitoring in this study. The low cost of
the data collection and analysis enables the replication of the methodologies outlined
in areas where resources may be limited, allowing microplastic pollution monitoring to
be expanded to areas where research may otherwise be hindered. In addition, the
methodologies outlined for use in this study enable easy replication for further
research of both spatial and temporal trends of microplastic pollution.

Chapter 4
42
CHAPTER 4: A NOVEL MACRO-BASED METHODOLOGY
FOR ACCURATE ESTIMATION OF MICROPLASTIC
FIBRE UPTAKE IN MUSSELS
4.1. Abstract
Microplastic (< 5 mm) pollution has recently become the focus of a large area of
research due to the ubiquity in marine environments and ingestion by marine
invertebrates such as mussels. However, the microscopy methods used to count and
measure microplastics in samples are time-consuming. The counting and
measurement of microplastics within samples is an important aspect of marine
microplastic biomonitoring but there is a need to develop a more rapid and
repeatable method of visual analysis. This study presents the first step in developing
an automated computer macro to count and measure microplastic particles within
mussel samples. The aim of this investigation was to determine if the developed
automated counting feature could be used as a viable time-saving alternative to
manual counting of microplastic fibres (microfibres) ingested by the rocky shore
bivalve Perna perna (L.) under laboratory conditions. Results showed that mean
microfibre counts, lengths, and widths were not statistically different between manual
and automated methodologies. The time taken to count microfibres in images was
significantly reduced using the automated counting and measurement method (1.00
± 0.14 minutes) as opposed to the manual counting and measuring method (23.91 ±
7.68 minutes). The findings showed that this novel counting methodology for
microfibre uptake in mussels under laboratory conditions is as effective and reliable
as manual microscopy, but resulted in significant reductions in microscopy time
analysis. Further research is required for the rapid polymer identification of
microplastic particles. As research of microplastic pollution is a relatively new area of
interest, the application of this novel methodology will reduce the microscopy time
necessary for sample analysis, benefitting future assessments of microplastics in
environmental samples.
Keywords: microplastics, microscopy, automation, novel methodology, Perna perna

Chapter 4
43
4.2. Introduction
Microplastics are any plastic particles smaller than five mm in size in their maximum
dimension (Lusher et al., 2017) and are primarily manufactured as raw plastic virgin
pellets for injection moulding and as scrubbers in cosmetic exfoliants (Ivar do Sul and
Costa, 2014; Luís et al., 2015). Microplastics are also formed from the breakdown of
larger plastic items in the environment via mechanisms such as wave, tidal,
chemical, and photo-degradation (Carr et al., 2016). One of the most common
sources of secondary microplastic particles is the plastic textile fibres from clothes
washed in washing machines (Cole et al., 2011; Lusher et al., 2013). As a result of
their small size and ubiquity throughout the marine environment (Van Cauwenberghe
et al., 2015), microplastics are of ecological concern as they are available for
ingestion to a wide variety of marine organisms (Van Cauwenberghe and Janssen,
2014). These ingested microplastics may not only affect the organisms which ingest
them, but can potentially be passed along the food web (Farrell and Nelson, 2013;
Setälä et al., 2014), further affecting a wide variety of organisms.
As a result of their filter-feeding nature, mussels are susceptible to the ingestion of
small microplastic particles (Von Moos et al., 2012). Numerous laboratory-based
investigations have shown that the ingestion of microplastics by mussels has a
negative effect on mussel physiology (Browne et al., 2008; Gerber, 2015). Organisms
in laboratory experiments are usually exposed to microplastic quantities far greater
than those found in natural environments (Phuong et al., 2016). The higher exposure
levels can be used to determine potential uptake rates of microplastics and the
associated adsorbed toxicants to the organisms should microplastic pollution levels
continue to increase in the natural environment. Studies of wild mussel populations
have shown that microplastics are being ingested by mussels in the marine
environment (Van Cauwenberghe et al., 2015), indicating that microplastics are
entering the food web. The ingestion of microplastics by wild mussels is both an
ecological and economic concern, as mussels are an important resource for
subsistence and commercial sectors (Richir and Gobert, 2016). However, the
presence of microplastics in mussels allows for the biomonitoring of microplastic
pollution within marine environments (Santana et al., 2016). Mussels are regarded as
an important biological indicator of marine pollution (Kacar et al., 2016) due to their

Chapter 4
44
sedentary lifestyle and filter-feeding strategy, which allows for spatial and temporal
patterns of marine pollutants to be identified (Martínez-Gómez et al., 2017). Mussels
have been used to monitor levels of heavy metal pollution in the South African
marine environment for a number of years (Degger et al., 2011, Greenfield et al.,
2014). However, it may be in the interest of ecosystem and human health to classify
and monitor microplastics within mussels in addition to heavy metals (Phuong et al.,
2017). The brown mussel, Perna perna (L.), is indigenous to South Africa (Zardi et
al., 2006) and is often harvested from natural populations along the KwaZulu-Natal
coastline by subsistence fishermen (Yap et al., 2004). The use of P. perna as a
biomonitor of microplastic pollution has previously been successful (Santana et al.,
2016), and offers an attractive alternative to abiotic monitoring of microplastic
pollution in the marine environment.
To identify quantities of ingested microplastics by organisms in laboratory and field
studies, microplastic particles need to be counted and analysed to determine relative
abundances, and potential threats to exposed organisms (Rodríguez-Seijo and
Pereira, 2017). Due to a lack of standardised procedures, multiple methods of
microplastic characterization in laboratory and field studies have been developed
(GESAMP, 2015). Visual characterisation has frequently been used as a rapid and
simple method to determine microplastic quantities, sizes, and shapes within
samples (Gallagher et al., 2016; Lusher et al., 2017). The quantification of
microscopic particles, such as microplastics, usually involves the use of light,
fluorescence or electron microscopy (Lusher et al., 2017) to manually count and size
each particle by photo enlargement or by counting and assigning particles to a size
class on the display (Rodríguez-Seijo and Pereira, 2017). Visual identification of
microplastics, on its own, is open to multiple sources of bias, such as the sample
matrix being examined, human error, and is limited to larger microplastics (Löder and
Gerdts, 2015). Visual counting is not only time-consuming, but researchers may be
prone to fatigue (Qiu et al., 2016). There is therefore a great need to introduce time-
saving, yet cost-effective alternatives to manual counting and sizing of microplastics.
Many freeware image analysis software applications, such as Image J and,
DeconvolutionLab, are available allowing for either the automated counting,
measurement or sizing of items of interest, but not all at once. The closest freeware

Chapter 4
45
that offers all options of the above is CellC, which was developed by Selinummi et al.
(2005) and has been used extensively for particle counting (Lehmussola et al., 2008;
De Vylder et al., 2013; Freimann et al., 2013). A limitation of CellC software is that it
can not be used for calibrating images for accurate dimensional estimates. It should
be noted that numerous other freeware image analysis software do exist (Heintzman,
2009) with each program structured around its intended purpose such as axon length
mapping, and three dimensional (3D) morphometries, with a few being solely
developed for bacterial enumeration and morphological characterization by white
light microscopy. In order for the accurate and rapid counting of microplastic
particles, the use of commercially available image analysis software Image Pro Plus
(IPP) was utilized as it offered the potential for automated counting and
measurements of microplastic particles, as well as providing continued technical
support. Although this software offers no repeatable automated counting feature,
simple macro steps can be programmed in order to make such repetitious functions
automated with minimal user input. Originally the macro herein was written
specifically to count and size DAPI (4‘6-diamidino-2-phenylindole) stained bacterial
cells. The use of this macro for counting bacterial cells was therefore adapted for the
use in counting and sizing microplastic fibres. The counting and measurement of
microplastics within mussels is an important aspect of marine microplastic
biomonitoring, however, there is a need to develop a more rapid and repeatable
method of visual analysis. This study presents the first step in developing an
automated computer macro to count and measure microplastic particles within
mussel samples. The aim of this investigation was to determine if the developed
automated counting feature could be used as a viable time-saving alternative to
manual counting of microplastic fibres ingested by the rocky shore bivalve, P. perna
under laboratory conditions. Objectives included 1) data comparison between
volunteers manually counting and measuring microfibres ingested by mussels using
IPP to compare with data collected by using the developed automated counting
feature and 2) account for potential time savings between the two methodologies. It
was hypothesized that 1) there would not be a significant difference in microfibre
counts and measurements between manual and automated methodologies and 2)
there would be a significant difference in data capture time between the
methodologies.

Chapter 4
46
4.3. Methods and Materials
4.3.1. Microfibre manufacture
To ensure homogeneity of size, shape and polymer composition of microplastics
particles to be counted, microplastic fibres were manufactured for the purposes of
this investigation. Ultra-violet (UV) fluorescent polyethylene-terephthalate (PET)
textile (395 nm) was manually sheared into fine fibres with scissors that had been
previously rinsed with deionised water. The fibres were placed in 500 mL of 100 %
ethanol and manually agitated until the fibres had separated. The fibre-ethanol
suspension was filtered through a 100 µm nylon mesh, and the filtrate was then
filtered through a 10 µm nylon mesh using a vacuum manifold. The plastics retained
on the 10 µm nylon mesh were collected and dried at 60 °C until constant mass. The
plastics (size range approximately 10 – 100 µm) were then weighed according to the
quantities needed for each experiment.
4.3.2. Microplastic ingestion experiment
Perna perna specimens (size class 50 – 60 mm) were sourced from the rocky shore
habitat at Park Rynie Beach, KwaZulu-Natal, South Africa (30°18'31.4"S
30°44'46.2"E) in October 2015 at low tide (average water temperature ± 24 °C).
Mussels were removed from the rocks by shearing the byssal threads with a 30 mm
titanium blade. Fouling organisms and debris were removed from the outer shell of
the mussels using a similar titanium blade, scrubbing brush and distilled water.
Mussels were contained in 50 L recirculating artificial saltwater (Red Sea Salt® with
distilled water) at a salinity of 30 psu and constant temperature (24 °C) (Srisunont
and Babel, 2015) for 48 hours to allow for depuration. During the 48 hour period,
mussels were initially fed ¼ teaspoon PhytoPlan® Advanced Plankton Diet and then
again after 24 hours to prevent starvation and to ensure that the guts were clear of
any microplastic particles prior to the experiment (Van Cauwenberghe and Janssen
2014). Ten mussels were individually distributed among ten buckets each containing
five L of recirculating and aerated artificial seawater (24 °C and 30 psu). Five mg [1
mg.L-1] of previously manufactured UV fluorescent microplastic fibres were dispensed
into each bucket and the mussels were allowed to feed for 24 hours. It has been

Chapter 4
47
noted that laboratory procedures often use microplastic concentrations several
thousand times greater than concentrations reported in field studies (Claessens et
al., 2013; Phuong et al., 2016). This is partly due to the difficulty of accurately
replicating the minute concentrations of microplastics found in natural environments,
and allows for the control of variables that cannot be controlled for in field
investigations. Mussels were removed and thoroughly rinsed with distilled water.
Each mussel was then placed into 50 mL of distilled water and boiled for 15 minutes
at 100 °C to allow for easier dissection of the gut tissue. The gut of each mussel was
carefully removed and alkaline digested according to methodology adapted from
Dehaut et al., (2016). Each gut was placed in jars containing 250 mL of 10 % (w/w)
potassium hydroxide (KOH). The jars were sealed and placed in an oven at 60 °C for
24 hours. Thereafter, samples were diluted to one L using distilled water and vacuum
filtered through a 5.0 µm polycarbonate track-etched ISOPORE™ membrane filter
(47 mm ⌀) (Merck Millipore Ltd.). The filters were dried at a constant temperature of
40 °C for 24 hours.
4.3.3. Microscopy and image analysis
The filters were viewed under UV illumination with a Nikon Eclipse 80i epifluorescent
microscope with external UV lamp using a 2X objective lens with the neutral density
filter (NDF) set at 4. The filter set comprised a UV – 2B filter with an excitation
wavelength of 330 – 380 nm, dichromic mirror of 400 nm and barrier filter of 420 nm.
The software program NIS Elements D (NIKON) was used for image capture, using a
Nikon Digital Sight DS–F1i digital camera for each sample. Image acquisition
parameters within NIS Elements D were adjusted to give the best image quality due
to the extreme distance between the sample and the objective lens when using
fluorescence. Ten fields of view were digitally captured within the working filtered
area with each captured field being 2.90 x 107 µm2 at 20X magnification. Ten
captured images covered approximately 94.77 % of the filter, allowing for a high
degree of accuracy while avoiding the potential of overlapping images. When
required, due to an inconsistent X – plane, multiple images of one field of view were
captured to be digitally Z stacked for improved quality and focus. Images to be
stacked were run through Image Pro Plus v.6.2 (IPP) with a specifically scripted
macro enabled Extended Depth of Field (EDF) for this study.

Chapter 4
48
Stacked images were then run through another specifically scripted macro in IPP for
data acquisition. Briefly, each sequential image was low level gray-scaled then
calibrated to a pre–set calibrated scale bar. Following this the image was
automatically assessed by a pre–selected histogram segmentation threshold that
was set to 27:255 for optimal data collection. This setting was previously determined
to give the best overall data acquisition based on image brightness and pixilation
around the microfibres. Data were then exported to a Microsoft Excel® data sheet for
further analysis. Data gathered included, but was not limited to, area, diameter,
length, width, ferret min, ferret max and the perimeter length of each microfibre.
Microfibres that were touching any edge of the captured image were not counted as it
could not be determined what proportion of the microfibre was outside of the image.
Macros were written using MS Excel® VBA (Visual Basic for Applications) to
automatically analyze and calculate the data within the Excel file captured from IPP.
To test the efficiency, accuracy and reproducibility of the above automated counting
feature, 50 microfibre images were given to five volunteers to count and size. For
ease of manual data gathering, only the width and best arc length were counted. This
data was compared to data collected from the automated counting feature for
accuracy of counts, measurements and time taken for analysis.
4.3.4. Calculations and statistical analyses
Calculation and extrapolation of microfibre counts per mussel (microfibres.mussel-1)
for both manual and automated counting methodologies was calculated using the
following equation:
(
)
Where N = final estimated microfibre counts per mussel (microfibres.mussel-1), AF =
working surface area of the filter used (3.06 x 108 µm2), n = total microfibres counted
in I number of images, I = number of images per filter (10), AI = total area of field of
view (FOV) for one image (2.90 x 107 µm2).

Chapter 4
49
All statistical analyses were done using IBM SPPS Statistics (version 23 for
Microsoft® Windows® 10). Statistical significance was set at α = 0.05 for all statistical
tests. Mean microfibre counts per mussel (microfibres.mussel-1) between manual
counting and automated counting were compared using a Paired samples t test after
assumptions of normally distributed data were met (One-sample Kolmogorov-
Smirnov test = 0.224, p = 0.20). Mean microfibre length (µm) was compared between
manual and automated counting methodologies using a Paired samples t test after
assumptions of normally distributed data were met (One-sample Kolmogorov-
Smirnov test = 0.233, p = 0.20). Mean microfibre width (µm) was compared between
manual and automated counting methodologies using a Paired Samples t test after
assumptions of normally distributed data (One-sample Kolmogorov-Smirnov test =
0.23, p = 0.20) was met. Mean time (minutes) taken to count and measure
microfibres in images was compared between manual and automated counting
methodologies using a Paired samples t test after assumptions of normally
distributed data were met (One-sample Kolmogorov-Smirnov test = 0.320, p = 0.103)
4.4. Results
There was no significant difference in the number of microfibres.mussel-1 between
manual (85.32 ± 42.61 microfibres.mussel-1) and automated (83.36 ± 43.33
microfibres.mussel-1) counting methodologies (Paired samples t test: t = 0.71, p =
0.52) (Figure 4.1a). There was no significant difference in counted microfibre length
(µm) within each mussel between manual (338.61 ± 81.48 µm) and automated
(370.56 ± 79.51 µm) counting methodologies (Paired samples t test: t = -2.48, p =
0.069) (n = 5) (Figure 4.1b). There was no significant difference in counted
microfibre widths (µm) within each mussel between manual (23.23 ± 1.45 µm) and
automated (23.03 ± 1.82 µm) counting methodologies (Paired samples t test: t =
1.16, p = 0.31) (Figure 4.1c). Mean time taken (minutes) to count and measure the
number of microfibres.mussel-1 was significantly different between manual and
automated counting methodologies (Paired samples t test: t = 6.66, p = 0.003). Mean
time taken (minutes) to count and measure the number of microfibres.mussel-1 was
significantly less using the automated methodology (1.00 ± 0.14 minutes) than the
manual methodology (23.91 ± 7.68 minutes) (Figure 4.1d).

Chapter 4
50
Figure 4.1: Comparisons of mean microfibre counts (microfibres.mussel-1) (a),
mean microfibre length (µm) (b), mean microfibre width (µm) (c), and mean time
taken (seconds) to count images for one mussel sample (d) between manual
and automated counting methodologies (n = 5 volunteers). Lowercase letters
indicate significant differences between data (p < 0.05). Error bars represent ±
1 standard deviation (SD).
a
a
0
20
40
60
80
100
120
140
Manual AutomatedMean
mic
rofi
bre
s.m
ussel-
1
Methodology
(a)
a
a
0
50
100
150
200
250
300
350
400
450
500
Manual Automated
Mean
mic
rofi
bre
len
gth
(µ
m)
Methodology
(b)
a
a
19
20
21
22
23
24
25
26
Manual AutomatedMean
mic
rofi
bre
wid
th (
µm
)
Methodology
(c)
a
b
0
5
10
15
20
25
30
35
Manual Automated
Mean
tim
e (
min
ute
s)
Methodology
(d)

Chapter 4
51
4.5. Discussion
The results show that there was no overall difference in microfibre counts and
measurements between manual and automated counting methodologies (Figure
4.1), therefore the hypothesis stating there will be no significant difference in
microfibre counts and measurements between manual and automated counting
methodologies was accepted. However the average time taken time taken (minutes)
to count and measure the number of microfibres.mussel-1 was significantly quicker
using the automated methodology than the manual methodology (Figure 4.1d). As a
result, the hypothesis stating there would be a significant difference in data capture
time between the methodologies was accepted. This data shows that the innovative
automatic counting feature developed can be used as a time-saving alternative to
manual counts of microfibres. There was also significantly less variation in time taken
to count and measure microfibres using the automated counting method than the
manual counting (Figure 4.1d), which indicates that the automated counting
methodology is far more reliable in data acquisition across all samples as compared
to manual counting. In addition to significantly reducing data capturing times,
automated counting allows for the removal of bias due to human error and fatigue
(Qiu et al., 2016).
Although there was no significant difference in microplastic counts between
automated counting and manual counting by human volunteers (Figure 4.1a), the
automated counting could not distinguish between particles of interest (in this case,
UV-fluorescent microfibres) and any other potentially interfering material (Figure
4.2). Figure 4.2 shows microfibre particles of interest in this study (A), and cotton
fibres (B) that had been intentionally placed in samples, all of which fluoresce under
UV illumination. The lack of distinction between particles of interest and debris by the
automated counting method may be attributed to the pre-grayscaling of the images,
whereas with the manual counting all volunteers were supplied colour images.
However, this lack of distinction may also be reflected in manual counting, where
volunteers with pre-existing physiological conditions (i.e. colour-blindness) may not
be able to differentiate between microplastic particles and other particles that may
fluoresce under UV illumination. These results indicate that regardless of manual or
automated methods, visual identification of microplastics and other debris may need

Chapter 4
52
to be supplemented with chemical analysis (Helm, 2017) to confirm particle
composition. The use of chemical analysis to identify microplastic polymer type has
been widely successful (Helm, 2017), with many studies using Fourier Transform
Infrared (FTIR) spectroscopy and Raman microspectroscopy (Hildago-Ruz et al.,
2012; MSFD, 2013; GESAMP, 2015; Naidoo et al., 2015; Carr et al., 2016; UNEP,
2016). However, FTIR and Raman microspectroscopy demand a relatively high level
of technical skill and financial resources (Helm, 2017; Maes et al., 2017). It has been
recommended that these analyses be used only for small sample sizes or for sub-
samples of data (Rodríguez-Seijo and Pereira, 2017). Automation procedures of
infrared (IR) microscopy to identify microplastics have been developed (Tagg et al.,
2015; Löder and Gerdts, 2015), but these methods are not recommended for
monitoring due to slow speed, high financial cost and poor spectral signals (Maes et
al., 2017).
Figure 4.2: Micrograph showing plastic microfibre (A) and non-plastic cotton
fibre (B) under ultra-violet (UV) illumination at 20X magnification. Scale bar
represents 1000 µm.
(A)
(B)

Chapter 4
53
A simple and effective procedure for distinguishing between microplastic particles
and other particles of non-plastic origin was developed by Maes et al. (2017), using
in situ fluorescent tagging of microplastics with the lipophilic dye Nile Red (NR). The
fluorescent tagging of microplastics with NR allows microplastic particles to be
distinguished from non-plastic particles under blue light (450 – 510 nm) and orange
filter (529 nm) (Figure 4.3). Although the automated macro used in Chapter 4 is
currently not useful for the characterization of plastic particles from non-plastic
debris, the adoption of fluorescent tagging of samples with NR, together with the
automated counting methodology, may aid in the rapid assessment of microplastics
from both laboratory and field studies. Microfibres used in this investigation were all
of consistent shape and colour, however the automated counting feature could be
capable of counting and measuring many varieties of microplastics.
Figure 4.3: Marine sediment spiked with microplastics of six different polymer
types, dyed with Nile Red, and filtered on to a Whatman GF/F filter. Photo taken
with blue light (450 – 510 nm) and orange filter (529 nm) (Maes et al., 2017).

Chapter 4
54
4.6. Conclusion
The novel automated methodology developed for the purposes of this investigation
resulted in significant saving of time with regard to microplastic counting. However,
further research is required regarding the identification of plastic and non-plastic
particles within samples. Automated features for the counting and measurement of
microfibres may be used in a wide variety of applications, including the use of rapid
bioassessement of microplastics ingested by mussels. The use of the automated
counting feature not only saves time, but reduces human error and fatigue and allows
for minimal training on the software thus enabling more samples to be processed
within a shorter period of time. In combination with fluorescent tagging of
microplastics, the automated method of counting will produce reliable estimates of
microplastic abundances within samples in future assessments of microplastic
pollution.

Chapter 5
55
CHAPTER 5: MICROPLASTIC POLLUTION DISTRIBUTION
IN SELECTED KWAZULU-NATAL TEMPORARILY
OPEN/CLOSED ESTUARIES DURING AN OPEN
MOUTH PHASE.
5.1. Abstract
Microplastic (< 5 mm) pollution has recently become the focus of a large body of
research due to its ubiquity and negative effects on organisms that ingest
microplastics. Global research trends are comparatively more focused on marine
microplastic pollution as opposed to freshwater microplastic pollution. As rivers and
their associated estuaries are considered to be major conduits of microplastic
pollution to the marine environment, it is important to identify microplastic pollution
levels in these estuarine entryways. To date, there are very few studies investigating
microplastic pollution in KwaZulu-Natal estuaries. This investigation aimed to identify
and compare microplastic pollution in three KwaZulu-Natal estuaries during an open
mouth phase. Results showed that Bilanhlolo Estuary had significantly greater levels
of microplastic pollution in sediment (4.22 x 10⁴ ± 2.17 x 10³ microplastics.m-2) and
surface water (5.98 ± 0.46 microplastics.m-2) as compared to Mhlangeni Estuary
(sediment: 1.33 x 10⁴ ± 1.52 x 10³ microplastics.m-2; surface water: 4.50 ± 0.59
microplastics.m-2) and Kongweni Estuary (sediment: 1.89 x 10⁴ ± 2.31 x 10³
microplastics.m-2; surface water: 2.34 ± 0.23 microplastics.m-2). Microplastic fibres
were the most dominant microplastic type in all studied systems (60.07 %) and
smaller microplastics were more abundant than larger microplastics in all studied
systems. This investigation is the first of its kind to investigate microplastic pollution
in these three estuaries and may be used as a baseline survey for future research of
South African microplastic pollution.
Keywords: microplastics, temporarily open/closed estuaries, open mouth phase,
South Africa, baseline

Chapter 5
56
5.2. Introduction
Microplastics are plastic particles smaller than 5 mm in their longest dimension
(Lusher et al., 2017) and are classified as primary or secondary based on their origin
(Cole et al., 2011). Primary microplastics are manufactured to be of a small size,
such as cosmetic scrubbers (Thompson et al., 2004), and secondary microplastics
result from the disintegration of larger plastic items via physical, chemical, and
biological degradation (Barnes et al., 2009). Another common source of secondary
microplastics is the microfibres which are produced as a result of washing synthetic
garments (Cole et al., 2011; Lusher et al., 2013). The inner drums of washing
machines act as a ‗grater‘ and sheer off minute synthetic fibres (Lusher et al., 2013).
These microplastics, along with primary microplastics, go directly from domestic
sources to municipal wastewater treatment works (WWTW). Microplastics are a
cause for concern as they may become available for ingestion by a number of
organisms (Van Cauwenberghe and Janssen, 2014). The ingestion of microplastics
have been shown to have numerous negative physiological effects on organism (Luís
et al., 2015), in addition to acting as vectors of toxicants to organisms (Chua et al.,
2014).
Recent publications have highlighted the widespread distribution of microplastics in
sediment (Alomar et al., 2016), freshwater and marine environments (Wagner et al.,
2014; Naidoo et al., 2015), as well as within organisms (Van Cauwenberghe et al.,
2015; Naidoo et al., 2016). Global research trends of microplastic pollution are
noticeably more focused on marine environments (Eerkes-Medrano et al., 2015) and
this has led to numerous clean-up projects and plastic-collection devices within
marine environments (Mahon et al., 2017). Despite approximately 80 % of plastic and
microplastic pollution in the marine environment being derived from terrestrial
sources (Andrady, 2011), there are still enormous knowledge gaps regarding the
impacts on ecological and human health of freshwater microplastic pollution and
consequential transport to marine environments (Eerkes-Medrano et al., 2015;
Cheung et al., 2016). Rivers and their associated estuaries are considered as major
sources of plastic and microplastic pollution into the marine environment (United
Nations Environmental Program) (UNEP), 2016). This phenomenon was highlighted
by Rech et al. (2014), who found a similarity between plastic litter sampled in the

Chapter 5
57
upper courses of a Chilean river system and plastic litter sampled in coastal areas
located near the associated estuary mouths. Therefore, an important aspect of
microplastic pollution monitoring is the identification of microplastic pollution levels in
these estuarine entryways. The lack of microplastic pollution research in freshwater
systems is mirrored within the South African context, as the majority of investigations
of microplastic pollution in South Africa focus on ocean and coastal microplastic
pollution (Ryan, 1988; Ryan and Moloney, 1990; Lamprecht, 2013; Nel and
Froneman, 2015). Only two South African studies to date have investigated
microplastic pollution in freshwater systems (Naidoo et al., 2015; Nel et al., 2018).
Temporarily open/closed estuaries (TOCEs) are a type of estuary characterized by
the opening of the estuary mouth during periods of increased rainfall, and the closure
of the estuary mouth during periods of decreased rainfall (Scharler, 2012). As
estuaries are intermittently open to the marine environment, effluents derived from
these estuaries are only transported in to the marine environment during periods of
mouth opening. 71 % of South African estuaries are classified as TOCEs (Scharler,
2012). In KwaZulu-Natal (KZN), there are 73 TOCEs, which makes up the
predominant type of estuary in this region (Begg, 1978). To date, there is only one
published study regarding microplastic pollution in KZN estuaries (Naidoo et al.,
2015), focussing on microplastic pollution in selected eThekwini estuaries and their
surrounding coastlines (Naidoo et al., 2015). Due to the relatively new understanding
of microplastic pollution and a lack of data, levels of microplastic pollution are not
used in the determination of estuarine health status in South Africa (DWA, 2013).
The South African Department of Water Affairs categorises estuaries based on their
health status in to six Ecological Categories (EC). The EC is then used to determine
the Present Ecological State (PES) of the estuary, which is the degree of which the
current estuarine conditions differ from ‗natural‘ or baseline status (DWA, 2013)
(Appendix A: Table A 1). As microplastic pollution is purely an anthropogenically
produced problem, it can be assumed that more microplastic pollution will be present
in estuaries and the associated effluent into the marine environment in area with a
higher human population (Rocha-Santos and Duarte, 2015). However, Zhao et al.
(2015) argued that population demographics surrounding an estuary are not the
primary causation of microplastic pollution within the estuaries, as economic structure
may also determine quantities of microplastic pollution in estuarine complexes. In

Chapter 5
58
addition to human population size and economic structure, microplastic abundances
in estuaries will depend on the different activities leaching effluent into each estuary.
Therefore, the PES of an estuary may be a more accurate predictor of microplastic
pollution levels in estuaries than surrounding population sizes. Due to the potential
impacts of microplastic ingestion by organisms (Chua et al., 2014) and transfer to
humans (Ziccardi et al., 2016), it is imperative that that state of microplastic pollution
in these areas is investigated.
The aim of this investigation was to determine microplastic pollution status in three
temporarily open/closed estuaries in KwaZulu-Natal during an open mouth phase.
The three estuaries, Mhlangeni Estuary, Kongweni Estuary, and Bilanhlolo Estuary,
all fall within the Ugu District Municipality, KwaZulu-Natal and experience similar
climate and weather due to their close geographic proximity. As microplastic pollution
in these estuaries has not been previously investigated, this investigation serves as a
baseline survey of microplastic pollution in these areas. Objectives of the study were
to compare 1) microplastic abundance in surface water and sediment among
estuaries, 2) compare microplastic type composition in surface water and sediment
among estuaries, and 3) compare microplastic size class distribution in surface water
and sediment among estuaries. As a descriptive analysis, the quantity of microplastic
pollution in each estuary was compared to the PES of each estuary It was
hypothesized that there would be a difference in microplastic abundance, type and
sizes in surface water and sediment between the three estuaries.
5.3. Methods and Materials
5.3.1. Data collection and processing
All data was collected from the selected estuaries (Mhlangeni Estuary, Kongweni
Estuary, and Bilanhlolo Estuary) (Chapter 1: Figure 1.1) over a three day period in
January 2017. Samples were collected at low tide during estuarine open mouth
phases. Estuarine surface water samples from each estuary mouth were collected
using a manta trawl (mouth size 0.28 m length x 0.32 m width; mesh size 300 µm).
The mouth of the manta trawl floated on the water surface so that approximately half
of the mouth was submerged. The manta trawl was towed for 50 m perpendicularly

Chapter 5
59
across each estuary mouth at ebb tide (Frère et al., 2017) for five replicate trawls per
estuary. Samples were taken only from the mouth of each estuary because this water
is most likely to enter the ocean at the time. An analysis of the upper reaches of the
estuaries would be redundant for the purposes of this study. Samples were washed
into the cod-end of the manta trawl. The cod-end was removed and contents washed
through a 5 mm sieve and then into a 300 µm sieve. The sample contents retained
on the 300 µm sieve were carefully transferred into previously acid-rinsed
polyethylene jars and sealed. Sample bottles were stored in a freezer at -20 ⁰C until
laboratory processing. Prior to laboratory processing, surface water samples were
removed from the freezer and completely thawed at room temperature (± 25 °C).
Surface water samples were vacuum-filtered on to 5.0 µm polycarbonate track-
etched ISOPORE™ membrane filters (47 mm ⌀) (Merck Millipore Ltd.). Each filter
was placed in to a new, clean plastic petri dish, loosely covered with aluminium foil
and dried in the oven at 60 ⁰C for 24 hours. Petri dishes were removed from the oven
and covered with aluminium foil until further microscope analysis.
Sediment samples for microplastic analysis were collected at two stations (North and
South) within each estuary mouth. At each station, using a plastic corer (45 mm
internal ⌀), five replicate sediment core samples of the top 5 cm of sediment in were
taken at the hightide mark at a minimum of 1 metre apart as per recommendations
(see Chapter 3, Hildago-Ruz et al., 2012; MSFD, 2013; Naidoo et al., 2015; Besley
et al., 2017). Each sample was collected and sieved through a 5 mm stainless steel
sieve and placed into previously acid-washed 300 mL bottles and sealed. Personnel
collected samples standing downwind of each sample site, to minimize airborne
microplastic contamination of collected samples (MFSD, 2013). Sediment samples
were stored in a freezer at -20 °C until laboratory processing. Prior to laboratory
processing, sediment samples were removed from the freezer and completely
thawed at room temperature (± 25 °C). Sediment samples were decanted into
aluminium ‗boats‘ and covered with additional aluminium foil. Samples were placed
into an oven and dried at 60 ºC for 48 hours until constant mass (Naidoo et al.,
2015). Density separation was used to separate microplastics from sediment. A fully
saturated sodium chloride (NaCl) solution was prepared by adding 360 g of
commercially available iodated table salt (First Value®) to a beaker containing 1 L of
distilled water and a magnetic stirrer bead. The beaker opening was covered with

Chapter 5
60
aluminium foil and placed on a magnetic stirrer. The mixture was mixed using a
magnetic stirrer at high speed at room temperature (25 ⁰C) for ten minutes.
Thereafter, the mixture was allowed to stand for a further 10 minutes. As
microplastics have been found in commercially available table salt (Yang et al., 2015;
Karami et al., 2017), the NaCl solution was vacuum-filtered on to a Whatman®
borosilicate glass microfibre filter (47 mm ⌀, 0.7 µm pore size) (Sigma-Aldrich©). The
supernatant was collected and the procedure was repeated until the appropriate
quantity of saturated NaCl solution had been obtained. Each dried sediment sample
was weighed to the nearest 0.001 g and thereafter mixed with 200 mL of saturated
NaCl solution with a glass rod in a 250 mL beaker (both previously rinsed with
deionized water) for approximately 2 minutes. The sediment-salt mixture was allowed
to stand for a minimum of one hour until the sediment had visibly settled, thereafter
the supernatant was carefully poured into the vacuum filtration receiver as to exclude
larger sediment particles. The supernatant was filtered through a 5.0 µm
polycarbonate track-etched ISOPORE™ membrane filter (47 mm ⌀) (Merck Millipore
Ltd.). The sediment sample was replenished with a further 200 mL of filtered NaCl
solution and the extraction procedure was repeated. As per recommendations by
MSFD (2013) and Besley et al., (2017), the extraction procedure was repeated three
times per sediment sample. Each filter was placed in a clean plastic petri dish and
covered with aluminium foil. The samples were dried in an oven at 60 ºC for 24 hours
and thereafter stored (still covered) at room temperature until microscope analysis.
To reduce the possibility of airborne microplastic contamination during laboratory
processing, all samples were covered with aluminium foil when not in use (Nel and
Froneman, 2015; Catarino et al., 2016). Where possible, non-plastic equipment was
used instead of plastic to reduce the possibility of sample contamination (MSFD,
2013; Nel and Froneman, 2015; Lusher et al., 2017). To reduce cross-contamination
of samples with synthetic fibres from clothes, personnel wore clean laboratory coats
at all times (MFSD, 2013; Catarino et al., 2016; Frère et al., 2017). Five blank
samples for both surface water and sediment samples were included to quantify for
any microplastic contamination during laboratory processing and analyses.

Chapter 5
61
5.3.2. Microplastic analyses
Filtered samples were viewed up to 40 X magnification using a Nikon© AZ100
stereomicroscope. Microplastics were distinguished from non-plastics by following
guidelines outlined in Table 3.3 (Chapter 3). Once a particle had been identified as
plastic, the maximum size dimension of each particle was recorded in µm (Lusher et
al., 2017), as well as microplastic type, colour, and state of degradation (Coyle et al.,
2016). Microplastic abundances (microplastics.m-2) were calculated for surface water
as follows:
Microplastic abundances (microplastics.m-2) were calculated for sediment as follows:
5.3.3. Statistical analysis
Statistical significance was set at α = 0.05. Absolute p values were reported for all
values > 0.001. Where p values were less than 0.001, the significance was reported
as p < 0.001. Univariate statistics were conducted using IBM SPSS Statistics®
(version 23 for Microsoft® Windows® 10). Mean surface water microplastic
abundance (microplastics.m-2) was compared between the three estuaries using a
one-way analysis of variance (ANOVA) after data was log10(x)-transformed to meet
assumptions of normally distributed residuals (Shapiro-Wilk statistic = 0.91, p > 0.05),
and homogeneity of variances (Levene‘s Test statistic = 0.78, p > 0.05). A Tukey
HSD post hoc test was used to determine statistically significant differences in
surface water microplastic abundance (microplastics.m-2) among the three estuaries.
Mean sediment microplastic abundance (microplastics.m-2) was compared between
the three estuaries using a one-way ANOVA after log10(x) data transformation to
meet ANOVA assumptions (Shapiro-Wilk statistic = 0.94, p > 0.05; Levene‘s Test

Chapter 5
62
statistic = 0.06, p > 0.05). A post hoc Tukey HSD test was used to determine
statistically significant differences in sediment microplastic abundance
(microplastics.m-2) among the three estuaries.
Multivariate statistics were conducted using Plymouth Routines in Multivariate
Ecological Research (PRIMER) version 6 and permutational multivariate analysis of
variance (PERMANOVA) package to determine significant differences in microplastic
type composition (%) in estuarine surface waters of each estuary and estuarine
sediment of each estuary. Data was square root transformed to weight the
contributions of common and ‗rare‘ microplastic types. A Bray Curtis matrix of
similarity was constructed with the square root transformed data. A nested
PERMANOVA and post hoc PERMANOVA pairwise comparisons were conducted on
the Bray Curtis matrix of square root transformed data to determine if microplastic
types in estuarine waters were significantly different among the three estuaries and if
microplastic type in sediment were significantly different among the three estuaries. A
similarity percentage analysis (SIMPER) was used to determine percentage
similarities and dissimilarities between microplastic types in the different estuaries.
The multivariate analysis was repeated for microplastic size distributions in estuarine
surface water and sediment among the three estuaries. Microplastic size class
ranges were selected from 20 µm (smallest detectable particle), 300 µm (mesh size),
1000 µm upper size limit for small microplastics (MSFD, 2013), and 5000 µm upper
size limit for microplastics (MSFD, 2013). The range values in between these values
(150 µm, 2500 µm) were chosen to assist detection of patterns in microplastic size
classes within these larger categories.
5.4. Results
5.4.1. Estuarine surface water and sediment microplastic abundance
No microplastics were found in blank samples. Microplastics were recorded in all
estuarine surface water samples and estuarine sediment samples. A total of 2209
microplastics were found in surface water samples and sediment samples combined
between the three estuary mouths. Overall, most microplastics were found in
sediment samples (53.60 %) among estuary study sites, with surface water samples

Chapter 5
63
accounting for relatively less (46.40 %) of the total microplastic abundance. Most
microplastics were found in the combined surface water and sediment samples from
Bilanhlolo Estuary (52.00 %), with relatively fewer from Kongweni Estuary (22.10 %)
and Mhlangeni Estuary (25.90 %).
There was a significant difference in log10(x)-transformed mean surface water
microplastic abundance (microplastics.m-2) (One-way ANOVA: F(2,12) = 109.62, p <
0.001), and sediment samples (One-way ANOVA: F(2,27) = 357.40, p < 0.001). Mean
surface water microplastic abundance (microplastics.m-2) was significantly different
among Mhlangeni Estuary (4.50 ± 0.59 microplastics.m-2), Kongweni Estuary (2.34 ±
0.23 microplastics.m-2), and Bilanhlolo Estuary (5.98 ± 0.46 microplastics.m-2) (Tukey
HSD post hoc comparison test: p < 0.001 for all interactions) (Figure 5.1a). Mean
sediment microplastic abundance (microplastics.m-2) was significantly different
among Mhlangeni Estuary (1.33 x 10⁴ ± 1.52 x 10³ microplastics.m-2), Kongweni
Estuary (1.89 x 10⁴ ± 2.31 x 10³ microplastics.m-2), and Bilanhlolo Estuary (4.22 x 10⁴
± 2.17 x 10³ microplastics.m-2) (Tukey HSD post hoc comparison test: p < 0.001 for
all interactions) (Figure 5.1b). Microplastics (microplastics.m-2) were most abundant
in both surface water and sediment of Bilanhlolo Estuary as compared to Mhlangeni
Estuary and Kongweni Estuary (Figure 5.1). Although Kongweni Estuary showed the
lowest microplastic abundance in surface water samples, this pattern was not
reflected within the sediment samples.

Chapter 5
64
Figure 5.1: Mean microplastic abundance (microplastics.m-2) in estuarine
surface water (n = 5) (a) and sediment (n = 10) (b) of Mhlangeni Estuary,
Kongweni Estuary, and Bilanhlolo Estuary. Lowercase letters indicate Tukey
HSD post hoc significant differences among estuaries. Error bars indicate ± 1
standard deviation (SD).
5.4.2. Estuarine microplastic type composition
There was no significant difference in overall square-root transformed microplastic
type composition (%) across all estuaries (surface water and sediment combined)
(PERMANOVA: Pseudo-F(2, 39) = 1.86, p = 0.383) (Figure 5.2). Microplastic fibres
were the most abundant microplastic type (60. 07 %) in all estuaries with surface
water and sediment combined (Mhlangeni Estuary: 60.40 %, Kongweni Estuary:
63.70 %, Bilanhlolo Estuary: 57.90 %) (Figure 5.2). Fragments were the second
most abundant microplastic type (22.95 %) in combined surface water and sediment
samples in all estuaries (Mhlangeni Estuary: 23.40 %, Kongweni Estuary: 22.20 %,
Bilanhlolo Estuary: 23.10 %) (Figure 5.2). Figure 5.3 shows micrographs of selected
microplastics found within samples.
a
b
c
0
1
2
3
4
5
6
7
MhlangeniEstuary
KongweniEstuary
BilanhloloEstuary
Es
tua
rin
e s
urf
ac
e w
ate
r m
icro
pla
sti
c
ab
un
da
nc
e (
mic
rop
las
tic
s.m
-2)
Site
(a)
a b
c
0
5000
10000
15000
20000
25000
30000
35000
40000
45000
50000
MhlangeniEstuary
KongweniEstuary
BilanhloloEstuary
Es
tua
rin
e s
ed
ime
nt
mic
rop
las
tic
a
bu
nd
an
ce
(m
icro
pla
sti
cs
.m-2
)
Site
(b)

Chapter 5
65
Figure 5.2: Overall microplastic type composition (%) (combined surface water
and sediment) between Mhlangeni Estuary, Kongweni Estuary, and Bilanhlolo
Estuary. Lowercase letters indicate PERMANOVA pairwise comparison
significant differences in microplastic composition (%) among sites.
a
a
a
0%
10%
20%
30%
40%
50%
60%
70%
80%
90%
100%
Mhlangeni Estuary Kongweni Estuary Bilanhlolo Estuary
Ove
rall
mic
rop
lasti
c t
yp
e c
om
po
sit
ion
(%
)
Site
Twine
Microbead
Fragment
Foam
Film
Fibre

Chapter 5
66
Figure 5.3: Micrographs of microplastic types found in samples, an example of
a microplastic fragment (a), microplastic bead (b), microplastic pellet (c), white
microbead, (d), microplastic film (e), microplastic fibre (f).
(a) (b)
(c) (d)
(e) (f)

Chapter 5
67
There was a significant difference between square-root transformed microplastic type
composition (%) between surface water and sediment samples across all estuaries
(PERMANOVA: Pseudo-F= 34.18, df = 1, p < 0.001) (PERMANOVA pairwise
comparison: Bilanhlolo Estuary: t = 4.28, p = 0.002; Kongweni Estuary: t = 3.15, p <
0.001; Mhlangeni Estuary: t = 4.38, p = 0.002). Square-root microplastic type
composition (%) was significantly different between surface water samples of each
estuary (PERMANOVA: Pseudo-F = 6.53, df = 2, p < 0.001). Square-root
microplastic type composition (%) in surface water was significantly different between
Bilanhlolo Estuary and Kongweni Estuary (PERMANOVA pairwise comparison: t =
3.62, p = 0.006), and between Kongweni Estuary and Mhlangeni Estuary
(PERMANOVA pairwise comparison: t = 2.30, p = 0.007) (Figure 5.4a and 5.4b).
There was no significant difference in surface water microplastic type composition
between Bilanhlolo Estuary and Mhlangeni Estuary (PERMANOVA pairwise
comparison: t = 1.48, p = 0.101) (Figure 5.4a and 5.4b). SIMPER similarity
percentage analysis indicated an average dissimilarity in surface water microplastic
type composition of 27.50 % between Bilanhlolo Estuary and Kongweni Estuary. The
majority of the dissimilarity was largely due to fibres (31.64 %), fragments (25.52 %),
and microbeads (15.44 %). SIMPER analysis determined the average dissimilarity in
surface water microplastic type composition between Kongweni Estuary and
Mhlangeni Estuary (25.36 %) was largely attributed to fibres (30.96 %), microbeads
(22.82 %), and foam (16.77 %). Fibres were the most dominant microplastic type
within surface water samples in all estuaries (46.10 %), contributing 51.54 % to the
total microplastic composition in Mhlangeni Estuary, 40.10 % in Kongweni Estuary
and 44.60 % in Bilanhlolo Estuary (Figure 5.4a). Fragments were the second
dominant microplastic type within surface water samples (36.50 %), contributing
30.30 % to the total microplastic composition in Mhlangeni Estuary, 42.20 % in
Kongweni Estuary and 38.90 % in Bilanhlolo Estuary. (Figure 5.4a).
There was a significant difference in microplastic type composition (%) in sediment
between all estuaries (PERMANOVA: Pseudo-F = 14.10, df = 2, p < 0.001). Square-
root transformed microplastic composition (%) was significantly different in sediment
samples between Bilanhlolo Estuary and Kongweni Estuary (PERMANOVA pairwise
comparison: t = 3.77, p = 0.001), between Bilanhlolo Estuary and Mhlangeni Estuary
(PERMANOVA pairwise comparison: t = 5.34, p = 0.001), and between Kongweni
Chapter 5
68
Estuary and Mhlangeni Estuary (PERMANOVA pairwise comparison: t = 1.87, p =
0.022) (Figure 5.4c and 5.4d). SIMPER analysis showed an average dissimilarity of
microplastic type composition in sediment of 29.11 % between Bilanhlolo Estuary
and Kongweni Estuary, mostly as a result of dissimilarities in film (31.95 %), fibres
(28.55 %), and fragments (19.15 %). There was an average of 37.75 % dissimilarity
in microplastic composition in sediment between Bilanhlolo Estuary and Kongweni
Estuary, the microplastics types that contributed the most to the dissimilarity were
fibres (33.46 %), film (29.27 %), and fragments (19.60 %). There was an average
dissimilarity in microplastic type composition in sediment of 23.4 % between
Kongweni Estuary and Mhlangeni Estuary. This dissimilarity was largely explained by
the dissimilarities of fragments (25.61 %), film (24.32 %), and fibres (20.99 %). In a
similar pattern to surface water samples, fibres were the most dominant microplastic
type in sediment across estuaries (72.10 %), contributing 67.40 %, 78.30 %, and
78.40 % to the total microplastic composition in Bilanhlolo Estuary, Kongweni Estuary
and Mhlangeni Estuary respectively (Figure 5.4c and Figure 5.4d). Microplastic film
was the second most dominant microplastic type within sediment samples (13.90 %),
contributing 18.30 %, 8.30 % and 8.00 % to microplastic composition in Bilanhlolo
Estuary, Kongweni Estuary, and Mhlangeni Estuary respectively (Figure 5.4c and
5.4d).

Chapter 5
69
Figure 5.4: Relative proportion of microplastic type composition (%) found
within estuarine surface water (a) and estuarine sediment (c) of Mhlangeni
Estuary, Kongweni Estuary and Bilanhlolo Estuary. Lower case letters indicate
significant differences in microplastic type composition (%) (PERMANOVA
pairwise comparison). Non-metric Multidimensional scaling plots are displayed
for estuarine surface water (b) and sediment (d). Cluster analysis is set at 75 %
similarity.
a
b
a
0%
10%
20%
30%
40%
50%
60%
70%
80%
90%
100%
Su
rface w
ate
r m
icro
pla
sti
c
co
mp
os
itio
n (
%)
Site
(a)
Twine
Microbead
Fragment
Foam
Film
Fibre
a
b
c
0%
10%
20%
30%
40%
50%
60%
70%
80%
90%
100%
Sed
imen
t m
icro
pla
sti
c
co
mp
os
itio
n (
%)
Site
(c)
Twine
Microbead
Fragment
Foam
Film
Fibre
(b)
(d)

Chapter 5
70
5.4.3. Estuarine microplastic size class distribution
There was no significant difference in microplastic size class (µm) distribution (%)
among estuaries (surface water and sediment combined) (PERMANOVA: Pseudo-F
= 0.64, df = 2, p = 0.705). Microplastics in the size class 300 – 999 µm were the most
dominant in combined surface water and sediment data across all estuaries (51.40
%), contributing 53.30 % in Bilanhlolo Estuary, 53.00 % in Kongweni Estuary, and
46.20 % in Mhlangeni Estuary to the total microplastic size class distribution within
each estuary (Figure 5.5). Slightly larger microplastics (1000 - 2499 µm) were the
second most dominant microplastic size class (22.00 %), contributing 20.40 %, 23.80
%, and 23.60 % to the total microplastic size distribution in Bilanhlolo Estuary,
Kongweni Estuary, and Mhlangeni Estuary respectively (Figure 5.5).
Figure 5.5: Microplastic size (µm) class distribution (%) in combined surface
water and sediment data among Mhlangeni Estuary, Kongweni Estuary, and
Bilanhlolo Estuary. Lowercase letters indicate significant difference between
microplastic size class (µm) distribution (%) between estuaries (PERMANOVA
pairwise comparison).
a
a
a
0% 20% 40% 60% 80% 100%
Bilanhlolo Estuary
Kongweni Estuary
Mhlangeni Estuary
Overall microplastic type composition (%)
Sit
e
20 - 149 µm
150 - 299 µm
300 - 999 µm
1000 - 2499 µm
2500 - 4999 µm

Chapter 5
71
There was a significant difference in square-root transformed microplastic size class
(µm) distribution (%) between surface water and sediment across all estuaries
(PERMANOVA: Pseudo-F = 18.57, df = 1, p < 0.001) (PERMANOVA pairwise
comparison: Bilanhlolo Estuary: t = 6.59, p < 0.001; Kongweni Estuary: t = 4.39, p <
0.001, Mhlangeni Estuary: t = 5.38, p < 0.001). Microplastic size class (µm)
distribution (%) was significantly different in estuarine surface waters among the
three estuaries (PERMANOVA: Pseudo-F = 30.81, df = 2, p < 0.001). Although the
nMDS plot did not reflect a similar pattern (Figure 5.6b), there was a significant
difference in microplastic size class (µm) distribution (%) between Bilanhlolo Estuary
and Kongweni Estuary (PERMANOVA pairwise comparison: t = 7.95, p = 0.012),
between Bilanhlolo Estuary and Mhlangeni Estuary (PERMANOVA pairwise
comparison: t = 3.115, p = 0.009), and between Kongweni Estuary and Mhlangeni
Estuary (PERMANOVA pairwise comparison: t = 4.28, p = 0.005) (Figure 5.6a).
Surface waters in estuaries were dominated by microplastics in the size range 300 –
999 µm (42.30 %), contributing 39.30 %, 54.00 %, and 40.30 % to the surface water
microplastic size distribution in Mhlangeni Estuary, Kongweni Estuary, and Bilanhlolo
Estuary respectively (Figure 5.5a). SIMPER similarity percentage analysis showed
that the majority of the average 27.48 % dissimilarity in the microplastic size class
(µm) distribution (%) of surface water between Bilanhlolo Estuary and Kongweni
Estuary was largely due to the 300 – 999 µm size class (35.25 %). Between
Bilanhlolo Estuary and Mhlangeni Estuary surface water, the average dissimilarity
(10.48 %) in microplastic size class (µm) distribution (%) was attributed to the large
dissimilarity of the size class 2500 – 4999 µm (44.25 %). Between Kongweni Estuary
and Mhlangeni Estuary, the average dissimilarity in microplastic size class (µm)
distribution (%) in surface water (18.18 %) was mostly due to the dissimilarity in the
size class 300 – 999 µm (45.23 %).
Microplastic size class (µm) distribution (%) was significantly different in estuarine
sediment among the three estuaries (PERMANOVA: Pseudo-F = 20.39, df = 2, p <
0.001). There was a significant difference in microplastic size class (µm) distribution
(%) between Bilanhlolo Estuary and Kongweni Estuary (PERMANOVA pairwise
comparison: t = 5.37, p < 0.001), between Bilanhlolo Estuary and Mhlangeni Estuary
(PERMANOVA pairwise comparison: t = 5.61, p < 0.001), and between Kongweni

Chapter 5
72
Estuary and Mhlangeni Estuary (PERMANOVA pairwise comparison: t = 2.22, p =
0.004) (Figure 5.6c and Figure 5.6d). SIMPER similarity percentage analysis
determined that the majority of the dissimilarity in sediment microplastic size class
distribution (%) between Bilanhlolo Estuary and Kongweni Estuary (average
dissimilarity = 25.36 %) was largely attributed to the dissimilarity in the 300 – 999 µm
size class (39.64 %). The average dissimilarity in sediment size class distribution (%)
between Bilanhlolo Estuary and Mhlangeni Estuary (33.96 %) was largely due to the
dissimilarity of the 300 – 999 µm size class (37.31 %). The 19.84 % average
dissimilarity between Kongweni Estuary and Mhlangeni Estuary was mostly due to
the dissimilarity in the 1000 – 2499 µm size class (26.15 %). Microplastics in the size
class 300 – 999 µm were the most abundant in sediment across all estuaries (59.20
%), contributing 63.20 %, 52.30 %, and 56.30 % to the total microplastic size class
distribution in Bilanhlolo Estuary, Kongweni Estuary, and Mhlangeni Estuary
respectively (Figure 5.6c).

Chapter 5
73
Figure 5.6: Microplastic particle size (µm) class distribution (%) in estuarine
surface water (a) and sediment (c) within Mhlangeni Estuary, Kongweni Estuary
and Bilanhlolo Estuary. No size class < 300 µm for surface water due to
sampling equipment mesh size. Lower case letters indicate significant
differences in microplastic size class (µm) distribution (%) (PERMANOVA
pairwise comparison). Non-metric Multidimensional scaling plots are displayed
for estuarine surface water (b) and sediment (d) within Bilanhlolo Estuary (BL),
Kongweni Estuary (KO), and Mhlangeni Estuary (MH). Cluster analysis is set at
75 % similarity.
c
b
a
0% 50% 100%
BilanhloloEstuary
KongweniEstuary
MhlangeniEstuary
Surface water microplastic size class distribution (%)
Sit
e
(a)
20 - 149 µm
150 - 299 µm
300 - 999 µm
1000 - 2499 µm
2500 - 4999 µm
c
b
a
0% 50% 100%
BilanhloloEstuary
KongweniEstuary
MhlangeniEstuary
Sediment microplastic size class distribution (%)
Sit
e
(b)
20 - 149 µm
150 - 299 µm
300 - 999 µm
1000 - 2499 µm
2500 - 4999 µm
(b)
(d)

Chapter 5
74
5.5. Discussion
Microplastic abundances (microplastics.m-2) were significantly different in both
surface water (Figure 5.1a) and sediment (Figure 5.1b) between Mhlangeni Estuary,
Kongweni Estuary, and Bilanhlolo Estuary. The Present Ecological State (PES)
category for each estuary as described by DWA (2013) was not a good indicator for
the microplastic pollution status of the estuaries in this investigation. It was expected
that Kongweni Estuary (PES category D) would contain more microplastics as it has
a higher degree of anthropogenic disturbances than Bilanhlolo Estuary (PES
category C) and Mhlangeni Estuary (PES category C). Bilanhlolo Estuary had the
highest microplastic abundance in both surface water (5.98 ± 0.46 microplastics.m-2)
and sediment (4.22 x 10⁴ ± 2.17 x 10³ microplastics.m-2) (Figure 5.1) out of all the
estuaries. Kongweni Estuary, although showing the lowest microplastic abundance in
surface water (2.34 ± 0.23 microplastics.m-2) in comparison to the other estuaries
(Figure 5.1a), displayed the second highest microplastic abundance in sediment
(1.89 x 10⁴ ± 2.31 x 10³ microplastics.m-2) (Figure 5.1b).
The differences in microplastic abundance between surface water and sediment
within each estuary may be as a result of microplastics accumulating in sediment
(Santana et al., 2016), although the differences may be attributed to the sampling
gear used for surface water, as any microplastics smaller than 300 µm would not be
sampled (MSFD, 2013). Rainfall has been cited as a major influence on microplastic
abundances in estuaries (Zhao et al., 2015). Since all samples were collected during
the same period in a rainy season, the differences in results could not be attributed to
differences in rainfall. The period of time each estuary mouth was open for prior to
sampling may be a factor influencing microplastic abundances within each estuary.
During periods of mouth closure, plastics may accumulate in the estuary, and are
washed out of the estuary once the mouth opens. During this study, the period that
each mouth was open was not taken in to account, therefore the results reported
should be used only as what microplastic pollution was within each estuary at the
time of sampling.
The catchment size of the river leading in to the estuary may also influence the
quantity of microplastics in the estuary (Zhao et al., 2015). The greater the catchment

Chapter 5
75
size, the greater the quantity of water and potential microplastic pollution flowing
through the estuary. The results presented (Figure 5.1) showed that catchment size
did not seem to have an effect on the quantity of microplastic pollution in each
estuary. Bilanhlolo Estuary and its associated river has a relatively smaller catchment
size (19.8 km2) (DWA, 2013) as compared to the other studied estuaries and the
associated rivers (Mhlangeni Estuary: 37.2 km2, Kongweni Estuary: 7.9 km2) (DWA,
2013), but displayed the greatest microplastic abundance. This information seems to
highlight that the actual sources of microplastic pollution within each river and
estuarine system have a greater effect on the microplastic abundance than the river
catchment size. The differences in microplastic abundance may be as a result of the
different inputs of microplastic pollution into each estuary (Naidoo et al., 2015).
Microplastics may be introduced into each estuary by fragmenting plastics from
within each estuarine system (Gallagher et al., 2016), oceans during an open mouth
phase (Vermeiren et al., 2016), in addition to domestic and commercial activities
surrounding each estuary (Lima et al., 2015).
Treated sewage has been cited as a significant source of microplastic pollution in
river and estuarine environments (Lebreton et al., 2017). However, the results of this
study contradict that statement as Kongweni Estuary, which receives treated sewage
discharge (DWA, 2013) displayed lower microplastic abundance than Bilanhlolo
Estuary, which does not receive treated sewage discharge (DWA, 2013). This
contradiction was also shown by Nel et al. (2018), where microplastic abundances
were found to be similar up and downstream of a wastewater treatment plant in the
Bloukrans River near the town of Grahamstown in Eastern Cape province, South
Africa, in both summer and winter seasons.
Bilanhlolo River and associated estuary receives unintentional overflow from the
nearby Oatlands domestic landfill site leachate dam during periods of high rainfall
and consequential leachate dam overspill. Landfill sites, often regarded as sinks for
plastic waste, have recently been confirmed as sources of microplastics to the
environment (Mahon et al., 2017). Due to the physio-chemical degradation processes
occurring in landfills, plastic products are fragmented and transported out of the
landfill via leachate production. Landfill leachate is the product of rainfall percolating
through decomposing landfill waste and is collected in dams on the landfill site before

Chapter 5
76
treatment and disposal, often directly in to rivers or sewage (Kilponen, 2016). In
periods of heavy rainfall, leachate dams sometimes overflow in to nearby freshwater
systems. In Ireland, Mahon et al. (2017) described microplastic content in raw landfill
leachate of up to 49600 ± 18385 particles.m-3, with an insignificant decrease after
reverse osmosis treatment (45000 ± 4242 particles.m-3). Although the present study
does not attempt to identify landfill leachate dams as a source of microplastic
pollution, these results highlight the potentially large input of microplastic pollution
from landfill leachate to freshwater systems and should be a focus of future research.
Increased microplastic pollution abundance in estuaries is cause for concern as it
allows for greater interaction frequency with lower trophic level organisms that live in
the estuaries (Zhao et al., 2015). The increased ingestion of microplastics by these
organisms may decrease the survival and reproductive fitness of important lower
trophic level animals, potentially causing the ecosystem dynamics of organisms to
change (Lima et al., 2015). The increased microplastic consumption may increase
the transfer of harmful toxicants throughout estuarine food webs (Chua et al., 2014).
In addition, estuaries are a major source of microplastics to the marine environment
(Bakir et al., 2014), so the quantification of microplastic abundances within estuaries
allows for a greater understanding of microplastics inputs in to the marine
environment.
Although a wide range of microplastic types were found in estuarine surface water
and sediment samples (Figure 5.2 and Figure 5.3), microplastic fibres were the most
dominant plastic type within the surface water and sediment in all studied estuaries
(Figure 5.2). Microplastic fibres were significantly more abundant in sediment (72.10
%) than in surface water (51.54 %), however this result may be due to the different
sampling methods used. The results of this investigation are similar to Zhao et al.
(2014), who found that microplastic fibres were the most dominant microplastic type
(79.1%) in the surface water of the Yangtze Estuary system, China. Microplastic
fibres were also the most dominant plastic type (> 90 %) in Jiaojiang, Ouijiang, and
Minjiang Estuaries in China (Zhao et al., 2015). Microplastic type is important to
quantify as it may provide insight of microplastic pollution origins within freshwater
systems (Rodríguez-Seijo and Pereira, 2017). Zhao et al. (2014) suggested that
microplastic fibres are an indication that most microplastic pollution in a particular

Chapter 5
77
area is derived from land-based debris, as microplastic fibres are the result of
synthetic polymer clothing being washed in washing machines and the resulting
wastewater transported into natural water courses (Browne et al., 2011). In addition,
microplastic type is important to quantify as negative impacts on organisms that
ingest microplastics have been shown to be associated with microplastic particle
shapes (Wright et al., 2013). Microplastic fibres have a higher surface area to volume
ratio than other microplastic shapes, potentially allowing for increased toxicant
accumulation on the surface of the microplastic, increasing the possibility of
increased toxicant transfer to animals which ingest the microplastic fibres (Chua et
al., 2014).
The results of this investigation show that there was no overall difference in
microplastic size class (µm) distribution (%) between studied estuaries (Figure 5.5),
therefore the hypothesis stating that there will be a difference in microplastic size
class distribution between the studied estuaries was rejected. However, there was a
significant difference in the microplastic size classes (µm) between surface water and
sediment among estuaries (Figure 5.6). This may be as a result of the sampling gear
used, as no microplastic particles smaller than 300 µm were sampled in the surface
water samples due to the net mesh size. Smaller microplastics were more abundant
in all samples as opposed to larger microplastics (Figure 5.5). These results are
similar to previous studies, indicating that smaller microplastics in estuarine surface
water and sediment are more abundant than larger microplastics (Naidoo et al.,
2015; Zhao et al., 2015).
Smaller microplastics may be more frequently encountered and consumed by benthic
and pelagic estuarine organisms (Zhao et al., 2014), especially lower trophic level
organisms. Foekema et al. (2013) found that smaller microplastics are more
frequently found in filter feeders as opposed to larger carnivorous taxa. Filter feeders
in estuarine environments have been shown to ingest microplastics the same size
and shape as their natural prey (Wright et al., 2013). The large quantities of smaller
microplastics in estuarine systems may lead to more frequent ingestion by lower
trophic level organisms, such as filter-feeders, and in turn, potentially increase the
bioaccumulation of microplastics and the associated toxicants throughout the food
web (Ivar do Sul and Costa, 2014).

Chapter 5
78
5.6. Conclusion
The results of Chapter 5 show that microplastic pollution was present in both surface
water and estuarine sediment of three studied estuaries during the sampling period.
The differences in microplastic abundances among estuaries may be due to different
inputs of microplastic pollution into each estuarine system; however the source of
microplastic pollution in each estuary may only be speculated. Microplastic fibres
dominated throughout all samples, indicating that domestic sources of microplastics
(i.e. washing machines) and fisheries may largely contribute to the microplastic
pollution within estuaries. The differences between surface water and sediment
microplastic abundances may be due to differences in sampling technique, which
demonstrates the importance to sample both sediment and surface water in estuaries
when investigating microplastic pollution levels. The microplastic pollution within each
estuary highlights the potential contribution of estuaries as conduits of microplastic
pollution transfer from land-based sources to the marine environment. The most
anthropogenically disturbed estuary (PES) (Kongweni Estuary) had lower levels of
microplastic pollution than the more ‗pristine‘ Bilanhlolo Estuary and Mhlangeni
Estuary. This information shows that the PES category (DWA, 2013) may not be a
good predictor of microplastic pollution levels in the studied estuaries. Future
research should include the seasonal sampling of TOCEs. As TOCEs are only
intermittently open to the marine environment, the effluents derived from these
estuaries are only transported into the marine environment in seasonal periods of
increased rainfall (wet season). Seasonal sampling can allow for identification of
potential spatial and temporal patterns of microplastic pollution from estuaries, which
eventually may be used to identify major point sources of microplastic pollution into
individual estuaries.

Chapter 6
79
CHAPTER 6: TEMPORARILY OPEN/CLOSED ESTUARIES
AS SOURCES OF MICROPLASTIC POLLUTION TO
KWAZULU-NATAL COASTAL ENVIRONMENTS
6.1. Abstract
Microplastic (< 5 mm in maximum dimension) pollution monitoring has only recently
become the focus of a large body of research, and as such, there is limited data
regarding microplastic pollution in South African coastal environments. Estuaries
have been described as important sources of microplastic pollution to marine
environments, however there is still a lack of knowledge regarding this phenomenon
in a South African context. The aim of this study was to determine and compare
spatial differences in beach sediment microplastic pollution originating from selected
KwaZulu-Natal temporarily open/closed estuaries (Mhlangeni Estuary, Kongweni
Estuary, and Bilanhlolo Estuary) during an open mouth phase at distances 500 m,
1000 m, and 2000 m North and South on the coastline adjacent to each estuary
mouth. Sediments from sites near the Mhlangeni Estuary displayed lower mean
levels of microplastic pollution (8.76 x 10³ ± 2.39 x 10³ microplastics.m-2) than sites
near Kongweni Estuary (1.21 x 10⁴ ± 3.02 x 10³ microplastics.m-2). Sediment from
sites near Bilanhlolo Estuary displayed the highest microplastic pollution levels (2.03
x 104 ± 6.44 x 10³ microplastics.m-2). Beach sediment displayed higher abundances
of microplastics (microplastics.m-2) at sites nearer to each estuary mouth than sites
further away. Microplastics in beach sediment were found to largely consist of
microplastic fibres (79.90 %), indicating that land-based microplastic pollution is a
significant source of marine microplastic pollution. The results of this study are the
first to investigate microplastic pollution in beach sediment in these areas of South
Africa and add new knowledge of microplastic pollution levels in South Africa.
Keywords: microplastics, beach sediment, temporarily open/closed estuaries,
KwaZulu-Natal, South Africa, baseline survey

Chapter 6
80
6.2. Introduction
The majority of studies on plastic pollution in the marine environment have focused
largely on macro-plastics and their negative effects on marine organisms (Setälä et
al., 2014). However, in comparison to macroplastics, there has been far less
research on microplastics (Barnes et al., 2009; Andrady, 2011). Microplastics
particles are those which are < 5 mm in maximum size dimension and have
commonly been described as major marine pollutants (Watts et al., 2014). They are
classified as being either primary or secondary microplastics (Cole et al., 2011).
Primary microplastics are those which are manufactured to be smaller than 5 mm,
commonly for domestic uses such as exfoliating face washes, and for industrial uses
such as ‗sand-blasting‘ (Teuten et al., 2007; Ivar do Sul and Costa, 2014). Secondary
microplastics are those which are derived from the degradation and/or fragmentation
of larger plastic items (Ivar do Sul and Costa, 2014).
Microplastics are considered to be ubiquitous throughout the marine environment
(Andrady, 2011), with reports of microplastic pollution found in sediment, in the water
column, as well as within organisms throughout the globe (Browne et al., 2011).
Techniques of microplastic pollution monitoring have often involved the sampling and
analysis of microplastics deposited in benthic sediments which has been successfully
applied to beach, estuarine and sea-floor sediments (Solomon and Palanisami,
2016). Microplastic deposition on sandy beaches has previously been used to
extrapolate microplastic pollution levels in a particular coastal area (Nel and
Froneman, 2015). Microplastic abundances are commonly investigated in sandy
beaches due to the ease of accessibility (Van Cauwenberghe et al., 2015).
Microplastics from the ocean are primarily deposited in inter-tidal zones of beaches,
most commonly on strand or drift lines (Moreira et al., 2016). Patterns of microplastic
distributions in beach sediment are subject to numerous influencing factors and are
therefore considered highly dynamic (Besley et al., 2017). The evaluation of
microplastics found in the inter-tidal zone would therefore be appropriate to
determine the amount of microplastic input from the ocean (Moreira et al., 2016) and
not necessarily the amount of accumulated microplastics over time. When an estuary
mouth is open the water flowing from the estuary will mix with the ocean water, often
resulting in the pollution of the nearby coastal environments. For this reason, the

Chapter 6
81
analysis of sediment samples collected from the inter-tidal zone of sandy beaches
near estuary mouths may be useful to determine the input of microplastic pollution
from estuaries into the nearby coastal environments.
To expand the understanding of microplastic pollution in South African marine
environments a case study was performed at three beaches near temporarily
open/closed estuaries (TOCEs) in KwaZulu-Natal. The aim of this investigation was
to determine and compare spatial differences in beach sediment microplastic
pollution originating from selected KwaZulu-Natal temporarily open/closed estuaries
(Mhlangeni Estuary, Kongweni Estuary, and Bilanhlolo Estuary) during an open
mouth phase at distances of 500 m, 1000 m, and 2000 m North and South on the
coastline adjacent to each estuary mouth. Objectives were to compare 1)
microplastic abundances (microplastics.m-2) in beach sediment at stations 500 m,
1000 m, and 2000 m North/South on the coastline adjacent to each estuary mouth
during an open mouth phase, 2) microplastic type composition (%) in beach sediment
at stations 500 m, 1000 m, and 2000 m North/South on the coastline adjacent to
each estuary mouth during an open mouth phase, and 3) microplastic size class (µm)
distribution (%) in beach sediment at stations 500 m, 1000 m, and 2000 m North/
South on the coastline adjacent to each estuary mouth during an open mouth phase.
It was hypothesized that there will be a difference in microplastic abundances
(microplastics.m-2), microplastic type composition (%), and microplastic size class
(µm) distribution (%) in beach sediment at stations 500 m, 1000 m, and 2000 m
North/ South on the coastline adjacent to each estuary mouth during the open mouth
phase.
6.3. Methods and Materials
6.3.1. Data collection
All data collection took place during a three day period in January 2017 at low tide.
Sediment samples for microplastic analysis were collected at six beach stations (500
m, 1000 m, and 2000 m North and South) adjacent to each estuary mouth (Chapter
1: Figure 1.1) (Geographic coordinates: Appendix A: Table A 2). At each station,
five replicate sediment cores of the top five cm of sediment were taken at the hightide

Chapter 6
82
mark at a minimum distance of one metre apart using a plastic corer (45 mm internal
⌀). If multiple drift lines were present, the samples were collected from the highest
observable drift line (Naidoo et al., 2015). Each core sample was sieved through a
five mm stainless steel mesh on site and thereafter transferred in to individual ziplock
bags. Personnel collected samples downwind of each site to minimize airborne
microplastic contamination of samples from clothing (MSFD, 2013). Sediment
samples were transported and stored in a freezer at -20 °C until laboratory
processing.
Prior to sample analysis, sediment samples were removed from the freezer and
allowed to thoroughly thaw at room temperature (± 25 °C). Thereafter, sediment
samples were transferred to aluminium ‗boats‘ and covered with additional aluminium
foil and oven dried at 60 ºC for 48 hours until constant mass (Naidoo et al., 2015).
Density separation was used to separate microplastics from sediment. A fully
saturated sodium chloride (NaCl) solution was prepared by mixing 360 g of
commercially available table salt (First Value®) with one L of distilled water using a
magnetic stirrer. The NaCl solution was thereafter vacuum-filtered through
Whatman® borosilicate glass microfibre filters (47 mm ⌀, 0.7 µm pore size) (Sigma-
Aldrich©) to remove any potential microplastic contaminants. The supernatant was
collected and the process was repeated until the required quantity of NaCl solution
was obtained. Once sediment samples were dried to constant mass, each sample
was mixed in a glass beaker with 200 mL of the saturated NaCl solution with a glass
rod for approximately two minutes. The mixture was allowed to stand for one hour
before the supernatant was filtered through a 5.0 µm polycarbonate track-etched
ISOPORE™ membrane filter (47 mm ⌀) (Merck Millipore Ltd.). The sediment sample
was replenished with a further 200 mL of filtered NaCl solution and the extraction
procedure was repeated three times per sediment sample. Filters were placed in to
new, clean petri dishes, covered loosely with aluminium foil, and oven dried at 60 ºC
for 24 hours. Blank samples (with no sediment) were included to account for any
airborne microplastic contamination during sample processing.

Chapter 6
83
6.3.2. Microplastic analysis
Filtered samples were viewed up to 40 X magnification using a Nikon© AZ100
stereomicroscope. Microplastics were distinguished from non-plastic particles using
previously recommended procedures (Chapter 3: Table 3.3). Once a particle had
been identified as plastic, the maximum size dimension of each particle was
measured (µm), and microplastic type was recorded. Microplastic abundances
(microplastics.m-2) were calculated for each sediment sample as follows:
6.3.3. Statistical analyses
Statistical significance was set at α = 0.05. Absolute p values were reported for all
values > 0.001. Univariate statistics were conducted using IBM SPSS Statistics®
(version 23 for Microsoft® Windows® 10). A fully-nested ANOVA was used to
compare microplastic abundance (microplastics.m-2) among sediment sites near
each estuary, direction (North/South) of each estuary mouth, and distances (0 m, 500
m, 1000 m, and 2000 m) within directions after log10(x)-transformed data met
assumptions of normality of residuals (Shapiro Wilk test statistic = 0.99, p > 0.05),
and homogeneity of variances (Levenes test statistic = 1.17, p > 0.05). Post hoc
Tukey HSD comparisons were used to determine significant differences of
microplastic abundances (microplastics.m-2) among sites. Multivariate statistics were
conducted using Plymouth Routines in Multivariate Ecological Research (PRIMER)
version 6 and permutational multivariate analysis of variance (PERMANOVA)
package to determine significant differences in microplastic type composition (%) in
beach sediment stations among estuaries, directions and distances. A Bray Curtis
matrix of similarity was constructed from square-root transformed data. A nested
PERMANOVA and PERMANOVA pairwise comparisons were performed on the Bray
Curtis similarity matrix of square-root transformed data. A similarity percentage
analysis (SIMPER) was used to determine percentage similarities and dissimilarities
between microplastic types in the different estuaries. The multivariate statistical

Chapter 6
84
analysis was repeated for microplastic size class (µm) distribution (%) in beach
sediment samples.
6.4. Results
6.4.1. Beach sediment microplastic abundance
Microplastics were recorded in all beach sediments samples. A total of 3413
individual microplastics were recorded at beach sediment stations. A fully-nested
ANOVA showed a significant difference in log10(x)-transformed microplastic
abundance overall between estuary beach sites (Nested ANOVA: F(2, 72) = 390.53, p
< 0.001), between directions North and South of each estuary mouth (Nested
ANOVA: F(3 ,72) = 78.10, p < 0.001), and a significant difference in microplastic
abundance at increasing distances North and South away from each estuary mouth
(Nested ANOVA: F(12, 72) = 17.84, p < 0.001).
Log10(x)-transformed microplastic abundance (microplastics.m-2) was significantly
different between estuarine systems (Tukey HSD post hoc comparison: p < 0.001 for
all interactions) (Figure 6.1). Sediments from sites near the Mhlangeni Estuary
displayed lower mean levels of microplastic pollution (8.76 x 10³ ± 2.39 x 10³
microplastics.m-2) than sites near Kongweni Estuary (1.21 x 10⁴ ± 3.02 x 10³
microplastics.m-2). Sediment from sites near Bilanhlolo Estuary displayed the highest
microplastic pollution levels (2.03 x 10⁴ ± 6.44 x 10³ microplastics.m-2). Tukey HSD
post hoc comparisons also showed that microplastic abundance was significantly
different between North and South sites within all estuary systems (p < 0.05 for all
interactions). Tukey HSD post hoc comparisons showed that sites further away from
each estuary mouth had significantly less microplastic abundances than sites closer
to each estuary mouth (Figure 6.1). All sites displayed decreased microplastic
abundance with increase in distance away from each estuary mouth, except for site
2000 m North of the Mhlangeni Estuary mouth which was significantly similar to sites
closer to the estuary mouth (Figure 6.1).

Chapter 6
85
Figure 6.1: Mean microplastic abundance (microplastic.m-2) in beach sediments
at increasing distances (m) North (N) and South (S) away from each estuary
mouth (n= 5). Uppercase letters indicate significance differences between
estuarine systems. Lowercase letters indicate Tukey HSD post hoc
significance differences between sites within each estuary system. Error bars
represent ± 1 SD.
6.4.2. Beach sediment microplastic type composition
Square-root-transformed microplastic type composition (%) was significantly different
overall in each estuary (PERMANOVA: Pseudo-F = 37.00, df = 2, p < 0.001), within
North/South stations in each estuary (PERMANOVA: Pseudo-F = 12.78, df = 3, p <
0.001), and between distances nested in direction between all estuaries
(PERMANOVA: Pseudo-F = 3.27, df = 12, p < 0.001).
Square-root transformed microplastic type composition (%) was significantly different
between sediments combined between Bilanhlolo Estuary and Kongweni Estuary
(PERMANOVA pairwise comparison: t = 5.93, p < 0.001), Bilanhlolo Estuary and
Mhlangeni Estuary (PERMANOVA pairwise comparison: t = 8.49, p < 0.001), and
Kongweni Estuary and Mhlangeni Estuary (PERMANOVA pairwise comparison: t =
2.94, p < 0.001) (Figure 6.2). Fibres were the most abundant microplastic type
b
c
c
b
c
c
a
c
b
a
a
a
a
a
ab
a
b
c
0
5000
10000
15000
20000
25000
30000
35000
Mhlangeni Estuary Kongweni Estuary Bilanhlolo Estuary
Se
dim
en
t m
icro
pla
sti
c a
bu
nd
an
ce
(m
icro
pla
sti
cs
.m-2
)
Site
2000 m N
1000 m N
500 m N
500 m S
1000 m S
2000 m S
A B C

Chapter 6
86
between all beach sediment sites across estuaries (79.90 %), contributing 75.30 %,
88.10 %, and 79.20 % to the total microplastic type composition (%) in Bilanhlolo
Estuary, Kongweni Estuary, and Mhlangeni Estuary respectively (Figure 6.2). Beach
sediment sites near Bilanhlolo Estuary showed a higher proportion of microplastic
film (12.20 %) as compared to Kongweni Estuary (6.50 %), and Mhlangeni Estuary
(5.80 %) (Figure 6.2). Beach sediment sites near Mhlangeni Estuary had the highest
proportion of microbeads (3.50 %) relative to the total microplastic type composition
(%) in comparison to Kongweni Estuary (0.90 %), and Bilanhlolo Estuary (0.30 %)
(Figure 6.2). Similarity percentage analysis (SIMPER) showed that the average
dissimilarity (27.29 %) between Bilanhlolo Estuary and Kongweni Estuary was largely
due to dissimilarities in fragments (30.45 %), film (26.06 %), and fibres (25.09 %).
The average dissimilarity (36.53 %) between Bilanhlolo Estuary and Mhlangeni
Estuary was largely attributed to dissimilarities in fragments (29.32 %), fibres (27.41
%), and film (27.11 %). The average dissimilarity between Kongweni Estuary and
Mhlangeni Estuary (26.26 %) was as a result of the main dissimilarities between film
(28.77 %), fibres (27.42 %), and fragments (25.96 %).
Figure 6.2: Overall microplastic type composition (%) in beach sediment sites
near each estuary (Mhlangeni Estuary, Kongweni Estuary, and Bilanhlolo
Estuary). Lowercase letters indicate PERMANOVA pairwise comparison
significant differences.
a b c
0%
10%
20%
30%
40%
50%
60%
70%
80%
90%
100%
Mhlangeni Estuary Kongweni Estuary Bilanhlolo Estuary
Beach
sed
imen
t m
icro
pla
sti
c
co
mp
osit
ion
(%
)
Site
Chart Title
Twine
Microbead
Fragment
Foam
Film
Fibre

Chapter 6
87
Square-root transformed microplastic type composition (%) was significantly different
between North and South sites within each estuary (PERMANOVA pairwise
comparison: Bilanhlolo Estuary: t = 3.17, p < 0.001; Kongweni Estuary: t = 2.92, p =
0.002; Mhlangeni Estuary: t = 4.18, p < 0.001) (Figure 6.3). Square-root microplastic
type composition (%) was generally not significantly different between beach
sediment sites at increasing distances (500 m, 1000 m, and 2000 m) North and
South away from each estuary mouth (Figure 6.3), except for a few beach stations
(Figure 6.3). Beach sediment sites near Mhlangeni Estuary had similar proportions
of microplastics fibres (Figure 6.3a), except for the site 2000 m South of Mhlangeni
Estuary which had a larger proportion of fragments (30.80 %), and relatively smaller
proportion of fibres (50.00 %) than other sediment sites near the Mhlangeni Estuary
mouth (Figure 6.3a). Beach sediment sites near Kongweni Estuary mouth had
similar proportions of microplastic fibres (Figure 6.3b), but the site at 2000 m North
had a larger proportion of microplastic film (10.20 %) than other sediment sites near
Kongweni Estuary mouth, while the site 1000 m North had a larger proportion of
fragments (8.00 %) (Figure 6.3b). Beach sediments sites near Bilanhlolo Estuary
mouth also had a similar proportion of microplastic fibres throughout (Figure 6.3c).
The site 1000 m North of the Bilanhlolo Estuary mouth showed the largest proportion
of fragments (21.70 %) relative to other beach sites (Figure 6.3c)

Chapter 6
88
Figure 6.3: Microplastic type composition (%) in beach sediment from sites at
increasing distances (500 m, 1000 m, and 2000 m) North (N) and South (S) away
from each estuary mouth. Mhlangeni Estuary sites (a), Kongweni Estuary sites
(b) and Bilanhlolo Estuary sites (c). Uppercase letters indicate PERMANOVA
significant differences between sites North and South. Lowercase letters
indicate significant PERMANOVA pairwise comparison significant differences
between sites at increasing distance (500 m, 1000 m, 2000 m) away from each
estuary mouth.
a ab b b ab c
0%
20%
40%
60%
80%
100%
N 2000 m N 1000 m N 500 m S 500 m S 1000 m S 2000 m
Be
ac
h s
ed
ime
nt
mic
rop
las
tic
c
om
po
sit
ion
(%
)
Site
(a)
Twine
Microbead
Fragment
Foam
Film
Fibre
c b c a a a
0%
20%
40%
60%
80%
100%
N 2000 m N 1000 m N 500 m S 500 m S 1000 m S 2000 m
Bea
ch
se
dim
en
t m
icro
pla
sti
c
co
mp
os
itio
n (
%)
Site
(b)
Twine
Microbead
Fragment
Foam
Film
Fibre
a a a c b b
0%
20%
40%
60%
80%
100%
N 2000 m N 1000 m N 500 m S 500 m S 1000 m S 2000 m
Bea
ch
se
dim
en
t m
icro
pla
sti
c
co
mp
os
itio
n (
%)
Site
(c)
Twine
Microbead
Fragment
Foam
Film
Fibre
A B
A B
A B

Chapter 6
89
6.4.3. Beach sediment microplastic size class distribution
Square-root transformed microplastic size class (µm) distribution (%) was
significantly different among combined sediment sites near each estuary mouth
(PERMANOVA: Pseudo-F = 17.16, df = 2, p < 0.001), among sites North and South
of each estuary mouth (PERMANOVA: Pseudo-F = 6.66, df = 3, p < 0.001), and
among sites at increasing distances (500 m, 1000 m, and 2000 m) North and South
of each estuary mouth (PERMANOVA: Pseudo-F = 2.33, df = 12, p < 0.001).
Square-root transformed microplastic size class (µm) distribution (%) was
significantly different in combined sediments sites between Bilanhlolo Estuary and
Kongweni Estuary (PERMANOVA pairwise comparison: t = 4.44, p < 0.001),
between Bilanhlolo Estuary and Mhlangeni Estuary (PERMANOVA pairwise
comparison: t = 5.31, p < 0.001) and between Kongweni Estuary and Mhlangeni
Estuary (PERMANOVA pairwise comparison: t = 2.33, p = 0.003). Microplastics in
the size class 300 – 999 µm were the most abundant for all beach sediment sites
near estuaries, contributing 60.90 %, 52.20 %, and 53.70 % to the total microplastic
size class distribution in Bilanhlolo Estuary, Kongweni Estuary, and Mhlangeni
Estuary respectively (Figure 6.4). The beach sediments in sites near Mhlangeni
Estuary had a greater abundance (5.60 %) of smaller microplastics (20 – 149 µm)
relative to total microplastic size distribution than Bilanhlolo Estuary (0.70 %), and
Kongweni Estuary (0.90 %) (Figure 6.4). Similarity percentage analysis (SIMPER)
showed that the average dissimilarity between Bilanhlolo Estuary and Kongweni
Estuary (22.89 %) was largely due to the dissimilarity in the size classes 300 – 999
µm (30.27 %), 150 – 299 µm (25.68 %), and 2500 – 4999 µm (21.39 %). The
average dissimilarity between Bilanhlolo Estuary and Mhlangeni Estuary (30.21 %)
was predominantly as a result of the dissimilarity in the size classes 300 – 999 µm
(30.39 %), 150 – 299 µm (25.73 %), and 2500 – 4999 µm (19.07 %). The average
dissimilarity between Kongweni Estuary and Mhlangeni Estuary (23.98 %) was
largely attributed to dissimilarities between the size classes 2500 – 4999 µm (27.48
%), 150 – 299 µm (24.26 %), and 1000 – 2499 µm (19.65 %).

Chapter 6
90
Figure 6.4: Overall microplastic size class (µm) distribution (%) (sites at
increasing distance North and South of estuary mouth combined) in beach
sediment samples near estuary (Mhlangeni Estuary, Kongweni Estuary, and
Bilanhlolo Estuary). Lowercase letters indicate PERMANOVA pairwise
comparison significant differences.
Square-root transformed microplastic size class (µm) distribution (%) was
significantly different between North and South sites within each estuary
(PERMANOVA pairwise comparison: Bilanhlolo Estuary: t = 2.62, p < 0.001;
Kongweni Estuary: t = 2.52, p < 0.001; Mhlangeni Estuary: t = 2.60, p < 0.001)
(Figure 6.5). Square-root transformed microplastic size class (µm) distribution (%)
showed that microplastic size class (µm) distribution was also significantly different in
some sediment sites at increasing distances North and South of each estuary mouth
(Figure 6.5). Microplastic size class distribution (%) was not significantly different at
increasing distances (m) North or South of Mhlangeni Estuary (Figure 6.5a), except
at site 2000 m S of the Mhlangeni Estuary mouth which was significantly different in
terms of microplastic size class distribution (%) than the sites closer to the estuary
mouth (500 m South) (Figure 6.5a), showing a much greater relative proportion of
microplastics in the size class 20 – 149 µm (18.50 %), and 150 – 299 µm (22.3 %)
than other sites near the Mhlangeni Estuary mouth (Figure 6.5a). Sediment sites
North of the Kongweni Estuary mouth showed no significant difference in microplastic
c
b
a
0% 20% 40% 60% 80% 100%
Mhlangeni Estuary
Kongweni Estuary
Bilanhlolo Estuary
Overall microplastic size class distribution (%) S
ite
20 - 149 µm
150 - 299 µm
300 - 999 µm
1000 - 2499 µm
2500 - 4999 µm

Chapter 6
91
size class (%) with an increase in distance away from the estuary mouth (Figure
6.5b). All sediment sites near Kongweni Estuary mouth showed a similar proportion
of microplastics in the size class 300 – 999 µm (Figure 6.5b), however the site 500
m S of the Kongweni Estuary mouth had a higher proportion of larger microplastics
(2500 – 4999 µm) than other sites (Figure 6.5b). Sediment sites near Bilanhlolo
Estuary mouth showed significant differences in microplastic size class distribution
(%) at distances (m) increasing North of the estuary mouth (Figure 6.5c), but the site
nearest to the estuary mouth (500 m North) displayed a greater proportion (3.5 %) of
smaller microplastics (20 – 149 µm) (Figure 6.5c). Sediment sites further South of
the Bilanhlolo Estuary mouth were significantly different to sediment sites closer to
the estuary mouth (Figure 6.5c), but all showed a relatively large proportion of
microplastics in the size class 300 – 999 µm (Figure 6.5c).

Chapter 6
92
Figure 6.5: Microplastic size class (µm) distribution (%) in beach sediment from
sites at increasing distances (500 m, 1000 m, and 2000 m) North (N) and South
(S) away from each estuary mouth. Mhlangeni Estuary sites (a), Kongweni
Estuary sites (b) and Bilanhlolo Estuary sites (c). Uppercase letters indicate
PERMANOVA significant differences between North and South stations.
Lowercase letters indicate PERMANOVA pairwise comparison significant
differences between stations at increasing distances North and South away
from each estuary mouth.
a
a
a
b
b
a
0% 20% 40% 60% 80% 100%
N 2000 m
N 1000 m
N 500 m
S 500 m
S 1000 m
S 2000 m
Beach sediment microplastic size distribution (%)
Sit
e
(a)
20 - 149 µm
150 - 299 µm
300 - 999 µm
1000 - 2499 µm
2500 - 4999 µm
a
a
a
b
a
ab
0% 20% 40% 60% 80% 100%
N 2000 m
N 1000 m
N 500 m
S 500 m
S 1000 m
S 2000 m
Beach sediment microplastic size distribution (%)
Sit
e
(b)
20 - 149 µm
150 - 299 µm
300 - 999 µm
1000 - 2499 µm
2500 - 4999 µm
a
a
b
bc
b
a
0% 20% 40% 60% 80% 100%
N 2000 m
N 1000 m
N 500 m
S 500 m
S 1000 m
S 2000 m
Beach sediment microplastic size distribution (%)
Sit
e
(c)
20 - 149 µm
150 - 299 µm
300 - 999 µm
1000 - 2499 µm
2500 - 4999 µm
A
B
A
B
A
B

Chapter 6
93
6.5. Discussion
Beach sediment displayed higher abundances of microplastics (microplastics.m-2) at
sites nearer to each estuary mouth than sites further away within North and South
groups (Figure 6.1). Therefore, the hypothesis stating that microplastic abundance
(microplastics.m-2) will change with increasing distance from each estuary mouth was
accepted. The only exception to this trend was the higher microplastic abundance at
the site 2000 m South of the Mhlangeni Estuary mouth (Figure 6.1). This may be due
to the site being located adjacent to the Vungu Estuary mouth (approximately 250 m
North), which may also be a source of microplastics to the marine environment. The
increase of microplastic abundances in beach sediment sites closer to each estuary
mouth than sites further away indicate that estuaries may be a point source of
microplastic pollution to the marine environment. Similar patterns of microplastic
abundances in beach sediment decreasing further North and South of the study
areas were reported for selected eThekwini estuary mouths and adjacent beach
environments (Naidoo et al., 2015). Naidoo et al. (2015) reported higher quantities of
microplastic pollution at sites 500 m North and South on the adjacent coastline of
estuary mouth than at sites further away. Increased microplastic abundances in
sediment at sites South of each estuary mouth as opposed to sites North of each
estuary mouth, may be due to the influence of the prevailing Agulhas current which
flows in a southerly direction along the KwaZulu-Natal coastline (Driver et al., 2004).
However, the predominant inshore current along KwaZulu-Natal flows in a northerly
direction (Guastella, 1994), indicating that the distribution of microplastics along the
studied beaches cannot be inferred from the nearby inshore currents.
Estimates of microplastic abundances in Chapter 6 (8760.72 ± 3024.01 - 20267.04 ±
6439.03 microplastics.m-2) (Figure 6.1) were much larger than estimated in previous
investigations. Nel and Froneman (2015) reported microplastic abundances in beach
sediment of 688.9 ± 348.2 – 3308 ± 1449 microplastics.m-2 at 21 sites along the
south eastern coast of South Africa. In a more recent study, Nel et al., (2017)
reported beach sediment microplastic abundances between 86.67 ± 48.68 to 754.7 ±
393 particles.m-2 between 16 sites along the entire South African coastline. Further
abroad, Fok and Cheung (2015) found average microplastic abundances of 5595
items/m2 from 25 beach sediment sites near the Pearl River Estuary, China.

Chapter 6
94
Comparisons of the results of Chapter 6 with those of previous studies are difficult
due to the different sampling methodologies and units reported (Besley et al., 2017).
In addition, the density separation technique used may not have extracted
microplastics with a density greater than 1.2 g.cm-3 (Van Cauwenberghe et al., 2015).
However, the results obtained provide important insight into previously unreported
microplastic pollution loads along a small stretch of KZN coastline adjacent to estuary
mouths.
Beach sediments have been cited as an important sink of microplastic pollution
(Hildago Ruz et al., 2012; Nel and Froneman, 2015, Besley et al., 2017). Microplastic
abundances in beach sediment may be influenced by a number of factors, such as
tide (Santana et al., 2016), wind (Besley et al., 2017), and distance from point source
(Wang et al., 2016). Microplastics may be resuspended from sediment in to the water
column during events such as storm surges (Wegner et al., 2012). There are some
models of microplastic deposition in beach sediment that are currently in
development (Wang et al., 2016). However, due to the large number of factors that
may influence microplastic deposition in beach sediment, it is currently not feasible to
make any inferences regarding the patterns seen in this study (Figure 6.1).
The results of Chapter 6 show that microplastic fibres contribute a large proportion of
microplastic types in beach sediment (79.90 %) (Figure 6.2). These results are
similar to previous investigations of microplastic pollution in beach sediment. Nel and
Froneman (2015) found that microplastic fibres contributed a large proportion to the
total microplastic type composition in 21 sites along the south eastern coastline of
South Africa. Naidoo et al. (2015) also found a large proportion of microplastic fibres
in the beach sediment adjacent to five eThekwini estuaries. International studies
have shown similar results, with large quantities of microplastic fibres found in
Solvenia shores (75 %) and infratidal regions (90 %) (Laglbauer et al., 2014). Lots et
al. (2017) found that the majority of microplastics in beach sediment across 23
European beaches consisted mostly of fibrous microplastics (98.7 %). Microplastic
fibres were more abundant in sites nearer to each estuary mouth (Figure 6.3). The
hypothesis that microplastic type composition (%) will change with increasing
distance (m) from the estuary mouth is therefore accepted. The microplastic fibre
pollution in beach sediment near each estuary mouth can be as a result of sewage

Chapter 6
95
input rather than fragmentation of larger plastic items in the marine environment
(Alomar et al., 2016). However, links between microplastic shape and source can
only be alluded to with these results; further testing is required to determine
microplastic polymers and their definite sources. The results of Chapter 6 show that
microplastic sizes in beach sediment range between relatively short distances
(Figure 6.5). Therefore, the hypothesis that microplastic size class distribution differs
between sediment sites at sites up to 2000 m North and South of each estuary mouth
is accepted. An important observation from these results is that microplastic
abundances, types, and sizes vary significantly within relatively short distances in
beach sediment.
6.6. Conclusion
Microplastic abundances in sediment vary between relatively short distances within
beaches, highlighting the highly dynamic factors influencing microplastic particle
deposition and turnover within these areas. Microplastic abundances were
significantly different at sites at increasing distances North and South of each estuary
mouth. Based on the results of Chapter 6, in conjunction with those of Naidoo et al.
(2015), it is recommended that future investigations sample sites 500 m North and
South of estuary mouths to determine levels of microplastic input from estuary
mouths into coastal environments. Larger distances between sample sites are
cautioned against, particularly along the KZN coastline, for the following reasons: 1)
unstudied or undocumented water sources (e.g. stormwater runoff) and 2) other
estuaries may have an impact on microplastic loading in a particular area (such as
the site 2000 m South of Mhlangeni Estuay, which had increased quantities of
microplastics due to the close proximity to Vungu Estuary mouth).
Microplastics in beach sediment were found to largely consist of microplastic fibres,
indicating that land-based microplastic pollution is a significant source of marine
microplastic pollution. Although sediment is considered to be a sink of microplastic
pollution, microplastic particles may re-enter marine environments via resuspension,
potentially increasing microplastic pollution in marine water columns in a particular
area. Patterns of microplastic pollution in the water column and sediments are erratic
as they are influenced by a number of abiotic factors such as wind, tidal actions, and

Chapter 6
96
ocean currents (Santana et al., 2016). Microplastics may accumulate in sediment in
densities far greater than those in the water column and these values cannot be used
to extrapolate microplastic abundances for what is available to organisms for
ingestion. The limitations and lack of standardisation throughout the use of
microplastic sampling methodologies highlight the need for a SOP for microplastic
sampling, or the development of a new rapid and accurate procedure of microplastic
sampling.

Chapter 7
97
CHAPTER 7: RAPID BIOASSESSMENT OF MICROPLASTIC
POLLUTION IN KWAZULU-NATAL COASTAL
ENVIRONMENTS USING THE BROWN MUSSEL,
PERNA PERNA (LINNEAUS, 1758)
7.1. Abstract
Microplastic pollution has become the focus of a large body of research due to the
ubiquity throughout marine environments and potential danger to organisms which
ingest them. As microplastic pollution research is a relatively new area of interest,
procedures of microplastic sampling are limited and not harmonized. A recent
recommendation was made to potentially use mussels as biomonitors of microplastic
pollution in marine environments as opposed to monitoring abiotic matrices. Mussels
have already been successfully used to monitor heavy metal pollution in South
African marine environments due to their sedentary lifestyle and filter-feeding
strategy. The aim of this study was to determine and compare spatial differences in
microplastic pollution in the mussel species, Perna perna, originating from selected
temporarily open/closed estuaries (Mhlangeni Estuary, Kongweni Estuary, and
Bilanhlolo Estuary) during an open mouth phases at increasing distance 500 m, 1000
m, and 2000 m North and South on the coastline adjacent to each estuary mouth.
The overall mean microplastic abundance per mussel was 2.22 ± 0.79
microplastics.g-1 tissue (w/w). Microplastics were significantly more abundant in
mussels from sites nearer to estuary mouths than those further away. Microplastic
fibres were the most dominant microplastic type found in P. perna (61.80 %). The
results of this study highlight that microplastic pollution is entering South African
marine food webs. The results of this study also highlight the potential for P. perna to
be used as biomonitors of coastal microplastic pollution in marine environments.
However, further research is required to develop standardised international protocols
for mussel microplastic monitoring.
Keywords: microplastics, Perna perna, biomonitoring, South Africa, baseline survey

Chapter 7
98
7.2. Introduction
Due to their sedentary lifestyles and filter-feeding strategy, bivalve molluscs,
including mussels, have been used worldwide as biomonitors of marine pollutants
(Degger et al., 2011). Marine mussels are found along rocky shore habitats and are
considered as one of the best biological indicators of environmental degradation
(Kacar et al., 2016). In South Africa, mussels have been used to monitor levels of
heavy metal pollution in the marine environment since 1974 (Greenfield et al., 2014).
Their sedentary lifestyle, filter-feeding strategy, and extensive range along the South
African coastline allow for spatial and temporal trends of marine pollutants to be
rapidly assessed (Degger et al., 2011; Vosloo et al., 2012). Mussel Watch Programs
(MWPs) in South Africa almost exclusively focus on heavy metal pollution in marine
environments (Greenfield et al., 2014). Due to the enormous success of marine
pollution biomonitoring using mussels, there have been recommendations to use
mussels as biomonitors of microplastic pollution in marine environments.
Microplastics are any plastic particles < 5 mm in largest size dimension (Lusher et al.,
2017) and have been shown to be ubiquitous throughout the marine environment.
Microplastics are small enough to become available for ingestion by marine
invertebrates such as mussels (Li et al., 2015). Numerous studies have investigated
microplastic content in several species of wild mussels (De Witte et al., 2014;
Mathalon and Hill, 2014; Van Cauwenberghe and Jannsen 2014; Van
Cauwenberghe et al., 2015). As mussels are ecologically important and a major
seafood resource (Li et al., 2015), it is important to classify microplastics in mussels
in the interest of ecosystem and human health (Vandermeersch et al., 2015; Phuong
et al., 2017). Mussels may also be useful to monitor smaller microplastics which
recommended procedures (Chapter 3) may underestimate (Lusher et al., 2017).
A large majority of terrestrial-based effluents reach rocky shore environments via
rivers and estuaries where mussel populations are concentrated (Greenfield et al.,
2014). Marine mussels in rocky shore habitats can therefore be used as biomonitors
of marine microplastic pollution derived from estuaries (Santana et al., 2016). Several
methodologies exist to monitor microplastic pollution in marine environments by
sampling of abiotic matrices (e.g. water and sediment) (Hildago-Ruz et al., 2012;

Chapter 7
99
Besley et al., 2017). However, spatial and temporal patterns of microplastic pollution
can vary extensively due to the large number of influencing abiotic variables, such as
wind, climate and tides (Santana et al., 2016). The use of mussels as biomonitors of
microplastic pollution in marine environments enables the identification of the
microplastics most likely ingested by mussels (Santana et al., 2016), as well as the
potential risk these mussels pose to humans who utilize the mussels as a food
source. The brown mussel Perna perna, belonging to the family Mytilidae, is
indigenous to South Africa (Zardi et al., 2006) and dominates the KwaZulu-Natal
coast line along inter-tidal zones (Zardi et al., 2006). P. perna typically have quicker
growth rates than other mussel species (Oliveira et al., 2016) and are harvested from
natural populations on the KwaZulu-Natal (KZN) coast by subsistence fishermen
throughout the year (Yap et al., 2004).
The aim of Chapter 7 was to determine and compare spatial differences in
microplastic pollution in the mussel species, P. perna, originating from selected
temporarily open/closed estuaries (Mhlangeni Estuary, Kongweni Estuary, and
Bilanhlolo Estuary) during an open mouth phase at increasing distances of 500 m,
1000 m, and 2000 m North/South on the coastline adjacent to each estuary mouth.
Objectives included comparisons of 1) microplastic abundances (microplastics.g-1
tissue w/w) in P. perna at stations 500 m, 1000 m, and 2000 m North/South on the
coastline adjacent to each estuary mouth during an open mouth phase, 2)
microplastic type composition (%) in P. perna at stations 500 m, 1000 m, and 2000 m
North/ South on the coastline adjacent to each estuary mouth during an open mouth
phase, and 3) microplastic size class (µm) distribution (%) in P. perna at stations 500
m, 1000 m, and 2000 m North/South on the coastline adjacent to each estuary mouth
during an open mouth phase. It was hypothesized that there would be a difference in
microplastic abundances (microplastics.g-1 tissue w/w), microplastic type composition
(%), and microplastic size class (µm) distribution (%) in Perna perna at stations 500
m, 1000 m, and 2000 m North/South on the coastline adjacent to each estuary mouth
during an open mouth phase.

Chapter 7
100
7.3. Methods and Materials
7.3.1. Data collection
All data collection took place during a three day period in January 2017 at low tide.
Perna perna specimens (50 – 60 mm) were collected from the rocky shores at
stations 500 m, 1000 m, and 2000 m North and South adjacent to each estuary
mouth (Chapter 1: Figure 1.1) (Geographic coordinates: Appendix A: Table A 2).
Mussel samples were collected in accordance with the field permit [RES2017/71] for
the purposes of scientific investigations or practical experiment in terms of Section 83
of the Marine Living Resource Act (Act No. 18 of 1998) issued by the Department of
Agriculture, Forestry and Fisheries of the Republic of South Africa (Appendix B).
The mussels were detached from the rocks by severing the byssal threads with a
titanium blade and placed into individual plastic bags. A total of five P. perna
specimens were collected from each site. Due to a lack of rocky shore habitat, no
mussels were collected at the station 500 m North of Kongweni Estuary mouth.
Mussels were preserved immediately on-ice after collection to minimize microplastic
loss via gut evacuation (Lusher et al., 2017). Once collected, the mussels were
transported, transferred to and stored in a freezer (-20 °C) for a minimum of twenty-
four hours. The freezing of the mussels helps to break down tissue, aiding in greater
digestion efficiency (Catarino et al., 2016). Before analysis, mussels were removed
from the freezer and individually placed into aluminium ‗boats‘ and allowed to
completely thaw at room temperature (< two hours) (Catarino et al., 2016). Mussels
were removed of all fouling organisms and detritus using a titanium blade and
stainless steel scrubbing brush to reduce the possibility of contamination of samples
of micoplastics not present within the mussel tissue. The byssal threads of each
mussel were removed as microplastics may adhere to the byssal threads, thereby
leading to overestimations of microplastics within mussel tissue (Phuong et al.,
2017). Mussels were weighed whole to the nearest 0.001 g. Soft tissue was
dissected out of the mussel (Phuong et al., 2017). Shell tissue was thereafter
weighed to determine wet weight of soft tissue by difference of mass (Catarino et al.,
2016). A 10 % (w/w) potassium hydroxide (KOH) solution was prepared by dissolving
10 g KOH pellets (The Great Supply (Pty) Ltd., South Africa) in a glass beaker
containing 90 g (90 mL) distilled water and thoroughly mixed with a previously acid-

Chapter 7
101
washed glass rod until all the KOH had visibly dissolved. The process was repeated
until the desired quantity of 10 % (w/w) KOH solution was prepared. The soft tissue
of each mussel was placed in individual jars containing 250 mL of 10 % (w/w) KOH
solution. Five blank samples (containing no mussel tissue) were also subjected to the
same procedure to account for microplastic contamination (Catarino et al., 2016;
Lusher et al., 2017). The jars were sealed and placed in an oven 60 ºC for twenty-
four hours (Dehaut et al., 2016). Thereafter, the contents of each jar was vacuum-
filtered (Catarino et al., 2016) through a 5.0 µm polycarbonate track-etched
ISOPORE™ membrane filter (47 mm ⌀) (Merck Millipore Ltd.). Filters were each
placed into clean plastic petri dishes and covered with aluminium foil (Catarino et al.,
2016). The samples were dried in an oven at 60 ºC for twenty-four hours (Catarino et
al., 2016), thereafter removed from the oven and stored at room temperature until
microscope analysis.
7.3.2. Microplastic analysis
Filtered mussel samples were viewed up to 40 X magnification using a Nikon©
AZ100 stereomicroscope. Microplastics were distinguished from non-plastic particles
using previous recommendations (Chapter 3: Table 3.3). Once a particle had been
identified as plastic, the maximum size dimension of each particle was measured
(µm), and microplastic type was recorded. Microplastic abundances (microplastics.g-1
tissue w/w) were calculated for each sediment sample as follows:
7.3.3. Statistical analyses
Statistical significance was set at α = 0.05. Absolute p values were reported for all
values > 0.001. Where p values were less than 0.001, the significance was reported
as p < 0.001. Univariate statistics were conducted using IBM SPSS Statistics®
(version 23 for Microsoft® Windows® 10). A fully-nested analysis of variance
(ANOVA) was used to compare microplastic abundance in P. perna (microplastics.g-1

Chapter 7
102
tissue w/w) among rocky shore sites near each estuary, direction (North/South) of
each estuary mouth, and distances (500 m, 1000 m, and 2000 m) within directions
after log10(x)-transformed data met assumptions of normality of residuals (Shapiro
Wilk test statistic = 0.89, p > 0.05), and homogeneity of variances (Levenes test
statistic = 1.31, p > 0.05). Post hoc Tukey HSD comparisons were used to determine
significant differences of microplastic abundances in P. perna (microplastics.g-1 tissue
w/w) among sites. A Pearson correlation was used to correlate microplastic
abundances in mussels (microplastics.g-1 tissue w/w) with microplastic abundances
in sediment (microplastics.m-2) (Chapter 6) at each site. To compare variability of
microplastic abundance data between sediment (Chapter 6) and mussels,
coefficients of variation (%) were calculated for each data set and compared using a
modified One-way ANOVA. The coefficient of variance is the ratio of the standard
deviation (SD) to the mean, allowing the variability of data to be compared between
two data sets with different unit values.
Multivariate statistics were conducted using Plymouth Routines in Multivariate
Ecological Research (PRIMER) version 6 and permutational multivariate analysis of
variance (PERMANOVA) package to determine significant differences in microplastic
type composition (%) in P. perna at rocky shore stations between estuaries,
directions and distances. Data was square root transformed to weight the
contributions of common and ‗rare‘ microplastic types. A Bray Curtis matrix of
similarity was constructed with the square root transformed data. A nested
PERMANOVA and post hoc PERMANOVA pairwise comparisons were conducted on
the Bray Curtis matrix of square root transformed data to determine if microplastic
types in mussels were significantly different among sites. A similarity percentage
analysis (SIMPER) was used to determine percentage similarities and dissimilarities
between microplastic types in mussels among sites. The multivariate statistical
analysis was repeated for microplastic size class (µm) distribution (%) in rocky shore
P. perna samples.

Chapter 7
103
7.4. Results
7.4.1. Microplastic abundance in Perna perna
Microplastics were recorded in all sampled P. perna individuals. Log10(x)-transformed
microplastic abundances in P. perna (microplastics.g-1 tisse w/w) were significantly
different among rocky shore sites near each estuary mouth (ANOVA: F(2, 84) = 149.43,
p < 0.001), between directions North and South of each estuary mouth (ANOVA: F(3,
68) = 28.08, p < 0.001), and at increasing distances North and South away from each
estuary mouth (ANOVA: F(11, 68) = 34.44, p < 0.001). Mussels at rocky shore sites
near Kongweni Estuary mouth contained greater mean quantities of microplastics
(3.10 ± 0.34 microplastics.g-1 tissue w/w) than mussels near Mhlangeni Estuary (2.10
± 0.21 microplastics.g-1 tissue w/w) and Bilanhlolo Estuary (1.67 ± 0.26
microplastics.g-1 tissue w/w) (Tukey HSD post hoc comparison: p < 0.05 for all
interactions) (Figure 7.1). Mussels from sites North and South of the Kongweni
Estuary mouth showed no significant differences in microplastic abundance (Tukey
HSD post hoc comparison: t = -166, p = 0.56) (Figure 7.1), but there was significant
differences in microplastic abundance in mussels from sites North and South of
Mhlangeni Estuary mouth (Tukey HSD post hoc comparison: t = 7.73, p < 0.001),
and Bilanhlolo Estuary mouth (Tukey HSD post hoc comparison: t = -4.65, p < 0.001)
(Figure 7.1). Microplastic abundances were significantly greater at sites South of the
Mhlangeni Estuary mouth, and greater at sites North of the Bilanhlolo Estuary mouth
(Figure 7.1). Microplastic abundance within mussels tended to decrease with an
increase in distance (m) North and South of each estuary mouth (Figure 7.1), except
for the site 2000 m South of Mhlangeni Estuary mouth, where mussels showed an
increased microplastic abundance (microplastics.g-1 tissue w/w) than sites nearer to
the estuary mouth (Figure 7.1). There was no correlation between log10(x)-
transformed sediment and mussels abundances (Pearson‘s correlation = 0.306, p >
.05) between sites within each estuary system.

Chapter 7
104
Figure 7.1: Mean microplastic abundance (microplastic.m-2) in Perna perna
specimens at increasing distances (m) North (N) and South (S) away from each
estuary mouth (n = 5). Uppercase letters indicate significance differences
between estuarine systems. Lowercase letters indicate Tukey HSD post hoc
significance differences between sites within each estuary system. Error bars
represent ± 1 SD. No data at site 500 m North of Kongweni Estuary mouth due
to absence of rocky shores.
The coefficients of variance were significantly different between sediment and
mussels (ANOVA: F = 3.99, df = 1, p = 0.047) (Figure 7.2). Mean coefficients of
variation were greatest for microplastic abundance in sediment (38.32 ± 30.65 %) in
comparison to mussels (30.69 ± 17.86 %). Microplastic abundances in sediment
were far more variable than in mussels, with a larger coefficient variation range and a
greater number of outliers within samples (Figure 7.2). The calculated coefficients of
variance for total data sets were 48.97 % for sediment (14046.14 ± 6878.01
microplastics.m-2), and 35.45 % for mussels (2.22 ± 0.79 microplastics.g-1 w/w).
b
a
ab
a
a
a
a
c a
b
a
a
ab
a
c
c
b
0
0.5
1
1.5
2
2.5
3
3.5
4
4.5
5
Mhlangeni Estuary Kongweni Estuary Bilanhlolo Estuary
Mic
rop
lasti
c a
bu
nd
an
ce i
n m
ussels
(m
icro
pla
sti
cs.g
-1 w
/w)
Site
2000 m N
1000 m N
500 m N
500 m S
1000 m S
2000 m S
A B C

Chapter 7
105
Figure 7.2: Coefficients of variance (%) of microplastic abundances in mussels
(n = 85) and sediment (n = 90). Lowercase letters indicate significant
differences (ANOVA).
7.4.2. Microplastic type composition in Perna perna
Square-root transformed microplastic type composition (%) was significantly different
in P. perna among combined sites near each estuary mouth (PERMANOVA: Pseudo-
F = 8.24, df = 2, p < 0.001), between sites North and South of each estuary mouth
(PERMANOVA: Pseudo-F = 4.14, df = 3, p < 0.001), and among sites at increasing
distances (500 m, 100 m, and 2000 m) North and South of each estuary mouth
(PERMANOVA: Pseudo-F = 3.72, df = 11, p < 0.001). There was a significant
difference in microplastic type composition (%) in P. perna specimens between all
sites (PERMANOVA pairwise comparison: Bilanhlolo Estuary and Kongweni Estuary:
t = 3.51, p < 0.001; Bilanhlolo Estuary and Mhlangeni Estuary: t = 2.81, p = 0.003;
Kongweni Estuary and Mhlangeni Estuary: t = 1.97, p = 0.013) (Figure 7.3).
a
b

Chapter 7
106
Microplastic fibres were the most dominant microplastic type in sites within combined
sites near estuaries (61.80 %), contributing 55.60 %, 55.20 %, and 77.30 % to the
total microplastic abundance in sites near Mhlangeni Estuary, Kongweni Estuary, and
Bilanhlolo Estuary respectively (Figure 7.3). Fragments were the second most
abundant microplastic type in mussels (26.20 %), with a relatively small proportion of
microplastic film in mussels (8.0 %) (Figure 7.3). Similarity percentage analysis
(SIMPER) showed that the average dissimilarity between combined sites near
Bilanhlolo Estuary and Kongweni Estuary (33.76 %) was largely attributed to the
dissimilarity in fragments (41.98 %), fibres (22.00 %), and film (21.15 %). The
average dissimilarity between combined sites near Bilanhlolo Estuary and Mhlangeni
Estuary (32.72 %) was largely as a result of fragments (39.35 %), fibres (24.89 %),
and film (24.02 %). The average dissimilarity in combined sites near Kongweni
Estuary and Mhlangeni Estuary (26.26 %) was due to the dissimilarities between
fragments (28.00 %), fibres (26.06 %), and film (25.15 %).
Figure 7.3: Overall microplastic type composition (%) in Perna perna from
rocky shore sites at increasing distances (500 m, 1000 m, and 2000 m) North
and South of estuary mouth combined (Mhlangeni Estuary, Kongweni Estuary,
and Bilanhlolo Estuary). Lowercase letters indicate significant differences in
microplastic type composition (%) (PERMANOVA).
a b c
0%
10%
20%
30%
40%
50%
60%
70%
80%
90%
100%
Mhlangeni Estuary Kongweni Estuary Bilanhlolo Estuary
Ov
era
ll m
icro
pla
sti
c c
om
po
sit
ion
(%
)
Site
Chart Title
Microbead
Fragment
Foam
Film
Fibre

Chapter 7
107
There was a significant difference in microplastic type composition (%) between
directions North and South of Bilanhlolo Estuary mouth (PERMANOVA pairwise
comparison: t = 2.92, p = 0.005), but no difference in microplastic type composition
(%) between directions North and South of Kongweni Estuary mouth (PERMANOVA
pairwise comparison: t = 1.22, p = 0.256), and between directions North and South of
Mhlangeni Estuary mouth (PERMANOVA pairwise comparison: t = 0.61, p = 0.688)
(Figure 7.4). There was no significant differences in microplastic type composition
(%) between sites North of Mhlangeni Estuary (PERMANOVA pairwise comparison:
p > 0.05 for all interactions), or between sites 2000 m and 1000 m South of
Mhlangeni Estuary (PERMANOVA pairwise comparison: t = 1.66, p = 0.09) (Figure
7.4a). There was a significant difference in microplastic type composition (%)
between sites 1000 m and 500 m South (PERMANOVA pairwise comparison: t =
2.32, p = 0.04) and between sites 2000 m and 500 m South (PERMANOVA pairwise
comparison: t = 2.53, p = 0.02) of Mhlangeni Estuary (Figure 7.4a). There was no
significant difference in microplastic type composition (%) between sites 1000 m and
2000 m North of Kongweni Estuary mouth (PERMANOVA pairwise comparison: t =
1.18, p = 0.27) (Figure 7.4b), but there was a significant difference in all sites South
of the Kongweni Estuary mouth (PERMANOVA pairwise comparison: p < 0.05 for all
interactions) (Figure 7.4b). There was no significant differences in microplastic type
composition (%) in P. perna in rocky shore sites North of Bilanhlolo Estuary or
between sites 2000 m and 500 m South, and sites 1000 m and 500 m South
(PERMANOVA pairwise comparison: p > 0.05 for all interactions) (Figure 7.4c), but
there was a significant difference in sites 1000 m and 2000 m South of Bilanhlolo
Estuary mouth (PERMANOVA pairwise comparison: t = 3.08, p = 0.03) (Figure
7.4c).

Chapter 7
108
Figure 7.4: Microplastic type composition (%) in Perna perna from sites at
increasing distances (500 m, 1000 m, and 2000 m) North (N) and South (S) away
from each estuary mouth (Mhlangeni Estuary sites (a), Kongweni Estuary sites
(b), and Bilanhlolo Estuary sites (c)). Uppercase letters indicate significant
differences between North and South sites (PERMANOVA pairwise
comparison). Lowercase letters indicate significant differences between sites
at increasing distances away from each estuary mouth within North and South
groups (PERMANOVA pairwise comparison). No data at site 500 m North of
Kongweni Estuary mouth due to absence of rocky shores.
a a a b a a
0%
20%
40%
60%
80%
100%
N 2000 m N 1000 m N 500 m S 500 m S 1000 m S 2000 m
Mic
rop
lasti
c t
yp
e c
om
po
sit
ion
in
m
us
sels
(%
)
Site
(a)
Microbead
Fragment
Foam
Film
Fibre
a a a b c
0%
20%
40%
60%
80%
100%
N 2000 m N 1000 m N 500 m S 500 m S 1000 m S 2000 mMic
rop
lasti
c t
yp
e c
om
po
sit
ion
in
m
us
sels
(%
)
Site
(b)
Microbead
Fragment
Foam
Film
Fibre
a a a ab a b
0%
20%
40%
60%
80%
100%
N 2000 m N 1000 m N 500 m S 500 m S 1000 m S 2000 m
Mic
rop
las
tic
typ
e c
om
po
sit
ion
in
mu
ss
els
(%
)
Site
(c)
Microbead
Fragment
Foam
Film
Fibre
A A
A A
A
B

Chapter 7
109
7.4.3. Microplastic size class distribution in Perna perna
Square-root transformed microplastic size class (µm) distribution (%) was
significantly different in P. perna specimens among combined sites near each
estuary mouth (PERMANOVA: Pseudo-F = 8.26, df = 2, p < 0.001), between rocky
shore sites North and South of each estuary mouth (PERMANOVA: Pseudo-F = 3.81,
df = 3, p = 0.002), and among sites at increasing distances (500 m, 1000 m, and
2000 m) North and South of each estuary mouth (PERMANOVA: Pseudo-F = 3.03, df
= 11, p < 0.001). Microplastic size class (µm) distribution (%) was significantly
different in P. perna specimens in combined sites between Bilanhlolo Estuary and
Kongweni Estuary (PERMANOVA pairwise comparison: t = 3.55, p < 0.001), and
between Bilanhlolo Estuary and Mhlangeni Estuary (PERMANOVA pairwise
comparison: t = 3.05, p = 0.003), but not between Kongweni Estuary and Mhlangeni
Estuary (PERMANOVA pairwise comparison: t = 1.50, p = 0.16). Microplastics in the
size class 300 – 999 µm were the most abundant for all mussels in sites near
estuaries, contributing 53.20 %, 38.80 %, and 35.10 % to the total microplastic size
class distribution in Bilanhlolo Estuary, Kongweni Estuary, and Mhlangeni Estuary,
respectively (Figure 7.5). The mussels in sites near Mhlangeni Estuary had a greater
abundance (31.00 %) of smaller microplastics (20 – 149 µm) relative to total
microplastic size distribution than Bilanhlolo Estuary (14.40 %), but similar to
Kongweni Estuary (30.40 %) (Figure 7.5).

Chapter 7
110
Figure 7.5: Overall microplastic size class (µm) distribution (%) (sites at
increasing distance North and South of estuary mouth combined) in Perna
perna samples near estuary (Mhlangeni Estuary, Kongweni Estuary, and
Bilanhlolo Estuary). Lowercase letters indicate significant differences
(PERMANOVA).
There was a significant difference in microplastic size class (µm) distribution (%)
between sites North and South of Mhlangeni Estuary mouth (PERMANOVA pairwise
comparison: t = 2.17, p = 0.04), and between sites North and South of Kongweni
Estuary mouth (PERMANOVA pairwise comparison: t = 2.11, p = 0.02), but not
between sites North and South of Bilanhlolo Estuary mouth (PERMANOVA pairwise
comparison: t = 1.66, p = 0.11) (Figure 7.6). Microplastic size class (µm) distribution
(%) was not significantly different at increasing distances North and South away from
Mhlangeni Estuary mouth (PERMANOVA pairwise comparison: p < 0.05 for all
interactions), except at site 2000 m South of the Mhlangeni Estuary mouth (Figure
7.6a). This site was significantly different in terms of microplastic size class (µm)
distribution (%) than the sites closer to the estuary mouth (500 m South)
(PERMANOVA pairwise comparison: t = 2.39, p = 0.008), showing a much greater
relative proportion of microplastics in the size class 300 - 999 µm (31.10 %) than
other sites near the Mhlangeni Estuary mouth (Figure 7.6a). Mussels from sites 1000
m and 2000 m North of the Kongweni Estuary mouth showed no significant
difference in microplastic size class (µm) distribution (%) (PERMANOVA pairwise
b
b
a
0% 20% 40% 60% 80% 100%
Mhlangeni Estuary
Kongweni Estuary
Bilanhlolo Estuary
Overall microplastic size class distribution (%) S
ite
20 - 149 µm
150 - 299 µm
300 - 999 µm

Chapter 7
111
comparison: t = 1.49, p = 0.15). Mussels from sites South of the Kongweni Estuary
mouth showed similarly large proportions of larger microplastics (300 – 999 µm)
(Figure 7.6b), but showed a significant difference between sites 1000 and 2000 m
South (PERMANOVA pairwise comparison: t = 2.63, p = 0.04) which was largely
attributed to the differences in microplastic size class of 150 – 299 µm (Figure 7.6b).
Mussels from sites near Bilanhlolo Estuary mouth showed no significant differences
in microplastic size class (µm) distribution (%) at distances (m) increasing North of
the estuary mouth (PERMANOVA pairwise comparison: p < 0.05 for all interactions),
but the furthest from the estuary mouth (2000 m North) displayed a greater
proportion (15.20 %) of smaller microplastics (20 – 149 µm) (Figure 7.6c). Mussels
from sites further South of the Bilanhlolo Estuary mouth had significantly different
size class composition to mussels from sites closer to the estuary mouth
(PERMANOVA pairwise comparison: t = 3.22, p = 0.004), but all showed a relatively
large proportion of microplastics in the size class 300 – 999 µm (Figure 7.6c).

Chapter 7
112
Figure 7.6: Microplastic size class (µm) distribution (%) in Perna perna from
sites at increasing distances (500 m, 1000 m, and 2000 m) North (N) and South
(S) away from each estuary mouth. Mhlangeni Estuary sites (a), Kongweni
Estuary sites (b) and Bilanhlolo Estuary sites (c). Uppercase letters indicate
significant differences between North and South sites (PERMANOVA pairwise
comparison). Lowercase letters indicate significant differences between sites
at increasing distances away from each estuary mouth within North and South
groups (PERMANOVA pairwise comparison). No data at site 500 m North of
Kongweni Estuary mouth due to absence of rocky shores.
a
a
a
b
ab
a
0% 20% 40% 60% 80% 100%
N 2000 m
N 1000 m
N 500 m
S 500 m
S 1000 m
S 2000 m
Microplastics in mussels size distribution (%)
Sit
e
(a)
20 - 149 µm
150 - 299 µm
300 - 999 µm
a
a
b
b
a
0% 20% 40% 60% 80% 100%
N 2000 m
N 1000 m
N 500 m
S 500 m
S 1000 m
S 2000 m
Microplastics in mussels size distribution (%)
Sit
e
(b)
20 - 149 µm
150 - 299 µm
300 - 999 µm
a
a
a
b
ab
a
0% 20% 40% 60% 80% 100%
N 2000 m
N 1000 m
N 500 m
S 500 m
S 1000 m
S 2000 m
Microplastics in mussels size distribution (%)
Sit
e
(c)
20 - 149 µm
150 - 299 µm
300 - 999 µm
A
B
A
B
A
A

Chapter 7
113
7.5. Discussion
The results of Chapter 7 show that Perna perna (50 – 60 mm) contained significantly
different mean microplastic concentrations among all sites (Figure 7.1). The number
of microplastics,g-1 tissue (w/w) decreased with an increase away from each estuary
mouth (Figure 7.1). The only exception was for the site 2000 m South of the
Mhlangeni Estuary mouth, as this site was adjacent to the Vungu Estuary mouth
(Figure 7.1). This means that the mussels from this site may be exposed to
increased microplastic loads from Vungu Estuary. Pillay (2015) found a similar
pattern of stable nitrogen isotopes in P. perna, which was greater at sites closer to
Kongweni Estuary, Umtamvuna Estuary, and Mhlungwa Estuary, than sites further
away. The increased microplastic pollution at the site 2000 m South of the Mhlangeni
Estuary mouth was also reflected in sediment microplastic abundances (Chapter 6).
Therefore, the hypothesis stating that microplastic abundances in mussels will differ
among sites was accepted. The overall mean microplastic abundance per mussel
(2.22 ± 0.79 microplastics.g-1 tissue w/w) was comparable to previous studies of
microplastics in Mytilus edulis of 2.4 items/g from a fishery market in China (Li et al.,
2015). A more recent study found similar mean microplastic abundances in wild and
farmed M. edulis of 2.2 items/g from China (Li et al., 2016). Lower abundances of
microplastics were reported in M. edulis cultivated for human consumption in
Germany (0.36 ± 0.07 microplastics.g-1 tissue w/w) (Van Cauwenberghe and
Janssen, 2014), and M. edulis along the French-Belgian-Dutch coastline (0.2 ± 0.3
microplastics.g-1 tissue w/w) (Van Cauwenberghe et al., 2015). These lower
abundances reported in literature, may be as a result of the nitric acid digestion
technique used to separate mussel tissue from microplastics. Nitric acid has shown
to alter or destroy microplastic particles within samples (Catarino et al., 2016).
Microplastics in P. perna mostly consisted of fibres (Figure 7.3), but microplastics
types varied between sites North and South of each estuary mouth (Figure 7.4).
Therefore, the hypothesis that microplastic types will be different in mussels at sites
increasing North and South of each estuary mouth was accepted. Fibres have been
reported to be the most abundant microplastic type in mussels throughout the world
(De Witte et al., 2014; Mathalon and Hill, 2014; Li et al., 2016). It is important to
quantify microplastic type as negative impacts on organisms ingesting microplastics

Chapter 7
114
have been shown to be associated with microplastic particle shapes (Wright et al.,
2013). Microplastic fibres have a higher surface area to volume ratio than other
microplastic types, potentially allowing for increased toxicant accumulation on the
surface of the microplastic, increasing the possibility of increased toxicant transfer to
animals ingesting microplastic fibres (Chua et al., 2014).
Microplastics found in P. perna in this study mostly consisted of smaller microplastics
(Figure 7.5 and Figure 7.6), however, the microplastic size class distribution did
differ significantly within sites near to each estuary mouth (Figure 7.6). The
hypothesis stating that microplastic size class (µm) distribution (%) among mussels
from different sites will be different was therefore accepted. The microplastic sizes
found in mussels from the study are comparable to other international studies, as
microplastics were found to range between 30 to 200 µm in size in M. edulis (Phuong
et al., 2017). Smaller microplastics have been shown to be present in greater
abundances in filter feeders than in larger carnivorous taxa (Foekema et al., 2013).
This finding was supported by Mathalon and Hill (2014), who found that smaller
microplastics have higher accumulation rates in mussel tissues as opposed to larger
microplastics.
The ingestion of microplastics by mussels has been shown to have negative
physiological effects, such as gut blockage, a false sense of satiation, leading to
malnutrition and eventual decrease in reproductive and survival fitness (Von Moos et
al., 2012; Wright et al., 2013). In addition, the increased ingestion of microplastics
may increase the potential of toxicant transfer from microplastics to mussels (Chua et
al., 2014), and potential increased bioaccumulation of these toxicants along the food
web (Ivar do Sul and Costa, 2014). As mussels are an important food source for a
large social sector (Yap et al., 2004) as well as for a wide variety of other organisms,
these results highlight the potential impacts of microplastic pollution on human food
sources and emphasizes the need for further research on toxicant transfer
mechanisms. Although microplastics may be eliminated by mussels, they constantly
ingest microplastics from the marine environment. Mussels will therefore always
harbour microplastics if the environment contains microplastics (Mathalon and Hill,
2014).

Chapter 7
115
Mussels have previously been determined to be suitable indicators of microplastic
pollution in the marine environment (Van Cauwenberghe et al., 2015; Li et al., 2016,
Santana et al., 2016; Wesch et al., 2016). The use of mussels as biomonitors of
microplastic pollution enables the identification of the relevant risks of certain
microplastics to the mussels (Santana et al., 2016), as well as the potential risk these
mussels pose to humans who utilize the mussels as a food source. According to
definitions of what makes a good indicator of plastic pollution monitoring outlined by
the United Nations Environment Programme (UNEP, 2016) (Table 7.1), the results of
Chapter 7 show that P. perna is a good monitor of microplastic pollution. In addition
to microplastic pollution levels, mussels may also be useful to monitor smaller
microplastics which recommended procedures (Chapter 3) may underestimate
(Lusher et al., 2017). In Chapter 7, the smallest detectable particle was 20 µm, which
is much smaller than the mesh sizes used in water (approximately 300 µm). There
was also less variability of microplastic abundances in mussels as compared to
sediment (Figure 7.2; Chapter 6 and Chapter 7). This information implies that while
microplastic abundances vary in mussels from different sites, the variability between
samples is less than that of sediment. The decreased variability between samples
indicates that P. perna may be a more useful and reliable way to monitor microplastic
pollution in marine environments than in abiotic matrices such as sediment.

Chapter 7
116
Table 7.1: Attributes of a good indicator (UNEP 2016) and relevance to P. perna
as biomonitors of microplastic pollution
Attributes In this study
1. Scientifically valid Yes – the procedure is repeatable and provides a
baseline for further microplastic biomonitoring
research in South Africa.
2. Simple to understand by
public and policy makers
Yes – rapid monitoring of microplastics, simple
collection methods
3. Sensitive and responsive
to change
Yes – changes in microplastic pollution in the
environment will be reflected in P. perna
4. Cost-effective Yes – low cost of collection and processing
5. Policy relevant Yes – can be useful to include microplastic
pollution in the already established national Mussel
Watch Program.
The results of Chapter 7 are only relevant to P. perna, however, to be part of a
national monitoring program it is recommended that this study be repeated with other
mussel species found along South African coastlines. The selection of which mussel
species to be used as biomonitors for microplastic pollution will be regionally-
dependant. While P. perna dominates the east coast of South Africa, Mytilus
galloprovincialis (Lamark, 1819), an invasive mussel species, dominates the west
coast of South Africa (Robinson et al., 2005; Picker and Griffiths, 2011). On the south
coast of South Africa, M. galloprovincialis is often found mixed in P. perna mussel
beds (Picker and Griffiths, 2011). M. galloprovincialis has successfully been used in a
Mussel Watch Program (MWP) to monitor heavy metal pollution along the south-
western coast of South Africa (Sparks et al., 2014). The already established Mussel
Watch Program with M. galloprovincialis, in combination with the baseline data for
microplastic pollution in P. perna, provide good motivation for future microplastic
monitoring using M. galloprovincialis in areas where P. perna is not naturally found.

Chapter 7
117
7.6. Conclusion
The ubiquity of microplastics in P. perna in Chapter 7 highlight that microplastics are
indeed entering South African marine food webs. The introduction of microplastics
into marine food webs in lower trophic organisms, such as P. perna, may have
disastrous knock-on effects throughout marine ecosystems. As P. perna are an
important subsistence food source for a large local population, the findings of
Chapter 7 may have important repercussions for food security within the subsistence
sector. The results of Chapter 7 have shown that P. perna are potentially useful
biomonitors of microplastics due to their sedentary lifestyle and non-selective filter-
feeding strategy. Using P. perna to monitor microplastic pollution aids in the
identification of which microplastics are the most bioavailable to organisms, thus
determining which microplastics may cause the most ecological damage. The use of
P. perna to monitor microplastics may enable the quantification of smaller
microplastic particles that may be underestimated in abiotic monitoring procedures.
In addition, the decreased variability of microplastic abundances in P. perna as
opposed to sediment highlight that mussels may be a more reliable way to spatially
and temporally monitor microplastic pollution. The results of Chapter 7 provide a
baseline for the development of a South African microplastic MWP, but further
research is required to develop standardised international protocols for mussel
microplastic monitoring (Vandermeersch et al., 2015; Li et al., 2016). Nonetheless,
the concept presented in Chapter 7 of using P. perna as biological monitors for
microplastic pollution has been shown to be feasible on a provincial scale. National
scale microplastic biomonitoring needs to be further validated using M.
galloprovincialis to develop a nationwide microplastic pollution biomonitoring program
across all South African marine biomes.

Chapter 8
118
CHAPTER 8: CONCLUSIONS AND RECOMMENDATIONS
FOR FUTURE RESEARCH
8.1. Major findings
The study found that the novel methodology using macro-based automated counting
of microfibres in samples showed no significant differences in microfibre counts and
measurements between manual counting by volunteers and the developed
automated counting feature (Chapter 4). However, the automated counting feature
resulted in a significant reduction in analysis time as compared to manual counting
and measurement by volunteers. The reduction in analysis time is useful for the rapid
assessment of microplastics within samples from both laboratory and field studies.
This study provided the first reports of microplastic pollution in three selected KZN
TOCEs during an open mouth phase (Chapter 5). It was found that Bilanhlolo
Estuary had the highest microplastic pollution levels of the studied estuaries in both
surface water (surface water (5.98 ± 0.46 microplastics.m-2) and sediment (42189.81
± 2166.67 microplastics.m-2). Mhlangeni Estuary and Kongweni Estuary displayed
lower levels of microplastic pollution in surface water (Mhlangeni Estuary: 4.50 ± 0.59
microplastics.m-2; Kongweni Estuary: 2.34 ± 0.23 microplastics.m-2) and in sediment
(Mhlangeni Estuary: 13266.84 ± 1524.37 microplastics.m-2; Kongweni Estuary:
18862.81 ± 2314.96 microplastics.m-2). It was found that the PES category of each
estuary as described by DWA (2013) was not a good indicator of microplastic
pollution levels in the sampled estuaries. Microplastic fibres were the most dominant
microplastic type within all estuaries (60.07 %). Microplastic size class distribution did
not differ significantly between the sampled estuaries within surface water and
sediment combined, but significantly differed between surface water and sediment
samples. The microplastic pollution within each estuary highlights the potential
contribution of estuaries as conduits of microplastic pollution transfer from land-
based sources to the marine environment.
The study investigating microplastic pollution in beach sediment adjacent to each
estuary mouth showed that microplastic abundances (microplastics.m-2) were greater

Chapter 8
119
at sites near to each estuary mouth than at beach sites further away (Chapter 6). In
conjunction with similar results by Naidoo et al. (2015), this information indicates that
estuaries are point sources of pollution. On average, sites near Bilanhlolo Estuary
had higher levels of microplastic pollution (20267.04 ± 6439.03 microplastics.m-2)
than Mhlangeni Estuary (8760.72 ± 2392.44 microplastics.m-2), and Kongweni
Estuary (12072.19 ± 3024.01 microplastics.m-2). These results are not unexpected,
as Bilanhlolo Estuary had the highest microplastic abundance within the estuary.
The beach sediment microplastic abundance was an order of magnitude larger than
reported by Nel and Froneman (2015) (688.9 ± 348.2 – 3308 ± 1449 microplastics.m-
2), Nel et al. 2016 (86.67 ± 48.68 to 754.7 ± 393 particles.m-2), and Fok and Cheung
(2016) (5595 items/m2). The data presented in Chapter 6 implies that the greater the
microplastic pollution loads in an estuary, the more microplastic pollution will be
transferred to the marine environment during open mouth phases. Microplastic fibres
were the most abundant microplastic type in all beach sediment samples (79.09 %).
Microplastic size class distribution differed significantly between beach sites. These
results provide insight of microplastic pollution in beach sediment in previously
unstudied areas. In addition, these results show the high variability of microplastic
pollution in relatively short distances in beach sediment near estuaries. The high
variability of microplastic loads in sediment may lead to inaccurate extrapolations of
microplastic pollution in particular areas. As such, alternative methods of microplastic
pollution monitoring (such as mussel biomonitoring) have been suggested.
Chapter 7, which investigated microplastic pollution in P. perna, showed that P.
perna in the sampled areas contained an average of 2.22 ± 0.79 microplastics.g-1
tissue (w/w). Mussels nearer to each estuary mouth contained greater quantities of
microplastics than sites further away. The pattern of increased microplastics in
mussels nearer to estuary mouth was reflected in sediment (Chapter 6), as well as
previous investigations of stable nitrogen isotopes in mussels at sites closer to
estuary mouths (Pillay, 2015). Microplastic fibres were the most common microplastic
type in all mussel samples (61.80 %). The results presented in Chapter 7 indicate
that microplastic pollution is entering South African marine food webs via TOCEs. In
addition, the results show that P. perna can successfully be used as marine
biomonitors of microplastic pollution. When comparing microplastic abundances
between sediment and mussels (Chapter 6 and 7), no correlation between

Chapter 8
120
microplastic pollution loads in sediment and mussels from the same site was found.
A comparison of microplastic loads in sediment and in P. perna showed that
microplastic abundance was less variable in P. perna than in sediment. This
indicates that while the monitoring of microplastic abundances in sediment may be
useful, biomonitoring of microplastics with P. perna may be a more reliable
procedure. The use of P. perna to monitor microplastics may also be useful in the
quantification of smaller microplastic particles that may be underestimated in abiotic
monitoring procedures. The results of this study provide a good baseline for further
research of microplastic biomonitoring in South Africa and for the development of a
national microplastic Mussel Watch Program (MWP).
8.2. Challenges and shortcomings
The major challenges associated with the environmental monitoring of microplastic
pollution in this study were predominantly due to the lack of standardized
methodologies available. As a result, the findings of this study could only be
compared to a narrow range of literature.
Some of the methodologies used in the study each had their own specific limitations.
For example, the density separation method used to extract microplastics from
estuarine and beach sediment (Chapter 5 and 6) may underestimate the quantity of
microplastics with a higher density than that of the saturated NaCl solution. However,
the use of a saturated NaCl solution is a more cost-effective and environmentally
friendly method of density separation. In addition, it is a technically simple and
replicable method, with potential to be used in a variety of microplastic pollution
research investigations (Chapter 3). The novel methodology of macro-based
automated counting of microplastics in samples is currently not able to distinguish
between plastic and non-plastic debris (Chapter 4). However, the adoption of
fluorescent tagging of samples with Nile Red, together with the automated counting
methodology, may aid in the rapid assessment of microplastics from both laboratory
and field studies.
The monitoring of estuarine and beach sediment microplastic pollution was largely
dependent on the equipment used to collect, extract, and analysis microplastics

Chapter 8
121
within samples. Microplastic abundances in estuarine surface water may be
underestimated due to the mesh size of the trawl used to collect samples (Chapter
5). In addition, only the surface water of each estuary was sampled, which may
underestimate microplastics of higher densities that are not as buoyant as
microplastics floating on the surface of the water.
The sampling of mussels at the specific distance of 500 m North and South of an
estuary mouth may not always be possible. For example, in Chapter 7 there was no
data for the site 500 m North of the Kongweni Estuary mouth because there was no
rocky shore habitat at that location. However, future research should include the next
available rocky shore to be sampled, which will still show a pattern of decreased
microplastic abundance with an increase in distance North/South away from each
estuary mouth.
Although Perna perna samples collected were all in the same size class (50 – 60
mm), there may have been variations in age, sex and physiology of each individual
mussel could not be determined in situ. These factors may cause variations in the
accumulation of microplastics and other pollutants within individual mussel tissues
(Degger et al., 2011; Lusher et al., 2017).
In all environmental studies in this dissertation, microplastic particles in samples were
identified by morphological type and no further chemical analysis was used to
determine microplastic polymer types. Microplastic polymer identification may be
useful in identifying potential sources of microplastic pollution to estuarine and
marine environments. However, the lack of microplastic polymer identification
certainly cannot detract from the important baseline results that this study provides.
However the lack of polymer identification is not necessary for rapid assessment
techniques which this study uses. In future, significantly different results from a
monitoring program can always be subjected to further polymer analysis if required.

Chapter 8
122
8.3. Recommendations for future research
Microplastic pollution research is still a relatively new area of global interest, and as a
result, a large proportion of third world countries do not have the necessary
resources to replicate microplastic pollution research undertaken in developed
nations (UNEP, 2016). The recommendations of microplastic monitoring techniques
outlined in Chapter 3, and the success of the automated macro-based microplastic
counting (Chapter 4) provide technically simple, rapid, and cost-effective methods of
microplastic monitoring and analysis that are repeatable and provide data of a
relatively good quality. The recommendations and novel methodology do not require
large amounts of financial resources and as such, may be used in future microplastic
pollution research in developing nations.
Chapter 5 and Chapter 6 provide baseline microplastic pollution data for three
previously unstudied South African estuaries and their adjacent coastlines. Future
research should include the monitoring of microplastic pollution in more estuaries
throughout South Africa. To date, there is only one published report on microplastic
pollution within estuaries in KZN (Naidoo et al., 2015). The increase in microplastic
monitoring in more South African estuaries and marine environments will provide a
clearer picture of the status of microplastic pollution in South Africa. This research
can be expanded further to include temporal microplastic pollution trends.
Microplastic pollution has been shown to fluctuate between seasons (Cheung et al.,
2016) as a result of changes in rainfall, estuarine mouth status, and general influx of
people in coastal towns during holiday seasons. Future research should include the
seasonal sampling of TOCEs. As TOCEs are only intermittently open to the marine
environment, the effluents derived from these estuaries are only transported into the
marine environment in seasonal periods of increased rainfall (wet season). Seasonal
sampling can allow for identification of potential spatial and temporal patterns of
microplastic pollution from estuaries, which eventually may be used to identify major
point sources of microplastic pollution into individual estuaries. Building on the
temporal analysis of microplastic pollution in estuaries, future research should
include the longitudinal analysis of riverine systems to investigate potential sources
of microplastics in to these freshwater resources.

Chapter 8
123
The use of P. perna as biomonitors of marine microplastic pollution offers an
alternative method of marine microplastic pollution monitoring (Chapter 7). The
results of this study can be used as a baseline of microplastic pollution levels in P.
perna for future research of microplastic bioassessments. Microplastic abundances
were less variable in mussel samples among sites than sediment. This may be
because microplastics accumulate in sediment, whereas mussels continually filter-
feed and egest some microplastics. Microplastics within mussels also help identify
which microplastic types are most bioavailable to the mussels and therefore, which
microplastics are more likely to be ingested by organisms. The results of the study
provide a baseline for the development of a South African microplastic MWP, but
further research is required to develop standardised international protocols for
mussel microplastic monitoring. While further research is required, this study has
shown that P. perna can be used as biomonitors of microplastic pollution in marine
environments. In the interest of developing a national microplastic MWP, it is
recommended that this study be extended to other dominant mussel species, such
as M. galloprovincialis, along the South African coastline. The extension of this study
to other mussel species will not only provide new knowledge of microplastics entering
South African marine food webs, but will also allow microplastic pollution
biomonitoring across all South African marine biomes.
The findings of these future studies will potentially advise policy makers to include
microplastic pollution in estuarine health surveys and potentially introduce legislation
to included more stringent plastic waste management policies in South Africa.
Expanding the scope of microplastic pollution monitoring in South Africa will aid in
raising awareness of the potential threats of microplastic pollution within human and
environmental health sectors. Whilst the prioritization of economic and social
development is vital for the well-being of the people of South Africa, the potential
risks posed by microplastics to human health and ecological integrity cannot be
ignored. Although microplastic pollution has received little national research attention,
this does not mean that the impacts of microplastic pollution are any less important.
At the very least, research in microplastic pollution in South African marine and
freshwater environments is the first step towards maintaining our constitutional
responsibility to ―prevent pollution and ecological degradation‖ and ―promote
conservation‖ (Constitution of the Republic of South Africa Act No. 108 of 1996,

Chapter 8
124
Chapter 2, Section 24). This dissertation has not only contributed new knowledge of
microplastic pollution baseline information in South African estuarine and coastal
environments, but also the first steps towards establishing a nationwide Mussel
Watch Program for microplastic pollution. In this context, it can be concluded that
mussels are indeed, more than just food.

References
125
REFERENCES
Alomar, C., Estarellas, F., and Deudero, S., 2016. Microplastics in the Mediterranean
Sea: deposition in coastal shallow sediments, spatial variation and preferential
grain size. Marine Environmental Research, 115, p. 1-10. [DOI:
10.1016/j.marenvres.2016.01.005]
Amoozadeh, E., Malek, M., Rashidinejad, R., Nabavi, S., Karbassi, M., Ghayoumi,
R., and Sures, B., 2014. Marine organisms as heavy metal bioindicators in the
Persian Gulf and the Gulf of Oman. Environmental Science and Pollution
Research, 21(3), p. 2386-2395. [DOI: 10.1007/s11356-013-1890-8]
Anandraj, A., Marshall, D. J., Gregory, M. A., and McClurg, T. P., 2002. Metal
accumulation, filtration and O2 uptake rates in the mussel Perna perna
(Mollusca: Bivalvia) exposed to Hg2+ Cu2+ and Zn2+. Comparative Biochemistry
and Physiology Part C: Toxicology & Pharmacology, 132(3), p. 355-363. [DOI:
10.1016/S1532-0456(02)00081-9]
Andrady, A.L., 2011. Microplastics in the marine environment. Marine Pollution
Bulletin, 62(8), p. 1596-1605. [DOI: 10.1016/j.marpolbul.2011.05.030]
Arthur, C., Baker, J., and Bamford, H. (eds), 2009. Proceedings of the International
Research Workshop on the Occurrence, Effects, and Fate of Microplastic
Marine Debris, September 9-11, 2008. NOAA Technical Memorandum NOS-
OR&R-30.
Avio, C. G., Gorbi, S., Milan, M., Benedetti, M., Fattorini, D., d'Errico, G., and Regoli,
F., 2015. Pollutants bioavailability and toxicological risk from microplastics to
marine mussels. Environmental Pollution, 198, p. 211-222. [DOI:
10.1016/j.envpol.2014.12.021]
Avio, C.G., Gorbi, S., and Regoli, F., 2017. Plastics and microplastics in the oceans:
From emerging pollutants to emerged threat. Marine Environmental Research,
128, p. 2-11. [DOI: 10.1016/j.marenvres.2016.05.012]
Bakir, A., Rowland, S.J., and Thompson, R.C., 2014. Transport of persistent organic
pollutants by microplastics in estuarine conditions. Estuarine, Coastal and Shelf
Science, 140, p. 14-21. [DOI: 10.1016/j.ecss.2014.01.004]
Barnes, D.K., Galgani, F., Thompson, R.C., and Barlaz, M., 2009. Accumulation and
fragmentation of plastic debris in global environments. Philosophical

References
126
Transactions of the Royal Society of London B: Biological Sciences, 364(1526),
p.1985-1998.
Barrows, A.P., Neumann, C.A., Berger, M.L., and Shaw, S.D., 2017. Grab vs.
neuston tow net: a microplastic sampling performance comparison and possible
advances in the field. Analytical Methods, 9(9), p. 1446-1453. [DOI:
10.1039/C6AY02387H]
Batel, A., Linti, F., Scherer, M., Erdinger, L., and Braunbeck, T., 2016. Transfer of
benzo [a] pyrene from microplastics to Artemia nauplii and further to zebrafish
via a trophic food web experiment: CYP1A induction and visual tracking of
persistent organic pollutants. Environmental Toxicology and Chemistry, 35(7),
p. 1656-1666. [DOI: 10.1002/etc.3361]
Begg, G.W., 1978. The estuaries of Natal, Natal Town and Regional Planning
Commission, Pietermanitzburg, Report 41, p. 41.
Besada, V., Andrade, J.M., Schultze, F., and González, J.J., 2011. Monitoring of
heavy metals in wild mussels (Mytilus galloprovincialis) from the Spanish North-
Atlantic coast. Continental Shelf Research, 31(5), p. 457-465. [DOI:
10.1016/j.csr.2010.04.011]
Besley, A., Vijver, M.G., Behrens, P., and Bosker, T., 2017. A standardized method
for sampling and extraction methods for quantifying microplastics in beach
sand. Marine Pollution Bulletin, 114(1), p. 77-83. [DOI:
10.1016/j.marpolbul.2016.08.055]
Browne, M.A., Crump, P., Niven, S.J., Teuten, E., Tonkin, A., Galloway, T., and
Thompson, R., 2011. Accumulation of microplastic on shorelines woldwide:
sources and sinks. Environmental Science & Technology, 45(21), p. 9175-9179.
[DOI: 10.1021/es201811s]
Browne, M.A., Dissanayake, A., Galloway, T.S., Lowe, D.M., and Thompson, R.C.,
2008. Ingested microscopic plastic translocates to the circulatory system of the
mussel, Mytilus edulis (L.). Environmental Science & Technology, 42(13), p.
5026-5031. [DOI: 10.1021/es800249a]
Calvo-Ugarteburu, G., Raemaekers, S., and Halling, C., 2017. Rehabilitating mussel
beds in Coffee Bay, South Africa: Towards fostering cooperative small-scale
fisheries governance and enabling community upliftment. Ambio, 46(2), p. 214-
226. [DOI: 10.1007/s13280-016-0823-4]

References
127
Canesi, L., Ciacci, C., Bergami, E., Monopoli, M. P., Dawson, K. A., Papa, S., and
Corsi, I., 2015. Evidence for immunomodulation and apoptotic processes
induced by cationic polystyrene nanoparticles in the hemocytes of the marine
bivalve Mytilus. Marine Environmental Research, 111, p. 34-40. [DOI:
10.1016/j.marenvres.2015.06.008]
Carr, K.E., Smyth, S.H., McCullough, M.T., Morris, J.F., and Moyes, S.M., 2012.
Morphological aspects of interactions between microparticles and mammalian
cells: intestinal uptake and onward movement. Progress in Histochemistry and
Cytochemistry, 46(4), p. 185-252. [DOI: 10.1016/j.proghi.2011.11.001]
Carr, S.A., Liu, J., and Tesoro, A.G., 2016. Transport and fate of microplastic
particles in wastewater treatment plants. Water Research, 91, p. 174-182. [DOI:
10.1016/j.watres.2016.01.002]
Catarino, A.I., Thompson, R., Sanderson, W., and Henry, T.B., 2016. Development
and optimization of a standard method for extraction of microplastics in mussels
by enzyme digestion of soft tissues. Supplemental data. Environmental
Toxicology and Chemistry. [DOI: 10.1002/etc.3608]
Cheung, P.K., Cheung, L.T.O., and Fok, L., 2016. Seasonal variation in the
abundance of marine plastic debris in the estuary of a subtropical macro-scale
drainage basin in South China. Science of the Total Environment, 562, p. 658-
665. [DOI: 10.1016/j.scitotenv.2016.04.048]
Chiarelli, R., and Roccheri, M.C., 2014. Marine invertebrates as bioindicators of
heavy metal pollution. Open Journal of Metal, 4(4). [DOI:
10.4236/ojmetal.2014.44011]
Chua, E.M., Shimeta, J., Nugegoda, D., Morrison, P.D., and Clarke, B.O., 2014.
Assimilation of polybrominated diphenyl ethers from microplastics by the marine
amphipod, Allorchestes compressa. Environmental Science & Technology,
48(14), p. 8127-8134. [DOI: 10.1021/es405717z]
Claessens, M., Van Cauwenberghe, L., Vandegehuchte, M.B. and Janssen, C.R.,
2013. New techniques for the detection of microplastics in sediments and field
collected organisms. Marine Pollution Bulletin, 70(1), p. 227 - 233. [DOI:
10.1016/j.marpolbul.2013.03.009]
Cole, M., Lindeque, P., Halsband, C., and Galloway, T. S., 2011. Microplastics as
contaminants in the marine environment: a review. Marine Pollution Bulletin,
62(12), p. 2588-2597. [DOI: 10.1016/j.marpolbul.2011.09.025]

References
128
Cole, M., Webb, H., Lindeque, P.K., Fileman, E.S., Halsband, C., and Galloway, T.S.,
2014. Isolation of microplastics in biota-rich seawater samples and marine
organisms. Scientific Reports, 4, p. 4528. [DOI: 10.1038/srep04528]
Coyle, C., Novaceski, M., Wells, E., and Liboiron, M. 2016. LADI and the trawl. Civic
Laboratory for Environmental Action Research. p .1-80.
Dahms, S., Van der Bank, F.H., and Greenfield, R., 2014. A baseline study of metal
contamination along the Namibian coastline for Perna perna and Choromytilus
meridionalis. Marine Pollution Bulletin, 85(1), p. 297-305. [DOI:
10.1016/j.marpolbul.2014.05.037]
De Vylder, J., Raspoet, R., Dewulf, J., Haesebrouck, F., Ducatelle, R., and Van
Immerseel, F., 2013. Salmonella enteritidis is superior in egg white survival
compared with other Salmonella serotypes. Poultry Science, 92(3), p. 842-845.
[DOI: 10.3382/ps.2012-02668]
De Witte, B., Devriese, L., Bekaert, K., Hoffman, S., Vandermeersch, G., Cooreman,
K., and Robbens, J., 2014. Quality assessment of the blue mussel (Mytilus
edulis): Comparison between commercial and wild types. Marine Pollution
Bulletin, 85(1), p. 146-155. [DOI: 10.1016/j.marpolbul.2014.06.006]
De Witte, B., Devriese, L., Bekaert, K., Hoffman, S., Vandermeersch, G., Cooreman,
K., and Robbens, J., 2014. Quality assessment of the blue mussel (Mytilus
edulis): Comparison between commercial and wild types. Marine Pollution
Bulletin, 85(1), p. 146-155. [DOI: 10.1016/j.marpolbul.2014.06.006]
Degger, N., Wepener, V., Richardson, B.J., and Wu, R.S.S., 2011. Brown mussels
(Perna perna) and semi-permeable membrane devices (SPMDs) as indicators
of organic pollutants in the South African marine environment. Marine Pollution
Bulletin, 63(5), p. 91-97. [DOI: 10.1016/j.marpolbul.2011.04.024]
Dehaut, A., Cassone, A.L., Frère, L., Hermabessiere, L., Himber, C., Rinnert, E.,
Rivière, G., Lambert, C., Soudant, P., Huvet, A., and Duflos, G., 2016.
Microplastics in seafood: benchmark protocol for their extraction and
characterization. Environmental Pollution, 215, p. 223-233. [DOI:
10.1016/j.envpol.2016.05.018]
Dekiff, J. H., Remy, D., Klasmeier, J., and Fries, E., 2014. Occurrence and spatial
distribution of microplastics in sediments from Norderney. Environmental
Pollution, 186, p. 248-256. [DOI: 10.1016/j.envpol.2013.11.019]

References
129
Department of Water Affairs (DWA), South Africa, 2013. Classification of water
resources and determination of the comprehensive reserve and resource quality
objectives in the Mvoti to Umzimkulu water management area (WMA): desktop
estuary ecoclassification and ecological water requirement. Report No.
RDM/WMA11/00/CON/CLA/0313. Prepared by: Rivers for Africa eFlows
Consulting (Pty)Ltd., South Africa.
Depledge, M.H., Galgani, F., Panti, C., Caliani, I., Casini, S., and Fossi, M.C., 2013.
Plastic litter in the sea. Marine Environmental Research, 92, p. 279-281. [DOI:
10.1016/j.marenvres.2013.10.002]
Doughty, R., and Eriksen, M., 2014. The case for a ban on microplastics in personal
care products. Tulane Environmental Law Journal, 27(2), p. 277-298.
Driver, A., Maze, K., Lombard, A.T., Nel, J., Rouget, M., Turpie, J.K., Cowling, R.M.,
Desmet, P., Goodman, P., Harris, J., Jonas, Z., Reyers, B., Sink, K., and
Strauss, T., 2004. South African National Spatial Biodiversity Assessment 2004:
Summary Report. Pretoria: South African National Biodiversity Institute.
DTI (Department of Trade and Industry). 2016. Industrial Policy Action Plan: IPAP
2016/17 _ 2018/19. Pretoria (SA): Government of South Africa.
Eerkes-Medrano, D., Thompson, R.C., and Aldridge, D.C., 2015. Microplastics in
freshwater systems: a review of the emerging threats, identification of
knowledge gaps and prioritisation of research needs. Water Research, 75, p.
63-82. [DOI: 10.1016/j.watres.2015.02.012]
Eriksen, M., Lebreton, L. C., Carson, H. S., Thiel, M., Moore, C. J., Borerro, J. C.,
and Reisser, J., 2014. Plastic pollution in the world's oceans: more than 5 trillion
plastic pieces weighing over 250,000 tons afloat at sea. PloS ONE, 9(12). [DOI:
10.1371/journal.pone.0111913]
Eriksen, M., Mason, S., Wilson, S., Box, C., Zellers, A., Edwards, W., Farley, H., and
Amato, S., 2013. Microplastic pollution in the surface waters of the Laurentian
Great Lakes. Marine Pollution Bulletin, 77(1), p. 177-182. [DOI:
10.1016/j.marpolbul.2013.10.007]
Farrell, P., and Nelson, K., 2013. Trophic level transfer of microplastic: Mytilus edulis
(L.) to Carcinus maenas (L.). Environmental Pollution, 177, p. 1-3. [DOI:
10.1016/j.envpol.2013.01.046]

References
130
Fendall, L.S., and Sewell, M.A., 2009. Contributing to marine pollution by washing
your face: microplastics in facial cleansers. Marine Pollution Bulletin, 58(8), p.
1225-1228. [DOI: 10.1016/j.marpolbul.2009.04.025]
Foekema, E.M., De Gruijter, C., Mergia, M.T., van Franeker, J.A., Murk, A.J., and
Koelmans, A.A., 2013. Plastic in north sea fish. Environmental Science &
Technology, 47(15), p. 8818-8824. [DOI: 10.1021/es400931b]
Fok, L., and Cheung, P.K., 2015. Hong Kong at the Pearl River Estuary: A hotspot of
microplastic pollution. Marine Pollution Bulletin, 99(1), p. 112-118. [DOI:
10.1016/j.marpolbul.2015.07.050]
Freimann, R., Bürgmann, H., Findlay, S.E., and Robinson, C.T., 2013. Bacterial
structures and ecosystem functions in glaciated floodplains: contemporary
states and potential future shifts. ISME Journal, 7(12), p. 2361-2373. [DOI:
10.1038/ismej.2013.114]
Frère, L., Paul-Pont, I., Rinnert, E., Petton, S., Jaffré, J., Bihannic, I., Soudant, P.,
Lambert, C., and Huvet, A., 2017. Influence of environmental and
anthropogenic factors on the composition, concentration and spatial distribution
of microplastics: A case study of the Bay of Brest (Brittany, France).
Environmental Pollution, 225, p. 211-222. [DOI: 10.1016/j.envpol.2017.03.023]
Gago, J., Galgani, F., Maes, T., and Thompson, R.C., 2016. Microplastics in
seawater: Recommendations from the Marine Strategy Framework Directive
Implementation Process. Frontiers in Marine Science, 3, p. 219. [DOI:
10.3389/fmars.2016.00219]
Gallagher, A., Rees, A., Rowe, R., Stevens, J., and Wright, P., 2016. Microplastics in
the Solent estuarine complex, UK: An initial assessment. Marine Pollution
Bulletin, 102(2), p. 243-249. [DOI: 10.1016/j.marpolbul.2015.04.002]
Gerber, G., 2015. Ingestion and filtration rates of microplastic fibres by Perna perna
(L.) (BSc. Honours thesis, School of Life Sciences, University of KwaZuulu-
Natal).
Goldberg, E.D., 1975. The mussel watch: a first step in global marine monitoring.
Marine Pollution Bulletin, 6 (1975), p. 111-132.
Goldstein, M.C., and Goodwin, D.S., 2013. Gooseneck barnacles (Lepas spp.) ingest
microplastic debris in the North Pacific Subtropical Gyre. PeerJ, 1, p. 184. [DOI:
10.7717/peerj.184]

References
131
Greenfield, R., Brink, K., Degger, N., and Wepener, V., 2014. The usefulness of
transplantation studies in monitoring of metals in the marine environment: South
African experience. Marine Pollution Bulletin, 85(2), p. 566-573. [DOI:
10.1016/j.marpolbul.2014.03.032]
Guastella, L.A., 1994. A quantitative assessment of recreational angling in Durban
Harbour, South Africa. South African Journal of Marine Science, 14(1), p.187-
203. [DOI: 10.2989/025776194784287120]
Heintzman, R. 2009. List of free software for microscopy.
[https://nic.med.harvard.edu/sites/nic.med.harvard.edu/files/user_files/ListofFre
eSoftware.pdf] [Accessed 12/06/2015]
Helm, P.A., 2017. Improving microplastics source apportionment: a role for
microplastic morphology and taxonomy? Analytical Methods, 9(9), p. 1328-
1331. [DOI: 10.1039/C7AY90016C]
Hidalgo-Ruz, V., Gutow, L., Thompson, R.C., and Thiel, M., 2012. Microplastics in
the marine environment: a review of the methods used for identification and
quantification. Environmental Science & Technology, 46(6), p. 3060-3075. [DOI:
10.1021/es2031505]
Ivar do Sul, J.A., and Costa, M.F., 2013. Plastic pollution risks in an estuarine
conservation unit. Journal of Coastal Research, 65(sp1), p. 48-53. [DOI:
10.2112/SI65-009.1]
Ivar do Sul, J.A., and Costa, M.F., 2014. The present and future of microplastic
pollution in the marine environment. Environmental Pollution, 185, p. 352-364.
[DOI: 10.1007/s11270-014-2004-z]
Joint Group of Experts on Scientific Aspects of Marine Environmental Protection
(GESAMP), 2015. Sources, fates and effects of microplastics in the marine
environment: a global assessment. (Kershaw, P.J., ed.). (IMO/FAO/UNESCO-
IOC/UNIDO/WMO/IAEA/UN/UNEP/UNDP Joint Group of Experts on the
Scientific Aspects of Marine Environmental Protection). Rep. Stud. GESAMP
No. 90, p. 96.
Jungerstam, J., Erlandsson, J., McQuaid, C.D., Porri, F., Westerbom, M., and
Kraufvelin, P., 2014. Is habitat amount important for biodiversity in rocky shore
systems? A study of South African mussel assemblages. Marine Biology,
161(7), p. 1507-1519. [DOI: 10.1007/s00227-014-2436-4]

References
132
Kacar, A., Pazi, I., Gonul, T., and Kucuksezgin, F., 2016. Marine pollution risk in a
coastal city: use of an eco-genotoxic tool as a stress indicator in mussels from
the Eastern Aegean Sea. Environmental Science and Pollution Research,
23(16), p. 16067-16078. [DOI: 10.1007/s11356-016-6783-1]
Karami, A., Golieskardi, A., Choo, C.K., Larat, V., Galloway, T.S., and Salamatinia,
B., 2017. The presence of microplastics in commercial salts from different
countries. Scientific Reports, 7. [DOI:10.1038/srep46173]
Karami, A., Golieskardi, A., Choo, C.K., Romano, N., Ho, Y.B., and Salamatinia, B.,
2016. A high-performance protocol for extraction of microplastics in fish.
Science of the Total Environment, 578, p. 485-494. [DOI:
10.1016/j.scitotenv.2016.10.213]
Kedzierski, M., Le Tilly, V., Bourseau, P., Bellegou, H., César, G., Sire, O., and
Bruzaud, S., 2016. Microplastics elutriation from sandy sediments: A
granulometric approach. Marine Pollution Bulletin, 107(1), p. 315-323. [DOI:
10.1016/j.marpolbul.2016.03.041]
Kilponen, J., 2016. Microplastics and harmful substances in urban runoffs and landfill
leachates: possible emission sources to marine environment. [URL:
http://urn.fi/URN:NBN:fi:amk-2016061713159] [Accessed 2 January 2017]
Kuo, F.J., and Huang, H.W., 2014. Strategy for mitigation of marine debris: analysis
of sources and composition of marine debris in northern Taiwan. Marine
Pollution Bulletin, 83(1), p. 70-78. [DOI: 10.1016/j.marpolbul.2014.04.019]
Laglbauer, B.J., Franco-Santos, R.M., Andreu-Cazenave, M., Brunelli, L., Papadatou,
M., Palatinus, A., Grego, M., and Deprez, T., 2014. Macrodebris and
microplastics from beaches in Slovenia. Marine Pollution Bulletin, 89(1), p. 356-
366. [DOI: 10.1016/j.marpolbul.2014.09.036]
Lamprecht, A., 2013. The abundance, distribution and accumulation of plastic debris
in Table Bay, Cape Town, South Africa (MSc. dissertation, Department of
Biological Sciences, University of Cape Town).
Lebreton, L.M., Greer, S.D., and Borrero, J.C., 2012. Numerical modelling of floating
debris in the world‘s oceans. Marine Pollution Bulletin, 64(3), pp. 653-661. [DOI:
10.1016/j.marpolbul.2011.10.027]
Lebreton, L.C., Van der Zwet, J., Damsteeg, J.W., Slat, B., Andrady, A., and Reisser,
J., 2017. River plastic emissions to the world‘s oceans. Nature
Communications, 8. [DOI: 10.1038/ncomms15611]

References
133
Lehmussola, A., Ruusuvuori, P., Selinummi, J., Rajala, T., and Yli-Harja, O., 2008.
Synthetic images of high-throughput microscopy for validation of image analysis
methods. Proceedings of the IEEE, 96(8), p. 1348-1360. [DOI:
10.1109/JPROC.2008.925490]
Li, J., Qu, X., Su, L., Zhang, W., Yang, D., Kolandhasamy, P., Li, D., and Shi, H.,
2016. Microplastics in mussels along the coastal waters of China.
Environmental Pollution, 214, p. 177-184. [DOI: 10.1016/j.envpol.2016.04.012]
Li, J., Yang, D., Li, L., Jabeen, K., and Shi, H., 2015. Microplastics in commercial
bivalves from China. Environmental Pollution, 207, p. 190-195. [DOI:
10.1016/j.envpol.2015.09.018]
Lima, A.R.A., Barletta, M., and Costa, M.F., 2015. Seasonal distribution and
interactions between plankton and microplastics in a tropical estuary. Estuarine,
Coastal and Shelf Science, 165, p. 213-225. [DOI: 10.1016/j.ecss.2015.05.018]
Liu, F., Wang, D. Z., and Wang, W. X. 2012. Cadmium‐induced changes in trace
element bioaccumulation and proteomics perspective in four marine
bivalves. Environmental Toxicology and Chemistry, 31(6), p. 1292-1300. [DOI:
10.1002/etc.1823]
Lobelle, D., and Cunliffe, M. 2011. Early microbial biofilm formation on marine plastic
debris. Marine Pollution Bulletin, 62(1), p. 197-200. [DOI:
10.1016/j.marpolbul.2010.10.013]
Löder, M.G., and Gerdts, G., 2015. Methodology used for the detection and
identification of microplastics—A critical appraisal. In Marine Anthropogenic
Litter (p. 201-227). Springer International Publishing, Cham. [DOI: 10.1007/978-
3-319-16510-3_8]
Lots, F.A., Behrens, P., Vijver, M.G., Horton, A.A., and Bosker, T., 2017. A large-
scale investigation of microplastic contamination: Abundance and
characteristics of microplastics in European beach sediment. Marine Pollution
Bulletin, 123(1-2), p. 219-226. [DOI: 10.1016/j.marpolbul.2017.08.057]
Luís, L. G., Ferreira, P., Fonte, E., Oliveira, M., and Guilhermino, L. 2015. Does the
presence of microplastics influence the acute toxicity of chromium (VI) to early
juveniles of the common goby (Pomatoschistus microps)? A study with juveniles
from two wild estuarine populations. Aquatic Toxicology, 164, p. 163-174. [DOI:
10.1016/j.aquatox.2015.04.018].

References
134
Lusher, A.L., McHugh, M., and Thompson, R.C., 2013. Occurrence of microplastics
in the gastrointestinal tract of pelagic and demersal fish from the English
Channel. Marine Pollution Bulletin, 67(1), p. 94-99. [DOI:
10.1016/j.marpolbul.2012.11.028]
Lusher, A.L., Welden, N.A., Sobral, P., and Cole, M., 2017. Sampling, isolating and
identifying microplastics ingested by fish and invertebrates. Analytical Methods.
9, p. 1346-1360. [DOI: 10.1039/C6AY02415G]
Maes, T., Jessop, R., Wellner, N., Haupt, K., and Mayes, A.G., 2017. A rapid-
screening approach to detect and quantify microplastics based on fluorescent
tagging with Nile Red. Scientific Reports, 7. [DOI: 10.1038/srep44501]
Mahon, A.M., Officer, R., Nash, R., and O‘Connor, I. 2017. Scope, fate, risks and
impacts of microplastic pollution in Irish freshwater systems. EPA Final Report.
Environmental Protection Agency, Wexford, Ireland.
Marine Strategy Framework Directive (MSFD), 2013. Guidance on monitoring of
marine litter in European Seas. Technical Report EUR 26113 EN. Joint
Research Commission (JRC) Scientific and Policy Reports. European
Commission.
Martínez-Gómez, C., Robinson, C.D., Burgeot, T., Gubbins, M., Halldorsson, H.P.,
Albentosa, M., Bignell, J.P., Hylland, K., and Vethaak, A.D., 2017. Biomarkers
of general stress in mussels as common indicators for marine biomonitoring
programmes in Europe: The ICON experience. Marine Environmental
Research, 124, p. 70-80. [DOI: 10.1016/j.marenvres.2015.10.012]
Mathalon, A., and Hill, P., 2014. Microplastic fibers in the intertidal ecosystem
surrounding Halifax Harbor, Nova Scotia. Marine Pollution Bulletin, 81(1), p. 69-
79. [DOI: 10.1016/j.marpolbul.2014.02.018]
Moore, C.J., 2008. Synthetic polymers in the marine environment: a rapidly
increasing, long-term threat. Environmental Research, 108(2), p. 131-139. [DOI:
10.1016/j.envres.2008.07.025]
Moreira, F.T., Prantoni, A.L., Martini, B., de Abreu, M.A., Stoiev, S.B., and Turra, A.,
2016. Small-scale temporal and spatial variability in the abundance of plastic
pellets on sandy beaches: methodological considerations for estimating the
input of microplastics. Marine Pollution Bulletin, 102(1), p. 114-121. [DOI:
10.1016/j.marpolbul.2015.11.051]

References
135
Naidoo, T., Glassom, D., and Smit, A. J., 2015. Plastic pollution in five urban
estuaries of KwaZulu-Natal, South Africa. Marine Pollution Bulletin, 101(1), p.
473-480. [DOI: 10.1016/j.marpolbul.2015.09.044]
Naidoo, T., Smit, A.J., and Glassom, D., 2016. Plastic ingestion by estuarine mullet
Mugil cephalus (Mugilidae) in an urban harbour, KwaZulu-Natal, South Africa.
African Journal of Marine Science, 38(1), p. 145-149. [DOI:
10.2989/1814232X.2016.1159616]
Napper, I.E., and Thompson, R.C., 2016. Release of synthetic microplastic plastic
fibres from domestic washing machines: Effects of fabric type and washing
conditions. Marine Pollution Bulletin, 112(1), p. 39-45. [DOI:
10.1016/j.marpolbul.2016.09.025]
Nel, H. A., and Froneman, P. W., 2015. A quantitative analysis of microplastic
pollution along the south-eastern coastline of South Africa. Marine Pollution
Bulletin, 101(1), p. 274-279. [DOI: 10.1016/j.marpolbul.2015.09.043]
Nel, H.A., Dalu, T., and Wasserman, R.J., 2018. Sinks and sources: Assessing
microplastic abundance in river sediment and deposit feeders in an Austral
temperate urban river system. Science of the Total Environment, 612, p. 950-
956. [DOI: 10.1016/j.scitotenv.2017.08.298]
Nel, H.A., Hean, J.W., Noundou, X.S., and Froneman, P.W., 2017. Do microplastic
loads reflect the population demographics along the southern African
coastline?. Marine Pollution Bulletin, 115(1), p. 115-119. [DOI:
10.1016/j.marpolbul.2016.11.056]
Norén, F., 2008. Small plastic particles in coastal Swedish waters, Lysekil: KIMO
Sweden, p. 11.
Nuelle, M.T., Dekiff, J.H., Remy, D., and Fries, E., 2014. A new analytical approach
for monitoring microplastics in marine sediments. Environmental Pollution, 184,
p. 161-169. [DOI: 10.1016/j.envpol.2013.07.027]
Oliveira, G.F.M., do Couto, M.C.M., de Freitas Lima, M., and do Bomfim, T.C.B.,
2016. Mussels (Perna perna) as bioindicator of environmental contamination by
Cryptosporidium species with zoonotic potential. International Journal for
Parasitology: Parasites and Wildlife, 5(1), p. 28-33. [DOI:
10.1016/j.ijppaw.2016.01.004]
Phuong, N.N., Zalouk-Vergnoux, A., Kamari, A., Mouneyrac, C., Amiard, F., Poirier,
L., and Lagarde, F., 2017. Quantification and characterization of microplastics in

References
136
blue mussels (Mytilus edulis): protocol setup and preliminary data on the
contamination of the French Atlantic coast. Environmental Science and
Pollution Research, p. 1-10. [DOI: 10.1007/s11356-017-8862-3]
Phuong, N.N., Zalouk-Vergnoux, A., Poirier, L., Kamari, A., Châtel, A., Mouneyrac,
C., and Lagarde, F., 2016. Is there any consistency between the microplastics
found in the field and those used in laboratory experiments? Environmental
Pollution, 211, p. 111-123. [DOI: 10.1016/j.envpol.2015.12.035]
Picker M.D., and Griffiths C.L., 2011. Alien and Invasive Animals – A South African
Perspective. Randomhouse/Struik Cape Town, p. 240.
Pillay, S., 2015. Linking nitrogen pollution in estuaries to rocky shores: A stable
isotope approach. (Masters dissertation, School of Life Sciences, University of
KwaZulu-Natal, Westville Campus)
Plastics SA. 2016. Plastics facts and figures. [http://www.plasticsinfo.co.za/industry-
news/] [Accessed 10 July 2017]
Qiu, Q., Tan, Z., Wang, J., Peng, J., Li, M., and Zhan, Z., 2016. Extraction,
enumeration and identification methods for monitoring microplastics in the
environment. Estuarine, Coastal and Shelf Science, 176, p. 102-109. [DOI:
10.1016/j.ecss.2016.04.012]
Rech, S., Macaya-Caquilpán, V., Pantoja, J.F., Rivadeneira, M.M., Madariaga, D.J.,
and Thiel, M., 2014. Rivers as a source of marine litter–a study from the SE
Pacific. Marine Pollution Bulletin, 82(1), p. 66-75. [DOI:
10.1016/j.marpolbul.2014.03.019]
Resgalla Jr, C., Brasil, E.D.S., and Salomão, L.C., 2007. The effect of temperature
and salinity on the physiological rates of the mussel Perna perna (Linnaeus
1758). Brazilian Archives of Biology and Technology, 50(3), p. 543-556. [DOI:
10.1590/S1516-89132007000300019]
Richir, J., and Gobert, S., 2016. An ecophysiological discussion of trace element
bioaccumulation in cultured Mytilus galloprovincialis. Belgian Journal of
Zoology, 145(1), p. 53-61.
Rist, S.E., Assidqi, K., Zamani, N.P., Appel, D., Perschke, M., Huhn, M., and Lenz,
M., 2016. Suspended micro-sized PVC particles impair the performance and
decrease survival in the Asian green mussel Perna viridis. Marine Pollution
Bulletin, 111(1), p. 213-220. [DOI: 10.1016/j.marpolbul.2016.07.006]

References
137
Robinson, T.B., Griffiths, C.L., McQuaid, C.D., and Rius, M., 2005. Marine alien
species of South Africa—status and impacts. African Journal of Marine Science,
27(1), p. 297-306.
Rocha-Santos, T., and Duarte, A.C., 2015. A critical overview of the analytical
approaches to the occurrence, the fate and the behavior of microplastics in the
environment. Trends in Analytical Chemistry, 65, p. 47-53. [DOI:
10.1016/j.trac.2014.10.011]
Rochman, C.M., Kross, S.M., Armstrong, J.B., Bogan, M.T., Darling, E.S., Green,
S.J., Smyth, A.R., and Veríssimo, D., 2015. Scientific evidence supports a ban
on microbeads. Environmental Science & Technology, 49(18), p. 10759-10761.
[DOI: 10.1021/acs.est.5b03909]
Rochman, C.M., Regan, F., and Thompson, R.C., 2017. On the harmonization of
methods for measuring the occurrence, fate and effects of microplastics.
Analytical Methods, 9(9), p. 1324-1325. [DOI: 10.1039/C7AY90014G]
Rodríguez-Seijo, A., and Pereira, R., 2017. Morphological and physical
characterization of microplastics. Comprehensive Analytical Chemistry. 75, p.
49-66. [DOI: 10.1016/bs.coac.2016.10.007]
Ryan, P.G., and Moloney, C.L., 1990. Plastic and other artefacts on South African
beaches: Temporal trends in abundance and composition. South African
Journal of Science, 86(7), p. 450-452.
Ryan, P.G., 1988. The characteristics and distribution of plastic particles at the sea-
surface off the southwestern Cape Province, South Africa. Marine
Environmental Research, 25(4), p. 249-273. [DOI: 10.1016/0141-
1136(88)90015-3]
SANCOR (Compiler). 1985. SANCOR: Summary report on marine research 1985.
National Scientific Programmes Unit: CSIR, SANSP Report 123, p. 63.
Santana, M.F.M., Ascer, L.G., Custódio, M.R., Moreira, F.T., and Turra, A., 2016.
Microplastic contamination in natural mussel beds from a Brazilian urbanized
coastal region: Rapid evaluation through bioassessment. Marine Pollution
Bulletin, 106(1), p. 183-189. [DOI: 10.1016/j.marpolbul.2016.02.074]
Scharler, U.M., 2012. Ecosystem development during open and closed phases of
temporarily open/closed estuaries on the subtropical east coast of South Africa.
Estuarine, Coastal and Shelf Science, 108, p. 119-131. [DOI:
10.1016/j.ecss.2011.08.003]

References
138
Selinummi, J., Seppala, J., Yli-Harja, O., and Puhakka, J.A., 2005. Software for
quantification of labeled bacteria from digital microscope images by automated
image analysis. Biotechniques, 39(6), p. 859. [DOI: 10.2144/000112018]
Setälä, O., Fleming-Lehtinen, V., and Lehtiniemi, M., 2014. Ingestion and transfer of
microplastics in the planktonic food web. Environmental Pollution, 185, p. 77-83.
[DOI: 10.1016/j.envpol.2013.10.013]
Solomon, O.O., and Palanisami, T., 2016. Microplastics in the marine environment:
current status, assessment methodologies, impacts and solutions. Journal of
Pollution Effects & Control, 4(161) p. 1-13. [DOI: 10.4172/2375-4397.1000161]
Song, Y.K., Hong, S.H., Jang, M., Han, G.M., Rani, M., Lee, J., and Shim, W.J.,
2015. A comparison of microscopic and spectroscopic identification methods for
analysis of microplastics in environmental samples. Marine Pollution Bulletin,
93(1), p. 202-209. [DOI: 10.1016/j.marpolbul.2015.01.015]
Sparks, C., Odendaal, J., and Snyman, R., 2014. An analysis of historical Mussel
Watch Programme data from the west coast of the Cape Peninsula, Cape
Town. Marine Pollution Bulletin, 87(1), p. 374-380. [DOI:
10.1016/j.marpolbul.2014.07.047]
Srisunont, C., and Babel, S., 2015. Uptake, release, and absorption of nutrients into
the marine environment by the green mussel (Perna viridis). Marine Pollution
Bulletin, 97(1), p. 285-293. [DOI: 10.1016/j.marpolbul.2015.06.004]
Stolte, A., Forster, S., Gerdts, G., and Schubert, H., 2015. Microplastic
concentrations in beach sediments along the German Baltic coast. Marine
Pollution Bulletin, 99(1), p. 216-229. [DOI: 10.1016/j.marpolbul.2015.07.022]
Syberg, K., Khan, F.R., Selck, H., Palmqvist, A., Banta, G.T., Daley, J., Sano, L., and
Duhaime, M.B., 2015. Microplastics: addressing ecological risk through lessons
learned. Environmental Toxicology and Chemistry, 34(5), p. 945-953. [DOI:
10.1002/etc.2914]
Tagg, A.S., Sapp, M., Harrison, J.P., and Ojeda, J.J., 2015. Identification and
quantification of microplastics in wastewater using focal plane array-based
reflectance micro-FT-IR imaging. Analytical Chemistry, 87(12), p. 6032-6040.
[DOI: 10.1021/acs.analchem.5b00495]
Tao, Y., Yuan, Z., Xiaona, H., and Wei, M., 2012. Distribution and bioaccumulation of
heavy metals in aquatic organisms of different trophic levels and potential

References
139
health risk assessment from Taihu lake, China. Ecotoxicology and
environmental safety, 81, p. 55-64. [DOI: 10.1016/j.ecoenv.2012.04.014]
Teuten, E.L., Rowland, S.J., Galloway, T.S., and Thompson, R.C., 2007. Potential for
plastics to transport hydrophobic contaminants. Environmental Science &
Technology, 41(22), p. 7759-7764. [DOI: 10.1021/es071737s]
Thompson, R.C., Moore, C.J., Vom Saal, F.S., and Swan, S.H., 2009. Plastics, the
environment and human health: current consensus and future trends.
Philosophical Transactions of the Royal Society of London B: Biological
Sciences, 364(1526), p. 2153-2166. [DOI: 10.1098/rstb.2009.0053]
Thompson, R.C., Olsen, Y., Mitchell, R.P., Davis, A., Rowland, S.J., John, A.W.,
McGonigle, D., and Russell, A.E., 2004. Lost at sea: where is all the plastic?.
Science, 304(5672), p. 838-838. [DOI: 10.1126/science.1094559]
Tosti, E., and Gallo, A., 2012. Best biomarker and bioindicator for marine
environmental pollution. Journal of Marine Science Research & Development,
2(2).
Turra, A., Manzano, A.B., Dias, R.J.S., Mahiques, M.M., Barbosa, L., Balthazar-Silva,
D., and Moreira, F.T., 2014. Three-dimensional distribution of plastic pellets in
sandy beaches: shifting paradigms. Scientific Reports, 4. [DOI:
10.1038/srep04435]
United Nations Environment Programme (UNEP), 2016. Marine plastic debris and
microplastics – global lessons and research to inspire action and guide policy
change. United Nations Environment Programme, Nairobi.
Van Cauwenberghe, L., and Janssen, C. R., 2014. Microplastics in bivalves cultured
for human consumption. Environmental Pollution, 193, p. 65-70. [DOI:
10.1016/j.envpol.2014.06.010]
Van Cauwenberghe, L., Devriese, L., Galgani, F., Robbens, J., and Janssen, C. R.,
2015. Microplastics in sediments: a review of techniques, occurrence and
effects. Marine Environmental Research, 111, p. 5-17. [DOI:
10.1016/j.marenvres.2015.06.007]
Van Niekerk, L., and Turpie, J.K., 2012. South African National Biodiversity
Assessment 2011: Technical Report. Volume 3: Estuary Component. CSIR
Report Number CSIR/NRE/ECOS/ER/2011/0045/B. Council for Scientific and
Industrial Research, Stellenbosch.

References
140
Vandermeersch, G., Van Cauwenberghe, L., Janssen, C.R., Marques, A., Granby,
K., Fait, G., Kotterman, M.J., Diogène, J., Bekaert, K., Robbens, J., and
Devriese, L., 2015. A critical view on microplastic quantification in aquatic
organisms. Environmental Research, 143, p. 46-55. [DOI:
10.1016/j.envres.2015.07.016]
Vermeiren, P., Muñoz, C.C., and Ikejima, K., 2016. Sources and sinks of plastic
debris in estuaries: A conceptual model integrating biological, physical and
chemical distribution mechanisms. Marine Pollution Bulletin, 113(1), p. 7-16.
[DOI: 10.1016/j.marpolbul.2016.10.002]
Vermeulen, L. A., and Wepener, V. 1999. Spatial and temporal variations of metals in
Richards Bay Harbour (RBH), South Africa. Marine Pollution Bulletin,39(1), p.
304- 307 [DOI: 10.1016/S0025-326X(99)00083-1]
Verster, C., Minnaar, K., and Bouwman, H., 2017. Marine and freshwater
microplastic research in South Africa. Integrated Environmental Assessment
and Management, 13(3), p. 533-535. [DOI: 10.1002/ieam.1900]
Von Moos, N., Burkhardt-Holm, P., and K hler, A., 2012. Uptake and effects of
microplastics on cells and tissue of the blue mussel Mytilus edulis L. after an
experimental exposure. Environmental Science & Technology, 46(20), p.
11327-11335. [DOI: 10.1021/es302332w]
Vosloo, D., Sara, J., and Vosloo, A., 2012. Acute responses of brown mussel (Perna
perna) exposed to sub-lethal copper levels: Integration of physiological and
cellular responses. Aquatic Toxicology, 106, p. 1-8. [DOI:
10.1016/j.aquatox.2011.10.001]
Wagner, M., Scherer, C., Alvarez-Muñoz, D., Brennholt, N., Bourrain, X., Buchinger,
S., Fries, E., Grosbois, C., Klasmeier, J., Marti, T., and Rodriguez-Mozaz, S.,
2014. Microplastics in freshwater ecosystems: what we know and what we need
to know. Environmental Sciences Europe, 26(1), p. 12. [DOI: 10.1186/s12302-
014-0012-7]
Wang, J., Tan, Z., Peng, J., Qiu, Q., and Li, M., 2016. The behaviors of microplastics
in the marine environment. Marine Environmental Research, 113, p. 7-17. [DOI:
10.1016/j.marenvres.2015.10.014]
Watts, A.J., Lewis, C., Goodhead, R.M., Beckett, S.J., Moger, J., Tyler, C.R., and
Galloway, T.S., 2014. Uptake and retention of microplastics by the shore crab

References
141
Carcinus maenas. Environmental Science & Technology, 48(15), p. 8823-8830.
[DOI: 10.1021/es501090e]
Wegner, A., Besseling, E., Foekema, E. M., Kamermans, P., and Koelmans, A. A.,
2012. Effects of nanopolystyrene on the feeding behavior of the blue mussel
(Mytilus edulis L.). Environmental Toxicology and Chemistry, 31(11), p. 2490-
2497. [DOI: 10.1002/etc.1984]
Wepener, V., and Degger, N., 2012. Status of marine pollution research in South
Africa (1960–present). Marine Pollution Bulletin, 64(7), p. 1508-1512. [DOI:
10.1016/j.marpolbul.2012.05.037]
Wesch, C., Bredimus, K., Paulus, M., and Klein, R., 2016. Towards the suitable
monitoring of ingestion of microplastics by marine biota: A review.
Environmental Pollution, 218, p. 1200-1208. [DOI:
10.1016/j.envpol.2016.08.076]
Whitfield, A.K., and Baliwe, N.G., 2013. A century of science in South African
estuaries: Bibliography and review of research trends (p. 289). South African
Institute for Aquatic Biodiversity (SAIAB).
Whitfield, A.K., 1992. A characterization of southern African estuarine systems.
Southern African Journal of Aquatic Science, 18(1-2), p. 89-103. [DOI:
10.1080/10183469.1992.9631327]
Woodall, L.C., Gwinnett, C., Packer, M., Thompson, R.C., Robinson, L.F., and
Paterson, G.L., 2015. Using a forensic science approach to minimize
environmental contamination and to identify microfibres in marine sediments.
Marine Pollution Bulletin, 95(1), p. 40-46.[DOI:10.1016/j.marpolbul.2015.04.044]
Wright, S. L., Thompson, R. C., and Galloway, T. S., 2013. The physical impacts of
microplastics on marine organisms: a review. Environmental Pollution, 178, p.
483-492. [DOI: 10.1016/j.envpol.2013.02.031]
Yang, D., Shi, H., Li, L., Li, J., Jabeen, K., and Kolandhasamy, P., 2015. Microplastic
pollution in table salts from China. Environmental Science & Technology,
49(22), p. 13622-13627. [DOI: 10.1021/acs.est.5b03163]
Yap, C.K., Ismail, A., and Tan, S.G., 2004. Heavy metal (Cd, Cu, Pb and Zn)
concentrations in the green-lipped mussel Perna viridis (Linnaeus) collected
from some wild and aquacultural sites in the west coast of Peninsular Malaysia.
Food Chemistry, 84(4), p. 569-575. [DOI: 10.1016/S0308-8146(03)00280-2]
References
142
Zardi, G.I., Nicastro, K.R., McQuaid, C.D., Rius, M., and Porri, F., 2006.
Hydrodynamic stress and habitat partitioning between indigenous (Perna perna)
and invasive (Mytilus galloprovincialis) mussels: constraints of an evolutionary
strategy. Marine Biology, 150(1), p. 79-88. [DOI: 10.1007/s00227-006-0328-y]
Zarfl, C., Fleet, D., Fries, E., Galgani, F., Gerdts, G., Hanke, G., and Matthies, M.,
2011. Microplastics in oceans. Marine Pollution Bulletin, (62), p. 1589-1591.
[DOI: 10.1016/j.marpolbul.2011.02.040]
Zhao, S., Zhu, L., and Li, D., 2015. Microplastic in three urban estuaries, China.
Environmental Pollution, 206, p. 597-604. [DOI: 10.1016/j.envpol.2015.08.027]
Zhao, S., Zhu, L., Wang, T., and Li, D., 2014. Suspended microplastics in the surface
water of the Yangtze Estuary System, China: first observations on occurrence,
distribution. Marine Pollution Bulletin, 86(1), p. 562-568. [DOI:
10.1016/j.marpolbul.2014.06.032]
Ziccardi, L.M., Edgington, A., Hentz, K., Kulacki, K.J., and Kane Driscoll, S., 2016.
Microplastics as vectors for bioaccumulation of hydrophobic organic chemicals
in the marine environment: A state‐of‐the‐science review. Environmental
Toxicology and Chemistry, 35(7), p. 1667-1676. [DOI: 10.1002/etc.3461]

Appendix A
143
APPENDIX A
Table A 1: Ecological categories of South African estuaries based on Present
Ecological State (PES) (DWA, 2013).
PES Description
A Unmodified, natural.
B Largely natural with a few modifications. A small change in natural
habitats and biota may have taken place but the ecosystem,
functions and processes are essentially unchanged.
C Moderately modified. A loss and change of natural habitat and biota
have occurred but the basic ecosystem functions and processes are
still predominantly unchanged.
D Largely modified. A loss and change of natural habitat, biota and
ecosystem functions and processes have occurred.
E Seriously modified. The loss of natural habitat, biota and basic
ecosystem functions and processes are extensive.
F Critically/Extremely modified. Modifications have reached a critical
level and the system has been modified completely with an almost
complete loss of natural habitat and biota. In the worst instances the
basic ecosystem functions and processes have been destroyed and
the changes are irreversible.

Appendix A
144
Table A 2: Geographic co-ordinates of sample stations. Estuary names noted
as MH (Mhlangeni Estuary), KO (Kongweni Estuary) or BL (Bilanhlolo Estuary).
Direction from estuary mouth noted as N (North) or S (South). Number denotes
distance (m) away from estuary mouth. *No rocky shore present.
Station ID Code Latitude Longitude
MH-N-2000 30°48'13.91"S 30°24'52.25"E
MH-N-1000 30°48'45.05"S 30°24'41.82"E
MH-N-500 30°48'57.59"S 30°24'33.19"E
MH-N-0 30°49'8.92"S 30°24'17.53"E
MH-S-0 30°49'11.14"S 30°24'16.10"E
MH-S-500 30°49'28.88"S 30°24'18.94"E
MH-S-1000 30°49'45.32"S 30°24'12.23"E
MH-S-2000 30°50'5.95"S 30°23'45.70"E
KO-N-2000 30°50'58.07"S 30°23'18.76"E
KO-N-1000 30°51'20.46"S 30°22'53.59"E
KO-N-500* 30°51'30.07"S 30°22'36.86"E
KO-N-0 30°51'37.06"S 30°22'22.53"E
KO-S-0 30°51'38.07"S 30°22'21.05"E
KO-S-500 30°51'55.07"S 30°22'19.15"E
KO-S-1000 30°52'12.20"S 30°22'11.64"E
KO-S-2000 30°52'34.39"S 30°21'46.06"E
BL-N-2000 30°52'34.78"S 30°21'45.09"E
BL-N-1000 30°53'1.19"S 30°21'23.38"E
BL-N-500 30°53'14.12"S 30°21'12.74"E
BL-N-0 30°53'20.52"S 30°20'56.19"E
BL-S-0 30°53'22.15"S 30°20'54.44"E
BL-S-500 30°53'36.38"S 30°20'55.31"E
BL-S-1000 30°53'50.25"S 30°20'48.68"E
BL-S-2000 30°54'15.04"S 30°20'28.58"E

Appendix B
145
APPENDIX B: PERMIT

Appendix B
146
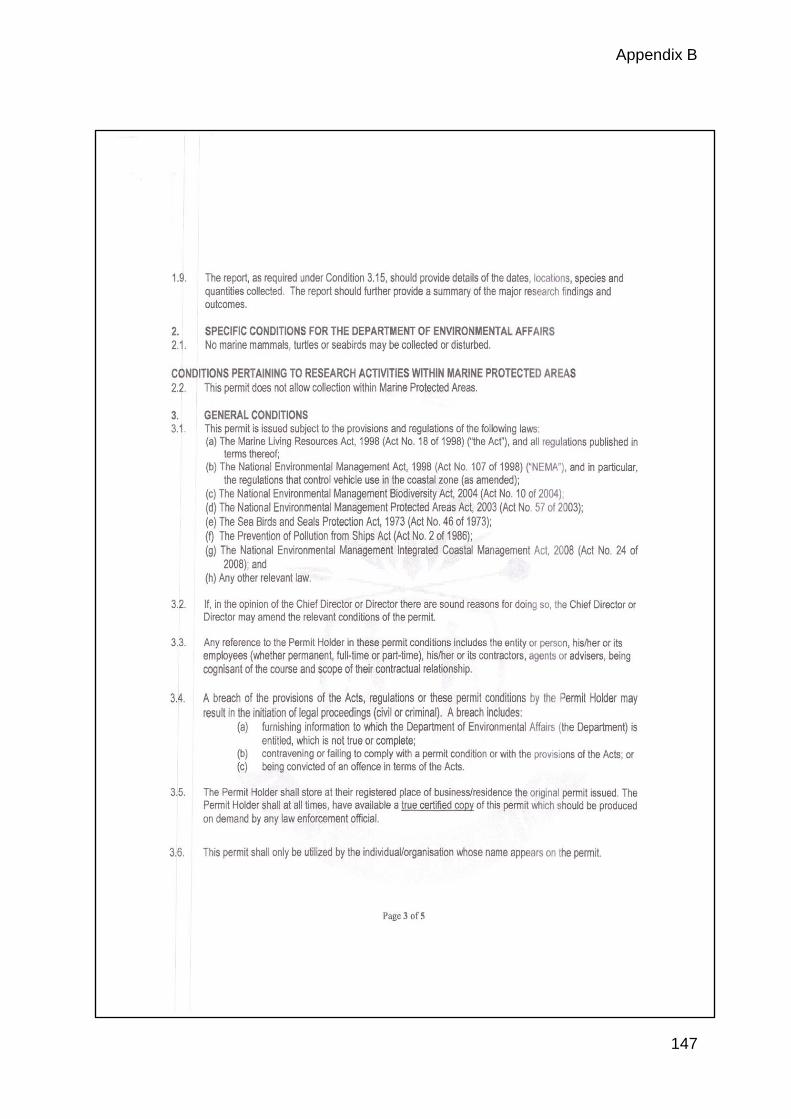
Appendix B
147

Appendix B
148

Appendix B
149