More than Innovation - Treet Corporation · his efforts in founding the Liaquat National Hospital,...
338
Treet Corporation Limited 2019 Annual Report More than Innovation
Transcript of More than Innovation - Treet Corporation · his efforts in founding the Liaquat National Hospital,...
Treet Corporation Limited
2019 Annual Report
More than
Innovation

Welcome to Treet Annual Report 2019
The secret of change is to focus all your energy not on fighting the old but on building the newSOCRATES
ContentsStrategic report
08Corporate Matters
20Human Resource Management
24Information System & Control
26Introduction to Taxation Management
44Financial Planning
56Group Information
58Our Mission & Vision Statement
62Company Information
66Directors’ Profile
95Guidelines To Business Conduct
96Corporate Social Responsibility
98Investment /Funding and Dividend Policies
100Financial Highlights
105Key Operating Financial Data
106Our Products
Governance114Chairperson’s Review
115Directors’ Report to the Shareholders
129Directors’ Report to the Shareholders (Urdu)
130Statement of Compliance
132Independent Auditor's Review Report
133Notice of Annual General Meeting
142List of Employees of Subsidiary Company

Chase the vision, not the money, the money will end up following you Tony Hsieh
Rs.11.97bnNet Sales2018: Rs.9.41 bn
Rs.17.69bnFixed Assets (Net)2018: Rs.13.31 bn
Rs.10.49bnShareholders’ Equity2018: Rs.9.07 bn
Rs.(2.13)bnNet Profit/(Loss)2018: Rs.(0.63) bn
Treet Holdings Limited
Treet Corporation
Limited
First Treet Manufacturing
ModarabaGlobal Arts
LimitedTreet Battery
LimitedRenacon
Pharma Limited
Rs.2.65bnExport Sales2018: Rs.2.09 bn
Rs.26.22bnTotal Assets (Net)2018: Rs.21.00 bn
Rs.1.25bnGross Profit2018: Rs.1.76 bn
Rs.(0.79)bnOperating Profit/(Loss)2018: Rs.(0.09) bn
Financial highlights (for the year ended 30 June 2019)
Financial highlights

Far and away the best prize that life offers is the chance to work hard at work worth doingTheodore Roosevelt
3 2019 Annual Report 2
Go
vern
ance
Str
ateg
ic re
po
rt
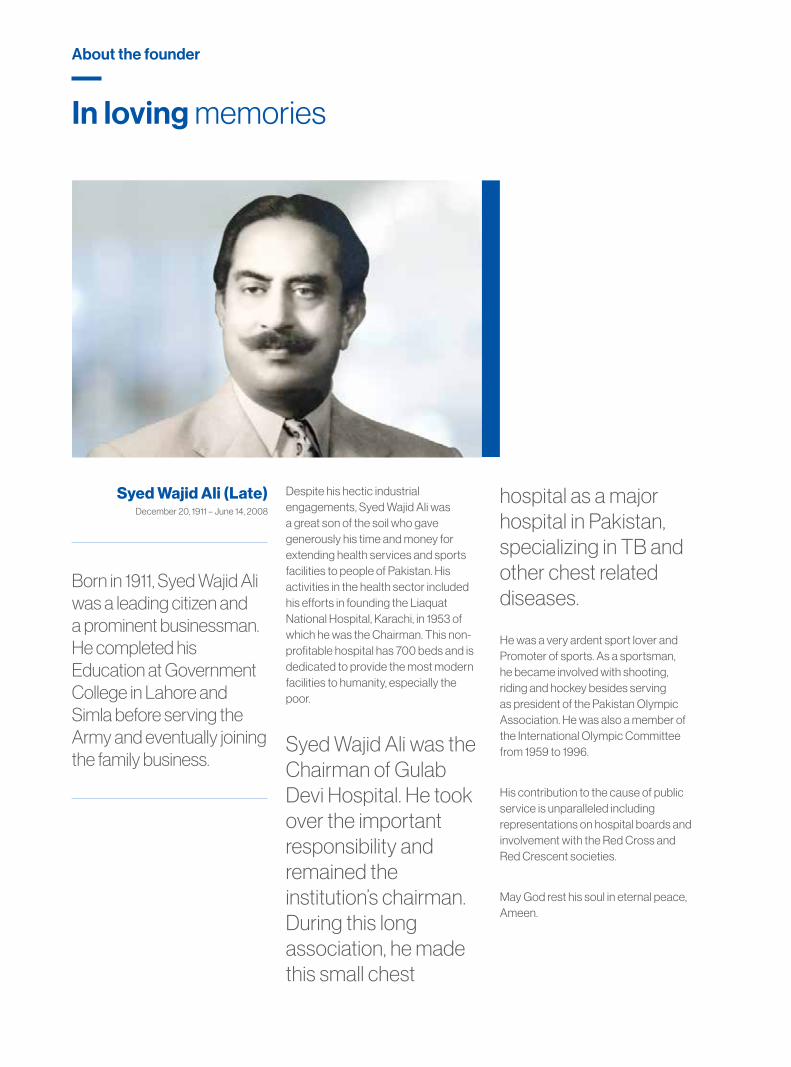
Syed Wajid Ali (Late)December 20, 1911 – June 14, 2008
Born in 1911, Syed Wajid Ali was a leading citizen and a prominent businessman. He completed his Education at Government College in Lahore and Simla before serving the Army and eventually joining the family business.
hospital as a major hospital in Pakistan, specializing in TB and other chest related diseases.
He was a very ardent sport lover and Promoter of sports. As a sportsman, he became involved with shooting, riding and hockey besides serving as president of the Pakistan Olympic Association. He was also a member of the International Olympic Committee from 1959 to 1996.
His contribution to the cause of public service is unparalleled including representations on hospital boards and involvement with the Red Cross and Red Crescent societies.
May God rest his soul in eternal peace, Ameen.
Despite his hectic industrial engagements, Syed Wajid Ali was a great son of the soil who gave generously his time and money for extending health services and sports facilities to people of Pakistan. His activities in the health sector included his efforts in founding the Liaquat National Hospital, Karachi, in 1953 of which he was the Chairman. This non-profitable hospital has 700 beds and is dedicated to provide the most modern facilities to humanity, especially the poor.
Syed Wajid Ali was the Chairman of Gulab Devi Hospital. He took over the important responsibility and remained the institution’s chairman. During this long association, he made this small chest
In loving memories
About the founder

Don’t be the same. Be better!
5 2019 Annual Report 4
Go
vern
ance
Str
ateg
ic re
po
rt

SUCCESS IS NOT FINAL,
FAILURE IS NOT FATAL:
IT IS THE COURAGE TO
CONTINUE THAT COUNTSWINSTON S. CHURCHILL
7 2019 Annual Report 6
Go
vern
ance
Str
ateg
ic re
po
rt
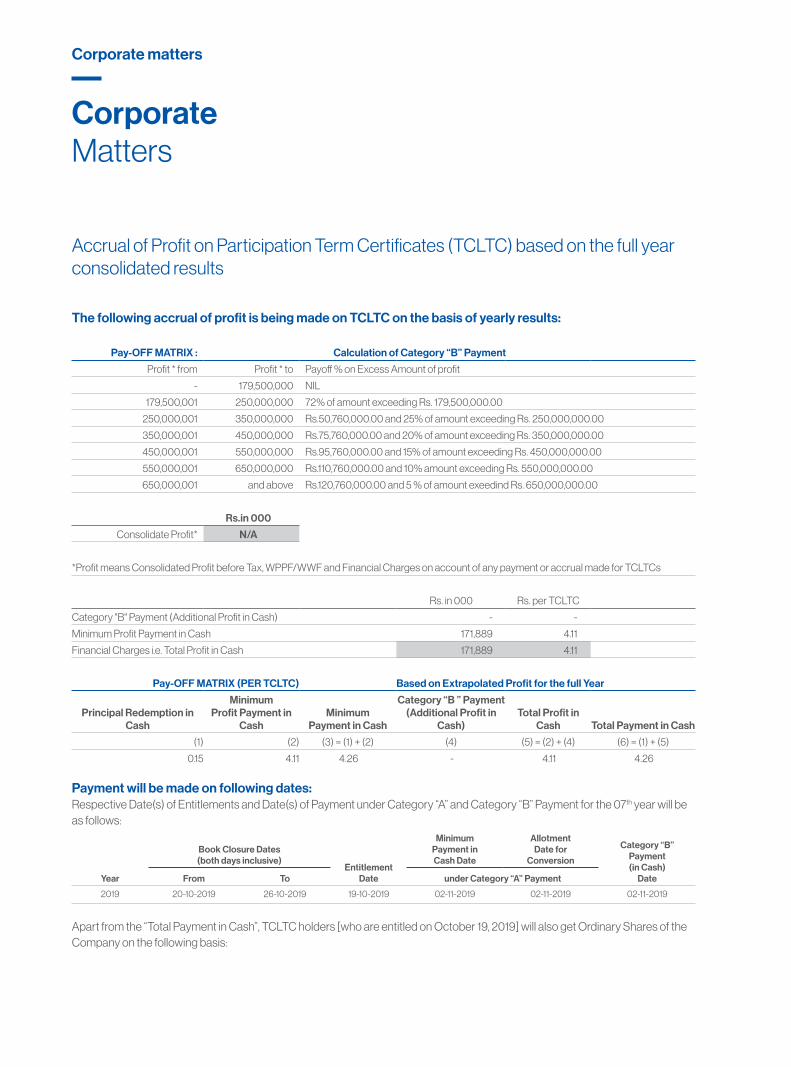
Accrual of Profit on Participation Term Certificates (TCLTC) based on the full year consolidated results
The following accrual of profit is being made on TCLTC on the basis of yearly results:
Pay-OFF MATRIX : Calculation of Category “B” Payment
Profit * from Profit * to Payoff % on Excess Amount of profit
- 179,500,000 NIL
179,500,001 250,000,000 72% of amount exceeding Rs. 179,500,000.00
250,000,001 350,000,000 Rs.50,760,000.00 and 25% of amount exceeding Rs. 250,000,000.00
350,000,001 450,000,000 Rs.75,760,000.00 and 20% of amount exceeding Rs. 350,000,000.00
450,000,001 550,000,000 Rs.95,760,000.00 and 15% of amount exceeding Rs. 450,000,000.00
550,000,001 650,000,000 Rs.110,760,000.00 and 10% amount exceeding Rs. 550,000,000.00
650,000,001 and above Rs.120,760,000.00 and 5 % of amount exeedind Rs. 650,000,000.00
Rs.in 000
Consolidate Profit* N/A
*Profit means Consolidated Profit before Tax, WPPF/WWF and Financial Charges on account of any payment or accrual made for TCLTCs
Rs. in 000 Rs. per TCLTC
Category "B" Payment (Additional Profit in Cash) - -
Minimum Profit Payment in Cash 171,889 4.11
Financial Charges i.e. Total Profit in Cash 171,889 4.11
Pay-OFF MATRIX (PER TCLTC) Based on Extrapolated Profit for the full Year
Principal Redemption in Cash
MinimumProfit Payment in
CashMinimum
Payment in Cash
Category “B ” Payment (Additional Profit in
Cash)Total Profit in
Cash Total Payment in Cash
(1) (2) (3) = (1) + (2) (4) (5) = (2) + (4) (6) = (1) + (5)
0.15 4.11 4.26 - 4.11 4.26
Payment will be made on following dates:Respective Date(s) of Entitlements and Date(s) of Payment under Category “A” and Category “B” Payment for the 07th year will be as follows:
Year
Book Closure Dates(both days inclusive)
EntitlementDate
MinimumPayment inCash Date
AllotmentDate for
Conversion
Category “B”Payment(in Cash)
Date From To under Category “A” Payment
2019 20-10-2019 26-10-2019 19-10-2019 02-11-2019 02-11-2019 02-11-2019
Apart from the “Total Payment in Cash”, TCLTC holders [who are entitled on October 19, 2019] will also get Ordinary Shares of the Company on the following basis:
CorporateMatters
Corporate matters
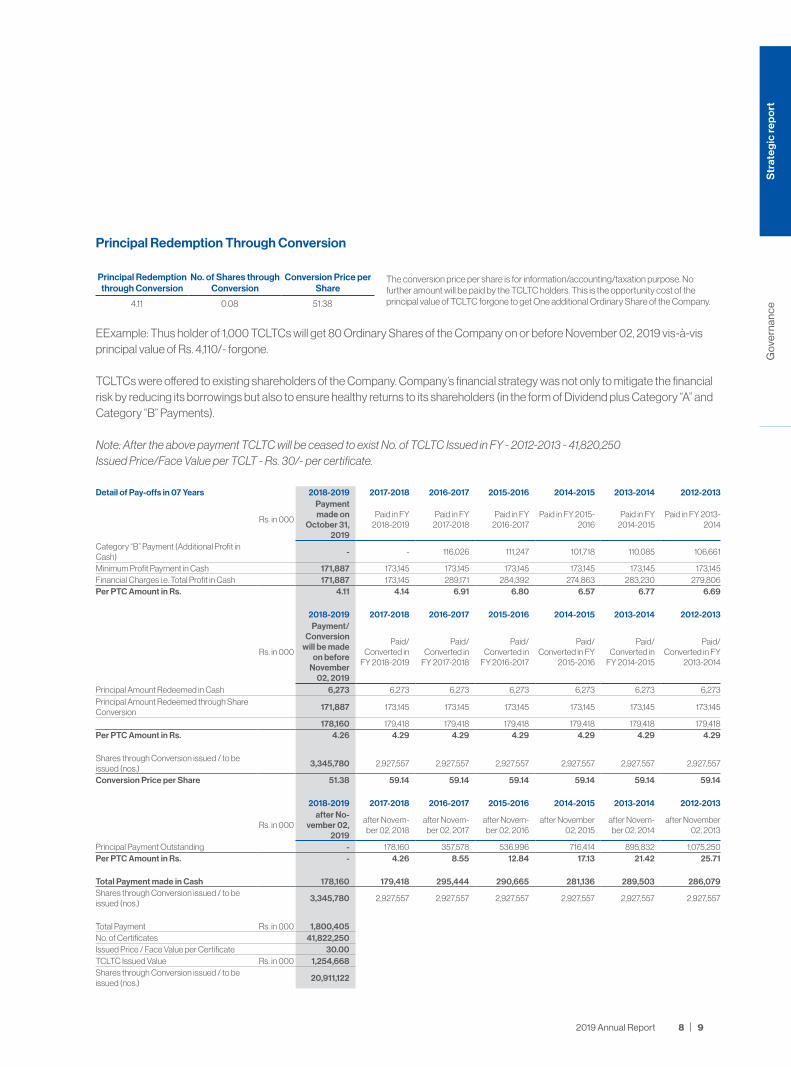
Principal Redemption Through Conversion
Principal Redemption through Conversion
No. of Shares through Conversion
Conversion Price per Share
The conversion price per share is for information/accounting/taxation purpose. No further amount will be paid by the TCLTC holders. This is the opportunity cost of the principal value of TCLTC forgone to get One additional Ordinary Share of the Company. 4.11 0.08 51.38
EExample: Thus holder of 1,000 TCLTCs will get 80 Ordinary Shares of the Company on or before November 02, 2019 vis-à-vis principal value of Rs. 4,110/- forgone.
TCLTCs were offered to existing shareholders of the Company. Company’s financial strategy was not only to mitigate the financial risk by reducing its borrowings but also to ensure healthy returns to its shareholders (in the form of Dividend plus Category “A” and Category “B” Payments).
Note: After the above payment TCLTC will be ceased to exist No. of TCLTC Issued in FY - 2012-2013 - 41,820,250Issued Price/Face Value per TCLT - Rs. 30/- per certificate.
Detail of Pay-offs in 07 Years 2018-2019 2017-2018 2016-2017 2015-2016 2014-2015 2013-2014 2012-2013
Rs. in 000
Payment made on
October 31, 2019
Paid in FY 2018-2019
Paid in FY 2017-2018
Paid in FY 2016-2017
Paid in FY 2015-2016
Paid in FY 2014-2015
Paid in FY 2013-2014
Category “B” Payment (Additional Profit in Cash)
- - 116,026 111,247 101,718 110,085 106,661
Minimum Profit Payment in Cash 171,887 173,145 173,145 173,145 173,145 173,145 173,145 Financial Charges i.e. Total Profit in Cash 171,887 173,145 289,171 284,392 274,863 283,230 279,806 Per PTC Amount in Rs. 4.11 4.14 6.91 6.80 6.57 6.77 6.69
2018-2019 2017-2018 2016-2017 2015-2016 2014-2015 2013-2014 2012-2013
Rs. in 000
Payment/Conversion
will be made on before
November 02, 2019
Paid/Converted in
FY 2018-2019
Paid/Converted in
FY 2017-2018
Paid/Converted in
FY 2016-2017
Paid/Converted in FY
2015-2016
Paid/Converted in
FY 2014-2015
Paid/Converted in FY
2013-2014
Principal Amount Redeemed in Cash 6,273 6,273 6,273 6,273 6,273 6,273 6,273 Principal Amount Redeemed through Share Conversion
171,887 173,145 173,145 173,145 173,145 173,145 173,145
178,160 179,418 179,418 179,418 179,418 179,418 179,418 Per PTC Amount in Rs. 4.26 4.29 4.29 4.29 4.29 4.29 4.29
Shares through Conversion issued / to be issued (nos.)
3,345,780 2,927,557 2,927,557 2,927,557 2,927,557 2,927,557 2,927,557
Conversion Price per Share 51.38 59.14 59.14 59.14 59.14 59.14 59.14
2018-2019 2017-2018 2016-2017 2015-2016 2014-2015 2013-2014 2012-2013
Rs. in 000after No-
vember 02, 2019
after Novem-ber 02, 2018
after Novem-ber 02, 2017
after Novem-ber 02, 2016
after November 02, 2015
after Novem-ber 02, 2014
after November 02, 2013
Principal Payment Outstanding - 178,160 357,578 536,996 716,414 895,832 1,075,250 Per PTC Amount in Rs. - 4.26 8.55 12.84 17.13 21.42 25.71
Total Payment made in Cash 178,160 179,418 295,444 290,665 281,136 289,503 286,079 Shares through Conversion issued / to be issued (nos.)
3,345,780 2,927,557 2,927,557 2,927,557 2,927,557 2,927,557 2,927,557
Total Payment Rs. in 000 1,800,405 No. of Certificates 41,822,250Issued Price / Face Value per Certificate 30.00 TCLTC Issued Value Rs. in 000 1,254,668 Shares through Conversion issued / to be issued (nos.)
20,911,122
9 2019 Annual Report 8
Str
ateg
ic re
po
rtG
ove
rnan
ce
CorporateMatters
Corporate matters continue
Code of Corporate Governance
The requirements of the Code of Corporate Governance, as introduced by the Securities and Exchange Commission of Pakistan (and set out by the Pakistan Stock Exchange Limited in its Listing Rules), have been duly complied with. A statement to this effect is annexed with the report.
Compliance with Code of Corporate Governance
In compliance with the Code, the Board of Directors of your Company states that:
• The financial statements, prepared by the management of your company, fairly present its state of affairs, the result of its operations, cash flows and changes in equity.
• Proper books of account have been maintained by your company.
• Appropriate accounting policies are consistently applied by your Company in the preparation of financial statements, and accounting estimates are based on reasonable and prudent judgment.
• International Accounting Standards, as applicable in Pakistan, have been followed in the preparation of these financial statements and any departure there from, if any, has been adequately disclosed.
• The system of Internal Control, being implemented in your Company is sound and has been effectively persisted throughout the year.
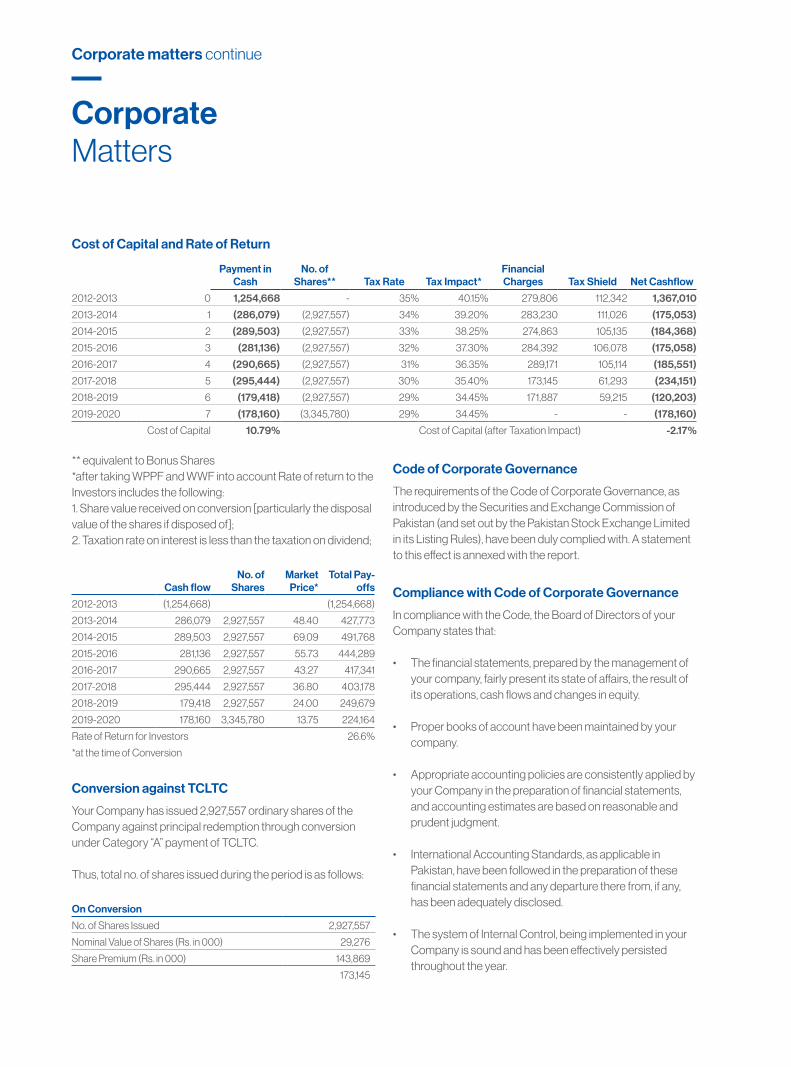
Cost of Capital and Rate of Return
Payment in Cash
No. of Shares** Tax Rate Tax Impact*
Financial Charges Tax Shield Net Cashflow
2012-2013 0 1,254,668 - 35% 40.15% 279,806 112,342 1,367,010
2013-2014 1 (286,079) (2,927,557) 34% 39.20% 283,230 111,026 (175,053)
2014-2015 2 (289,503) (2,927,557) 33% 38.25% 274,863 105,135 (184,368)
2015-2016 3 (281,136) (2,927,557) 32% 37.30% 284,392 106,078 (175,058)
2016-2017 4 (290,665) (2,927,557) 31% 36.35% 289,171 105,114 (185,551)
2017-2018 5 (295,444) (2,927,557) 30% 35.40% 173,145 61,293 (234,151)
2018-2019 6 (179,418) (2,927,557) 29% 34.45% 171,887 59,215 (120,203)
2019-2020 7 (178,160) (3,345,780) 29% 34.45% - - (178,160)
Cost of Capital 10.79% Cost of Capital (after Taxation Impact) -2.17%
** equivalent to Bonus Shares*after taking WPPF and WWF into account Rate of return to the Investors includes the following:1. Share value received on conversion [particularly the disposal value of the shares if disposed of];2. Taxation rate on interest is less than the taxation on dividend;
Cash flowNo. of
SharesMarket
Price*Total Pay-
offs
2012-2013 (1,254,668) (1,254,668)
2013-2014 286,079 2,927,557 48.40 427,773
2014-2015 289,503 2,927,557 69.09 491,768
2015-2016 281,136 2,927,557 55.73 444,289
2016-2017 290,665 2,927,557 43.27 417,341
2017-2018 295,444 2,927,557 36.80 403,178
2018-2019 179,418 2,927,557 24.00 249,679
2019-2020 178,160 3,345,780 13.75 224,164
Rate of Return for Investors 26.6%
*at the time of Conversion
Conversion against TCLTC
Your Company has issued 2,927,557 ordinary shares of the Company against principal redemption through conversion under Category “A” payment of TCLTC.
Thus, total no. of shares issued during the period is as follows:
On Conversion
No. of Shares Issued 2,927,557
Nominal Value of Shares (Rs. in 000) 29,276
Share Premium (Rs. in 000) 143,869
173,145

• Keeping in view the financial position of your Company, we do not have any significant doubt upon its continuance as a going concern.
• There also has not been any material departure from the best practices of corporate governance, as detailed in the listing regulations, during the year under review.
Employee Benefit Funds
Values of investments (in Rs. Million) of employees’ retirement funds as per their respective audited accounts for the year ended on June 30, 2019 are as follows:
Provident Fund 450.777
Gratuity Fund 415.190
Superannuation Fund 446.555
Service Fund 215.094
Housing Fund 77.800
Benevolent Fund 13.436
Audit Committee
The Board of Directors of the Company has established an Audit Committee comprising of four members, in compliance with the Revised Code of Corporate Governance 2017 (CCG). Whom three are Non-Executive Directors including Chairman of the Committee. During the year June 30, 2019, the Committee met four times. The Meetings of the Audit Committee were held at least once every quarter prior approval of the interim and final results of the Company as required by CCG. The attendance of the Board Members was as follows:
Sr. No. Name Designation 4/Oct/18 30/Oct/18 26/Feb/19 30/Apr/19 2018-2019
1 Dr. Salman Faridi Chairman/Independent Director P P P P 4/4
2 Mr. Imran Azim Non-Executive Director P P A P 3/4
3 Mr. Munir Karim Bana Non-Executive Director P P P P 4/4
Quorum of the Meetings 3/3 3/3 2/3 3/3
P Present in the Meeting
A Leave of Absence
Chief Financial Officer, Secretary of Audit Committee and Head of Internal Audit were also attended all meetings during the year under review. The Committee also met the External Auditors separately in the absence of Chief Financial Officer and Head of Internal Audit to get their feedback on the overall control and Governance structure within the Company.
Terms of reference of Audit Committee
The Committee reviews the periodic financial statements and examines the adequacy of financial policies and practices to ensure that an efficient and strong system of internal control is in place. The Committee also reviews the audit reports issued by the Internal Audit Department and compliance status of audit observations.
The Audit Committee is also responsible for recommending to the Board of Directors the appointment of external auditors by the Company’s shareholders and considers any question of resignation or removal of external auditors, audit fees and provision of any service to the Company by its external auditors in addition to the audit of its financial statements.
The Terms of Reference of the Audit Committee are consistent with those stated in the Code of Corporate Governance and broadly include the following:
i. Review of the interim and annual financial statements of the Company prior to approval by the Board of Directors.
ii. Discussions with the external auditors of major observations arising from interim and final audits; review of management letter issued by the external auditors and management’s response thereto.
iii. Review of scope and extent of internal audit ensuring that the internal audit function has adequate resources and is appropriately placed within the Company.
iv. Ascertain adequacy and effectiveness of the internal control system including financial and operational controls, accounting system and reporting structure.
v. Determination of compliance with relevant statutory requirements and monitoring compliance with the best practices of corporate governance.
11 2019 Annual Report 10
Str
ateg
ic re
po
rtG
ove
rnan
ce

Internal Audit
In compliance with the Code, the Board of Directors of your Company has also established an Internal Audit Function to monitor and review the adequacy and implementation of Internal Control at each level of your Company.
Transfer Pricing
It is the company’s policy to ensure that all transactions entered with related parties must be at arm’s length. In exceptional circumstances, however, company may enter into transactions, other than arm’s length transaction, but company should, subject to approval of Board of Directors and Audit Committee, justify (and duly jot down & present in the financial statements) its rationale and financial impact of the departure from the arm’s length transaction.
Risk Management Policy
The Board plays a key role in risk management principally through the Risk Management Committee. Programs have been established to consider and manage operational, strategic, technological, scientific, reputation, environmental health and safety and other risks to the Company’s businesses. These are reviewed with the committees on a regular basis. All operational units incorporate Risk Management into their planning process:
• To minimize risk within the Company
• To ensure Risk Management is incorporated into the corporate governance systems and management structure of the Company
• To ensure that significant Risks within the Company are identified and appropriate strategies are in place to manage them
• To develop effective and efficient Risk Management procedures
Strategic Planning
It is company’s mainstay policy to position itself strategically in order to achieve its vision of being recognized as a world-class manufacturer of top quality products and to deliver value to its consumer; and
vi. Institute special projects, value for money studies or other investigations on any matters specified by the Board of Directors.
vii. Review of management letter issued by the External Auditors and Management response thereto:
Report of the Audit Committee
The Committee performs its functions in accordance with the terms of reference as approved by the Board and reviewed the following key items during the current financial year.
Financial Reporting:
The Committee reviewed, discussed and recommended for Board approval, the draft Interim and Annual Results of the Company. The Committee discussed with the CFO, HIA and External Auditors of the Company on significant accounting policies, estimates and judgments applied in preparing the financial information.
Review of Compliance with the Code of Corporate Governance (CCG):
The committee places great importance on ensuring compliance with the best practices of the Code of Corporate Governance. In this respect, the Committee annually reviews the Company’s Compliance with the CCG.
Appointment of External Auditors:
As per the requirements of the CCG and term of reference of the Audit Committee, the Committee recommended the appointment and remuneration of External Auditors to the Board for their approval.
Review of Management Letter issued by the External Auditors:
The Committee also reviews the Management Letter issued by the External Auditors’ wherein control weaknesses are highlighted. Compliance status of previously highlighted observations by the External Auditors’ is reviewed and corrective measures are discussed to improve the overall control environment.
CorporateMatters
Corporate matters continue

1. To ensure that decisions about strategic positioning are made within the context of a comprehensive and shared understanding of the External/Internal environment.
2. To identify and consider opportunities for the Company to consolidate and strengthen its position.
3. To establish productive and mutually-beneficial partnerships to develop a sustainable competitive advantage.
4. To ensure that the Company has strong and effectively aligned planning and budget processes, incorporating review and continuous improvement mechanisms.
Human Resources
The company is committed to equal opportunity employment. It accepts the obligation as a member of the community-at-large and as an employer to exercise an active and positive program of non-discrimination in all areas of employment. Employment decisions are made by providing equal opportunity and access on the basis of qualification and merits.Moreover, the company shall ensure that fair, consistent, effective and efficient recruitment and selection practices exist in hiring the most suitable candidates.
Your Company has recomposed the HR & Remuneration Committee (Compensation Committee) and following are the members of the Committee;
Attendance report of HR & Remuneration Committee
during the year 2018-2019
Sr. No.
Name Designation 23/May/1928/
Jun/192018-2019
1 Mr. Imran Azim Chairman/Member
P P 2/2
2 Mr. Munir Karim Bana Member P P 2/2
3 Mr. Muhammad Shafique Anjum
Member P P 2/2
4 Syed Sheharyar Ali Member P P 2/2
5 Dr.Salman Faridi Member P P 2/2
6 Mr. Amir Zia CFO P P 2/2
7 Mr. Jahangir Bashir HR Manager P P 2/2
8 Rana Shakeel Shaukat Secretary P P 2/2
Quorum of the Meetings 8/8 8/8
P Present in the Meeting
A Leave of Absence
Terms of Reference of the Human Resource & Remuneration Committee:
The Committee shall be responsible for making recommendations to the Board for maintaining:
i. A sound plan of organization for the company.
ii. An effective employees’ development programme.
iii. Sound compensation and benefits plans, policies and practices designed to attract and retain the caliber of personnel needed to manage the business effectively.
iv. Evaluate and recommend for approval of changes in the organization, functions and relationships affecting management positions equivalent in importance to those on the management position schedule.
v. Determine appropriate limits of authority and approval procedures for personnel matters requiring decisions at different levels of management.
vi. Review the employees’ development system to ensure that it:a. Foresees the company’s senior management
requirements.b. Provides for early identification and development of
key personnel.c. Brings forward specific succession plans for senior
management positions.d. Training and development plans.
vii. Compensation and Benefits:i. recommending human resource management
policies to the board;ii. recommending to the board the selection, evaluation,
compensation (including retirement benefits) and succession planning of the CEO;
iii. recommending to the Board the selection, evaluation, compensation (including retirement benefits) of COO, CFO, Company Secretary and Head of Internal Audit; and senior management reporting to CEO.
13 2019 Annual Report 12
Str
ateg
ic re
po
rtG
ove
rnan
ce

advanced state of the art healthcare facilities that meet best international standards;
• Specialized Pharmacy Chain;
• Pharmaceutical Business (initially through marketing and trading);
• Multi-purpose Commercial Complex;• Business Education;
Restructuring Plan
Battery Project is currently under First Treet Manufacturing Modaraba (FTMM). However, this segment is being transferred to separate entity namely “Treet Battery Limited” (TBL) under Scheme of Arrangement.
Since FTMM is listed Modaraba, TBL will be technically listed on the Pakistan Stock Exchange in accordance with applicable rules and regulations.
The benefits of the Scheme of Arrangement, shall include but are not limited to the following:
• De-bundling of business unit and exploration of value• Requirement of International Market• Additional Funds Raising • Value creation for the Modaraba Certificate Holders• Voting Rights for existing Modaraba Certificate Holders
Battery Unit is being spun-off to the existing certificate holders of the Modaraba under scheme of arrangement as per following Swap ratio:
Swap Ratio: 0.99840i.e. 9,984 Share of Treet Battery Limited against Ten Thousand
Meetings of the Board of Directors
During the year, the Board of Directors of your company has met Eight times and the attendance at each of these meetings is as follows:
Sr. No.Name Designation 30/Jul/18 4/Oct/18 30/Oct/18 20/Nov/18 21/Jan/19 26/Feb/19 30/Apr/19 23/May/19 2018-2019
1 Dr. Mrs. Niloufer Qasim Mahdi Chairperson A P P P A A A A 3/8
2 Syed Shahid Ali Shah Chief Executive Officer P A P P P P P P 7/8
3 Mr. Saulat Said Executive Director P P P P P P P P 8/8
4 Dr. Salman Faridi Independent Director P P P A P P P P 7/8
5 Mr. Imran Azim Non-Executive Director P P P P P A P P 7/8
6 Mr. Munir Karim Bana Non-Executive Director P P P P A P P P 7/8
7 Mr. Muhammad Shafique Anjum Executive Director P P P P P P P P 8/8
8 Syed Sheharyar Ali Executive Director P P P P P A P P 7/8
Quorum of Meetings 7/8 7/8 8/8 7/8 6/8 5/8 7/8 7/8
P Present in the Meeting
A Leave of Absence
Pattern of Shareholding
The pattern of shareholding of your Company as on June 30, 2019 is annexed with this report. This statement is in accordance with the amendments made through the Code.
Share Trading
All trades in the shares of the Company, carried out by its directors, CEO, CFO, Company Secretary, their spouses and minor children is also disclosed in Form 34 annexed with this report.
For the purpose of this clause 5.19.11(xii) and clause 5.19.15 of the Code of Corporate Governance of PSX Regulations, the expression “executive” means the CEO, COO, CFO, Head of Internal Audit and Company Secretary and employees of the Company for whom the Board of Directors has determined [in their meeting held on October 04, 2019] the minimum threshold of gross salary (excluding retirement funds) of Rs. 8.00 million per annum for the financial year 2019-2020.
Future Expansion / Plans:
Your Company is also seeking the feasibilities of the following avenues to harness its plans of concentric and conglomerate diversification;
• Medical Complex that will provide comprehensive and
Corporate matters continue
CorporateMatters

(10,000) Certificates of First Treet Manufacturing Modaraba out of share premium.
Scheme of Arrangement
Cut-off date of the Scheme is as on June 30, 2019. Shares of TBL will be issued to the existing certificate-holders out of share premium and all the assets, liabilities and related loss [pertaining to Battery Segment] to be transferred to the TBL as follows:
Adjustment in Equity & Reserves
Balance Sheet after Restructuring
FTMM FTMMFTMM-
ResidualFTMM-
ResidualFTMM-
Residual
Asset / Liabilities / Equity ConsolidatedCorrugation
Segment & Soap Segment
Corrugation Segment &
Soap Segment
Corrugation Segment & Soap
SegmentBattery
Segment Battery
Segment Battery
Segment
Rs. In 000 Rs. In 000 Rs. In 000 Rs. In 000 Rs. In 000 Rs. In 000 Rs. In 000
Property, plant and equipment 8,682,886 7,791,431 891,455 7,791,431 891,455
Long term advances - - - - -
Long term deposits 10,932 717 10,215 717 10,215
Stores and spares 93,321 75 93,246 75 93,246
Stock in trade 1,858,077 1,562,820 295,257 1,562,820 295,257
Trade debts 754,829 74,081 680,748 74,081 680,748
Advances, deposits, prepayments and other receivables 552,548 343,368 209,180 343,368 209,180
Tax refunds due from the Government - Advance Tax 106,322 - 106,322 - 106,322
Tax refunds due from the Government - Sales Tax 1,017,183 1,017,183 - 1,017,183 -
Cash and bank balances 99,596 62,361 37,235 62,361 37,235
Issued, subscribed and paid up certificate capital (1,956,000) - (1,956,000) - (1,956,000)
Statutory reserve (511,941) - (511,941) - (511,941)
Certificate premium (1,952,870) - (1,952,870) 1,952,870 - -
Surplus on revaluation of property, plant & equipment (387,476) - (387,476) - (387,476)
Accumulated loss 2,765,445 2,492,496 272,949 - 2,492,496 272,949
Deffered Taxation (9,272) - (9,272) - (9,272)
Retention money payable (21,662) (8,090) (13,572) (8,090) (13,572)
Short term borrowings - Banks (3,924,345) (3,924,345) - (3,924,345) -
Short term borrowings - Treet Corporation Limited (6,462,909) (6,462,909) - - (6,462,909) -
Trade and other payables (622,899) (465,613) (157,286) (465,613) (157,286)
Accrued profit on secured borrowings (91,765) - (91,765) - (91,765)
Intra-Company Receivable/Payable - (2,483,575) 2,483,575 1,952,870 (1,952,870) (530,705) 530,705
Share Capital - Treet Battery Limited Note-1 - (1,952,870) (1,952,870) -
Note-1 :
Treet Battery Limited No. of Shares Par Value
Rs. In 000
Shares to be Issued to Certificateholders of First Treet Maufacturing Modaraba under SWAP Ratio 195,287,000 1,952,870
SWAP Ratio: 0.998409984 Share of Treet Battery Limited against Ten Thousand Certificates of First Treet Manufacturing Modaraba
15 2019 Annual Report 14
Str
ateg
ic re
po
rtG
ove
rnan
ce

Corporate matters continue
Information Brief – Renacon Pharma Limited
Renacon Pharma Limited (“Renacon” or the “Company”) is a prominent Hemodialysis Concentrates manufacturer in Pakistan. Hemodialysis Concentrates, marketed in powder and solution forms, are used only with hemodialysis machines and are meant to cleanse the blood by flowing it through a disposable filter called a dialyzer. Manufacturing products with a quality comparable to global leaders such as Fresenius (Germany), B. Braun (Germany), Toray (Japan), Nipro (Japan), Rockwell (USA), and Gambro (Sweden), Renacon’s products cost approximately 20% less than foreign competition, making them highly suitable at dialysis centers in Pakistan. The current manufacturing facility of the company is situated on leasehold land at 18KM Ferozpur Road, opposite Nishtar Colony, Lahore.
Renacon was incorporated as an Association of Person (“AoP”) by Dr. Salman Shakoh in 1996, in order to develop Bicarbonate Hemodialysis Concentrate in Pakistan. Until the early 1990s, Pakistan was predominantly using low-quality Acetate Hemodialysis Concentrate. Dr. Shakoh, a leading kidney physician, having performed and supervised several different dialysis procedures, used his knowledge and experience to indigenously develop a much superior quality solution in the form of Bicarbonate Concentrates. Unlike Acetate, which is toxic and has severe side-effects, Bicarbonate Concentrates are benign and dramatically improve the quality and span of life of dialysis patients.
The Company obtained its manufacturing license in 1998 and subsequently replaced majority market of the old Acetate solution with its newer Bicarbonate Concentrate solution within 5 years of introduction. Since then, through dedicated research, Renacon has developed a wide range of dialysis products, improved production processes, obtained the top and most stringent global medicine production and quality certifications, made successful inroads into the international dialysis market, and developed a unique and difficult-to-replicate blend of skillset: that of clinical nephrology and pharmaceutical production.
The AOP, Renacon Pharma, was converted into a Private Limited Company in Pakistan under the name of Renacon Pharma (Private) Limited in 2009. In 2017, Treet Corporation Limited acquired 58.16% shareholding in Renacon, effectively becoming the sponsor of the Company.
Today, Renacon is the only dialysis company in Pakistan
that can produce over 100 formulations of Hemodialysis concentrate enabling it to provide customized solutions according to patients’ needs. It is amongst the group of companies that have multiple certifications which vouch for the quality of its products and thus enable it to market its products internationally, including free sale authorization within the European Union.
Renacon’s current manufacturing facility is situated on leasehold property at 18 KM Ferozpur Road, Lahore Pakistan. The facility has a total capacity of manufacturing up to 1,560,000 sessions worth of Hemodialysis Concentrates per annum. The plant obtains electricity via an industrial connection from Lahore Electric Supply Company. Water, which is a major input in formation of solutions, is bored at the facility and purified in a reverse osmosis (RO) plant.
The management of Renacon has identified an unmet need for Hemodialysis Concentrates and locally manufactured Blood Tubing Lines (BTLs) in Pakistan. The industry’s current capacity only serves ten percent of the demand for concentrates and there is no local producer of BTLs in the country. The Company has therefore planned to establish a new manufacturing facility that will expand on its production capacity of Hemodialysis Concentrates and will have a dedicated plant for production of BTL and AVF Needle sets.
The proposed project will be located in Faisalabad Industrial Estate, Special Economic Zone (SEZ). Operating in the SEZ will allow the Company to gain incentives in the form of one-time exemption from custom duties and taxes on import of plant and machinery as well as exemption from all taxes on income for the next ten years. The facility will be situated off Lahore-Islamabad Motorway (M3), which will act as a center point for transportation to northern and southern parts of the country. The Company has already acquired 10 acres of land out of which 5 acres will initially be utilized to set up the proposed project, whereas excess land will be utilized for further expansion as and when the Company’s management deems necessary.
The proposed facility will have a Hemodialysis plant with a production capacity of 15.30 million sessions of Hemodialysis Concentrates, a 9.8 times increase over the Company’s current capacity. The BTL segment at the facility will have a capacity to manufacture 9.6 million sets of BTL and AVF needles, with each set consisting of one blood tubing line and a pair of AVF
CorporateMatters
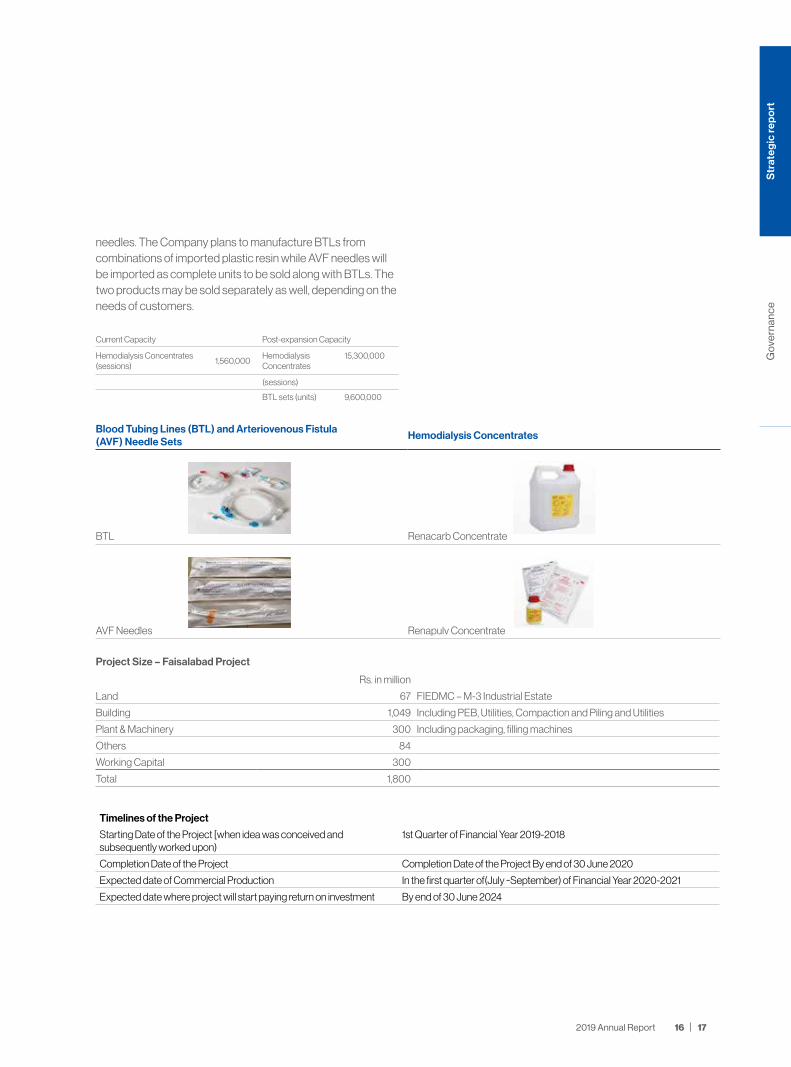
needles. The Company plans to manufacture BTLs from combinations of imported plastic resin while AVF needles will be imported as complete units to be sold along with BTLs. The two products may be sold separately as well, depending on the needs of customers.
Current Capacity Post-expansion Capacity
Hemodialysis Concentrates (sessions)
1,560,000Hemodialysis 15,300,000Concentrates
(sessions)
BTL sets (units) 9,600,000
Blood Tubing Lines (BTL) and Arteriovenous Fistula (AVF) Needle Sets
Hemodialysis Concentrates
BTL Renacarb Concentrate
AVF Needles Renapulv Concentrate
Project Size – Faisalabad Project
Rs. in million
Land 67 FIEDMC – M-3 Industrial Estate
Building 1,049 Including PEB, Utilities, Compaction and Piling and Utilities
Plant & Machinery 300 Including packaging, filling machines
Others 84
Working Capital 300
Total 1,800
Timelines of the Project
Starting Date of the Project [when idea was conceived and subsequently worked upon)
1st Quarter of Financial Year 2019-2018
Completion Date of the Project Completion Date of the Project By end of 30 June 2020
Expected date of Commercial Production In the first quarter of(July ~September) of Financial Year 2020-2021
Expected date where project will start paying return on investment By end of 30 June 2024
17 2019 Annual Report 16
Str
ateg
ic re
po
rtG
ove
rnan
ce

Detail of Shares Issued since January 01, 2017
Date Issue TypeNo. of
SharesPar Value per
ShareTotal (Nominal
Value)Right Price per
ShareRight
Proceeds
Nos. Rs. Rs. Rs. Rs.
31-12-2016 Opening Shares 60,000 100 6,000,000
17-01-2017 Right Issue 84,400 100 8,340,000 4,877 406,741,800
Stock Split 1,434,000 10 14,340,000
06-07-2017 Right Issue 400,086 10 4,000,860 500 200,043,000
17-07-2017 Bonus Issue 60,524,5838 10 605,248,380
30-09-2017 Shares Outstanding 62,358,924 10 623,589,240 606,784,800
Share Premium Rs. Position as on 28-02-2019 Rs.
31-12-2016 Opening Balance -
17-01-2017 Right Issue 398,401,800
06-07-2017 Right Issue 196,042,140
16-07-2017 Balance before Bonus Issue 594,443,940
17-07-2017 Bonus Issue out of Share Premium 594,443,940
30-09-2017 Balance -
17-07-2017 Bonus Issue out of Retained Earnings 10,804,440
No. of Shares
Issued for Cash 1,834,086
Issued as Bonus Issue 60,524,838
62,358,924
Sources of Funds
Rs. in million
Internal Sources 500
Equity / Holding Company 700Including intended private placement and short term loan from holding company (including equity injection)
Bank Borrowings / Loans 600 Including project loan and short term running finance
Future Prospects
Chronic Kidney Disease affects every one in ten people around the world. The worst form of this disease is known as End-Stage Renal Disease (ESRD) where there is a complete loss of kidney function and regular dialysis treatment (two to three times weekly) or a kidney transplant is needed to survive. It is estimated that approximately 20 million people suffer from ESRD around the world, but only over 2 million of them receive treatment via dialysis or transplant.
In Pakistan, data for the prevalence of ESRD is fragmented and largely undocumented, however healthcare professionals estimate that approximately 200,000 people are suffering from the disease across the country and this number is growing at an alarming rate of nearly 15,000 to 20,000 new patients every
year . This is because Pakistan ranks amongst the highest in prevalence of two diseases that contribute to chronic kidney disease: diabetes, which affects every one in twelve Pakistanis, and hypertension, which affects every fourth adult in the country according to a report by WHO.
There are around 20,000 patients of ESRD being treated with Hemodialysis in Pakistan which means that for the other 90% people affected, regular treatment is either unaffordable or unavailable. Currently there are an estimated 450 dialysis centers - housing 5,400 dialysis machines - in all major cities across the country where approximately 3.1 million Hemodialysis procedures or sessions are carried out annually20. The requisite Concentrate solutions for the procedure are manufactured locally whereas machinery and disposables such as blood tubing lines (BTL) and AVF needles are imported.
Corporate matters continue
CorporateMatters
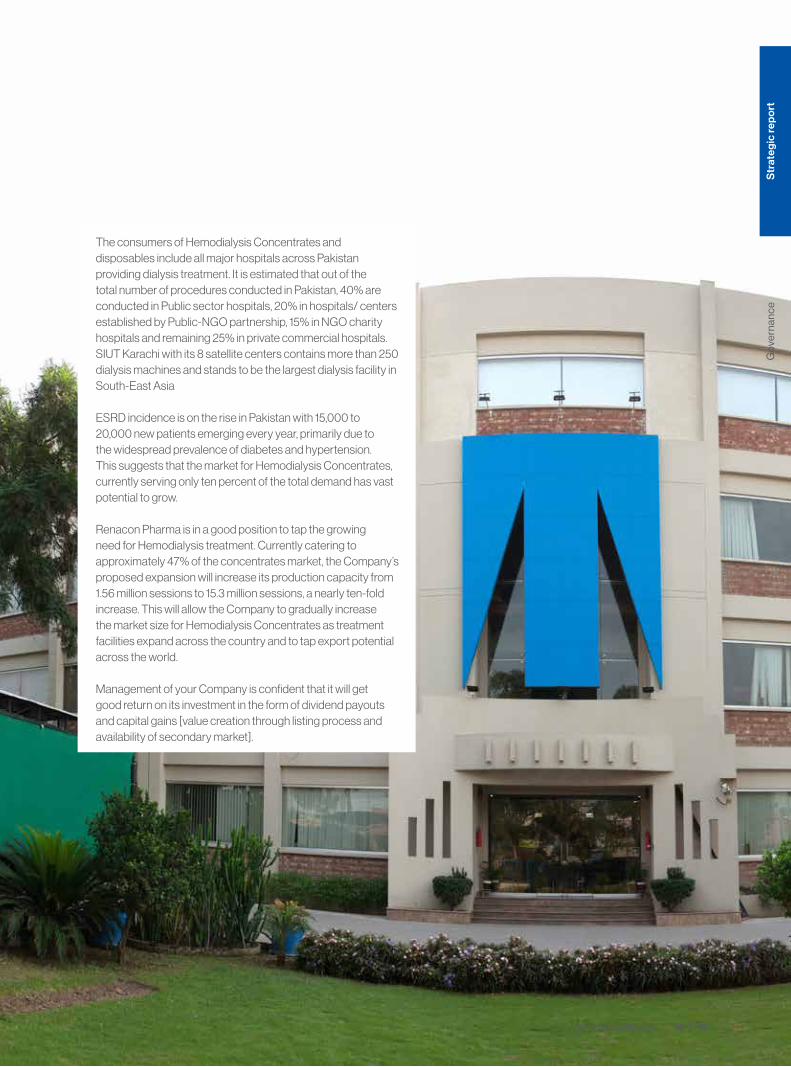
The consumers of Hemodialysis Concentrates and disposables include all major hospitals across Pakistan providing dialysis treatment. It is estimated that out of the total number of procedures conducted in Pakistan, 40% are conducted in Public sector hospitals, 20% in hospitals/ centers established by Public-NGO partnership, 15% in NGO charity hospitals and remaining 25% in private commercial hospitals. SIUT Karachi with its 8 satellite centers contains more than 250 dialysis machines and stands to be the largest dialysis facility in South-East Asia
ESRD incidence is on the rise in Pakistan with 15,000 to 20,000 new patients emerging every year, primarily due to the widespread prevalence of diabetes and hypertension. This suggests that the market for Hemodialysis Concentrates, currently serving only ten percent of the total demand has vast potential to grow.
Renacon Pharma is in a good position to tap the growing need for Hemodialysis treatment. Currently catering to approximately 47% of the concentrates market, the Company’s proposed expansion will increase its production capacity from 1.56 million sessions to 15.3 million sessions, a nearly ten-fold increase. This will allow the Company to gradually increase the market size for Hemodialysis Concentrates as treatment facilities expand across the country and to tap export potential across the world.
Management of your Company is confident that it will get good return on its investment in the form of dividend payouts and capital gains [value creation through listing process and availability of secondary market].
19 2019 Annual Report 18
Str
ateg
ic re
po
rtG
ove
rnan
ce

We consider our employees to be our most valuable asset and to get their commitment and efforts, your Company firmly believes in providing them conducive environment and making them feel a sense of security.
Generally employees are not good in their personal financial management. Neither they have required skills nor have proper vision to make a trade-off between present and future. Your Company has taken this responsibility. We have designed total payroll cost in such a way to cater each sphere of his/ her life. Our ultimate task is to give him/her tension free environment.
We divide our total payroll costs into Seven segments:
1. Monthly Salary to cover day to day expenses;
Annual Salary increase is linked Consumer
Price Index (CPI)
Employees get annual increments in July based on CPI;
Increment based on Performance
This is based on annual performance evaluation;
2. Annual bonuses/and incentives that covers durables
and to plan vacations [and these bonuses/incentives are variable part of salary that is linked with the Company’s performance so if Company performs well so do the employees];
iii. Bonuses that are linked to production quantities/ sales volume;
iv. Profitability linked Incentives
5. Hospitalization coverage for self, immediate family and dependent parents;
This includes hospitalization, major and minor surgery, dentistry, eye operation, optical, maternity, costly tests etc.
6. Currently Company is running various retirement benefit funds;
Retirement Funds are designed to ensure reasonable accumulation of wealth [professionally managed by the Company itself] at the time of retirement and that includes;
• Defined Contribution Plans Provident Fund
• Service Fund Benevolent Fund Superannuation Fund -2 Housing Fund
• Defined Benefit Plans Gratuity Fund
• Superannuation Fund -1
7. Company is providing various insurance plans/ schemes for its employees to financially secure them and/or their family in the event of any mishap;
Insurance / Assurance Schemes that covers contingencies/mishaps and includes;
a. Group Life Insurance
b. Insurance Coverage that is linked to no. of Years Served x Last Salary drawn
c. Insurance Coverage that is linked to no. of Years Remaining in the Service x Last Salary drawn
d. Provident Fund Multiple Insurance
e. Pay Continuation Plan that insures pay continuation for 15 years with Inflation Indexing
Human resource management
EMPLOYEE SATISFACTION
Service Excellence
PositivePublic Image
Catalystfor change
Increasedstaff retention
Employer ofchoice attracts
talent
Develop effectiveprocesses
Manage knowledge
retain intellectual
capital
ReducedRecruitment,training costs
Human ResourceManagement
f. Unit Plans Assurance Schemes linked to Benevolent Fund
7. Owning a home is a keystone of wealth - both financial affluence and emotional security. Company has also initiated scheme to provide shelters (house or land) under Housing Fund. Initially it is limited to management employees [who opt for it] and gradually it will be broadening to other cadres of employees as well.
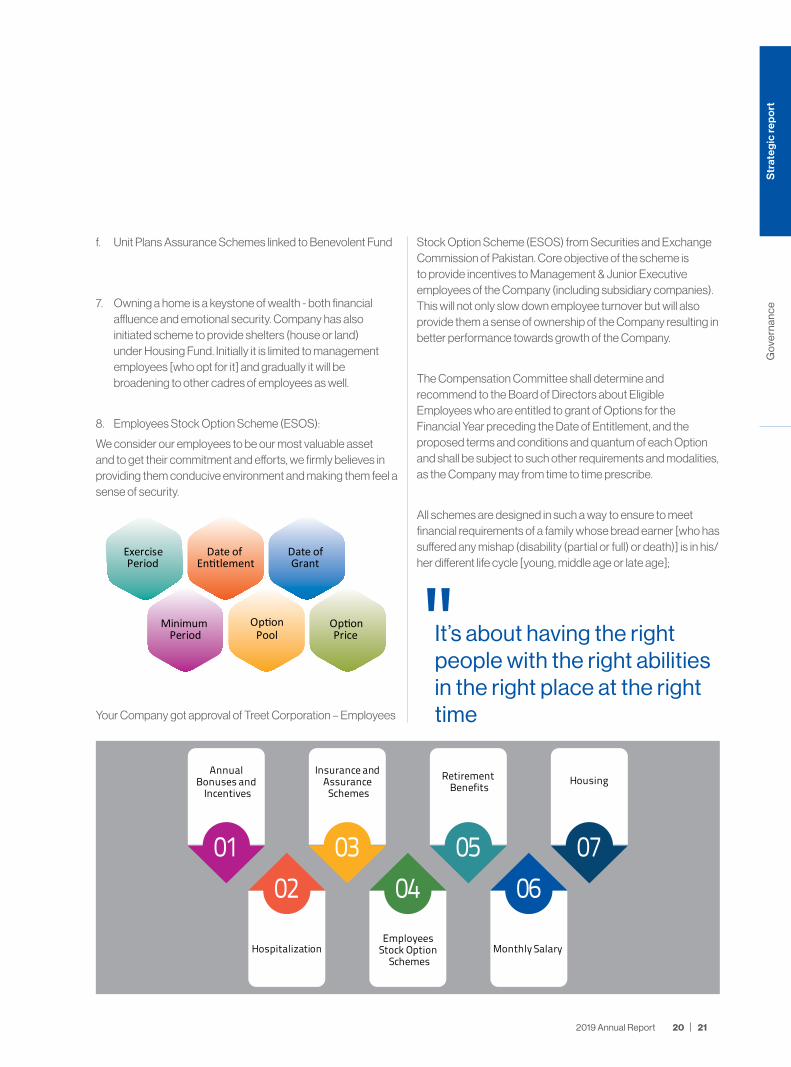
8. Employees Stock Option Scheme (ESOS):
We consider our employees to be our most valuable asset and to get their commitment and efforts, we firmly believes in providing them conducive environment and making them feel a sense of security.
Your Company got approval of Treet Corporation – Employees
Stock Option Scheme (ESOS) from Securities and Exchange Commission of Pakistan. Core objective of the scheme is to provide incentives to Management & Junior Executive employees of the Company (including subsidiary companies). This will not only slow down employee turnover but will also provide them a sense of ownership of the Company resulting in better performance towards growth of the Company.
The Compensation Committee shall determine and recommend to the Board of Directors about Eligible Employees who are entitled to grant of Options for the Financial Year preceding the Date of Entitlement, and the proposed terms and conditions and quantum of each Option and shall be subject to such other requirements and modalities, as the Company may from time to time prescribe.
All schemes are designed in such a way to ensure to meet financial requirements of a family whose bread earner [who has suffered any mishap (disability (partial or full) or death)] is in his/her different life cycle [young, middle age or late age];
0102 04 06
03 05 07
ESOS
Date of Grant
Date of En�tlement
Op�on Op�on Price
Minimum Period
Exercise Period
Pool It’s about having the right people with the right abilities in the right place at the right time
21 2019 Annual Report 20
Str
ateg
ic re
po
rtG
ove
rnan
ce

Your Company has granted following options to the employees of the Company (including employees of the subsidiary companies)
Date of Grant Financial Year Share Strike Price No. of Options Granted No. of Employees
July 17, 2019 2018-2019 15.71 4,962,000 242
Following is the summary of the options granted till to date:
Treet Corporation LimitedEmployees Stock Option Scheme (ESOS)
Financial Year 2014-2015 2015-2016 2016-2017 2017-2018 2018-2019 No. of Shares Outstanding (A) latest 165,450,942
Date of Grant 14/Jul/15 16/Jul/16 14/Jul/17 30/Jul/18 17/Jul/19 Option Pool 15% of A 24,817,641
Date of Entitlement 1/Jul/15 1/Jul/16 1/Jul/17 1/Jul/18 1/Jul/19
Share Price (Option Price) from 14/Apr/15 16/Apr/16 14/Apr/17 30/Apr/18 17/Apr/19 Grant of Option 2014-2015 1,604,800
Share Price (Option Price) to 13/Jul/15 15/Jul/16 13/Jul/17 29/Jul/18 16/Jul/19 Grant of Option 2015-2016 4,114,100
Weighted Average Price i.e. Exercise Price in Rs. per Share
90.58 51.79 66.45 35.44 15.71 Grant of Option 2016-2017 4,259,400
Revised Price i.e. "Exercise Price in Rs. per Share (Revised)
51.79 Not Revised 20.00 15.71 Not Revised Grant of Option 2017-2018 4,768,700
Minimum Vesting Period: from 15/Jul/15 17/Jul/16 15/Jul/17 31/Jul/18 18/Jul/19 Grant of Option 2018-2019 4,962,000
Minimum Vesting Period: to 14/Jul/16 17/Jul/17 15/Jul/18 31/Jul/19 17/Jul/20
Exercise (Option) Period: from 15/Jul/16 18/Jul/17 16/Jul/18 1/Aug/19 18/Jul/20 Option Granted 19,709,000
Exercise (Option) Period: to 14/Jul/17 17/Jul/18 15/Jul/19 30/Jul/20 17/Jul/21
Grant of Option as a % of Shares Out-standing
2.97% 2.99% 3.00% 2.98% 3.00% Balance Available in Option Pool 5,108,641
Share Outstanding (at the Date of Grant) 53,950,701 137,804,309 142,143,666 160,084,685 165,450,942
No. of Options Granted 1,604,800 4,114,100 4,259,400 4,768,700 4,962,000
No. of Options Exercised 1,411,800 533,451 2,438,700 - -
No. of Options Declined /Lapsed but subse-quently Offered
193,000 - - - -
No. of Options Lapsed / Declined - [and subsequently NOT offered]
- 3,580,649 1,820,700 - -
No. of Shares Issued (pursuant to exercise of options granted & offered)
1,604,800 533,451 2,438,700 - -
Status Closed Closed Closed Exercise-
able Vesting
Period
No. of Employees 210 202 271 298 242
Minimum Lock Period Nil Nil Nil Nil Nil
Summary
No. of Options Vested 19,709,000
No. of Options Exercised 4,383,951
No. of Options Declined /Lapsed but subse-quently Offered
193,000
No. of Options Lapsed / Declined - [and subsequently NOT offered]
5,401,349
No. of Shares Issued (pursuant to exercise of options granted & offered)
4,576,951
Human resource management continue
Human ResourceManagement
Pressure can burst a pipe, but pressure also
makes diamonds
Fin
anci
al s
tate
men
tG
ove
rnan
ceS
trat
egic
rep
ort
23 2019 Annual Report 23

Management of the Company believes that they are responsible for providing accurate financial information, both externally and internally. The control environment is the foundation for the other components of internal control. It is the attitude set by management regarding the importance of establishing and maintaining control.
The Company wishes to improve the control of production, reduce inventories and improve customer service in order to achieve ultimate goal to create value for its stake-holders (i.e. consumers, share-holders, employees etc).
The management of the company is committed to implementing and maintaining a documented quality system. This commitment includes;
• ensuring that customer, regulatory and legal requirements are understood and appropriately addressed;
• the quality policy is understood and implemented at all levels of the organization, quality objectives and plans are established as necessary and that the responsibilities of all functions affecting quality are clearly defined;
• provision of the necessary resources and personnel to maintain the system, including a management representative, who will ensure that the requirements of quality assurance are met.
• management reviews of the system on annual basis to determine its effectiveness.
Your Company has successfully implemented Oracle Financials across its business units (SBUs). It has covered following business processes in its implementation:
1. Inventory2. Sales & Receivables3. After Sale Service4. Procurement & Payables
5. Human Resources & Payroll6. Retirement Funds7. Fixed Assets & Capital Work in Process8. Treasury Management 9. General Ledger10. Taxation11. Import12. Manufacturing
Your Company is in the process of implementing business intelligence, performance management and resource planning and scheduling systems.
What is important in the implementation of any information system in the organization is to adhere the following principles:• Proper mapping of the business processes;• Implementation of Internal Control Procedures;• Introduction of series of “Validations” in the data entry;
Thousands of thousands transactions are keyed in the system by the hundreds of people having different mind sets and knowledge skills. Training of the employees is very important but not enough. We have to give them a framework within which each user has to work. Here concept of internal controls and validations is very important. Restrict the user through series of controls and validations to enter the false data or to make mistake at outset. Role of Business Analyst and System Analyst is very important in implementing the ERP in the Organization. Expecting these areas from outside consultant/implementer is NOT ENOUGH resulting into failure of even very good software.
Your Company has implemented comprehensive campus management system from one of the leading firms which covers complete student lifecycle, admissions through graduation. It manages three major operational areas for a University i.e. Admissions, Academics and Financials.
Administrative Procedures & Control
To ensure that the plans of organization and all methods and procedures that are concerned mainly with operational efficiency and adherence to managerial policies, that relate only indirectly to the financial records, are continuously updated and functional; and to ensure that Administrative Controls, which includes such controls as physical safeguarding of assets, time and motion studies, performance reports, employee training programs, and organizational controls etc. are operational.
Information System and Control
Information system & control
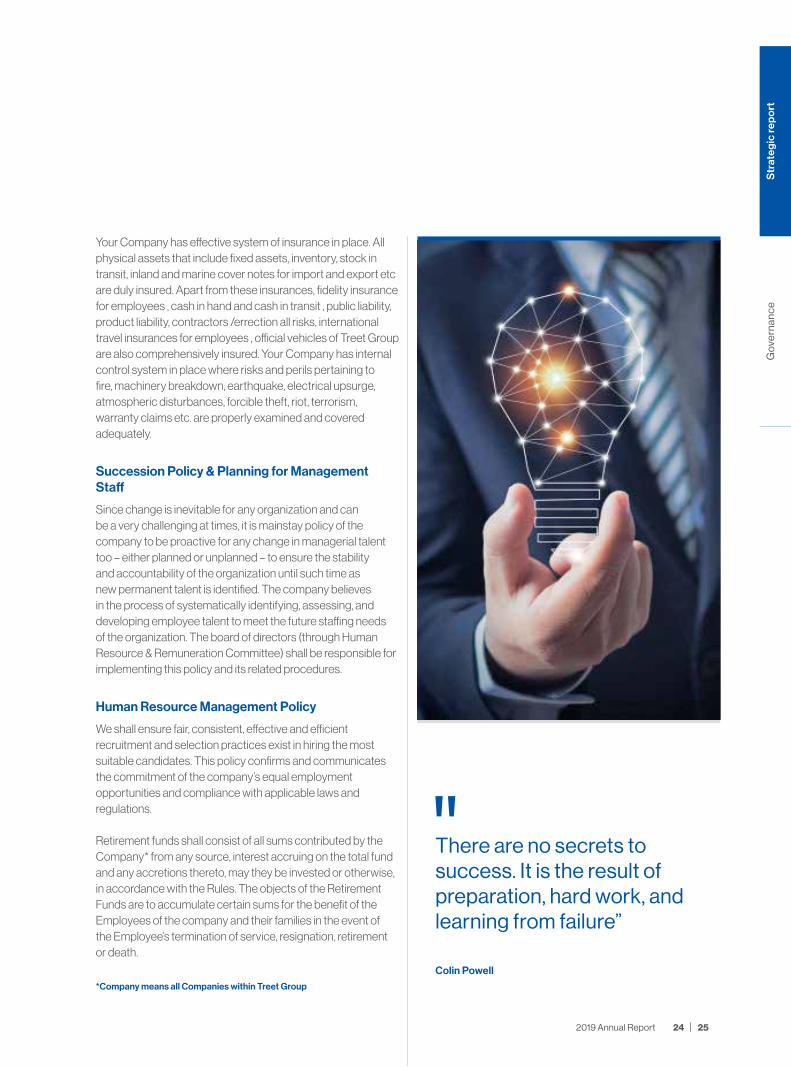
Your Company has effective system of insurance in place. All physical assets that include fixed assets, inventory, stock in transit, inland and marine cover notes for import and export etc are duly insured. Apart from these insurances, fidelity insurance for employees , cash in hand and cash in transit , public liability, product liability, contractors /errection all risks, international travel insurances for employees , official vehicles of Treet Group are also comprehensively insured. Your Company has internal control system in place where risks and perils pertaining to fire, machinery breakdown, earthquake, electrical upsurge, atmospheric disturbances, forcible theft, riot, terrorism, warranty claims etc. are properly examined and covered adequately.
Succession Policy & Planning for Management Staff
Since change is inevitable for any organization and can be a very challenging at times, it is mainstay policy of the company to be proactive for any change in managerial talent too – either planned or unplanned – to ensure the stability and accountability of the organization until such time as new permanent talent is identified. The company believes in the process of systematically identifying, assessing, and developing employee talent to meet the future staffing needs of the organization. The board of directors (through Human Resource & Remuneration Committee) shall be responsible for implementing this policy and its related procedures.
Human Resource Management Policy
We shall ensure fair, consistent, effective and efficient recruitment and selection practices exist in hiring the most suitable candidates. This policy confirms and communicates the commitment of the company’s equal employment opportunities and compliance with applicable laws and regulations.
Retirement funds shall consist of all sums contributed by the Company* from any source, interest accruing on the total fund and any accretions thereto, may they be invested or otherwise, in accordance with the Rules. The objects of the Retirement Funds are to accumulate certain sums for the benefit of the Employees of the company and their families in the event of the Employee’s termination of service, resignation, retirement or death.
*Company means all Companies within Treet Group
There are no secrets to success. It is the result of preparation, hard work, and learning from failure”
Colin Powell
25 2019 Annual Report 24
Str
ateg
ic re
po
rtG
ove
rnan
ce
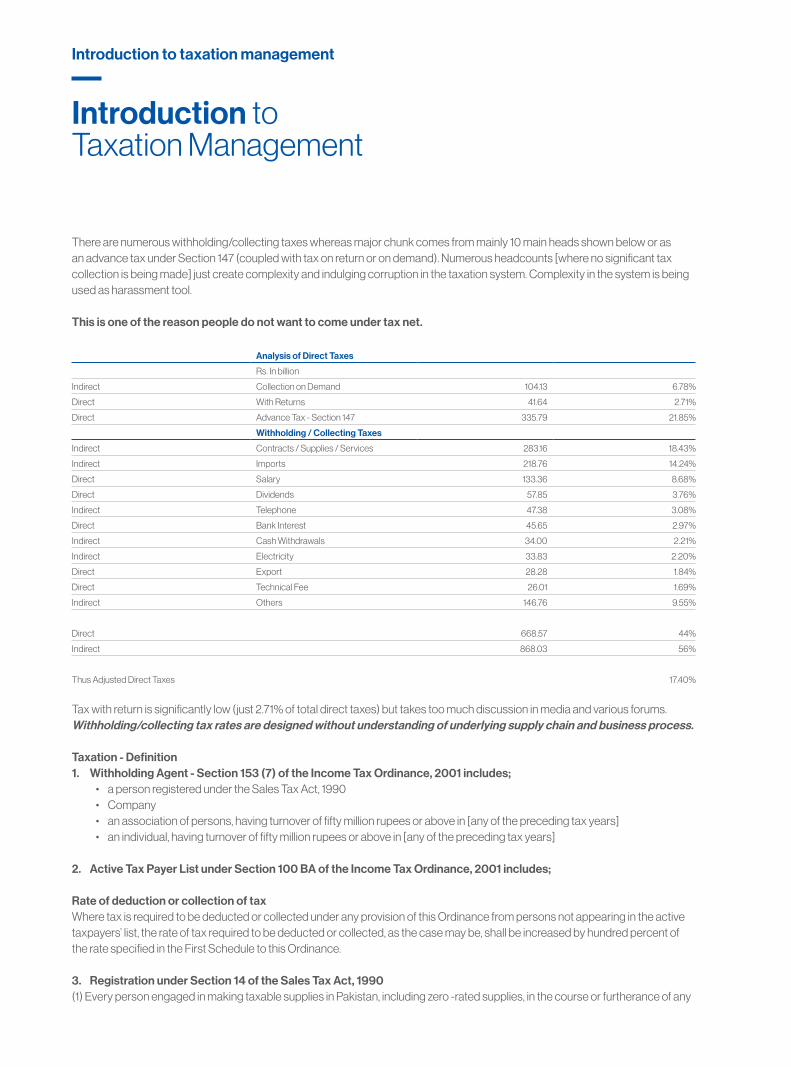
There are numerous withholding/collecting taxes whereas major chunk comes from mainly 10 main heads shown below or as an advance tax under Section 147 (coupled with tax on return or on demand). Numerous headcounts [where no significant tax collection is being made] just create complexity and indulging corruption in the taxation system. Complexity in the system is being used as harassment tool.
This is one of the reason people do not want to come under tax net.
Analysis of Direct Taxes
Rs. In billion
Indirect Collection on Demand 104.13 6.78%
Direct With Returns 41.64 2.71%
Direct Advance Tax - Section 147 335.79 21.85%
Withholding / Collecting Taxes
Indirect Contracts / Supplies / Services 283.16 18.43%
Indirect Imports 218.76 14.24%
Direct Salary 133.36 8.68%
Direct Dividends 57.85 3.76%
Indirect Telephone 47.38 3.08%
Direct Bank Interest 45.65 2.97%
Indirect Cash Withdrawals 34.00 2.21%
Indirect Electricity 33.83 2.20%
Direct Export 28.28 1.84%
Direct Technical Fee 26.01 1.69%
Indirect Others 146.76 9.55%
Direct 668.57 44%
Indirect 868.03 56%
Thus Adjusted Direct Taxes 17.40%
Tax with return is significantly low (just 2.71% of total direct taxes) but takes too much discussion in media and various forums. Withholding/collecting tax rates are designed without understanding of underlying supply chain and business process.
Taxation - Definition1. Withholding Agent - Section 153 (7) of the Income Tax Ordinance, 2001 includes;
• a person registered under the Sales Tax Act, 1990 • Company• an association of persons, having turnover of fifty million rupees or above in [any of the preceding tax years]• an individual, having turnover of fifty million rupees or above in [any of the preceding tax years]
2. Active Tax Payer List under Section 100 BA of the Income Tax Ordinance, 2001 includes;
Rate of deduction or collection of taxWhere tax is required to be deducted or collected under any provision of this Ordinance from persons not appearing in the active taxpayers’ list, the rate of tax required to be deducted or collected, as the case may be, shall be increased by hundred percent of the rate specified in the First Schedule to this Ordinance.
3. Registration under Section 14 of the Sales Tax Act, 1990(1) Every person engaged in making taxable supplies in Pakistan, including zero -rated supplies, in the course or furtherance of any
Introduction to Taxation Management
Introduction to taxation management

taxable activity carried on by him, falling in any of the following categories, if not already registered, is required to be registered under this Act, namely:
(a) a manufacturer who is not running a cottage industry; (b) a retailer who is liable to pay sales tax under the Act or rules made thereunder, excluding such retailer required to pay sales tax
through his electricity bill under sub -section (9) of section 3;(c) an importer; (d) an exporter who intends to obtain sales tax refund against his zero-rated supplies;(e) a wholesaler, dealer or distributor; and(f) a person who is required, under any other Federal law or Provincial law, to be registered for the purpose of any duty or tax
collected or paid as if it were a levy of sales tax to be collected under the Act;
4. Section 8(m) of the Sales Tax Act, 1990The input goods attributable to supplies made to un-registered person, on pro-rata basis, for which sale invoices do not bear the NIC number or NTN, as the case may be, of the recipient as stipulated in section 23.
5. Section 8(B) of the Sales Tax Act, 1990Notwithstanding anything contained in this Act, in relation to a tax period, a registered person shall not be allowed to adjust input tax in excess of ninety per cent of the output tax for that tax period.
6. Section 108(B) of the Income Tax Ordinance, 2001Transactions under dealership arrangements. — (1) Where a person supplies products listed in the Third Schedule to the Sales Tax Act, 1990 or any other products as prescribed by the Board, under a dealership arrangement with the dealers who are not registered under the Sales Tax Act, 1990 and are not appearing in the active taxpayers’ list under this Ordinance, an amount equal to seventy -five percent of the dealer's margin shall be added to the income of the person making such supplies.(2) For the purposes of operation of this section, ten percent of the sale price of the manufacturer shall be treated as dealers’ margin.
7. Rate of Tax under Normal Tax Regime under Division 1 & Division II [Part 1 of First Schedule]
Company 29%
Others (Individuals, Association of Persons etc.) 0% ~ 35%
8. Minimum tax under Section 113 [Division IX of Part 1 of First Schedule]
Motor Cycles 0.25%
Fast Moving Consumer Goods 0.20%
Other Cases 1.50%
9. Section 153 of the Income Tax Ordinance, 2001
for the sale of goods, except where payment is less than seventy-five thousand Rupees in aggregate, during a financial year;
Minimum Tax unless company being a manufacturer of such goods [or public company listed on a registered stock exchange in Pakistan]
27 2019 Annual Report 26
Str
ateg
ic re
po
rtG
ove
rnan
ce
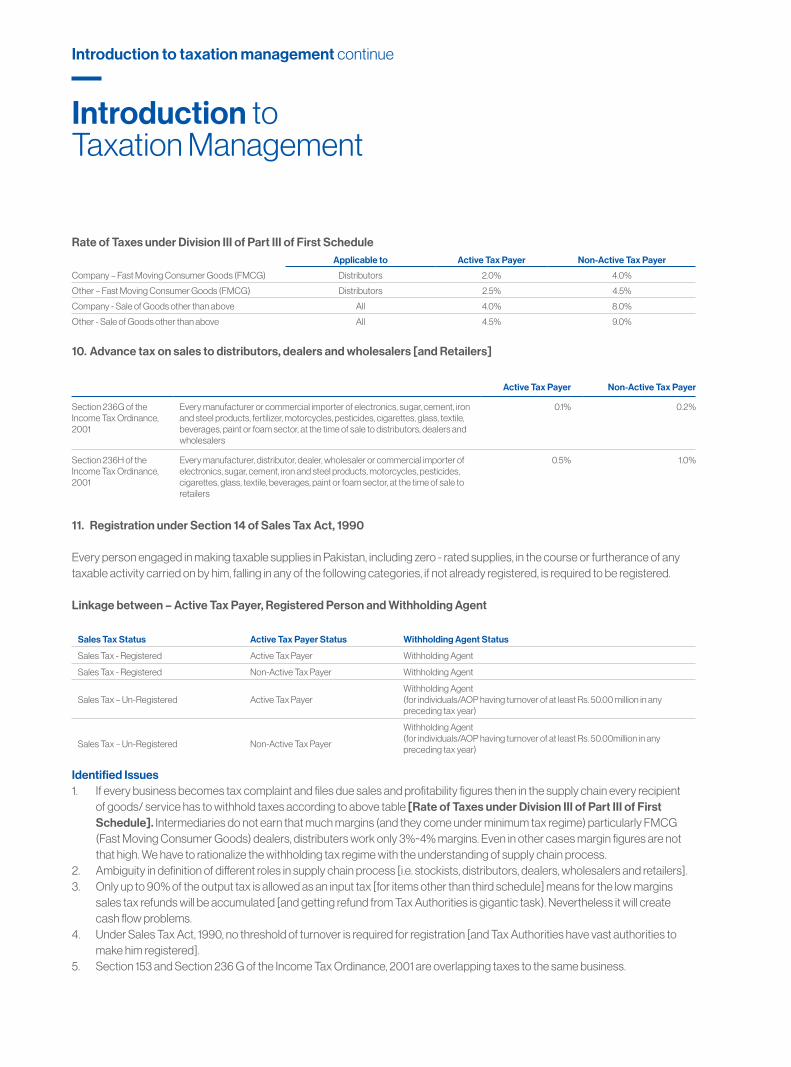
Rate of Taxes under Division III of Part III of First ScheduleApplicable to Active Tax Payer Non-Active Tax Payer
Company – Fast Moving Consumer Goods (FMCG) Distributors 2.0% 4.0%
Other – Fast Moving Consumer Goods (FMCG) Distributors 2.5% 4.5%
Company - Sale of Goods other than above All 4.0% 8.0%
Other - Sale of Goods other than above All 4.5% 9.0%
10. Advance tax on sales to distributors, dealers and wholesalers [and Retailers]
Active Tax Payer Non-Active Tax Payer
Section 236G of the Income Tax Ordinance, 2001
Every manufacturer or commercial importer of electronics, sugar, cement, iron and steel products, fertilizer, motorcycles, pesticides, cigarettes, glass, textile, beverages, paint or foam sector, at the time of sale to distributors, dealers and wholesalers
0.1% 0.2%
Section 236H of the Income Tax Ordinance, 2001
Every manufacturer, distributor, dealer, wholesaler or commercial importer of electronics, sugar, cement, iron and steel products, motorcycles, pesticides, cigarettes, glass, textile, beverages, paint or foam sector, at the time of sale to retailers
0.5% 1.0%
11. Registration under Section 14 of Sales Tax Act, 1990
Every person engaged in making taxable supplies in Pakistan, including zero - rated supplies, in the course or furtherance of any taxable activity carried on by him, falling in any of the following categories, if not already registered, is required to be registered.
Linkage between – Active Tax Payer, Registered Person and Withholding Agent
Sales Tax Status Active Tax Payer Status Withholding Agent Status
Sales Tax - Registered Active Tax Payer Withholding Agent
Sales Tax - Registered Non-Active Tax Payer Withholding Agent
Sales Tax – Un-Registered Active Tax PayerWithholding Agent(for individuals/AOP having turnover of at least Rs. 50.00 million in any preceding tax year)
Sales Tax – Un-Registered Non-Active Tax Payer
Withholding Agent(for individuals/AOP having turnover of at least Rs. 50.00million in any preceding tax year)
Identified Issues1. If every business becomes tax complaint and files due sales and profitability figures then in the supply chain every recipient
of goods/ service has to withhold taxes according to above table [Rate of Taxes under Division III of Part III of First Schedule]. Intermediaries do not earn that much margins (and they come under minimum tax regime) particularly FMCG (Fast Moving Consumer Goods) dealers, distributers work only 3%~4% margins. Even in other cases margin figures are not that high. We have to rationalize the withholding tax regime with the understanding of supply chain process.
2. Ambiguity in definition of different roles in supply chain process [i.e. stockists, distributors, dealers, wholesalers and retailers].3. Only up to 90% of the output tax is allowed as an input tax [for items other than third schedule] means for the low margins
sales tax refunds will be accumulated [and getting refund from Tax Authorities is gigantic task). Nevertheless it will create cash flow problems.
4. Under Sales Tax Act, 1990, no threshold of turnover is required for registration [and Tax Authorities have vast authorities to make him registered].
5. Section 153 and Section 236 G of the Income Tax Ordinance, 2001 are overlapping taxes to the same business.
Introduction to Taxation Management
Introduction to taxation management continue
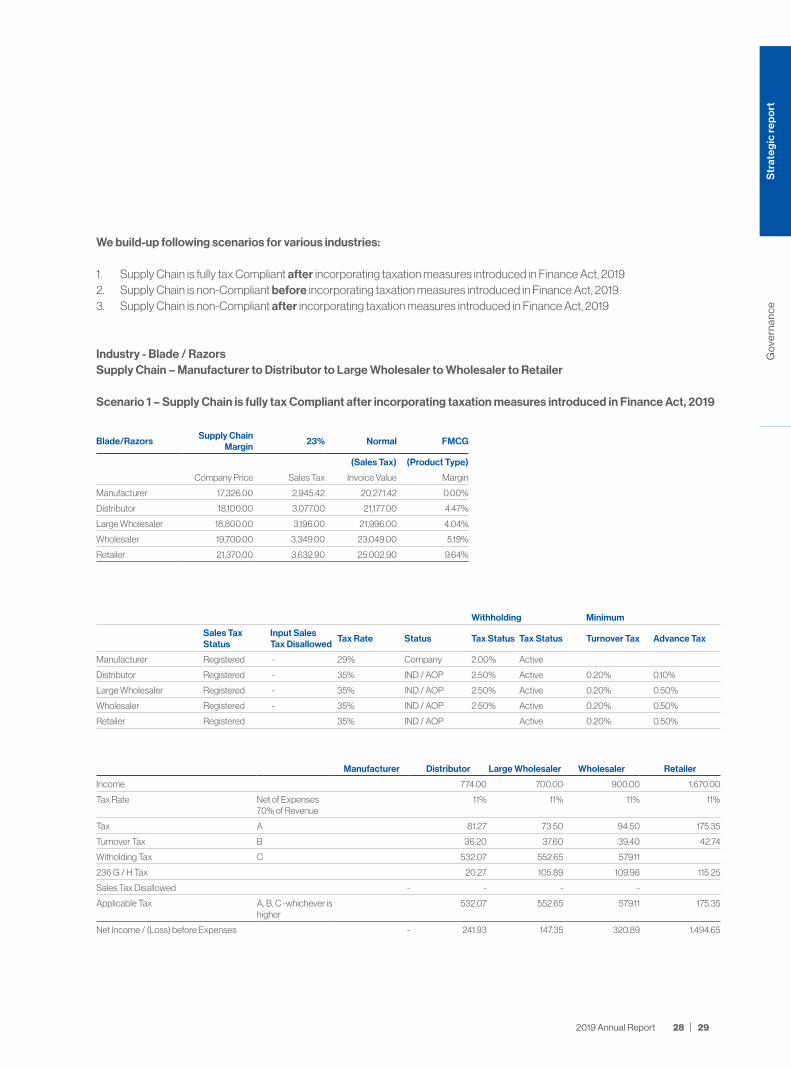
We build-up following scenarios for various industries:
1. Supply Chain is fully tax Compliant after incorporating taxation measures introduced in Finance Act, 20192. Supply Chain is non-Compliant before incorporating taxation measures introduced in Finance Act, 20193. Supply Chain is non-Compliant after incorporating taxation measures introduced in Finance Act, 2019
Industry - Blade / RazorsSupply Chain – Manufacturer to Distributor to Large Wholesaler to Wholesaler to Retailer
Scenario 1 – Supply Chain is fully tax Compliant after incorporating taxation measures introduced in Finance Act, 2019
Blade/RazorsSupply Chain
Margin23% Normal FMCG
(Sales Tax) (Product Type)
Company Price Sales Tax Invoice Value Margin
Manufacturer 17,326.00 2,945.42 20,271.42 0.00%
Distributor 18,100.00 3,077.00 21,177.00 4.47%
Large Wholesaler 18,800.00 3,196.00 21,996.00 4.04%
Wholesaler 19,700.00 3,349.00 23,049.00 5.19%
Retailer 21,370.00 3,632.90 25,002.90 9.64%
Withholding Minimum
Sales Tax Status
Input Sales Tax Disallowed
Tax Rate Status Tax Status Tax Status Turnover Tax Advance Tax
Manufacturer Registered - 29% Company 2.00% Active
Distributor Registered - 35% IND / AOP 2.50% Active 0.20% 0.10%
Large Wholesaler Registered - 35% IND / AOP 2.50% Active 0.20% 0.50%
Wholesaler Registered - 35% IND / AOP 2.50% Active 0.20% 0.50%
Retailer Registered 35% IND / AOP Active 0.20% 0.50%
Manufacturer Distributor Large Wholesaler Wholesaler Retailer
Income 774.00 700.00 900.00 1,670.00
Tax Rate Net of Expenses 70% of Revenue
11% 11% 11% 11%
Tax A 81.27 73.50 94.50 175.35
Turnover Tax B 36.20 37.60 39.40 42.74
Witholding Tax C 532.07 552.65 579.11
236 G / H Tax 20.27 105.89 109.98 115.25
Sales Tax Disallowed - - - -
Applicable Tax A, B, C -whichever is higher
532.07 552.65 579.11 175.35
Net Income / (Loss) before Expenses - 241.93 147.35 320.89 1,494.65
29 2019 Annual Report 28
Str
ateg
ic re
po
rtG
ove
rnan
ce

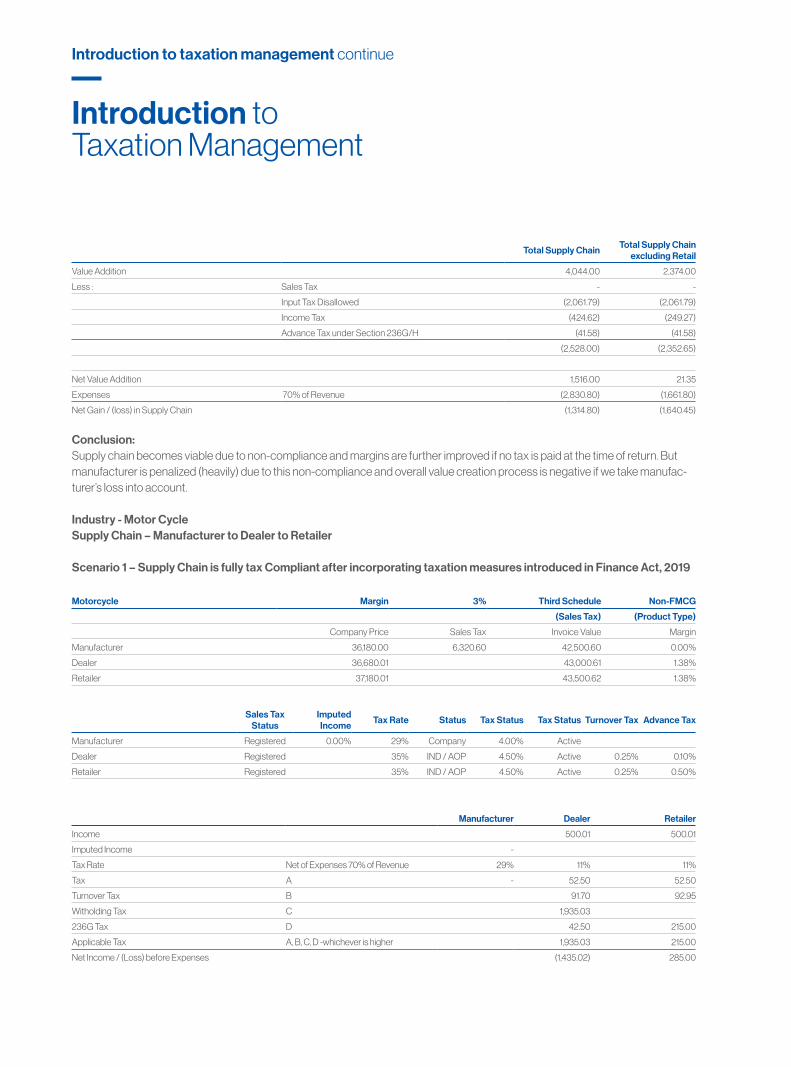
Total Supply Chain Total Supply Chain excluding Retail
Value Addition 7,676.90 5,723.00
Less : Sales Tax (3,632.90) (3,349.00)
Input Tax Disallowed - -
Income Tax (1,839.18) (1,663.83)
Advance Tax under Section 236G/H (351.38) (236.14) Cashflow Issue through refund
(5,823.46) (5,248.96)
Net Value Addition 1,853.44 474.04 -
Expenses 70% of Revenue (2,830.80) (1,661.80)
Net Gain / (loss) in Supply Chain (977.36) (1,187.76)
Conclusion:Supply chain becomes unviable due to withholding/collecting tax regime and Section 8B of the Sales Tax Act, 1990.
Scenario 2 – Supply Chain is non-Compliant before incorporating taxation measures introduced in Finance Act, 2019.
Blade/RazorsSupply Chain
Margin23% Normal FMCG
(Sales Tax) (Product Type)
Company Price Sales Tax Invoice Value Margin
Manufacturer 17,326.00 3,465.20 20,791.20 0.00%
Distributor 18,100.00 - 18,100.00 4.47%
Large Wholesaler 18,800.00 - 18,800.00 4.04%
Wholesaler 19,700.00 - 19,700.00 5.19%
Retailer 21,370.00 - 21,370.00 9.64%
Withholding Minimum
Sales Tax Status
Input Sales Tax Disallowed
Tax Rate Status Tax Status Tax Status Turnover Tax Advance Tax
Manufacturer Registered - 29% Company 2.00% Active
Distributor Un-Registered - 35% IND / AOP 5.00% Non-Active 0.00% 0.20%
Large Wholesaler Un-Registered - 35% IND / AOP 5.00% Non-Active 0.00% 1.00%
Wholesaler Un-Registered - 35% IND / AOP 5.00% Non-Active 0.00% 1.00%
Retailer Un-Registered - 35% IND / AOP Non-Active 0.00% 1.00%
Manufacturer Distributor Large Wholesaler Wholesaler Retailer
Income 774.00 700.00 900.00 1,670.00
Tax RateNet of Expenses 70% of Revenue
11% 11% 11% 11%
Tax A 81.27 73.50 94.50 175.35
Turnover Tax B - - - -
Witholding Tax C - - -
236 G / H Tax 41.58 - - -
Sales Tax Disallowed - - - -
Applicable TaxA, B, C -whichever is
higher 81.27 73.50 94.50 175.35
Net Income / (Loss) before Expenses - 692.73 626.50 805.50 1,494.65
Introduction to Taxation Management
Introduction to taxation management continue

Total Supply Chain Total Supply Chain excluding Retail
Value Addition 4,044.00 2,374.00
Less : Sales Tax - -
Input Tax Disallowed - -
Income Tax (424.62) (249.27)
Advance Tax under Section 236G/H (41.58) (41.58)
(466.20) (290.85)
Net Value Addition 3,577.80 2,083.15
Expenses 70% of Revenue (2,830.80) (1,661.80)
Net Gain / (loss) in Supply Chain 747.00 421.35
Conclusion:Supply chain becomes viable due to non-compliance and margins are further improved if no tax return is filed [and no tax is paid at the time of return].
Scenario 3 – Supply Chain is non-Compliant after incorporating taxation measures introduced in Finance Act, 2019
Blade/RazorsSupply Chain
Margin23% Normal FMCG
(Sales Tax) (Product Type)
Company Price Sales Tax Invoice Value Margin
Manufacturer 17,326.00 3,465.20 20,791.20 0.00%
Distributor 18,100.00 - 18,100.00 4.47%
Large Wholesaler 18,800.00 - 18,800.00 4.04%
Wholesaler 19,700.00 - 19,700.00 5.19%
Retailer 21,370.00 - 21,370.00 9.64%
Withholding Minimum
Sales Tax Status
Input Sales Tax Disallowed
Tax Rate Status Tax Status Tax Status Turnover Tax Advance Tax
Manufacturer Registered 2,061.79 29% Company 2.00% Active
Distributor Un-Registered - 35% IND / AOP 5.00% Non-Active 0.00% 0.20%
Large Wholesaler Un-Registered - 35% IND / AOP 5.00% Non-Active 0.00% 1.00%
Wholesaler Un-Registered - 35% IND / AOP 5.00% Non-Active 0.00% 1.00%
Retailer Un-Registered - 35% IND / AOP Non-Active 0.00% 1.00%
Manufacturer Distributor Large Wholesaler Wholesaler Retailer
Income 774.00 700.00 900.00 1,670.00
Tax RateNet of Expenses 70% of Revenue
11% 11% 11% 11%
Tax A 81.27 73.50 94.50 175.35
Turnover Tax B - - - -
Witholding Tax C - - - -
236 G / H Tax 41.58 - - -
Sales Tax Disallowed 2,061.79 - - - -
Applicable TaxA, B, C -whichever is higher
81.27 73.50 94.50 175.35
Net Income / (Loss) before Expenses (2,061.79) 692.73 626.50 805.50 1,494.65
31 2019 Annual Report 30
Str
ateg
ic re
po
rtG
ove
rnan
ce
Total Supply ChainTotal Supply Chain
excluding Retail
Value Addition 4,044.00 2,374.00
Less : Sales Tax - -
Input Tax Disallowed (2,061.79) (2,061.79)
Income Tax (424.62) (249.27)
Advance Tax under Section 236G/H (41.58) (41.58)
(2,528.00) (2,352.65)
Net Value Addition 1,516.00 21.35
Expenses 70% of Revenue (2,830.80) (1,661.80)
Net Gain / (loss) in Supply Chain (1,314.80) (1,640.45)
Conclusion:Supply chain becomes viable due to non-compliance and margins are further improved if no tax is paid at the time of return. But manufacturer is penalized (heavily) due to this non-compliance and overall value creation process is negative if we take manufac-turer’s loss into account.
Industry - Motor CycleSupply Chain – Manufacturer to Dealer to Retailer
Scenario 1 – Supply Chain is fully tax Compliant after incorporating taxation measures introduced in Finance Act, 2019
Motorcycle Margin 3% Third Schedule Non-FMCG
(Sales Tax) (Product Type)
Company Price Sales Tax Invoice Value Margin
Manufacturer 36,180.00 6,320.60 42,500.60 0.00%
Dealer 36,680.01 43,000.61 1.38%
Retailer 37,180.01 43,500.62 1.38%
Sales Tax Status
Imputed Income
Tax Rate Status Tax Status Tax Status Turnover Tax Advance Tax
Manufacturer Registered 0.00% 29% Company 4.00% Active
Dealer Registered 35% IND / AOP 4.50% Active 0.25% 0.10%
Retailer Registered 35% IND / AOP 4.50% Active 0.25% 0.50%
Manufacturer Dealer Retailer
Income 500.01 500.01
Imputed Income -
Tax Rate Net of Expenses 70% of Revenue 29% 11% 11%
Tax A - 52.50 52.50
Turnover Tax B 91.70 92.95
Witholding Tax C 1,935.03
236G Tax D 42.50 215.00
Applicable Tax A, B, C, D -whichever is higher 1,935.03 215.00
Net Income / (Loss) before Expenses (1,435.02) 285.00
Introduction to Taxation Management
Introduction to taxation management continue
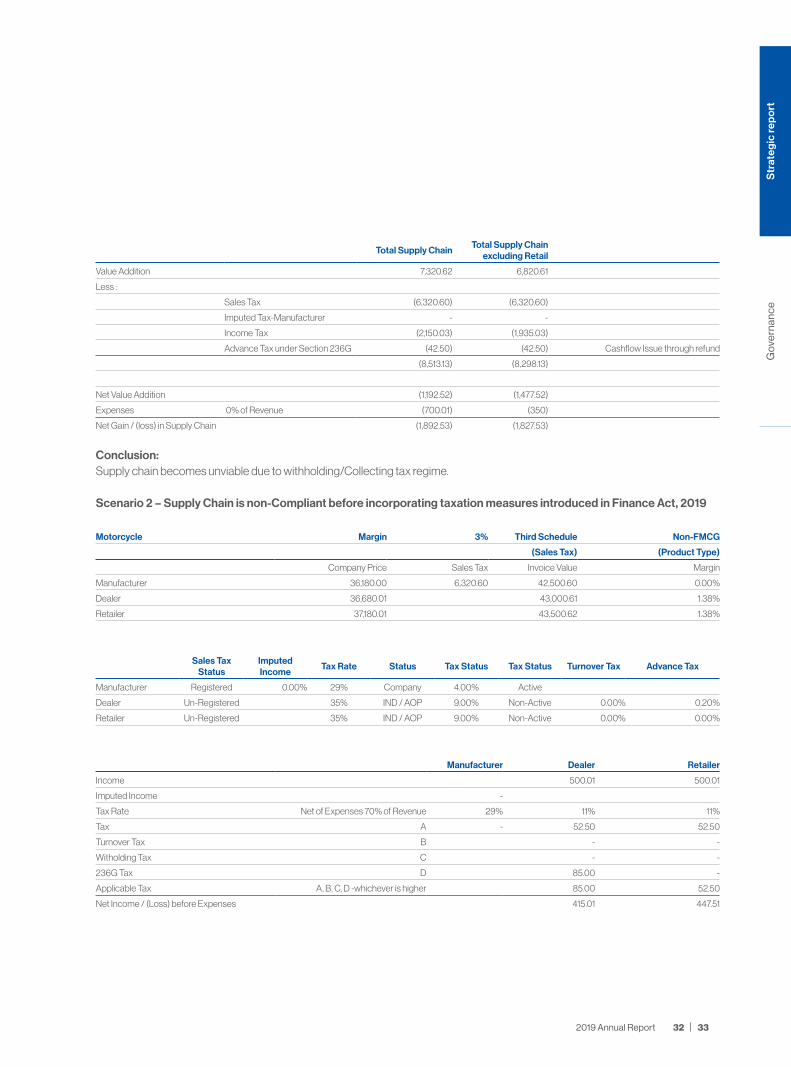
Total Supply ChainTotal Supply Chain
excluding Retail
Value Addition 7,320.62 6,820.61
Less :
Sales Tax (6,320.60) (6,320.60)
Imputed Tax-Manufacturer - -
Income Tax (2,150.03) (1,935.03)
Advance Tax under Section 236G (42.50) (42.50) Cashflow Issue through refund
(8,513.13) (8,298.13)
Net Value Addition (1,192.52) (1,477.52)
Expenses 0% of Revenue (700.01) (350)
Net Gain / (loss) in Supply Chain (1,892.53) (1,827.53)
Conclusion:Supply chain becomes unviable due to withholding/Collecting tax regime.
Scenario 2 – Supply Chain is non-Compliant before incorporating taxation measures introduced in Finance Act, 2019
Motorcycle Margin 3% Third Schedule Non-FMCG
(Sales Tax) (Product Type)
Company Price Sales Tax Invoice Value Margin
Manufacturer 36,180.00 6,320.60 42,500.60 0.00%
Dealer 36,680.01 43,000.61 1.38%
Retailer 37,180.01 43,500.62 1.38%
Sales Tax Status
Imputed Income
Tax Rate Status Tax Status Tax Status Turnover Tax Advance Tax
Manufacturer Registered 0.00% 29% Company 4.00% Active
Dealer Un-Registered 35% IND / AOP 9.00% Non-Active 0.00% 0.20%
Retailer Un-Registered 35% IND / AOP 9.00% Non-Active 0.00% 0.00%
Manufacturer Dealer Retailer
Income 500.01 500.01
Imputed Income -
Tax Rate Net of Expenses 70% of Revenue 29% 11% 11%
Tax A - 52.50 52.50
Turnover Tax B - -
Witholding Tax C - -
236G Tax D 85.00 -
Applicable Tax A, B, C, D -whichever is higher 85.00 52.50
Net Income / (Loss) before Expenses 415.01 447.51
33 2019 Annual Report 32
Str
ateg
ic re
po
rtG
ove
rnan
ce

Total Supply ChainTotal Supply Chain excluding
Retail
Value Addition 7,320.62 6,820.61
Less :
Sales Tax (6,320.60) (6,320.60)
Imputed Tax-Manufacturer - -
Income Tax (137.50) (85.00)
(6,458.10) (6,405.60)
Net Value Addition 862.51 415.01
Expenses 0% of Revenue (700.01) (350)
Net Gain / (loss) in Supply Chain 162.50 65.00
Conclusion:Supply chain becomes viable due to non-compliance and margins are further improved if no tax return is filed [and no tax is paid at the time of return].
Scenario 3 – Supply Chain is non-Compliant after incorporating taxation measures introduced in Finance Act, 2019
Motorcycle Margin 3% Third Schedule Non-FMCG
(Sales Tax) (Product Type)
Company Price Sales Tax Invoice Value Margin
Manufacturer 36,180.00 6,320.60 42,500.60 0.00%
Dealer 36,680.01 43,000.61 1.38%
Retailer 37,180.01 43,500.62 1.38%
Sales Tax Status
Imputed Income
Tax Rate Status Tax Status Tax Status Turnover Tax Advance TaxInput Sales Tax
Disallowed
Manufacturer Registered 7.50% 29% Company 4.00% Active 6,320.60
Dealer Un-Registered 35% IND / AOP 9.00% Non-Active 0.00% 0.20%
Retailer Un-Registered 35% IND / AOP 9.00% Non-Active 0.00% 0.00%
6,320.60
Manufacturer Dealer Retailer
Income 500.01 500.01
Imputed Income 2,713.50
Tax Rate Net of Expenses 70% of Revenue 29% 11% 11%
Tax A 786.92 52.50 52.50
Turnover Tax B - -
Witholding Tax C - -
236G Tax D 85.00 -
Applicable Tax A, B, C, D -whichever is higher 85.00 52.50
Net Income / (Loss) before Expenses 415.01 447.51
Introduction to Taxation Management
Introduction to taxation management continue
Total Supply ChainTotal Supply Chain excluding
Retail
Value Addition 7,320.62 6,820.61
Less
Sales Tax (6,320.60) (6,320.60)
Imputed Tax-Manufacturer (786.92) (786.92)
Input tax Disallowed (6,320.60) (6,320.60)
Income Tax (137.50) (85.00)
(13,565.62) (13,598.12)
Net Value Addition (6,245.01) (6,777.51)
Expenses 0% of Revenue (700.01) (350)
Net Gain / (loss) in Supply Chain (6,945.02) (7,127.52)
Conclusion:
Supply chain becomes viable due to non-compliance and margins are further improved if no tax is paid at the time of return. But manufacturer is penalized (heavily) due to this non-compliance and overall value creation process is negative if we take manufacturer’s loss into account.
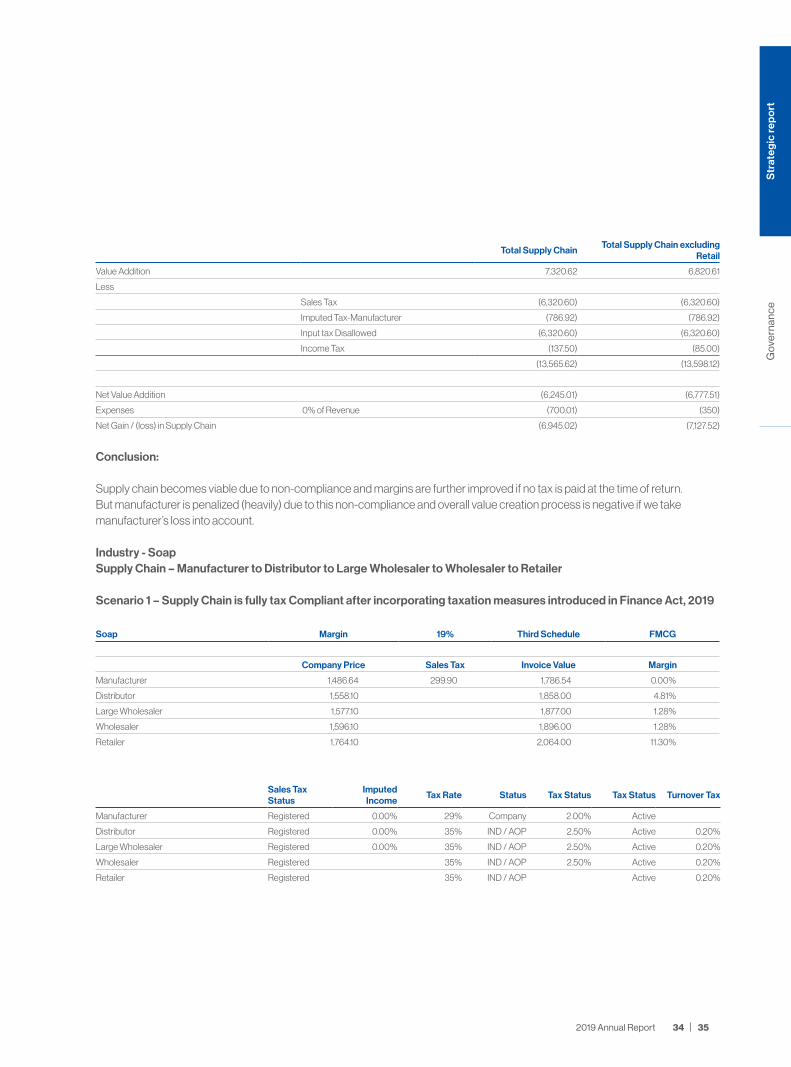
Industry - SoapSupply Chain – Manufacturer to Distributor to Large Wholesaler to Wholesaler to Retailer
Scenario 1 – Supply Chain is fully tax Compliant after incorporating taxation measures introduced in Finance Act, 2019
Soap Margin 19% Third Schedule FMCG
Company Price Sales Tax Invoice Value Margin
Manufacturer 1,486.64 299.90 1,786.54 0.00%
Distributor 1,558.10 1,858.00 4.81%
Large Wholesaler 1,577.10 1,877.00 1.28%
Wholesaler 1,596.10 1,896.00 1.28%
Retailer 1,764.10 2,064.00 11.30%
Sales Tax Status
Imputed Income
Tax Rate Status Tax Status Tax Status Turnover Tax
Manufacturer Registered 0.00% 29% Company 2.00% Active
Distributor Registered 0.00% 35% IND / AOP 2.50% Active 0.20%
Large Wholesaler Registered 0.00% 35% IND / AOP 2.50% Active 0.20%
Wholesaler Registered 35% IND / AOP 2.50% Active 0.20%
Retailer Registered 35% IND / AOP Active 0.20%
35 2019 Annual Report 34
Str
ateg
ic re
po
rtG
ove
rnan
ce

Manufacturer DistributorLarge
WholesalerWholesaler Retailer
Income 71.46 19.00 19.00 168.00
Imputed Income - - -
Tax Rate Net of Expenses 70% of Revenue 29% 11% 11% 11% 11%
Tax A - 7.50 2.00 2.00 17.64
Turnover Tax B 3.12 3.15 3.19 3.53
Witholding Tax C 46.45 46.92 47.40
Applicable Tax A, B, C-whichever is higher 46.45 46.92 47.40 17.64
Net Income / (Loss) before Expenses - 25.01 (27.92) (28.40) 150.36
Total Supply Chain Total Supply Chain excluding Retail
Value Addition 577.36 409.36
Less :
Sales Tax (299.90) (299.90)
Imputed Tax-Manufacturer - -
Income Tax (158.41) (140.77)
(458.31) (440.67)
Net Value Addition 119.05 (31.31)
Expenses 70% of Revenue (194.22) (76.62)
Net Gain / (loss) in Supply Chain (75.18) (107.94)
Conclusion:Supply chain becomes unviable due to withholding tax regime.
Scenario 2 – Supply Chain is non-Compliant before incorporating taxation measures introduced in Finance Act, 2019
Soap Margin 19% Third Schedule FMCG
Company Price Sales Tax Invoice Value Margin
Manufacturer 1,486.64 299.90 1,786.54 0.00%
Distributor 1,558.10 1,858.00 4.81%
Large Wholesaler 1,577.10 1,877.00 1.28%
Wholesaler 1,596.10 1,896.00 1.28%
Retailer 1,764.10 2,064.00 11.30%
Sales Tax Status Imputed Income Tax Rate Status Tax Status Tax Status Turnover Tax
Manufacturer Registered 0.00% 29% Company 2.00% Active
Distributor Un-Registered 0.00% 35% IND / AOP 5.00% Non-Active 0.00%
Large Wholesaler Un-Registered 0.00% 35% IND / AOP 5.00% Non-Active 0.00%
Wholesaler Un-Registered 35% IND / AOP 5.00% Non-Active 0.00%
Retailer Un-Registered 35% IND / AOP Non-Active 0.00%
Introduction to Taxation Management
Introduction to taxation management continue
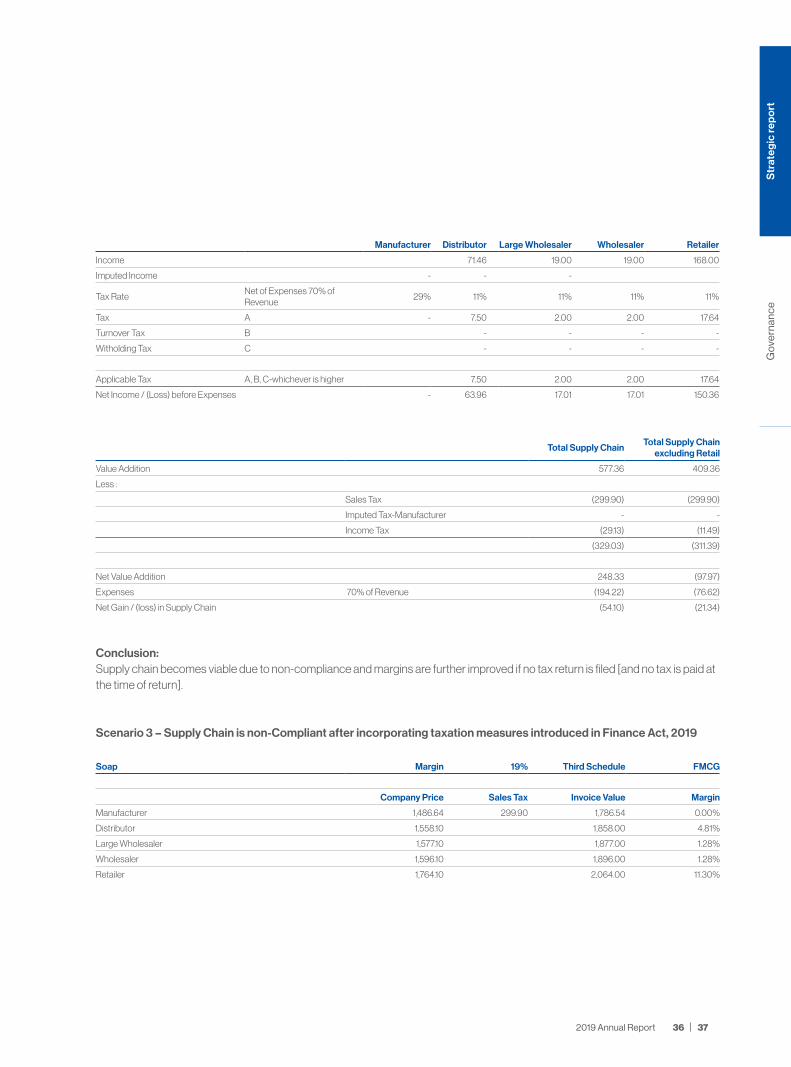
Manufacturer Distributor Large Wholesaler Wholesaler Retailer
Income 71.46 19.00 19.00 168.00
Imputed Income - - -
Tax RateNet of Expenses 70% of Revenue
29% 11% 11% 11% 11%
Tax A - 7.50 2.00 2.00 17.64
Turnover Tax B - - - -
Witholding Tax C - - - -
Applicable Tax A, B, C-whichever is higher 7.50 2.00 2.00 17.64
Net Income / (Loss) before Expenses - 63.96 17.01 17.01 150.36
Total Supply ChainTotal Supply Chain
excluding Retail
Value Addition 577.36 409.36
Less :
Sales Tax (299.90) (299.90)
Imputed Tax-Manufacturer - -
Income Tax (29.13) (11.49)
(329.03) (311.39)
Net Value Addition 248.33 (97.97)
Expenses 70% of Revenue (194.22) (76.62)
Net Gain / (loss) in Supply Chain (54.10) (21.34)
Conclusion:Supply chain becomes viable due to non-compliance and margins are further improved if no tax return is filed [and no tax is paid at the time of return].
Scenario 3 – Supply Chain is non-Compliant after incorporating taxation measures introduced in Finance Act, 2019
Soap Margin 19% Third Schedule FMCG
Company Price Sales Tax Invoice Value Margin
Manufacturer 1,486.64 299.90 1,786.54 0.00%
Distributor 1,558.10 1,858.00 4.81%
Large Wholesaler 1,577.10 1,877.00 1.28%
Wholesaler 1,596.10 1,896.00 1.28%
Retailer 1,764.10 2,064.00 11.30%
37 2019 Annual Report 36
Str
ateg
ic re
po
rtG
ove
rnan
ce

Sales Tax Status
Imputed Income
Tax Rate Status Tax Status Tax Status Turnover TaxImputed
Income
Manufacturer Registered 7.50% 29% Company 2.00% Active 299.90
Distributor Un-Registered 0.00% 35% IND / AOP 5.00% Non-Active 0.00% -
Large Wholesaler Un-Registered 0.00% 35% IND / AOP 5.00% Non-Active 0.00% -
Wholesaler Un-Registered 35% IND / AOP 5.00% Non-Active 0.00% -
Retailer Un-Registered 35% IND / AOP Non-Active 0.00% -
299.90
Manufacturer DistributorLarge
WholesalerWholesaler Retailer
Income 71.46 19.00 19.00 168.00
Imputed Income 111.50 - -
Tax Rate Net of Expenses 70% of Revenue 29% 11% 11% 11% 11%
Tax A 32.33 7.50 2.00 2.00 17.64
Turnover Tax B - - - -
Witholding Tax C - - - -
Applicable Tax A, B, C-whichever is higher 7.50 2.00 2.00 17.64
Net Income / (Loss) before Expenses (32.33) 63.96 17.01 17.01 150.36
Total Supply ChainTotal Supply Chain excluding
Retail
Value Addition 577.36 409.36
Less :
Sales Tax (299.90) (299.90)
Imputed Tax-Manufacturer (32.33) (32.33)
Input Tax Disallowed (299.90) (299.90)
Income Tax (29.13) (11.49)
(661.26) (643.62)
Net Value Addition (83.90) (234.26)
Expenses 70% of Revenue (194.22) (76.62)
Net Gain / (loss) in Supply Chain (278.13) (310.89)
Conclusion:Supply chain becomes viable due to non-compliance and margins are further improved if no tax is paid at the time of return. But manufacturer is penalized (heavily) due to this non-compliance.
Introduction to Taxation Management
Introduction to taxation management continue

Industry - BatterySupply Chain – Manufacturer to Dealer to Retailer
Scenario 1 – Supply Chain is fully tax Compliant after incorporating taxation measures introduced in Finance Act, 2019
Battery Margin 18% Third Schedule Non-FMCG
Company Price Sales Tax Invoice Value Margin
Manufacturer 3,060.00 612.00 3,672.00 0.00%
Dealer 3,215.00 3,827.00 5.07%
Retailer 3,600.00 4,212.00 12.58%
-
Sales Tax Status
Imputed Income
Tax Rate Status Tax Status Tax Status Turnover Tax
Manufacturer Registered 0.00% 29% Company 4.00% Active
Dealer Registered 35% IND / AOP 4.50% Active 1.50%
Retailer Registered 35% IND / AOP Active 1.50%
Manufacturer Dealer Retailer
Income 155.00 385.00
Imputed Income -
Tax Rate Net of Expenses 70% of Revenue 29% 11% 11%
Tax A - 16.28 40.43
Turnover Tax B 48.23 54.00
Witholding Tax C 172.22
Additional Discount
Applicable Tax A, B, C-whichever is higher 172.22 54.00
Net Income / (Loss) before Expenses (17.22) 331.00
Total Supply ChainTotal Supply Chain
excluding Retail
Value Addition 1,152.00 767.00
Less :
Sales Tax (612.00) (612.00)
Imputed Tax-Manufacturer - -
Income Tax (226.22) (172.22)
Additional Discount - -
(838.22) (784.22)
Net Value Addition 313.79 (17.22)
Expenses 70% of Revenue (378.00) (108.50)
Net Gain / (loss) in Supply Chain (64.22) (125.72)
Conclusion:Supply chain becomes unviable due to withholding tax regime.
39 2019 Annual Report 38
Str
ateg
ic re
po
rtG
ove
rnan
ce
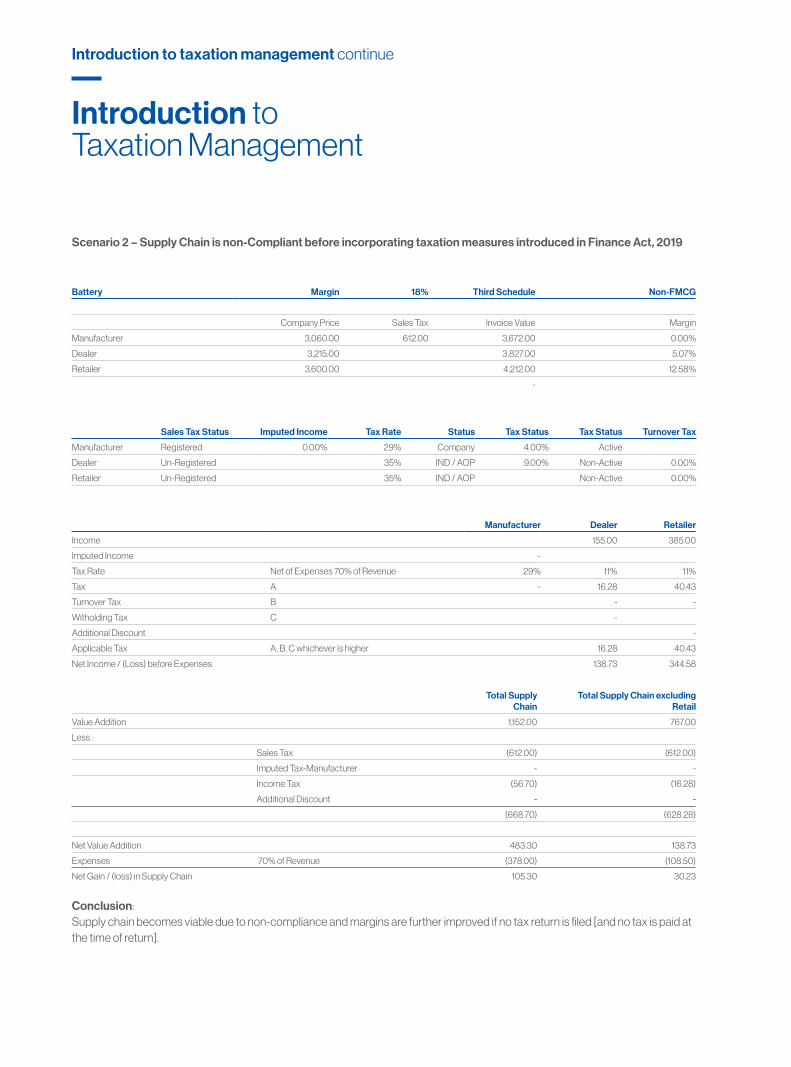
Scenario 2 – Supply Chain is non-Compliant before incorporating taxation measures introduced in Finance Act, 2019
Battery Margin 18% Third Schedule Non-FMCG
Company Price Sales Tax Invoice Value Margin
Manufacturer 3,060.00 612.00 3,672.00 0.00%
Dealer 3,215.00 3,827.00 5.07%
Retailer 3,600.00 4,212.00 12.58%
-
Sales Tax Status Imputed Income Tax Rate Status Tax Status Tax Status Turnover Tax
Manufacturer Registered 0.00% 29% Company 4.00% Active
Dealer Un-Registered 35% IND / AOP 9.00% Non-Active 0.00%
Retailer Un-Registered 35% IND / AOP Non-Active 0.00%
Manufacturer Dealer Retailer
Income 155.00 385.00
Imputed Income -
Tax Rate Net of Expenses 70% of Revenue 29% 11% 11%
Tax A - 16.28 40.43
Turnover Tax B - -
Witholding Tax C -
Additional Discount -
Applicable Tax A, B, C whichever is higher 16.28 40.43
Net Income / (Loss) before Expenses 138.73 344.58
Total Supply Chain
Total Supply Chain excluding Retail
Value Addition 1,152.00 767.00
Less :
Sales Tax (612.00) (612.00)
Imputed Tax-Manufacturer - -
Income Tax (56.70) (16.28)
Additional Discount - -
(668.70) (628.28)
Net Value Addition 483.30 138.73
Expenses 70% of Revenue (378.00) (108.50)
Net Gain / (loss) in Supply Chain 105.30 30.23
Conclusion:Supply chain becomes viable due to non-compliance and margins are further improved if no tax return is filed [and no tax is paid at the time of return].
Introduction to Taxation Management
Introduction to taxation management continue
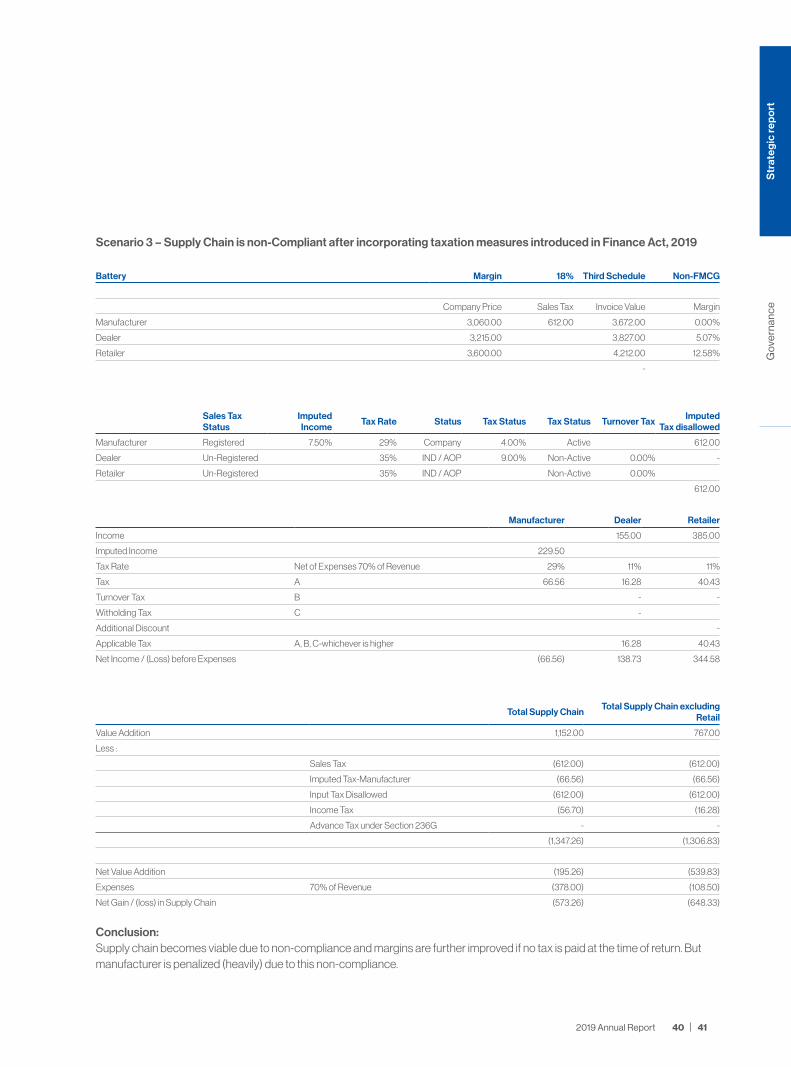
Scenario 3 – Supply Chain is non-Compliant after incorporating taxation measures introduced in Finance Act, 2019
Battery Margin 18% Third Schedule Non-FMCG
Company Price Sales Tax Invoice Value Margin
Manufacturer 3,060.00 612.00 3,672.00 0.00%
Dealer 3,215.00 3,827.00 5.07%
Retailer 3,600.00 4,212.00 12.58%
-
Sales Tax Status
Imputed Income
Tax Rate Status Tax Status Tax Status Turnover TaxImputed
Tax disallowed
Manufacturer Registered 7.50% 29% Company 4.00% Active 612.00
Dealer Un-Registered 35% IND / AOP 9.00% Non-Active 0.00% -
Retailer Un-Registered 35% IND / AOP Non-Active 0.00%
612.00
Manufacturer Dealer Retailer
Income 155.00 385.00
Imputed Income 229.50
Tax Rate Net of Expenses 70% of Revenue 29% 11% 11%
Tax A 66.56 16.28 40.43
Turnover Tax B - -
Witholding Tax C -
Additional Discount -
Applicable Tax A, B, C-whichever is higher 16.28 40.43
Net Income / (Loss) before Expenses (66.56) 138.73 344.58
Total Supply ChainTotal Supply Chain excluding
Retail
Value Addition 1,152.00 767.00
Less :
Sales Tax (612.00) (612.00)
Imputed Tax-Manufacturer (66.56) (66.56)
Input Tax Disallowed (612.00) (612.00)
Income Tax (56.70) (16.28)
Advance Tax under Section 236G - -
(1,347.26) (1,306.83)
Net Value Addition (195.26) (539.83)
Expenses 70% of Revenue (378.00) (108.50)
Net Gain / (loss) in Supply Chain (573.26) (648.33)
Conclusion:Supply chain becomes viable due to non-compliance and margins are further improved if no tax is paid at the time of return. But manufacturer is penalized (heavily) due to this non-compliance.
41 2019 Annual Report 40
Str
ateg
ic re
po
rtG
ove
rnan
ce
General ConclusionWithholding tax regime and Section 8B of the Sales Tax Act, 1990 [and minimum turnover tax (particularly for other thanFMCG business)] are major deterrent in tax compliance. Tax structure shows lack of understanding of supply chain process andthis is one of the reason people do not want to come under tax net.
Cost of tax compliance is more than tax non-compliance.
Introduction to Taxation Management
"Chase the vision, not the money, themoney will end up following you."
Introduction to taxation management continue
43 2019 Annual Report 43
Go
vern
ance
Str
ateg
ic re
po
rt

Pursuant to the approval of the shareholders of the Company in the Extraordinary Ordinary General Meeting (EOGM) held on October 31, 2016, the Company intends to issue Preference Shares of up to Rs. 1,000,000,000/- (Rupees One Billion Only) divided into 100,000,000/- (One Hundred Million Only) of Rs. 10/- each subject to the approval of Securities & Exchange Commission of Pakistan (SECP).
The following are salient features of the proposed preference shares:
1. Total No. of Preference Shares100,000,000 preference shares of Rs. 10/- each (Authorized Capital – Preference Shares : 150,000,000) Authorized capital can be utilized in one or more tranche(s)
2. Cumulative / Non- Cumulative Cumulative Preference Shares
3. Issue Price Rs. 10/- per share with NIL premium
4. Rate of Preference DividendLinked to Profitability of “Designated Subsidiary” i.e. Global Arts Limited as elaborated in the “Special Resolution”
5. Mode of Issuance By way of Right to the existing shareholders
6. Purpose of the IssueTo finance the diversification stratagem of the Company i.e. for the educational project of the Company (detail is given below)
7. Listing Listing will be applied at Pakistan Stock Exchange Limited
8. RedemptionRedemption any time after 04years of its first issue at par value in cash at option of preference shareholder
9. Exit Strategy
Two exit options will be given to the Preference Shareholders:• Secondary Market : Preference Shares will be listed on Pakistan Stock Exchange
Limited.• Redemption Option to the Preference Shareholder after expiry of 04years of first
issue.
10.Participation in the Surplus Assets
in the event of winding up of the Company or repayment of the capital of the Company, the Preference Shares will carry a preferential right over Ordinary Shares only to the extent of proceeds arising from sales of shares of the Designated Subsidiary and/or assets of the Designated Subsidiary
11. Convertibility Non-Convertible
12. Voting Right
The following decisions shall not be taken either by the Company or the Designated Subsidiary except with the approval of the Preference Shareholders by means of an ordinary resolution passed at a general meeting of the Preference Shareholders:• Any sale, transfer, encumbrance or alienation of shares of the Designated
Subsidiary owned by the Company or dilution of Company’s shareholding in the Designated Subsidiary through any other means;
• Nomination/selection of not less than 50 % of the proposed directors to be elected by the Company on the Board of Directors of the Designated Subsidiary;
• Any sale, transfer, lease, encumbrance or alienation of the business, assets, undertaking etc. of the Designated Subsidiary or any portion thereof;
• Any resolution for the winding-up of the Designated Subsidiary;
13. -----Clauses 4 & 4A [of the Articles of Association] for Preference Shares is attached herewith
Preference Shares
Financial planning
Justification of the Issue
The Company is considering various project as a part of diversification stratagem and one of the project is educational project.
Company is considering various funding options for any of the educational project. One of the funding option that management of the Company is considering is preference shares that is structured in a unique way to track the performance of the “designated subsidiary” that will be undertaking the said project.
Preference shares are designed to track the performance of the designated subsidiary and its payouts will be directly linked to the performance of that subsidiary. These preference shares will be offered to the existing shareholders by way of right.
The designated project is educational project and designated subsidiary is “Global Arts Limited (GAL)” as follows:
1. Educational Project
The Company’s corporate strategy is to develop synergies by sharing and coordinating staff and other resources across business units, investing financial resources across business units, and using business units to complement other corporate business activities. One of the Projects that Company has embarked is an “educational project” in field of Art, Culture and Architecture. This Project is implemented through two subsidiaries i.e. Global Arts Limited (GAL) and Society for Cultural Education (SCE). SCE has established an Institute in the field of Art, culture and Architecture through promulgation of an Act by National Assembly through “The Institute for Art and Culture Act, 2018 (Act No.XXX1 of 2018)”.
2. Global Arts Limited
Global Arts Limited (GAL) is wholly owned subsidiary of Treet Corporation Limited. Global Arts Limited (GAL), previously, Treet Services (Private) Limited was incorporated in Pakistan on 26th October 2007 as a private limited company under the Companies Ordinance, 1984. Subsequently, on 23 July 2014, the Company was converted into a public limited company.
Initially Company was envisaged to cater technical services but Company did not operate as such and thereafter has changed the name of the Company to “Global Arts Limited”. Objects clauses are also changed to promote, establish, run manage and maintain, educational institutions, colleges of arts, research, sciences, information technology and business administration; higher level schools, academics, technical training centers and such other educational institutions as may be considered appropriate for the promotion and advancement of education in the country with national and international affiliations to acquire the services of professors, associate professors, lecturers, teachers, managements skills and other professional from within the country and abroad as would be needed to run and promote educational institutions set up by the Company subject however, to the permission of competent authority but not to operate itself as a university and not to act as a degree awarding institution. Its registered office is situated at 72-B, Industrial Area Kotlakhpat, Lahore.
3. Society for Cultural Education
Society for Cultural Education (SCE) is a Society registered under the Societies Registration Act, XXI of 1860, and having its Registered/Head Office at, 72-B, Kotlakhpat Industrial Area, Lahore. Object clauses include to establish, construct, run, maintain and manage schools, professional schools and colleges, universities, coaching classes, offices, libraries, information centers and other institutions for imparting moral, academic and technical education to children and adults and to promote and encourage the study of all arts, sciences, culture, history and general knowledge, subject to necessary permissions from regulatory bodies, if any and to take over running business of, or affiliate with or obtain affiliation from, any universities, colleges, schools, educational institutes, information centers and/or any other institutions etc.
45 2019 Annual Report 44
Str
ateg
ic re
po
rtG
ove
rnan
ce
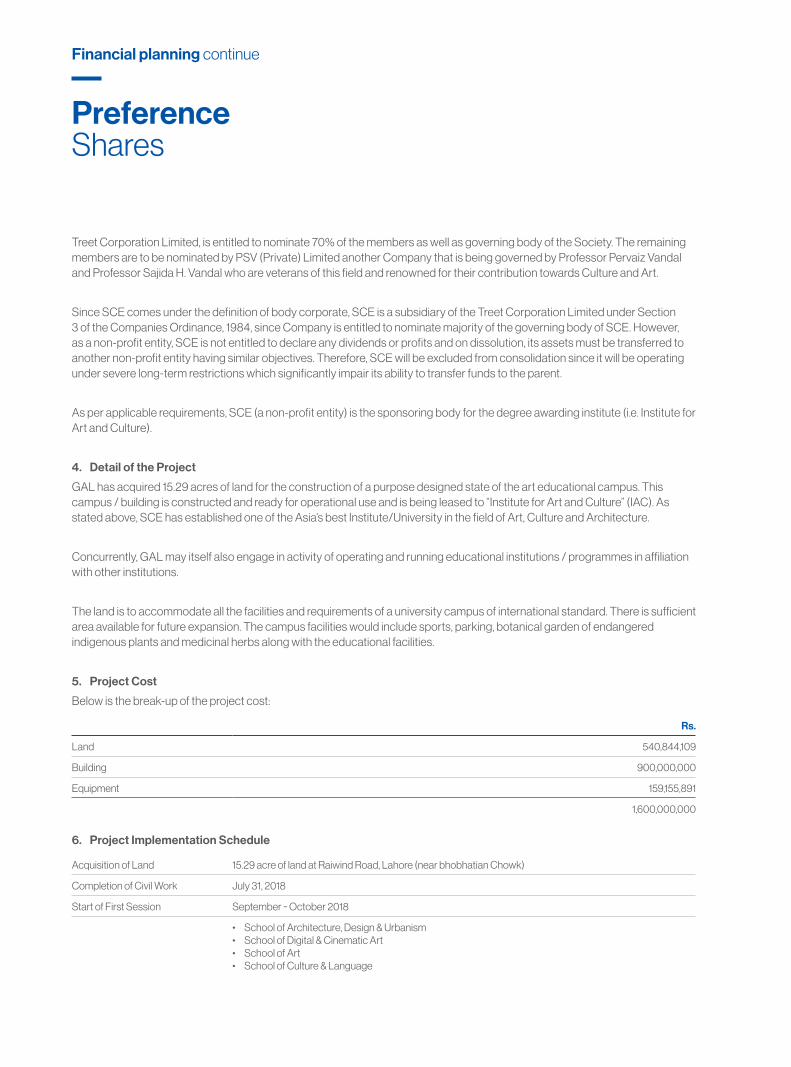
Financial planning continue
Treet Corporation Limited, is entitled to nominate 70% of the members as well as governing body of the Society. The remaining members are to be nominated by PSV (Private) Limited another Company that is being governed by Professor Pervaiz Vandal and Professor Sajida H. Vandal who are veterans of this field and renowned for their contribution towards Culture and Art.
Since SCE comes under the definition of body corporate, SCE is a subsidiary of the Treet Corporation Limited under Section 3 of the Companies Ordinance, 1984, since Company is entitled to nominate majority of the governing body of SCE. However, as a non-profit entity, SCE is not entitled to declare any dividends or profits and on dissolution, its assets must be transferred to another non-profit entity having similar objectives. Therefore, SCE will be excluded from consolidation since it will be operating under severe long-term restrictions which significantly impair its ability to transfer funds to the parent.
As per applicable requirements, SCE (a non-profit entity) is the sponsoring body for the degree awarding institute (i.e. Institute for Art and Culture).
4. Detail of the Project
GAL has acquired 15.29 acres of land for the construction of a purpose designed state of the art educational campus. This campus / building is constructed and ready for operational use and is being leased to “Institute for Art and Culture” (IAC). As stated above, SCE has established one of the Asia’s best Institute/University in the field of Art, Culture and Architecture.
Concurrently, GAL may itself also engage in activity of operating and running educational institutions / programmes in affiliation with other institutions.
The land is to accommodate all the facilities and requirements of a university campus of international standard. There is sufficient area available for future expansion. The campus facilities would include sports, parking, botanical garden of endangered indigenous plants and medicinal herbs along with the educational facilities.
5. Project Cost
Below is the break-up of the project cost:
Rs.
Land 540,844,109
Building 900,000,000
Equipment 159,155,891
1,600,000,000
6. Project Implementation Schedule
Acquisition of Land 15.29 acre of land at Raiwind Road, Lahore (near bhobhatian Chowk)
Completion of Civil Work July 31, 2018
Start of First Session September ~ October 2018
• School of Architecture, Design & Urbanism• School of Digital & Cinematic Art• School of Art• School of Culture & Language
Preference Shares

7. Means of Funding
The project will be funded entirely through equity. The parent Company (i.e. Treet Corporation Limited) has already injected net equity (in the GAL) amounting to Rs. 1,600 million. This amount is generated from the internal sources mainly borrowings. Funds so generated [through issuance of preference shares] will be utilized in paying off those borrowings.
Day to day running costs of the Society as well as initial endowment for the Institute is being met by the parent company (i.e. Treet Corporation Limited) in the form of donations. Since the Society and Institute are being run as a non-profit entities, such donations shall be accounted for as Corporate Social Responsibility activities of the Company and shall be duly reported as such in accordance with applicable laws. Subsequently Society and the Institute is expected to generate revenues/donations from its own activities.
8. Benefits to the Company
GAL will be receiving revenues from the following sources:
• Lease rentals linked to revenue;
• Income from provision of amenities, utilities or any other service connected with renting of building;
• Short term courses and diplomas;
• Revenue from club/gym and allied services;
• In the medium term, from running, managing and maintaining colleges and schools;
Management of the Company is confident that such form of investment will be beneficial to the shareholders of the Company in the form of dividends and appreciation of share’s value.
9. Financial Feasibility & Financial Projections
Financial Projections, Market Report and Feasibility of the project will be circulated to the shareholders once it is approved by the SECP.
10 Rationale
Trend of Art and Culture education in Pakistan remained subdued due to various reasons. However, as Pakistan is opening up to the world need of Art and Culture education is eminent. What is needed is the state of the art facilities, with trained [and satisfied faculties] coupled with closed coordination with industry [to meet their requirements] that ensures not only groomed students [personally and professionally] but with their better chances to get jobs and thriving at their career path. Treet Group of Companies (Treet) recognized this gap and bringing state of the art degree awarding institute [with the national charter]. Since it is the unique project and getting quality and trained faculty coupled with designing up to the mark syllabus [catering modern industry requirements] and process of getting charter was quite lengthy and time consuming, Treet has undertaken this project with the internal finance (mainly borrowings). But since this project is now kicked off and revenue streams is coming from the project [again revenue streams will increase with each semester as they will be filled up e.g. 04 years bachelor degree is having 08 semester and some programmes are having 10 semester], management of the Company feels that it is right time to offer this project to the existing shareholders of the Company and to pay back its borrowed funds.
Moreover, this is the start and Company has full intention to develop the backward integration (e.g. colleges, schools etc.) and it will consummate the whole educational process.
47 2019 Annual Report 46
Str
ateg
ic re
po
rtG
ove
rnan
ce
Features of Preference share are designed in such a way that ensure the following:
1. Exit strategy is available to the shareholders
a. Through secondary market
b. Redemption option
2. Participation in profitability of Global Arts Limited
a. Profitability of Global Arts Limited (GAL) is the bench mark for the return on investments. One of the option is to make listing of ordinary share of GAL through offering of ordinary shares of GAL to the existing shareholders of the Company (Treet). But same results can be achieved if same features of ordinary shares are embedded in the structured preference shares. Moreover, cumulative dividend feature is the added advantage.
3. Preference shareholders may appoint their member(s) on the Board of Directors of GAL.
4. Better protection in case of liquidation of the Company or GAL.
Clauses 4 & 4 A of the Articles of Association of the Company is reproduced below:
“4. Authorized Share Capital
The Authorized Capital of the Company is Rs. 4,000,000,000 (Rupees Four Billion Only) divided into 250,000,000 (Two Hundred & Fifty Million) Ordinary Shares of Rs. 10/- each and 150,000,000 (One Hundred & Fifty Million) Preference Shares of Rs. 10/- each of different classes comprising Redeemable or Non Redeemable, Cumulative or Non Cumulative, Convertible or Non Convertible with attached thereto respective such preferential, deferred, qualified or special rights, privileges or conditions as provided in the Articles of Association of the Company or in accordance with the Companies Ordinance, 1984.”
“4A Preference Shares
The Preference Shares of up to Rs. 1,500,000,000 (Rupees Fifteen Hundred Million Only), divided into 150,000,000 (One Hundred & Fifty Million) Preference Shares of Rs.10/- each (the “Preference Shares”), to be issued from time to time subject to approval of the members through special resolution and approval of Securities & Exchange Commission of Pakistan, shall have the following rights and privileges attached thereto (subject to any changes or amendments made by Securities and Exchange Commission of Pakistan and accepted by the Board of Directors of the Company, which changes and amendments (if any) shall be deemed to form part of this clause 4A without need for any further action):
a. The Preference Shares shall be Non-Convertible Cumulative Redeemable Preference Shares and may also be listed on the Pakistan Stock Exchange;
b. The Preference Shares shall be cumulative and shall carry entitlement of a variable annual dividend (“VAD”) per Preference Share to be paid out of the normal profits of the Company in each financial year. The VAD for each financial year shall be calculated as follows: VAD = ‘X’ + ‘Y’ Where: X = the higher of ‘A’ and ‘B’ A = 80 % (eighty percent) of amount of dividend (net of taxes) paid to the Company by the Designated Subsidiary of the Company in respect of the Company’s shareholding in the Designated Subsidiary, in relation to the financial year for which
Preference shares continue
Preference Shares

VAD is being calculated, divided by the number of Issued Preference Shares. B= 40 % of the Net Profits after Tax of the Designated Subsidiary, in relation to the financial year for which VAD is being calculated, divided by the number of Issued Preference Shares; “Designated Subsidiary” means the nominated subsidiary company of the Company, as decided/ nominated by the Board of Directors any time prior to the first issuance of the Preference Shares, which decision/nomination may not subsequently be changed; “Net Profit after Tax” means the net profit after tax calculated as per applicable accounting conventions and accounting standards prevailing in Pakistan; and “Issued Preference Shares” means on any date the actual number of preference shares issued in terms of this clause 4A up till such date without taking into account any redemption of Preference Shares up till such date; Y = the aggregate of VADs per Preference Share accumulated and unpaid for the financial years preceding the financial year for which VAD is being calculated
c. Any portion of the VAD not declared and paid in any financial year shall cumulate towards entitlement of VAD in future years. The Company shall only be able to declare and pay dividends to ordinary shareholders out of its normal profits if: a. prior to declaration and payment of dividend to such ordinary shareholders, all amounts of VAD (including previously accrued VAD), if any, have already been declared out of its normal profits, and b. the VAD (if any) is paid prior to or simultaneous with the payment of dividends to ordinary shareholders.
d. The Preference Shares shall not carry any entitlement of ordinary dividend, rights shares or bonus shares, or have any right to participate in the profits of the Company, save as specified in Clause 4A(b) above or as otherwise provided in the Companies Ordinance, 1984;
e. The Preference Shareholders shall not be entitled to receive notice of or attend General Meetings or vote at such General Meetings of the Company, except as stated in Clause 4A (f) below or as otherwise provided in the Companies Ordinance, 1984 whereby holders of such shares would be entitled to vote separately as a class, i.e. with respect to voting entitlement of Preference Shareholders on matters/ issue affecting substantive rights or liabilities of Preference Shareholders;
f. The following decisions shall not be taken either by the Company or the Designated Subsidiary except with the approval of the Preference Shareholders by means of an ordinary resolution passed at a general meeting of the Preference Shareholders:
i. Any sale, transfer, encumbrance or alienation of shares of the Designated Subsidiary owned by the Company or dilution of Company’s shareholding in the Designated Subsidiary through any other means;
ii. Nomination/selection of not less than 50 % of the proposed directors to be elected by the Company on the Board of Directors of the Designated Subsidiary;
iii. Any sale, transfer, lease, encumbrance or alienation of the business, assets, undertaking etc. of the Designated Subsidiary or any portion thereof;
iv. Any resolution for the winding-up of the Designated Subsidiary;
The Company shall use its shareholding in the Designated Subsidiary to give effect to the foregoing requirement.
49 2019 Annual Report 48
Str
ateg
ic re
po
rtG
ove
rnan
ce
g. in the event of winding up of the Company or repayment of the capital of the Company, the Preference Shares will carry a preferential right over Ordinary Shares only to the extent of proceeds arising from sales of shares of the Designated Subsidiary and/or assets of the Designated Subsidiary;
h. the Preference Shares shall, subject to Clause 4A (i) below, be redeemable at par value at the option of the preference shareholder at any time after expiry of four years of date of first issue of the Preference Shares;
i. the Preference Shares shall automatically stand redeemed in the following circumstances:
j. The redemption in terms of sub-clause (h) or (i) of Clause 4A shall be in cash at par value and shall be in accordance with and subject to the provisions of Section 85 of the Companies Ordinance, 1984. Furthermore, the Board of Director Company may, from time to time, prescribe modalities, procedure and steps to be taken in case redemption under sub-clause (h) or (i) is triggered.
k. the Preference Shares shall rank pari passu inter se each other notwithstanding different dates of issue; and
l. the Preference Shares shall be under the control of the Board of Directors who may allot, forfeit, surrender, rectify or otherwise dispose of the same to such persons, firms, corporation or corporations on such terms and conditions and at any such time as may be thought fit, subject to and in accordance with the provisions of the Companies Ordinance, 1984 and the Securities Act, 2015.
i. in case any resolution for voluntary winding-up of the Designated Subsidiary is passed or a winding-up order for the Designated Subsidiary is passed by the competent court;
ii. in case the aggregate shareholding of the Company in the Designated Subsidiary becomes equal to or less than 50% of the voting shares of the Designated Subsidiary;
iii. in case a breach by the Company of the terms and conditions of the Preference Shares is not remedied within 90 days of receipt of a written notice from Preference Shareholders holding not less than 20 % in value of the outstanding Preference Shares to the Company specifying such breach.
Preference shares continue
Preference Shares
51 2019 Annual Report 51
Go
vern
ance
Str
ateg
ic re
po
rt
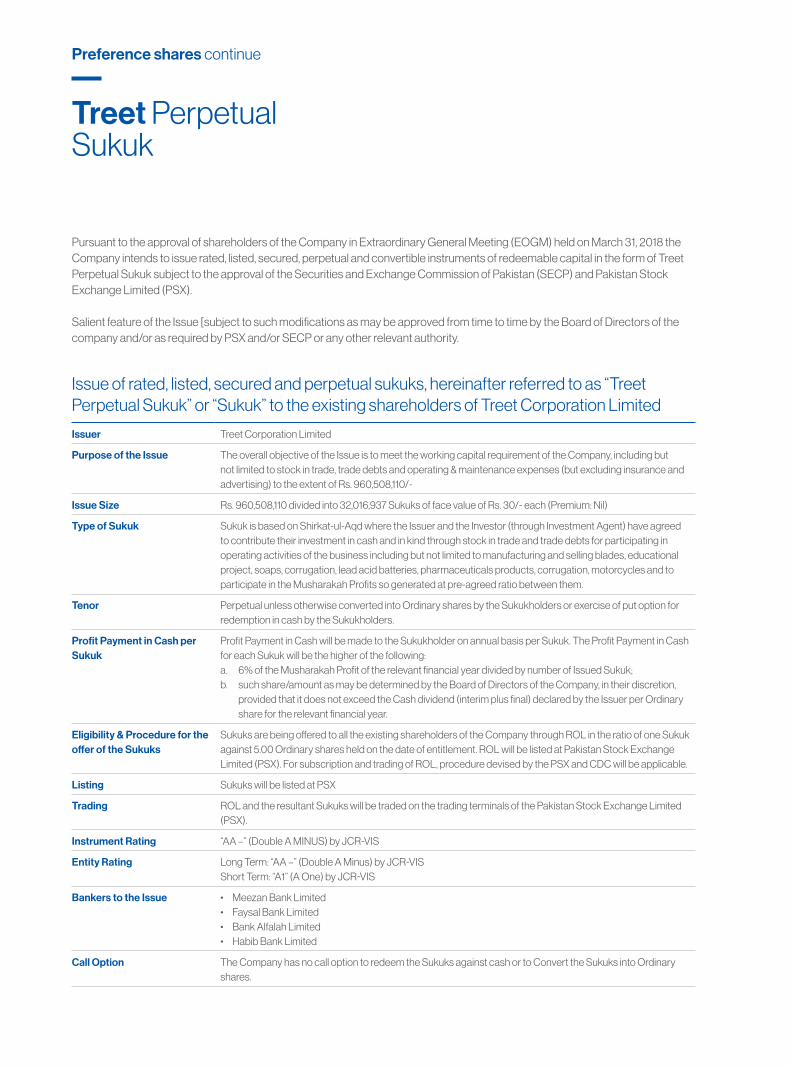
Pursuant to the approval of shareholders of the Company in Extraordinary General Meeting (EOGM) held on March 31, 2018 the Company intends to issue rated, listed, secured, perpetual and convertible instruments of redeemable capital in the form of Treet Perpetual Sukuk subject to the approval of the Securities and Exchange Commission of Pakistan (SECP) and Pakistan Stock Exchange Limited (PSX).
Salient feature of the Issue [subject to such modifications as may be approved from time to time by the Board of Directors of the company and/or as required by PSX and/or SECP or any other relevant authority.
Issue of rated, listed, secured and perpetual sukuks, hereinafter referred to as “Treet Perpetual Sukuk” or “Sukuk” to the existing shareholders of Treet Corporation Limited
Issuer Treet Corporation Limited
Purpose of the Issue The overall objective of the Issue is to meet the working capital requirement of the Company, including but not limited to stock in trade, trade debts and operating & maintenance expenses (but excluding insurance and advertising) to the extent of Rs. 960,508,110/-
Issue Size Rs. 960,508,110 divided into 32,016,937 Sukuks of face value of Rs. 30/- each (Premium: Nil)
Type of Sukuk Sukuk is based on Shirkat-ul-Aqd where the Issuer and the Investor (through Investment Agent) have agreed to contribute their investment in cash and in kind through stock in trade and trade debts for participating in operating activities of the business including but not limited to manufacturing and selling blades, educational project, soaps, corrugation, lead acid batteries, pharmaceuticals products, corrugation, motorcycles and to participate in the Musharakah Profits so generated at pre-agreed ratio between them.
Tenor Perpetual unless otherwise converted into Ordinary shares by the Sukukholders or exercise of put option for redemption in cash by the Sukukholders.
Profit Payment in Cash per Sukuk
Profit Payment in Cash will be made to the Sukukholder on annual basis per Sukuk. The Profit Payment in Cash for each Sukuk will be the higher of the following:a. 6% of the Musharakah Profit of the relevant financial year divided by number of Issued Sukuk; b. such share/amount as may be determined by the Board of Directors of the Company, in their discretion,
provided that it does not exceed the Cash dividend (interim plus final) declared by the Issuer per Ordinary share for the relevant financial year.
Eligibility & Procedure for the offer of the Sukuks
Sukuks are being offered to all the existing shareholders of the Company through ROL in the ratio of one Sukuk against 5.00 Ordinary shares held on the date of entitlement. ROL will be listed at Pakistan Stock Exchange Limited (PSX). For subscription and trading of ROL, procedure devised by the PSX and CDC will be applicable.
Listing Sukuks will be listed at PSX
Trading ROL and the resultant Sukuks will be traded on the trading terminals of the Pakistan Stock Exchange Limited (PSX).
Instrument Rating “AA –” (Double A MINUS) by JCR-VIS
Entity Rating Long Term: “AA –” (Double A Minus) by JCR-VISShort Term: “A1” (A One) by JCR-VIS
Bankers to the Issue • Meezan Bank Limited• Faysal Bank Limited• Bank Alfalah Limited• Habib Bank Limited
Call Option The Company has no call option to redeem the Sukuks against cash or to Convert the Sukuks into Ordinary shares.
Treet Perpetual Sukuk
Preference shares continue
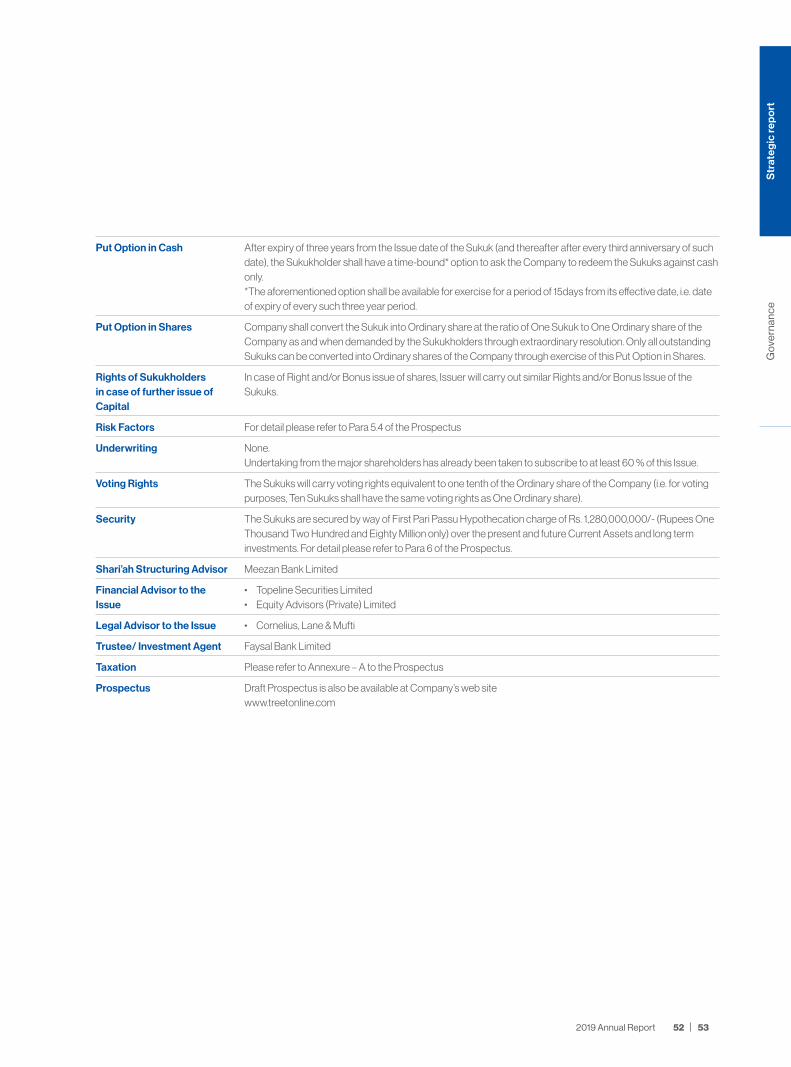
Put Option in Cash After expiry of three years from the Issue date of the Sukuk (and thereafter after every third anniversary of such date), the Sukukholder shall have a time-bound* option to ask the Company to redeem the Sukuks against cash only. *The aforementioned option shall be available for exercise for a period of 15days from its effective date, i.e. date of expiry of every such three year period.
Put Option in Shares Company shall convert the Sukuk into Ordinary share at the ratio of One Sukuk to One Ordinary share of the Company as and when demanded by the Sukukholders through extraordinary resolution. Only all outstanding Sukuks can be converted into Ordinary shares of the Company through exercise of this Put Option in Shares.
Rights of Sukukholders in case of further issue of Capital
In case of Right and/or Bonus issue of shares, Issuer will carry out similar Rights and/or Bonus Issue of the Sukuks.
Risk Factors For detail please refer to Para 5.4 of the Prospectus
Underwriting None. Undertaking from the major shareholders has already been taken to subscribe to at least 60 % of this Issue.
Voting Rights The Sukuks will carry voting rights equivalent to one tenth of the Ordinary share of the Company (i.e. for voting purposes, Ten Sukuks shall have the same voting rights as One Ordinary share).
Security The Sukuks are secured by way of First Pari Passu Hypothecation charge of Rs. 1,280,000,000/- (Rupees One Thousand Two Hundred and Eighty Million only) over the present and future Current Assets and long term investments. For detail please refer to Para 6 of the Prospectus.
Shari’ah Structuring Advisor Meezan Bank Limited
Financial Advisor to the Issue
• Topeline Securities Limited• Equity Advisors (Private) Limited
Legal Advisor to the Issue • Cornelius, Lane & Mufti
Trustee/ Investment Agent Faysal Bank Limited
Taxation Please refer to Annexure – A to the Prospectus
Prospectus Draft Prospectus is also be available at Company’s web site www.treetonline.com
53 2019 Annual Report 52
Str
ateg
ic re
po
rtG
ove
rnan
ce

Your Company has decided to reduce its certificate holding in First Treet Manufacturing Modaraba. Initial shareholding was 89.85%* but it may be reduced up to 60.00% (i.e. maximum reduction may be up to 29.85%) either through disposal of certificates in the market or otherwise.
*Group’s holding was 99.87%
The Company has created a trust over a certain percentage of its present and future voting rights in Treet Holdings Limited (“THL”) in relation to election of directors at any general meeting of THL (not exceeding in aggregate 40 % of its total voting rights in THL exercisable at any such general meeting) (the “Trustee Voting Rights”) for the benefit of the Non-Treet Certificate Holders, with the intent that such Non-Treet Certificate Holders shall be entitled to instruct the Company to exercise such voting rights to elect the independent directors selected by the Non-Treet Certificate Holders, up to a maximum of 02 directors or 30 % of the Board of Directors of THL, whichever is less (the “Selected Directors”).
RationaleIn order to broaden the investors in certificates of First Treet Manufacturing Modaraba (“FTMM”) and to attract investment by other individuals in such certificates, and to promote transparency and openness in the affairs of THL, the Company wanted to have representation of independent directors on Board of Directors of THL selected by existing and future certificate holders of FTMM other than the Company and/or any of its subsidiaries (“Non-Treet Certificate Holders”). To give effect to this, the Company has created a trust over a certain percentage of its present and future voting rights in THL in relation to election of directors at any general meeting of THL (not exceeding in aggregate 40 % of its total voting rights in THL exercisable at any such general meeting) (the “Trustee Voting Rights”) for the benefit of the Non-Treet Certificate Holders, with the intent that such Non-Treet Certificate Holders shall be entitled to instruct the Company to exercise such voting rights to elect the independent directors selected by the Non-Treet Certificate Holders, up to a maximum of 02 directors or 30 % of the Board of Directors of THL, whichever is less (the “Selected Directors”).
It is pertinent to note that copy of “voting trust” is made available at our web site www.treetonline.com and is subject to such modifications as be approved from time to time by the Board of Directors of the Company and/or required by the Securities and Exchange Commission of Pakistan (“SECP”) or any other competent authority.
Current Status
Maximum Voting Rights that is allowed to be transferred to the Trust by the shareholders of the Company
40%
Rights Transferred to the Trust 25%
Trust to be effective on the date the Non-Treet Certificate Holders collectively hold more than certain % of the total number of FTMM Certificates issued by FTMM.
15%
Currently No. of FTMM Certificates held by Non-Treet Certificate Holders 2.63%
Trust Status Non-Active (since below 15% threshold)
Total No. of Directors at the Board of Treet Holdings Limited (THL) 08
Maximum no. of Directors that can be appointed by Non-Treet Certificate Holders 02
Procedure for exercising Voting Rights As given in the Trust Deed and communicated on the election of the Board of Directors of THL
Voting Trust
Preference shares continue

55 2019 Annual Report 54
Str
ateg
ic re
po
rtG
ove
rnan
ce
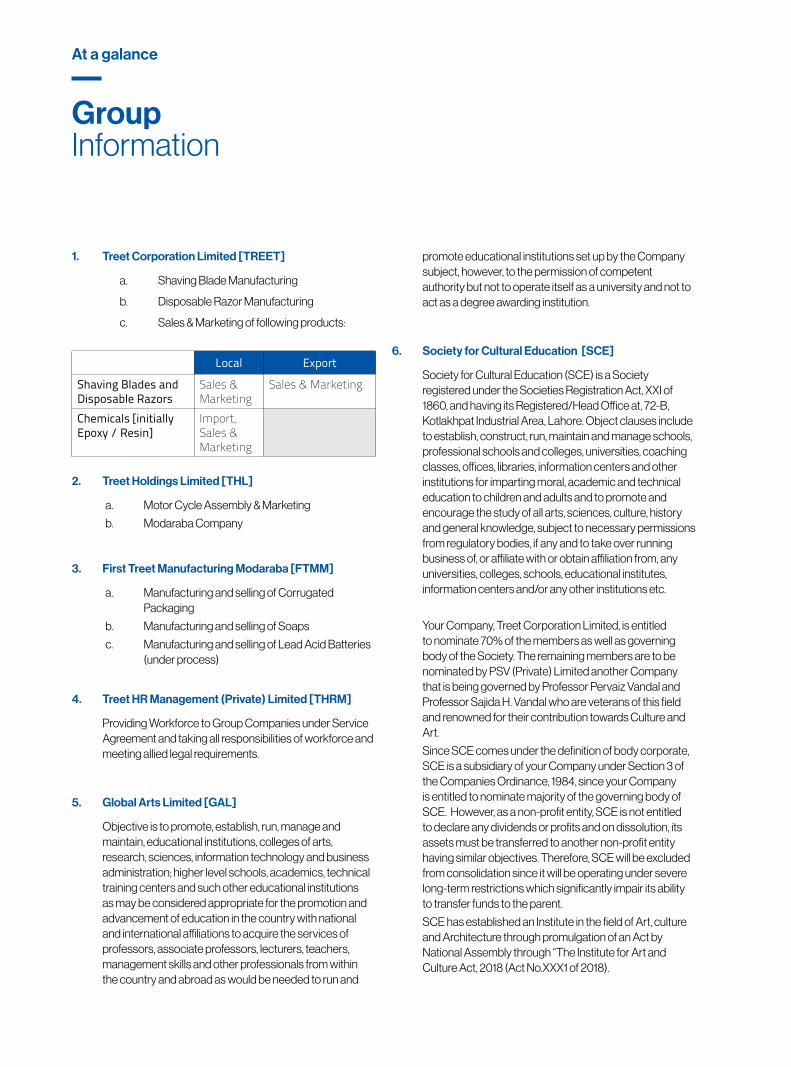
GroupInformation
At a galance
1. Treet Corporation Limited [TREET]
a. Shaving Blade Manufacturing
b. Disposable Razor Manufacturing
c. Sales & Marketing of following products:
Local Export
Shaving Blades and Disposable Razors
Sales & Marketing
Sales & Marketing
Chemicals [initially Epoxy / Resin]
Import, Sales & Marketing
2. Treet Holdings Limited [THL]
a. Motor Cycle Assembly & Marketing
b. Modaraba Company
3. First Treet Manufacturing Modaraba [FTMM]
a. Manufacturing and selling of Corrugated Packaging
b. Manufacturing and selling of Soaps
c. Manufacturing and selling of Lead Acid Batteries (under process)
4. Treet HR Management (Private) Limited [THRM]
Providing Workforce to Group Companies under Service Agreement and taking all responsibilities of workforce and meeting allied legal requirements.
5. Global Arts Limited [GAL]
Objective is to promote, establish, run, manage and maintain, educational institutions, colleges of arts, research, sciences, information technology and business administration; higher level schools, academics, technical training centers and such other educational institutions as may be considered appropriate for the promotion and advancement of education in the country with national and international affiliations to acquire the services of professors, associate professors, lecturers, teachers, management skills and other professionals from within the country and abroad as would be needed to run and
promote educational institutions set up by the Company subject, however, to the permission of competent authority but not to operate itself as a university and not to act as a degree awarding institution.
6. Society for Cultural Education [SCE]
Society for Cultural Education (SCE) is a Society registered under the Societies Registration Act, XXI of 1860, and having its Registered/Head Office at, 72-B, Kotlakhpat Industrial Area, Lahore. Object clauses include to establish, construct, run, maintain and manage schools, professional schools and colleges, universities, coaching classes, offices, libraries, information centers and other institutions for imparting moral, academic and technical education to children and adults and to promote and encourage the study of all arts, sciences, culture, history and general knowledge, subject to necessary permissions from regulatory bodies, if any and to take over running business of, or affiliate with or obtain affiliation from, any universities, colleges, schools, educational institutes, information centers and/or any other institutions etc.
Your Company, Treet Corporation Limited, is entitled to nominate 70% of the members as well as governing body of the Society. The remaining members are to be nominated by PSV (Private) Limited another Company that is being governed by Professor Pervaiz Vandal and Professor Sajida H. Vandal who are veterans of this field and renowned for their contribution towards Culture and Art.
Since SCE comes under the definition of body corporate, SCE is a subsidiary of your Company under Section 3 of the Companies Ordinance, 1984, since your Company is entitled to nominate majority of the governing body of SCE. However, as a non-profit entity, SCE is not entitled to declare any dividends or profits and on dissolution, its assets must be transferred to another non-profit entity having similar objectives. Therefore, SCE will be excluded from consolidation since it will be operating under severe long-term restrictions which significantly impair its ability to transfer funds to the parent.
SCE has established an Institute in the field of Art, culture and Architecture through promulgation of an Act by National Assembly through “The Institute for Art and Culture Act, 2018 (Act No.XXX1 of 2018).

7. Renacon Pharma Limited
Renacon Pharma Limited specializes in the production of all types of formulations of Hemodialysis Concentrate in powder and solution form for all brands of machines since 1996. Products also include fully automated mixers for powder form.
8. Treet Power Limited [TPL] - Dormant for the time being
Companies within a Group are strategic business units that are semi-autonomous units responsible for their own budgeting, new product / market decisions, and new venture exploration and pricing. They are treated as internal profit centers by the corporate headquarter i.e. Treet Corporation Limited, the parent company. Each SBU is responsible for developing its business strategies independently from the other businesses but these must be in tune with the broader corporate strategies. Corporate strategy (by the parent company) seeks to develop synergies by sharing and coordinating staff and other resources across business units, investing financial resources across business units, and using business units to complement other corporate business activities.
Therefore to summarize businesses of the Treet Group are as follows:
1. Manufacturing and selling blades/disposable razors ;
2. Manufacturing and selling of corrugated packaging;
3. Manufacturing of soaps and marketing thereof;
4. Assembling [and selling] of Motorcycles;
5. Import, sales and marketing of Lead Acid Batteries;
6. Import, sales and marketing of Specialized Chemicals;
7. Pharmaceutical Business [initially Bicarbonate
Hemodialysis Concentrate (solutions & powder)];
8. Labor-Hire Services;
9. Floatation and control of Modarabas;
10. Manufacturing and selling of lead acid batteries;
11. Establish, run, manage and maintain, educational projects; etc.
Factories / Projects:
- Lahore Factory:
72-B Kot Lakhpat, Industrial Area, Lahore
- Hyderabad Factory:
Hali Road, P.O.Box No. 308, Hyderabad
- Packaging Solutions:
Kacha Tiba Rohi Nala, 22-KM, Ferozepur Road,
Lahore
- Lead Acid Batteries:
Faisalabad Industrial City (M 3 Industrial City),
Faisalabad
- Soap Factory:
Ghakkar [under Toll Manufacturing Arrangement]
- Educational Project:
07- KM, Raiwind Road, Lahore
- Pharmaceutical Business:
18- KM., Ferozepur Road, Opp. Nishter Colony, Lahore
Others / Future Expansion:
- Land [12 Kanals] at Multan Road, Lahore
- Land [18 Kanals] at Raiwind Road, Lahore
- Land [15 Acres] at Faisalabad Industrial City,
Faisalabad
Shares held by
Treet THL GAL TPL THRM FTMM RPL Directors Outsider
Treet Holdings Limited THL 85.93% 14.07%
Global Arts Limited GAL 88.76% 5.58% 5.66%
Treet Power Limited TPL 100.00%
Treet HR Management (Private) Limited THRM 100.00%
First Treet Manufacturing Modaraba FTMM 87.54% 10.02% 0.01% 2.44%
Renacon Pharma Limited RPL 45.47% 10.39% 38.47% 5.67%
Treet Battery Limited TBL 100.00%
57 2019 Annual Report 56
Str
ateg
ic re
po
rtG
ove
rnan
ce
Our missionOur MISSION is, to satisfy and meet the needs of our customers, providing our products and services with the quality, adjusted to their needs and preferences and to create value for our stakeholders through originality and strict adherence to our principles. We being a conscientious producer, and having stood the test of time, will continue our emphasis on responding to customer need with value added products and services. It is our belief that we can fulfill this mission through a unique combination of industry vision, effective supply chain management and innovative technology.
To be innovative in our field to the benefit of society, we will fairly compete in quality, technology, sales and marketing expertise, while ensuring sound financial and sustainable growth of the Treet Group for the sake of its stakeholders and reputation.
Vision statement
59 2019 Annual Report 58
Str
ateg
ic re
po
rtG
ove
rnan
ce

PrincipleWe will base our human resources systems on our proven principles reflective of our core values and our commitment to attract, reward, develop and motivate sophisticated people. They will reflect the global scope of our business while demonstrating responsibility and flexibility with respect to cultural diversity, and statutory and regional business realities.
To be innovative in our field to the benefit of society, we will fairly compete in quality, technology, sales and marketing expertise, while ensuring sound financial and sustainable growth of the Treet Group for the sake of its stakeholders and reputation.
Emphasis
Social ResponsibilityWe will continually strive to be environmentally responsible and support the communities where we operate and the industries in which we participate.
• Total Customer Services • Long-Term Business Focus • Technology Oriented • Quality & Reliability • Staff Development & Teamwork • Effective Resources & Cost
Management • Corporate Responsibility
Corporate Values
61 2019 Annual Report 60
Str
ateg
ic re
po
rtG
ove
rnan
ce

Board of directorsDr. Mrs. Niloufer Qasim MahdiChairperson / Non-Executive DirectorSyed Shahid AliChief Executive OfficerDr. Salman FaridiIndependent DirectorSyed Sheharyar AliExecutive DirectorMuhammad Shafique AnjumExecutive DirectorMr. Saulat SaidNon-Executive DirectorMr. Imran AzimNon-Executive DirectorMr. Munir K. BanaNon-Executive Director
Audit committeeDr. Salman FaridiChairman/MemberMr. Imran AzimMemberMr. Munir K. BanaMember
Human resourceDr. Salman FaridiChairman/MemberMr. Imran AzimMember
Remuneration committeeMr. Munir K. BanaMemberSyed Sheharyar AliMemberMuhammad Shafique AnjumMember
Chief financial officerMr. Amir Zia
Company secretaryRana Shakeel Shaukat
Head of internal auditMuhammad Ali
External auditorsKPMG Taseer Hadi & Co.Chartered Accountants, Lahore.
Income tax consultantsKreston Hyder Bhimji & Co.Chartered Accountants, Lahore.
Legal advisorsSalim & Baig, Advocates - Lahore.
Corporate advisorsCornelius, Lane & Mufti Legal Advisors & Solicitors Lahore
Shariah advisorMufti Muhammad Javed Hassan(Only for First Treet Manufacturing Modaraba)
BankersAL-Baraka Bank Pakistan LimitedAllied Bank LimitedAskari Bank LimitedBank Alfalah LimitedBank Islami Pakistan LimitedHabib Bank LimitedDubai Islamic Bank Pakistan LimitedFaysal Bank LimitedHabib Metropolitan Bank LimitedJS Bank LimitedMCB Bank LimitedMeezan Bank LimitedNational Bank of PakistanSamba Bank LimitedSilk Bank LimitedSindh Bank LimitedSoneri Bank LimitedThe Bank of PunjabUnited Bank LimitedMCB Islamic Bank Limited
Share registrarCorplink (Private) LimitedWing Arcade, 1-K Commercial, Model Town, LahoreTel: 042 35916714Fax: 042 35839182
Group companiesTreet Holdings LimitedFirst Treet Manufacturing ModarabaTreet HR Management (Private) LimitedTreet Power LimitedGlobal Arts LimitedSociety for Cultural EducationRenacon Pharma LimitedTreet Battery Limited
Address72-B, Industrial Area, Kot Lakhpat, Lahore
Karachi office6-B (A-1) Saaed Hai Road, Muhammad Ali Co-operative Society, KarachiTel: 021 34372270-1Fax: 021 34372272
Company Information
Corporate information

72-B, Industrial Area, Kot Lakhpat, Lahore
Tel: 042 32590701, 35156567, 35122296 & 35830881
Fax: 042 35114127 & 35215825
Blade/Razor
Hali Road P.O. Box No. 308, Hyderabad
Tel: 0223 880846, 883058 & 883174
Fax: 0223 880172
First Treet Manufacturing Modaraba
(Managed by Treet Holdings Limited)
Battery project
Faisalabad Industrial Estate Development and Management Company(FIEDMC)
M-3 Motorway City, Sahianwala Interchange, Faisalabad
Packaging Solutions - Corrugation
22 Km Ferozepur Road, Kachha Tiba, Rohi Nala, Lahore
Tel: 042 8555848
Soap Division
80 Km GT Road, Gujranwala
Treet Holdings Limited
A wholly owned subsidiary of Treet Corporation Limited
Bike Project
72-B, Industrial Area, Kot Lakhpat, Lahore
Renacon Pharma Limited
18 Km, Ferozepur Road, Opp. Nishter Colony, Lahore
Tel: 042 35401847, 35401852, 35401851
Institute for Art and Culture
7 Km, Thokar Niaz Baig, Main Raiwind Road, Lahore
042 32590040-7
Treet Holdings Limited
First Treet Manufacturing Modaraba
Treet HR Management (Private) Limited
Treet Power Limited
Global Arts Limited
Society for Cultural Education
Renacon Pharma Limited
Treet Battery Limited
Address
72-B, Industrial Area, Kot Lakhpat, Lahore
Karachi office
6-B (A-1) Saaed Hai Road, Muhammad Ali Co-operative Society, Karachi
Tel: 021 34372270-1
Fax: 021 34372272
Registered office
72-B, Industrial Area, Kot Lakhpat, Lahore
Tel: 042 35830881, 35156567 & 35122296
Fax: 042 35114127 & 35215825
www.treetonline.com
49 Business Review
Treet group factories/Head office Group companies
63 2019 Annual Report 62
Str
ateg
ic re
po
rtG
ove
rnan
ce


You don’t build a business, you build people and then people build the business
65 65 2019 Annual Report
Gov
erna
nce
Str
ateg
ic re
po
rt

We strongly believe that stock markets are catalyst to economic growth and development through access to finance (primary market) by perpetual funding augmented with reduction of financial risk.
An ExperiencedBoard of Directors
Board of directors
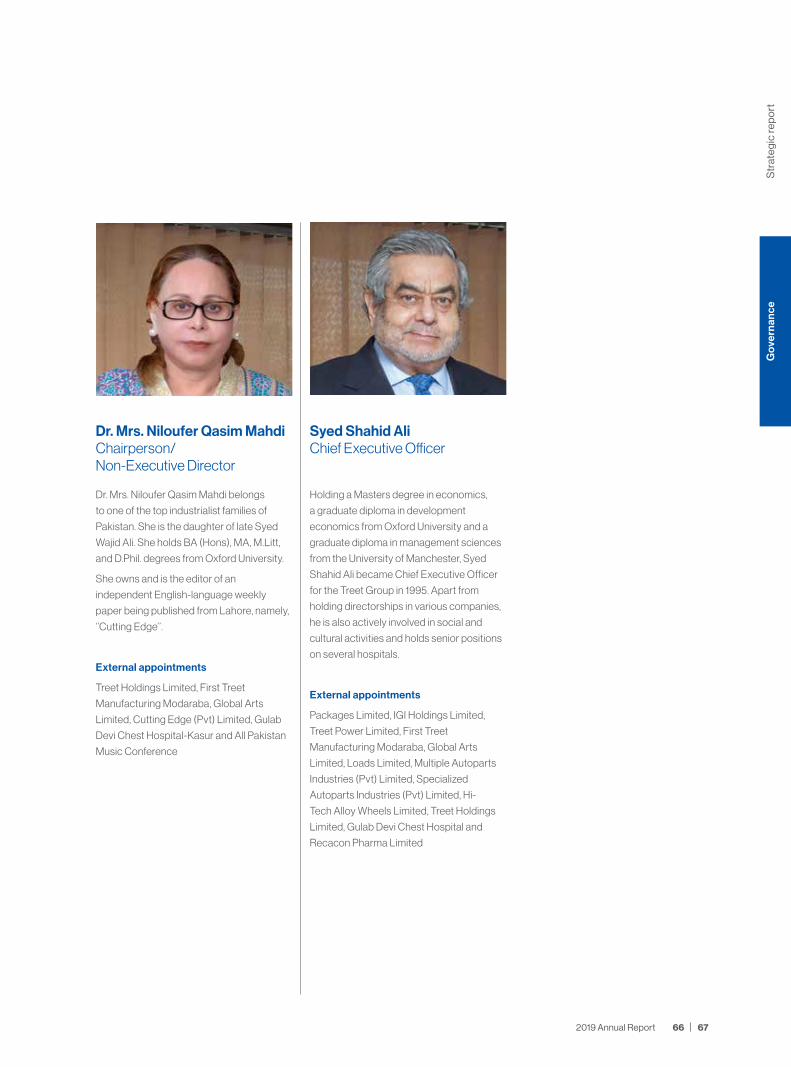
Dr. Mrs. Niloufer Qasim MahdiChairperson/Non-Executive Director
Dr. Mrs. Niloufer Qasim Mahdi belongs
to one of the top industrialist families of
Pakistan. She is the daughter of late Syed
Wajid Ali. She holds BA (Hons), MA, M.Litt,
and D.Phil. degrees from Oxford University.
She owns and is the editor of an
independent English-language weekly
paper being published from Lahore, namely,
‘’Cutting Edge’’.
External appointments
Treet Holdings Limited, First Treet
Manufacturing Modaraba, Global Arts
Limited, Cutting Edge (Pvt) Limited, Gulab
Devi Chest Hospital-Kasur and All Pakistan
Music Conference
Syed Shahid AliChief Executive Officer
Holding a Masters degree in economics,
a graduate diploma in development
economics from Oxford University and a
graduate diploma in management sciences
from the University of Manchester, Syed
Shahid Ali became Chief Executive Officer
for the Treet Group in 1995. Apart from
holding directorships in various companies,
he is also actively involved in social and
cultural activities and holds senior positions
on several hospitals.
External appointments
Packages Limited, IGI Holdings Limited,
Treet Power Limited, First Treet
Manufacturing Modaraba, Global Arts
Limited, Loads Limited, Multiple Autoparts
Industries (Pvt) Limited, Specialized
Autoparts Industries (Pvt) Limited, Hi-
Tech Alloy Wheels Limited, Treet Holdings
Limited, Gulab Devi Chest Hospital and
Recacon Pharma Limited
Str
ateg
ic re
po
rtG
over
nanc
e
67 2019 Annual Report 66

Dr. Salman FaridiIndependent Director
He is graduate from Dow Medical College
and trained in UK as a Surgeon. He obtained
FRCS in 1983. He is also fellow of Royal
Society of Medicine. He has vast medical
experience of more than two decades in
UK, Middle East & Pakistan. Currently, He
is Medical Director at the Liaquat National
Hospital, Karachi, a largest hospital in the
private healthcare in Pakistan.
External appointments
Pakistan Standard and Quality Authority,
Institute of Business Management-Karachi,
Venous Thromboembolism (VTE), Treet
Holdings Limited and Recacon Pharma
Limited
Muhammad Shafique AnjumExecutive Director
Mr. Anjum has been with the Treet Group
for over 35 years. With a Mechanical
Engineering degree, he has a vast
experience in the razor blades and the allied
product manufacturing field.
External appointments
Treet Power Limited, Treet Assets (Pvt)
Limited, First Treet Manufacturing
Modaraba, Treet HR Management (Pvt)
Limited, Treet Holdings Limited and Global
Arts Limited
After returning from Saint Louis University,
USA in 2001, Syed Sheharyar Ali became
one of the youngest directors of Treet
Corporation Limited. Currently at the age of
39 he manages a very diversified portfolio
consisting of manufacturing, healthcare,
information technology, automobiles, sports
and music.
External appointments
Treet Power Limited, First Treet
Manufacturing Modaraba, Global Arts
Limited, Loads Limited, Multiple Autoparts
Industries (Pvt) Limited, Specialized
Autoparts Industries (Pvt) Limited,
Specialized Motorcycle (Pvt) Limited,
Cutting Edge (Pvt) Limited, Online Hotel
Agents (Pvt) Limited, Frag Games (Pvt)
Limited, Punjab Netball Federation, All
Pakistan Music Conference, Treet Holdings
Limited, Gulab Devi Chest Hospital-Kasur,
RoboArt (Pvt) Limited, Spell Digital Movies
(Pvt) Limited, Elite Brands Limited, Hi-Tech
Alloy Wheels Limited and Recacon Pharma
Limited
Syed Sheharyar AliExecutive Director
Board of directors continue
An ExperiencedBoard of Directors
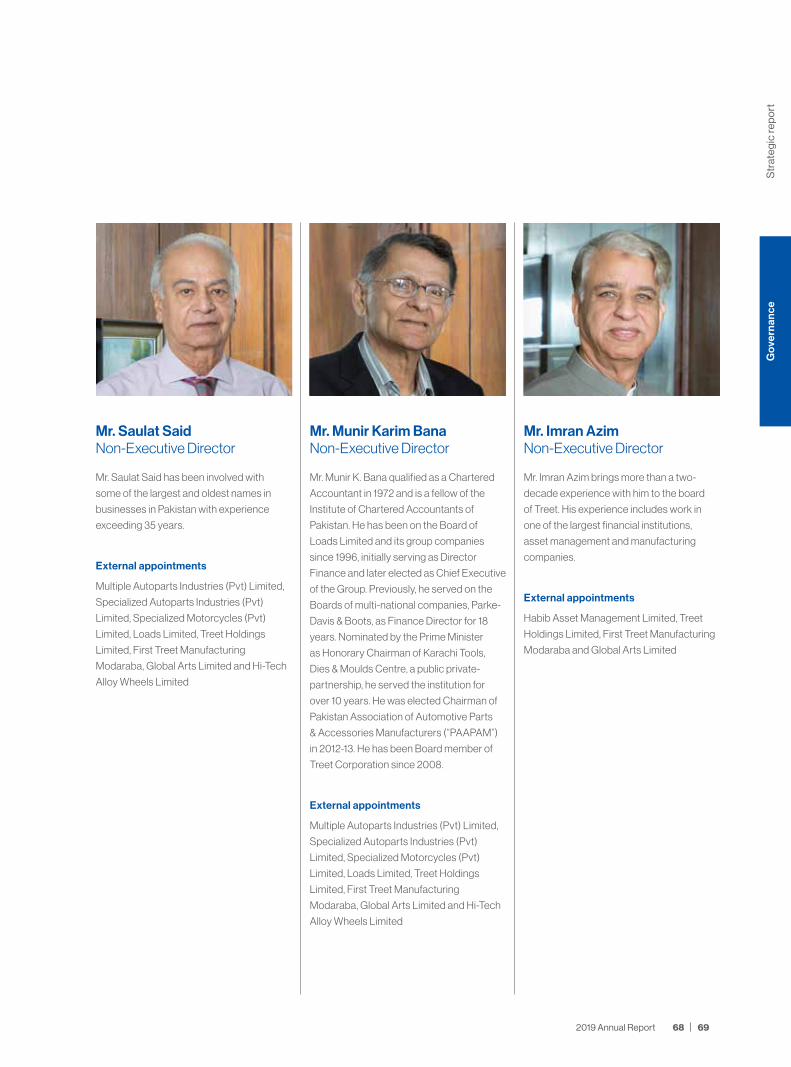
Mr. Munir Karim BanaNon-Executive Director
Mr. Munir K. Bana qualified as a Chartered
Accountant in 1972 and is a fellow of the
Institute of Chartered Accountants of
Pakistan. He has been on the Board of
Loads Limited and its group companies
since 1996, initially serving as Director
Finance and later elected as Chief Executive
of the Group. Previously, he served on the
Boards of multi-national companies, Parke-
Davis & Boots, as Finance Director for 18
years. Nominated by the Prime Minister
as Honorary Chairman of Karachi Tools,
Dies & Moulds Centre, a public private-
partnership, he served the institution for
over 10 years. He was elected Chairman of
Pakistan Association of Automotive Parts
& Accessories Manufacturers (“PAAPAM”)
in 2012-13. He has been Board member of
Treet Corporation since 2008.
External appointments
Multiple Autoparts Industries (Pvt) Limited,
Specialized Autoparts Industries (Pvt)
Limited, Specialized Motorcycles (Pvt)
Limited, Loads Limited, Treet Holdings
Limited, First Treet Manufacturing
Modaraba, Global Arts Limited and Hi-Tech
Alloy Wheels Limited
Mr. Imran AzimNon-Executive Director
Mr. Imran Azim brings more than a two-
decade experience with him to the board
of Treet. His experience includes work in
one of the largest financial institutions,
asset management and manufacturing
companies.
External appointments
Habib Asset Management Limited, Treet
Holdings Limited, First Treet Manufacturing
Modaraba and Global Arts Limited
Mr. Saulat Said has been involved with
some of the largest and oldest names in
businesses in Pakistan with experience
exceeding 35 years.
External appointments
Multiple Autoparts Industries (Pvt) Limited,
Specialized Autoparts Industries (Pvt)
Limited, Specialized Motorcycles (Pvt)
Limited, Loads Limited, Treet Holdings
Limited, First Treet Manufacturing
Modaraba, Global Arts Limited and Hi-Tech
Alloy Wheels Limited
Mr. Saulat SaidNon-Executive Director
Str
ateg
ic re
po
rtG
over
nanc
e
69 2019 Annual Report 68

Muhammad Javaid AslamDGM-Disposable Razors
Ihsan Masih GillSr.Manager Commercial
Muhammad Younas KhanSr. Manager MFG-IV(B)
Akhlaq Ahmed DGM - Double Edge Blade
Shahid Mehmood Sr. Manager Civil Works
Arshad Latif DGM QCQA, R&D
Rashid Ali Rizvi General Manager Hyderabad
Imran KhanWorks Manager
MUHAMMAD SHAFIQUE ANJUMExecutive Director/COO
Blade/Razor
Production

Muhammad AliHead of Internal Audit
Rana Imran AhmadSr. Manager (QMS)
Safwan Mushtaq Manager Store
Mr. Nisar Ahmed Sr. Manager MFG-II(A)
Rashid Ali RanaDeputy Manager Commercial
Mr. Azhar Saeed ButtManager MFG-III(A)
Mr. Asghar Ali BhattiManager MFG-III(B)
Tariq MahmoodDeputy Manager Commercial
Mr. Zahid AnwarManager MFG-II(C)
M. Naseem KhanManager MFG-II(A)
Mr. Amir Kaleem Sr. Manager MFG-II(B&C)
Ali HamzaAsst. Manager Commercial
Muhammad AzeemSr. Manager (PMP)
Muhammad Imran Ch.Manager HR
Str
ateg
ic re
po
rtG
over
nanc
e
71 2019 Annual Report 70

Nasir MehmoodGM Sales & Marketing
Waqar Ali HijaziProduct Manager
Farhaan Abid RaoDeputy Manager Exports
Feroz Hassan KhanExport Marketing Manager
Nadeem AfzalSales Analyst
Saadat Ali KheraManager Business Development
Israr ul HaqWorks Manager
Hammad MalikGM Sales-Bike
SHAHID ZIAChief Operating Officer (Sales & Marketing & Soap Operations)
Blade/Soap/Bike
Sales & Marketing
Abdul WaheedDeputy Manager Operations
Naseem AkhtarDeputy Manager Sales-Cordi-nation
Asghar MushtaqSales Support Manager
Khawaja Azhar HussainProduction Manager Bike
Syed Basharat AhmadManager Sales Coordination
Str
ateg
ic re
po
rtG
over
nanc
e
73 2019 Annual Report 72

Moazzam Hussain HashmiGroup Chief Accountant
Adnan Khan JalwanaAssistant Manager Accounts
Rana Shakeel ShaukatGroup Company Secretary
Shahid Tanveer Assistant Manager Accounts
Jawad AhmadGroup Treasury Manager
Muhammad ZubairManager Costing
Imran MunawarHSE Manager
Ali Raza Gardezi Assistant Manager Accounts
AMIR ZIAGroup Chief Financial Officer
Finance & Accounts
Finance & Accounts

Aamir HameedAssistant Manager Accounts
Hajra NoreenTreasury Executive
Syed Abad HassanAssistant Manager Accounts
Faizan KhalidManager Planning & Implementation
Sarmad RaheelTreasury Executive
Saad SaadatCorporate Executive
Kashif ZiaAccount Executive
Shahid ShafiqPlanning Officer ERP
Taimoor SaeedAsst. Manager Taxation
Misbah KhanTax Executive
Sohail Hussain KhanAccount Officer
Shamrose KhanAccount Officer
Danish ChristopherAccounts Executive
Usman SaleemAsst Company Secretary
Ahsan HaseebManager Planning & Implementation
Fizza RafiqAccounts Executive
Str
ateg
ic re
po
rtG
over
nanc
e
75 2019 Annual Report 74

Sohaib UsmanAssistant Manager HR
Sohail KhalidAssistant Manager HR
Asma ShamimHR Executive
TALHA RAOGroup HR Head
Human Resource
HR
Jahangir BashirDeputy Manager HR
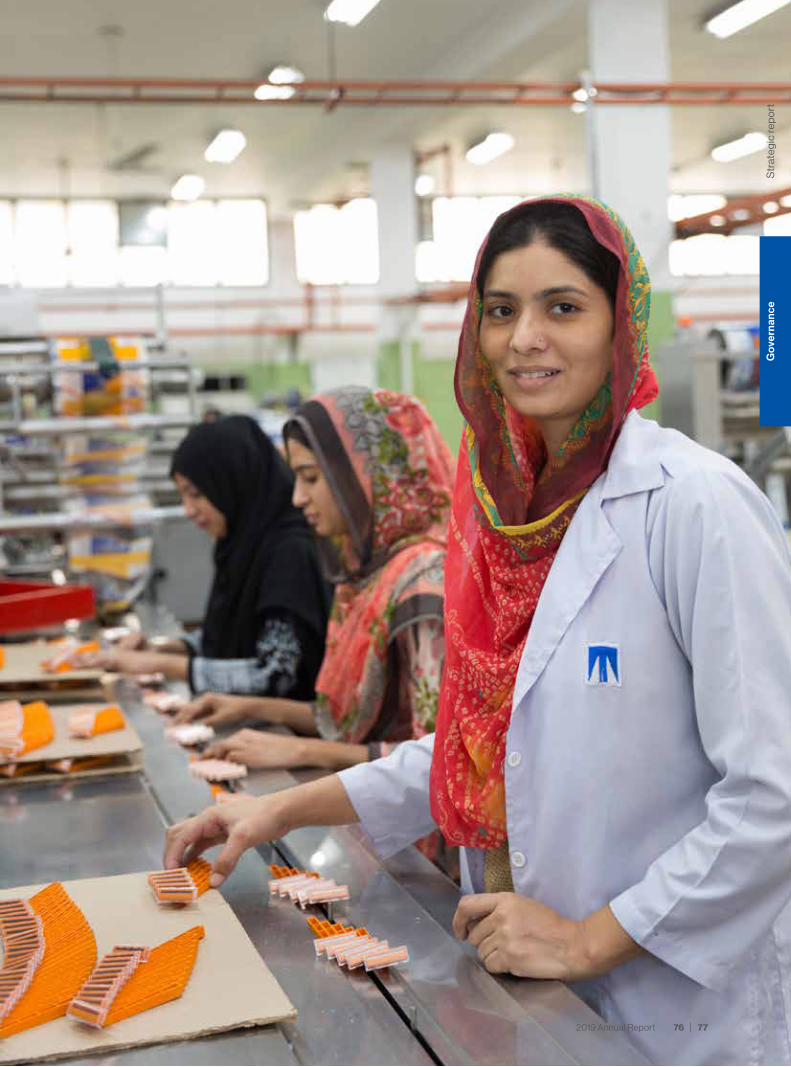
Str
ateg
ic re
po
rtG
over
nanc
e
77 2019 Annual Report 76
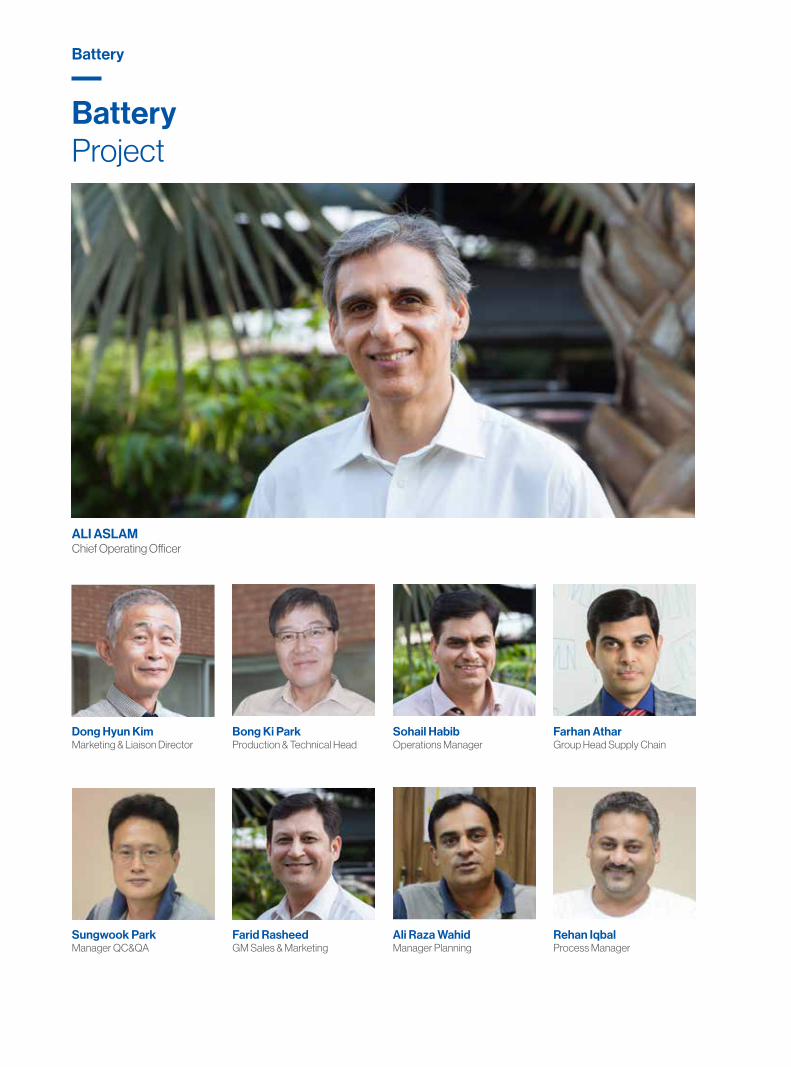
Dong Hyun KimMarketing & Liaison Director
Sungwook ParkManager QC&QA
Bong Ki Park Production & Technical Head
Farhan AtharGroup Head Supply Chain
Sohail HabibOperations Manager
Ali Raza Wahid Manager Planning
Farid Rasheed GM Sales & Marketing
Rehan IqbalProcess Manager
ALI ASLAMChief Operating Officer
Battery Project
Battery
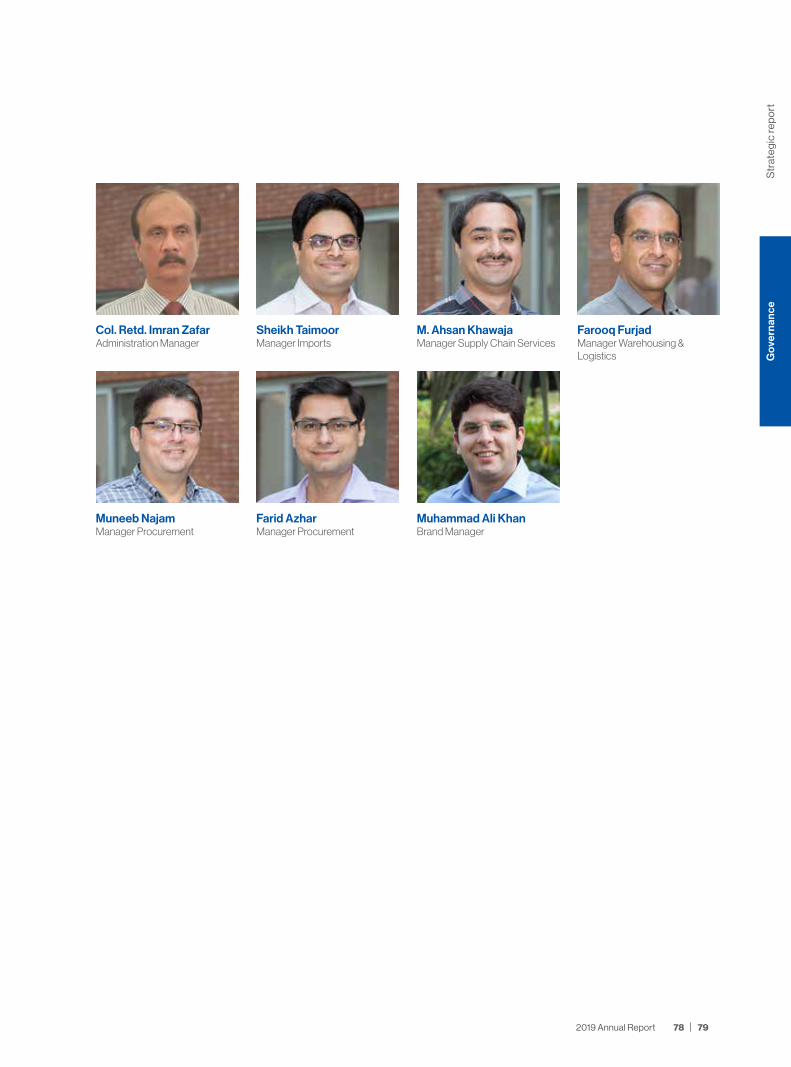
Col. Retd. Imran ZafarAdministration Manager
Muneeb NajamManager Procurement
Sheikh TaimoorManager Imports
Farid AzharManager Procurement
M. Ahsan KhawajaManager Supply Chain Services
Muhammad Ali KhanBrand Manager
Farooq FurjadManager Warehousing & Logistics
Str
ateg
ic re
po
rtG
over
nanc
e
79 2019 Annual Report 78

Hammad Javed KhanHead of Sales & Marketing
Harris Najeeb DarChief Accountant
Mobeen Akhtar Deputy General Manager
Rehan Tariq GhoriRegional Sales Manager
Azam Tariq GhoriSystem & HR Manager
Khawaja Amir RehmanManager Admin & Personnel
Sajjad Ahmed Fakhri Commercial Manager
Hammad AhmadAsst. Manager Accounts
IMRAN AZIZChief Operating Officer
Corrugation
Corrugation

Saleem FazalArea Sales Manager
Hafiz Faheem JavedAsst. Manager Sales
Usman RiazLiaison Manager
Sadia IbrahimSales Coordinator
Shakeel AhmadIndustrial Performance Coordi-nator
Nasar HayatPlanning Officer
Gov
erna
nce
81 2019 Annual Report 80
Str
ateg
ic re
po
rt

Muhammad Ali RazaManager IT Security
Umar Farooq Sr. Manager MIS
Jawwad Ahmed KhanManager Infrastructure & Support
Muhammad Jahanger Sr. Manager Infrastructure & Support
M. Shoaib MahmoodManager MIS
M. Usman GhaniManager MIS
Imran Ahmed ToorManager MIS
Muhammad Adeel AmjadManager MIS
HUSSAIN YOUSUFChief Information Officer
Information Technology
Information technology

Mahmood AslamManager Infrastructure & Support
Nauman AkbarNetwork Officer
Saqib Abbas ZaidiAsst. Manager MIS
Ahmed AliAssit. Manager MIS
Zaheer AhmadAssit. Manager Networks
Imran ShoukatNetwork Officer
Rai Abubakar KharalNetwork Officer
Sajid AnwarNetwork Officer
Imtiaz AhmadManager Networks (Infrastructure & Support)
Mohammad Tarique SultanApplication Programmer
Muhammad AhmedAsst. Manager MIS
Abid AliNetwork Support Officer
Rafia AzharAsst. Manager MIS
Muhammad Ahtsham MeharNetwork Officer
Str
ateg
ic re
po
rtG
over
nanc
e
83 2019 Annual Report 82

Nadeem Hassan KhanRegistrar
Col. Retd. Rana IrfanGM Administration
Jamil MalikSenior Manager MIS
Zafar IqbalProfessor & Dean
Prof. Sajida Pervaiz VandalVice Chancellor
Institute For Art & Culture
Art & culture
Prof. M. Pervaiz VandalPro. Vice Chancellor
Saulat SaidDirector Adminstration
Masood ul HassanTreasurer
Gov
erna
nce
85 2019 Annual Report 85
Str
ateg
ic re
po
rt

Umer SaleemChief Operating Officer
Mahmood AhmedIncharge Quality Control
Sajjad Haider KhanManager Operations and Controls
Sohail QureshiManager Business Development
Faraz Hussain MirzaProject Manager Construction
Fareed AhmadIncharge Quality Assurance
Naeem KhalidManager Marketing
M. NaveedProcurement Manager
Dr.Salman ShakohManaging Director
Renacon Pharma Limited
Pharmaceutical

Muhammad ShafiqProduction Manager
M. Bilal ShafiqueAccounts Asst.
M. Usman FaisalAccounts Officer
YOU DON'TBUILD A BUSINESS
~YOU BUILD PEOPLE~AND THEN PEOPLE
BUILD THE BUSINESS
Str
ateg
ic re
po
rtG
over
nanc
e
87 2019 Annual Report 86
Str
ateg
ic re
po
rtG
over
nanc
e
89 2019 Annual Report 88

Str
ateg
ic re
po
rtG
over
nanc
e
91 2019 Annual Report 90


Str
ateg
ic re
po
rtG
over
nanc
e
93 2019 Annual Report 92
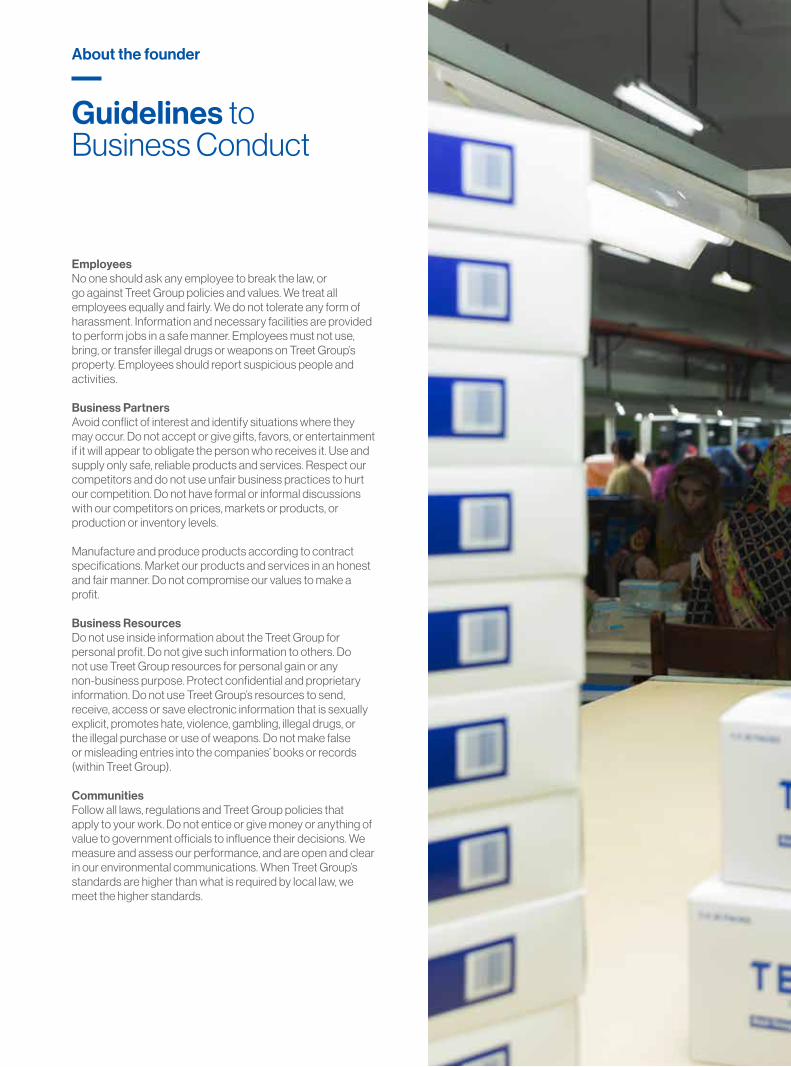
EmployeesNo one should ask any employee to break the law, or go against Treet Group policies and values. We treat all employees equally and fairly. We do not tolerate any form of harassment. Information and necessary facilities are provided to perform jobs in a safe manner. Employees must not use, bring, or transfer illegal drugs or weapons on Treet Group’s property. Employees should report suspicious people and activities.
Business PartnersAvoid conflict of interest and identify situations where they may occur. Do not accept or give gifts, favors, or entertainment if it will appear to obligate the person who receives it. Use and supply only safe, reliable products and services. Respect our competitors and do not use unfair business practices to hurt our competition. Do not have formal or informal discussions with our competitors on prices, markets or products, or production or inventory levels.
Manufacture and produce products according to contract specifications. Market our products and services in an honest and fair manner. Do not compromise our values to make a profit.
Business ResourcesDo not use inside information about the Treet Group for personal profit. Do not give such information to others. Do not use Treet Group resources for personal gain or any non-business purpose. Protect confidential and proprietary information. Do not use Treet Group’s resources to send, receive, access or save electronic information that is sexually explicit, promotes hate, violence, gambling, illegal drugs, or the illegal purchase or use of weapons. Do not make false or misleading entries into the companies’ books or records (within Treet Group).
CommunitiesFollow all laws, regulations and Treet Group policies that apply to your work. Do not entice or give money or anything of value to government officials to influence their decisions. We measure and assess our performance, and are open and clear in our environmental communications. When Treet Group’s standards are higher than what is required by local law, we meet the higher standards.
Guidelines to Business Conduct
About the founder

Gov
erna
nce
95 2019 Annual Report 95
Str
ateg
ic re
po
rt
and manufacturing. We will encourage cross-functional communication and co-operation to aid this.
Environment
Reflecting our commitment to a cleaner world, we aim to develop products and manufacturing processes which are as friendly to the environment as practicable.
Society
We will conduct our business at all times in a fair, ethical, consistent and professional manner. We accept our responsibilities to be a responsible community neighbour, and will continue to support community affairs.
Health, Safety and Environment Policy
Treet Group policy is to; Minimize its environmental impact, as is economically and practically possible.Save raw material, water and energy and avoid wastage (and reprocess the waste to the maximum possible extent).Ensure that all its present and future activities are conducted safely without endangering the health of its employees, its customers and the public.Develop plans and procedures and provide resources to successfully implement the policy and for dealing effectively with any emergency.Provide environmental, health and safety training to all employees and other relevant persons to enable them to carry out their duties safely without causing harm to themselves, others and to the environment.Ensure that all its activities comply with national environmental, health and safety regulations.
Donations, charities, contributions and other payments of a similar nature;
Companies within Treet Group are, subject to Board’s approval, encouraged to provide support to local communities through donations, charities etc. to fulfill its duty toward social cause. But companies in our Treet Groupwill not, in any case, contribute any amount;(a) to any political party; or(b) for any political purpose to any individual or body.Moreover, Companies in Treet Group shall not distribute gifts in any form to its members in its meeting.
Treet
Groupbelieves that a responsible attitude toward society and the environment can make a business more competitive, more resilient to shocks, and more likely to attract and hold both consumers and the best employees.Treet Groupfeels that social attitude is a significant part of its risk management and reputation strategy. In a world where brand value and reputation are increasingly seen as a Treet Group’s most valuable assets, responsible social attitude can build the loyalty and trust that ensure a bright sustainable future.
Customers
Our future existence relies on understanding and satisfying our customers’ present and future needs. Our goal is to be recognized by our customers as a high quality, innovative and cost effective supplier, and the most desirable to do business with. We recognize that, as a result, the next person in the process is our customer.Our PeopleWe value our family of employees as essential to the success of our Treet Group. We aim to develop a long term trusting relationship with each employee, encouraging their contributions and assisting in their personal development and education. In all dealings we will be fair and consistent.
Products and Services
We are recognized at large by our end products and services. We will endeavor to produce technologically advanced products and services that offer superior quality and value. Continued innovation and improvement are critical to our survival and growth.SuppliersWe view suppliers of goods and services as an extension of our Treet Group, with whom we wish to develop long term trusting relationships. We expect our suppliers to embrace our quality improvement philosophy in their dealing with us.ShareholdersWe aim to be an organization in whom our shareholders have trust and pride. We will keep our shareholders properly informed of our Treet Group’s performance and prospects. We recognize the need to provide our shareholders with an excellent return on investment, consistent with long term growth.PlanningAll short term decisions will be consistent with long term objectives that balance the needs of our people, customers, suppliers and shareholders. Each year these objectives will be widely communicated within our Treet Group.
Quality Improvement
We believe in step by step continual improvement of everything that we are engaged in, including our administration, marketing, sales, design, service, distribution
Corporate Social Responsibility
CSR
Str
ateg
ic re
po
rtG
over
nanc
e
97 2019 Annual Report 96

Moreover, the above funding options may augment other ancillary financial products (i.e. derivatives like shares options etc.).
Dividend Policy
The Companies in Treet Group in general meeting may declare dividends; but no dividend shall exceed the amount recommended by the directors; and
No dividend shall be declared or paid by a company for any financial year out of the profits of the company made from the sale or disposal of any immovable property or assets of a capital nature comprised in the undertaking or any of the undertaking of the company; and
� No dividend shall be paid by a company otherwise than out of profits of the company; and
� The Board may approve and pay to the Members such interim dividends as appears to be justified by the profits of the Company; and
� The Board may, before recommending any dividend, set aside out of the profits of the Company, such sums as they think proper as a reserve(s), which shall, at the discretion of the Board, be applicable for meeting contingencies etc.; and
� Company’s dividend decision will be auxiliary to Company’s Financing Policy
Dividend Policy for First Treet Manufacturing Modaraba
Not less than 90% of the net income in respect of the Modaraba’s business [non-trading] activities, determined after setting aside the mandatory reserves as per Prudential Regulations for Modaraba, is to be distributed at least once in every year to the certificate holders in proportion to the number of certificates held by them. Distribution will be in the form of cash dividend. No dividend shall be paid otherwise than out of the profits of the Modaraba for the year or any other distributed profits.
Investment Policy
The Executive Committee of the Directors is responsible for seeking/evaluating and recommending either;
� Portfolio Investments (i.e. in Shares/ Securities etc. (Fresh Issues or Market Purchase) or Financial claims); or
� Investment in New Projects (either equity based or loan based); or
� Joint Ventures; or
� Investment in Intangibles (Goodwill/ Trade Marks/ Patents etc.)
Moreover, Executive Committee ensures that Proposed Investments are set out in Treet Group’s vision and Strategic domain.
Funding Policy
It is Treet Group’s policy not only to utilize funds efficiently but also to seek funds from the cheapest source(s).
Treet Group advertently evaluates, from time to time, different funding options for;
� Working Capital Requirements (including import/export financing)
� Medium Term Rollovers/Capital Requirements
� Long Term Project Based Requirements
� These funding options may include;
� Internally Generated Funds*
� Bank Borrowings (Short Term as well as Long Term)
� Trade & Sundry Credits
� Debt Instruments (Commercial Papers/ Bonds/ TFC etc.) issued to Institutions or Public in general
� Subordinate- Debts
� Leasing (Operating as well as Capital)
� Equity Financing etc.
* This includes Intra-Treet Group resource sharing. Corporate strategy (by the parent company i.e. Treet Corporation Limited) will seek to develop synergies by sharing and coordinating staff and other resources across business units, investing financial resources across business units, and using business units to complement other corporate business activities.
Investment/ Funding & dividend policies
IFDP

Quality Policy
Treet Corporation Limited
strives to meet the international standards. Top management of the Corporation is committed to a policy of sustained growth. The employees are quality conscious and work in highly motivated environment. The management is focused on customer satisfaction by continually upgrading human resource skills, technology and promoting a balanced trilateral customer – organization – supplier relationship.
Syed Shahid Ali
Chief Executive Officer
Str
ateg
ic re
po
rtG
over
nanc
e
99 2019 Annual Report 98
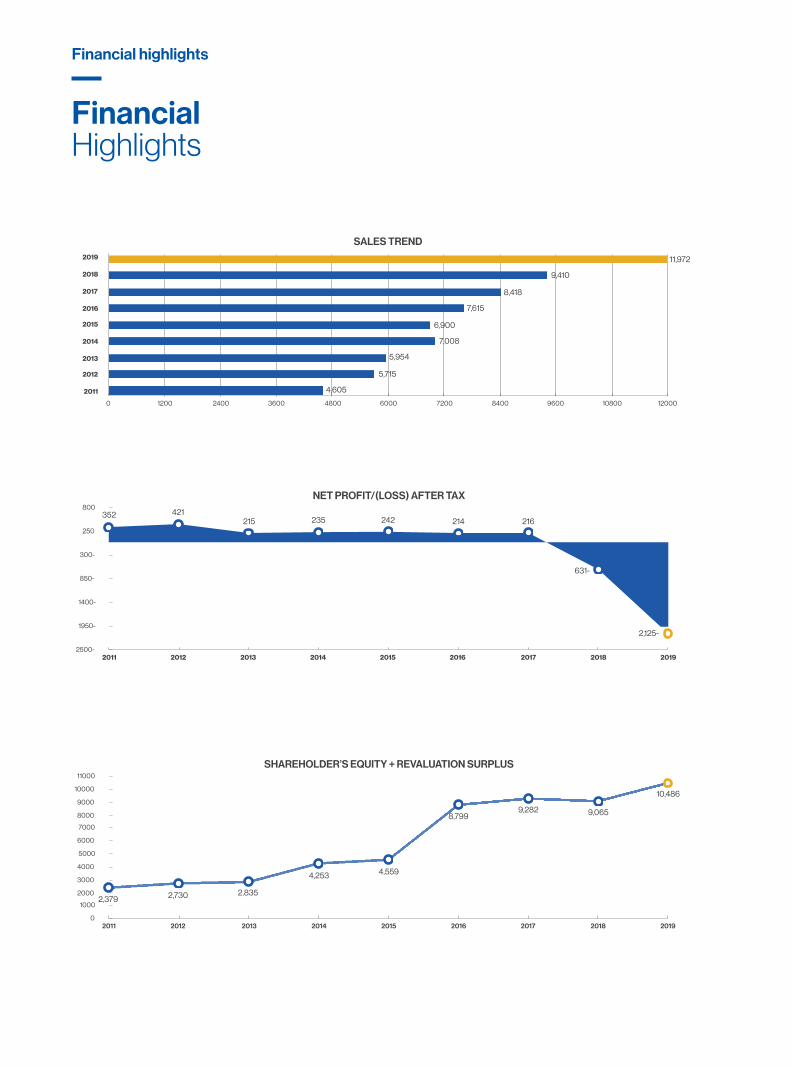
Financial Highlights
Financial highlights
SALES TREND2019
2018
2017
2016
2015
2014
2013
2012
2011
0 1200 2400 3600 4800 6000 7200 8400 9600 10800 12000
4,605
5,715
5,954
7,008
6,900
7,615
8,418
9,410
11,972
NET PROFIT/(LOSS) AFTER TAX
2500-
1950-
1400-
850-
300-
250
800
2011 2012 2013 2014 2015 2016 2017 2018 2019
352 421215 235 242 214 216
SHAREHOLDER’S EQUITY + REVALUATION SURPLUS
0
1000
2000
3000
4000
5000
6000
7000
8000
9000
10000
11000
2011 2012 2013 2014 2015 2016 2017 2018 2019
2,379 2,730 2,835
4,253 4,559
8,7999,282 9,065
10,486
631-
2,125-

EXPORT
0
400
800
1200
1600
2000
2400
2800
2011 2012 2013 2014 2015 2016 2017 2018 2019
9881192
1410
2008
17111875 1877
2088
2650
NPAT %
%25-
%20-
%15-
%10-
%5-
%0
%5
%10
%15
2011 2012 2013 2014 2015 2016 2017 2018 2019
%17.75-
%6.70-
%2.56%2.81%3.51%3.35%3.61
%7.36%7.65
ROE %
%25-
%20-
%15-
%10-
%5-
%0
%5
%10
%15
%20
2011 2012 2013 2014 2015 2016 2017 2018 2019
%20-
%7-
%2%2%5%6
%8
%15%15
Str
ateg
ic re
po
rtG
over
nanc
e
101 2019 Annual Report 100
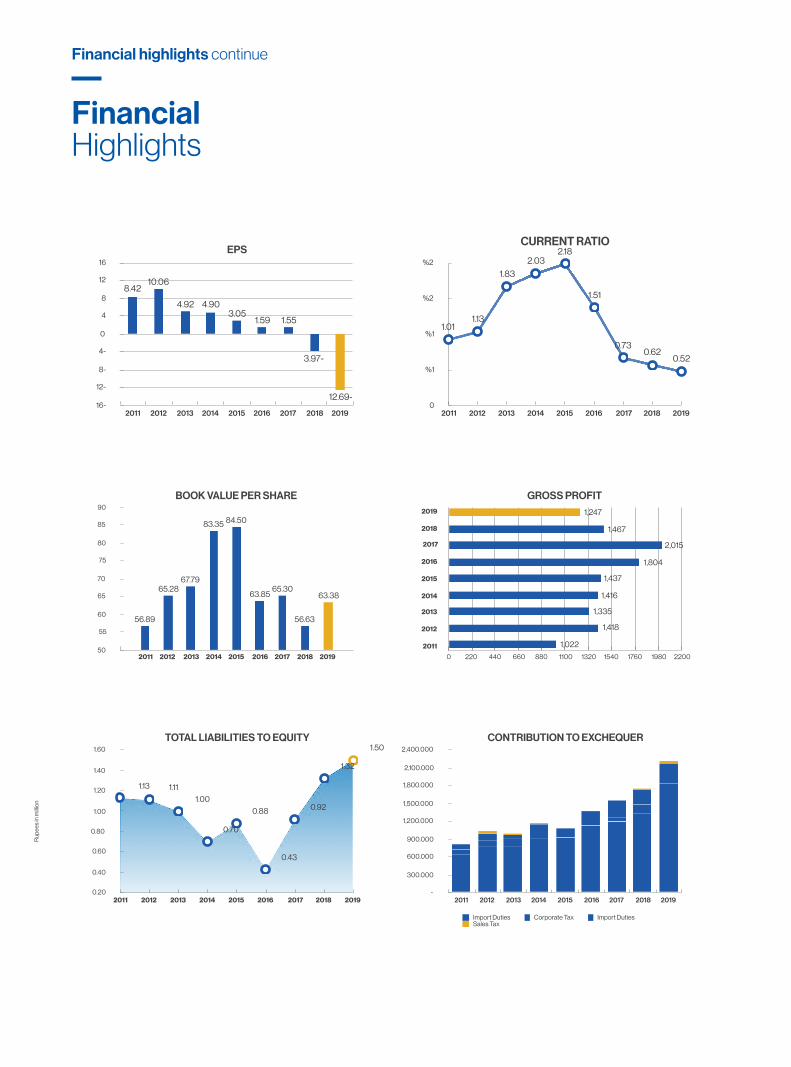
Financial highlights continue
EPS
16-
12-
8-
4-
0
4
8
12
16
2011 2012 2013 2014 2015 2016 2017 2018 2019
12.69-
3.97-
1.551.593.05
4.904.92
10.068.42
CURRENT RATIO
0
%1
%1
%2
%2
2011 2012 2013 2014 2015 2016 2017 2018 2019
1.011.13
1.83
2.032.18
1.51
0.730.62
0.52
BOOK VALUE PER SHARE
50
55
60
65
70
75
80
85
90
2011 2012 2013 2014 2015 2016 2017 2018 2019
63.38
56.63
65.3063.85
84.5083.35
67.7965.28
56.89
GROSS PROFIT2019
2018
2017
2016
2015
2014
2013
2012
2011
0 220 440 660 880 1100 1320 1540 1760 1980 2200
1,022
1,418
1,335
1,416
1,437
1,804
2,015
1,467
1,247
TOTAL LIABILITIES TO EQUITY
Rup
ees
in m
illio
n
0.20
0.40
0.60
0.80
1.00
1.20
1.40
1.60
2011 2012 2013 2014 2015 2016 2017 2018 2019
1.13 1.11
1.00
0.70
0.88
0.43
0.92
1.32
1.50 CONTRIBUTION TO EXCHEQUER
-
300.000
600.000
900.000
1,200.000
1,500.000
1,800.000
2,100.000
2,400.000
2011 2012 2013 2014 2015 2016 2017 2018 2019
Import Duties Corporate Tax Import DutiesSales Tax
Financial Highlights

P/E RATIO
16.00-
8.00-
0.00
8.00
16.00
24.00
32.00
40.00
2011 2012 2013 2014 2015 2016 2017 2018 2019
6.13 5.17
16.88
23.42 23.66
31.18
36.72
8.62-
1.18-
BONUS AND CASH DIVIDEND
CA
SH
DIV
IDE
ND
%5-
%0-
%5
%10
%15
%20
%25
BO
NU
S
%0
%1
%2
%3
%4
%5
%6
%7
%8
%9
%10
2011 2012 2013 2014 2015 2016 2017 2018 2019
Bonus Cash Dividend
GP MARGIN %
0
%4
%8
%11
%15
%19
%23
%26
%30
2011 2012 2013 2014 2015 2016 2017 2018 2019
22.19
24.8022.42
20.20 20.83
23.69 23.93
15.59
10.41
REVENUE DISTRIBUTED - CONSOLIDATED
Raw Material
Salaries
Utilities
Others
Depreciation
Transportation
Donations
Advertising
Financial Charges
Taxation
Net Loss
%30- %20- %10- %0 %10 %20 %30 %40 %50 %60 %70
%17-%1
%10
%5
%2
%3
%6
%8%6
%20
%57
Str
ateg
ic re
po
rtG
over
nanc
e
103 2019 Annual Report 102
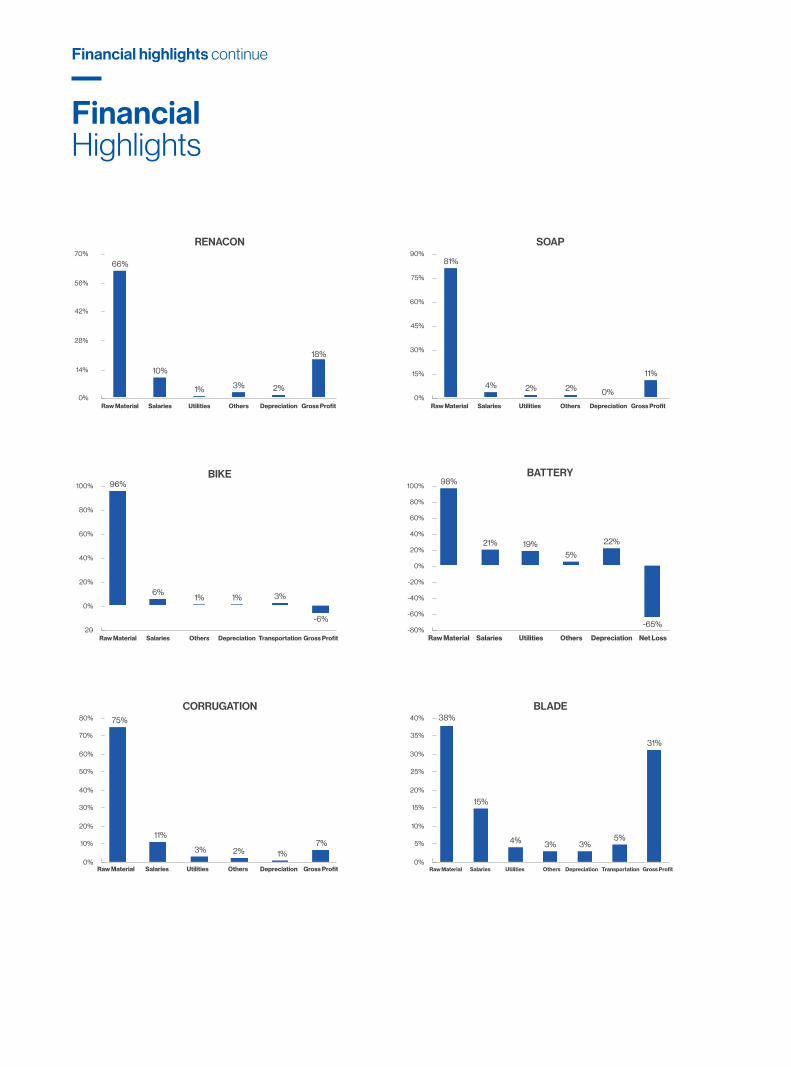
Financial highlights continue
RENACON
0%
14%
28%
42%
56%
70%
Raw Material Salaries Utilities Others Depreciation Gross Profit
18%
2%3%1%
10%
66%
SOAP
0%
15%
30%
45%
60%
75%
90%
Raw Material Salaries Utilities Others Depreciation Gross Profit
11%
0%2%2%4%
81%
BIKE
20-
0%
20%
40%
60%
80%
100%
Raw Material Salaries Others Depreciation Transportation Gross Profit
-6%
3%1%1%6%
96%
CORRUGATION
0%
10%
20%
30%
40%
50%
60%
70%
80%
Raw Material Salaries Utilities Others Depreciation Gross Profit
7%1%2%3%
11%
75%
BLADE
0%
5%
10%
15%
20%
25%
30%
35%
40%
Raw Material Salaries Utilities Others Depreciation Transportation Gross Profit
31%
5%3%3%4%
15%
38%
BATTERY
-80%
-60%
-40%
-20%
0%
20%
40%
60%
80%
100%
Raw Material Salaries Utilities Others Depreciation Net Loss
22%
5%19%21%
98%
-65%
Financial Highlights

Key Operating Financial Data
Financial highlights continue
Rs. in 000 2019 2018 2017 2016 2015
Sales 11,972,060 9,410,276 8,418,188 7,615,231 6,900,175
Export Sales 2,650,200 2,087,699 1,877,190 1,875,341 1,710,675
Gross Profit 1,246,890 1,467,191 2,014,884 1,804,382 1,437,390
Profit before Taxation (1,948,764) (478,835) 304,576 267,796 214,132
Profit after Taxation (2,125,246) (630,512) 215,910 214,314 242,213
Shareholders' Equity + Revaluation Surplus
10,485,669 9,065,394 9,281,533 8,798,692 4,558,790
Fixed Assets - Net 17,694,336 13,308,050 11,383,772 7,840,611 4,202,680
Total Assets 26,223,079 21,001,871 17,777,635 12,544,365 10,990,970
Total Liabilities 15,737,410 11,936,477 8,496,102 3,745,673 4,010,568
Current Assets 7,846,942 7,025,973 5,717,417 4,335,134 6,462,531
Current Liabilities 15,188,379 11,419,384 7,828,940 2,866,738 2,970,673
Cash Dividend 0% 0% 0% 10% 10%
Stock Dividend 0% 0% 10% 0% 0%
Shares Outstanding 165,450,942 160,084,685 142,143,666 137,804,309 53,950,701
*Restated
Important Ratios
Profitability
Gross Profit 10.41% 15.59% 23.93% 23.69% 20.83%
Profit before Tax -16.28% -5.09% 3.62% 3.52% 3.10%
Profit after Tax -17.75% -6.70% 2.56% 2.81% 3.51%
Return to Equity
Return on Equity before Tax -18.59% -5.28% 3.28% 3.04% 4.70%
Return on Equity after Tax -20.27% -6.96% 2.33% 2.44% 5.31%
Earning per Shares (12.69) (3.97) 1.55 1.59 3.05
Liquidity/Leverage
Current Ratio 0.52 0.62 0.73 1.51 2.18
Break-up Value per Share 63.38 56.63 65.30 63.85 84.50
Total Liabilities to Equity 1.50 1.32 0.92 0.43 0.88
% Change
Sales 27.22% 11.79% 10.54% 10.36% -1.55%
Export Sales 26.94% 11.21% 0.10% 9.63% -14.80%
Gross Profit -15.02% -27.18% 11.67% 25.53% 1.54%
Profit before Taxation 306.98% -257.21% 13.73% 25.06% -13.14%
Profit after Taxation 237.07% -392.03% 0.74% -11.52% 3.26%
Shareholders' Equity + Revaluation Surplus
15.67% -2.33% 5.49% 93.00% 7.20%
Fixed Assets - Net 32.96% 16.90% 45.19% 86.56% 36.39%
Total Assets 24.86% 18.14% 41.72% 14.13% 51.70%
Total Liabilities 31.84% 40.49% 126.82% -6.60% 34.01%
Current Assets 11.68% 22.89% 31.89% -32.92% 66.63%
Current Liabilities 33.01% 45.86% 173.10% -3.50% 55.41%
Dividend -100.00% 0.00% -50.00%
Shares Outstanding -100.00% 3.15% 155.43% 5.74%
Str
ateg
ic re
po
rtG
over
nanc
e
105 2019 Annual Report 104

Our Products
Our products continue

Str
ateg
ic re
po
rtG
over
nanc
e
107 2019 Annual Report 106
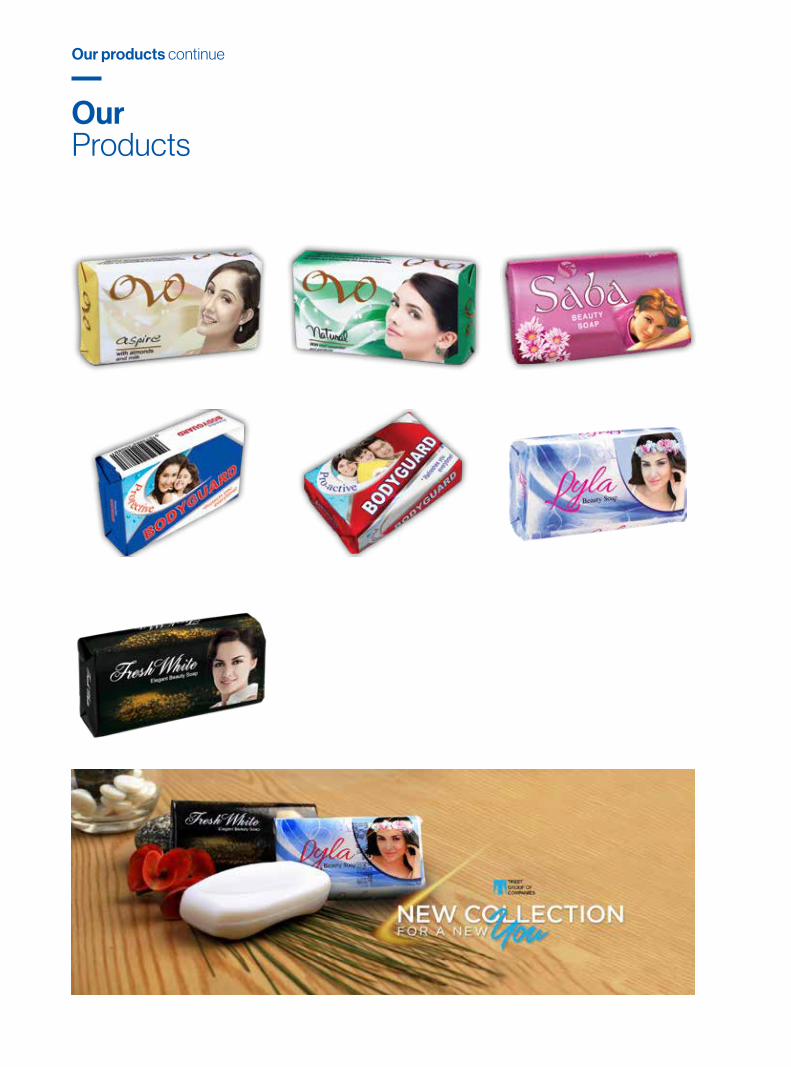
Our products continue
Our Products

Str
ateg
ic re
po
rtG
over
nanc
e
109 2019 Annual Report 108

Our products continue
Our Products

Str
ateg
ic re
po
rtG
over
nanc
e
111 2019 Annual Report 110

Our products continue
Our Products

Gov
erna
nce
113 2019 Annual Report 113
Str
ateg
ic re
po
rt
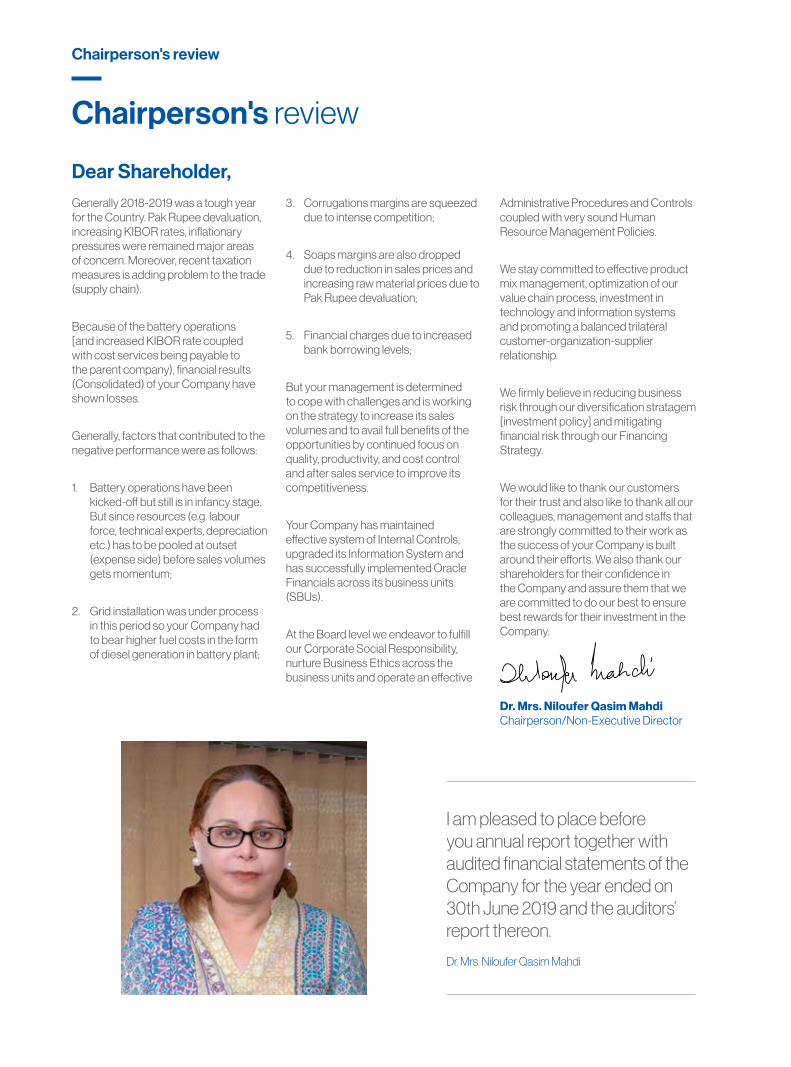
Generally 2018-2019 was a tough year for the Country. Pak Rupee devaluation, increasing KIBOR rates, inflationary pressures were remained major areas of concern. Moreover, recent taxation measures is adding problem to the trade (supply chain).
Because of the battery operations [and increased KIBOR rate coupled with cost services being payable to the parent company), financial results (Consolidated) of your Company have shown losses.
Generally, factors that contributed to the negative performance were as follows:
1. Battery operations have been kicked-off but still is in infancy stage. But since resources (e.g. labour force, technical experts, depreciation etc.) has to be pooled at outset (expense side) before sales volumes gets momentum;
2. Grid installation was under process in this period so your Company had to bear higher fuel costs in the form of diesel generation in battery plant;
3. Corrugations margins are squeezed due to intense competition;
4. Soaps margins are also dropped due to reduction in sales prices and increasing raw material prices due to Pak Rupee devaluation;
5. Financial charges due to increased bank borrowing levels;
But your management is determined to cope with challenges and is working on the strategy to increase its sales volumes and to avail full benefits of the opportunities by continued focus on quality, productivity, and cost control and after sales service to improve its competitiveness.
Your Company has maintained effective system of Internal Controls, upgraded its Information System and has successfully implemented Oracle Financials across its business units (SBUs).
At the Board level we endeavor to fulfill our Corporate Social Responsibility, nurture Business Ethics across the business units and operate an effective
Dear Shareholder,Administrative Procedures and Controls coupled with very sound Human Resource Management Policies.
We stay committed to effective product mix management, optimization of our value chain process, investment in technology and information systems and promoting a balanced trilateral customer-organization-supplier relationship.
We firmly believe in reducing business risk through our diversification stratagem [investment policy] and mitigating financial risk through our Financing Strategy.
We would like to thank our customers for their trust and also like to thank all our colleagues, management and staffs that are strongly committed to their work as the success of your Company is built around their efforts. We also thank our shareholders for their confidence in the Company and assure them that we are committed to do our best to ensure best rewards for their investment in the Company.
Dr. Mrs. Niloufer Qasim MahdiChairperson/Non-Executive Director
I am pleased to place before you annual report together with audited financial statements of the Company for the year ended on 30th June 2019 and the auditors’ report thereon.
Dr. Mrs. Niloufer Qasim Mahdi
Chairperson's review
Chairperson's review
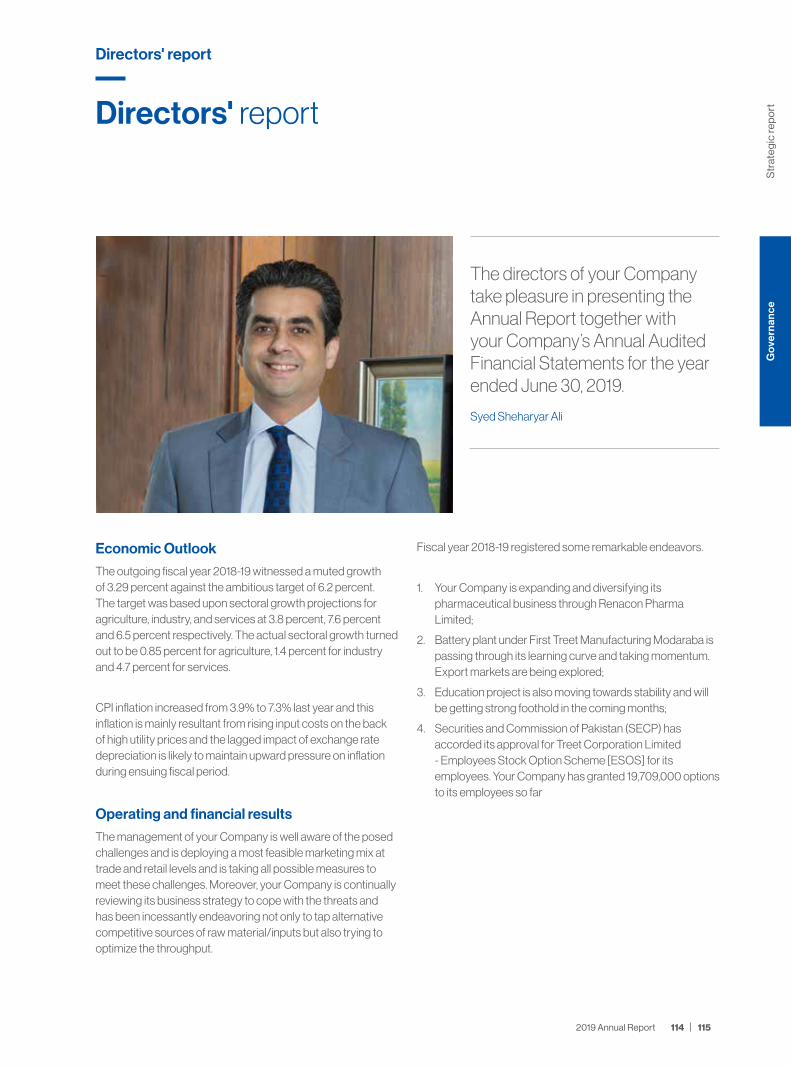
Economic Outlook
The outgoing fiscal year 2018-19 witnessed a muted growth of 3.29 percent against the ambitious target of 6.2 percent. The target was based upon sectoral growth projections for agriculture, industry, and services at 3.8 percent, 7.6 percent and 6.5 percent respectively. The actual sectoral growth turned out to be 0.85 percent for agriculture, 1.4 percent for industry and 4.7 percent for services.
CPI inflation increased from 3.9% to 7.3% last year and this inflation is mainly resultant from rising input costs on the back of high utility prices and the lagged impact of exchange rate depreciation is likely to maintain upward pressure on inflation during ensuing fiscal period.
Operating and financial results
The management of your Company is well aware of the posed challenges and is deploying a most feasible marketing mix at trade and retail levels and is taking all possible measures to meet these challenges. Moreover, your Company is continually reviewing its business strategy to cope with the threats and has been incessantly endeavoring not only to tap alternative competitive sources of raw material/inputs but also trying to optimize the throughput.
Fiscal year 2018-19 registered some remarkable endeavors.
1. Your Company is expanding and diversifying its pharmaceutical business through Renacon Pharma Limited;
2. Battery plant under First Treet Manufacturing Modaraba is passing through its learning curve and taking momentum. Export markets are being explored;
3. Education project is also moving towards stability and will be getting strong foothold in the coming months;
4. Securities and Commission of Pakistan (SECP) has accorded its approval for Treet Corporation Limited - Employees Stock Option Scheme [ESOS] for its employees. Your Company has granted 19,709,000 options to its employees so far
The directors of your Company take pleasure in presenting the Annual Report together with your Company’s Annual Audited Financial Statements for the year ended June 30, 2019.
Syed Sheharyar Ali
Directors' report
Directors' report
Str
ateg
ic re
po
rtG
over
nanc
e
115 2019 Annual Report 114
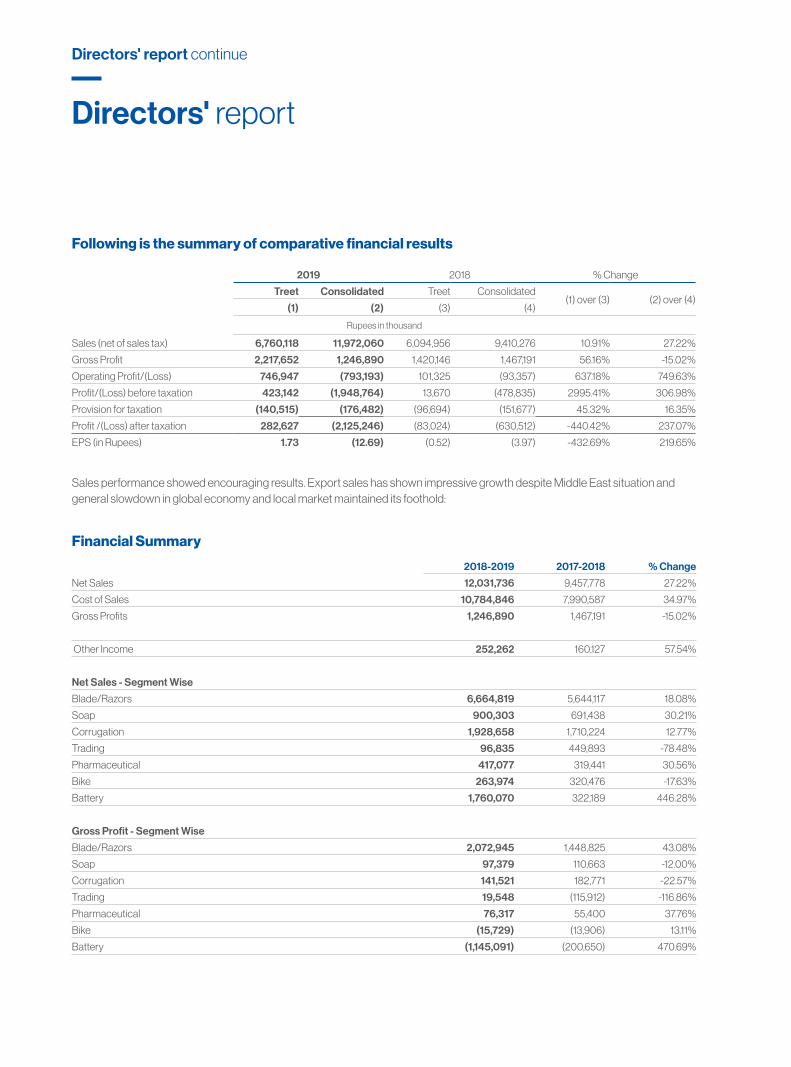
Following is the summary of comparative financial results
2019 2018 % Change
Treet Consolidated Treet Consolidated(1) over (3) (2) over (4)
(1) (2) (3) (4)
Rupees in thousand
Sales (net of sales tax) 6,760,118 11,972,060 6,094,956 9,410,276 10.91% 27.22%
Gross Profit 2,217,652 1,246,890 1,420,146 1,467,191 56.16% -15.02%
Operating Profit/(Loss) 746,947 (793,193) 101,325 (93,357) 637.18% 749.63%
Profit/(Loss) before taxation 423,142 (1,948,764) 13,670 (478,835) 2995.41% 306.98%
Provision for taxation (140,515) (176,482) (96,694) (151,677) 45.32% 16.35%
Profit /(Loss) after taxation 282,627 (2,125,246) (83,024) (630,512) -440.42% 237.07%
EPS (in Rupees) 1.73 (12.69) (0.52) (3.97) -432.69% 219.65%
Sales performance showed encouraging results. Export sales has shown impressive growth despite Middle East situation and general slowdown in global economy and local market maintained its foothold:
Financial Summary
2018-2019 2017-2018 % Change
Net Sales 12,031,736 9,457,778 27.22%
Cost of Sales 10,784,846 7,990,587 34.97%
Gross Profits 1,246,890 1,467,191 -15.02%
Other Income 252,262 160,127 57.54%
Net Sales - Segment Wise
Blade/Razors 6,664,819 5,644,117 18.08%
Soap 900,303 691,438 30.21%
Corrugation 1,928,658 1,710,224 12.77%
Trading 96,835 449,893 -78.48%
Pharmaceutical 417,077 319,441 30.56%
Bike 263,974 320,476 -17.63%
Battery 1,760,070 322,189 446.28%
Gross Profit - Segment Wise
Blade/Razors 2,072,945 1,448,825 43.08%
Soap 97,379 110,663 -12.00%
Corrugation 141,521 182,771 -22.57%
Trading 19,548 (115,912) -116.86%
Pharmaceutical 76,317 55,400 37.76%
Bike (15,729) (13,906) 13.11%
Battery (1,145,091) (200,650) 470.69%
Directors' report continue
Directors' report

Selling & General Administration and Others
Salaries 732,574 607,973 20.49%
Utilities 724 465 55.70%
Others 576,544 370,547 55.59%
Depreciation 68,166 57,256 19.05%
Transportation 4,452 5,097 -12.65%
Donations 211,427 115,568 82.95%
Advertising 567,637 463,333 22.51%
Financial charges 1,286,392 485,914 164.74%
Taxation 176,482 151,677 16.35%
Gross Profit (2,125,246) (630,512) 237.07%
Gross profit margins (on consolidated basis) are decreased mainly due to the following factors;
Lead Acid Batteries Segment
Your Company has started commercial production of lead acid batteries since February 2018. In the initial period, profitability is in Red due to following factors:
• Manpower is to be built up and to be trained through learning curve. Your Company has hired full work force and are being trained by the Korean experts since this is new technology and local expertise are not available and has to be trained and built up with this passage of time;
• Cost of Korean experts is relatively high but has to be borne to develop the local workforce;
• Production pace is slow and will be geared up gradually as learning curve is developed;
• Depreciation and other fixed costs are to be borne fully irrespective of production volumes;
• Utilities costs are high due to diesel generation. But this will be calm down in the coming months since Company’s own grid is installed and functioning;
• Total impact is Rs. 500.00~ Rs. 600.00million (appx) (excluding depreciation) . Your Company is making full efforts to achieve positive EBITDA in Financial Year 2018-2019. Moreover, efforts are being made to explore export markets and necessary certifications are under process. Distribution channel is established and will be strengthen further in the coming month.
Corrugation & Soap Segments
• Cost of raw material is increased but pass through impact is limited.
Operating profit is also in red mainly because of increase in operating costs due to new projects and expansion and that includes;
• Salaries and wages;
• Donation to Society for Cultural Education;
Str
ateg
ic re
po
rtG
over
nanc
e
117 2019 Annual Report 116

Directors' report continue
Factors having –ve impact on Net Profit/(Loss):
• Financial Charges due to increased borrowings;
Revenue Distribution
2018-2019 2018-2019 2017-2018 2017-2018 % Change
% of Sales % of Sales Year to Year %
Raw Material 7,055,543 57.4% 5,078,943 52.8% 38.92%Because of Battery Segment - Material to Sales Ratio is higher in Battery Segment
Salaries 2,445,819 19.9% 2,224,999 23.1% 9.92%Increased sales volumes and economies of Scale
Utilities 686,104 5.6% 412,767 4.3% 66.22%Because of Battery Segment [power generation through Diesel Generators]
Others 936,237 7.6% 667,792 6.9% 40.20%
Depreciation 676,310 5.5% 351,413 3.7% 92.45%Battery Segment in full year of Operation
Transportation 367,293 2.99% 296,011 3.08% 24.08%
Donations 211,427 1.72% 115,568 1.20% 82.95%
Advertising 567,637 4.62% 463,333 4.82% 22.51%
Financial charges 1,286,392 10.47% 485,914 5.05% 164.74%Increased borowings and increase of KIBOR rates
Taxation 176,482 1.44% 151,677 1.58% 16.35%
Gross Profit/(Loss) (2,125,246) -17.30% (630,512) -6.56% 237.07%
Appropriations
Rs. in thousands 2018-2019 2017-2018
Un-Appropriated Profit b/f 695,265 974,863
Incremental Depreciation 8,894 8,854
Other Comprehensive Loss (89,464) (62,558)
Profit/(Loss) during the period 490,781 (83,024)
Issuance of Bonus Shares @ 10% - (142,870)
Dividend Distributed - -
Un-Appropriated Profit c/f 1,105,476 695,265
Dividend
Due to expansion/diversification plans of the Company, Board of Directors of the Company has decided not to declare dividend for this financial year.
Auditors
The Audit Committee of your company has recommended that, the present auditors, M/s KPMG Taseer Hadi & Company Chartered Accountants due to retire and being eligible, are offering themselves for reappointment, may be appointed as auditors of your Company for another term.
Directors' report
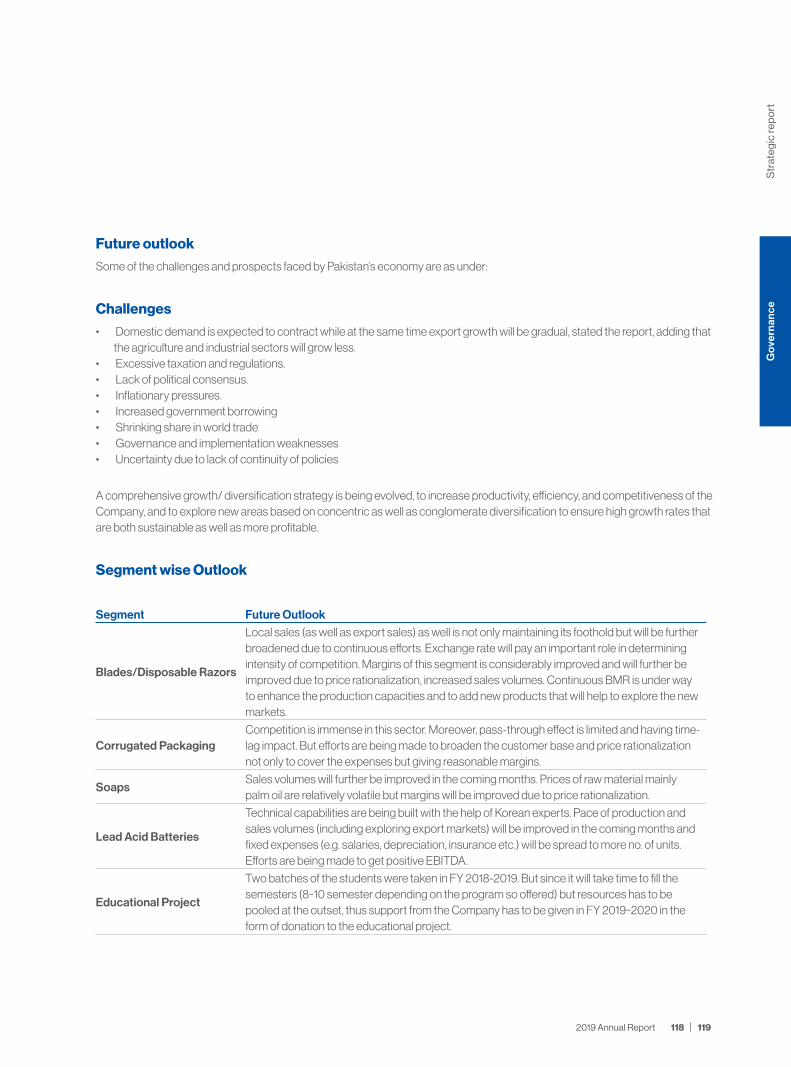
Future outlook
Some of the challenges and prospects faced by Pakistan’s economy are as under:
Challenges
• Domestic demand is expected to contract while at the same time export growth will be gradual, stated the report, adding that the agriculture and industrial sectors will grow less.
• Excessive taxation and regulations.• Lack of political consensus.• Inflationary pressures.• Increased government borrowing• Shrinking share in world trade• Governance and implementation weaknesses• Uncertainty due to lack of continuity of policies
A comprehensive growth/ diversification strategy is being evolved, to increase productivity, efficiency, and competitiveness of the Company, and to explore new areas based on concentric as well as conglomerate diversification to ensure high growth rates that are both sustainable as well as more profitable.
Segment wise Outlook
Segment Future Outlook
Blades/Disposable Razors
Local sales (as well as export sales) as well is not only maintaining its foothold but will be further broadened due to continuous efforts. Exchange rate will pay an important role in determining intensity of competition. Margins of this segment is considerably improved and will further be improved due to price rationalization, increased sales volumes. Continuous BMR is under way to enhance the production capacities and to add new products that will help to explore the new markets.
Corrugated PackagingCompetition is immense in this sector. Moreover, pass-through effect is limited and having time-lag impact. But efforts are being made to broaden the customer base and price rationalization not only to cover the expenses but giving reasonable margins.
SoapsSales volumes will further be improved in the coming months. Prices of raw material mainly palm oil are relatively volatile but margins will be improved due to price rationalization.
Lead Acid Batteries
Technical capabilities are being built with the help of Korean experts. Pace of production and sales volumes (including exploring export markets) will be improved in the coming months and fixed expenses (e.g. salaries, depreciation, insurance etc.) will be spread to more no. of units. Efforts are being made to get positive EBITDA.
Educational Project
Two batches of the students were taken in FY 2018-2019. But since it will take time to fill the semesters (8~10 semester depending on the program so offered) but resources has to be pooled at the outset, thus support from the Company has to be given in FY 2019~2020 in the form of donation to the educational project.
Str
ateg
ic re
po
rtG
over
nanc
e
119 2019 Annual Report 118

Directors' report continue
Chemicals
Industrial chemicals like Epoxy Resin, Hardener, Polyuria Polyol and other related products are being imported and marketed in Pakistan after detailed study of the domestic market of the said chemicals; Initially test marketing will be done and after passing through learning curve of the industry proper sales and marketing strategy will be implemented;
Pharmaceutical
This segment has shown impressive growth and this trend is likely to continue in FY 2019-2020. Moreover, construction work on Faisalabad project is underway. This project will not only increase the capacity of existing plant but also your Company will be able to add new products (e.g. blood tubing lines, pharmaceutical products etc.).
Financial PlanningDetailed Financial planning is attached with the report. What is import at the moment is to bring the current levels of borrowings down. Since due to restrictive fiscal measures it is expected that KIBOR will be escalated in the ensuing months.
AcknowledgementsWe wish to place on record gratitude to our valued customers for their confidence in our products and we pledge ourselves to provide them the best quality by continuously improving our products. We would also like to thank all our colleagues, management and factory staff who are strongly committed to their work as the success of your Company is built around their efforts. We also thank our shareholders for their confidence in the Company and assure them that we are committed to do our best to ensure best rewards for their investment in the Company.
Syed Sheharyar AliExecutive Director
Dated: October 04, 2019 Lahore
Directors' report

Gov
erna
nce
121 2019 Annual Report 121
Str
ateg
ic re
po
rt
اعترافہم اپنے معزز کسٹمرز کو ان کے ہماری مصنوعات پر اعتماد کے لئے شکریہ ادا کرنا چاہتے ہیں اور ہم عہد کرتے ہیں کہ انہیں اپنے
بہترین معیا ر کی مصنو عات فراہم کرتے رہیں گے۔ ہم اپنے تمام ساتھیوں، مینجمنٹ اور فیکٹری کے عملہ کو بھی شکریہ ادا کرتے ہیں۔ جنہوں نے اپنے عہد کے مطابق سخت محنت کی۔ آپکی کمپنی کی کامیابی آپ کی جدوجہد کا نتیجہ ہے ہم حصص رکھنے
والوں کا بھی شکریہ ادا کرنا چاہتے ہیں کہ انہوں نے کمپنی پر اپنے اعتماد کا اظہار کیا اور انہیں یقین دالتے ہیں کہ کمپنی میں ان کی سرمایہ کاری کے لئے بہترین معاوضہ دالنے اپنی بہترین صالحیتوں کو بروئے کار النے کا عہد کرتے ہیں۔
سید شہر یار علیایگزیکٹو ڈائریکڑ
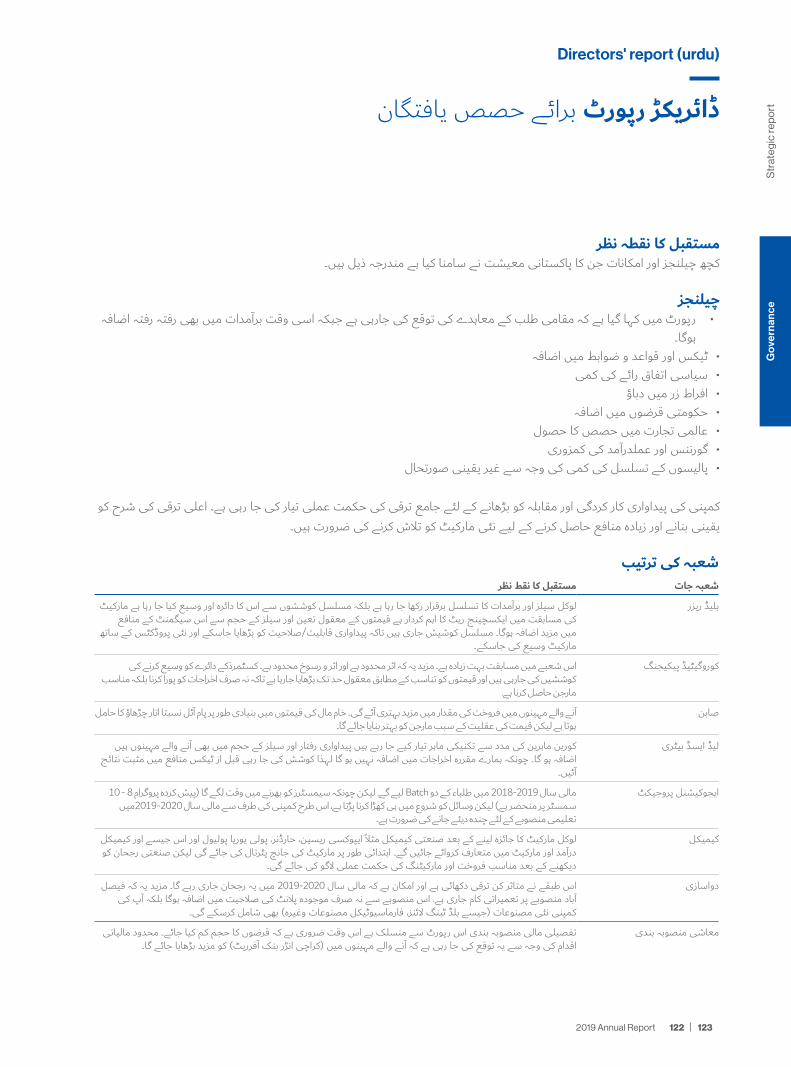
شعبہ کی ترتیبمستقبل کا نقط نظر شعبہ جات
لوکل سیلز اور برآمدات کا تسلسل برقرار رکھا جا رہا ہے بلکہ مسلسل کوششوں سے اس کا دائرہ اور وسیع کیا جا رہا ہے مارکیٹ کی مسابقت میں ایکسچینج ریٹ کا اہم کردار ہے قیمتوں کے معقول تعین اور سیلز کے حجم سے اس سیگمنٹ کے منافع
میں مزید اضافہ ہوگا۔ مسلسل کوشیش جاری ہیں تاکہ پیداواری قابلیت/صالحیت کو بڑھایا جاسکے اور نئی پروڈکٹس کے ساتھمارکیٹ وسیع کی جاسکے۔
بلیڈ ریزر
اس شعبے میں مسابقت بہت زیادہ ہے۔ مزید یہ کہ اثر محدود ہے اور اثر و رسوخ محدود ہے۔ کسٹمرذکے دائرے کو وسیع کرنے کی کوششیں کی جارہی ہیں اور قیمتوں کو تناسب کے مطابق معقول حد تک بڑھایا جارہا ہے تاکہ نہ صرف اخراجات کو پورا کرنا بلکہ مناسب
مارجن حاصل کرنا ہے.
کوروگیٹیڈ پیکیجنگ
آنے والے مہینوں میں فروخت کی مقدار میں مزید بہتری آئے گی۔ خام مال کی قیمتوں میں بنیادی طور پر پام آئل نسبتا اتار چڑھاؤ کا حاملہوتا ہے لیکن قیمت کی عقلیت کے سبب مارجن کو بہتر بنایا جائے گا۔
صابن
کورین ماہرین کی مدد سے تکنیکی ماہر تیار کیے جا رہے ہیں پیداواری رفتار اور سیلز کے حجم میں بھی آنے والے مہینوں ہیں اضافہ ہو گا۔ چونکہ ہمارے مقررہ اخراجات میں اضافہ نہیں ہو گا لہذا کوشش کی جا رہی قبل از ٹیکس منافع میں مثبت نتائج
آئیں۔
لیڈ ایسڈ بیٹری
مالی سال 2019-2018 میں طلباء کے دو Batch لیے گے. لیکن چونکہ سیمسٹرز کو بھرنے میں وقت لگے گا )پیش کردہ پروگرام 8 - 10 سمسٹر پر منحصر ہے( لیکن وسائل کو شروع میں ہی کھڑا کرنا پڑتا ہے، اس طرح کمپنی کی طرف سے مالی سال 2020-2019میں
تعلیمی منصوبے کے لئے چندہ دیئے جانے کی ضرورت ہے۔
ایجوکیشنل پروجیکٹ
لوکل مارکیٹ کا جائزہ لینے کے بعد صنعتی کیمیکل مثال ایپوکسی ریسین، حارڈنر، پولی یوریا پولیول اور اس جیسے اور کیمیکل درآمد اور مارکیٹ میں متعارف کروائے جائیں گے۔ ابتدائی طور پر مارکیٹ کی جانچ پٹرتال کی جائے گی لیکن صنعتی رجحان کو
دیکھنے کے بعد مناسب فروخت اور مارکیٹنگ کی حکمت عملی الگو کی جائے گی۔
کیمیکل
اس طبقے نے متاثر کن ترقی دکھائی ہے اور امکان ہے کہ مالی سال 2020-2019 میں یہ رجحان جاری رہے گا۔ مزید یہ کہ فیصل آباد منصوبے پر تعمیراتی کام جاری ہے. اس منصوبے سے نہ صرف موجودہ پالنٹ کی صالحیت میں اضافہ ہوگا بلکہ آپ کی
کمپنی نئی مصنوعات )جیسے بلڈ ٹبنگ الئنز، فارماسیوٹیکل مصنوعات وغیرہ( بھی شامل کرسکے گی۔
دواسازی
تفصیلی مالی منصوبہ بندی اس رپورٹ سے منسلک ہے اس وقت ضروری ہے کہ قرضوں کا حجم کم کیا جائے۔ محدود مالیاتیاقدام کی وجہ سے یہ توقع کی جا رہی ہے کہ آنے والے مہینوں میں )کراچی انڑر بنک افرریٹ( کو مزید بڑھایا جائے گا۔
معاشی منصوبہ بندی
مستقبل کا نقطہ نظرکچھ چیلنجز اور امکانات جن کا پاکستانی معیشت نے سامنا کیا ہے مندرجہ ذیل ہیں۔
چیلنجز رپورٹ میں کہا گیا ہے کہ مقامی طلب کے معاہدے کی توقع کی جارہی ہے جبکہ اسی وقت برآمدات میں بھی رفتہ رفتہ اضافہ
ہوگا۔ٹیکس اور قواعد و ضوابط میں اضافہ سیاسی اتفاق رائے کی کمی افراط زر میں دباؤ حکومتی قرضوں میں اضافہ عالمی تجارت میں حصص کا حصول گورننس اور عملدرآمد کی کمزوری پالیسوں کے تسلسل کی کمی کی وجہ سے غیر یقینی صورتحال
کمپنی کی پیداواری کار کردگی اور مقابلہ کو بڑھانے کے لئے جامع ترقی کی حکمت عملی تیار کی جا رہی ہے۔ اعلی ترقی کی شرح کو یقینی بنانے اور زیادہ منافع حاصل کرنے کے لیے نئی مارکیٹ کو تالش کرنے کی ضرورت ہیں۔
ڈائریکڑ رپورٹ برائے حصص یافتگان
Directors' report (urdu)
Str
ateg
ic re
po
rtG
over
nanc
e
123 2019 Annual Report 122

محصول کی تقسیم% Change 2017-2018 2017-2018 2018-2019 2018-2019
Year to Year % % of Sales % of Sales
بیٹری طبقہ کی وجہ سے - بیٹری طبقہ میں خام مال سے سیل کا تناسب زیادہ
ہے۔ 38.92% 52.8% 5,078,943 57.4% خام مال 7,055,543
فروخت کی مقدار میں اضافہ 9.92% 23.1% 2,224,999 19.9% تنخواہ 2,445,819بیٹری طبقہ کی وجہ سے ]ڈیزل جنریٹرز
کے ذریعے بجلی پیدا کرنا66.22% 4.3% 412,767 5.6% افادیت کے اخراجات 686,104
40.20% 6.9% 667,792 7.6% دوسرے اخراجات 936,237پورے سال فرسودگی 92.45% 3.7% 351,413 5.5% فرسودگی 676,310
24.08% 3.08% 296,011 2.99% نقل و حمل 367,29382.95% 1.20% 115,568 1.72% عطیات 211,42722.51% 4.82% 463,333 4.62% اشتہار 567,637
قرضوں میں اضافہ اور KIBOR کی شرحوں میں اضافہ۔
164.74% 5.05% 485,914 10.47% مالی چارجز 1,286,392
ٹیکس کے اخراجات 16.35% 1.58% 151,677 1.44% ٹیکس کے اخراجات 176,482کل منافع/)نقصان( 237.07% -6.56% (630,512) -17.30% (2,125,246) کل منافع/)نقصان(
تصرفات2017-2018 2018-2019 ہزار وں میں
974,863 695,265 b/fغیر تصرف شدہ منافع
اضافی ڈیپریسیشن 8,894 8,854
)62,558( (89,464) دیگر جامع نقصان
)83,024( 490,781 مدت کے دوران منافع/)نقصان(
)142,870( - بونس شیئرز کا اجراء ۱۰فیصد
- - تقسیم کیا گیا ڈیویڈنڈ
695,265 1,105,476 c/fغیر تصرف شدہ منافع
ڈیویڈنڈکاروبار میں توسیع کی وجہ سے کمپنی کے بورڈ آف ڈائر یکڑز نے فیصلہ کیا ہے کہ اس مالی سال ڈیویڈنڈنہ دیا جائے ۔
آڈیٹرزکاونٹنٹس کی سبک دوشی اور اہل اپکی کمپنی کی آڈٹ کمیٹی موجودہ اڈیٹرز میسرز کے پی ایم جی تاثیر ہادی اینڈ کمپنی چارٹرڈ اہونے کی وجہ سے ان کی دوبارہ تقرری کی سفارش کی ہے کہ انہیں اگلی مدت کے لیے اپکی کمپنی کا بحیثیت اڈیٹرز تقرر کیا جائے۔
لیڈ ایسڈ بیٹریز کا شعبہآپکی کمپنی کے مضاربہ نے فروری 2018 سے لیڈ ایسڈ بیٹری کی پیداوار شروع کر دی ہے۔ شروع میں مندرجہ ذیل عوامل کی وجہ
سے منافع میں کمی دیکھی جا سکتی ہے۔
ورکرز کو با اختیار بنانا اور سیکھانا۔ آپکے مضاربہ نے ورکرز ماہانہ اجرت پر رکھے ہیں جنکو کورین ماہرین کے ذریعے سے ہنر سکھایا جا رہا ہے کیونکہ یہ نئی ٹیکنالوجی ہے اور اسکا کوئی ماہر پاکستان میں میسر نہیں ہے لہذا س ٹیکنالوجی کو سیکھانے میں
وقت درکا ر ہے۔
کورین ماہرین کی الگت نسبتا زیادہ ہے لیکن ہمیں اپنی ورک فورس کو تیار کرنے کے لیے یہ الگت الزمی ہے۔
پیداوار کی رفتار سست ہے لیکن مقامی افرادی قوت کے تیار ہونے کے ساتھ اس میں اضافہ ہوگا۔
پیداوری حجم کو باالئے طاق رکھتے ہوئے ڈیپر یسیشن اور دوسرے مقررہ خرچے برداشت کیے گئے ہیں۔
جنریٹرز میں ڈیزل کے استعمال کی وجہ سے خرچ میں اضافہ ہوا ہے لیکن آنے والے مہینوں میں اس میں کمی واقع ہو گی کیونکہ مضاربہ کا اپنا گرڈ اسٹیشن تیار ہو گیا ہے جو کہ عنقریب کام شروع کر دے گا۔
کل مجموعہ تقریبا 600-500 ملین روپے ہے۔ آپکی کمپنی پوری کوشش کر رہی ہے کہ مالی سال 20-2019 میں قبل از ٹیکس منافع حاصل کیاجائے۔ مزید برآں مختلف سرٹیفیکیشن اور برآمدات کے لیے کام جاری ہے۔ ڈسٹریبویشن چینل قائم ہو چکا ہے جو
آنے والے مہینوں میں مزید مضبوط ہو گا۔
کوروگیشن اور صابن سیگمنٹ خام مال کی قیمت بڑھی ہے لیکن اس کا بوجھ خریدار پر اس شرح سے نہیں پرا۔
آپریٹنگ منافع بھی سرخی میں ہے بنیادی طور پر نئے منصوبوں اور توسیع کی وجہ سے آپریٹنگ اخراجات میں اضافے کی وجہ نیچے ذکرہیں;
تنخواہ اور اجرت؛ تعلیم کے لئے سوسائٹی کو عطیہ؛
خالص منافع پر منفی اثر ڈالنے والے عوامل۔قرضوں میں اضافے کی وجہ سے مالی چارجز
ڈائریکڑ رپورٹ برائے حصص یافتگان
Directors' report (urdu)
Str
ateg
ic re
po
rtG
over
nanc
e
125 2019 Annual Report 124

سیلز کی کارکردگی کے نتائج حوصلہ افزاء ہیں برامدات کی فروخت نے مشرقی وسطی کے حاالت اور عالمی معیشت کی سست روی کے باوجود متاثر کن کارکردگی دکھائی۔ مگر مقامیمارکیٹ اپنی جگہ پر برقرار رہی۔
مالیاتی نتائج کا خالصہتبدیلی % 2017-2018 2018-2019
27.22% خالص فروخت 12,031,736 9,457,778 34.97% فروخت کی قیمت 10,784,846 7,990,587 -15.02% کل منافع 1,246,890 1,467,191
57.54% دوسری آمدنی 252,262 160,127
طبقہ وار خالص فروخت18.08% بلیڈ / استرا 6,664,819 5,644,117 30.21% صابن 900,303 691,438 12.77% کوروگیشن 1,928,658 1,710,224
-78.48% تجارت 96,835 449,893 30.56% دواسازی 417,077 319,441 -17.63% موٹر سائیکل 263,974 320,476
446.28% بیٹری 1,760,070 322,189
43.08% بلیڈ / استرا 2,072,945 1,448,825 -12.00% صابن 97,379 110,663 -22.57% کوروگیشن 141,521 182,771
-116.86% (115,912) تجارت 19,548 37.76% دواسازی 76,317 55,400
13.11% (13,906) (15,729) موٹر سائیکل470.69% (200,650) (1,145,091) بیٹری
فروخت اور عمومی انتظامیہ اور دیگر۔
20.49% تنخواہ 732,574 607,973 55.70% افادیت کے اخراجات 724 465 55.59% دوسرے اخراجات 576,544 370,547 19.05% فرسودگی 68,166 57,256
-12.65% نقل و حمل 4,452 5,097 82.95% عطیات 211,427 115,568 22.51% اشتہار 567,637 463,333
164.74% مالی چارجز 1,286,392 485,914 16.35% ٹیکس کے اخراجات 176,482 151,677
237.07% (630,512) (2,125,246) کل منافع
مجموئی منافع میں مندرجہ ذیل عوامل کی وجہ سے کمی واقع ہوئی ہے۔
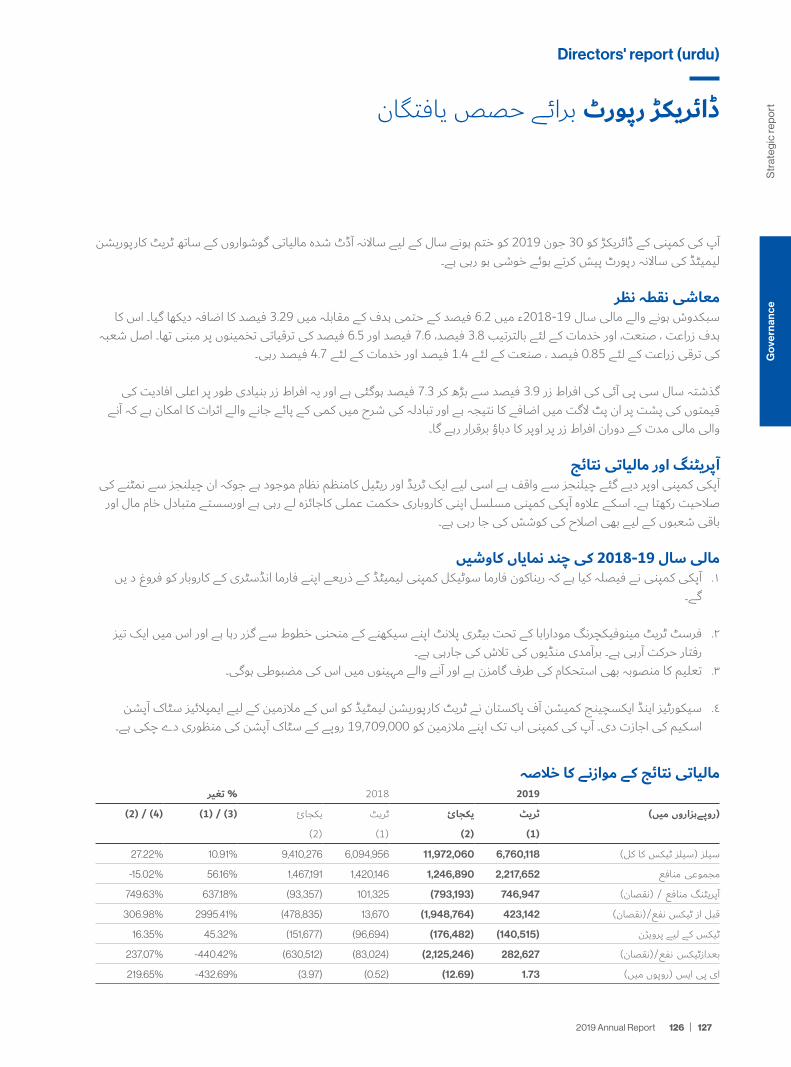
آپ کی کمپنی کے ڈائریکڑ کو 30 جون 2019 کو ختم ہونے سال کے لیے ساالنہ آڈٹ شدہ مالیاتی گوشواروں کے ساتھ ٹریٹ کارپوریشن لیمیٹڈ کی ساالنہ رپورٹ پیش کرتے ہوئے خوشی ہو رہی ہے۔
معاشی نقطہ نظر سبکدوش ہونے والے مالی سال 19-2018ء میں 6.2 فیصد کے حتمی ہدف کے مقابلہ میں 3.29 فیصد کا اضافہ دیکھا گیا۔ اس کا
ہدف زراعت ، صنعت، اور خدمات کے لئے بالترتیب 3.8 فیصد، 7.6 فیصد اور 6.5 فیصد کی ترقیاتی تخمینوں پر مبنی تھا۔ اصل شعبہ کی ترقی زراعت کے لئے 0.85 فیصد ، صنعت کے لئے 1.4 فیصد اور خدمات کے لئے 4.7 فیصد رہی۔
گذشتہ سال سی پی آئی کی افراط زر 3.9 فیصد سے بڑھ کر 7.3 فیصد ہوگئی ہے اور یہ افراط زر بنیادی طور پر اعلی افادیت کی قیمتوں کی پشت پر ان پٹ الگت میں اضافے کا نتیجہ ہے اور تبادلہ کی شرح میں کمی کے پائے جانے والے اثرات کا امکان ہے کہ آنے
والی مالی مدت کے دوران افراط زر پر اوپر کا دباؤ برقرار رہے گا۔
آپریٹنگ اور مالیاتی نتائج آپکی کمپنی اوپر دیے گئے چیلنجز سے واقف ہے اسی لیے ایک ٹریڈ اور ریٹیل کامنظم نظام موجود ہے جوکہ ان چیلنجز سے نمٹنے کی
صالحیت رکھتا ہے۔ اسکے عالوہ آپکی کمپنی مسلسل اپنی کاروباری حکمت عملی کاجائزہ لے رہی ہے اورسستے متبادل خام مال اور باقی شعبوں کے لیے بھی اصالح کی کوشش کی جا رہی ہے۔
مالی سال 19-2018 کی چند نمایاں کاوشیں آپکی کمپنی نے فیصلہ کیا ہے کہ ریناکون فارما سوٹیکل کمپنی لیمیٹڈ کے ذریعے اپنے فارما انڈسٹری کے کاروبار کو فروغ د یں . 1
گے۔
فرسٹ ٹریٹ مینوفیکچرنگ مودارابا کے تحت بیٹری پالنٹ اپنے سیکھنے کے منحنی خطوط سے گزر رہا ہے اور اس میں ایک تیز . 2رفتار حرکت آرہی ہے۔ برآمدی منڈیوں کی تالش کی جارہی ہے۔
تعلیم کا منصوبہ بھی استحکام کی طرف گامزن ہے اور آنے والے مہینوں میں اس کی مضبوطی ہوگی۔. 3
سیکورٹیز اینڈ ایکسچینج کمیشن آف پاکستان نے ٹریٹ کارپوریشن لیمٹیڈ کو اس کے مالزمین کے لیے ایمپالئیز سٹاک آپشن . 4اسکیم کی اجازت دی۔ آپ کی کمپنی اب تک اپنے مالزمین کو 19,709,000 روپے کے سٹاک آپشن کی منظوری دے چکی ہے۔
مالیاتی نتائج کے موازنے کا خالصہ% تغیر 2018 2019
(2) / (4) (1) / (3) یکجائ ٹریٹ یکجائ ٹریٹ (روپےہزاروں میں)
)2( )1( (2) (1)
27.22% 10.91% 9,410,276 6,094,956 11,972,060 6,760,118 سیلز )سیلز ٹیکس کا کل(
-15.02% 56.16% 1,467,191 1,420,146 1,246,890 2,217,652 مجموعی منافع
749.63% 637.18% (93,357) 101,325 (793,193) 746,947 اپریٹنگ منافع / )نقصان(
306.98% 2995.41% (478,835) 13,670 (1,948,764) 423,142 قبل از ٹیکس نفع/)نقصان(
16.35% 45.32% (151,677) (96,694) (176,482) (140,515) ٹیکس کے لیے پرویژن
237.07% -440.42% (630,512) (83,024) (2,125,246) 282,627 نفع/)نقصان( بعدازٹیکس
219.65% -432.69% (3.97) (0.52) (12.69) 1.73 ای پی ایس )روپوں میں(
ڈائریکڑ رپورٹ برائے حصص یافتگان
Directors' report (urdu)
Str
ateg
ic re
po
rtG
over
nanc
e
127 2019 Annual Report 126

سیلز کی کارکردگی کے نتائج حوصلہ افزاء ہیں برامدات کی فروخت نے مشرقی وسطی کے حاالت اور عالمی معیشت کی سست روی کے باوجود متاثر کن کارکردگی دکھائی۔ مگر مقامیمارکیٹ اپنی جگہ پر برقرار رہی۔
تبدیلی % 2017-2018 2018-2019
27.22% خالص فروخت 12,031,736 9,457,77834.97% فروخت کی قیمت 10,784,846 7,990,587-15.02% کل منافع 1,246,890 1,467,191
57.54% دوسری آمدنی 252,262 160,127
طبقہ وار خالص فروخت18.08% بلیڈ / استرا 6,664,819 5,644,11730.21% صابن 900,303 691,43812.77% کوروگیشن 1,928,658 1,710,224
-78.48% تجارت 96,835 449,89330.56% دواسازی 417,077 319,441-17.63% موٹر سائیکل 263,974 320,476
446.28% بیٹری 1,760,070 322,189
43.08% بلیڈ / استرا 2,072,945 1,448,825-12.00% صابن 97,379 110,663-22.57% کوروگیشن 141,521 182,771
-116.86% (115,912) تجارت 19,54837.76% دواسازی 76,317 55,400
13.11% (13,906) (15,729) موٹر سائیکل470.69% (200,650) (1,145,091) بیٹری
فروخت اور عمومی انتظامیہ اور دیگر۔
20.49% تنخواہ 732,574 607,97355.70% افادیت کے اخراجات 724 46555.59% دوسرے اخراجات 576,544 370,54719.05% فرسودگی 68,166 57,256
-12.65% نقل و حمل 4,452 5,09782.95% عطیات 211,427 115,56822.51% اشتہار 567,637 463,333
164.74% مالی چارجز 1,286,392 485,91416.35% ٹیکس کے اخراجات 176,482 151,677
237.07% (630,512) (2,125,246) کل منافع

ڈائریکڑ رپورٹ برائے حصص یافتگان
آپ کی کمپنی کے ڈائریکڑ کو 30 جون 2019 کو ختم ہونے سال کے لیے ساالنہ آڈٹ شدہ مالیاتی گوشواروں کے ساتھ ٹریٹ کارپوریشن لیمیٹڈ کی ساالنہ رپورٹ پیش کرتے ہوئے خوشی ہو رہی ہے۔
معاشی نقطہ نظر سبکدوش ہونے والے مالی سال 19-2018ء میں 6.2 فیصد کے حتمی ہدف کے مقابلہ میں 3.29 فیصد کا اضافہ دیکھا گیا۔ اس کا
ہدف زراعت ، صنعت، اور خدمات کے لئے بالترتیب 3.8 فیصد، 7.6 فیصد اور 6.5 فیصد کی ترقیاتی تخمینوں پر مبنی تھا۔ اصل شعبہ کی ترقی زراعت کے لئے 0.85 فیصد ، صنعت کے لئے 1.4 فیصد اور خدمات کے لئے 4.7 فیصد رہی۔
گذشتہ سال سی پی آئی کی افراط زر 3.9 فیصد سے بڑھ کر 7.3 فیصد ہوگئی ہے اور یہ افراط زر بنیادی طور پر اعلی افادیت کی قیمتوں کی پشت پر ان پٹ الگت میں اضافے کا نتیجہ ہے اور تبادلہ کی شرح میں کمی کے پائے جانے والے اثرات کا امکان ہے کہ آنے
والی مالی مدت کے دوران افراط زر پر اوپر کا دباؤ برقرار رہے گا۔
آپریٹنگ اور مالیاتی نتائج آپکی کمپنی اوپر دیے گئے چیلنجز سے واقف ہے اسی لیے ایک ٹریڈ اور ریٹیل کامنظم نظام موجود ہے جوکہ ان چیلنجز سے نمٹنے کی
صالحیت رکھتا ہے۔ اسکے عالوہ آپکی کمپنی مسلسل اپنی کاروباری حکمت عملی کاجائزہ لے رہی ہے اورسستے متبادل خام مال اور باقی شعبوں کے لیے بھی اصالح کی کوشش کی جا رہی ہے۔
مالی سال 19-2018 کی چند نمایاں کاوشیں آپکی کمپنی نے فیصلہ کیا ہے کہ ریناکون فارما سوٹیکل کمپنی لیمیٹڈ کے ذریعے اپنے فارما انڈسٹری کے کاروبار کو فروغ د یں . 1
گے۔
فرسٹ ٹریٹ مینوفیکچرنگ مودارابا کے تحت بیٹری پالنٹ اپنے سیکھنے کے منحنی خطوط سے گزر رہا ہے اور اس میں ایک تیز . 2رفتار حرکت آرہی ہے۔ برآمدی منڈیوں کی تالش کی جارہی ہے۔
تعلیم کا منصوبہ بھی استحکام کی طرف گامزن ہے اور آنے والے مہینوں میں اس کی مضبوطی ہوگی۔. 3
سیکورٹیز اینڈ ایکسچینج کمیشن آف پاکستان نے ٹریٹ کارپوریشن لیمٹیڈ کو اس کے مالزمین کے لیے ایمپالئیز سٹاک آپشن . 4اسکیم کی اجازت دی۔ آپ کی کمپنی اب تک اپنے مالزمین کو 19,709,000 روپے کے سٹاک آپشن کی منظوری دے چکی ہے۔
مالیاتی نتائج کے موازنے کا خالصہ% تغیر 2018 2019
(2) / (4) (1) / (3) یکجائ ٹریٹ یکجائ ٹریٹ (روپےہزاروں میں)
)2( )1( (2) (1)
27.22% 10.91% 9,410,276 6,094,956 11,972,060 6,760,118 سیلز )سیلز ٹیکس کا کل(
-15.02% 56.16% 1,467,191 1,420,146 1,246,890 2,217,652 مجموعی منافع
749.63% 637.18% )93,357( 101,325 (793,175) 746,947 اپریٹنگ منافع / )نقصان(
306.98% 2926.06% )478,835( 13,670 (1,958,134) 413,663 قبل از ٹیکس نفع/)نقصان(
16.35% 44.83% )151,677( )96,694( (175,508) (140,041) ٹیکس کے لیے پرویژن
237.07% -429.57% )630,512( )83,024( (2,133,642) 273,622 نفع/)نقصان( بعدازٹیکس
219.65% -423.08% )3.97( )0.52( (12.75) 1.68 ای پی ایس )روپوں میں(
Directors' report (urdu)
Str
ateg
ic re
po
rtG
over
nanc
e
129 2019 Annual Report 128
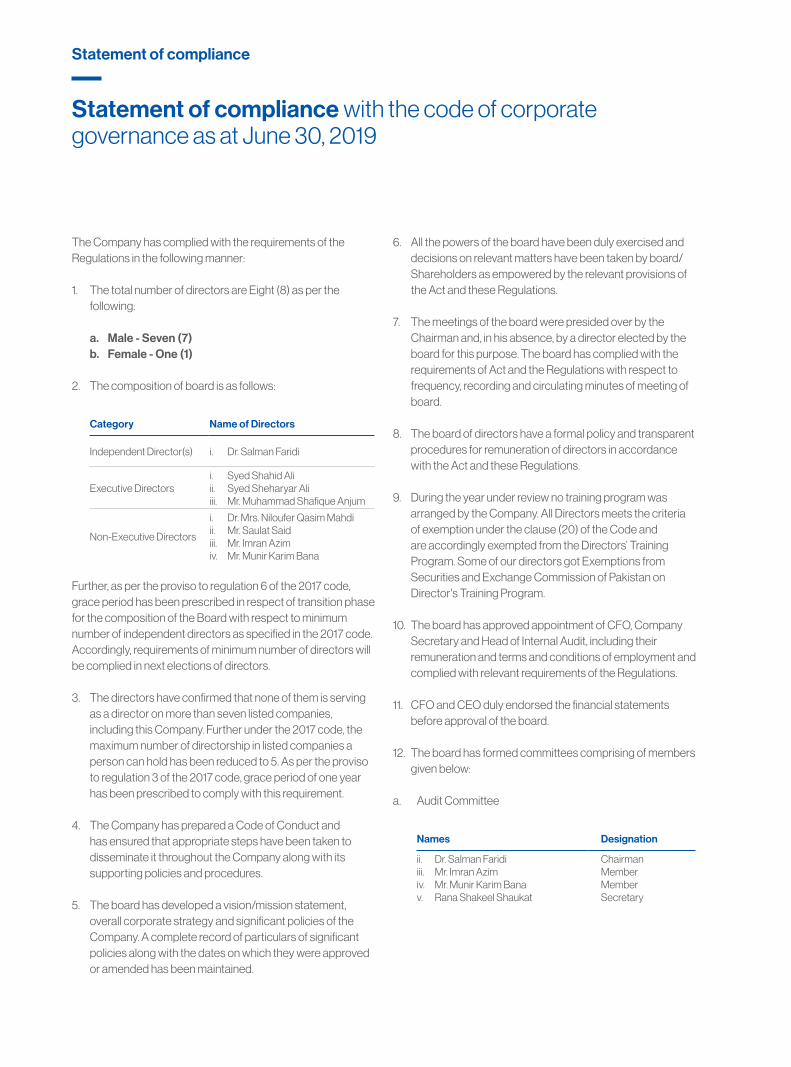
Statement of compliance with the code of corporate governance as at June 30, 2019
Statement of compliance
The Company has complied with the requirements of the Regulations in the following manner:
1. The total number of directors are Eight (8) as per the following:
a. Male - Seven (7)b. Female - One (1)
2. The composition of board is as follows:
Category Name of Directors
Independent Director(s) i. Dr. Salman Faridi
Executive Directorsi. Syed Shahid Aliii. Syed Sheharyar Aliiii. Mr. Muhammad Shafique Anjum
Non-Executive Directors
i. Dr. Mrs. Niloufer Qasim Mahdiii. Mr. Saulat Said iii. Mr. Imran Azimiv. Mr. Munir Karim Bana
Further, as per the proviso to regulation 6 of the 2017 code, grace period has been prescribed in respect of transition phase for the composition of the Board with respect to minimum number of independent directors as specified in the 2017 code. Accordingly, requirements of minimum number of directors will be complied in next elections of directors.
3. The directors have confirmed that none of them is serving as a director on more than seven listed companies, including this Company. Further under the 2017 code, the maximum number of directorship in listed companies a person can hold has been reduced to 5. As per the proviso to regulation 3 of the 2017 code, grace period of one year has been prescribed to comply with this requirement.
4. The Company has prepared a Code of Conduct and has ensured that appropriate steps have been taken to disseminate it throughout the Company along with its supporting policies and procedures.
5. The board has developed a vision/mission statement, overall corporate strategy and significant policies of the Company. A complete record of particulars of significant policies along with the dates on which they were approved or amended has been maintained.
6. All the powers of the board have been duly exercised and decisions on relevant matters have been taken by board/ Shareholders as empowered by the relevant provisions of the Act and these Regulations.
7. The meetings of the board were presided over by the Chairman and, in his absence, by a director elected by the board for this purpose. The board has complied with the requirements of Act and the Regulations with respect to frequency, recording and circulating minutes of meeting of board.
8. The board of directors have a formal policy and transparent procedures for remuneration of directors in accordance with the Act and these Regulations.
9. During the year under review no training program was arranged by the Company. All Directors meets the criteria of exemption under the clause (20) of the Code and are accordingly exempted from the Directors’ Training Program. Some of our directors got Exemptions from Securities and Exchange Commission of Pakistan on Director's Training Program.
10. The board has approved appointment of CFO, Company Secretary and Head of Internal Audit, including their remuneration and terms and conditions of employment and complied with relevant requirements of the Regulations.
11. CFO and CEO duly endorsed the financial statements before approval of the board.
12. The board has formed committees comprising of members given below:
a. Audit Committee
Names Designation
ii. Dr. Salman Faridiiii. Mr. Imran Azimiv. Mr. Munir Karim Banav. Rana Shakeel Shaukat
ChairmanMemberMemberSecretary

a. HR and Remuneration Committee
Names Designation
i. Dr. Salman Faridiii. Syed Sheharyar Aliiii. Mr. Munir Karim Banaiv. Muhammad Shafique Anjumv. Mr. Imran Azimvi. Rana Shakeel Shaukat
ChairmanMemberMemberMemberMemberSecretary
13. The terms of reference of the aforesaid committees have been formed, documented and advised to the committee for compliance.
14. The frequency of meetings (quarterly/half yearly/ yearly) of the committee were as per following:
Meetings Frequency
Audit CommitteeFour quarterly meetings were held during the financial year ended June 30, 2019.
HR & Remuneration Committee
Two meetings were held during the financial year ended June 30, 2019.
15. The board has set up an effective internal audit function which is considered suitably qualified and experienced for the purpose and are conversant with the policies and procedures of the Company.
16. The statutory auditors of the Company have confirmed that they have been given a satisfactory rating under the quality control review program of the ICAP and registered with Audit Oversight Board of Pakistan, that they or any of the partners of the firm, their spouses and minor children do not hold certificates of the Company and that the firm and all its partners are in compliance with International Federation of Accountants (IFAC) guidelines on code of ethics as adopted by the ICAP.
17. The statutory auditors or the persons associated with them have not been appointed to provide other services except in accordance with the Act, these regulations or any other regulatory requirement and the auditors have confirmed that they have observed IFAC guidelines in this regard.
18. We confirm that all other requirements of the Regulations have been complied with.
Syed Shahid AliChief Executive Officer
Str
ateg
ic re
po
rtG
over
nanc
e
131 2019 Annual Report 130
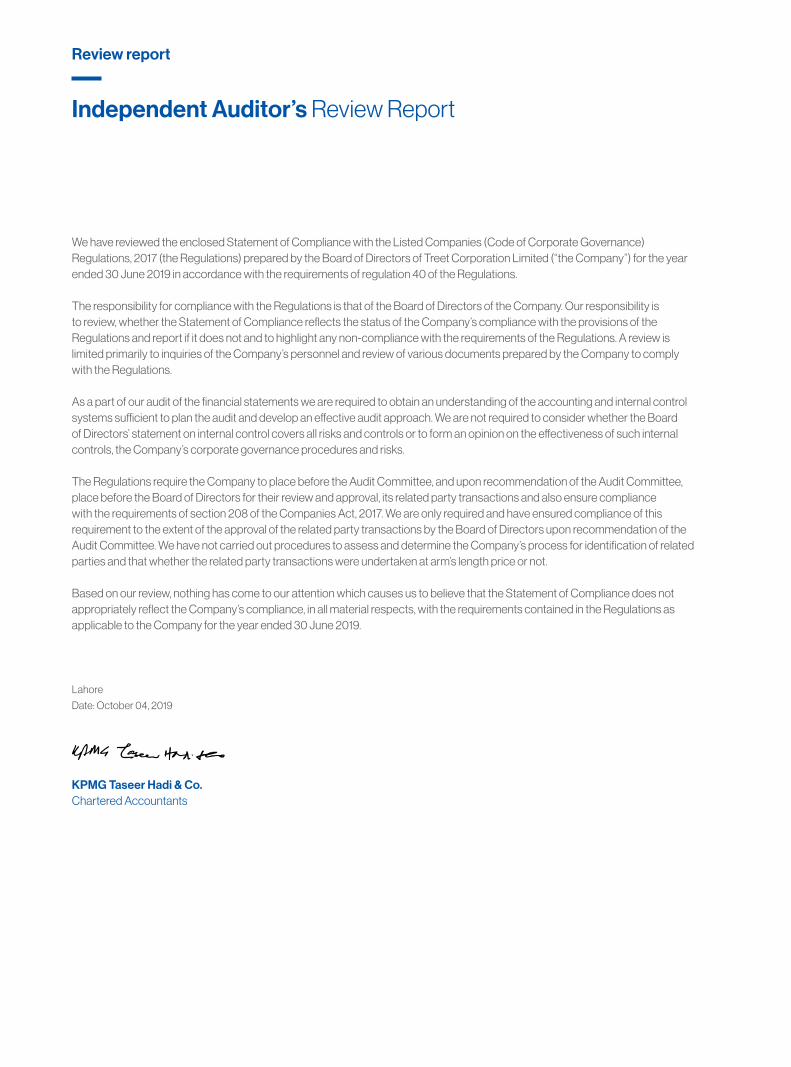
Independent Auditor’s Review Report
Review report
We have reviewed the enclosed Statement of Compliance with the Listed Companies (Code of Corporate Governance) Regulations, 2017 (the Regulations) prepared by the Board of Directors of Treet Corporation Limited (“the Company”) for the year ended 30 June 2019 in accordance with the requirements of regulation 40 of the Regulations.
The responsibility for compliance with the Regulations is that of the Board of Directors of the Company. Our responsibility is to review, whether the Statement of Compliance reflects the status of the Company’s compliance with the provisions of the Regulations and report if it does not and to highlight any non-compliance with the requirements of the Regulations. A review is limited primarily to inquiries of the Company’s personnel and review of various documents prepared by the Company to comply with the Regulations.
As a part of our audit of the financial statements we are required to obtain an understanding of the accounting and internal control systems sufficient to plan the audit and develop an effective audit approach. We are not required to consider whether the Board of Directors’ statement on internal control covers all risks and controls or to form an opinion on the effectiveness of such internal controls, the Company’s corporate governance procedures and risks.
The Regulations require the Company to place before the Audit Committee, and upon recommendation of the Audit Committee, place before the Board of Directors for their review and approval, its related party transactions and also ensure compliance with the requirements of section 208 of the Companies Act, 2017. We are only required and have ensured compliance of this requirement to the extent of the approval of the related party transactions by the Board of Directors upon recommendation of the Audit Committee. We have not carried out procedures to assess and determine the Company’s process for identification of related parties and that whether the related party transactions were undertaken at arm’s length price or not.
Based on our review, nothing has come to our attention which causes us to believe that the Statement of Compliance does not appropriately reflect the Company’s compliance, in all material respects, with the requirements contained in the Regulations as applicable to the Company for the year ended 30 June 2019.
Lahore
Date: October 04, 2019
KPMG Taseer Hadi & Co.Chartered Accountants
Notice of Annual General Meeting
AGM
Notice is hereby given that Annual General Meeting of the shareholders of Treet Corporation Limited (the “Company”) will be held on Monday, October 28, 2019 at 11:00 A.M. at 72-B, Industrial Area, Kot Lakhpat, Lahore the Registered Office of the Company to transact the following business:
ORDINARY BUSINESS
1. To receive, consider and adopt the Annual Audited Accounts of the Company for the Year Ended June 30, 2019, together with the Directors’ and Auditors’ Reports thereon.
2. To appoint External Auditors of the Company for the year ending June 30, 2020 and to fix their remuneration. The retiring Auditors M/s KPMG Taseer Hadi & Co., Chartered Accountants, being eligible, have offered themselves for re-appointment.
SPECIAL BUSINESS
To consider and if thought fit, to pass the following Special Resolution with or without modification(s), addition(s) or deletion(s) in respect of Employees Stock Option Scheme:
GRANT OF STOCK OPTIONS TO THE EMPLOYEES OF SUBSIDIARY COMPANY
RESOLVED that pursuant to recommendations of the compensation committee under the Companies Employees Stock Option Scheme, 2015 and the approval of the Board of Directors, approval of shareholders be and is hereby accorded for grant of 2,103,200 Options to the 150 Employees of Subsidiary Companies mentioned in the Annexure A (in the manner and to the extent mentioned against such employees name in Annexure A) at option price of Rs. 15.71 per share, in accordance with sub-rule ii of Rules 6 of Public Companies (Employees Stock Option Scheme) Rules, 2001 read with sub-clause 2(i) of Clause 5 of Chapter II of Guidelines for Structuring and Offering of the Employees Stock Option Schemes approved by the Securities and Exchange Commission of Pakistan.
FURTHER RESOLVED THAT Chief Executive Officer and Company Secretary be and are hereby singly authorized to sign Option Certificates and to take all necessary steps to comply with the preceding resolution and fulfil all legal requirements for issuance of Shares against Employees Stock Option Scheme (hereinafter referred to as “ESOS”) including making application to the Securities and Exchange Commission of Pakistan.
To consider and if thought fit, to pass the following Special Resolution with or without modification(s), addition(s) or deletion(s) in respect of Employees Stock Option Scheme:
RE-PRICING OF 4,768,700 OPTIONS ALREADY GRANTED FOR 2017-18
RESOLVED THAT in accordance with Rule 7(ii) of the Public Companies (Employees Stock Option Scheme) Rules, 2001 read with sub-clause 3 of Clause 6 of Chapter III of the Guidelines for Structuring and Offering of the Employees Stock Option Schemes approved by Securities and Exchange Commission of Pakistan, approval of the shareholders be and is hereby accorded to re-price the 4,768,700 options already granted and pending for exercise under the Company’s Employees Stock Option Scheme, from initial exercise price of Rs. 35.44 per share to the revised price of Rs. 15.71 per share, without any change or modification in the vesting period/schedule, exercise period and/or any other specific terms and conditions under which such options have been granted. FURTHER RESOLVED THAT Chief Executive Officer and Company Secretary be and are hereby singly authorized on behalf of the Company to do all such things, deeds and acts and to execute and deliver all such instruments, documents, directions and writings and perform such other things as may be necessary, desirable or useful for the purpose of giving effect to the foregoing resolution, including but not limited to amending the ESOS Scheme, making any filings or any jurisdiction with the Securities and Exchange Commission of Pakistan, stock exchanges and /or relevant regulatory authorities.
To consider and if thought fit, pass the following Special Resolution under Section 199 of the Companies Act, 2017, with or without modification(s), addition(s) or deletion(s).
Str
ateg
ic re
po
rtG
over
nanc
e
133 2019 Annual Report 132
FURTHER RESOLVED THAT the aforementioned donation can be made in one or more installments. FURTHER RESOLVED THAT Chief Executive Officer and Company Secretary be and are hereby singly authorized to complete all the necessary corporate and legal formalities and to do all such acts, deeds and things as may be deemed necessary to give effect to the abovementioned resolution.
To ratify and approve transactions carried out with associated Companies in the normal course of the business by passing the following ordinary resolutions:
RESOLVED THAT the transactions carried out in normal course of business with associated Companies as disclosed in respective notes to the Audited Financial Statements for the year ended June 30, 2019 be and are hereby ratified and approved. FURTHER RESOLVED THAT the Chief Executive of the Company be and is hereby authorized to approve all the transactions carried out and to be carried out in normal course of business with associated companies during the year ended June 30, 2020 and in this connection the Chief Executive be and is hereby also authorized to take any and all necessary actions and sign/execute any and all such documents/indentures as may be required in this regard on behalf of the Company.
To transact any other business with the permission of the Chair.
By Order of the Board
Lahore: October 04, 2019
Rana Shakeel ShaukatCompany Secretary
RESOLVED that approval of the shareholders of Treet Corporation Limited (the “Company”) be and is hereby accorded in terms of Section 199 of the Companies Act, 2017, Regulation No. 5(7) of Companies (Investment in Associated Companies or Associated Undertakings) Regulations, 2017 and subject to the compliance with all statutory and legal requirements, for investment up to PKR 1,500,000,000/- (Rupees Fifteen Hundred Million Only) in First Treet Manufacturing Modaraba (“FTMM”) and Renacon Pharma Limited (“RPL”), being subsidiary undertakings, in the form of working capital loan for a period of one year starting from the date of approval by Shareholders. FURTHER RESOLVED THAT approval of the shareholders of Treet Corporation Limited (the Company”) be and is hereby accorded in terms of Section 199 of the Companies Act, 2017, Regulation No. 5(7) of Companies (Investment in Associated Companies or Associated Undertakings) Regulations, 2017 and subject to the compliance with all statutory and legal requirements, to give corporate guarantee and/or to earmark its un-funded financial facilities for opening of letter of credits and guarantees to the banks/financial institutions on behalf of its various subsidiaries, namely, First Treet Manufacturing Modaraba, Renacon Pharma Limited, Treet Battery Limited and Treet Holdings Limited. FURTHER RESOLVED THAT the said resolution shall be valid for one year starting from the date of approval by shareholders and the Chief Executive Officer and/or Chief Financial Officer and/or Company Secretary of the Company be and are hereby singly empowered and authorized to undertake the decision of said investment as and when required and to take all steps and actions necessary, incidental and ancillary including execution of any and all documents and agreements as may be required in this regard and to do all acts, matters, deeds and things as may be necessary or expedient for the purpose of implementing the aforesaid resolution.
To consider and approve with or without modification(s), addition(s) or deletion(s), the following resolutions as ordinary resolution for donation:
RESOLVED THAT further donation of up to Rs. 200.00 million in the “Institute for Culture and Art” be and is hereby approved to enable the “Institute for Culture and Art” to meet day to day requirements till the time it is financially stabilized and generates enough revenues to meet its expenses.
Notice of Annual General Meeting
AGM continue

Notes:
CLOSURE OF SHARE TRANSFER BOOKSThe share transfer Books of the Company will remain closed from October 21, 2019 to October 28, 2019 (both days inclusive) for the purpose of attending Annual General Meeting. Transfers received in order at the office of our Share Registrar M/s Corplink (Private) Limited, Wings Arcade, 1-K, Commercial Model Town, Lahore at the close of business on October 19, 2019 will be considered in time to attend the AGM. PARTICIPATION IN THE ANNUAL GENERAL MEETING
All members entitled to attend and vote at this Meeting may appoint another person as his/her proxy to attend and vote for him / her. Proxies in order to be effective must be received at the Registered Offi ce of the Company not less than 48 hours before the time of holding the meeting. CDC Accounts Holders will further have to follow the guidelines as laid down in Circular 1 dated January 26, 2000 issued by the Securities & Exchange Commission of Pakistan. Proxy form is available at the Company’s website i.e. www.treetonline.com
For Attending the Meetinga. In case of individuals, the account holder or sub-account
holder and / or the person whose securities are in group account and their registration detail is uploaded as per the Regulations, shall authenticate their identity by showing his/ her original National Identity Card (“CNIC”) or original passport at the time of attending the meeting.
b. In case of corporate entity, Board of Directors’ resolution/power of attorney with specimen signature of the nominee shall be produced (unless provided earlier) at the time of the meeting.
For Appointing Proxiesa. In case of individuals, the account holder or sub-account
holder is and / or the person whose securities are in group account and their registration detail is uploaded as per the CDC Regulations, shall submit the proxy form as per the above requirement.
b. The proxy form shall be witnessed by two persons whose names, addresses and CNIC numbers shall be mentioned on the form.
c. Attested copies of the CNIC or passport of the benefi cial owners and the proxy shall be furnished with the proxy form.
d. The proxy shall produce his/her original CNIC or original passport at the time of the meeting.
e. In case of corporate entities, board of directors’ resolution/power of attorney with specimen signature of the nominee shall be submitted (unless provided earlier) along with the proxy form to Company.
CONSENT FOR VIDEO CONFERENCE
Pursuant to SECP’s Circular No 10 dated 21 May 2014, if the Company receives consent from members holding in aggregate 10% or more shareholding residing at a geographical location, to participate in the meeting through video conference at least 10 days prior to the date of meeting, the Company will arrange video conference facility in that city subject to availability of such facility in that city. In this regard please fill the following and submit to registered address of the Company at least 10 days before the date of AGM.
I/We ______________ of ______________, being member(s) of Treet Corporation Limited holder ______________ Ordinary share(s) as per Register Folio No. ______________ hereby opt for video conference facility at ______________.
STATEMENTS OF MATERIAL FACTS UNDER SECTION 134(3) OF THE COMPANIES ACT, 2017 RELATING TO THE SPECIAL BUSINESS TO BE TRANSACTED AT THE ANNUAL GENRAL MEETING.
AGENDA ITEM NO. 4Pursuant to the Employees Stock Option Scheme, 2015 as approved by Securities and Exchange Commission of Pakistan, the Board of Directors of the Company in their meeting held on July 17, 2019 granted options to the eligible employees of the Company including 2,103,200 Options to the 150 Employees of Subsidiary Companies mentioned in the Annexure A (in the manner and to the extent mentioned against such employees name in Annexure A) at option price of Rs. 15.71 per share, in accordance with sub-rule ii of Rules 6 of Public Companies (Employees Stock Option Scheme) Rules, 2001* read with sub-clause 2(i) of Clause 5 of Chapter II of Guidelines for structuring and offering of the Employees Stock
Str
ateg
ic re
po
rtG
over
nanc
e
135 2019 Annual Report 134
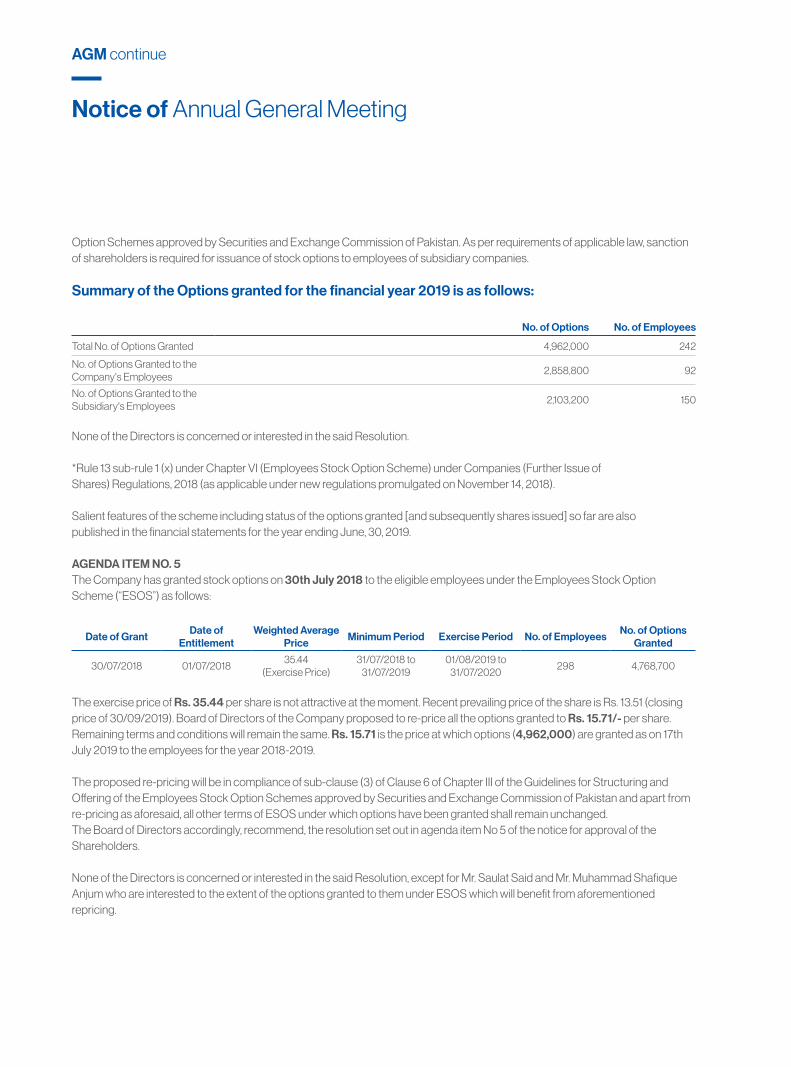
Option Schemes approved by Securities and Exchange Commission of Pakistan. As per requirements of applicable law, sanction of shareholders is required for issuance of stock options to employees of subsidiary companies.
Summary of the Options granted for the financial year 2019 is as follows:
No. of Options No. of Employees
Total No. of Options Granted 4,962,000 242
No. of Options Granted to the Company's Employees
2,858,800 92
No. of Options Granted to the Subsidiary's Employees
2,103,200 150
None of the Directors is concerned or interested in the said Resolution.
*Rule 13 sub-rule 1 (x) under Chapter VI (Employees Stock Option Scheme) under Companies (Further Issue of Shares) Regulations, 2018 (as applicable under new regulations promulgated on November 14, 2018).
Salient features of the scheme including status of the options granted [and subsequently shares issued] so far are also published in the financial statements for the year ending June, 30, 2019.
AGENDA ITEM NO. 5The Company has granted stock options on 30th July 2018 to the eligible employees under the Employees Stock Option Scheme (“ESOS”) as follows:
Date of GrantDate of
EntitlementWeighted Average
PriceMinimum Period Exercise Period No. of Employees
No. of Options Granted
30/07/2018 01/07/201835.44
(Exercise Price)31/07/2018 to
31/07/201901/08/2019 to
31/07/2020298 4,768,700
The exercise price of Rs. 35.44 per share is not attractive at the moment. Recent prevailing price of the share is Rs. 13.51 (closing price of 30/09/2019). Board of Directors of the Company proposed to re-price all the options granted to Rs. 15.71/- per share. Remaining terms and conditions will remain the same. Rs. 15.71 is the price at which options (4,962,000) are granted as on 17th July 2019 to the employees for the year 2018-2019.
The proposed re-pricing will be in compliance of sub-clause (3) of Clause 6 of Chapter III of the Guidelines for Structuring and Offering of the Employees Stock Option Schemes approved by Securities and Exchange Commission of Pakistan and apart from re-pricing as aforesaid, all other terms of ESOS under which options have been granted shall remain unchanged.The Board of Directors accordingly, recommend, the resolution set out in agenda item No 5 of the notice for approval of the Shareholders.
None of the Directors is concerned or interested in the said Resolution, except for Mr. Saulat Said and Mr. Muhammad Shafique Anjum who are interested to the extent of the options granted to them under ESOS which will benefit from aforementioned repricing.
Notice of Annual General Meeting
AGM continue

AGENDA ITEM NO. 6Information pursuant to Companies (Investment in Associated Companies or Associated Undertakings) Regulations, 2017 (the “Regulations”).
Advance/Loans to First Treet Manufacturing Modaraba
Corporate Guarantee/Earmarking of its Un-Funded Facilities
Advance / Loan to Renacon Pharma Limited
name of the associated company or associated undertaking along with criteria based on which the associated relationship is established;
First Treet Manufacturing Modaraba [FTMM] has set up battery (lead acid) project in Faisalabad; The Company owns 97.36 % of certificates of FTMM and holds 100% of the shares of Treet Holdings Limited, being the Modaraba company managing FTMM.
• First Treet Manufacturing Modaraba
• Renacon Pharma Limited• Treet Battery Limited• Treet Holdings Limited
Renacon Pharma Limited [RPL] is setting up hemodialysis concentrates plant in Faisalabad;RPL is 55.86% subsidiary of Treet Corporation Limited
Earnings per share for the last three years
2017 – 1.052018 – (1.83)2019 - (12.23 )
Not Applicable 2017 – 0.592018 – 0.322019 - 0.33
Breakup value per share, based on latest audited financial statements
Rs. 10.44 per share Not Applicable Rs. 11.20 per share
financial position, including main items of balance sheet and profit and loss account of the associated company or associated undertaking on the basis of its latest financial statements;
FTMM is listed Modaraba. Detailed accounts are available at www.treetonline.com . However, Profit & Loss Account and Balance Sheet as on June 30, 2019 is attached herewith
Accounts of subsidiary companies are available at www.treetonline.com However, Profit & Loss Account and Balance Sheet as on June 30, 2019 is attached herewith
RPL is under process of listing. Detailed accounts are available at www.treetonline.com However, Profit & Loss Account and Balance Sheet as on June 30, 2019 is attached herewith
a description of the project and its history since conceptualization;
Not Applicable Not Applicable Renacon Pharma Limited (“Renacon” or the “Company”) is a prominent Hemodialysis Concentrates manufacturer in Pakistan. The Company obtained its manufacturing license in 1998 and subsequently replaced majority market of the old Acetate solution with its newer Bicarbonate Concentrate solution within 5 years of introduction.Information memorandum is available at www.treetonline.comAnd also available in the Financial Statements (for 2018-2019) of the Company
starting date and expected date of completion;
Not Applicable Not Applicable By the end of June 30, 2020
time by which such project shall become commercially operational;
Not Applicable Not Applicable In the first quarter of(July ~September) of Financial Year 2020-2021
expected return on total capital employed in the project; and
Not Applicable Not Applicable Information memorandum is available at www.treetonline.com for detail of project and its returns
Str
ateg
ic re
po
rtG
over
nanc
e
137 2019 Annual Report 136

Notice of Annual General Meeting
AGM continue
funds invested of to be invested by the promoters distinguishing between cash and non-cash amounts:
Not Applicable Not Applicable Information memorandum is available at www.treetonline.comAnd also available in the Financial Statements (for 2018-2019) of the Company
amount of loans or advances; Up to an extent of Rs. 1,000 Million
Not Applicable Up to an extent of Rs. 500 Million
purpose of loans or advances and benefits likely to accrue to the investing company and its members from such loans or advances;
To meet the working capital requirements [of Battery Project] of the Modaraba. Dividend returns from the Modaraba are expected to enhance profitability of the Company, which resultantly will strengthen/consolidate its share price and confidence of investor and creditors.
To meet the letter of credit / guarantee requirements of above subsidiaries
To meet the Capital Expenditure requirements of RPL Total project size is Rs. 1,500 million. This is in addition to the existing project in Lahore [which is already in operation] Dividend returns from the RPL are expected to enhance profitability of the Company, which resultantly will strengthen/consolidate its share price and confidence of investor and creditors
in case any loan has already been granted to the said associated company or associated undertaking, the complete details thereof;
Approval of Rs. 6,650 million is taken from shareholders in annual general meeting held on October 26, 2018. Further approval from shareholders is being sought to increase this borrowing levels from 6,650 million to Rs. 7,650 million.
Not Applicable Not Applicable
average borrowing cost of the investing company or in case of absence of borrowing the Karachi Inter Bank Offered Rate for the relevant period;
Average borrowing Cost is KIBOR [3month or Six Months) + Spread [25bps to 150pbs]
Not Applicable Average borrowing Cost is KIBOR [3month or Six Months) + Spread [25bps to 150pbs]
average borrowing cost of the investing company or in case of absence of borrowing the Karachi Inter Bank Offered Rate for the relevant period;
Equivalent cost (average rate) to be charged to the borrowing subsidiary
Not Applicable Equivalent cost (average rate) to be charged to the borrowing subsidiary
sources of funds from where loans or advances will be given;
Bank Borrowings Not Applicable Bank Borrowings
where loans or advances are being granted using borrowed funds,
Bank Borrowings Not Applicable Bank Borrowings
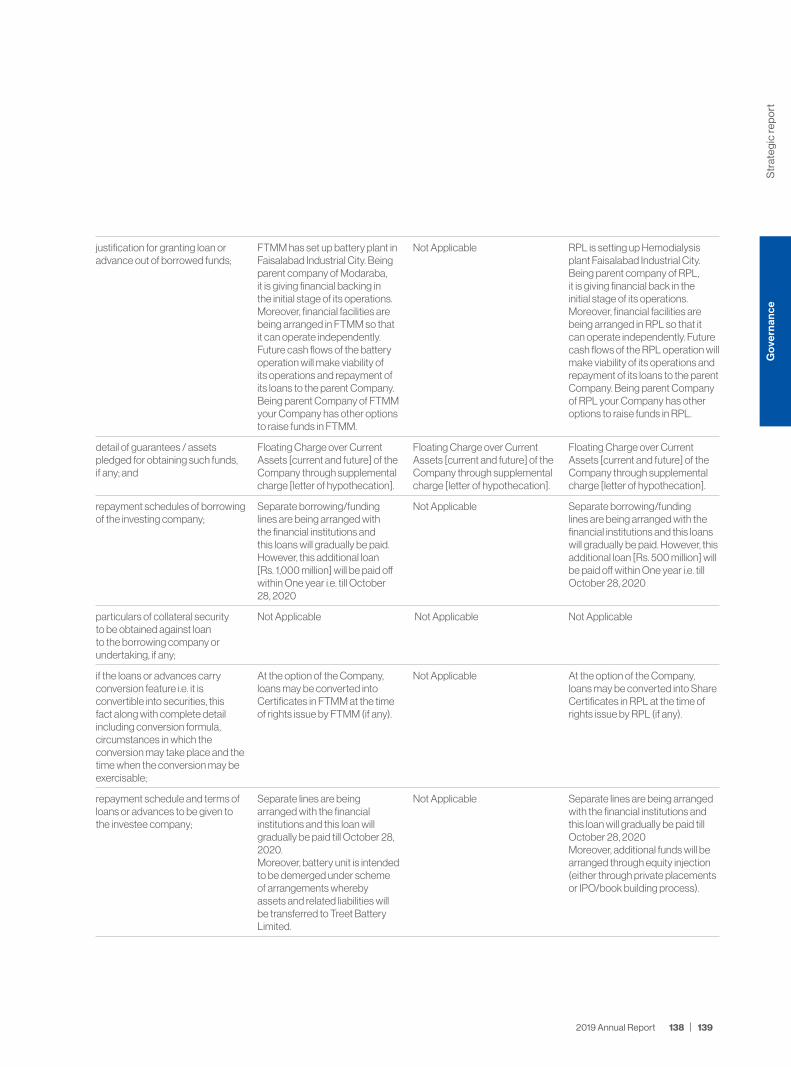
justification for granting loan or advance out of borrowed funds;
FTMM has set up battery plant in Faisalabad Industrial City. Being parent company of Modaraba, it is giving financial backing in the initial stage of its operations. Moreover, financial facilities are being arranged in FTMM so that it can operate independently. Future cash flows of the battery operation will make viability of its operations and repayment of its loans to the parent Company. Being parent Company of FTMM your Company has other options to raise funds in FTMM.
Not Applicable RPL is setting up Hemodialysis plant Faisalabad Industrial City. Being parent company of RPL, it is giving financial back in the initial stage of its operations. Moreover, financial facilities are being arranged in RPL so that it can operate independently. Future cash flows of the RPL operation will make viability of its operations and repayment of its loans to the parent Company. Being parent Company of RPL your Company has other options to raise funds in RPL.
detail of guarantees / assets pledged for obtaining such funds, if any; and
Floating Charge over Current Assets [current and future] of the Company through supplemental charge [letter of hypothecation].
Floating Charge over Current Assets [current and future] of the Company through supplemental charge [letter of hypothecation].
Floating Charge over Current Assets [current and future] of the Company through supplemental charge [letter of hypothecation].
repayment schedules of borrowing of the investing company;
Separate borrowing/funding lines are being arranged with the financial institutions and this loans will gradually be paid. However, this additional loan [Rs. 1,000 million] will be paid off within One year i.e. till October 28, 2020
Not Applicable Separate borrowing/funding lines are being arranged with the financial institutions and this loans will gradually be paid. However, this additional loan [Rs. 500 million] will be paid off within One year i.e. till October 28, 2020
particulars of collateral security to be obtained against loan to the borrowing company or undertaking, if any;
Not Applicable Not Applicable Not Applicable
if the loans or advances carry conversion feature i.e. it is convertible into securities, this fact along with complete detail including conversion formula, circumstances in which the conversion may take place and the time when the conversion may be exercisable;
At the option of the Company, loans may be converted into Certificates in FTMM at the time of rights issue by FTMM (if any).
Not Applicable At the option of the Company, loans may be converted into Share Certificates in RPL at the time of rights issue by RPL (if any).
repayment schedule and terms of loans or advances to be given to the investee company;
Separate lines are being arranged with the financial institutions and this loan will gradually be paid till October 28, 2020.Moreover, battery unit is intended to be demerged under scheme of arrangements whereby assets and related liabilities will be transferred to Treet Battery Limited.
Not Applicable Separate lines are being arranged with the financial institutions and this loan will gradually be paid till October 28, 2020Moreover, additional funds will be arranged through equity injection (either through private placements or IPO/book building process).
Str
ateg
ic re
po
rtG
over
nanc
e
139 2019 Annual Report 138

salient feature of all agreements entered or to be entered with its associated company or associated undertaking with regards to proposed investment;
Not Applicable Not Applicable Not Applicable
direct or indirect interest of directors, sponsors, majority shareholders and their relatives, if any, in the associated company or associated undertaking or the transaction under consideration;
Syed Shahid Ali, Syed Sheharyar Ali and Muhammad Shafique Anjum are directors in the Company and on the Board of Treet Holdings Limited (Modaraba Company).
Common Directorship Syed Shahid Ali, Syed Sheharyar Ali and Dr. Salman Faridi are directors in the Company
any other important details necessary for the members to understand the transaction; and
Not Applicable Not Applicable Not Applicable
in case of investment in a project of an associated company or associated undertaking that has not commenced operations, in addition to the information referred to above, the following further information is required, namely,
Not Applicable Not Applicable RPL is already in operation in Lahore. However, 10 acre of land has been acquired in Faisalabad to increase its production facilities.
Audited Financial Statements of Investee Companies:
As required by Regulation 4(3) of the Regulations, following Financial statements of First Treet Manufacturing Modaraba and Renacon Pharma Limited shall be made available for inspection by the members at the meeting; namely
Annual Audited Accounts for the year ended June 30, 2018Annual Audited Accounts for the year ended June 30, 2017Annual Audited Accounts for the year ended June 30, 2016
Due Diligence Undertaking of Directors:
The Directors of the Company hereby certify to the Members that the Directors have, as required by Regulation 3(3) of the Regulations, carried out the requisite due diligence of Fist Treet Manufacturing Modaraba and Renacon Pharma Limited for the investment in both companies and also carried out due diligence of Treet Battery Limited and Treet Holdings Limited for corporate guarantee provided for those companies. The recommendations of the said due diligence report duly signed under the authority of the Directors will be made available for inspection by the members at the meeting;
AGENDA ITEM NO. 7
The Educational Project is the Institute for Art and Culture (“IAC”) established by the SCE through promulgation of an Act by National Assembly titled “The Institute for Art and Culture Act, 2018 (Act No.XXX1 of 2018)”.
This project is being handled through two subsidiaries i.e. Global Arts Limited (GAL) and Society for Cultural Education (SCE).
In continuance of various approvals from shareholders in their meetings.
Notice of Annual General Meeting
AGM continue
(Financial Statements of the SCE is attached herewith that shows the actual disbursement (including Rs. 15.00 million is transferred to Endowment Fund as a legal requirement for setting up an Institute). Detail of expenses are elaborated in the attached Income & Expenditure Account and Balance Sheet of the SCE.
This amount will be utilized to meet the further day to day expenses for the year 2018-2019 including but not limited to salaries, utilities, rent & taxes, legal & professional charges etc. Educational project has started its operation and will be able to operate independently within two years, but by that time parent Company has to supports its operations in the form of donations.
Directors of the Company are interested to the extent that as nominees of the Company some of them are also directors of GAL and members of General and Governing Body of SCE.
Audited Accounts of GAL and SCE have been kept at the registered office of the Company which can be inspected on any working day during usual business hours till the date of Annual General Meeting. Moreover, pursuant to directions given by Securities and Exchange Commission of Pakistan vide letter no. EMD/233/613/2002-826 dated February 24, 2016 Company is circulating the balance sheet and a statement of expenditure pertaining to SCE along with the Financial Statements of the Company.
AGENDA ITEM NO. 8
Transactions carried out with associated companies during the year ended June 30, 2019 to be passed as an Ordinary Resolution. The transactions carried out in normal course of business with associated companies (Related parties) were being approved by the Board as recommended by the Audit Committee on quarterly basis pursuant to Clause-15 of the Listed Companies (Code of Corporate Governance) Regulations, 2017, in force and applicable for that period.
In view of the above, the transactions conducted during the financial year ended June 30, 2019 with associated company as shown in relevant notes of the Audited Financial Statements are being placed before the shareholders for their consideration and approval/ratification.
The Directors are interested in the resolution to the extent of their common directorships and their shareholding in the associated companies.
Authorization of the Chief Executive for the transactions carried out and to be carried out with associated companies during the ensuing year ending June 30, 2020 to be passed as an Ordinary Resolution.
The Company would be conducting transactions with associated companies in the normal course of business. The majority of Directors are interested in these Transactions due to their common directorship and shareholding in the associated companies. Therefore, such transactions with associated companies have to be approved by the shareholders.
Str
ateg
ic re
po
rtG
over
nanc
e
141 2019 Annual Report 140

List of employees of subsidiary company i.e Treet HR Management Private Limited
No. of Employees No. of Options
Total No. of Options Granted 4,962,000 242
No. of Emptions Granted to the Company’s Employees 2,858,800 92
No. of Options Granted to the Subsidiary’s Employees 2,103,200 150
Sr. No.
Date of grant Financial year Expiry PeriodEmployees code
Name of entitled employeesOption
granted nos.
1 7/17/19 2018-2019 17/Jul/21 1091 QASSAR ABBAS 12,300
2 7/17/19 2018-2019 17/Jul/21 1123 KAMRAN KALEEM 7,300
3 7/17/19 2018-2019 17/Jul/21 1158 SALEEM FAZAL 12,700
4 7/17/19 2018-2019 17/Jul/21 1234 MOHAMMAD IDREES HANJRA 5,000
5 7/17/19 2018-2019 17/Jul/21 1269 SAJJAD HAIDER KHAN 42,000
6 7/17/19 2018-2019 17/Jul/21 1314 SOHAIL HABIB 70,400
7 7/17/19 2018-2019 17/Jul/21 1329 ISRAR-UL-HAQ 48,100
8 7/17/19 2018-2019 17/Jul/21 1330 ABU ASFAR-ULLAH ALAM 30,400
9 7/17/19 2018-2019 17/Jul/21 1352 IMRAN MUNAWAR 17,900
10 7/17/19 2018-2019 17/Jul/21 1355 SHAKEEL AHMED 29,200
11 7/17/19 2018-2019 17/Jul/21 1360 IMRAN AZIZ 115,200
12 7/17/19 2018-2019 17/Jul/21 2098 IMRAN AHMED TOOR 12,900
13 7/17/19 2018-2019 17/Jul/21 2144 NISAR UL HAQ 15,800
14 7/17/19 2018-2019 17/Jul/21 2154 MUHAMMAD AMIR ANIS 4,300
15 7/17/19 2018-2019 17/Jul/21 2355 SUFWAN MALIK 6,000
16 7/17/19 2018-2019 17/Jul/21 2376 DANISH. C. ATTAULLAH 10,800
17 7/17/19 2018-2019 17/Jul/21 2383 MOHAMMAD ADEEL AMJAD 11,600
18 7/17/19 2018-2019 17/Jul/21 2384 UMAR FAROOQ 16,200
19 7/17/19 2018-2019 17/Jul/21 2564 ASGHAR ALI 6,700
20 7/17/19 2018-2019 17/Jul/21 5001 SAJJAD AHMED FAKHRI 30,100
21 7/17/19 2018-2019 17/Jul/21 5006 GHAZANFAR ALI 7,700
22 7/17/19 2018-2019 17/Jul/21 5015 MUHAMMAD SHAMROSE 15,300
23 7/17/19 2018-2019 17/Jul/21 5016 REHAN TARIQ GHORY 19,100
24 7/17/19 2018-2019 17/Jul/21 5018 NASAR HAYAT 22,800
25 7/17/19 2018-2019 17/Jul/21 5019 ASLAM TUFAIL 7,800
26 7/17/19 2018-2019 17/Jul/21 5020 PERVEZ TERLOKA 6,900
27 7/17/19 2018-2019 17/Jul/21 5035 UZMA SHEIKH 9,600
28 7/17/19 2018-2019 17/Jul/21 5060 HAMMAD AHMED 14,600
29 7/17/19 2018-2019 17/Jul/21 5119 ZAFAR IQBAL 8,600
30 7/17/19 2018-2019 17/Jul/21 5171 KAMRAN AHMED 8,800
List of employees
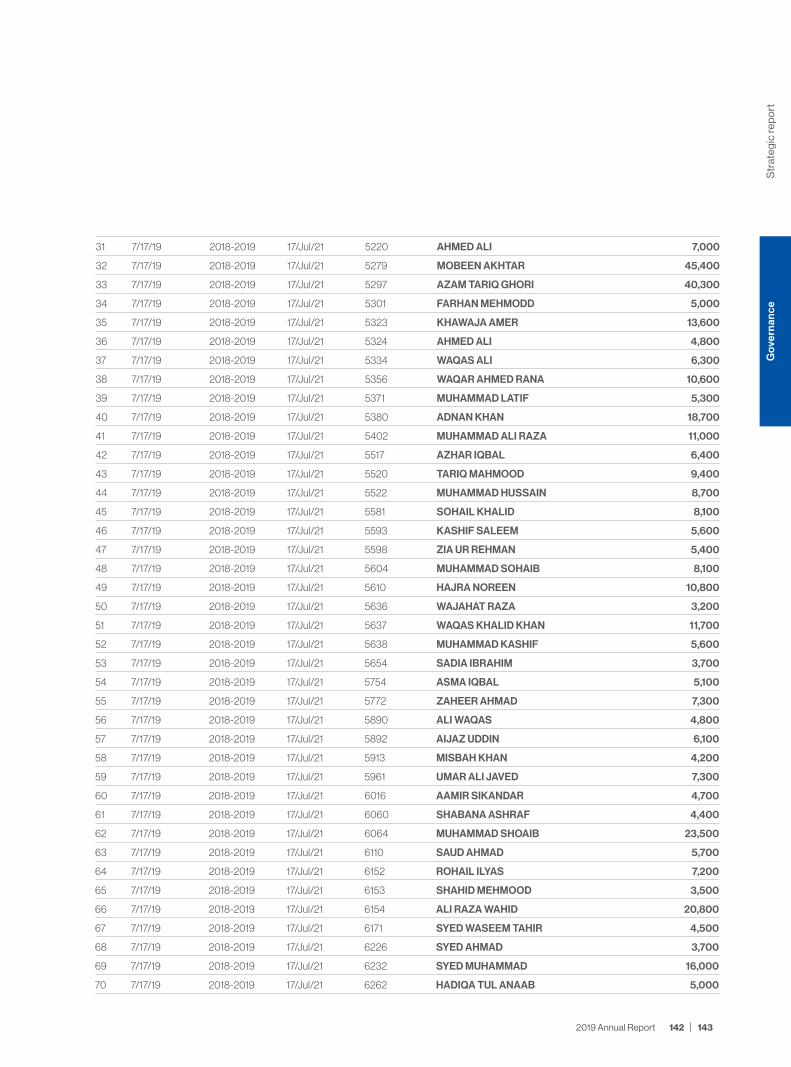
31 7/17/19 2018-2019 17/Jul/21 5220 AHMED ALI 7,000
32 7/17/19 2018-2019 17/Jul/21 5279 MOBEEN AKHTAR 45,400
33 7/17/19 2018-2019 17/Jul/21 5297 AZAM TARIQ GHORI 40,300
34 7/17/19 2018-2019 17/Jul/21 5301 FARHAN MEHMODD 5,000
35 7/17/19 2018-2019 17/Jul/21 5323 KHAWAJA AMER 13,600
36 7/17/19 2018-2019 17/Jul/21 5324 AHMED ALI 4,800
37 7/17/19 2018-2019 17/Jul/21 5334 WAQAS ALI 6,300
38 7/17/19 2018-2019 17/Jul/21 5356 WAQAR AHMED RANA 10,600
39 7/17/19 2018-2019 17/Jul/21 5371 MUHAMMAD LATIF 5,300
40 7/17/19 2018-2019 17/Jul/21 5380 ADNAN KHAN 18,700
41 7/17/19 2018-2019 17/Jul/21 5402 MUHAMMAD ALI RAZA 11,000
42 7/17/19 2018-2019 17/Jul/21 5517 AZHAR IQBAL 6,400
43 7/17/19 2018-2019 17/Jul/21 5520 TARIQ MAHMOOD 9,400
44 7/17/19 2018-2019 17/Jul/21 5522 MUHAMMAD HUSSAIN 8,700
45 7/17/19 2018-2019 17/Jul/21 5581 SOHAIL KHALID 8,100
46 7/17/19 2018-2019 17/Jul/21 5593 KASHIF SALEEM 5,600
47 7/17/19 2018-2019 17/Jul/21 5598 ZIA UR REHMAN 5,400
48 7/17/19 2018-2019 17/Jul/21 5604 MUHAMMAD SOHAIB 8,100
49 7/17/19 2018-2019 17/Jul/21 5610 HAJRA NOREEN 10,800
50 7/17/19 2018-2019 17/Jul/21 5636 WAJAHAT RAZA 3,200
51 7/17/19 2018-2019 17/Jul/21 5637 WAQAS KHALID KHAN 11,700
52 7/17/19 2018-2019 17/Jul/21 5638 MUHAMMAD KASHIF 5,600
53 7/17/19 2018-2019 17/Jul/21 5654 SADIA IBRAHIM 3,700
54 7/17/19 2018-2019 17/Jul/21 5754 ASMA IQBAL 5,100
55 7/17/19 2018-2019 17/Jul/21 5772 ZAHEER AHMAD 7,300
56 7/17/19 2018-2019 17/Jul/21 5890 ALI WAQAS 4,800
57 7/17/19 2018-2019 17/Jul/21 5892 AIJAZ UDDIN 6,100
58 7/17/19 2018-2019 17/Jul/21 5913 MISBAH KHAN 4,200
59 7/17/19 2018-2019 17/Jul/21 5961 UMAR ALI JAVED 7,300
60 7/17/19 2018-2019 17/Jul/21 6016 AAMIR SIKANDAR 4,700
61 7/17/19 2018-2019 17/Jul/21 6060 SHABANA ASHRAF 4,400
62 7/17/19 2018-2019 17/Jul/21 6064 MUHAMMAD SHOAIB 23,500
63 7/17/19 2018-2019 17/Jul/21 6110 SAUD AHMAD 5,700
64 7/17/19 2018-2019 17/Jul/21 6152 ROHAIL ILYAS 7,200
65 7/17/19 2018-2019 17/Jul/21 6153 SHAHID MEHMOOD 3,500
66 7/17/19 2018-2019 17/Jul/21 6154 ALI RAZA WAHID 20,800
67 7/17/19 2018-2019 17/Jul/21 6171 SYED WASEEM TAHIR 4,500
68 7/17/19 2018-2019 17/Jul/21 6226 SYED AHMAD 3,700
69 7/17/19 2018-2019 17/Jul/21 6232 SYED MUHAMMAD 16,000
70 7/17/19 2018-2019 17/Jul/21 6262 HADIQA TUL ANAAB 5,000
Str
ateg
ic re
po
rtG
over
nanc
e
143 2019 Annual Report 142

List of employees of subsidiary company i.e Treet HR Management Private Limited
List of employees continue
71 7/17/19 2018-2019 17/Jul/21 6280 NAUMAN AKBAR 3,400
72 7/17/19 2018-2019 17/Jul/21 6281 MUHAMMAD IRFAN 6,000
73 7/17/19 2018-2019 17/Jul/21 6282 MUHAMMAD ISHAQ 6,000
74 7/17/19 2018-2019 17/Jul/21 6303 M. ALI IMRAN 5,300
75 7/17/19 2018-2019 17/Jul/21 6343 SHEIKH TAMOOR 6,500
76 7/17/19 2018-2019 17/Jul/21 6352 HAMAD MEHMOOD 25,900
77 7/17/19 2018-2019 17/Jul/21 6360 QANBAR ABBAS 3,900
78 7/17/19 2018-2019 17/Jul/21 6371 RAFIA AZHAR 3,600
79 7/17/19 2018-2019 17/Jul/21 6381 MASOOD UL HASSAN 26,600
80 7/17/19 2018-2019 17/Jul/21 6390 MUHAMMAD AHMAD 13,000
81 7/17/19 2018-2019 17/Jul/21 6393 JAMAL ARSHAD 11,400
82 7/17/19 2018-2019 17/Jul/21 6403 MUHAMMAD SAJID 5,600
83 7/17/19 2018-2019 17/Jul/21 6404 MUHAMMAD USMAN 19,900
84 7/17/19 2018-2019 17/Jul/21 6433 AMJAD ZAMAN 4,900
85 7/17/19 2018-2019 17/Jul/21 6438 MUHAMMAD ASAD 4,100
86 7/17/19 2018-2019 17/Jul/21 6464 MUHAMMAD TARIQUE 3,200
87 7/17/19 2018-2019 17/Jul/21 6467 SHAHID SHAFIQUE 4,900
88 7/17/19 2018-2019 17/Jul/21 6480 USMAN RIAZ 7,100
89 7/17/19 2018-2019 17/Jul/21 6494 ZIL- E- SAMRA 3,200
90 7/17/19 2018-2019 17/Jul/21 6505 M. AHMAD MASOOM 9,600
91 7/17/19 2018-2019 17/Jul/21 6512 MUHAMMAD MOHSIN 4,900
92 7/17/19 2018-2019 17/Jul/21 6522 FAHAD FAROOQ 4,000
93 7/17/19 2018-2019 17/Jul/21 6524 FARAZ HUSSAIN 56,600
94 7/17/19 2018-2019 17/Jul/21 6565 USMAN BUTT 4,800
95 7/17/19 2018-2019 17/Jul/21 6566 MUHAMMAD ZUBAIR 19,500
96 7/17/19 2018-2019 17/Jul/21 6583 FARID RASHEED 75,900
97 7/17/19 2018-2019 17/Jul/21 6593 KHAWAJA AZHAR 8,200
98 7/17/19 2018-2019 17/Jul/21 6603 FARHAN ATHAR 56,600
99 7/17/19 2018-2019 17/Jul/21 6606 ALI ASLAM 206,300
100 7/17/19 2018-2019 17/Jul/21 6622 HAFIZ MUHAMMAD 3,400
101 7/17/19 2018-2019 17/Jul/21 6645 MUHAMMAD AHSAN 12,500
102 7/17/19 2018-2019 17/Jul/21 6650 RANA ZIAB HASSAN 13,400
103 7/17/19 2018-2019 17/Jul/21 6652 SHAHZADA KAMRAN 14,300
104 7/17/19 2018-2019 17/Jul/21 6657 ALI AKRAM KHAN 6,400
105 7/17/19 2018-2019 17/Jul/21 6662 ASAD ALI 9,100
106 7/17/19 2018-2019 17/Jul/21 6674 MUNEEB NAJAM 12,900
107 7/17/19 2018-2019 17/Jul/21 6689 SHEIKH TAIMOOR 10,700
108 7/17/19 2018-2019 17/Jul/21 6693 KANWAL ASGHAR 10,200
109 7/17/19 2018-2019 17/Jul/21 6695 MUHAMMAD HASEEB 3,300
110 7/17/19 2018-2019 17/Jul/21 6699 MUNEER AHMAD 4,100

111 7/17/19 2018-2019 17/Jul/21 6707 IRFAN HABIB 7,900
112 7/17/19 2018-2019 17/Jul/21 6711 YAHYA KHAN 3,200
113 7/17/19 2018-2019 17/Jul/21 6717 FAROOQ FURJAD 13,300
114 7/17/19 2018-2019 17/Jul/21 6725 IMRAN ZAFAR 21,200
115 7/17/19 2018-2019 17/Jul/21 6731 ABID ALI 3,400
116 7/17/19 2018-2019 17/Jul/21 6736 MUMTAZ HASSAN 7,500
117 7/17/19 2018-2019 17/Jul/21 6743 NUAMAN HUSSAN 4,600
118 7/17/19 2018-2019 17/Jul/21 6746 MUHAMMAD WASEEM 4,000
119 7/17/19 2018-2019 17/Jul/21 6813 Waseem Ahmad - 6813 12,500
120 7/17/19 2018-2019 17/Jul/21 9983 QASIM MANSOOR 2,400
121 7/17/19 2018-2019 17/Jul/21 9997 Uzair Hassan - 9997 8,900
122 7/17/19 2018-2019 17/Jul/21 9998 Zaid Aslam - 9998 10,500
123 7/17/19 2018-2019 17/Jul/21 9999 Rehan Iqbal - 9999 18,100
124 7/17/19 2018-2019 17/Jul/21 10001 Hafiz Faheem Javed - 10001 6,300
125 7/17/19 2018-2019 17/Jul/21 10142 Salman Ahmed Rabbani - 10142 15,700
126 7/17/19 2018-2019 17/Jul/21 10148 Malik Muhammad Muslim - 10148 18,700
127 7/17/19 2018-2019 17/Jul/21 10164 Muhammad Waqas - 10164 2,900
128 7/17/19 2018-2019 17/Jul/21 10211 Asma Shamim - 10211 2,900
129 7/17/19 2018-2019 17/Jul/21 10221 Faizan Khalid - 10221 11,700
130 7/17/19 2018-2019 17/Jul/21 10279 Imran Nazir Saqib - 10279 2,900
131 7/17/19 2018-2019 17/Jul/21 10360 Muhammad Shoaib Mahmood - 10360 17,900
132 7/17/19 2018-2019 17/Jul/21 10370 Anees Qamar - 10370 6,700
133 7/17/19 2018-2019 17/Jul/21 10393 Saqib Abbas Zaidi - 10393 8,300
134 7/17/19 2018-2019 17/Jul/21 10395 Zubair Bin Saeed - 10395 8,200
135 7/17/19 2018-2019 17/Jul/21 10414 Sameer Malik - 10414 7,700
136 7/17/19 2018-2019 17/Jul/21 10567 Ahsan Haseeb - 10567 11,700
137 7/17/19 2018-2019 17/Jul/21 10587 Shahzad Gill - 10587 3,500
138 7/17/19 2018-2019 17/Jul/21 10600 Aadil Jabbar - 10600 2,800
139 7/17/19 2018-2019 17/Jul/21 10674 Muhammad Arshad Abbasi - 10674 2,400
140 7/17/19 2018-2019 17/Jul/21 10724 Fayaz Ahmad - 10724 4,000
141 7/17/19 2018-2019 17/Jul/21 10805 Ahmed Nasir - 10805 9,200
142 7/17/19 2018-2019 17/Jul/21 10817 Sajid Ali - 10817 15,700
143 7/17/19 2018-2019 17/Jul/21 10910 Abeer Akif - 10910 9,300
144 7/17/19 2018-2019 17/Jul/21 10895 Harris Najeeb Dar - 10895 26,100
145 7/17/19 2018-2019 17/Jul/21 10864 Muhammad Ali Khan - 10864 21,200
146 7/17/19 2018-2019 17/Jul/21 11044 Usman Saleem - 11044 11,800
147 7/17/19 2018-2019 17/Jul/21 11045 Saad Saadat - 11045 6,100
148 7/17/19 2018-2019 17/Jul/21 11109 Shahzad Akbar Khan - 11109 4,600
149 7/17/19 2018-2019 17/Jul/21 11153 Imtiaz Ahmed - 11153 9,400
150 7/17/19 2018-2019 17/Jul/21 11199 Azm Zubair - 11199 12,200
Str
ateg
ic re
po
rtG
over
nanc
e
145 2019 Annual Report 144

Treet Corporation Limited

2019 Annual Report
Treet Corporation Limited
“Today’s Accomplishments
were Yesterday’s Impossibilites”
TREET GROUPOF COMPANIES
Head O�ce72-B, Industrial Area Kot Lakhpat,Lahore-54770, PakistanPhone +92 42 5830881, 35156567, 35122296Fax +92 42 35114127, 35836770www.treetonline.com
Robert H. Schuller


Independent auditors’ report 03
Consolidated statement of financial position
07
Consolidated statement of profit or loss 08
Consolidated statement ofcomprehensive income
09
Consolidated statement of cash flows 10
Consolidated statement of changes in equity
11
Notes to the consolidated financial statement
13
Statement of financial position 168
Statement of comprehensive income 169
Statement of changes in accumulated funds
170
Statement of cash flows 171
Notes to the financial statement 172
Independent auditors’ report 94
Unconsolidated statement of Financial position
98
Unconsolidated statement of Profit or loss
99
Unconsolidated statement ofcomprehensive income
100
Unconsolidated statement of cash flows
101
Unconsolidated statement of changes in equity
102
Notes to the unconsolidated financial statement
103
Pattern of shareholding 178
Participation Term Certificate (TCLTC) 182
Information for shareholders 184
Form of proxy 185
Form of proxy (urdu) 186
CO
NT
EN
TS CONSOLIDATED
FINANCIAL STATEMENTSSOCIETY FOR CULTURAL EDUCATION
UNCONSOLIDATED FINANCIAL STATEMENTS
INVESTORS’ INFORMATION

CONSOLIDATED
FINANCIAL STATEMENTSFor the year ended 30 June 2019
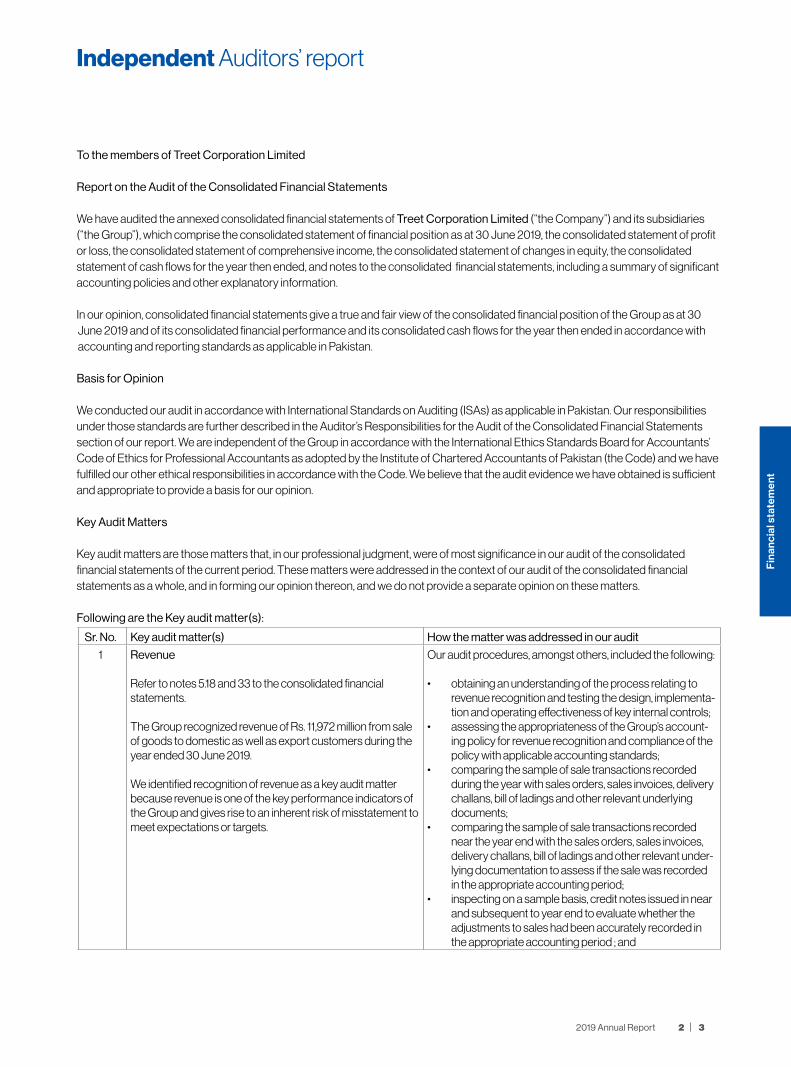
To the members of Treet Corporation Limited
Report on the Audit of the Consolidated Financial Statements
We have audited the annexed consolidated financial statements of Treet Corporation Limited (“the Company”) and its subsidiaries (“the Group”), which comprise the consolidated statement of financial position as at 30 June 2019, the consolidated statement of profit or loss, the consolidated statement of comprehensive income, the consolidated statement of changes in equity, the consolidated statement of cash flows for the year then ended, and notes to the consolidated financial statements, including a summary of significant accounting policies and other explanatory information.
In our opinion, consolidated financial statements give a true and fair view of the consolidated financial position of the Group as at 30 June 2019 and of its consolidated financial performance and its consolidated cash flows for the year then ended in accordance with accounting and reporting standards as applicable in Pakistan.
Basis for Opinion
We conducted our audit in accordance with International Standards on Auditing (ISAs) as applicable in Pakistan. Our responsibilities under those standards are further described in the Auditor’s Responsibilities for the Audit of the Consolidated Financial Statements section of our report. We are independent of the Group in accordance with the International Ethics Standards Board for Accountants’ Code of Ethics for Professional Accountants as adopted by the Institute of Chartered Accountants of Pakistan (the Code) and we have fulfilled our other ethical responsibilities in accordance with the Code. We believe that the audit evidence we have obtained is sufficient and appropriate to provide a basis for our opinion.
Key Audit Matters
Key audit matters are those matters that, in our professional judgment, were of most significance in our audit of the consolidated financial statements of the current period. These matters were addressed in the context of our audit of the consolidated financial statements as a whole, and in forming our opinion thereon, and we do not provide a separate opinion on these matters.
Following are the Key audit matter(s):
Sr. No. Key audit matter(s) How the matter was addressed in our audit
1 Revenue
Refer to notes 5.18 and 33 to the consolidated financial statements.
The Group recognized revenue of Rs. 11,972 million from sale of goods to domestic as well as export customers during the year ended 30 June 2019.
We identified recognition of revenue as a key audit matter because revenue is one of the key performance indicators of the Group and gives rise to an inherent risk of misstatement to meet expectations or targets.
Our audit procedures, amongst others, included the following:
• obtaining an understanding of the process relating to revenue recognition and testing the design, implementa-tion and operating effectiveness of key internal controls;
• assessing the appropriateness of the Group’s account-ing policy for revenue recognition and compliance of the policy with applicable accounting standards;
• comparing the sample of sale transactions recorded during the year with sales orders, sales invoices, delivery challans, bill of ladings and other relevant underlying documents;
• comparing the sample of sale transactions recorded near the year end with the sales orders, sales invoices, delivery challans, bill of ladings and other relevant under-lying documentation to assess if the sale was recorded in the appropriate accounting period;
• inspecting on a sample basis, credit notes issued in near and subsequent to year end to evaluate whether the adjustments to sales had been accurately recorded in the appropriate accounting period ; and
Independent Auditors’ report
32 2019 Annual Report
Fin
anci
al s
tate
men
t

Sr. No. Key audit matter(s) How the matter was addressed in our audit
• scanning for any manual journal entries relating to sales recorded during and near the year end which were con-sidered to be material or met other specific risk based criteria for inspecting underlying documentation.
2 Valuation of Stock-in-trade
Refer to notes 5.11 and 14 to the consolidated financial statements.
As at 30 June 2019, the Group’s gross carrying amount of stock-in-trade amounts to Rs. 2,957 million.
We identified valuation of stock-in-trade as a key audit matter as it involves significant management judgment in determin-ing the carrying value of stock-in-trade.
Our audit procedures, amongst others, included the following:
• obtaining an understanding of internal controls over valuation of stock-in-trade and testing their design, implementation and operating effectiveness;
• assessing the appropriateness of the Group’s ac-counting policies for valuation of stock-in-trade and compliance of those policies with applicable accounting standards;
• obtaining an understanding and assessing reason-ableness of the management’s determination of net realizable value (NRV) and the key estimates adopted, including future selling prices, future costs to complete work-in-process and costs necessary to make the sales and their basis; and
• comparing the NRV, on a sample basis, to the cost of stock in trade to assess whether any adjustments are required to value stock-in-trade in accordance with the accounting policy.
3 Impairment assessment of Goodwill
Goodwill of Rs. 133 million was recognized on business acquisition undertaken by the Group as disclosed in note 8.2 to the consolidated financial statements. The Group annually tests the carrying value of goodwill.
The testing is subject to estimates and judgments made by the management of the Group with respect to future sales growth and profitability, cash flow projections and selection of appropriate discount rate.
We identified impairment testing of goodwill as a key audit matter because significant degree of management judgment is involved in assessing its recoverable amount.
Our audit procedures, amongst others, included the following:
• discussing with the Group’s management key assump-tions used in valuation model and testing the mathemati-cal accuracy of the model;
• involving our internal valuation specialist to assist us in evaluating the assumptions and judgments adopted by the Group’s management relating to growth rate, terminal values and the discount rate used to derive the recoverable amount of Goodwill;
• comparing the recoverable amount with the goodwill recognized to identify impairment, if any; and
• assessing the adequacy of disclosure made in the con-solidated financial statements in accordance with the requirements of the applicable accounting standards.
4 Revaluation of freehold land and building on freehold land
Refer to notes 5.4, 6.1 and 31 to the consolidated financial statements.
The Group follows the revaluation model for subsequent measurement of freehold land and buildings on freehold land.
Latest revaluation was carried on 30 June 2019. The reval-uation was performed by an external professional valuer engaged by the Group.We identified the revaluation of the Group’s freehold land and building on freehold land as a key audit matter because the valuation involves a significant degree of judgment and estimation.
Our audit procedures, amongst others, included the following:
• obtaining and inspecting the valuation reports prepared by the external expert engaged by the Group and on which the management’s assessment of the valuation of freehold land and building on freehold land was based;
• evaluating the information provided by the Group to the external professional valuer by inspecting the relevant underlying documentation;
• involving our valuation expert to assist in evaluating the appropriateness of the valuation methodology and assessing the reasonableness of the key estimates and assumptions adopted in the valuation report by the valuer engaged by the Group; and
• assessing the completeness, appropriateness and adequacy of the disclosure in the Group’s financial state-ments with regard to the revaluation performed.
Independent Auditors’ report

Information other than the Consolidated Financial Statements and Auditor’s Report thereon
Management is responsible for the other information. Other information comprises the information included in the annual report for the year ended 30 June 2019, but does not include the consolidated financial statements and our auditor’s report thereon.Our opinion on the consolidated financial statements does not cover the other information and we do not express any form of assurance conclusion thereon.
In connection with our audit of the consolidated financial statements, our responsibility is to read the other information and, in doing so, consider whether the other information is materially inconsistent with the consolidated financial statements or our knowledge obtained in the audit or otherwise appears to be materially misstated. If, based on the work we have performed, we conclude that there is a material misstatement of this other information, we are required to report that fact. We have nothing to report in this regard.
Responsibilities of Management and Board of Directors for the Consolidated Financial Statements
Management is responsible for the preparation and fair presentation of the consolidated financial statements in accordance with the accounting and reporting standards as applicable in Pakistan and the requirements of Companies Act, 2017(XIX of 2017) and for such internal control as management determines is necessary to enable the preparation of consolidated financial statements that are free from material misstatement, whether due to fraud or error.
In preparing the consolidated financial statements, management is responsible for assessing the Group’s ability to continue as a going concern, disclosing, as applicable, matters related to going concern and using the going concern basis of accounting unless management either intends to liquidate the Group or to cease operations, or has no realistic alternative but to do so.
The Board of directors is responsible for overseeing the Group’s financial reporting process.
Auditor’s responsibilities for the Audit of the Consolidated Financial Statements
Our objectives are to obtain reasonable assurance about whether the consolidated financial statements as a whole are free from material misstatement, whether due to fraud or error and to issue an auditor’s report that includes our opinion. Reasonable assurance is a high level of assurance, but is not a guarantee that an audit conducted in accordance with ISAs as applicable in Pakistan will always detect a material misstatement when it exists. Misstatements can arise from fraud or error and are considered material if, individually or in the aggregate, they could reasonably be expected to influence the economic decisions of users taken on the basis of these consolidated financial statements.
As part of an audit in accordance with ISAs as applicable in Pakistan, we exercise professional judgment and maintain professional skepticism throughout the audit. We also:
• Identify and assess the risks of material misstatement of the consolidated financial statements, whether due to fraud or error, design and perform audit procedures responsive to those risks, and obtain audit evidence that is sufficient and appropriate to provide a basis for our opinion. The risk of not detecting a material misstatement resulting from fraud is higher than for one resulting from error, as fraud may involve collusion, forgery, intentional omissions, misrepresentations, or the override of internal control.
• Obtain an understanding of internal control relevant to the audit in order to design audit procedures that are appropriate in the circumstances, but not for the purpose of expressing an opinion on the effectiveness of the Group’s internal control.
• Evaluate the appropriateness of accounting policies used and the reasonableness of accounting estimates and related disclosures made by management.
• Conclude on the appropriateness of management’s use of the going concern basis of accounting and, based on the audit evidence obtained, whether a material uncertainty exists related to events or conditions that may cast significant doubt on the Group’s ability to continue as a going concern. If we conclude that a material uncertainty exists, we are required to draw attention in our auditor’s report to the related disclosures in the consolidated financial statements or, if such disclosures are inadequate,
Independent Auditors’ report
54 2019 Annual Report
Fin
anci
al s
tate
men
t

to modify our opinion. Our conclusions are based on the audit evidence obtained up to the date of our auditor’s report. However, future events or conditions may cause the Group to cease to continue as a going concern.
• Evaluate the overall presentation, structure and content of the consolidated financial statements, including the disclosures, and whether the consolidated financial statements represent the underlying transactions and events in a manner that achieves fair presentation.
• Obtain sufficient appropriate audit evidence regarding the financial information of the entities or business activities within the Group to express an opinion on the consolidated financial statements. We are responsible for the direction, supervision and performance of the group audit. We remain solely responsible for our audit opinion.
We communicate with the board of directors regarding, among other matters, the planned scope and timing of the audit and significant audit findings, including any significant deficiencies in internal control that we identify during our audit.
We also provide the board of directors with a statement that we have complied with relevant ethical requirements regarding independence, and to communicate with them all relationships and other matters that may reasonably be thought to bear on our independence, and where applicable, related safeguards.
From the matters communicated with the board of directors, we determine those matters that were of most significance in the audit of the consolidated financial statements of the current period and are therefore the key audit matters. We describe these matters in our auditor’s report unless law or regulation precludes public disclosure about the matter or when, in extremely rare circumstances, we determine that a matter should not be communicated in our report because the adverse consequences of doing so would reasonably be expected to outweigh the public interest benefits of such communication.
The engagement partner on the audit resulting in this independent auditor’s report is Kamran Iqbal Yousafi.
KPMG Taseer Hadi & Co.Chartered AccountantsLAHORE
Date: October 04, 2019
Independent Auditors’ report

Consolidated statement of financial positionAs at 30 June 2019
Note 2019 2018(Rupees in thousand)
AssetsNon-current assetsProperty, plant and equipment 6 17,681,440 13,288,666 Investment property 7 12,896 19,384 Intangible assets 8 155,317 163,693 Long term investments 9 478,297 457,703 Long term loans and advances 10 1,973 2,847 Long term deposits 11 46,214 43,605
18,376,137 13,975,898
Current assetsStores and spares 13 286,834 267,058 Stock in trade 14 2,956,983 1,950,670 Trade debts 15 1,235,283 1,035,898 Short term investments 16 435,348 462,484 Loans, advances, deposits, prepayments
and other receivables 17 2,573,504 2,147,413 Cash and bank balances 18 358,990 1,118,210
7,846,942 6,981,733 Assets held for sale 19 - 44,240
7,846,942 7,025,973 LiabilitiesCurrent liabilitiesCurrent portion of long term liabilities 20 201,266 290,577 Short term borrowings 21 13,066,427 9,700,404 Trade and other payables 22 1,278,665 1,023,516 Unclaimed dividend 13,274 13,335 Accrued mark-up 23 485,136 298,001 Provision for taxation 143,611 93,551
15,188,379 11,419,384 Net current assets (7,341,437) (4,393,411)Non-current liabilitiesLong term deposits 24 1,214 1,214 Redeemable capital 25 - 178,166 Deferred liabilities - Employee retirement benefits 26 481,508 325,698 Deferred taxation 12 66,309 12,015
549,031 517,093 Contingencies and commitments 28
10,485,669 9,065,394 Represented by:Authorized capital
250,000,000 (2018: 250,000,000) ordinary shares of Rs. 10 each 2,500,000 2,500,000 150,000,000 (2018: 150,000,000) preference shares of Rs. 10 each 1,500,000 1,500,000
4,000,000 4,000,000
Issued, subscribed and paid up capital 29 1,654,508 1,600,846 Reserves 30 5,455,651 5,265,880 Unappropriated (loss) / profit (1,606,263) 539,157 Surplus on revaluation of land and buildings - net of tax 31 4,642,427 1,301,777 Equity attributable to owners of the Company 10,146,323 8,707,660
Non - controlling interest 32 339,346 357,734 10,485,669 9,065,394
The annexed notes 1 to 53 form an integral part of these unconsolidated financial statements.
Syed Shahid AliChief Executive Officer
Muhammad Shafique AnjumDirector
LAHOREOctober 04, 2019
Amir ZiaChief Financial Officer
76 2019 Annual Report
Fin
anci
al s
tate
men
t

Consolidated statement of profit or lossFor the year ended 30 June 2019
Note 2019 2018
(Rupees in thousand)
Revenue - net 33 11,972,060 9,410,276
Cost of sales 34 10,725,170 7,943,085
Gross profit 1,246,890 1,467,191
Administrative expenses 35 665,508 486,635
Distribution cost 36 1,365,875 1,064,894
Impairment loss on trade debts 15.3 8,700 9,019
2,040,083 1,560,548
Operating loss (793,193) (93,357)
Finance cost 37 1,286,392 485,914
Other operating expenses 38 121,441 59,691
1,407,833 545,605
Other income 39 243,315 129,509
Share of profit of associate 8,947 30,618
Loss before taxation (1,948,764) (478,835)
Taxation 161,903 141,241
- Group 14,579 10,436
- Associate 40 176,482 151,677
Loss after taxation 40 (2,125,246) (630,512)
Attributable to:
Equity holders of the Parent Company (2,070,587) (629,139)
Non - controlling interest 32 (54,659) (1,373)
(2,125,246) (630,512)
Loss per share - basic and diluted (Rupees) 41 (12.69) (3.97)
The annexed notes 1 to 53 form an integral part of these consolidated financial statements.
Syed Shahid AliChief Executive Officer
Muhammad Shafique AnjumDirector
LAHOREOctober 04, 2019
Amir ZiaChief Financial Officer

Consolidated statement of comprehensive incomeFor the year ended 30 June 2019
2019 2018
(Rupees in thousand)
Loss after taxation (2,125,246) (630,512)
Other comprehensive income / (loss)
Items that are or may be reclassified
to profit or loss account:
Unrealised loss on re-measurement of available
for sale investments - Group’s share in associate - (2,559)
Items that will never be reclassified
to profit or loss account:
Remeasurement of defined benefit obligation - net of tax (89,464) (62,558)
Surplus on revaluation of freehold land and building - net of tax 3,384,443 -
Equity securities at FVOCI - net change in fair value of
investments - Group’s share in associate (2,078) -
Share of loss in associate’s defined benefit liability - net of tax (1,696) (1,286)
Total comprehensive income for the year 1,165,959 (696,915)
Attributable to:
Equity holders of the Parent Company 1,191,924 (695,542)
Non-controlling interest (25,965) (1,373)
1,165,959 (696,915)
The annexed notes 1 to 53 form an integral part of these consolidated financial statements.
Syed Shahid AliChief Executive Officer
Muhammad Shafique AnjumDirector
LAHOREOctober 04, 2019
Amir ZiaChief Financial Officer
98 2019 Annual Report
Fin
anci
al s
tate
men
t

2019 2018
(Rupees in thousand)
Cash used in from operations 47 (1,219,699) (784,989)
Finance cost paid (1,099,257) (538,772)
Taxes paid (125,317) (151,378)
WPPF and WWF paid (4,773) (12,270)
Payment to gratuity fund and superannuation fund (39,159) (61,023)
Long term loans and deposits - net (1,735) 6,963
(1,270,241) (756,480)
Net cash used in from operating activities (2,489,940) (1,541,469)
Cash flows from investing activities
Fixed capital expenditure (1,778,045) (2,343,476)
Proceeds from sale of property, plant and equipment 96,497 36,828
Acquisition of associate (30,000) -
Profit received on bank deposits 21,171 23,540
Dividend received 3,783 21,764
Net cash used in investing activities (1,686,594) (2,261,344)
Cash flows from financing activities
Proceeds from issue of shares under employee stock option scheme 48,774 37,623
Consideration received from Non Controlling Interest 8,851 242,112
Loan from Chief Executive Officer - Interest free (290,000) -
Redemption of participation term certificates (6,273) (6,273)
Short term borrowings - net 302,267 637,077
Dividend paid (61) (5,460)
Net cash generated from financing activities 63,558 905,079
Net decrease in cash and cash equivalents (4,112,976) (2,897,734)
Cash and cash equivalents at beginning of year (5,852,073) (2,954,339)
Cash and cash equivalents at end of year 48 (9,965,049) (5,852,073)
The annexed notes 1 to 53 form an integral part of these consolidated financial statements.
Consolidated statement of cash flowsFor the year ended 30 June 2019
Syed Shahid AliChief Executive Officer
Muhammad Shafique AnjumDirector
LAHOREOctober 04, 2019
Amir ZiaChief Financial Officer

Consolidated statement of changes in equityFor the year ended 30 June 2019
Cap
ital R
eser
ves
Rev
enue
Res
erve
sTo
tal e
quity
at
trib
utab
le to
sh
areh
olde
rs
of H
oldi
ng
Com
pany
Non
- C
ontr
ollin
g In
tere
st
Tota
l sh
areh
olde
rs
equi
ty S
hare
C
apita
l
Sha
re
Pre
miu
m
Cap
ital
Res
erve
Sha
re in
ca
pita
l re
serv
e of
as
soci
ate
Sur
plus
on
reva
luat
ion
of la
nd a
nd
build
ings
- ne
t of
tax
Fair
valu
e re
serv
e on
in
vest
men
t
Sta
tuto
ry
Res
erve
Em
ploy
ee
Sto
ck O
ptio
n C
ompe
nsat
ion
Res
erve
Gen
eral
R
eser
ve
Un-
appr
opria
ted
profi
t / (l
oss)
----
----
----
----
----
----
----
----
----
----
----
----
----
----
----
----
----
----
----
----
----
----
----
----
----
(Rup
ees
in th
ousa
nd)-
----
----
----
----
----
----
----
----
----
----
----
----
----
----
----
----
----
----
----
----
----
----
----
----
---
Bal
ance
as
at 3
0 J
une
2017
1,42
1,436
4
,318
,067
6
29
4,2
13
1,31
1,607
-
511
,941
-
266
,40
0
1,25
5,0
27
9,0
89,3
20
192,
213
9,2
81,5
33
Tota
l com
preh
ensi
ve lo
ss fo
r the
yea
r
Loss
for t
he y
ear
- -
- -
- -
- -
- (6
29,13
9) (6
29,13
9) (1
,373
) (6
30,5
12)
Oth
er c
ompr
ehen
sive
loss
- -
- (2
,559
) -
- -
- -
(63,
844)
(66,
403)
- (6
6,40
3)
- -
- (2
,559
) -
- -
- -
(692
,983
) (6
95,5
42)
(1,3
73)
(696
,915
)
Incr
emen
tal d
epre
ciat
ion
rela
ting
to s
urpl
us o
n re
valu
atio
n o
f bui
ldin
gs -
net o
f tax
- -
- -
(10,
749)
- -
- -
10,74
9 -
- -
Effe
ct o
f cha
nge
in ta
x ra
te o
n ac
coun
t of s
urpl
us o
n r
eval
uatio
n of
bui
ldin
gs -
- -
- 9
19
- -
- -
- 9
19
- 9
19
Gro
up's
sha
re o
f pos
t acq
uisi
tion
chan
ge in
net
ass
ets
of a
ssoc
iate
- -
- -
- -
- -
- 3
1,918
3
1,918
-
31,9
18
Rel
ated
def
erre
d ta
x -
- -
- -
- -
- -
(4,7
88)
(4,7
88)
- (4
,788
)
- -
- -
- -
- -
- 2
7,130
2
7,130
-
27,1
30
Tran
sact
ions
with
ow
ners
of t
he G
roup
,C
ontr
ibut
ions
and
dis
trib
utio
ns
Con
vers
ion
of P
TCs
into
ord
inar
y sh
ares
@ 0
.07
shar
e pe
r PTC
29
,275
14
3,8
69
-
- -
- -
- -
- 17
3,14
4
- 17
3,14
4
Issu
ance
of s
hare
s un
der e
mpl
oyee
sto
ck o
ptio
n sc
hem
e 7
,26
5 3
0,3
58
- -
- -
- -
- -
37,
623
-
37,
623
Issu
ance
of
shar
es a
s fu
lly p
aid
bonu
s sh
are
@10
% 14
2,8
70
- -
- -
- -
- -
(14
2,8
70)
- -
-
Div
iden
d pa
id to
NC
I -
- -
- -
- -
- -
- -
(152
) (1
52)
179
,410
17
4,2
27
- -
- -
- -
- (1
42,
870
) 2
10,7
67
(152
) 2
10,6
15
Cha
nges
in o
wne
rshi
p in
tere
st
Acq
uisi
tion
by N
CI w
ithou
t cha
nge
in c
ontr
ol -
- -
- -
- -
- -
75,
06
6
75,
06
6
167,
04
6
24
2,11
2
Bal
ance
as
at 3
0 J
une
2018
as
prev
ious
ly re
port
ed 1,
60
0,8
46
4
,49
2,29
4
629
1,
654
1,
30
1,777
-
511
,941
-
26
6,4
00
5
32,
119
8
,70
7,6
60
3
57,7
34
9
,06
5,3
94
Adj
ustm
ent o
n in
itial
app
licat
ion
of IF
RS
9, n
et o
f tax
- -
- -
- (7
,03
8)
- -
- 7
,03
8
- -
-
Adj
uste
d ba
lanc
e as
at 0
1 Jul
y 20
18 1,
60
0,8
46
4
,49
2,29
4
629
1,
654
1,
30
1,777
(7
,03
8)
511
,941
-
26
6,4
00
5
39
,157
8,7
07,
66
0
357
,73
4
9,0
65,
39
4
Tota
l com
preh
ensi
ve lo
ss fo
r the
yea
r
Loss
for t
he y
ear
- -
- -
- -
- -
- (2
,070
,58
7) (2
,070
,58
7) (5
4,6
59)
(2,12
5,24
6)
Oth
er c
ompr
ehen
sive
inco
me
- -
- (2
,078
) 3
,355
,74
9
- -
- -
(91,1
60
) 3
,26
2,51
1 2
8,6
94
3
,29
1,20
5
- -
- (2
,078
) 3
,355
,74
9
- -
- (2
,161,7
47)
1,19
1,924
(2
5,9
65)
1,16
5,9
59
Sye
d S
hahi
d A
liC
hief
Exe
cutiv
e O
ffice
rM
uham
mad
Sha
fique
Anj
umD
irect
orLA
HO
RE
Oct
ober
04,
20
19A
mir
Zia
Chi
ef F
inan
cial
Offi
cer
1110 2019 Annual Report
Fin
anci
al s
tate
men
t
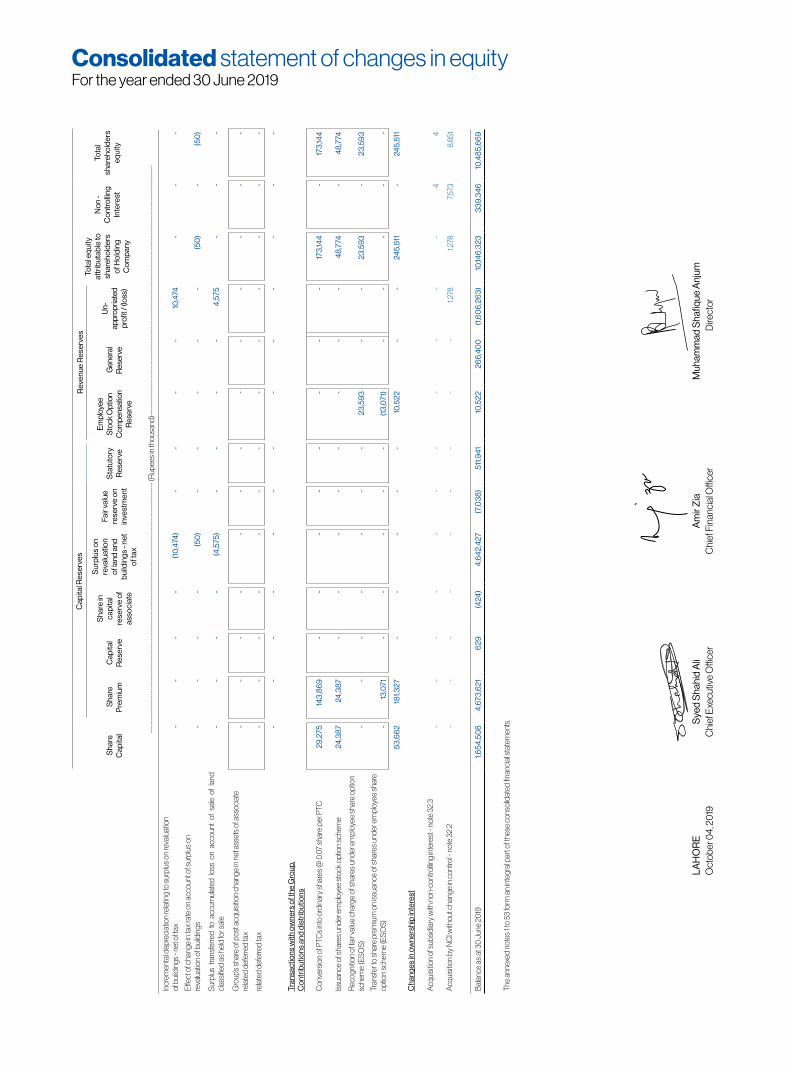
Cap
ital R
eser
ves
Rev
enue
Res
erve
sTo
tal e
quity
at
trib
utab
le to
sh
areh
olde
rs
of H
oldi
ng
Com
pany
Non
- C
ontr
ollin
g In
tere
st
Tota
l sh
areh
olde
rs
equi
ty S
hare
C
apita
l
Sha
re
Pre
miu
m
Cap
ital
Res
erve
Sha
re in
ca
pita
l re
serv
e of
as
soci
ate
Sur
plus
on
reva
luat
ion
of la
nd a
nd
build
ings
- ne
t of
tax
Fair
valu
e re
serv
e on
in
vest
men
t
Sta
tuto
ry
Res
erve
Em
ploy
ee
Sto
ck O
ptio
n C
ompe
nsat
ion
Res
erve
Gen
eral
R
eser
ve
Un-
appr
opria
ted
profi
t / (l
oss)
----
----
----
----
----
----
----
----
----
----
----
----
----
----
----
----
----
----
----
----
----
----
----
----
----
(Rup
ees
in th
ousa
nd)-
----
----
----
----
----
----
----
----
----
----
----
----
----
----
----
----
----
----
----
----
----
----
----
----
---
Incr
emen
tal d
epre
ciat
ion
rela
ting
to s
urpl
us o
n re
valu
atio
n of
bui
ldin
gs -
net o
f tax
- -
- -
(10
,474
) -
- -
- 10
,474
-
- -
Effe
ct o
f cha
nge
in ta
x ra
te o
n ac
coun
t of s
urpl
us o
n re
valu
atio
n of
bui
ldin
gs -
- -
- (5
0)
- -
- -
- (5
0)
- (5
0)
Sur
plus
tra
nsfe
rred
to a
ccum
ulat
ed l
oss
on a
ccou
nt o
f sa
le o
f la
nd
clas
sifie
d as
hel
d fo
r sal
e-
--
- (4
,575
)-
--
-4
,575
--
-
Gro
up’s
shar
e of
pos
t acq
uisi
tion
chan
ge in
net
ass
ets
of a
ssoc
iate
re
late
d de
ferre
d ta
x -
- -
- -
- -
- -
- -
- -
rela
ted
defe
rred
tax
- -
- -
- -
- -
- -
- -
-
- -
- -
- -
- -
- -
- -
-
Tran
sact
ions
with
ow
ners
of t
he G
roup
,C
ontr
ibut
ions
and
dis
trib
utio
ns
Con
vers
ion
of P
TCs
into
ord
inar
y sh
ares
@ 0
.07
shar
e pe
r PTC
29
,275
14
3,8
69
-
- -
- -
- -
- 17
3,14
4
- 17
3,14
4
Issu
ance
of s
hare
s un
der e
mpl
oyee
sto
ck o
ptio
n sc
hem
e 2
4,3
87
24
,38
7 -
- -
- -
- -
- 4
8,7
74
- 4
8,7
74
Rec
ogni
tion
of fa
ir va
lue
char
ge o
f sha
res
unde
r em
ploy
ee s
hare
opt
ion
sche
me
(ES
OS
) -
- -
- -
- -
23
,59
3
- -
23
,59
3
- 2
3,5
93
Tran
sfer
to s
hare
pre
miu
m o
n is
suan
ce o
f sha
res
unde
r em
ploy
ee s
hare
op
tion
sche
me
(ES
OS
) -
13,0
71
- -
- -
- (1
3,0
71)
- -
- -
-
53
,66
2 18
1,327
-
- -
- -
10,5
22
- -
24
5,51
1 -
24
5,51
1
Cha
nges
in o
wne
rshi
p in
tere
st
Acq
uisi
tion
of s
ubsi
diar
y w
ith n
on-c
ontro
lling
inte
rest
- no
te 3
2.3
- -
- -
- -
- -
- -
- 4
4
Acq
uisi
tion
by N
CI w
ithou
t cha
nge
in c
ontro
l - n
ote
32.2
- -
- -
- -
- -
- 1,
278
1,27
8 7
,573
8
,851
Bal
ance
as
at 3
0 J
une
2019
1,6
54,5
08
4
,673
,621
6
29
(424
) 4
,64
2,4
27
(7,0
38
) 5
11,9
41
10,5
22
26
6,4
00
(1
,60
6,2
63
) 10
,146
,323
3
39
,34
6
10,4
85,
66
9
The
ann
exed
not
es 1
to 5
3 fo
rm a
n in
tegr
al p
art o
f the
se c
onso
lidat
ed fi
nanc
ial s
tate
men
ts.
Consolidated statement of changes in equityFor the year ended 30 June 2019
Sye
d S
hahi
d A
liC
hief
Exe
cutiv
e O
ffice
rM
uham
mad
Sha
fique
Anj
umD
irect
orLA
HO
RE
Oct
ober
04,
20
19A
mir
Zia
Chi
ef F
inan
cial
Offi
cer
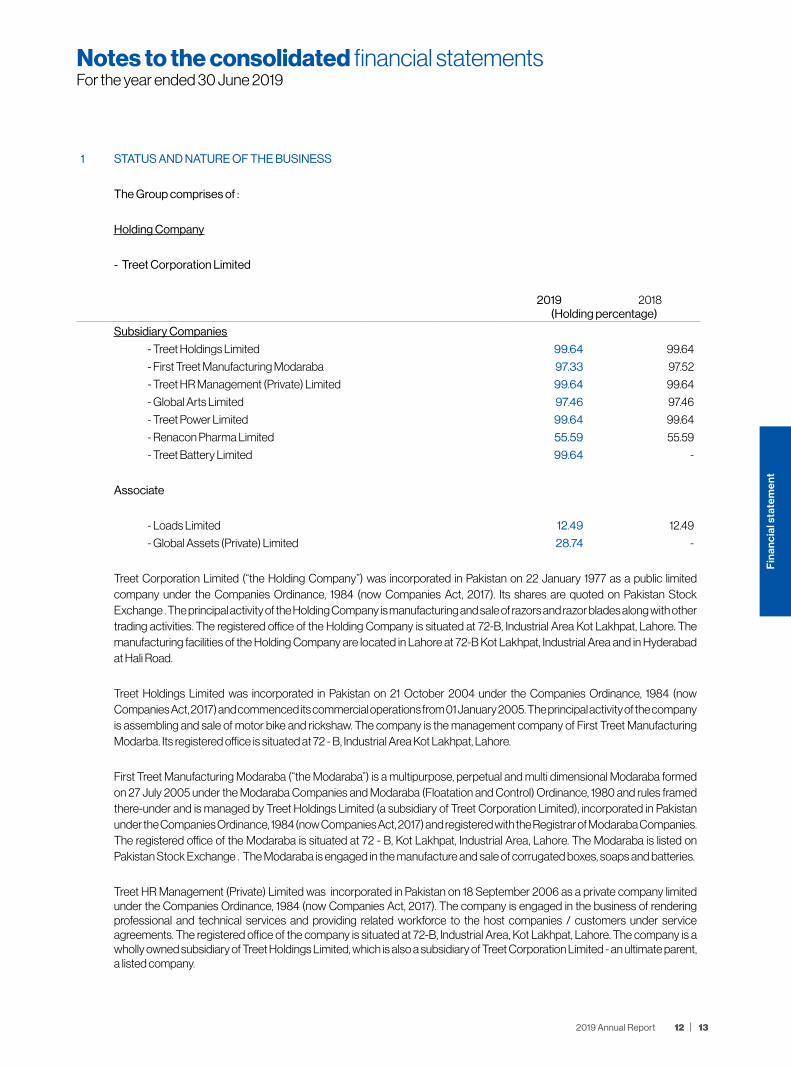
1 STATUS AND NATURE OF THE BUSINESS
The Group comprises of :
Holding Company
- Treet Corporation Limited
2019 2018(Holding percentage)
Subsidiary Companies
- Treet Holdings Limited 99.64 99.64
- First Treet Manufacturing Modaraba 97.33 97.52
- Treet HR Management (Private) Limited 99.64 99.64
- Global Arts Limited 97.46 97.46
- Treet Power Limited 99.64 99.64
- Renacon Pharma Limited 55.59 55.59
- Treet Battery Limited 99.64 -
Associate
- Loads Limited 12.49 12.49
- Global Assets (Private) Limited 28.74 -
Treet Corporation Limited (“the Holding Company”) was incorporated in Pakistan on 22 January 1977 as a public limited company under the Companies Ordinance, 1984 (now Companies Act, 2017). Its shares are quoted on Pakistan Stock Exchange . The principal activity of the Holding Company is manufacturing and sale of razors and razor blades along with other trading activities. The registered office of the Holding Company is situated at 72-B, Industrial Area Kot Lakhpat, Lahore. The manufacturing facilities of the Holding Company are located in Lahore at 72-B Kot Lakhpat, Industrial Area and in Hyderabad at Hali Road.
Treet Holdings Limited was incorporated in Pakistan on 21 October 2004 under the Companies Ordinance, 1984 (now Companies Act, 2017) and commenced its commercial operations from 01 January 2005. The principal activity of the company is assembling and sale of motor bike and rickshaw. The company is the management company of First Treet Manufacturing Modarba. Its registered office is situated at 72 - B, Industrial Area Kot Lakhpat, Lahore.
First Treet Manufacturing Modaraba (“the Modaraba”) is a multipurpose, perpetual and multi dimensional Modaraba formed on 27 July 2005 under the Modaraba Companies and Modaraba (Floatation and Control) Ordinance, 1980 and rules framed there-under and is managed by Treet Holdings Limited (a subsidiary of Treet Corporation Limited), incorporated in Pakistan under the Companies Ordinance, 1984 (now Companies Act, 2017) and registered with the Registrar of Modaraba Companies. The registered office of the Modaraba is situated at 72 - B, Kot Lakhpat, Industrial Area, Lahore. The Modaraba is listed on Pakistan Stock Exchange . The Modaraba is engaged in the manufacture and sale of corrugated boxes, soaps and batteries.
Treet HR Management (Private) Limited was incorporated in Pakistan on 18 September 2006 as a private company limited under the Companies Ordinance, 1984 (now Companies Act, 2017). The company is engaged in the business of rendering professional and technical services and providing related workforce to the host companies / customers under service agreements. The registered office of the company is situated at 72-B, Industrial Area, Kot Lakhpat, Lahore. The company is a wholly owned subsidiary of Treet Holdings Limited, which is also a subsidiary of Treet Corporation Limited - an ultimate parent, a listed company.
Notes to the consolidated financial statementsFor the year ended 30 June 2019
1312 2019 Annual Report
Fin
anci
al s
tate
men
t
Global Arts Limited (“the Company”) was incorporated in Pakistan on 26 October 2007 under the Companies Ordinance, 1984 (now Companies Act, 2017) as a private limited company. The Company was converted into public limited company (unlisted) after complying with the legal formalities w.e.f 23 July 2014. The Company is engaged to promote, establish, run, manage and maintain educational institutions, colleges of arts, research, sciences, information technology, business administration and such other educational institutions as may be considered appropriate for the promotion and advancement of education in the country with national and international affiliation. The registered office of the company is situated at 72-B, Industrial Area, Kot Lakhpat, Lahore.
Treet Power Limited was incorporated on 20 November, 2007 in Pakistan. At present the company is planning to set up an Electric Power Generation Project for generating, distribution and selling of Electric Power, which is kept in abeyance in order to complete other projects of the Group Companies of Treet Corporation Limited. The registered office of the company is situated at 72-B, Industrial Area, Kot Lakhpat, Lahore. The company is a wholly owned subsidiary of Treet Holdings Limited, which is also a subsidiary of Treet Corporation Limited - an ultimate parent, a listed company.
Renacon Pharma Limited was incorporated on 07 July 2009 as a private limited company under the Companies Ordinance, 1984 (now Companies Act, 2017). The company was converted into Public Limited Company (unlisted) on 27 January 2017 after complying with the legal formalities. The Company is engaged in the business of manufacturing of all types of formulations of Haemodialysis concentration in powder and solution form for all brands of machines. The registered office of the company is situated at 72-B, Industrial Area, Kot Lakhpat, Lahore.
Treet Battery Limited was incorporated on 22 February 2019 in Pakistan under the Companies Act, 2017 and in the process of initiating its operations by the period end. The Company will carry out business as manufacturers, assemblers, processors, producers, suppliers, sellers, importers, exporters, makers, fabricators and dealers in all batteries including but not limited to lead acid batteries, deep cycle batteries, lithium batteries, nickel cadmimum batteries, nickel metal hydride batteries, absorbed glass mat (AGM) batteries, Gel batteries used in or required for industrial, transport, commercial and domestic and any other purpose. The registered office of the Company is situated at 72-B, Industrial Area, Kot Lakhpat, Lahore.
1.1 Basis of consolidation and equity accounting
These consolidated financial statements comprise the financial statements of the Holding Company, its subsidiary companies and its associates as at 30 June 2019. These consolidated financial statements have been prepared from the information available in the audited separate financial statements of the Holding Company for the year ended 30 June 2019 and the audited financial statements of the subsidiaries and associates for the year ended 30 June 2019.
1.2.1 Subsidiaries
Subsidiaries are all entities (including structured entities) over which the Group has control. The Group controls an entity when the Group is exposed to, or has rights to, variable returns from its involvement with the entity and has the ability to affect those returns through its power to direct the activities of the entity. The subsidiaries are fully consolidated from the date of acquisition, being the date on which the Holding Company obtains control, and continue to be consolidated until the date that such control ceases.
The financial statements of the subsidiary companies have been consolidated on a line-by-line basis and the carrying values of the investments held by the Holding Company have been eliminated against the shareholders’ equity in the subsidiary companies. The financial statements of the subsidiaries are prepared for the same reporting year as of the Holding Company, using consistent accounting policies
Intra - Group balances and transactions, and any unrealised income and expenses arising from intra - group transactions, are eliminated in full.
Notes to the consolidated financial statementsFor the year ended 30 June 2019

The purchase method of accounting is used to account for the acquisition of subsidiaries by the Group. The cost of an acquisition is measured as the fair value of the assets given, equity instruments issued and liabilities incurred or assumed at the date of exchange, plus costs directly attributable to the acquisition. Identifiable assets acquired and liabilities and contingent liabilities assumed in a business combination are measured initially at their fair values at the acquisition date, irrespective of the extent of any non-controlling interest. The excess of the cost of acquisition over the fair value of the Group’s share of the identifiable net assets acquired is recorded as goodwill. Any goodwill that arises is tested annually for impairment.
Non-controlling interest
Non-controlling interest is that part of net results of operations and of net assets of the subsidiaries which are not owned by the Holding Company either directly or indirectly. Non-controlling interest is presented as a separate item in the consolidated financial statements. The Group applies a policy of treating transactions with non-controlling interests as transactions with parties external to the Group. Non-controlling interest is measured at proportionate share of identifiable net assets at the time of acquisition.
Changes in the Group’s interest in a subsidiary that do not result in a loss of control are accounted for as equity transaction.
Loss of control
On the loss of control, the Group derecognizes the assets and liabilities of the subsidiary, any non controlling interests and other components of equity related to the subsidiary. Any surplus or deficit arising on the loss of control is recognized in consolidated statement of profit or loss. In addition, any amounts previously recognised in other comprehensive income in respect of that subsidiary are reclassified to the consolidated profit or loss. If the Group retains any interest in the previous subsidiary, then such interest is measured at fair value at the date that control is lost. Subsequently that retained interest is accounted for as an equity-accounted investee, joint venture or as an FVOCI financial asset depending on the level of influence retained.
1.2.2 Associates
Associates are all entities over which the Group has significant influence but not control. This is generally the case where the Group holds between 20% to 50% of the voting rights. Investments in associates are accounted for using the equity method of accounting. Under the equity method, the investment is initially recognized at cost, and the carrying amount is increased or decreased to recognize the Group’s share of the profit or loss of the associate after the date of acquisition.
If the ownership interest in an associate is reduced but significant influence is retained, only a proportionate share of the amounts previously recognized in other comprehensive income is reclassified to statement of profit or loss account where appropriate.
The Group’s share of its associates post acquisition profits or losses is recognized in the consolidated statement of profit or loss and its share in post acquisition movements in the other comprehensive income is recognized in other comprehensive income with a corresponding adjustment to the carrying amount of the investment. The Group’s share of its associates post acquisition changes in net assests (associates transactions with NCI) are recognized directly in equity with a corresponding adjustment to the carrying amount of the investment. When the Group’s share of losses in associates equals or exceeds its interest in the associate including any other unsecured receivables, the Group does not recognize further losses, unless it has incurred legal or constructive obligations or made payments on behalf of the associates.
Notes to the consolidated financial statementsFor the year ended 30 June 2019
1514 2019 Annual Report
Fin
anci
al s
tate
men
t

Unrealized gains arising from transactions between the Group and its associates are eliminated against investment to the extent of the Group’s interest in the associates. Unrealized losses are also eliminated unless the transaction provides evidence of an impairment of the asset transferred.
Associates, which the Group intends to dispose off within twelve months of the reporting date are not accounted for under the equity method and are shown under non-current assets held for sale at the lower of carrying amount and fair value less cost to sell.
Dilution gains and losses arising in investments in associates are recognized in the consolidated statement of profit or loss.
At each reporting date, the Group reviews the carrying amounts of its investments in associates to assess whether there is any indication that such investments have suffered an impairment loss. If any such indication exists, the recoverable amount is estimated using the discounted cash flow methodology, in order to determine the extent of the impairment loss, if any. Impairment losses are recognized as expense.
2 BASIS OF PREPARATION
2.1 Statement of compliance
These consolidated financial statements have been prepared in accordance with the accounting and reporting standards as applicable in Pakistan. The accounting and reporting standards applicable in Pakistan comprise of:
- International Financial Reporting Standards (IFRS Standards) issued by the International Accounting Standards Board (IASB) as notified under the Companies Act, 2017;
- ‘Islamic Financial Accounting Standards (IFAS) issued by the Institute of Chartered Accountants of Pakistan as notified under the Companies Act, 2017; and
- Provisions of and directives issued under the Companies Act, 2017.
Where provisions of and directives issued under the Companies Act, 2017 differ from the IFRS Standards, the provisions of and directives issued under the Companies Act, 2017 have been followed.
2.2 Basis of measurement
These consolidated financial statements have been prepared under the historical cost convention except for revaluation of certain financial instruments at fair value as referred to in note 5.8, the measurement of certain items of property, plant and equipment as referred to in note 5.4 at revalued amounts and recognition of certain employee retirement benefits as referred to in note 5.2 at present value. In these consolidated financial statements, except for the cash flow statement, all the transactions have been accounted for on accrual basis.
2.3 Functional and presentational currency
These consolidated financial statements are presented in Pakistan Rupees which is also the Group’s functional currency. All financial information presented in Pakistan Rupees has been rounded to the nearest thousand of rupees, unless otherwise indicated.
Notes to the consolidated financial statementsFor the year ended 30 June 2019
3 USE OF ESTIMATES AND JUDGMENTS
The preparation of consolidated financial statements in conformity with approved accounting standards requires management to make judgments, estimates and assumptions that affect the application of policies and reported amounts of assets and liabilities, income and expenses. The estimates and associated assumptions and judgments are based on historical experience and various other factors that are believed to be reasonable under the circumstances, the result of which form the basis of making the judgments about carrying values of assets and liabilities that are not readily apparent from other sources. Actual results may differ from these estimates.
The estimates and underlying assumptions are reviewed on an ongoing basis. Revision to accounting estimates are recognized in the period in which the estimate is revised, if the revision affects only that period, or in the period of revision and future periods if the revision affects both current and future periods.
The areas where various assumptions and estimates are significant to Group’s financial statements or where judgments were exercised in application of accounting policies are as follows:
- Employee retirement benefits 5.2- Taxation 5.3- Residual values and useful lives of depreciable assets 5.4- Impairment 5.8- Provisions 5.16- Contingent liabilities 5.24
4 Standards, interpretations and amendments to published approved International Financial Reporting Standards that are not yet effective:
4.1 The following International Financial Reporting Standards (IFRS Standards) as notified under the Companies Act, 2017 and the amendments and interpretations thereto will be effective for accounting periods beginning on or after 01 July 2019:
• IFRIC 23 ‘Uncertainty over Income Tax Treatments’ (effective for annual periods beginning on or after 01 January 2019) clarifies the accounting for income tax when there is uncertainty over income tax treatments under IAS 12. The interpretation requires the uncertainty over tax treatment be reflected in the measurement of current and deferred tax. The application of interpretation is not likely to have an impact on Group’s consolidated financial statements.
• IFRS 16 ‘Leases’ (effective for annual period beginning on or after 01 January 2019). IFRS 16 replaces existing leasing guidance, including IAS 17 ‘Leases’, IFRIC 4 ‘Determining whether an Arrangement contains a Lease’, SIC-15 ‘Operating Leases- Incentives’ and SIC-27 ‘Evaluating the Substance of Transactions Involving the Legal Form of a Lease’. IFRS 16 introduces a single, on-balance sheet lease accounting model for lessees. A lessee recognizes a right-of-use asset representing its right to use the underlying asset and a lease liability representing its obligation to make lease payments. There are recognition exemptions for short-term leases and leases of low-value items. Lessor accounting remains similar to the current standard i.e. lessors continue to classify leases as finance or operating leases. The management is in the process of analyzing the potiential impacts on adoption of this standard.
• Amendment to IFRS 9 ‘Financial Instruments’ – Prepayment Features with Negative Compensation (effective for annual periods beginning on or after 1 January 2019). For a debt instrument to be eligible for measurement at amortized cost or FVOCI, IFRS 9 requires its contractual cash flows to meet the SPPI criterion – i.e. the cash flows are ‘solely payments of principal and interest’. Some prepayment options could result in the party that triggers the early termination receiving compensation from the other party (negative compensation). The amendment allows that financial assets containing prepayment features with negative compensation can be measured at amortized cost or at fair value through other comprehensive income (FVOCI) if they meet the other relevant requirements of IFRS 9. The application of amendment is not likely to have an impact on Group’s consolidated financial statements.
Notes to the consolidated financial statementsFor the year ended 30 June 2019
1716 2019 Annual Report
Fin
anci
al s
tate
men
t

• Amendment to IAS 28 ‘Investments in Associates and Joint Ventures’ - Long Term Interests in Associates and Joint Ventures (effective for annual period beginning on or after 01 January 2019). The amendment will affect companies that finance such entities with preference shares or with loans for which repayment is not expected in the foreseeable future (referred to as long-term interests or ‘LTI’). The amendment and accompanying example state that LTI are in the scope of both IFRS 9 and IAS 28 and explain the annual sequence in which both standards are to be applied. The amendments are not likely to have an impact on Group’s consolidated financial statements.
• Amendment to IFRS 3 ‘Business Combinations’ – Definition of a Business (effective for business combinations for which the acquisition date is on or after the beginning of annual period beginning on or after 01 January 2020). The IASB has issued amendments aiming to resolve the difficulties that arise when an entity determines whether it has acquired a business or a group of assets. The amendments clarify that to be considered a business, an acquired set of activities and assets must include, at a minimum, an input and a substantive process that together significantly contribute to the ability to create outputs. The amendments include an election to use a concentration test. The standard is effective for transactions in the future and therefore would not have an impact on past financial statements.
• Amendments to IAS 1 Presentation of Financial Statements and IAS 8 Accounting Policies, Changes in Accounting Estimates and Errors (effective for annual periods beginning on or after 01 January 2020). The amendments are intended to make the definition of material in IAS 1 easier to understand and are not intended to alter the underlying concept of materiality in IFRS Standards. In addition, the IASB has also issued guidance on how to make materiality judgments when preparing their general purpose financial statements in accordance with IFRS Standards.
• On 29 March 2018, the International Accounting Standards Board (the IASB) has issued a revised Conceptual Framework for Financial Reporting which is applicable immediately contains changes that will set a new direction for IFRS in the future.. The Conceptual Framework primarily serves as a tool for the IASB to develop standards and to assist the IFRS Interpretations Committee in interpreting them. It does not override the requirements of individual IFRSs and any inconsistencies with the revised Framework will be subject to the usual due process – this means that the overall impact on standard setting may take some time to crystallize. The companies may use the Framework as a reference for selecting their accounting policies in the absence of specific IFRS requirements. In these cases, companies should review those policies and apply the new guidance retrospectively as of 01 January 2020, unless the new guidance contains specific scope outs.
Annual Improvements to IFRS Standards 2015–2017 Cycle - the improvements address amendments to following approved accounting standards:
• IFRS 3 Business Combinations and IFRS 11 Joint Arrangement - the amendment aims to clarify the accounting treatment when a company increases its interest in a joint operation that meets the definition of a business. A company remeasures its previously held interest in a joint operation when it obtains control of the business. A company does not remeasure its previously held interest in a joint operation when it obtains joint control of the business.
• IAS 12 Income Taxes - the amendment clarifies that all income tax consequences of dividends (including payments on financial instruments classified as equity) are recognized consistently with the transaction that generates the distributable profits.
• IAS 23 Borrowing Costs - the amendment clarifies that a company treats as part of general borrowings any borrowing originally made to develop an asset when the asset is ready for its intended use or sale.
The above amendments are effective from annual period beginning on or after 01 January 2019 and are not likely to have an impact on Group’s consolidated financial statements.
Notes to the consolidated financial statementsFor the year ended 30 June 2019
5 SUMMARY OF SIGNIFICANT ACCOUNTING POLICIES
The significant accounting policies adopted in preparation of these consolidated financial statements are set out below. These policies have been consistently applied to all years presented, unless otherwise stated.
5.1 Change in accounting policy
The Group has adopted IFRS 15 ‘Revenue from Contracts with Customers’ and IFRS 9 ‘Financial Instruments’ from 01 July 2018 which are effective from annual periods beginning on or after 01 July 2018. Due to the transition methods chosen by the Group in applying these standards, comparative information throughout these financial statements has not been restated to reflect the requirements of these new standards. The details of new significant accounting policies adopted and the nature and effect of the changes to previous accounting policies are set out below:
5.1.1 IFRS 15 - Revenue from Contracts with Customers
IFRS 15 establishes a comprehensive framework for determining whether, how much and when revenue is recognized. It replaced IAS 18 Revenue, IAS 11 Construction Contracts and related interpretations. Under IFRS 15, revenue is recognized when a customer obtains control of the goods or services. Determining the timing of the transfer of control – at a point in time or over time requires judgment. The Group is manufacturing and sale of razors, razor blades, bikes and its spare parts, soaps, corrugated boxes along with other trading activities which generally include single performance obligation. Management has concluded that revenue from sale of goods be recognised at the point in time when control of the asset is transferred to the customer. The above is generally consistent with the timing and amounts of revenue the Group recognised in accordance with the previous standard, IAS 18. Therefore, the adoption of IFRS 15 which replaced IAS 18 Revenue, IAS 11 Construction Contracts and related interpretations, did not have an impact on the timing and amounts of revenue recognition of the Group except for the reclassification of freight cost previously disclosed in distribution cost to cost of sales. Accordingly, distribution cost of Rs. 362.38 million (2018: Rs. 290.19 million) have been reclassified to cost of sales. There was no adjustment required to beginning retained earnings on 01 July 2018 as a result of adopting the standard. This reclassification has no impact on the reported Earning per Share (“EPS”) of the corresponding year.
Similarly, the amounts received for future sale of goods were reclassified to ‘contract liabilities’ which were previously classified as “advances from customers”.
Impact on financial statements
As at 01 July 2018, contract liabilities were increased by Rs. 49.43 million and advance from customers decreased by the same amount.
5.1.2 IFRS 9 - Financial instruments
IFRS 9 replaced the provisions of IAS 39 ‘Financial Instruments: Recognition and Measurement’ that relates to the recognition. classification and measurement of financial assets and financial liabilities, derecognition of financial instruments, impairment of financial assets and hedge accounting. The details of new significant accounting policies adopted and the nature and effect of the changes to previous accounting policies are set out below:
As a result of the adoption of IFRS 9, the Group has adopted consequential amendments to IAS 1 Presentation of Financial Statements, which require impairment of financial assets to be presented in a separate line item in the consolidated statement of profit or loss. Previously, the Group’s approach was to include the impairment of trade receivables in distribution cost. Consequently, the Group reclassified impairment losses amounting to Rs. 9.02 million, recognised under IAS 39, from ‘distribution cost’ to ‘impairment loss on trade and other receivables’ in the consolidated statement of profit or loss for the year ended 30 June 2018.
Notes to the consolidated financial statementsFor the year ended 30 June 2019
1918 2019 Annual Report
Fin
anci
al s
tate
men
t

Additionally, the Group has adopted consequential amendments to IFRS 7 Financial Instruments: Disclosures that are applied to disclosures about 2018 but have not been generally applied to comparative information.
5.1.2.1 Classification and measurement of financial instruments
IFRS 9 largely retains the existing requirements in IAS 39 for the classification and measurement of financial liabilities. However, it eliminates the previous IAS 39 categories for financial assets of held to maturity, loans and receivables and available for sale. Under IFRS 9, on initial recognition, the Group classifies its financial assets in the following measurement categories:
- those to be measured subsequently at fair value either through Other Comprehensive Income (FVOCl), or through profit or loss (FVTPL); and
- those to be measured at amortised cost
The classification depends on the Group’s business model for managing the financial assets and the contractual terms of the cash flows.
A financial asset is measured at amortised cost if it meets both of the following conditions and is not designated as at fair value through profit or loss:
- It is held within business model whose objective is to hold assets to collect contractual cash flows; and
- Its contractual terms give rise on specified dates to cash flows that are solely payments of principal and interest on principal amount outstanding.
Financial assets at amortised cost are subsequently measured using the effective interest rate method. Interest income, foreign exchange gains and losses and impairment are recognised in statement of profit or loss. Any gain on derecognition is recognised in profit or loss.
Equity investments at fair value through profit or loss are measured at fair value. Net gains and losses and dividend income is recognised in statement of profit or loss account.
The adoption of IFRS 9 did not have any effect on the Group’s accounting policies related to financial liabilities.
5.1.2.2 Impact of change in classification and measurement of financial assets due to adoption of IFRS 9
The following table explain the original measurement categories under IAS 39 and the new measurement categories under IFRS 9 for each class of the Group’s financial assets as at 1st July 2018:
Notes to the consolidated financial statementsFor the year ended 30 June 2019
Financial AssetsOriginal classification
under IAS 39New classification
under IFRS 9Original carrying
AmountNew carrying
amount
(Rupees in ‘000)
Long term loans Loans and receivables Amortized cost 2,847 2,847
Deposits and others Loans and receivable Amortized cost 43,605 43,605
Trade debts Loans and receivables Amortized cost 1,035,898 1,035,898
Long term investment Available for sale FVOCI 1,555 1,555
Short term investments Held for trading FVTPL 462,484 462,484
Loan and advances Loans and receivables Amortized cost 1,329,571 1,329,571
Cash and bank balances Loans and receivables Amortized cost 1,118,210 1,118,210
Pursuant to the requirement of IFRS-9, accumulated impairment loss on available for sale investment of Rs. 7.04 million at 01 July 2018 previously recognized in profit and loss statement has been recorded in fair value reserve in Statement of Changes in Equity with corresponding effect in accumulated profit.
The accounting policies that apply to financial instruments are stated in note “5.21” to the consolidated financial statements.
5.1.2.3 Impairment of financial assets
The adoption of IFRS 9 has changed the Group’s impairment model by replacing the IAS 39 ‘incurred loss model’ with a forward looking ‘expected credit loss’ (ECL) model when assessing the impairment of financial assets in the scope of IFRS 9. IFRS 9 requires the Group to recognize ECLs for trade debts earlier than IAS 39. Cash and bank balances, long term loans to employees, deposits and other receivables are also subject to ECL but there is no or immaterial impairment for the current year.
Under IFRS 9, the losses allowances are measured on either of the following bases:
- 12 months ECLs: these are the ECLs that result from possible default events within the 12 months after the reporting date; and
- lifetime ECLs: these are ECLs that result from all possible default events over the expected life of a financial instrument
The Group applies the IFRS 9 simplified approach to measuring expected credit losses which uses a lifetime expected loss allowance for all trade and other receivables. Trade and other receivables are written off when there is no reasonable expectation of recovery. The move from an incurred loss model to an expected loss model has not had a significant impact on the financial position and / or financial performance of the Group.
Loss allowance on bank balances is measured at 12 months expected credit losses. Since they are short term in nature and there is no adverse change in credit rating of the banks where the balances are maintained, therefore no credit loss is expected on these balances.
5.2 Employee benefits
Defined contribution plans
The Group has maintained five contributory schemes for the employees, as below:
i) A recognized contributory provident fund scheme namely “Treet Corporation Limited - Group Employees Provident Fund” is in operation covering all permanent employees. Equal monthly contributions are made both by the Group and employees in accordance with the rules of the scheme at 10% of the basic salary.
ii) A recognized contributory fund scheme namely “Treet Corporation Limited - Group Employee Service Fund” is in operation which covers all permanent management employees. In accordance with the rules of the scheme, equal monthly contributions are made both by the Group and employees at 10% of basic salary from the date the employee gets permanent status. Additional contributions may be made by the Group for those employees who have at most 15 years of service remaining before reaching retirement age, however, employees can start their additional contribution above the threshold limit of 10% of the basic salary at any time.
Notes to the consolidated financial statementsFor the year ended 30 June 2019
2120 2019 Annual Report
Fin
anci
al s
tate
men
t
iii) A recognized contributory fund scheme namely “Treet Corporation Limited - Group Employees Benevolent Fund” in operation for the benefit of employees if the employee opts for the scheme. The contributions to the fund are made at 10% of employees basic salary on monthly basis by both employee and the employer. Periodic bonuses by the Group to all the employees in any year, not exceeding one month’s basic salary of an employee, is credited to his personal account in the Fund at the sole discretion of the Group.
iv) A unrecognized contributory fund scheme namely “Treet Corporation Limited - Group Employees Superannuation-II Fund” is in operation covering all permanent management employees. Equal monthly contributions are made both by the Group and employees in accordance with the rules of the scheme at 12% of the basic salary.
v) An unrecognized contributory fund scheme namely, “Treet Corporation Limited - Group Employees Housing Fund Scheme” is in operation covering permanent management employees with minimum five years of service with the Group. Equal contributions are made monthly both by the Group and employees in accordance with the rules of the Scheme at 20% of the basic pay.
Defined benefit plans
An approved funded gratuity scheme and a funded superannuation scheme is in operation for all employees with qualifying service periods of six months and ten years respectively. These are operated through “Treet Corporation Limited - Group Employees Gratuity Fund” and “Treet Corporation Limited - Group Employee Superannuation Fund”, respectively. The Group’s net obligation in respect of defined benefit plans is calculated separately for each plan by estimating the amount of future benefits that employees have earned in current and prior periods, discounting that amount and deducting the fair value of any plan assets.
The calculation of defined benefit obligation is performed annually by a qualified actuary using the ‘Projected Unit Credit Method’ and latest actuarial valuation has been carried out at 30 June 2019. When calculation results in a potential asset for the Group, the recognized asset is limited to the present value of economic benefits available in the form of refunds from the plan or reductions in future contributions to the plan.
Actual gains and losses arising from experience adjustments and changes in actuarial assumptions are charged to equity through other comprehensive income in the year in which they arise. Past service costs are recognized immediately in the profit or loss account. The main features of defined benefit schemes are mentioned in note 26.
Employee Stock Option Scheme
The Group operates an equity settled stock option scheme to be called ‘Treet Corporation Limited - Employees Stock Option Scheme, 2015’. The compensation committee (“committee”) of the Board of Directors (“Board”) evaluates the performance and other criteria of employees and recommends to the Board for grant of options. The Board on the recommendation of the committee, on its discretion, grants recommended options to employees. These options vest after a specified period subject to fulfilment of certain conditions as defined in the scheme. Upon vesting, employees are eligible to apply and secure allotment of Holding Company’s shares at a pre-determined price on the date of grant of options. The main features of the scheme are mentioned in note 27.
The grant date fair value of equity settled share based payments to employees, determined as option discount as allowed by Public Companies (Employee Stock Option Scheme) Rules 2001, is recognized as employee compensation expense on a straight line basis over the vesting period with a consequent credit to equity as employee stock option compensation reserve. The deferred employee stock option cost is shown as a deduction from employee stock option compensation reserve. Option discount means the excess of market price of the share at the date of grant of an option under a Scheme over exercise price of the option.
Notes to the consolidated financial statementsFor the year ended 30 June 2019

When an unvested option lapses by virtue of an employee not conforming to the vesting conditions after recognition of an employee compensation expense in the profit or loss account, such employee compensation expense is reversed in the profit or loss account equal to the amortized portion with a corresponding effect to employee stock option compensation reserve equal to the un amortized portion.
When a vested option lapses on expiry of the exercise period, employee compensation expense already recognized in the profit or loss is reversed with a corresponding reduction to employee stock option compensation reserve. When the options are exercised, employee stock option compensation reserve relating to these options is transferred to share capital and share premium. An amount equivalent to the face value of related shares is transferred to share capital. Any amount over and above the share capital is transferred to share premium.
5.3 Taxation
Current
Provision of current tax is based on the taxable income for the year determined in accordance with the prevailing law for taxation of income. The charge for current tax is calculated using prevailing tax rates or tax rates expected to apply to the profit for the year if enacted after taking into account tax credits, rebates and exemptions, if any. The charge for current tax also includes adjustments, where considered necessary, to provision for tax made in previous years arising from assessments framed during the year for such years.
Deferred
Deferred tax is recognized using the balance sheet liability method, on all temporary differences arising from differences between the carrying amount of assets and liabilities in the financial statements and the corresponding tax losses used in the computation of taxable profit. Deferred tax liabilities are recognized for all taxable temporary differences. Deferred tax assets are recognized for all deductible temporary differences and carry-forward of unused tax losses and tax credits, to the extent that it is probable that taxable profits will be available against which the deductible temporary differences, unused tax losses and tax credits can be utilized.
The carrying amount of all deferred tax assets is reviewed at each balance sheet date and reduced to the extent that it is no longer probable that sufficient taxable profits will be available to allow all or part of the deferred tax assets to be utilized.
Deferred tax assets and liabilities are measured at the tax rates that are expected to apply to the period when the asset is realized or the liability is settled, based on tax rates (and tax laws) that have been enacted or substantively enacted at the reporting date. In this regard, the effects on deferred taxation of the proportion of income that is subject to final tax regime is also considered in accordance with the treatment prescribed by the Institute of Chartered Accountants of Pakistan. Deferred tax is charged in the statement of profit or loss, except in the case of items charged to other comprehensive income or equity in which case it is included in other comprehensive income or equity.
5.4 Property, plant and equipment
Property, plant and equipment are carried at cost less accumulated depreciation and impairment loss, if any, except for freehold land and buildings on freehold land. Freehold land is stated at revalued amount carried out by independent valuers by reference to its current market price less impairment loss, if any. Buildings on freehold land is stated at revalued amount carried out by independent valuers by reference to its current market price less accumulated depreciation and impairment loss, if any. Any accumulated depreciation at the date of revaluation is eliminated against the gross carrying amount of the buildings, and the net amount is restated to the revalued amount of the buildings.
Notes to the consolidated financial statementsFor the year ended 30 June 2019
2322 2019 Annual Report
Fin
anci
al s
tate
men
t

Increases in the carrying amount arising on revaluation of property, plant and equipment are credited to surplus on revaluation of property, plant and equipment. Decreases that offset previous increases of the same assets are charged against this surplus, all other decreases are charged to statement of profit or loss. Each year the difference between depreciation based on the revalued carrying amount of the asset charged to the statement of profit or loss, and depreciation based on the asset’s original cost is transferred from ‘surplus on revaluation of property, plant and equipment’ to ‘equity’. All transfers to / from surplus on revaluation of property, plant and equipment are net of applicable deferred income tax.
Capitalization threshold
Following are the minimum threshold limits for capitalization of individual items:
Particulars Rupees
Building on free hold land 50,000
Plant and machinery 10,000
Office equipments 8,000
Furniture and fixture 10,000
Others 10,000
Depreciation is charged to statement of profit or loss, unless it is included in the carrying amount of another asset, on straight line method whereby cost of an asset is written off over its estimated useful lives given in note 6.1
Depreciation on additions to property, plant and equipment is charged from the day on which an asset is available for use till the day the asset is fully depreciated or disposed off. Assets, which have been fully depreciated, are retained in the books at a nominal value of Rupee 1. Where an impairment loss is recognized, the depreciation charge is adjusted in the future periods to allocate the assets revised carrying amount over its estimated useful life.
Depreciation methods, residual value and the useful life of assets are reviewed at each financial year end, and adjusted if impact on depreciation is significant.
Subsequent costs are included in the asset’s carrying amount or recognized as a separate asset, as appropriate, only when it is probable that future economic benefits associated with the item will flow to the Group and cost of the item can be measured reliably. All other repairs and maintenance costs are charged to statement of profit or loss as and when incurred.
On disposal or scrapping, the cost of the assets and the corresponding depreciation is adjusted and the resultant gain or loss is dealt with through the statement of profit or loss.
Capital work-in-progress
Capital work in progress is stated at cost, less any identified impairment loss. Capital work in progress represents expenditure on property, plant and equipment in the course of construction and installation. Transfers are made to relevant category of property, plant and equipment as and when assets are available for use.
5.5 Intangible assets
Intangible assets represent the cost of computer software (ERP system) and are stated at cost less accumulated amortization and any identified impairment loss. Subsequent expenditure is capitalised only when it increases the future economic benefits embodied in the specific asset to which it relates. All other expenditure is recognised in statement of profit or loss as incurred.
Notes to the consolidated financial statementsFor the year ended 30 June 2019

All intangibles are amortized over the period of four years on a straight line basis so as to write off the cost of an asset over its estimated useful life. Amortisation on additions to intangible assets is charged from the day on which an asset is available for use till the day the asset is fully amortized or disposed off.
5.6 Non-current assets held for sale
Non-current assets are classified as assets held for sale if it is highly probable that their carrying amount will be recovered principally through sale rather than through continuing use. They are stated at lower of carrying amount and fair value less costs to sell.
Once classified as held for sale, intangible assets and property, plant and equipment are no longer amortised or depreciated, and any equity accounted investee is no longer equity accounted.
5.7 Investments
Investments intended to be held for less than twelve months from the reporting date or to be sold to raise operating capital are included in current assets, all other investments are classified as non-current. Management determines the classification of its investments at the time of purchase depending on the purpose for which the investments are required and re-evaluates this classification on regular basis.
5.8 Impairment
Financial assets
The Group recognizes loss allowances for ECLs on:
- financial assets measured at amortized cost;
- debt investments measured at FVOCI; and
- contract asset
‘The Group measures loss allowances at an amount equal to lifetime ECLs, except for the following, which are measured at 12-month ECLs:
- debt securities that are determined to have low credit risk at the reporting date; and
-other debt securities and bank balances for which credit risk (i.e. the risk of default occurring over the expected life of the financial instrument) has not increased significantly since initial recognition.
12 month ECLs are the portion of ECLs that result from default events that are possible within the 12 months after the reporting date (or a shorter period if the expected life of the instrument is less than 12 months).
When determining whether the credit risk of a financial asset has increased significantly since initial recognition and when estimating ECLs, the Group considers reasonable and supportable information that is relevant and available without undue cost or effort. This includes both quantitative and qualitative information and analysis, based on the Group’s historical experience and informed credit assessment and including forward-looking information.
The Group assumes that the credit risk on a financial asset has increased significantly if it is more than past due for a reasonable period of time. Lifetime ECLs are the ECLs that result from all possible default events over the expected life of a financial instrument. 12-month ECLs are the portion of ECLs that result from default events that are possible within the 12 months after the reporting date (or a shorter period if the expected life of the instrument is less than 12 months). The maximum period considered when estimating ECLs is the maximum contractual period over which the Group is exposed to credit risk.
Notes to the consolidated financial statementsFor the year ended 30 June 2019
2524 2019 Annual Report
Fin
anci
al s
tate
men
t

Loss allowances for financial assets measured at amortised cost are deducted from the gross carrying amount of the assets.
The gross carrying amount of a financial asset is written off when the Group has no reasonable expectations of recovering of a financial asset in its entirety or a portion thereof. The Group individually makes an assessment with respect to the timing and amount of write-off based on whether there is a reasonable expectation of recovery. The Group expects no significant recovery from the amount written off.
Non-financial assets
The carrying amount of the Group’s non-financial assets, other than inventories and deferred tax assets are reviewed at each reporting date to determine whether there is any indication of impairment. If any such indication exists, then the asset’s recoverable amount is estimated. A cash-generating unit is the smallest identifiable asset group that generates cash flows that largely are independent from other assets and groups. The recoverable amount of an asset or cash generating unit is the greater of its value in use and its fair value less cost to sell. In assessing value in use, the estimated future cash flows are discounted to their present values using a pre-tax discount rate that reflects current market assessments of the time value of money and the risks specific to the asset or cash generating unit.
An impairment loss is recognized if the carrying amount of the assets or its cash generating unit exceeds its estimated recoverable amount. Impairment losses are recognized in the consolidated statement of profit or loss. Impairment losses recognized in respect of cash generating units are allocated first to reduce the carrying amount of any goodwill allocated to the cash-generating unit and then to reduce the carrying amounts of the other assets in the unit on a pro rata basis. Impairment losses recognized in prior periods are assessed at each reporting date for any indications that the loss has decreased or no longer exists. An impairment loss is reversed if there has been a change in the estimates used to determine the recoverable amount. An impairment loss is reversed only to that extent that the asset’s carrying amount after the reversal does not exceed the carrying amount that would have been determined, net of depreciation and amortization, if no impairment loss had been recognized.
5.10 Stores and spares
These are valued at the moving average cost except for items in transit, which are valued at invoice price and related expenses incurred upto the reporting date. The Group reviews the carrying amount of stores and spares on a regular basis and provision is made for obsolescence if there is any change in usage pattern and physical form of related stores and spares.
5.11 Stock-in-trade
Stock of raw materials, packing materials, work-in-process and finished goods is valued at lower of moving average cost and net realizable value, except for stock in transit which is valued at invoice price and related expenses. Cost in relation to work in process and finished goods includes direct production costs such as raw materials, consumables, labor and appropriate proportion of production overheads. Finished goods purchased for resale are valued at moving average cost of purchase and comprise of purchase price and other costs incurred in buying the material to its present location and condition.
Net realizable value signifies the estimated selling price in the ordinary course of business less estimated costs of completion and the estimated cost necessary to be incurred to make the sale.
5.12 Trade debts, loans, deposits and other receivables
These are classified at amoritzed cost and are initially recognized when they are orignated and measured at fair value of consideration receivable. These assets are written off when there is no reasonable expectation of recovery. Actual credit loss experience over past years is used to base the calculation of expected credit loss.
Notes to the consolidated financial statementsFor the year ended 30 June 2019

5.13 Cash and cash equivalents
Cash and cash equivalents are carried in the statement of financial position at amortized cost. For the purpose of cash flow statement, cash and cash equivalents comprise of cash in hand, current and deposit account balances with banks and outstanding balance of running finance facilities availed by the Group.
5.14 Borrowings
Borrowings are recognized initially at the proceeds received. Borrowings are subsequently stated at amortized cost, any difference between the proceeds (net of transaction costs) and the redemption value is recognized in the consolidated profit or loss over the period of the borrowings using the effective interest rate method. Finance costs are accounted for on accrual basis and are reported under accrued markup to the extent of the amount remaining unpaid.
Borrowings are classified as current liabilities unless the Group has an unconditional right to defer settlement of the liability for atleast twelve months after the reporting date.
5.15 Trade and other payables
Liabilities for trade and other amounts payable are carried at cost which is the fair value of the consideration to be paid in future for goods and services received whether or not billed to the Group.
5.16 Provisions
Provisions are recognized when the Group has a present legal or constructive obligation as a result of past events, it is probable that an outflow of resources embodying economic benefits will be required to settle the obligation, and a reliable estimate can be made of the amount of obligation. Provisions are reviewed at each reporting date and adjusted to reflect the current best estimate.
A provision for warranties is recognised when the underlying products or services are sold, based on historical data and a weighting of possible outcomes against their associated probabilities.
5.17 Foreign currency translation
Foreign currency transactions are translated into Pakistan Rupees which is the Group’s functional and presentation currency using the exchange rates approximating those prevailing at the date of the transaction. All monetary assets and liabilities in foreign currencies are translated into Pakistan Rupees using the exchange rate at the reporting date. Exchange gains and losses resulting from the settlement of such transactions and from the translations at the year end exchange rates of monetary assets and liabilities denominated in foreign currencies are recognized in statement of profit or loss. All non-monetary assets and liabilities are translated in Pakistan Rupees using the exchange rates prevailing at the date of transaction or at the date when the fair value was determined.
5.18 Revenue recognition
(i) Revenue from the sale of goods is recognized at the point in time when the performance obligations arising from the contract with a customer is satisfied and the amount of revenue that it expects to be entitled to can be determined. This usually occurs when control of the asset is transferred to the customer, which is when goods are delivered to the customer and revenue from sale of services is recognized over time.
Revenue is measured based on the consideration specified in a contract with a customer and excludes amounts collected on behalf of third parties. Revenue is disclosed net of returns, rebates, discounts and other allowances.
Notes to the consolidated financial statementsFor the year ended 30 June 2019
2726 2019 Annual Report
Fin
anci
al s
tate
men
t

(ii) Dividend income and entitlement of bonus shares are recognized when the right to receive is established.
(iii) Return on bank deposits, investments and interest on loans is accounted for on a time proportionate basis using the applicable rate of return / interest.
5.19 Contract liabilities
A contract liability is the obligation of the Group to transfer goods or services to a customer for which the Group has received consideration (or an amount of consideration is due) from the customer. If a customer pays consideration before the Group transfers goods or services to the customer, a contract liability is recognized when the payment is made or the payment is due (whichever is earlier). Contract liabilities are recognized as revenue when the Group performs under the contract. It also includes refund liabilities arising out of customers‘ right to claim amounts from the Group on account of contractual delays in delivery of performance obligations and incentive on target achievements.
5.20 Borrowing costs
General and specific borrowing costs directly attributable to the acquisition, construction or production of qualifying assets, which are assets that necessarily take a substantial period of time to get ready for their intended use or sale, are added to the cost of those assets, until such time as the assets are substantially ready for their intended use or sale. All other borrowing costs are recognized in profit or loss account in the period in which they are incurred.
5.21 Financial instruments
5.21.1 Recognition and initial measurement
All financial assets or financial liabilities are initially recognized when the Group becomes a party to the contractual provisions of the instrument.
A financial asset (unless it is a trade receivable without a significant financing component) or financial liability is initially measured at fair value plus, for an item not at FVTPL, transaction costs that are directly attributable to its acquisition or issue. A receivable without a significant financing component is initially measured at the transaction price.
5.21.2 Classification and subsequent measurement
Financial assets
On initial recognition, a financial asset is classified as measured at amortized cost, fair value through other comprehensive income (FVOCI) and fair value through profit or loss (FVTPL).
A financial asset is initially measured at fair value plus, for an item not at FVTPL, transaction costs that are directly attributable to its acquisition.
Financial assets are not reclassified subsequent to their initial recognition unless the Group changes its business model for managing financial assets, in which case all affected financial assets are reclassified on the first day of the first reporting period following the change in the business model.
Amortized cost
A financial asset is measured at amortized cost if it meets both of the following conditions and is not designated as at FVTPL:
Notes to the consolidated financial statementsFor the year ended 30 June 2019

- it is held within a business model whose objective is to hold assets to collect contractual cash flows; and
- its contractual terms give rise on specified dates to cash flows that are solely payments of principal and interest on the principal amount outstanding.
These assets are subsequently measured at amortized cost using the effective interest method. The amortized cost is reduced by impairment losses. Interest income, foreign exchange gains and losses and impairment are recognized in statement of profit or loss. Any gain or loss on derecognition is recognized in statement of profit or loss.
Financial assets measured at amortized cost comprise of cash and bank balances, deposits, trade debts and other receivables.
Debt Instrument - FVOCI
A debt investment is measured at FVOCI if it meets both of the following conditions and is not designated as at FVTPL:
-it is held within a business model whose objective is achieved by both collecting contractual cash flows and selling financial assets; and
- its contractual terms give rise on specified dates to cash flows that are solely payments of principal and interest on the principal amount outstanding.
These assets are subsequently measured at fair value. Interest income calculated using the effective interest method, foreign exchange gains and losses and impairment are recognized in statement of profit or loss. Other net gains and losses are recognized in OCI. On derecognition, gains and losses accumulated in OCI are reclassified to profit or loss. However, the Group has no such instrument at the reporting date.
Equity Instrument - FVOCI
On initial recognition of an equity investment that is not held for trading, the Group may irrevocably elect to present subsequent changes in the investment’s fair value in OCI. This election is made on an investment-by-investment basis.
These assets are subsequently measured at fair value. Dividends are recognized as income in profit or loss unless the dividend clearly represents a recovery of part of the cost of the investment. Other net gains and losses are recognized in OCI and are never reclassified to profit or loss.
Fair value through profit or loss (FVTPL)
All financial assets not classified as measured at amortized cost or FVOCI as described above are measured at FVTPL.
On initial recognition, the Group may irrevocably designate a financial asset that otherwise meets the requirements to be measured at amortized cost or at FVOCI as at FVTPL if doing so eliminates or significantly reduces an accounting mismatch that would otherwise arise.
These assets are subsequently measured at fair value. Net gains and losses, including any interest or dividend income, are recognized in profit or loss.
Financial assets – Business model assessment:
For the purposes of the assessment, ‘principal’ is defined as the fair value of the financial asset on initial recognition. ‘Interest’ is defined as consideration for the time value of money and for the credit risk associated with the principal amount outstanding during a particular period of time and for other basic lending risks and costs (e.g. liquidity risk and administrative costs), as well as a profit margin.
Notes to the consolidated financial statementsFor the year ended 30 June 2019
2928 2019 Annual Report
Fin
anci
al s
tate
men
t
In assessing whether the contractual cash flows are solely payments of principal and interest, the Group considers the contractual terms of the instrument. This includes assessing whether the financial asset contains a contractual term that could change the timing or amount of contractual cash flows such that it would not meet this condition. In making this assessment, the Group considers:
- contingent events that would change the amount or timing of cash flows;
- terms that may adjust the contractual coupon rate, including variable-rate
- prepayment and extension features; and
- terms that limit the Group’s claim to cash flows from specified assets (e.g. non-recourse features).
Financial liabilities
Financial liabilities are classified as measured at amortized cost or FVTPL. A financial liability is classified as at FVTPL if it is classified as held-for-trading, it is a derivative or it is designated as such on initial recognition. Financial liabilities at FVTPL are measured at fair value and net gains and losses, including any interest expense, are recognized in consolidated statement of profit or loss. Other financial liabilities are subsequently measured at amortized cost using the effective interest method. Interest expense and foreign exchange gains and losses are recognized in profit or loss. Any gain or loss on derecognition is also recognized in profit or loss.
Financial liabilities comprise trade and other payables, short term financing, unclaimed dividend and accrued markup.
5.21.3 Derecognition
Financial assets
The Group derecognizes a financial asset when the contractual rights to the cash flows from the financial asset expire, or it transfers the rights to receive the contractual cash flows in a transaction in which substantially all of the risks and rewards of ownership of the financial asset are transferred or in which the Group neither transfers nor retains substantially all of the risks and rewards of ownership and it does not retain control of the financial asset.
The Group might enter into transactions whereby it transfers assets recognized in its statement of financial position, but retains either all or substantially all of the risks and rewards of the transferred assets. In these cases, the transferred assets are not derecognized.
Financial libilities
The Group derecognizes a financial liability when its contractual obligations are discharged or cancelled, or expire. The Group also derecognizes a financial liability when its terms are modified and the cash flows of the modified liability are substantially different, in which case a new financial liability based on the modified terms is recognized at fair value. On derecognition of a financial liability, the difference between the carrying amount extinguished and the consideration paid (including any non-cash assets transferred or liabilities assumed) is recognized in statement of profit or loss.
5.22 Research and development costs
Research and development costs are charged to profit or loss account as and when incurred.
5.23 Dividends
Distribution of Group`s dividend to the shareholders is recognized as a liability in the period in which the dividends are approved by Board of Directors.
Notes to the consolidated financial statementsFor the year ended 30 June 2019

5.24 Contingent liabilities
A contingent liability is disclosed when:
- There is a possible obligation that arises from past events and whose existence will be confirmed only by the occurrence or non-occurrence of one or more uncertain future events not wholly within the control of the Group; or
- There is present obligation that arises from past events but it is not probable that an outflow of resources embodying economic benefits will be required to settle the obligation or the amount of the obligation cannot be measured with sufficient reliability.
5.25 Segment reporting
Operating segments are reported in a manner consistent with the internal reporting provided to the chief operating decision maker. The chief operating decision maker, who is responsible for allocating resources and assessing performance of the operating segments, has been identified as the Board of Directors of the Group that make strategic decisions.
Segment results, asset and liabilities include items directly attributable to segment as well as those that can be allocated on reasonable basis. Segment assets consists primarily of stores and spares, stock in trade and trade debts. Segment liabilities consist of operating liabilities and exclude items such as taxation and corporate.
6 PROPERTY, PLANT AND EQUIPMENT
Note 2019 2018(Rupees in thousand)
Operating fixed assets 6.1 13,809,237 10,661,782
Capital work in progress 6.2 3,872,203 2,626,884
17,681,440 13,288,666
Notes to the consolidated financial statementsFor the year ended 30 June 2019
3130 2019 Annual Report
Fin
anci
al s
tate
men
t

6.1
Pro
pert
y, p
lant
and
equ
ipm
ent
Ann
ual
rate
of
depr
ecia
tion
Cos
t/ re
valu
ed
amou
nt a
s at
01 J
uly
2018
Rev
alua
tion
surp
lus
durin
g th
e ye
ar
Add
ition
s/(D
elet
ions
)
Cos
t/ re
valu
ed
amou
nt a
s at
30
Jun
e 20
19
Acc
umul
ated
depr
ecia
tion
as a
t0
1 Jul
y 20
18
Dep
reci
atio
n ch
arge
/ (d
elet
ions
) for
th
e ye
ar
Acc
umul
ated
depr
ecia
tion
as a
t3
0 J
une
2019
Boo
k va
lue
as a
t3
0 J
une
2019
%--
----
----
----
----
----
----
----
----
----
----
(Rup
ees
in th
ousa
nd)-
----
----
----
----
----
----
----
----
----
---
Ow
ned
Free
hold
land
- 2
,53
4,5
71
3,2
54,0
13
33
,36
7 5
,76
0,9
31
- -
- 5
,76
0,9
31
(61,0
20)
Bui
ldin
g on
free
hold
land
5 4
,08
1,214
16
1,76
1 8
9,8
79
4,3
32,
854
2
01,3
10
218
,76
4
420
,074
3
,912
,78
0
- -
Bui
ldin
gs o
n le
aseh
old
land
10 4
,79
1 -
- 4
,79
1 3
,115
24
0
3,3
55
1,4
36
- -
Pla
nt a
nd m
achi
nery
10 5
,171,4
24
- 19
3,18
5 5
,36
4,0
59
1,21
4,5
92
359
,673
1,
573
,715
3
,79
0,3
44
(550
) (5
50)
Furn
iture
and
equ
ipm
ent
10 -
25 16
5,3
12
- 7
3,2
16
23
6,2
32
75,
88
9
21,8
70
96
,33
3
139
,89
9
(2,2
96
) (1
,426
)
Vehi
cles
20 3
59,11
4
- 8
6,6
52
39
5,24
9
159
,73
8
67,
38
7 19
1,40
2 2
03
,847
(50
,517
) (3
5,72
3)
2019
12,3
16,4
26
3,4
15,7
74
476
,29
9
16,0
94
,116
1,
654
,64
4
66
7,9
34
2
,28
4,8
79
13,8
09
,237
(114
,38
3)
(37,
69
9)
Ann
ual
rate
of
depr
ecia
tion
Cos
t/ re
valu
ed
amou
nt a
s at
01 J
uly
2017
Rev
alua
tion
surp
lus
durin
g th
e ye
ar
Add
ition
s/(D
elet
ions
)
Cos
t/ re
valu
ed
amou
nt a
s at
30 J
une
2018
Acc
umul
ated
depr
ecia
tion
as a
t0
1 Jul
y 20
17
Dep
reci
atio
n ch
arge
/ (d
elet
ions
) for
th
e ye
ar
Acc
umul
ated
depr
ecia
tion
as a
t30
Jun
e 20
18
Boo
k va
lue
as a
t30
Jun
e 20
18
%--
----
----
----
----
----
----
----
----
----
----
(Rup
ees
in th
ousa
nd)-
----
----
----
----
----
----
----
----
----
---
Ow
ned
Free
hold
land
- 2
,534
,571
-
- 2
,534
,571
-
- -
2,5
34,5
71
Bui
ldin
g on
free
hold
land
5 5
81,2
14
- 3
,50
0,0
00
4
,081
,214
11
2,86
5 8
8,44
5 2
01,3
10
3,8
79,9
04
Bui
ldin
gs o
n le
aseh
old
land
10 4
,791
-
- 4
,791
2
,875
2
40
3,11
5 1,
676
Pla
nt a
nd m
achi
nery
10 1,
812,
463
- 3
,361
,584
5
,171,4
24
1,0
31,6
86
185,
529
1,21
4,59
2 3
,956
,832
(2,6
23)
(2,6
23)
Furn
iture
and
equ
ipm
ent
10 -
25 11
8,63
2 -
47,
858
165,
312
62,
168
14,6
75
75,
889
89,
423
(1,17
8) (9
54)
Vehi
cles
20 2
83,8
15
- 13
0,0
56
359
,114
141,6
05
56,
634
159,
738
199,
376
(54,
757)
(38,
501)
2018
5,3
35,4
86
- 7
,039
,498
12
,316
,426
1,
351,1
99
345
,523
1,
654,
644
10,6
61,7
82
(58,
558)
(42,
078)
Notes to the consolidated financial statementsFor the year ended 30 June 2019

Notes to the consolidated financial statementsFor the year ended 30 June 2019
6.1.1 Particulars of immovable property (i.e. land and building) in the name of Holding Company and its subsidiaries are as follows:
Location Usage of Immovable Property
Total area (acres)
Covered Area (Square Feet)
Main Haali / Link Road Hyderabad Manufacturing facility 5.49 98,696
72-b Main Peco Road, Kot Lakhpat Lahore Head Office and Manufacturing facility
14.06 231,440
Warehouse land, 14 Km Multan Road, Lahore Warehouse 1.50 10,752
Hadbast Mouza Pandu, Tehsil Model Town Warehouse 1.00 N/A
09-KM Thokar Niaz Baig, Lahore Education campus 15.17 348,480
Raiwind Road, Lahore Proposed expansion project 2.31 N/A
Faisalabad Industrial Estate, Sahianwala Faisalabad
Manufacturing facility 49.19 367,184
05 Km off Ferozpur Road, Gajju Matta, Kacha Road, Lahore
Manufacturing facility and warehouse
13.19 142,403
2019 2018
Note (Rupees in thousand)
6.1.2 Depreciation charge for the year has been allocated as follows:
Cost of goods sold - blades 34.1 185,930 156,432
Cost of goods sold - soaps 34.2 2,809 2,773
Cost of goods sold - corrugated boxes 34.3 19,062 18,937
Cost of goods sold - bikes 34.4 2,044 2,044
Cost of goods sold - battery 34.5 390,521 107,148
Cost of goods sold - pharmaceutical products 34.6 7,778 6,823
608,144 294,157
Batteries (trail run cost) - 2,486
Administrative expenses 35 42,127 33,156
Distribution cost 36 17,664 15,724
667,935 345,523
6.1.3 Had the assets not been revalued, the net book value of specific classes of operating fixed assets would have amounted to:
Freehold land 1,402,249 1,385,126
Buildings 3,546,680 3,702,378
4,948,929 5,087,504
3332 2019 Annual Report
Fin
anci
al s
tate
men
t
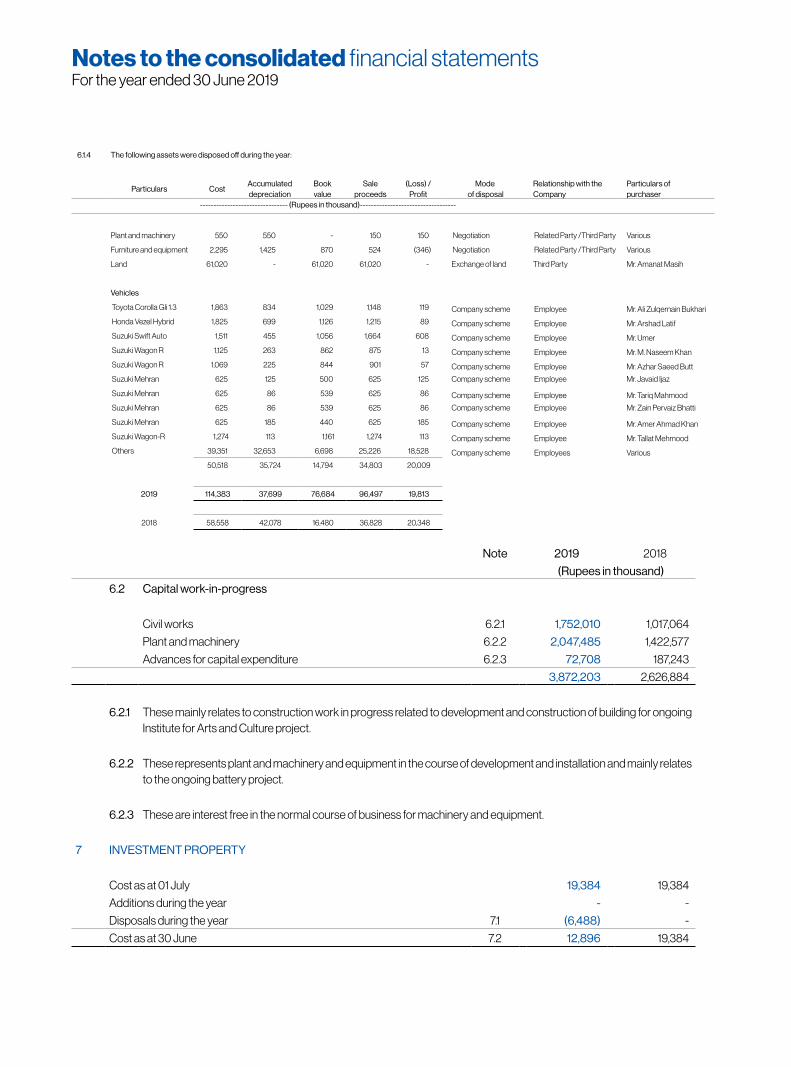
Note 2019 2018
(Rupees in thousand)
6.2 Capital work-in-progress
Civil works 6.2.1 1,752,010 1,017,064
Plant and machinery 6.2.2 2,047,485 1,422,577
Advances for capital expenditure 6.2.3 72,708 187,243
3,872,203 2,626,884
6.2.1 These mainly relates to construction work in progress related to development and construction of building for ongoing Institute for Arts and Culture project.
6.2.2 These represents plant and machinery and equipment in the course of development and installation and mainly relates to the ongoing battery project.
6.2.3 These are interest free in the normal course of business for machinery and equipment.
7 INVESTMENT PROPERTY
Cost as at 01 July 19,384 19,384
Additions during the year - -
Disposals during the year 7.1 (6,488) -
Cost as at 30 June 7.2 12,896 19,384
6.1.4 The following assets were disposed off during the year:
Particulars CostAccumulated depreciation
Bookvalue
Saleproceeds
(Loss) / Profit
Mode of disposal
Relationship with the Company
Particulars of purchaser
-------------------------------- (Rupees in thousand)-----------------------------------
Plant and machinery 550 550 - 150 150 Negotiation Related Party /Third Party Various
Furniture and equipment 2,295 1,425 870 524 (346) Negotiation Related Party /Third Party Various
Land 61,020 - 61,020 61,020 - Exchange of land Third Party Mr. Amanat Masih
Vehicles
Toyota Corolla Gli 1.3 1,863 834 1,029 1,148 119 Company scheme Employee Mr. Ali Zulqernain Bukhari
Honda Vezel Hybrid 1,825 699 1,126 1,215 89 Company scheme Employee Mr. Arshad Latif
Suzuki Swift Auto 1,511 455 1,056 1,664 608 Company scheme Employee Mr. Umer
Suzuki Wagon R 1,125 263 862 875 13 Company scheme Employee Mr. M. Naseem Khan
Suzuki Wagon R 1,069 225 844 901 57 Company scheme Employee Mr. Azhar Saeed Butt
Suzuki Mehran 625 125 500 625 125 Company scheme Employee Mr. Javaid Ijaz
Suzuki Mehran 625 86 539 625 86 Company scheme Employee Mr. Tariq Mahmood
Suzuki Mehran 625 86 539 625 86 Company scheme Employee Mr. Zain Pervaiz Bhatti
Suzuki Mehran 625 185 440 625 185 Company scheme Employee Mr. Amer Ahmad Khan
Suzuki Wagon-R 1,274 113 1,161 1,274 113 Company scheme Employee Mr. Tallat Mehmood
Others 39,351 32,653 6,698 25,226 18,528 Company scheme Employees Various
50,518 35,724 14,794 34,803 20,009
2019 114,383 37,699 76,684 96,497 19,813
2018 58,558 42,078 16,480 36,828 20,348
Notes to the consolidated financial statementsFor the year ended 30 June 2019

7.1 11 Kanals 1 Marla at 34 Km Ferozepur Road carried at cost amounting to Rs. 6.49 million has been disposed of against proceeds amounting to Rs. 6.59 million.
7.2 This represent 14 Kanals and 5 Marlas located at 4 km Kacha Road Mouza Kacha Tehsil Model Town, Lahore, having fair value of Rs. 13.50 million.
The value of investment property was determined by approved external, independent property valuer i.e. Muneeb State and Builders. The most significant input into this valuation is market value. The valuation is considered to be Level 3 in the fair value hierarchy due to non-observable inputs used in valuation. The different levels have been mentioned in note 45.5.
Note 2019 2018
(Rupees in thousand)
8 INTANGIBLE ASSETS
Oracle computer software and implementation 8.1 21,704 30,080
Goodwill acquired on acquisition 8.2 133,613 133,613
155,317 163,693
8.1 Oracle computer software and implementation
Intangible asset represents computer software (ERP system).
Cost
As at 01 July 41,882 41,110
Addition during the year - 772
Accumulated amortisation
As at 01 July (11,802) (3,426)
Amortisation for the year (8,376) (8,376)
Balance at 30 June 21,704 30,080
Rate of amortisation 20% 20%
8.2 Goodwill acquired on acquisition
This goodwill represents the excess of purchase consideration paid by the Group for acquisition of the Renacon Pharma Limited (RPL) over Group’s interest in the fair value of identifiable net assets of the RPL at date of acquisition.
The recoverable amount of goodwill has been tested for impairment as at 30 June 2019 based on value in use in accordance with IAS 36 “Impairment of Assets”. The recoverable amount was calculated on the basis of five years business plan which includes a comprehensive analysis of existing operational deployments of the Company along with strategic business plans and business growth. The value in use calculations are based on cash flow projections derived from aforesaid business plan, which have been extrapolated beyond five years, by using a growth rate of 4%. The cash flows are discounted using a discount rate of 14.7% which is sensitive to discount rate and local inflation rates. Based on this calculation no impairment is required to be accounted for against the carrying amount of goodwill.
Notes to the consolidated financial statementsFor the year ended 30 June 2019
3534 2019 Annual Report
Fin
anci
al s
tate
men
t

Note 2019 2018
(Rupees in thousand)
9 LONG TERM INVESTMENTS
Available for sale - at cost 9.1 1,555 1,555
Investment in associate 9.2 476,742 456,148
478,297 457,703
9.1 Fair value through OCI
Techlogix International Limited - unquoted
748,879 (2018: 748,879) fully paid ordinary shares of par value of USD 0.00015.
Equity held: 0.71 % (2018: 0.71 %)
Investment classified as available for sale - 1,555
Investment classified as fair value through other
comprehensive income - note - 5.1.2 1,555 -
1,555 1,555
9.1.1 Techlogix International Limited (“Techlogix”) is a Bermuda registered company with the beneficial owners, Salman Akhtar and Kewan Khawaja of United States of America. Techlogix is engaged in providing specialized technical consultancy and software development services to national and international clients. The Group intends to hold this investment of USD 112 (2018: USD 112) over the long term and realise its returns. During the year, the Group received a return amounting to Rs. Nil (2018: Rs. 0.18 million).
9.2 Investment in associate
Loads Limited- quoted
18,895,057 (2018: 18,895,057) fully paid ordinary
shares of Rs. 10 each
Equity held: 12.49% (2018: 12.49%) 9.2.1 446,753 456,148
Chief Executive Officer - Munir K. Bana
Global Assets (Private) Limited
3,000,000 fully paid ordinary shares
shares of Rs. 10 each
Equity held: 28.74% 9.2.2 29,989 -
Chief Executive Officer - Syed Shahid Ali
476,742 456,148
Notes to the consolidated financial statementsFor the year ended 30 June 2019

2019 2018
(Rupees in thousand)
9.2.1 In equity instrument of associate
Cost 162,529 162,529
Brought forward amounts of post acquisition reserves and profits recognized directly in consolidated statement of profit or loss 293,619 262,541
456,148 425,070
Share of profit for the year 8,958 30,618
- before taxation (14,579) (10,436)
- provision for taxation (5,621) 20,182
Share of other comprehensive loss (3,774) (3,845)
Dividend received during the year - (17,177)
Group’s share of post acquisition change in net assets of associate - 31,918
Balance as at 30 June 446,753 456,148
446,753 456,148
The Group’s investment in Load Limited is less than 20% but it is considered to be an associate as per the requirements of IAS - 28 “Investments in Associates” because the Group has significant influence over its financial and operating policies through representation on the Board.
Loads Limited (“Loads”) was incorporated in Pakistan on 01 January 1979 as a private limited Company. On 19 December 1993, Loads was converted to unlisted public Company and subsequently on 01 November 2016, the shares of the Loads were listed on Pakistan Stock Exchange . The registered office of the Loads is situated at Plot No. 23, Sector 19, Korangi Industrial Area, Karachi. The principal activity of the Loads is to manufacture and sale of radiators, exhaust systems and other components for automotive industry. The activities of the Loads are largely independent of the Holding Company. The following table summarizes the financial information of Loads as included in its own consolidated audited financial statements and the Group’s share in the results. The table also reconciles the summarized financial information to the carrying amount of the Group’s interest in its associate.
Percentage interest held 12.49% 12.49%
Non-current assets 4,883,817 2,304,604
Current assets 2,839,070 3,284,246
Non-current liabilities (248,786) (96,339)
Current liabilities (3,897,965) (1,841,168)
Net assets (100%) 3,576,136 3,651,343
Group’s share of net assets 446,753 456,148
Carrying amount of interest in associate 446,753 456,148
Revenue 5,709,735 4,889,664
(Loss) / profit from operations (44,994) 161,557
Other comprehensive loss (30,213) (30,783)
Total comprehensive income (100%) (75,207) 130,774
Group's share of total comprehensive (loss) / income (9,395) 16,337
Notes to the consolidated financial statementsFor the year ended 30 June 2019
3736 2019 Annual Report
Fin
anci
al s
tate
men
t
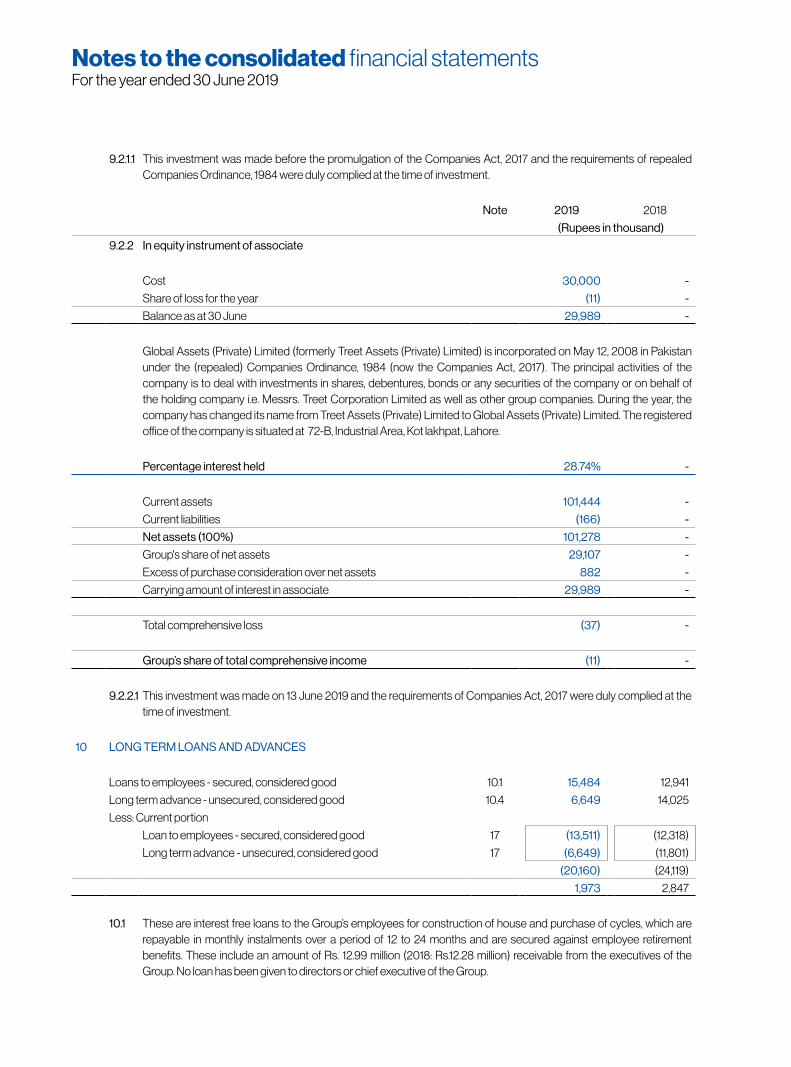
9.2.1.1 This investment was made before the promulgation of the Companies Act, 2017 and the requirements of repealed Companies Ordinance, 1984 were duly complied at the time of investment.
Note 2019 2018
(Rupees in thousand)
9.2.2 In equity instrument of associate
Cost 30,000 -
Share of loss for the year (11) -
Balance as at 30 June 29,989 -
Global Assets (Private) Limited (formerly Treet Assets (Private) Limited) is incorporated on May 12, 2008 in Pakistan under the (repealed) Companies Ordinance, 1984 (now the Companies Act, 2017). The principal activities of the company is to deal with investments in shares, debentures, bonds or any securities of the company or on behalf of the holding company i.e. Messrs. Treet Corporation Limited as well as other group companies. During the year, the company has changed its name from Treet Assets (Private) Limited to Global Assets (Private) Limited. The registered office of the company is situated at 72-B, Industrial Area, Kot lakhpat, Lahore.
Percentage interest held 28.74% -
Current assets 101,444 -
Current liabilities (166) -
Net assets (100%) 101,278 -
Group's share of net assets 29,107 -
Excess of purchase consideration over net assets 882 -
Carrying amount of interest in associate 29,989 -
Total comprehensive loss (37) -
Group’s share of total comprehensive income (11) -
9.2.2.1 This investment was made on 13 June 2019 and the requirements of Companies Act, 2017 were duly complied at the time of investment.
10 LONG TERM LOANS AND ADVANCES
Loans to employees - secured, considered good 10.1 15,484 12,941
Long term advance - unsecured, considered good 10.4 6,649 14,025
Less: Current portion
Loan to employees - secured, considered good 17 (13,511) (12,318)
Long term advance - unsecured, considered good 17 (6,649) (11,801)
(20,160) (24,119)
1,973 2,847
10.1 These are interest free loans to the Group’s employees for construction of house and purchase of cycles, which are repayable in monthly instalments over a period of 12 to 24 months and are secured against employee retirement benefits. These include an amount of Rs. 12.99 million (2018: Rs.12.28 million) receivable from the executives of the Group. No loan has been given to directors or chief executive of the Group.
Notes to the consolidated financial statementsFor the year ended 30 June 2019
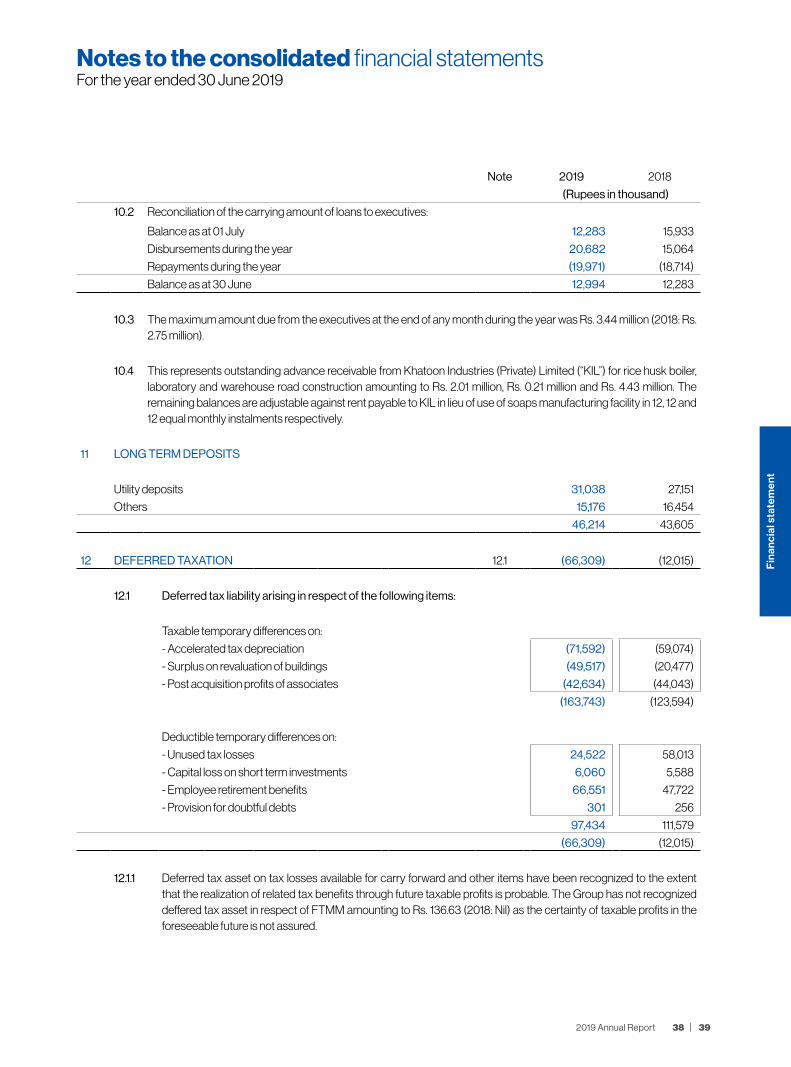
12 DEFERRED TAXATION 12.1 (66,309) (12,015)
12.1 Deferred tax liability arising in respect of the following items:
Taxable temporary differences on:
- Accelerated tax depreciation (71,592) (59,074)
- Surplus on revaluation of buildings (49,517) (20,477)
- Post acquisition profits of associates (42,634) (44,043)
(163,743) (123,594)
Deductible temporary differences on:
- Unused tax losses 24,522 58,013
- Capital loss on short term investments 6,060 5,588
- Employee retirement benefits 66,551 47,722
- Provision for doubtful debts 301 256
97,434 111,579
(66,309) (12,015)
12.1.1 Deferred tax asset on tax losses available for carry forward and other items have been recognized to the extent that the realization of related tax benefits through future taxable profits is probable. The Group has not recognized deffered tax asset in respect of FTMM amounting to Rs. 136.63 (2018: Nil) as the certainty of taxable profits in the foreseeable future is not assured.
Note 2019 2018
(Rupees in thousand)
10.2 Reconciliation of the carrying amount of loans to executives:
Balance as at 01 July 12,283 15,933
Disbursements during the year 20,682 15,064
Repayments during the year (19,971) (18,714)
Balance as at 30 June 12,994 12,283
10.3 The maximum amount due from the executives at the end of any month during the year was Rs. 3.44 million (2018: Rs. 2.75 million).
10.4 This represents outstanding advance receivable from Khatoon Industries (Private) Limited (“KIL”) for rice husk boiler, laboratory and warehouse road construction amounting to Rs. 2.01 million, Rs. 0.21 million and Rs. 4.43 million. The remaining balances are adjustable against rent payable to KIL in lieu of use of soaps manufacturing facility in 12, 12 and 12 equal monthly instalments respectively.
11 LONG TERM DEPOSITS
Utility deposits 31,038 27,151
Others 15,176 16,454
46,214 43,605
Notes to the consolidated financial statementsFor the year ended 30 June 2019
3938 2019 Annual Report
Fin
anci
al s
tate
men
t

Note 2019 2018
(Rupees in thousand)
12.1.2 Movement in deferred tax asset / (liability) is as follows:
Balance as at 01 July (12,015) 25,109
Recognized in statement of profit or loss:
- Accelerated tax depreciation (12,517) (1,928)
- Surplus on revaluation of buildings 2,341 1,836
- Capital loss on short term investments 472 (5,901)
- Unused tax losses (33,491) (32,574)
- Post acquisition reserves of associates 1,409 (6,437)
- Provision for doubtful debts 44 32
(41,742) (44,972)
Recognized in other comprehensive income / equity:
- Net off against Re-measurement of employee retirement benefits recognized 18,829 11,717
- Effect of change in tax rate on account of surplus on revaluation of buildings (50) 919
- Net off against the surplus on revaluation of building (31,331) -
- Group’s share of post acquisition changein net assets of associate - (4,788)
Balance as at 30 June (66,309) (12,015)
13 STORES AND SPARES
Stores 152,949 112,601
Spares 133,885 154,457
13.1&13.2 286,834 267,058
13.1 It includes provision for obsolete store items amounting to Rs. Nil (2018: Rs. 5.52 million).
13.2 It includes stores and spares in transit amounting to Rs. 8.02 million (2018: Rs. 17.15 million).
Notes to the consolidated financial statementsFor the year ended 30 June 2019

Notes to the consolidated financial statementsFor the year ended 30 June 2019
Note 2019 2018
(Rupees in thousand)
14 STOCK-IN-TRADE
Blades, razor and other trading operations:
Raw and packing material 14.1 666,974 395,318
Work in process 34.1 51,552 65,068
Finished goods 14.2 & 34.1 179,675 145,619
898,201 606,005
Battery
Raw and packing materials 14.1 874,418 513,851
Work in process 34.5 587,427 242,745
Finished goods 34.5 100,975 147,817
1,562,820 904,413
Soaps
Raw and packing materials 14.1 58,711 45,665
Work in process 34.2 - 547
Finished goods 34.2 53,097 42,980
111,808 89,192
Corrugated boxes
Raw and packing materials 14.1 134,982 220,011
Work in process 34.3 6,319 10,723
Finished goods 34.3 42,148 34,444
183,449 265,178
Bike
Raw and packing materials 14.1 38,647 42,439
Finished goods 34.4 7,070 5,680
45,717 48,119
Pharmaceutical products
Raw and packing materials 14.1 146,426 31,788
Work in process 34.6 675 675
Finished goods 34.6 7,887 5,300
154,988 37,763
2,956,983 1,950,670
14.1 It includes raw material in transit as follows:
Blades 135,970 38,643
Battery 190,156 256,147
Soaps - 22
Corrugated boxes - 21
Bike 2,697 7,537
Pharmaceutical products 12,028 12,028
340,851 314,398
14.2 The amount charged to consolidated statement of profit or loss on account of write down of finished goods to net realizable value amounts to Rs. 0.91 million (2018: 169.12). It also includes finished goods - chemicals in transit amounting to Rs. 7.36 million (2018: Rs. Nil).
4140 2019 Annual Report
Fin
anci
al s
tate
men
t
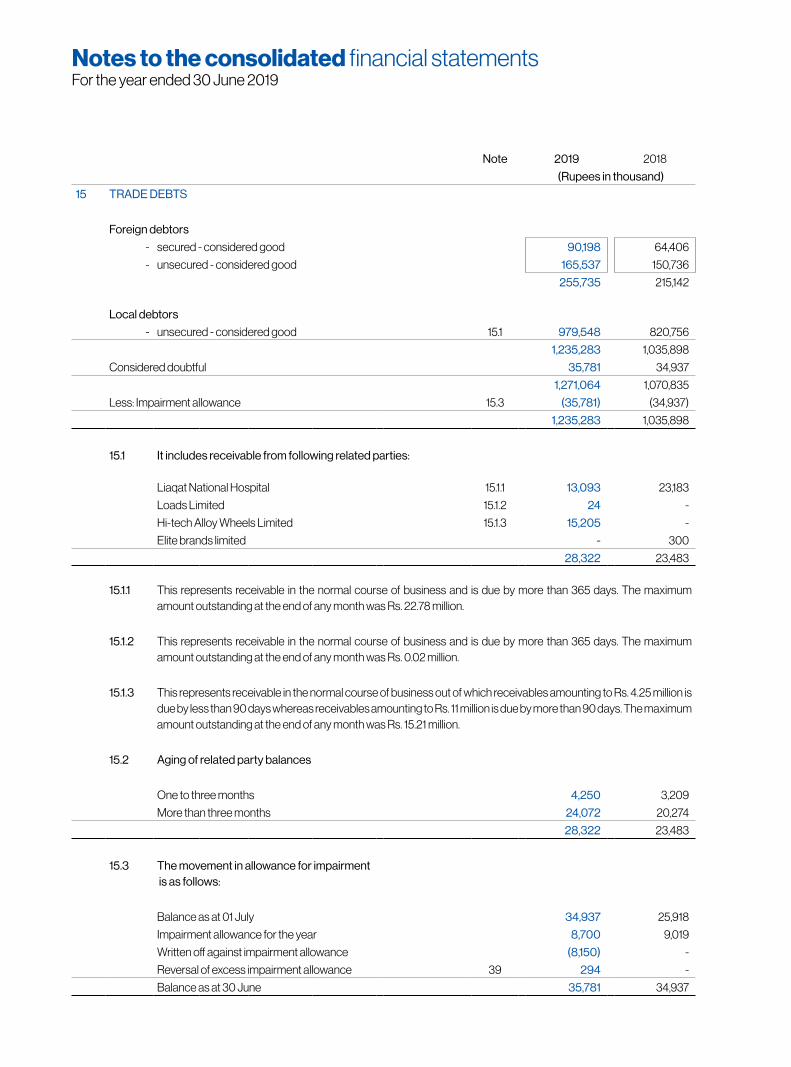
Note 2019 2018
(Rupees in thousand)
15 TRADE DEBTS
Foreign debtors
- secured - considered good 90,198 64,406
- unsecured - considered good 165,537 150,736
255,735 215,142
Local debtors
- unsecured - considered good 15.1 979,548 820,756
1,235,283 1,035,898
Considered doubtful 35,781 34,937
1,271,064 1,070,835
Less: Impairment allowance 15.3 (35,781) (34,937)
1,235,283 1,035,898
15.1 It includes receivable from following related parties:
Liaqat National Hospital 15.1.1 13,093 23,183
Loads Limited 15.1.2 24 -
Hi-tech Alloy Wheels Limited 15.1.3 15,205 -
Elite brands limited - 300
28,322 23,483
15.1.1 This represents receivable in the normal course of business and is due by more than 365 days. The maximum amount outstanding at the end of any month was Rs. 22.78 million.
15.1.2 This represents receivable in the normal course of business and is due by more than 365 days. The maximum amount outstanding at the end of any month was Rs. 0.02 million.
15.1.3 This represents receivable in the normal course of business out of which receivables amounting to Rs. 4.25 million is due by less than 90 days whereas receivables amounting to Rs. 11 million is due by more than 90 days. The maximum amount outstanding at the end of any month was Rs. 15.21 million.
15.2 Aging of related party balances
One to three months 4,250 3,209
More than three months 24,072 20,274
28,322 23,483
15.3 The movement in allowance for impairment is as follows:
Balance as at 01 July 34,937 25,918
Impairment allowance for the year 8,700 9,019
Written off against impairment allowance (8,150) -
Reversal of excess impairment allowance 39 294 -
Balance as at 30 June 35,781 34,937
Notes to the consolidated financial statementsFor the year ended 30 June 2019

Note 2019 2018
(Rupees in thousand)
16 SHORT TERM INVESTMENTS
Investments at fair value through profit or loss:
Listed equity securities 16.1 432,348 462,484 Mutual funds 3,000 -
435,348 462,484
Notes to the consolidated financial statementsFor the year ended 30 June 2019
16.1 Details of investment in listed equity securities / mutual funds are stated below:
Share / certificates Carrying value Market value
2019 2018 2019 2018 2019 2018
Number Number ---------------------(Rupees in thousand)---------------------
Sector / Companies
a) Banks
Silk Bank Limited 258,997,500 255,497,500 352,026 429,120 305,618 347,477
b) Textile
Sunrays Textiles Mills Limited 27,200 30,600 4,566 6,044 6,135 5,216
Shahtaj Textile Limited 868,400 868,400 69,463 115,002 84,113 69,463
Maqbool Textiles Mills Limited 894,500 894,500 37,828 27,641 36,451 37,828
Kohinoor Spinning Mills
Limited
- 856,000 - 2,551 - 2,500
c) Miscellaneous
Transmission Engineering Industries Limited
133,000 133,000 - - - -
IGI Holdings Limited 203 - 31 - 31 -
463,914 580,358 432,348 462,484
16.2 Investments (shares of Silk Bank Limited and Shahtaj Textile Limited) to the extent of Rs. 203.80 million (cost of Rs. 242.48 million) are pledged in favour or under lien of the trustee as security against Participation Term Certificates as referred to in note 25.
4342 2019 Annual Report
Fin
anci
al s
tate
men
t

Notes to the consolidated financial statementsFor the year ended 30 June 2019
Note 2019 2018
(Rupees in thousand)
17 LOANS, ADVANCES, DEPOSITS, PREPAYMENTS AND OTHER RECEIVABLES
Current portion of long term advances - unsecured, considered good 6,649 11,801
Current portion of loan to employees - secured, considered good 13,511 12,318
10 20,160 24,119
Advances to employees - secured, considered good 17.1 25,122 77,392
Advances to suppliers - unsecured, considered good 17.2 526,522 301,722
Margin deposits - Letter of credits 6,971 3,785
Security deposits 9,231 9,231
Prepayments 17.3 70,296 42,049
Advances to related parties / employee retirement funds - unsecured considered good
- Loads Limited 12,370 70
- IGI Insurance Limited - 127
- Service fund 239 -
- Superannuation Fund 360 1,161
- Gratuity Fund 3,000 20,369
- Employees Housing Fund 23,662 31,770
17.4 39,631 53,497
Balance with statutory authorities
- Export rebate 83,552 61,950
- Collector of customs - custom duty 42,017 149,287
- Advance income tax 643,116 569,167
- Sales tax 1,077,497 801,714
1,846,182 1,582,118
Workers profit participation fund 17.5 - 4,039
Receivable from broker against sale of investments 6,898 43,519
Other receivables 22,491 5,942
2,573,504 2,147,413
17.1 These are interest free advances to employees in respect of salary, medical and travelling expenses and are secured against employees retirement benefits. These include an aggregate amount of Rs. 5.09 million (2018: Rs. 7.76 million) receivable from executives of the Group. No amount is advance to CEO or directors of the Group.
17.2 These are interest free in the normal course of business.
17.3 Prepayments includes amount paid to IGI Insurance Limited (related party) of Rs. 16.26 million (2018: 18.48 million ).
17.4 These represent amounts receivable from related parties for reimbursement of expenses and purchase of goods or services under normal business trade as per the agreed terms and are interest free.
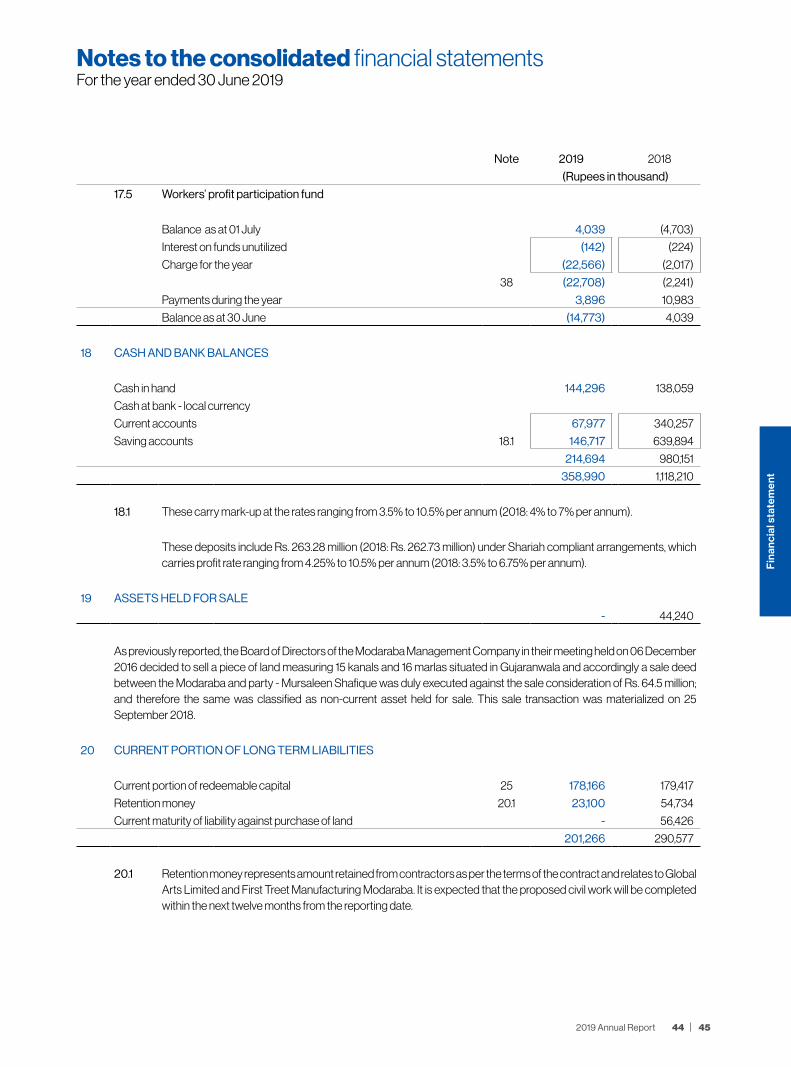
Note 2019 2018
(Rupees in thousand)
17.5 Workers’ profit participation fund
Balance as at 01 July 4,039 (4,703)
Interest on funds unutilized (142) (224)
Charge for the year (22,566) (2,017)
38 (22,708) (2,241)
Payments during the year 3,896 10,983
Balance as at 30 June (14,773) 4,039
18 CASH AND BANK BALANCES
Cash in hand 144,296 138,059
Cash at bank - local currency
Current accounts 67,977 340,257
Saving accounts 18.1 146,717 639,894
214,694 980,151
358,990 1,118,210
18.1 These carry mark-up at the rates ranging from 3.5% to 10.5% per annum (2018: 4% to 7% per annum).
These deposits include Rs. 263.28 million (2018: Rs. 262.73 million) under Shariah compliant arrangements, which carries profit rate ranging from 4.25% to 10.5% per annum (2018: 3.5% to 6.75% per annum).
19 ASSETS HELD FOR SALE
- 44,240
As previously reported, the Board of Directors of the Modaraba Management Company in their meeting held on 06 December 2016 decided to sell a piece of land measuring 15 kanals and 16 marlas situated in Gujaranwala and accordingly a sale deed between the Modaraba and party - Mursaleen Shafique was duly executed against the sale consideration of Rs. 64.5 million; and therefore the same was classified as non-current asset held for sale. This sale transaction was materialized on 25 September 2018.
20 CURRENT PORTION OF LONG TERM LIABILITIES
Current portion of redeemable capital 25 178,166 179,417
Retention money 20.1 23,100 54,734
Current maturity of liability against purchase of land - 56,426
201,266 290,577
20.1 Retention money represents amount retained from contractors as per the terms of the contract and relates to Global Arts Limited and First Treet Manufacturing Modaraba. It is expected that the proposed civil work will be completed within the next twelve months from the reporting date.
Notes to the consolidated financial statementsFor the year ended 30 June 2019
4544 2019 Annual Report
Fin
anci
al s
tate
men
t

Note 2019 2018
(Rupees in thousand)
21 SHORT TERM BORROWINGS
Short term running finance - secured 10,324,039 6,970,283
Short term advance - secured 1,765,000 1,399,980
Export refinance - secured 877,388 940,141
Loan from Chief Executive - Interest free, unsecured 100,000 390,000
13,066,427 9,700,404
21.1 Particulars of borrowings
Interest / markup based financing 21.2 8,524,864 6,121,089
Islamic mode of financing
- Holding Company 21.2 517,218 1,242,314
- Subsidiary Company 21.3 3,924,345 1,947,001
Interest free 21.4 100,000 390,000
13,066,427 9,700,404
21.2 The Holding Company has arranged facilities for short term finances to meet working capital requirements from various banks under mark-up arrangement / shariah arrangements to the extent of Rs. 8,825 million (2018: Rs. 7,775 million). The running finance facilities carried mark-up at the rates ranging from 7.43% to 14.14% per annum (2018: 6.39% to 9.43% per annum). Running finance amounting to Rs. 4,350 million (2018: Rs. 3,975 million) can interchangeably be utilized as export running finance. These carried mark-up at the rate of 2.35% to 2.50% per annum (2018: 2.40% to 2.50% per annum). Fund based facilities aggregating to Rs. 900 million can interchangeably be earmarked for utilization by subsidiary company, First Treet Manufacturing Modarba, through cross corporate guarantee of the Holding Company. Unutilized amount as at the year end amounted to Rs. 531 million (2018: Rs. 412 million).
All short term borrowings of the Holding Company are secured by way of joint first pari passu hypothecation charge of Rs. 10,704 million (2018: Rs. 10,371 million) on the entire present and future current assets of the Holding Company. Export running finances are also covered through lien on documents.
21.2.1 Running finance amounting to Rs. 2,650 million (2018: Rs. 2,650 million) can interchangeably be utilized as Short term advance. Short term advance mark-up rate is negotiated on case to case basis with the financial institute and carried mark-up at rate of 7.09% to 13.02% per annum (2018: 6.40% to 8.27% per annum).
21.3 The subsidiary company, First Treet Manufacturing Modarba has availed following Islamic mode of financing facilities:
21.3.1 This includes Istisna and Musharaka finance facilities obtained from various financial institutions under shariah arrangements for the manufacturing of corrugated boxes, soap and Batteries out of the total sanctioned limits of Rs. 3,757.50 million (2018: Rs. 2,200 million).
21.3.2 This includes Import Murabaha / Muswammah finance facilities obtained from various financial institutions under shariah arrangements for the retirements of letters of credit for import of plant & machinery, raw materials, stocks, chemicals, stores, tools and spare parts etc, out of the total sanctioned limits of Rs. 1,000 million (2018: Rs. 500 million).
Notes to the consolidated financial statementsFor the year ended 30 June 2019

21.4 The subsidiary company, Renacon Pharma Limited has availed following mode of financing facilities:
Term running finance facilities are available to Renacon Pharma Limited from Bank Alfalah limited under mark-up / profit arrangements amounting to Rs 85.42 million (2018: Rs Nil). The term finance facility is to be repaid in 10 months.These facilities carry mark-up ranging from 3 months Kibor + 1.5% per annum (2018: NIL % per annum) and are secured by charge on machinery being imported. Total sanctioned limit is Rs. 200 million.
Demand Finance facility available from MCB Limited under mark-up arrangements amounting to Rs. 54.62 million (2018: Nil). The demand finance facility is to be repaid in 6- months. The facility carry mark-up ranging 1 months Kibor +1% per annum and are secured by hypothecation of overall present and future current assets of the company. Total sanctioned limit is Rs. 200 million.
21.5 This represents interest free loan obtained from Chief Executive Officer of the Group for working capital requirements and is repayable on demand.
21.6 The facilities for opening letters of credits and guarantees as at 30 June 2019 amounts to Rs. 4,150 million (2018: Rs. 3,707 million) of which unutilized amount as at year end amounted to Rs 2,985 million (2018: Rs. 2,784 million). Non- fund based facilities aggregating to Rs 2,350 million (2018: Rs. 1,890 million) out of which Rs 1,100 million can interchangeably be earmarked for utilization by subsidiary company, First Treet Manufacturing Modarba, through cross corporate guarantee of the Company.
21.7 As per the financing arrangements, the Group is required to comply with certain financial covenants and other conditions including dividend restrictions as imposed by the providers of finance.
Notes to the consolidated financial statementsFor the year ended 30 June 2019
4746 2019 Annual Report
Fin
anci
al s
tate
men
t
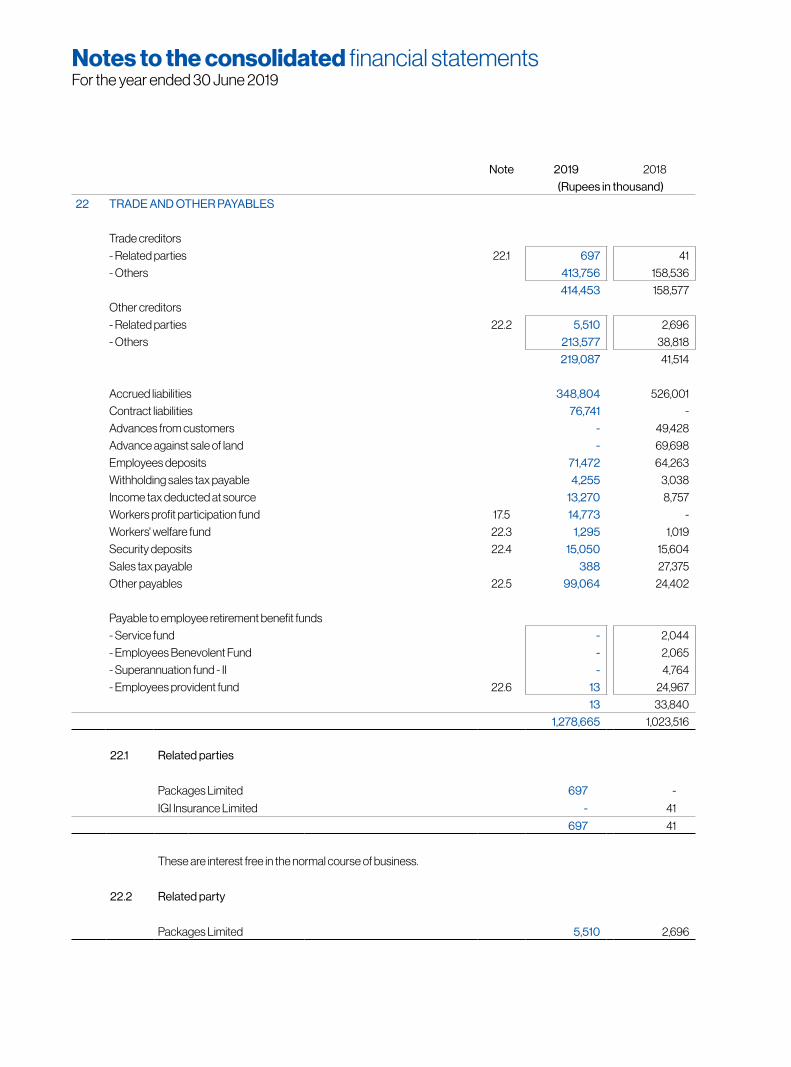
Note 2019 2018
(Rupees in thousand)
22 TRADE AND OTHER PAYABLES
Trade creditors
- Related parties 22.1 697 41
- Others 413,756 158,536
414,453 158,577
Other creditors
- Related parties 22.2 5,510 2,696
- Others 213,577 38,818
219,087 41,514
Accrued liabilities 348,804 526,001
Contract liabilities 76,741 -
Advances from customers - 49,428
Advance against sale of land - 69,698
Employees deposits 71,472 64,263
Withholding sales tax payable 4,255 3,038
Income tax deducted at source 13,270 8,757
Workers profit participation fund 17.5 14,773 -
Workers' welfare fund 22.3 1,295 1,019
Security deposits 22.4 15,050 15,604
Sales tax payable 388 27,375
Other payables 22.5 99,064 24,402
Payable to employee retirement benefit funds
- Service fund - 2,044
- Employees Benevolent Fund - 2,065
- Superannuation fund - II - 4,764
- Employees provident fund 22.6 13 24,967
13 33,840
1,278,665 1,023,516
Notes to the consolidated financial statementsFor the year ended 30 June 2019
22.1 Related parties
Packages Limited 697 -
IGI Insurance Limited - 41
697 41
These are interest free in the normal course of business.
22.2 Related party
Packages Limited 5,510 2,696

Notes to the consolidated financial statementsFor the year ended 30 June 2019
Note 2019 2018
(Rupees in thousand)
22.3 Workers' welfare fund
Balance as at 01 July 1,019 1,513
Add: Charge for the year 38 1,295 1,017
Less: paid during the year (1,019) (1,511)
Balance as at 30 June 1,295 1,019
22.4 It includes an amount received from dealer by virtue of contract and is repayable at the time of termination of dealership or on demand. The amount has been kept in regular business accounts of the Holding Company.
22.5 This includes unpresented cheques amounting to Rs. 77.93 million (2018: Rs. 0.82 million) at year end, which have been cleared subsequent to the reporting date.
22.6 In respect of contributory retirement funds other than provident fund, the Holding Company is not compliant with the requirement of section 218 of the Companies Act, 2017 and the rules formulated for this purpose.
Note 2019 2018
(Rupees in thousand)
23 ACCRUED MARK-UP
Accrued markup / return on:
Participation term certificates 171,889 173,144
Short term borrowings 313,247 124,857
485,136 298,001
24 LONG TERM DEPOSITS
These represent interest free deposits received from freight forwarding agencies and other contractors repayable after performance of contracts.
25 REDEEMABLE CAPITAL
Participation term certificates 178,166 357,583
Less: Current portion shown under current liabilities 20 (178,166) (179,417)
- 178,166
In 2013, the Holding Company issued 41,822,250 participation term certificates (PTCs) of Rs. 30 each to existing shareholders in the ratio of 1 PTC for every 1 ordinary share held. The PTCs are listed on Pakistan Stock Exchange. The term of PTCs shall be 07 years. The proceeds from the issue of PTC were utilised to repay existing bank borrowings of the Holding Company at the date of issue. The Holding Company has no option to prematurely call the PTCs for redemption and/or conversion. The PTC holders have no option to ask the Holding Company to redeem and/or convert PTC’s prematurely. PTC holders shall have no preemptive right in any further issue of capital of the Holding Company.
4948 2019 Annual Report
Fin
anci
al s
tate
men
t
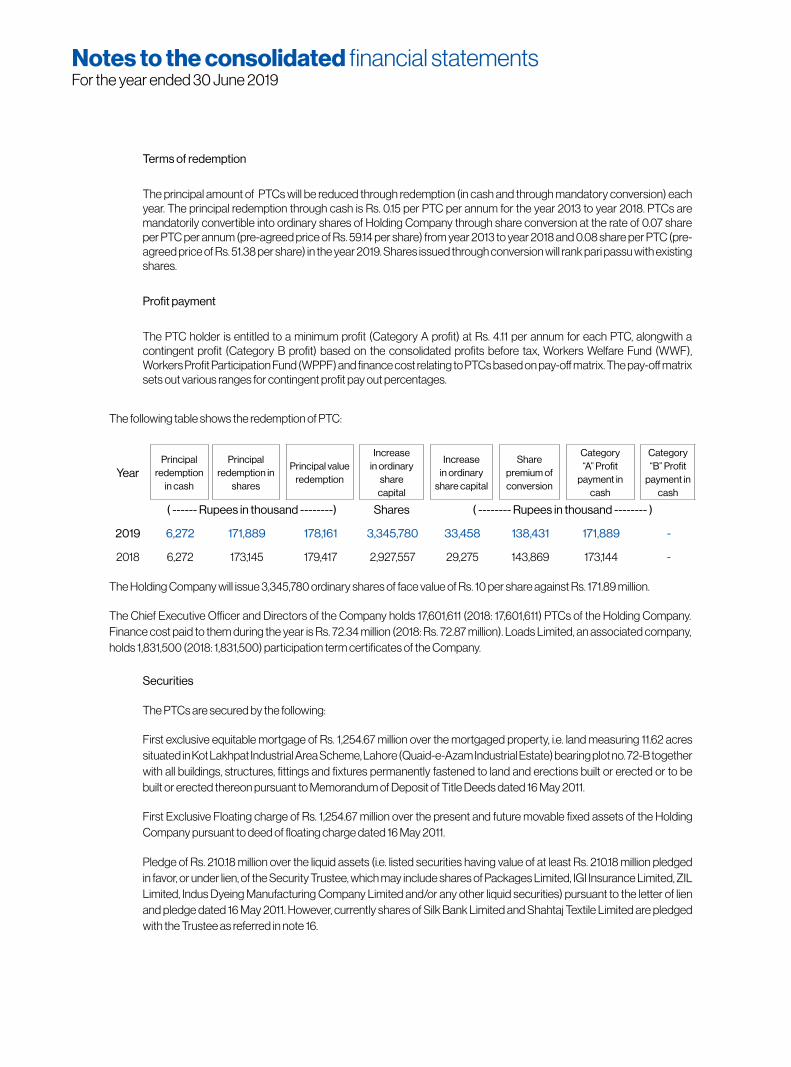
Notes to the consolidated financial statementsFor the year ended 30 June 2019
The following table shows the redemption of PTC:
YearPrincipal
redemption in cash
Principal redemption in
shares
Principal value redemption
Increase in ordinary
sharecapital
Increase in ordinary
share capital
Share premium of conversion
Category “A” Profit
payment in cash
Category “B” Profit
payment in cash
( ------ Rupees in thousand --------) Shares ( -------- Rupees in thousand -------- )
2019 6,272 171,889 178,161 3,345,780 33,458 138,431 171,889 -
2018 6,272 173,145 179,417 2,927,557 29,275 143,869 173,144 -
The Holding Company will issue 3,345,780 ordinary shares of face value of Rs. 10 per share against Rs. 171.89 million.
The Chief Executive Officer and Directors of the Company holds 17,601,611 (2018: 17,601,611) PTCs of the Holding Company. Finance cost paid to them during the year is Rs. 72.34 million (2018: Rs. 72.87 million). Loads Limited, an associated company, holds 1,831,500 (2018: 1,831,500) participation term certificates of the Company.
Terms of redemption
The principal amount of PTCs will be reduced through redemption (in cash and through mandatory conversion) each year. The principal redemption through cash is Rs. 0.15 per PTC per annum for the year 2013 to year 2018. PTCs are mandatorily convertible into ordinary shares of Holding Company through share conversion at the rate of 0.07 share per PTC per annum (pre-agreed price of Rs. 59.14 per share) from year 2013 to year 2018 and 0.08 share per PTC (pre-agreed price of Rs. 51.38 per share) in the year 2019. Shares issued through conversion will rank pari passu with existing shares.
Profit payment
The PTC holder is entitled to a minimum profit (Category A profit) at Rs. 4.11 per annum for each PTC, alongwith a contingent profit (Category B profit) based on the consolidated profits before tax, Workers Welfare Fund (WWF), Workers Profit Participation Fund (WPPF) and finance cost relating to PTCs based on pay-off matrix. The pay-off matrix sets out various ranges for contingent profit pay out percentages.
Securities
The PTCs are secured by the following:
First exclusive equitable mortgage of Rs. 1,254.67 million over the mortgaged property, i.e. land measuring 11.62 acres situated in Kot Lakhpat Industrial Area Scheme, Lahore (Quaid-e-Azam Industrial Estate) bearing plot no. 72-B together with all buildings, structures, fittings and fixtures permanently fastened to land and erections built or erected or to be built or erected thereon pursuant to Memorandum of Deposit of Title Deeds dated 16 May 2011.
First Exclusive Floating charge of Rs. 1,254.67 million over the present and future movable fixed assets of the Holding Company pursuant to deed of floating charge dated 16 May 2011.
Pledge of Rs. 210.18 million over the liquid assets (i.e. listed securities having value of at least Rs. 210.18 million pledged in favor, or under lien, of the Security Trustee, which may include shares of Packages Limited, IGI Insurance Limited, ZIL Limited, Indus Dyeing Manufacturing Company Limited and/or any other liquid securities) pursuant to the letter of lien and pledge dated 16 May 2011. However, currently shares of Silk Bank Limited and Shahtaj Textile Limited are pledged with the Trustee as referred in note 16.

Notes to the consolidated financial statementsFor the year ended 30 June 2019
The above investment in shares/securities will be kept in CDC Account which shall be under pledge of security trustee. However movement in/from the said pledged account will not be restricted by the security trustee provided that aggregate value of Rs. 250 million is maintained. The security trustee shall ensure that the closing balance of shares in the pledged account at anytime shall not fall below the equivalent rupee value of Rs. 250 million.
Note 2019 2018
(Rupees in thousand)
26 DEFERRED LIABILITIES - EMPLOYEE RETIREMENT BENEFITS
Gratuity fund 233,944 160,769
Superannuation fund 247,564 164,929
26.1 481,508 325,698
Gratuity Superannuation
2019 2018 2019 2018
(Rupees in thousand) (Rupees in thousand)
26.1 Net retirement benefit obligation
Amounts recognized in statement of financial position are as follows:
Present value of defined benefit obligation 415,192 349,276 389,555 330,390
Fair value of plan assets (181,248) (188,507) (141,991) (165,461)
Net retirement benefit obligation 233,944 160,769 247,564 164,929
26.2 Movement in net obligation
Net liability as at 01 July 160,769 122,823 164,929 129,116
Charge to statement of profit or loss
Treet Corporation Limited 44,493 30,232 38,299 27,587
Treet HR Management (Private) Limited 2,679 1,820 1,205 868
47,172 32,052 39,504 28,455
Re-measurements chargeable in othercomprehensive income
Treet Corporation Limited 48,386 39,239 54,492 31,322
Treet HR Management (Private) Limited 2,547 2,065 2,868 1,649
50,933 41,304 57,360 32,971
Contribution made by the Group (24,930) (35,410) (14,229) (25,613)
Net liability as at 30 June 233,944 160,769 247,564 164,929
5150 2019 Annual Report
Fin
anci
al s
tate
men
t
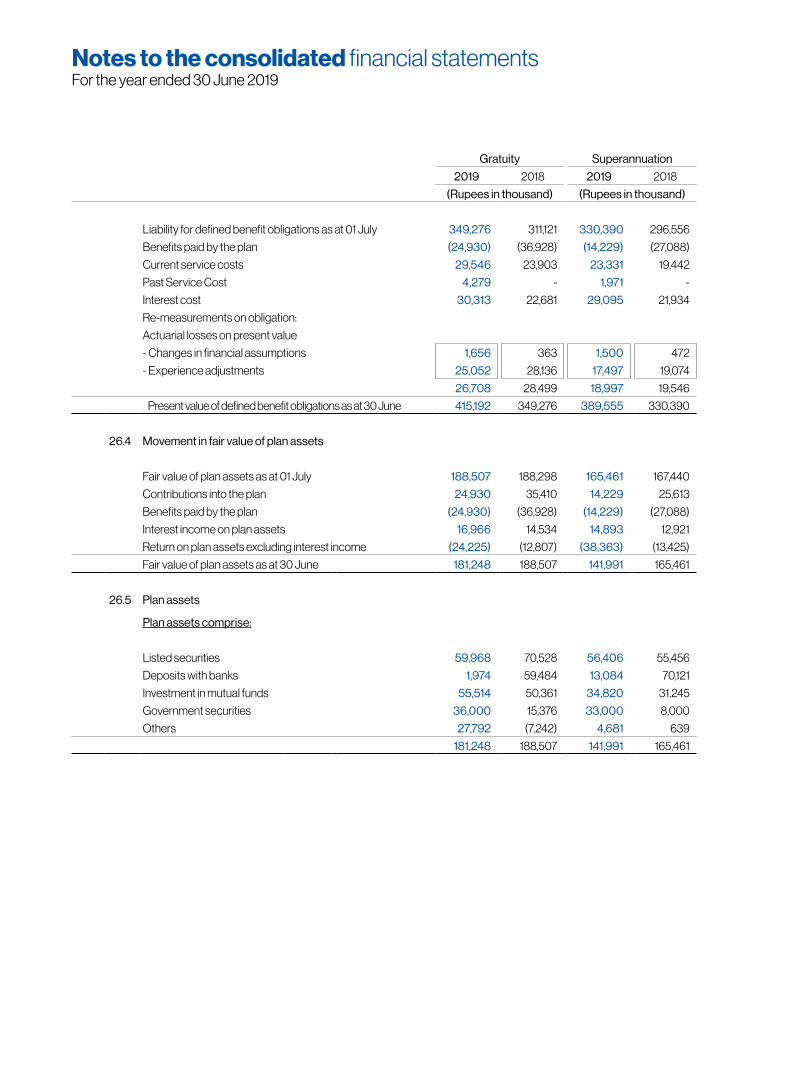
Notes to the consolidated financial statementsFor the year ended 30 June 2019
Gratuity Superannuation
2019 2018 2019 2018
(Rupees in thousand) (Rupees in thousand)
Liability for defined benefit obligations as at 01 July 349,276 311,121 330,390 296,556
Benefits paid by the plan (24,930) (36,928) (14,229) (27,088)
Current service costs 29,546 23,903 23,331 19,442
Past Service Cost 4,279 - 1,971 -
Interest cost 30,313 22,681 29,095 21,934
Re-measurements on obligation:
Actuarial losses on present value
- Changes in financial assumptions 1,656 363 1,500 472
- Experience adjustments 25,052 28,136 17,497 19,074
26,708 28,499 18,997 19,546
Present value of defined benefit obligations as at 30 June 415,192 349,276 389,555 330,390
26.4 Movement in fair value of plan assets
Fair value of plan assets as at 01 July 188,507 188,298 165,461 167,440
Contributions into the plan 24,930 35,410 14,229 25,613
Benefits paid by the plan (24,930) (36,928) (14,229) (27,088)
Interest income on plan assets 16,966 14,534 14,893 12,921
Return on plan assets excluding interest income (24,225) (12,807) (38,363) (13,425)
Fair value of plan assets as at 30 June 181,248 188,507 141,991 165,461
26.5 Plan assets
Plan assets comprise:
Listed securities 59,968 70,528 56,406 55,456
Deposits with banks 1,974 59,484 13,084 70,121
Investment in mutual funds 55,514 50,361 34,820 31,245
Government securities 36,000 15,376 33,000 8,000
Others 27,792 (7,242) 4,681 639
181,248 188,507 141,991 165,461
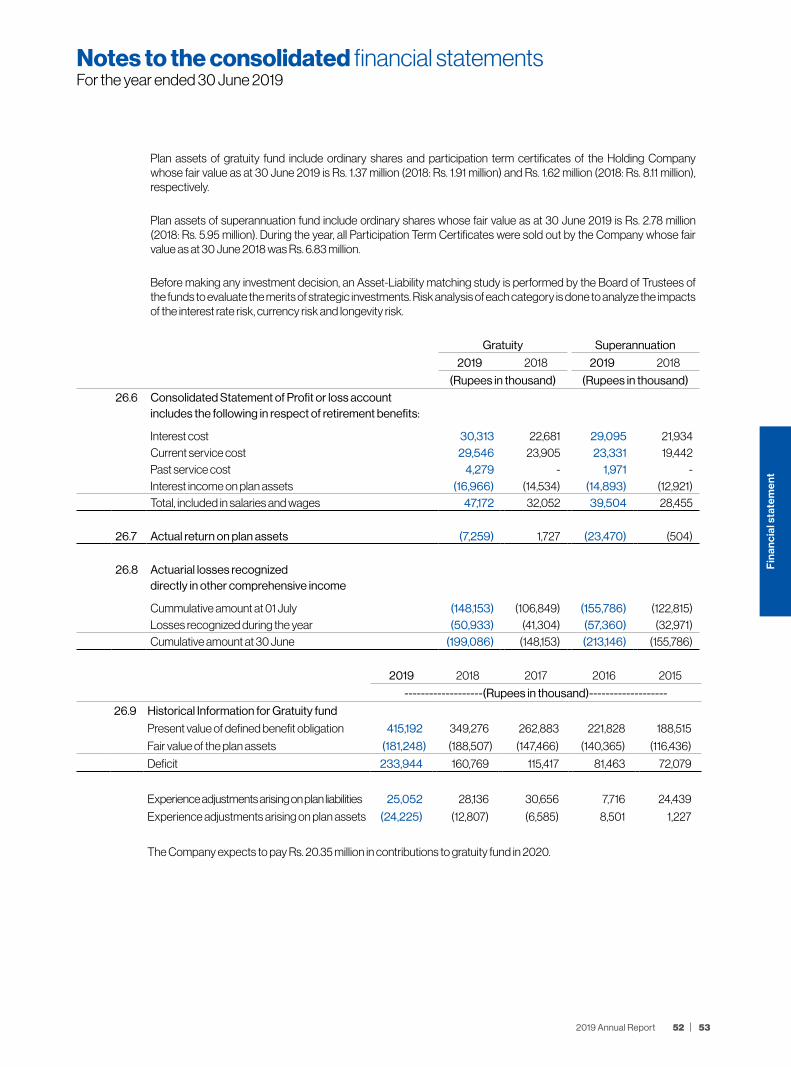
Notes to the consolidated financial statementsFor the year ended 30 June 2019
Plan assets of gratuity fund include ordinary shares and participation term certificates of the Holding Company whose fair value as at 30 June 2019 is Rs. 1.37 million (2018: Rs. 1.91 million) and Rs. 1.62 million (2018: Rs. 8.11 million), respectively.
Plan assets of superannuation fund include ordinary shares whose fair value as at 30 June 2019 is Rs. 2.78 million (2018: Rs. 5.95 million). During the year, all Participation Term Certificates were sold out by the Company whose fair value as at 30 June 2018 was Rs. 6.83 million.
Before making any investment decision, an Asset-Liability matching study is performed by the Board of Trustees of the funds to evaluate the merits of strategic investments. Risk analysis of each category is done to analyze the impacts of the interest rate risk, currency risk and longevity risk.
Gratuity Superannuation
2019 2018 2019 2018
(Rupees in thousand) (Rupees in thousand)
26.6 Consolidated Statement of Profit or loss account includes the following in respect of retirement benefits:
Interest cost 30,313 22,681 29,095 21,934 Current service cost 29,546 23,905 23,331 19,442 Past service cost 4,279 - 1,971 - Interest income on plan assets (16,966) (14,534) (14,893) (12,921)Total, included in salaries and wages 47,172 32,052 39,504 28,455
26.7 Actual return on plan assets (7,259) 1,727 (23,470) (504)
26.8 Actuarial losses recognized directly in other comprehensive income
Cummulative amount at 01 July (148,153) (106,849) (155,786) (122,815)Losses recognized during the year (50,933) (41,304) (57,360) (32,971)Cumulative amount at 30 June (199,086) (148,153) (213,146) (155,786)
2019 2018 2017 2016 2015
-------------------(Rupees in thousand)-------------------
26.9 Historical Information for Gratuity fund
Present value of defined benefit obligation 415,192 349,276 262,883 221,828 188,515
Fair value of the plan assets (181,248) (188,507) (147,466) (140,365) (116,436)
Deficit 233,944 160,769 115,417 81,463 72,079
Experience adjustments arising on plan liabilities 25,052 28,136 30,656 7,716 24,439
Experience adjustments arising on plan assets (24,225) (12,807) (6,585) 8,501 1,227
The Company expects to pay Rs. 20.35 million in contributions to gratuity fund in 2020.
5352 2019 Annual Report
Fin
anci
al s
tate
men
t
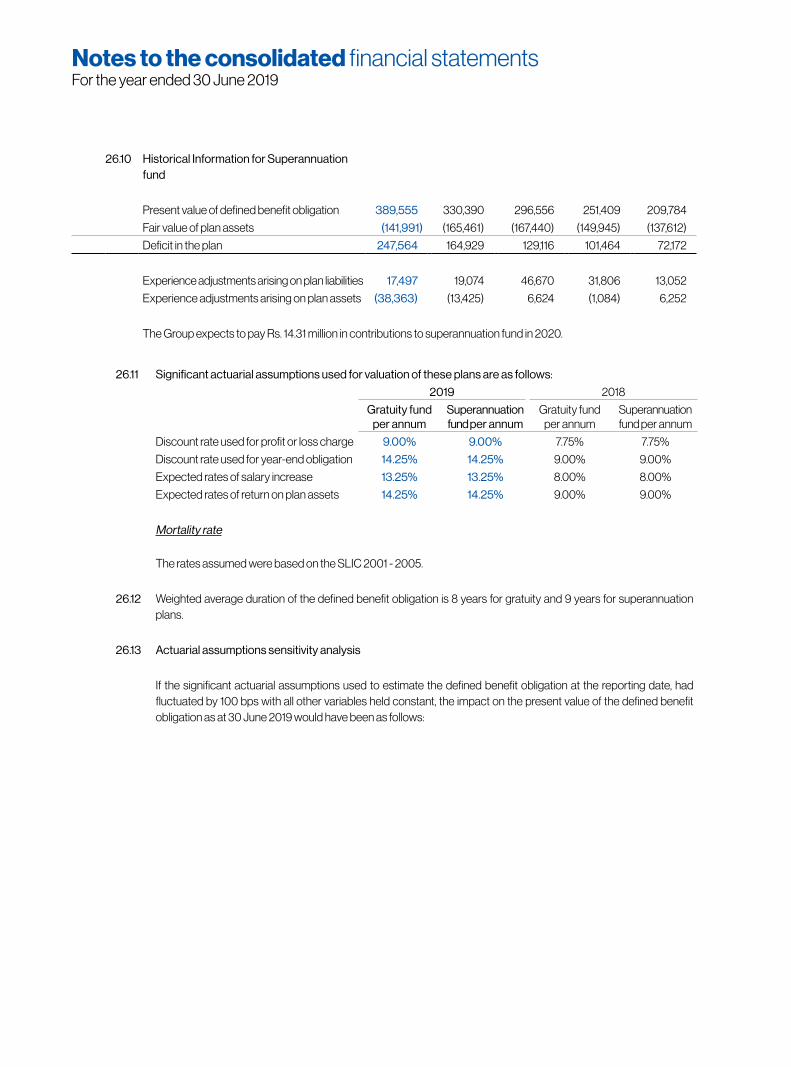
26.11 Significant actuarial assumptions used for valuation of these plans are as follows:
2019 2018
Gratuity fund per annum
Superannuationfund per annum
Gratuity fund per annum
Superannuation fund per annum
Discount rate used for profit or loss charge 9.00% 9.00% 7.75% 7.75%
Discount rate used for year-end obligation 14.25% 14.25% 9.00% 9.00%
Expected rates of salary increase 13.25% 13.25% 8.00% 8.00%
Expected rates of return on plan assets 14.25% 14.25% 9.00% 9.00%
Mortality rate
The rates assumed were based on the SLIC 2001 - 2005.
26.12 Weighted average duration of the defined benefit obligation is 8 years for gratuity and 9 years for superannuation plans.
26.13 Actuarial assumptions sensitivity analysis
If the significant actuarial assumptions used to estimate the defined benefit obligation at the reporting date, had fluctuated by 100 bps with all other variables held constant, the impact on the present value of the defined benefit obligation as at 30 June 2019 would have been as follows:
Notes to the consolidated financial statementsFor the year ended 30 June 2019
26.10 Historical Information for Superannuation fund
Present value of defined benefit obligation 389,555 330,390 296,556 251,409 209,784
Fair value of plan assets (141,991) (165,461) (167,440) (149,945) (137,612)
Deficit in the plan 247,564 164,929 129,116 101,464 72,172
Experience adjustments arising on plan liabilities 17,497 19,074 46,670 31,806 13,052
Experience adjustments arising on plan assets (38,363) (13,425) 6,624 (1,084) 6,252
The Group expects to pay Rs. 14.31 million in contributions to superannuation fund in 2020.

Notes to the consolidated financial statementsFor the year ended 30 June 2019
Impact on present value of defined benefit obligation as at 30 June 2019
Gratuity Superannuation
Change Increase Decrease Increase Decrease
---------(Rupees in thousand)---------
Discount rate 100 bps (383,252) 451,901 (358,178) 425,715
Future salary increase 100 bps 451,901 (382,722) 425,715 (357,658)
The sensitivity analysis of the defined benefit obligation to the significant actuarial assumptions has been performed using the same calculation techniques as applied for calculation of defined benefit obligation reported in the statement of financial position.
27 EMPLOYEE STOCK OPTION SCHEME
The Group has granted share options to its employees under the Treet Corporation Limited - Employee Stock Options Scheme, 2015 (“the scheme”) as approved by the shareholders in their annual general meeting held on 31 October 2014 and the Securities and Exchange Commission of Pakistan (SECP) vide its letter No. SMD/CIW/ESOS/02/2014 dated 19 February 2015.
Under the Scheme, the Group may grant options to eligible employees selected by the Board Compensation Committee, from time to time, which shall not at any time exceed 15% of the paid up capital of the Holding Company (as increased from time to time). The option entitles an employee to purchase shares at an exercise prices determined in accordance with the mechanism defined in the scheme at the date of grant. The aggregate number of shares for all options to be granted under the scheme to any single eligible employee shall not, at any time, exceed 3% of the paid up capital of the Holding Company (as increased from time to time). Further the grant of options in anyone calendar year exceeding 3% of the paid up capital shall require approval of the shareholders. The options carry neither right to dividends nor voting rights till shares are issued to employees on exercise of options.
The options will have a vesting period of one year and an exercise period of one year from the date options are vested as laid down in the scheme. These options shall be exercisable after completion of vesting period i.e. one year from date of grant. Upon vesting, employees are eligible to apply and secure allotment of Holding Company’s shares at a exercise price determined on the date of grant of options. Option price shall be payable by the employee on the exercise of options in full or part. The options will lapse after completion of two years of grant date if not exercised.
5554 2019 Annual Report
Fin
anci
al s
tate
men
t

* Initially the shareholders of the Company in their Annual General Meeting held on 31 October 2016 approved re-pricing of 1,604,800 options already granted and pending for excercise unde the scheme from inital price of Rs. 90.58 per share to revised price of Rs. 51.79 per share without any change or modification to any other terms.
Further, during the current period, the shareholders of the Company in their Annual General Meeting held on 26 October 2018 approved re-pricing of 4,259,400 options already granted and pending for excercise under the scheme from initial price of Rs. 66.45 per share to revised price of Rs. 20 per share without any change or modification in the vesting period / schedule, excercise period or anyother specific terms and conditions under which such options have been granted.
Subsequent to the year end, the Company has granted 4.96 million stock options to its eligible employees at an excecise price of Rs. 15.17 per share under "Treet Corporation Limited - Employee Stock Option Scheme, 2015" in respect of year 2018-2019. These options will have a vesting period of one year from grant date and an excercise period of any year from the date the options are vested. These options shall be excercisable after completion of vesting period i.e. one year from date of grant.
28 CONTINGENCIES AND COMMITMENTS
28.1 Contingencies
Contingencies - The Holding Company
- A tax demand amounting to Rs. 14.80 million had been created by Additional Commissioner Inland Revenue under section 12(9A) of the repealed Income Tax Ordinance, 1979 for assessment year 2000-2001. The tax demand was adjusted against income tax refunds of the Company for the tax year 2006. The Company has filed an appeal before Appellate Tribunal Inland Revenue.
Notes to the consolidated financial statementsFor the year ended 30 June 2019
The details of the share options granted under the scheme together with the status as at 30 June 2019 is as follows:
Granted in year 2018
Granted in the year 2017
Granted in year 2016
Granted in the year 2015
(*Modified October 2018)
(*Modified October
2016)-------------------------(Rupees in thousand)-------------------------
Original grant date 30-Jul-18 14 July 2017 16 July 2016 14 July 2015Modified grant date N/A 26-Oct-18 N/A 31-Oct- 16
Options issued 4,769 4,259 4,114 1,605 Options no longer in issue N/A N/A - - Options vested N/A 4,259 4,114 1,605 Options exercised N/A 2,439 533 1,605 Shares issued under the scheme N/A 2,439 533 1,605 Original exercise price per share 35.44 66.45 51.79 90.58 Market value per share at grant date 35.60 51.53 51.63 77.09 Option discount per share at grant date N/A NIL NIL NIL Modified exercise price per share N/A 20 N/A 51.79 Market value per share at modified grant date N/A 25.36 N/A 47.08 Option discount per share at modified grant date N/A 5.36 N/A NIL Options issued to key management personnel 2,416 2,003 3,224 1,367 Options exercised by key management N/A 1,334 426 1,367 Options exercised by key management personnel N/A N/A 1,367
Notes to the consolidated financial statementsFor the year ended 30 June 2019
- A tax demand amounting to Rs. 16.05 million had been raised by the tax department against the Company on the issue of proration of profits between local and export sales for the tax year 2003 and 2006. In 2010, Appellate Tribunal Inland Revenue dismissed the Company’s appeal, however, the Company filed an application under section 21 of General Clauses Act, 1997 to rescind or amend the order. Further, without conceding the legitimate position of this issue as stated above, a rectification application on account of incorrect computation has also been filed resulting in rectification amounting to Rs. 10.29 million. The Company is expecting a favorable outcome as this issue was decided in the favor of the Company in past.
- For the assessment year 1999 to 2000, the taxation officer charged additional tax amounting to Rs. 3.27 million on the grounds that the Company failed to deposit the due tax as per the return filed. The Company, on the grounds that the amount due has already been deposited, filed a rectification application against levy of additional tax on the basis that the mistake is apparent from the record.
- For the tax year 2004, the Additional Commissioner Inland Revenue passed an order under section 122(5A) of the Income Tax Ordinance, 2001 on the issue of proration of profits between local and export sales and created a tax demand of Rs. 6.56 million which was subsequently reduced to Rs. 2.62 million vide order dated 30 June 2015. The Company filed an appeal before Commissioner Inland Revenue (CIR) (Appeals) who decided the matter against the Company. Against the order of CIR (appeals), the Company filed an appeal before Appellate Tribunal Inland Revenue which is pending adjudication.
- For the tax year 2011, the Deputy Commissioner Inland Revenue passed an order under section 161/205 of the Income Tax Ordinance, 2001 and created a tax demand of Rs. 0.58 million. The Company filed an appeal before Commissioner Inland Revenue (Appeals) and obtained a relief of Rs. 0.24 million thereby reducing the overall demand to Rs. 0.37 million. The Company then filed a second appeal before the Appellate Tribunal Inland Revenue which is pending adjudication.
- For the tax year 2014, the Deputy Commissioner Inland Revenue passed an order under section 121(1)/122(5) after conducting a tax audit under section 177 of the of the Income Tax Ordinance, 2001. The additions made through the above order resulted in reduction of the brought forward losses of the respective tax year. The Company filed an appeal before Commissioner Inland Revenue (Appeals) which is pending adjudication.
- For the tax year 2016, the Assistant Commissioner Inland Revenue passed an order under section 161/205 of the Income Tax Ordinance, 2001 and created a tax demand of Rs. 3.12 million. The Company filed an appeal before Commissioner Inland Revenue (Appeals) which is pending adjudication.
- A sales tax demand amounting to Rs. 1.56 million has been created by Deputy Commissioner Inland Revenue for alleged default of compliance of section 8(1)(CA) of the Sales Tax Act, 1990. The Company filed an appeal with Commissioner Appeals against this order and obtained relief of Rs. 0.42 million. The Company filed an appeal before Appellate Tribunal Inland Revenue and expects a favorable outcome on the grounds that Honorable Lahore High Court has declared the provision of section 8(1)(CA) ultra-vires.
- In the year 2015, the Company was selected for sales tax audit in respect of tax period July 2013 to June 2014 under section 72B of the Sales Tax Act, 1990. After the conclusion of audit proceedings, a sales tax demand of Rs. 8.65 million including penalty was created by Deputy Commissioner Inland Revenue mainly on account of admissibility of input sales tax under SRO 490(I)/2004. The Company filed an appeal with Commissioner Inland Revenue (Appeals) against this order which is pending adjudication.
- For the tax period July 2013 to June 2018 a sales tax demand of Rs. 138.04 million along with default surcharge and penalty was created by ACIR, E & C Unit-03, Zone-1, LTU, Lahore on the contention that the Company has claiming inadmissible input sales tax adjustment on the strength of bogus invoices issued by the suspended units in voilation of section 8 of the Sales Tax Act, 1990 as well as insurance services on stock in trade and plant and machinery and illegally adjusted input sales tax of irrelevant sectors in contravention of the said section. The Company filed an appeal with Commissioner Inland Revenue (Appeals) against this order which is pending adjudication.
5756 2019 Annual Report
Fin
anci
al s
tate
men
t

Based on the opinion of the Holding Company’s legal counsel, management is expecting a favorable outcome of the above cases. Therefore no provision has been recognized in these consolidated financial statements.
Contingencies - First Treet Manufacturing Modaraba
- For the tax years 2011 and 2012, the Deputy Commissioner Inland Revenue (DCIR) passed orders under sections 161 and 205 of the Income Tax Ordinance, 2001 creating tax demands of Rs. 1.52 million and Rs. 41.36 million respectively. The Modaraba filed appeals against the orders passed by DCIR before Commissioner Inland Revenue (CIR) Appeals who decided the matters in favor of the Modaraba by deleting the tax demands. Tax department filed appeals against the decision of CIR Appeals before Appellate Tribunal Inland Revenue (ATIR) which are pending adjudication. The management and tax advisor of Modaraba are of the view that favorable outcome is expected as the Modaraba is fully compliant of withholding tax provisions.
- For the tax year 2017, the Inland Revenue Officer (IRO), E & C Unit-VII, Range-II, Zone-VI, CRTO, Lahore, passed orders under sections 161 and 205 of the Income Tax Ordinance, 2001 arbitrarily creating a tax demand of Rs. 1.81 million. The Modaraba filed appeals against the order passed by IRO before Commissioner Inland Revenue (CIR) Appeals, Zone-II, Lahore which is pending adjudication. The management and tax advisor of Modaraba are of the view that favorable outcome is expected as the Modaraba is fully compliant of withholding tax provisions.
- For the tax period July 2015 to June 2016, the Additional Commissioner Inland Revenue (ACIR) passed order under section 25 of the Sales Tax Act, 1990 creating a sales tax demand of Rs. 9.80 million along with penalty of Rs. 0.47 million mainly on the issue of inadmissibility of input sales tax. The Modaraba filed appeals against the order passed by ACIR before Commissioner Inland Revenue (CIR) Appeals, Zone-II, Lahore which is pending adjudication. The management and tax advisor of Modaraba are of the view that the tax demand will be deleted by appellate authorities based a decision in favour of Registered Person (RP) on this issue by the Lahore High Court, Lahore.
Based on the opinion of tax advisor of Modaraba, management is expecting a favourable outcome of the above cases. Therefore, no provision in this regard has been recognised in these consolidated financial statements.
Contingencies - Treet Holdings Limited
- A tax demand amounting to Rs. 43.26 million had been created by Additional Commissioner Inland Revenue (ACIR) through the order passed u/s 122(5A) of the Income Tax Ordinance, 2001 for the tax year 2011. The Company has filed an appeal before Appellate Tribunal Inland Revenue (ATIR) Lahore.
- A tax demand amounting to Rs. 26.60 million had been raised by Commissioner Inland Revenue - Appeals - 1, through the order passed u/s 221 of the Income Tax Ordinance, 2001 for the tax year 2011. The Company has filed an appeal before Appellate Tribunal Inland Revenue, Lahore being unlawful and illegal demand created by the department.
- For the tax year 2009, the Deputy Commissioner Inland Revenue (DCIR) passed an order under section 161/205 of Income Tax Ordinance, 2001 and created a tax demand of Rs. 34.65 million. The Company filed an appeal before the Commissioner Inland Revenue - Appeals - 1, who deleted tax demand of Rs. 32.36 million. The Company has filed second appeal before the Appellate Tribunal Inland Revenue for the remaining amount, which is in process.
- For the tax year 2012, the Assistant Commissioner Inland Revenue (ACIR) passed an order u/s 161/205 and arbitrarily created a tax demand of Rs. 1.10 million. The Company filed an appeal before the Commissioner Inland Revenue (Appeals), Zone-1, Lahore.
- For the tax year 2012, the Additional Commissioner Inland Revenue (ACIR) had passed an order u/s 122(5A) on different issues i.e. allocation of expenses between normal income and presumptive income, u/s 34(3) read with section 20, u/s 29, bad debts, exchange loss, payment of WWF & dividend income and created a tax demand of Rs. 1.30 million. The Company filed an appeal before the Commissioner Inland Revenue (Appeals) which is pending adjudication at this point in time.
Notes to the consolidated financial statementsFor the year ended 30 June 2019

Notes to the consolidated financial statementsFor the year ended 30 June 2019
- For the tax year 2013, the Additional Commissioner Inland Revenue (ACIR) had passed an order u/s 122(5A) on different issues i.e. u/s 34(3) read with section 20, u/s 29, bad debts, capital gains on securities, exchange loss & sale / transfer of stock and created a tax demand of Rs. 17.28 million. The Company filed an appeal before the Commissioner Inland Revenue (Appeals).
- For the tax year 2014, the Deputy Commissioner Inland Revenue (DCIR) had passed an order u/s 122(1) read with section 122(5) of the Income Tax Ordinance, 2001 on different issues i.e disallowing expenses on account of trade discount, u/s 111(1)(a), provision for doubtful debts, u/s 20(1), 21(C), 21(h), 21(l), 21(m) and 111(1)(b) amounting to Rs. 17.30 million. The Company filed an appeal before the Commissioner Inland Revenue Appeals-II, Lahore.
- For the tax year 2014, the Assistant Commissioner Inland Revenue, Enforcement-06, Zone- 1, Large Tax Payer Unit, Lahore passed an order u/s 161/205 and arbitrarily created a tax demand of Rs. 1.3 million. Against this order, the company filed appeal before the Commissioner Inland Revenue (Appeals), Zone-1, Lahore which is pending adjudication at this point in time.
- A sales tax demand of Rs. 161.52 million was created by Deputy Commissioner Inland Revenue (DCIR), Audit-03, Zone-1, LTU, Lahore for the tax period July 2010 to June 2011, after conducting audit under section 72(b) of the Sales Tax Act, 1990. The Appellate Tribunal Inland Revenue deleted the tax demand of Rs. 161.01 million. As a result, tax department filed second appeal before the Appellate Tribunal Inland Revenue, Lahore for remanding the case back on the issue of violation of section-73 of Sales Tax Act, 1990.
- For the tax period December 2011, a sale tax demand of Rs. 9.3 million was created by DCIR, Audit-02, Zone-1, L TU, Lahore for alleged default of compliance of section 8(1 )(ca) of the Sales Tax Act, 1990. Against this order the company filed appeal before the CIR (Appeals), Zone-1, Lahore where the worthy CIR (Appeals) has given partial relief to the extent of Rs. 8.6 million.
- The Deputy Commissioner Inland Revenue (DCIR) issued an order to recover Rs. 12.51 million as inadmissible input sales tax which was adjusted in the electronic sales tax return, as previously sales tax returns were being filed manually on the directions of Honorable Lahore High Court in response to the company’s writ petition challenging the amendments made in the Sales Tax Special Procedure Withholding rules, 2007 wide SRO 505(1)-2013. The Company has filed an appeal before the Commissioner Inland Revenue (Appeals 1), Lahore which is pending adjudication.
- For the tax period 2011 and 2012, a sales tax demand of Rs. 13.88 million and Rs. 1.8 million respectively was created by Deputy Commissioner Inland Revenue (DCIR) for alleged default of compliance u/s 8(1)(ca) of Sales Tax Act, 1990. The Company filed an appeal before the Commissioner Inland Revenue - Appeals, Zone-1, Lahore where the relief was given to the extent of Rs. 12.92 million and Rs. 1.3 million respectively. The Company filed second appeal before the Appellate Tribunal Inland Revenue (ATIR)for the remaining amount, as the Honorable Lahore High Court, Lahore has declared the provision of sec-8(1)(ca) ultra vires. In response thereto, ATIR passed an order dated 08 January 2019, in the favour of the Company wherein tax demand amounting to Rs. 4.5 million and Rs. 1.8 million has been deleted.
Based on the opinion of the Subsidiary Company’s legal counsel, management is expecting a favorable outcome of the above cases. Therefore no provision has been recognized in these consolidated financial statements.
28.2 Commitments
- Outstanding letters of credit as at 30 June 2019 amounted to Rs. 748.46 million (2018: Rs. 1,175.43 million).
- Outstanding capital commitments as at 30 June 2019 amounted to Rs. 115.28 (2018: Rs. Nil).
28.2.1 Operating leases
The Group has availed its soaps manufacturing facility on operating lease. This lease runs for the maximum period of 10 years ending on 30 June 2020, with an option to renew after that date.
5958 2019 Annual Report
Fin
anci
al s
tate
men
t
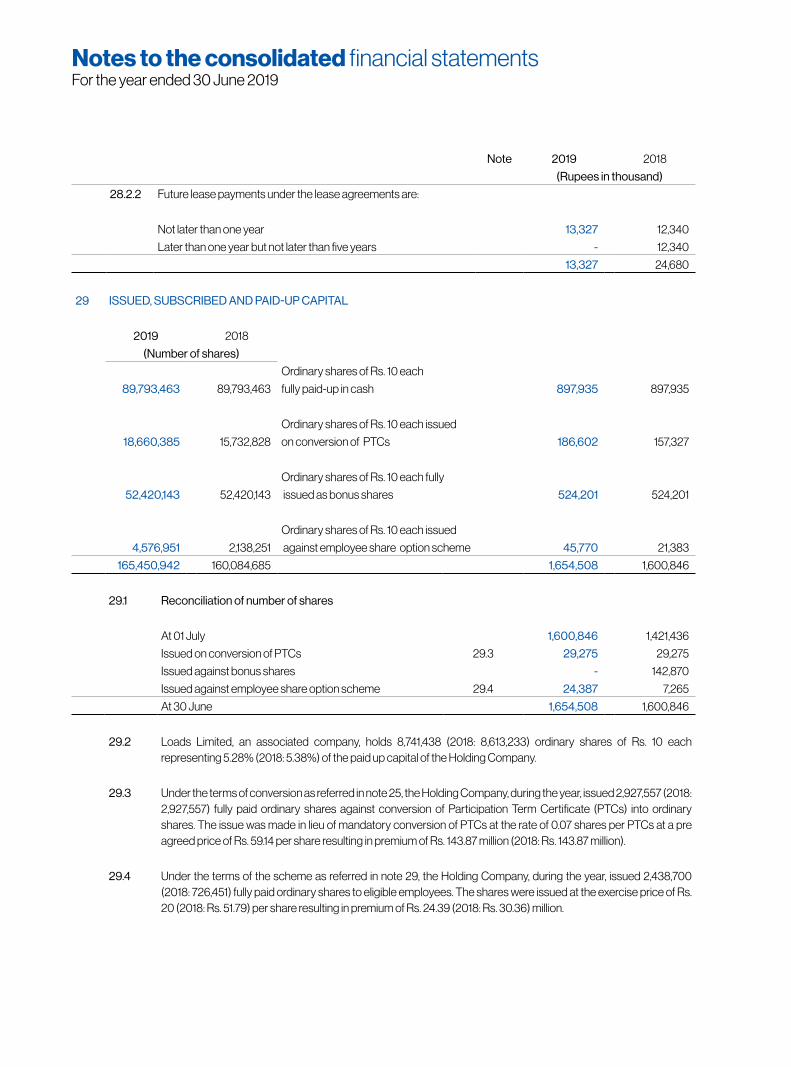
29.1 Reconciliation of number of shares
At 01 July 1,600,846 1,421,436
Issued on conversion of PTCs 29.3 29,275 29,275
Issued against bonus shares - 142,870
Issued against employee share option scheme 29.4 24,387 7,265
At 30 June 1,654,508 1,600,846
29.2 Loads Limited, an associated company, holds 8,741,438 (2018: 8,613,233) ordinary shares of Rs. 10 each representing 5.28% (2018: 5.38%) of the paid up capital of the Holding Company.
29.3 Under the terms of conversion as referred in note 25, the Holding Company, during the year, issued 2,927,557 (2018: 2,927,557) fully paid ordinary shares against conversion of Participation Term Certificate (PTCs) into ordinary shares. The issue was made in lieu of mandatory conversion of PTCs at the rate of 0.07 shares per PTCs at a pre agreed price of Rs. 59.14 per share resulting in premium of Rs. 143.87 million (2018: Rs. 143.87 million).
29.4 Under the terms of the scheme as referred in note 29, the Holding Company, during the year, issued 2,438,700 (2018: 726,451) fully paid ordinary shares to eligible employees. The shares were issued at the exercise price of Rs. 20 (2018: Rs. 51.79) per share resulting in premium of Rs. 24.39 (2018: Rs. 30.36) million.
29 ISSUED, SUBSCRIBED AND PAID-UP CAPITAL
2019 2018
(Number of shares)
Ordinary shares of Rs. 10 each
89,793,463 89,793,463 fully paid-up in cash 897,935 897,935
Ordinary shares of Rs. 10 each issued
18,660,385 15,732,828 on conversion of PTCs 186,602 157,327
Ordinary shares of Rs. 10 each fully
52,420,143 52,420,143 issued as bonus shares 524,201 524,201
Ordinary shares of Rs. 10 each issued
4,576,951 2,138,251 against employee share option scheme 45,770 21,383
165,450,942 160,084,685 1,654,508 1,600,846
Note 2019 2018
(Rupees in thousand)
28.2.2 Future lease payments under the lease agreements are:
Not later than one year 13,327 12,340
Later than one year but not later than five years - 12,340
13,327 24,680
Notes to the consolidated financial statementsFor the year ended 30 June 2019
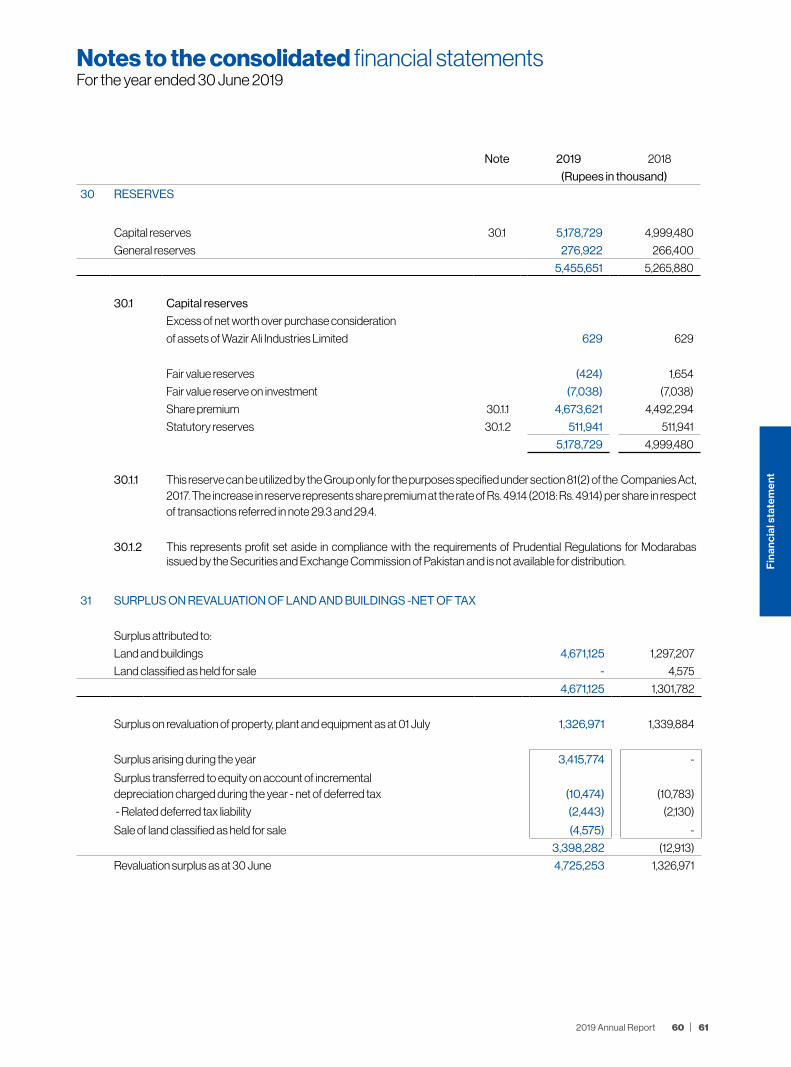
Note 2019 2018
(Rupees in thousand)
30 RESERVES
Capital reserves 30.1 5,178,729 4,999,480
General reserves 276,922 266,400
5,455,651 5,265,880
30.1 Capital reserves
Excess of net worth over purchase consideration
of assets of Wazir Ali Industries Limited 629 629
Fair value reserves (424) 1,654
Fair value reserve on investment (7,038) (7,038)
Share premium 30.1.1 4,673,621 4,492,294
Statutory reserves 30.1.2 511,941 511,941
5,178,729 4,999,480
30.1.1 This reserve can be utilized by the Group only for the purposes specified under section 81(2) of the Companies Act, 2017. The increase in reserve represents share premium at the rate of Rs. 49.14 (2018: Rs. 49.14) per share in respect of transactions referred in note 29.3 and 29.4.
30.1.2 This represents profit set aside in compliance with the requirements of Prudential Regulations for Modarabas issued by the Securities and Exchange Commission of Pakistan and is not available for distribution.
Notes to the consolidated financial statementsFor the year ended 30 June 2019
31 SURPLUS ON REVALUATION OF LAND AND BUILDINGS -NET OF TAX
Surplus attributed to:
Land and buildings 4,671,125 1,297,207
Land classified as held for sale - 4,575
4,671,125 1,301,782
Surplus on revaluation of property, plant and equipment as at 01 July 1,326,971 1,339,884
Surplus arising during the year 3,415,774 -
Surplus transferred to equity on account of incrementaldepreciation charged during the year - net of deferred tax (10,474) (10,783)
- Related deferred tax liability (2,443) (2,130)
Sale of land classified as held for sale (4,575) -
3,398,282 (12,913)
Revaluation surplus as at 30 June 4,725,253 1,326,971
6160 2019 Annual Report
Fin
anci
al s
tate
men
t

2019 2018
(Rupees in thousand)
Related deferred tax liability:
- On revaluation as at 01 July (25,189) (28,238)
- on surplus arising during the year (31,331) -
- on account of incremental depreciation charged during the year 2,442 2,130
- tax rate adjustment (50) 919
(54,128) (25,189)
Surplus on revaluation of property, plant and equipment as at 30 June 4,671,125 1,301,782
31.1 Charge of incremental depreciation for the year net of tax attributable to:
Owners of the Group (10,446) (10,749)
Non-controlling interests (28) (34)
(10,474) (10,783)
31.2 Balance as at 30 June attributable to:
Owners of the Group 4,642,427 1,301,777
Non-controlling interests 28,698 5
4,671,125 1,301,782
31.3 Land and buildings were last revalued on 30 June 2019 by M/s Medallion (Pvt) Limited (PBA approved valuators, in-spectors and engineers) resulting in surplus of Rs. 3,415.77 million. Land was revalued on the basis of current market value and buildings have been revalued on the basis of replacement value. The forced sale value of freehold land and buildings on freehold land was Rs. 3,157.27 million and Rs. 599.34 million respectively.
Notes to the consolidated financial statementsFor the year ended 30 June 2019

32
NO
N-C
ON
TR
OLL
ING
INT
ER
ES
T
32.1
Gro
up e
ntiti
es
The
follo
win
g ta
ble
sum
mar
izes
the
info
rmat
ion
rela
ting
to th
e G
roup
’s su
bsid
iarie
s th
at h
ave
non
cont
rollin
g in
tere
st (N
CI).
30
Jun
e 20
19A
mou
nt in
Rup
ees
Firs
t Tre
et
Man
ufac
turin
g M
odar
aba
Ren
acon
P
harm
a
Lim
ited
Tre
et
Hol
ding
s L
imite
d
Glo
bal A
rts
Lim
ited
Tre
et H
R
Man
agem
ent
(Priv
ate)
Lim
ited
Tre
et P
ower
Li
mite
d T
reet
Bat
tery
Li
mite
d To
tal
NC
I per
cent
age
2.6
7%4
4.4
0%
0.3
6%
2.53
%0
.36
%0
.36
%0
.36
%
Non
cur
rent
ass
ets
8,7
11,8
78
725
,189
5
24,2
68
2
,192,
30
5 3
0,0
00
-
-
Cur
rent
ass
ets
4,4
81,8
76
23
6,3
78
24
8,8
53
8,6
60
6
2,47
1 9
93
1,
019
Non
-cur
rent
liabi
litie
s 9
,272
-
- 4
44
-
- -
Cur
rent
liabi
litie
s 11
,123
,58
0
44
6,6
58
136
,878
9
7,6
91
25,
60
0
4,6
95
16
Net
ass
ets
2,0
60
,90
2 5
14,9
09
6
36
,24
3
2,10
2,8
30
6
6,8
71
(3,7
02)
1,0
03
Car
ryin
g am
ount
of N
CI
54
,94
0
228
,64
0
2,2
74
53
,26
0
241
(1
3)
4
33
9,3
46
Rev
enue
- ne
t 4
,56
9,4
00
4
17,0
77
273
,58
0
- 2
8,5
36
-
-
(Los
s) /
profi
t afte
r tax
atio
n (2
,39
1,79
2) 2
0,7
21
(4,5
33
) (8
,36
0)
19,6
88
(1
31)
3
Oth
er c
ompr
ehen
sive
inco
me
36
6,0
43
19
,56
2 1,
33
1 4
04
,48
0
- -
-
Tota
l com
preh
ensi
ve in
com
e / (
loss
) (2
,025
,74
9)
40
,28
3
(3,2
02)
39
6,12
0
19,6
88
(1
31)
3
Tota
l com
preh
ensi
ve in
com
e / (
loss
) al
loca
ted
to N
CI
(63
,70
3)
17,8
87
(11)
10,0
33
7
1 -
- (5
4,6
59)
Cas
h flo
ws
from
ope
ratin
g ac
tiviti
es (2
,929
,04
0)
(99
,459
) (1
8,3
94
) 8
1,50
9
22,
856
(1
15)
(4)
Cas
h flo
ws
from
inve
stin
g ac
tiviti
es (2
83
,09
6)
(54
9,7
04
) 3
4,4
87
(10
9,5
05)
(30
,00
0)
1 2
1
Cas
h flo
ws
from
fina
ncin
g ac
tiviti
es 2
,64
4,7
28
50
,00
0
- -
(35,
00
0)
- 1,
00
0
Net
incr
ease
/ (d
ecre
ase)
in c
ash
and
cash
equ
ival
ents
(56
7,4
08
) (5
99
,163
) 16
,09
3
(27,
99
6)
(42,
144
) (1
14)
1,0
17
Notes to the consolidated financial statementsFor the year ended 30 June 2019
6362 2019 Annual Report
Fin
anci
al s
tate
men
t
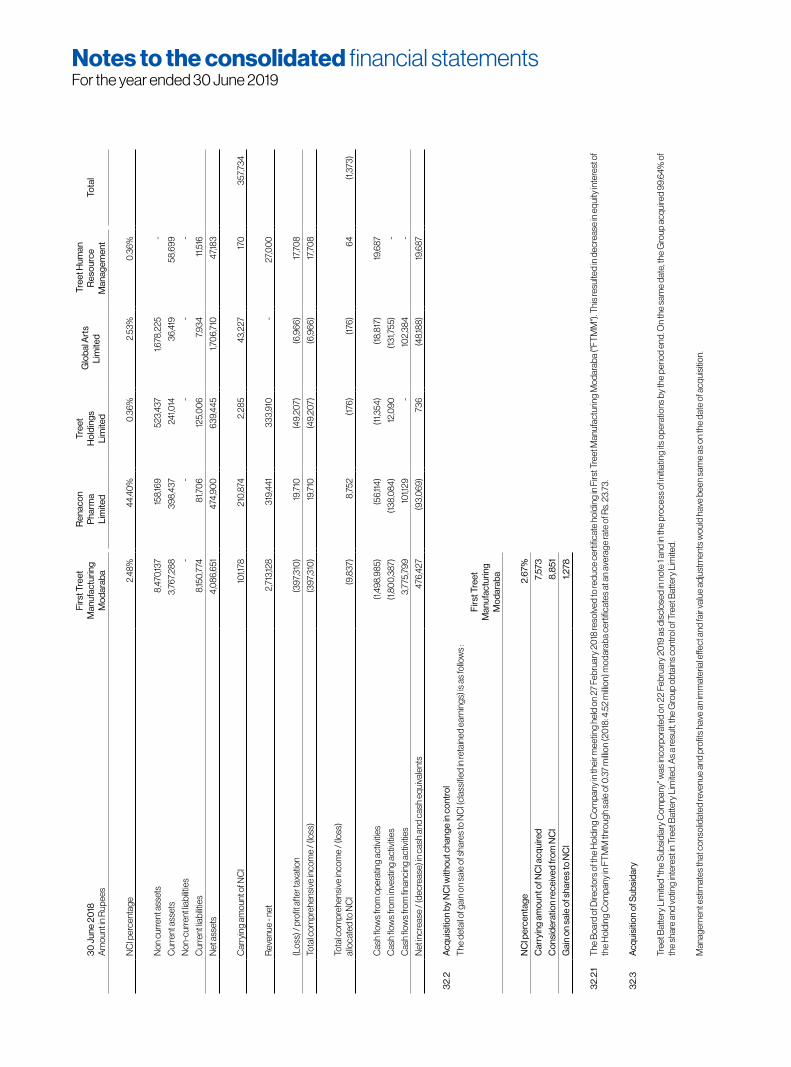
Notes to the consolidated financial statementsFor the year ended 30 June 2019
30
Jun
e 20
18A
mou
nt in
Rup
ees
Firs
t Tre
et
Man
ufac
turin
g M
odar
aba
Ren
acon
P
harm
a
Lim
ited
Tre
et
Hol
ding
s L
imite
d
Glo
bal A
rts
Lim
ited
Tre
et H
uman
R
esou
rce
Man
agem
ent
Tota
l
NC
I per
cent
age
2.48
%44
.40
%0.
36%
2.53
%0.
36%
Non
cur
rent
ass
ets
8,4
70,13
7 15
8,16
9 5
23,4
37
1,67
8,22
5 -
Cur
rent
ass
ets
3,7
67,2
88
398
,437
2
41,0
14
36,
419
58,
699
Non
-cur
rent
liabi
litie
s -
- -
- -
Cur
rent
liabi
litie
s 8
,150,
774
81,7
06
125,
00
6 7
,934
11
,516
Net
ass
ets
4,0
86,6
51
474
,90
0
639
,445
1,
706,
710
4
7,183
Car
ryin
g am
ount
of N
CI
101,1
78
210
,874
2
,285
4
3,22
7 17
0
357
,734
Rev
enue
- ne
t 2
,713
,128
319
,441
3
33,9
10
- 2
7,00
0
(Los
s) /
profi
t afte
r tax
atio
n (3
97,3
10)
19,7
10
(49,
207)
(6,9
66)
17,7
08
Tota
l com
preh
ensi
ve in
com
e / (
loss
) (3
97,3
10)
19,7
10
(49,
207)
(6,9
66)
17,7
08
Tota
l com
preh
ensi
ve in
com
e / (
loss
) al
loca
ted
to N
CI
(9,8
37)
8,7
52
(176
) (1
76)
64
(1,3
73)
Cas
h flo
ws
from
ope
ratin
g ac
tiviti
es (1
,498
,985
) (5
6,11
4) (1
1,354
) (1
8,81
7) 19
,687
Cas
h flo
ws
from
inve
stin
g ac
tiviti
es (1
,80
0,38
7) (1
38,0
84)
12,0
90
(131
,755
) -
Cas
h flo
ws
from
fina
ncin
g ac
tiviti
es 3
,775
,799
10
1,129
-
102,
384
-
Net
incr
ease
/ (d
ecre
ase)
in c
ash
and
cash
equ
ival
ents
476
,427
(9
3,0
69)
736
(4
8,18
8) 19
,687
32.
2A
cqui
sitio
n by
NC
I with
out c
hang
e in
con
trol
The
det
ail o
f gai
n on
sal
e of
sha
res
to N
CI (
clas
sifie
d in
reta
ined
ear
ning
s) is
as
follo
ws
:
Firs
t Tre
et
Man
ufac
turin
g M
odar
aba
NC
I per
cent
age
2.6
7%
Car
ryin
g am
ount
of N
CI a
cqui
red
7,5
73
Con
side
ratio
n re
ceiv
ed fr
om N
CI
8,8
51
Gai
n on
sal
e of
sha
res
to N
CI
1,27
8
32.
2.1
The
Boa
rd o
f Dire
ctor
s of
the
Hol
ding
Com
pany
in th
eir m
eetin
g he
ld o
n 27
Feb
ruar
y 20
18 re
solv
ed to
redu
ce c
ertifi
cate
hol
ding
in F
irst T
reet
Man
ufac
turin
g M
odar
aba
("FT
MM
"). T
his
resu
lted
in d
ecre
ase
in e
quity
inte
rest
of
the
Hol
ding
Com
pany
in F
TM
M th
roug
h sa
le o
f 0.3
7 m
illion
(20
18: 4
.52
milli
on) m
odar
aba
cert
ifica
tes
at a
n av
erag
e ra
te o
f Rs.
23.
73.
32.
3A
cqui
sitio
n of
Sub
sida
ry
Tree
t Bat
tery
Lim
ited
"the
Sub
sidi
ary
Com
pany
" was
inco
rpor
ated
on
22 F
ebru
ary
2019
as
disc
lose
d in
not
e 1 a
nd in
the
proc
ess
of in
itiat
ing
its o
pera
tions
by
the
perio
d en
d. O
n th
e sa
me
date
, the
Gro
up a
cqui
red
99.6
4% o
f th
e sh
are
and
votin
g in
tere
st in
Tre
et B
atte
ry L
imite
d. A
s a
resu
lt, th
e G
roup
obt
ains
con
trol
of T
reet
Bat
tery
Lim
ited.
Man
agem
ent e
stim
ates
that
con
solid
ated
reve
nue
and
profi
ts h
ave
an im
mat
eria
l effe
ct a
nd fa
ir va
lue
adju
stm
ents
wou
ld h
ave
been
sam
e as
on
the
date
of a
cqui
sitio
n.

Note 2019 2018
(Rupees in thousand)
33 REVENUE - NET
Blades and trading income 33.1 6,760,118 6,094,010
Soaps 33.2 900,303 691,438
Corrugated boxes 33.3 1,868,982 1,662,722
Bikes 33.4 263,974 320,476
Battery 33.5 1,760,070 322,189
Hemodialysis concentrates (Pharmaceutical products) 33.6 417,077 319,441
Services of THRM 33.7 1,536 -
11,972,060 9,410,276
33.1 Blades and trading income
Blades and razors
Export sales 2,538,191 2,057,136
Less: Trade discount (9,175) -
2,529,016 2,057,136
Local sales 5,034,908 4,555,991
Less: Sales tax (794,195) (695,304)
Trade discount (104,910) (141,405)
4,135,803 3,719,282
Trading income
Sale of batteries - gross 26,257 515,418
Less: Sales tax (3,472) (77,901)
Trade discount (2,633) (157,663)
20,152 279,854
Trading income
Sale of Chemical - gross 88,161 44,333
Less: Sales tax (12,921) (6,495)
Trade discount (93) (100)
75,147 37,738
6,760,118 6,094,010
33.2 Soaps
Local Sales 1,093,066 841,518
Less: Sales tax (192,155) (148,462)
Trade discount (608) (1,618)
(192,763) (150,080)
900,303 691,438
Notes to the consolidated financial statementsFor the year ended 30 June 2019
6564 2019 Annual Report
Fin
anci
al s
tate
men
t

2019 2018
(Rupees in thousand)
33.3 Corrugated boxes
Local Sales 2,173,367 1,938,792
Less: Sales tax (303,121) (275,339)
Trade discount (1,264) (731)
(304,385) (276,070)
1,868,982 1,662,722
33.4 Bikes
Local Sales 317,369 385,067
Less: Sales tax (52,609) (62,612)
Trade discount (786) (1,979)
(53,395) (64,591)
263,974 320,476
33.5 Battery
Local sales 2,101,686 403,166
Export sales 81,736 -
Less: Sales tax (309,957) (59,944)
Trade discount (113,395) (21,033)
(423,352) (80,977)
1,760,070 322,189
33.6 Hemodialysis concentrates (Pharmaceutical products)
Export sales 39,448 30,563
Local sales 384,240 290,959
Less: Trade discount (6,611) (2,081)
377,629 288,878
417,077 319,441
33.7 Services of THRM
Local sales 1,782 -
Less: Sales tax (246) -
1,536 -
Notes to the consolidated financial statementsFor the year ended 30 June 2019

33
.8D
isag
greg
atio
n of
Rev
enue
In th
e fo
llow
ing
tabl
e, re
venu
e fro
m c
ontr
acts
with
cus
tom
ers
is d
isag
greg
ated
by
prim
ary
geog
rahi
cal m
arke
ts, m
ajor
pro
duct
s an
d se
rvic
e lin
e an
d tim
ing
of re
venu
e re
cogn
ition
.
Bla
des
and
tradi
ng
oper
atio
nsS
oap
Cor
ruga
ted
boxe
sB
ikes
Bat
tery
Hem
odia
lysi
s co
ncen
trate
s H
uman
reso
urce
se
rvic
esTo
tal
2019
2018
2019
2018
2019
2018
2019
2018
2019
2018
2019
2018
2019
2018
2019
2018
----
----
----
----
----
----
----
----
----
----
----
----
----
----
-Rup
ees
in th
ousa
nds-
----
----
----
----
----
----
----
----
----
----
----
----
----
----
-
Prim
ary
Geo
-gr
aphi
cal M
arke
ts
Asi
a 6
,337
,251
5
,712
,810
9
00
,30
3
691
,438
1,
86
8,9
82
1,66
2,72
2 2
63
,974
3
20,4
76
1,75
4,2
36
3
21,12
1 4
10,4
04
3
14,3
30
1,53
6
- 11
,53
6,6
86
9
,022
,897
Afr
ica
- -
- -
- -
- -
- -
6,6
73
5,11
1 -
- 6
,673
5
,111
Eur
ope
148
,34
4
133,
727
- -
- -
- -
- -
- -
- -
148
,34
4
133,
727
US
2
74,5
23
247
,473
-
- -
- -
- 5
,83
4
1,0
68
- -
- -
28
0,3
57
248
,541
6,7
60
,118
6
,094
,010
9
00
,30
3
691
,438
1,
86
8,9
82
1,66
2,72
2 2
63
,974
3
20,4
76
1,76
0,0
70
322
,189
417
,077
3
19,4
41
1,53
6
- 11
,972
,06
0
9,4
10,2
76
Maj
or P
rodu
cts
/ S
ervi
ce L
ines
Bla
des
and
trad
ing
oper
atio
ns 6
,76
0,11
8
6,0
94,0
10
- -
- -
- -
- -
- -
- -
6,7
60
,118
6
,094
,010
Soa
p -
- 9
00
,30
3
691
,438
-
- -
- -
- -
- -
- 9
00
,30
3
691
,438
Cor
ruga
ted
boxe
s -
- -
- 1,
86
8,9
82
1,66
2,72
2 -
- -
- -
- -
- 1,
86
8,9
82
1,66
2,72
2
Bik
es -
- -
- -
- 2
63
,974
3
20,4
76
- -
- -
- -
26
3,9
74
320
,476
Bat
tery
- -
- -
- -
- -
1,76
0,0
70
322
,189
- -
- -
1,76
0,0
70
322
,189
Hem
odia
lysi
s co
ncen
trat
es
- -
- -
- -
- -
- -
417
,077
3
19,4
41
- -
417
,077
3
19,4
41
Hum
an re
sour
ce
serv
ices
- -
- -
- -
- -
- -
- -
1,53
6
- 1,
536
-
6,7
60
,118
6
,094
,010
9
00
,30
3
691
,438
1,
86
8,9
82
1,66
2,72
2 2
63
,974
3
20,4
76
1,76
0,0
70
322
,189
417
,077
3
19,4
41
1,53
6
- 11
,972
,06
0
9,4
10,2
76
Tim
ing
of re
venu
e re
cogn
ition
Pro
duct
s tr
ansf
erre
d at
a
poin
t in
time
6,7
60
,118
6
,094
,010
9
00
,30
3
691
,438
1,
86
8,9
82
1,66
2,72
2 2
63
,974
3
20,4
76
1,76
0,0
70
322
,189
417
,077
3
19,4
41
- -
11
,970
,524
9
,410
,276
Ser
vice
s pr
ovid
ed
over
the
time
- -
- -
- -
- -
- -
- -
1,53
6
- 1,
536
-
6,7
60
,118
6
,094
,010
9
00
,30
3
691
,438
1,
86
8,9
82
1,66
2,72
2 2
63
,974
3
20,4
76
1,76
0,0
70
322
,189
417
,077
3
19,4
41
1,53
6
- 11
,972
,06
0
9,4
10,2
76
Notes to the consolidated financial statementsFor the year ended 30 June 2019
6766 2019 Annual Report
Fin
anci
al s
tate
men
t

Note 2019 2018
(Rupees in thousand)
34 COST OF GOODS SOLD
Blades and trading operations 34.1 4,644,337 4,738,922
Soaps 34.2 783,293 566,281
Corrugated boxes 34.3 1,787,137 1,527,453
Bikes 34.4 279,703 334,382
Battery 34.5 2,905,161 522,839
Hemodialysis concentrates (Pharmaceutical products) 34.6 325,539 253,208
10,725,170 7,943,085
34.1 Cost of goods sold - blades
Raw and packing material consumed 2,356,368 1,956,598
Stores and spares consumed 164,714 208,298
Salaries, wages and other benefits 34.1.1 1,031,236 1,164,526
Fuel and power 268,893 243,633
Freight, octroi and handling 355,992 283,175
Repair and maintenance 22,632 29,683
Rent, rates and taxes 5,149 5,400
Insurance 76,210 79,270
Travelling and conveyance 24,453 18,785
Printing and stationery 22,340 17,956
Postage and telephone 8,005 7,373
Legal and professional charges 926 332
Entertainment 751 1,896
Staff training 949 631
Subscriptions 1,833 787
Depreciation on property, plant and equipment 6.1.2 185,930 156,432
Others 35,505 34,261
4,561,886 4,209,036
Opening stock of work-in-process14
65,068 61,311
Closing stock of work-in-process (51,552) (65,068)
Cost of goods manufactured 4,575,402 4,205,279
Opening stock of finished goods 148,377 234,914
Finished goods purchased for resale - batteries and chemicals 14
100,233 447,106
Closing stock of finished goods (179,675) (148,377)
4,644,337 4,738,922
34.1.1 Salaries, wages and other benefits include Rs. 61.95 million (2018: Rs. 45.42 million) and Rs. 48.43 million (2018: Rs. 47.9 million) in respect of defined benefit schemes and defined contribution schemes respectively.
Notes to the consolidated financial statementsFor the year ended 30 June 2019

Note 2019 2018
(Rupees in thousand)
34.2 Soaps
Raw and packing material consumed 716,823 500,686
Stores and spares consumed 4,204 4,265
Salaries, wages and other benefits 34.2.1 31,449 48,816
Fuel and power 15,939 7,479
Travelling and conveyance 338 632
Repair and maintenance 1,351 1,463
Plant rental 12,260 11,779
Insurance 1,697 2,860
Depreciation on property, plant and equipment 6.1.2 2,809 2,773
Rent, rates and taxes - 177
Manufacturing charges 5,993 4,896
792,863 585,826
Opening stock of work-in-process14
547 1,438
Closing stock of work-in-process - (547)
Cost of goods manufactured 793,410 586,717
Opening stock of finished goods14
42,980 22,544
Closing stock of finished goods (53,097) (42,980)
783,293 566,281
34.2.1 Salaries, wages and other benefits include Rs. 0.36 million (2018: Rs. 2.45 million) in respect of contribution to staff retirement benefit plans.
34.3 Corrugated boxes
Raw and packing material consumed 1,392,283 1,116,401
Stores and spares consumed 58,884 70,290
Salaries, wages and other benefits 34.3.1 216,433 196,466
Fuel and power 67,410 72,208
Repair and maintenance 14,008 16,846
Rent rates and taxes 827 441
Insurance 7,033 4,231
Travelling and conveyance 4,401 2,986
Depreciation on property, plant and equipment 6.1.2 19,062 18,937
Other expenses 10,096 5,750
1,790,437 1,504,556
Opening stock of work in process 10,723 35,353
Closing stock of work in process 14 (6,319) (10,723)
Cost of goods manufactured 1,794,841 1,529,186
Opening stock of finished goods 34,444 32,711
Closing stock of finished goods 14 (42,148) (34,444)
1,787,137 1,527,453
34.3.1 Salaries, wages and other benefits include Rs. 3.54 million (2018: Rs. 9.06 million) in respect of contribution to staff retirement benefit plans.
Notes to the consolidated financial statementsFor the year ended 30 June 2019
6968 2019 Annual Report
Fin
anci
al s
tate
men
t

Note 2019 2018
(Rupees in thousand)
34.4 Bikes
Raw and packing material consumed 34.4.1 254,156 300,453 Carriage inward 457 725 Salaries, wages and other benefits 34.4.2 15,128 15,802 Repair and maintenance 611 815 Printing and stationery 680 516 Freight and Handling 6,392 7,014 Travelling and conveyance 267 235 Depreciation on property, plant and equipment 6.1.2 2,044 2,044 Other expenses 1,358 1,251
281,093 328,855 Opening stock of work-in-process
14 - 9,228
Closing stock of work-in-process - - Cost of goods manufactured 281,093 338,083 Opening stock of finished goods
14 5,680 1,979
Closing stock of finished goods (7,070) (5,680) 279,703 334,382
34.4.1 This includes import of engines of motor bikes amounting to Rs. 18.27 million (2018: Rs. 26.58 million).
34.4.2 Salaries, wages and other benefits includes Rs. 0.22 million (2018: Rs. 0.15 million) and Rs. 0.36 million (2018: Rs. 0.39 million) in respect of defined benefit schemes and defined contribution schemes respectively.
34.5 Battery
Raw material and packing material consumed 1,974,592 563,638 Stores and spares consumed 44,752 - Salaries, wages and other benefits 34.5.1 341,289 127,284 Fuel and power 329,516 86,754 Repair and maintenance 45,696 20,222 Rent, Rates and taxes 947 96 Insurance 23,224 1,625 Traveling and conveyance 25,132 16,724 Depreciation on property, plant and equipment 6.1.2 390,521 107,148 Other manufacturing expenses 27,332 6,399
3,203,001 929,890 Elimination of trial production cost - (16,489)
3,203,001 913,401 Opening stock of work in process
14 242,745 -
Closing stock of work in process (587,427) (242,745)Cost of goods manufactured 2,858,319 670,656
Opening stock of finished goods14
147,817 - Closing stock of finished goods (100,975) (147,817)
2,905,161 522,839
34.5.1 Salaries, wages and other benefits include Rs. 1.59 million (2018: Rs. 7.98) in respect of contribution to staff retirement benefit plans.
Notes to the consolidated financial statementsFor the year ended 30 June 2019

34.6.1 Salaries, wages and other benefits include Rs. 2.90 million (2018: Rs. 1.95 million) in respect of contribution to staff retirement benefit plans.
35 ADMINISTRATIVE EXPENSES
Salaries, wages and other benefits 35.1 289,457 232,548
Repairs and maintenance 3,513 3,471
Rent, rates and taxes 1,746 3,016
Traveling and conveyance 21,006 14,588
Entertainment 1,717 988
Insurance 2,306 1,758
Postage and telephone 1,593 1,758
Printing and stationery 2,946 2,813
Legal and professional charges 35.2 49,505 40,929
Donations 35.3 & 35.4 211,427 115,568
Computer expenses 8,939 6,054
Directors' fee 960 499
Subscription 983 1,579
Depreciation on property, plant and equipment 6.1.2 42,127 33,156
Amortization on intangible asset 8,376 8,376
Other expenses 18,907 19,534
665,508 486,635
Note 2019 2018(Rupees in thousand)
34.6 Hemodialysis concentrates (Pharmaceutical products)
Raw and packing material consumed 261,327 179,500 Salaries wages and other benefits 34.6.1 36,071 44,990 Repair and maintenance 4,124 3,721 Fuel and power 3,622 2,228 Rent, Rates and taxes 94 1,215 Printing and stationery 847 785 Postage and telephone 926 489 Legal and professional 1,463 560 Entertainment 195 103 Travelling 2,542 4,444 Insurance 1,772 1,536 Depreciation on property, plant and equipment 6.1.2 7,778 6,823 Other manufacturing expenses 7,365 7,216
328,126 253,610 Opening stock of work in process
14 675 675
Closing stock of work in process (675) (675)Cost of goods manufactured 328,126 253,610
Opening stock of finished goods14
5,300 4,898 Closing stock of finished goods (7,887) (5,300)
325,539 253,208
Notes to the consolidated financial statementsFor the year ended 30 June 2019
7170 2019 Annual Report
Fin
anci
al s
tate
men
t

35.1 Salaries and other benefits include Rs. 9.52 million (2018: Rs. 7.56 million) and Rs. 13.41 million (2018: Rs. 8.34 million) in respect of defined benefit schemes and defined contribution schemes respectively.
Note 2019 2018(Rupees in thousand)
35.2 Legal and professional charges include the following in respect of auditors’ remuneration:
Audit fees of Holding Company 2,211 1,711
Audit fees of Subsidiary Companies 1,855 1,856
Half yearly reviews 670 670
Out of pocket expenses 471 306
Other services 3,153 2,515
8,360 7,058
35.3 Donations include the payment to following institution in which the director is interested:
Gulab Devi Chest Hospital (GDCH) 779 4,822
Ferozepur Road, Lahore.
(Syed Shahid Ali, CEO is also Chairman of GDCH)
Society for Cultural Education 35.3.1 207,377 108,723
208,156 113,545
35.3.1 Society for Cultural Education (SCE) is a Society registered under the Societies Registration Act, XXI of 1860. SCE although does not have any share capital, the Company is entitled to nominate 70% of the members as well as governing body of SCE. The amount is given as donation to meet the working capital requirements of SCE for ongoing University project as is approved by the shareholders of the Holding Company in their Annual General Meeting held on 31 October 2018.
35.4 Donations to following organizations exceeds Rs. 0.5 million:
Cancer Care Hospital and Research Centre 2,500 1,000
Information Technology University - 500
2,500 1,500
Notes to the consolidated financial statementsFor the year ended 30 June 2019

Note 2019 2018
(Rupees in thousand)
36 DISTRIBUTION COST
Salaries, wages and other benefits 36.1 443,117 375,425
Repair and maintenance 36.2 24,270 60,561
Electricity and gas 724 465
Export commission 4,452 5,097
Advertisement 567,637 463,333
Bad debts written off 5,839 -
Rent, rates and taxes 58,680 55,781
Traveling and conveyance 69,659 50,040
Printing and stationery 936 1,099
Postage and telephone 7,633 7,129
Depreciation on property, plant and equipment 6.1.2 17,664 15,724
Legal and professional charges 189 1,041
Other expenses 165,075 29,199
1,365,875 1,064,894
36.1 Salaries and other benefits include Rs. 8.71 million (2018: Rs. 9.14 million) and Rs. 16.22 million (2018: Rs. 12.92 million) in respect of defined benefit schemes and defined contribution schemes respectively.
36.2 This includes Rs. 18.70 million (2018: Rs. 55.07 million) on account of claims against batteries in respect of trading operations of the Group.
37 FINANCE COST
Markup on short term borrowings 1,085,712 291,703
Markup on participation term certificates 171,889 173,144
Bank charges 28,791 21,067
1,286,392 485,914
38 OTHER OPERATING EXPENSES
Realized exchange loss 38.1 56,098 18,245
Workers' profit participation fund 17.5 22,566 2,017
Interest on Workers' profit participation fund 17.5 142 224
Workers' welfare fund 22.3 1,295 1,017
Unrealized loss on short term investments at fair value through profit or loss 40,923 38,188
Unrealized exchange loss 417 -
121,441 59,691
38.1 This represents loss incurred due to actual currency fluctuations.
Notes to the consolidated financial statementsFor the year ended 30 June 2019
7372 2019 Annual Report
Fin
anci
al s
tate
men
t

Note 2019 2018
(Rupees in thousand)
39 OTHER INCOME
Income from financial assets
Profit on bank deposits 39.1 21,171 23,540
Realized gain on short term investments at fair value through profit or loss 1,532 5,697
Gain on hedging instrument 1,767 -
Dividend income 39.2 3,783 4,587
28,253 33,824
Income from non-financial assets
Profit on disposal of property, plant and equipment 6.1.4 19,813 20,348
Profit on disposal of held for sale land 18,865 -
Profit on disposal of investment property 105 -
Scrap sale 112,509 34,924
Export rebate 54,623 33,247
Reversal of excess impairment allowance 15.3 294 2,825
Others 8,853 4,341
215,062 95,685
243,315 129,509
39.1 The income from savings accounts relating to deposits placed under shariah based arrangement amounting to Rs. 4.95 million (2018: Rs. 4.18 million).
Notes to the consolidated financial statementsFor the year ended 30 June 2019
39.2 Dividend income is received from the following:
Shahtaj Textile Limited 2,345 4,342
Sunrays Textile Mills Limited 319 123
Techlogix International Limited - 122
IGI Holdings Limited 1 -
Maqbool Textile Mills Limited 1,118 -
3,783 4,587
40 TAXATION
Current
- For the year 122,188 88,519
- For prior years (2,027) 7,750
Deferred
- For the year 12.1.2 41,742 44,972
161,903 141,241
Associate 9.2.1 14,579 10,436
40.1 176,482 151,677
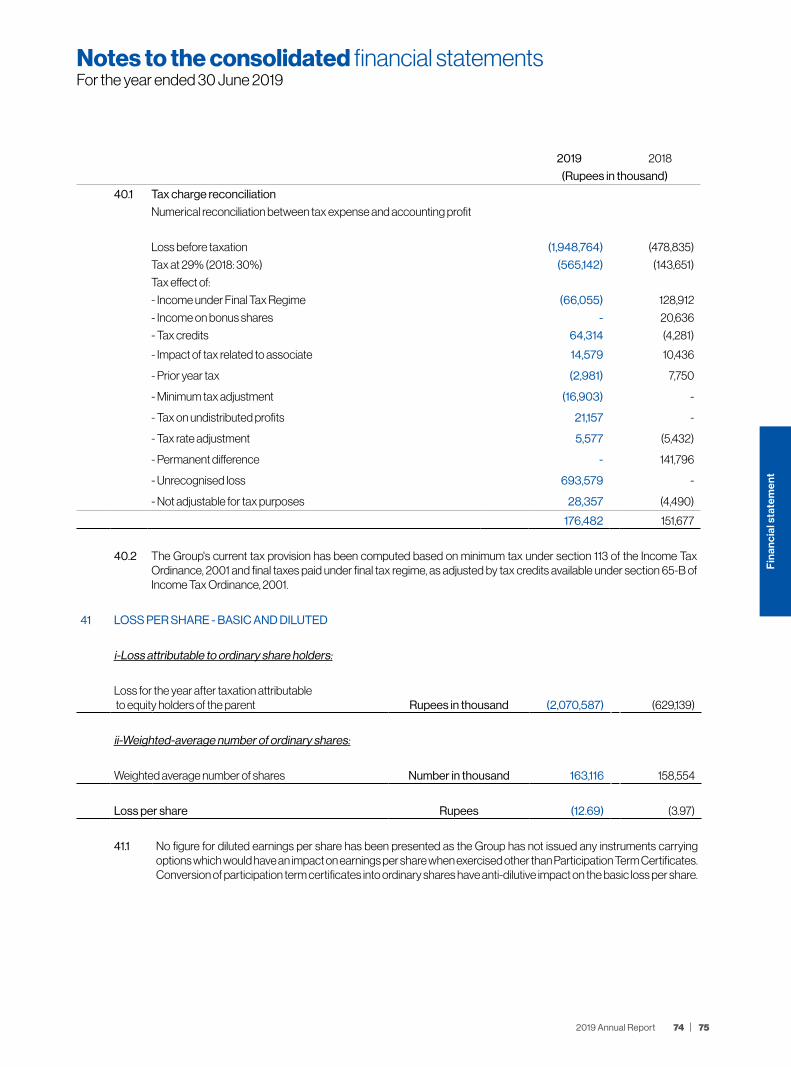
Notes to the consolidated financial statementsFor the year ended 30 June 2019
2019 2018
(Rupees in thousand)
40.1 Tax charge reconciliation
Numerical reconciliation between tax expense and accounting profit
Loss before taxation (1,948,764) (478,835)
Tax at 29% (2018: 30%) (565,142) (143,651)
Tax effect of:
- Income under Final Tax Regime (66,055) 128,912
- Income on bonus shares - 20,636
- Tax credits 64,314 (4,281)
- Impact of tax related to associate 14,579 10,436
- Prior year tax (2,981) 7,750
- Minimum tax adjustment (16,903) -
- Tax on undistributed profits 21,157 -
- Tax rate adjustment 5,577 (5,432)
- Permanent difference - 141,796
- Unrecognised loss 693,579 -
- Not adjustable for tax purposes 28,357 (4,490)
176,482 151,677
40.2 The Group's current tax provision has been computed based on minimum tax under section 113 of the Income Tax Ordinance, 2001 and final taxes paid under final tax regime, as adjusted by tax credits available under section 65-B of Income Tax Ordinance, 2001.
41 LOSS PER SHARE - BASIC AND DILUTED
i-Loss attributable to ordinary share holders:
Loss for the year after taxation attributable to equity holders of the parent Rupees in thousand (2,070,587) (629,139)
ii-Weighted-average number of ordinary shares:
Weighted average number of shares Number in thousand 163,116 158,554
Loss per share Rupees (12.69) (3.97)
41.1 No figure for diluted earnings per share has been presented as the Group has not issued any instruments carrying options which would have an impact on earnings per share when exercised other than Participation Term Certificates. Conversion of participation term certificates into ordinary shares have anti-dilutive impact on the basic loss per share.
7574 2019 Annual Report
Fin
anci
al s
tate
men
t

42
RE
MU
NE
RAT
ION
OF
CH
IEF
EX
EC
UT
IVE
, DIR
EC
TO
RS
AN
D E
XE
CU
TIV
ES
The
agg
rega
te a
mou
nt c
harg
ed in
the
cons
olid
ated
fina
ncia
l sta
tem
ents
for
the
year
for
rem
uner
atio
n, in
clud
ing
cert
ain
bene
fits,
to th
e ch
ief e
xecu
tive,
exe
cutiv
es d
irect
ors,
non
-exe
cutiv
e di
rect
ors
and
exec
utiv
es o
f the
Gro
up is
as
follo
ws: C
hief
Exe
cutiv
eE
xecu
tive
Dire
ctor
sN
on- E
xecu
tive
Dire
ctor
sE
xecu
tives
2019
2018
2019
2018
2019
2018
2019
2018
----
----
----
----
----
----
----
----
----
----
-(R
upee
s in
thou
sand
)---
----
----
----
----
----
----
----
----
Man
ager
ial r
emun
erat
ion
36
,073
3
4,90
9 2
2,78
5 19
,911
-
- 18
1,09
2 14
6,27
6
Pro
vide
nt fu
nd -
- 1,
519
1,
308
- -
8,4
39
6
,663
Ser
vice
fund
- -
1,51
9
1,30
8 -
- 8
,43
9
6,6
63
Hou
sing
fund
- -
- -
- -
12,4
71
9,13
0
Sup
eran
nuat
ion
fund
- II
- -
- -
- -
4,0
20
3,0
26
Ben
evol
ent f
und
- -
- -
- -
3,5
48
2
,80
5
Bon
us -
- 16
,226
13
,80
9 -
- 9
2,15
3
71,7
94
Util
ities
- -
1,51
9
1,30
8 -
- 9
,183
7
,256
Med
ical
3,6
07
3,4
91
1,51
9
1,30
8 -
- 9
,49
0
7,5
35
Fees
- -
- -
570
4
09
- -
39
,68
0
38,
400
4
5,0
87
38,
952
570
4
09
328
,83
5 2
61,14
8
Num
ber o
f per
sons
11
22
55
39
33
42.
1
The
chi
ef e
xecu
tive
office
r, dire
ctor
s an
d ex
ecut
ives
are
pro
vide
d w
ith fr
ee u
se o
f Gro
up m
aint
aine
d ca
rs a
nd te
leph
one
faci
lity,
acc
ordi
ng to
thei
r ent
itlem
ent a
nd a
re a
lso
gran
ted
optio
ns
un
der t
he e
mpl
oyee
s st
ock
optio
n sc
hem
e as
refe
rred
in n
ote
29.
42.
2
T
he C
ompa
ny h
as c
ontr
ibut
ed R
s. 2
.89
milli
on a
nd R
s. 2
.59
milli
on in
gra
tuity
and
sup
eran
nuat
ion
fund
resp
ectiv
ely
for k
ey m
anag
emen
t per
sonn
el.
43
NU
MB
ER
OF
EM
PLO
YE
ES
The
Gro
up h
as e
mpl
oyed
follo
win
g nu
mbe
r of p
erso
ns in
clud
ing
perm
anen
t and
con
trac
tual
sta
ff:
2019
2018
(Num
ber o
f per
sons
)
- As
at 3
0 J
une
3,0
51
2,8
98
- Ave
rage
num
ber o
f em
ploy
ees
2,9
75
2,7
60
Notes to the consolidated financial statementsFor the year ended 30 June 2019

Notes to the consolidated financial statementsFor the year ended 30 June 2019
44 Transactions and balances with related parties
The related parties comprise associated companies, other related group companies, directors of the Group, key management personnel and post employment benefit plans. The Group in the normal course of business carries out transactions with various related parties. Amounts due from and to related parties are shown under loans, advances, deposits, prepayments and other receivables note 17 and trade and other payables note 22 and remuneration of directors and key management personnel are disclosed in note 42. Other significant transactions with related parties are as follows.
Relationship with the group Relationship Nature of transactions 2019 2018
(Rupees in thousand)
I Related Parties
Packages Limited Common directorship Purchase of goods 195,374 166,023
Sale of goods 109 79
IGI General Insurance Limited Common directorship Purchase of services 119,945 57,974
Cutting Edge (Private ) Limited Common directorship Purchase of services 2,587 2,574
Liaquat National Hospital Common directorship Sale of goods - 15,451
Loads Limited Common directorship Finance cost paid - PTC 7,582 7,582
Hi - Tech Alloy Wheels Limited Common directorship Services Rendered 1,782 -
Elite Brands Limited Common directorship Sale of goods 458,964 175,869
II Post employment benefit plans
Superannuation fund Contribution 37,412 35,410
Gratuity fund Contribution 43,563 25,942
Provident fund Contribution 33,786 26,572
Service fund Contribution 18,636 3,241
Housing fund Contribution 17,885 31,770
Benevolent fund Contribution 4,281 2,065
Superannuation fund - II Contribution 5,351 4,764
All transactions with related parties have been carried out on mutually agreed terms and conditions.
7776 2019 Annual Report
Fin
anci
al s
tate
men
t
45 FINANCIAL RISK MANAGEMENT
45.1 Financial risk factors
The Group’s activities expose it to a variety of financial risks: credit risk, liquidity risk and market risk (including currency risk, interest rate risk and other price risk). The Group’s overall risk management program focuses on the unpredictability of financial markets and seeks to minimize potential adverse effects on the financial performance.
The Group’s Board of Directors (“the Board”) has overall responsibility for establishment and oversight of the Group’s risk management framework. The Board is responsible for developing and monitoring the Group’s risk management policies.
The Group’s risk management policies are established to identify and analyze the risks faced by the Group, to set appropriate risk limits and controls, and to monitor risk and adherence to limits. Risk management policies and systems are reviewed regularly to reflect changes in market conditions and Group’s activities. The Group, through its training and management standards and procedures, aims to develop a disciplined and constructive control environment in which all employees understand their roles and obligations.
The Group’s audit committee oversees how management monitors compliance with the Group’s risk management policies and procedures and reviews the adequacy of the risk management framework in relation to the risks faced by the Group. Audit committee is assisted in its oversight role by internal audit department. Internal audit department undertakes both regular and adhoc reviews of risk management controls and procedures, the results of which are reported to the audit committee.
The Group’s exposure to financial risk, the way these risks affect the financial position and performance and the manner in which such risks are managed is as follows:
45.2 Credit risk
Credit risk represents the risk of financial loss if a customer or counterparty to a financial instrument fails to meet its contractual obligations and arises principally from trade receivables. Out of the total financial assets of Rs. 1,533 million (2018: Rs. 2,113 million), the financial assets which are subject to credit risk amounted to Rs. 1,676.85 million (2018: Rs. 2,250.10 million).
To manage exposure to credit risk in respect of trade receivables, management performs credit reviews taking into account the customer’s financial position, past experience and other factors. Exports sales are either secured through letter of credit or a foreign bank guarantee is obtained. Majority of the local sales are made through distributors.
All investing transactions are settled / paid for upon delivery as per the advice of investment committee. The Group’s policy is to enter into financial instrument contract by following internal guidelines such as approving counterparties and approving credits.
Concentration of credit risk arises when a number of counter parties are engaged in similar business activities or have similar economic features that would cause their abilities to meet contractual obligation to be similarly effected by the changes in economic, political or other conditions. The management believes that it is not exposed to major concentration of credit risk.
Notes to the consolidated financial statementsFor the year ended 30 June 2019
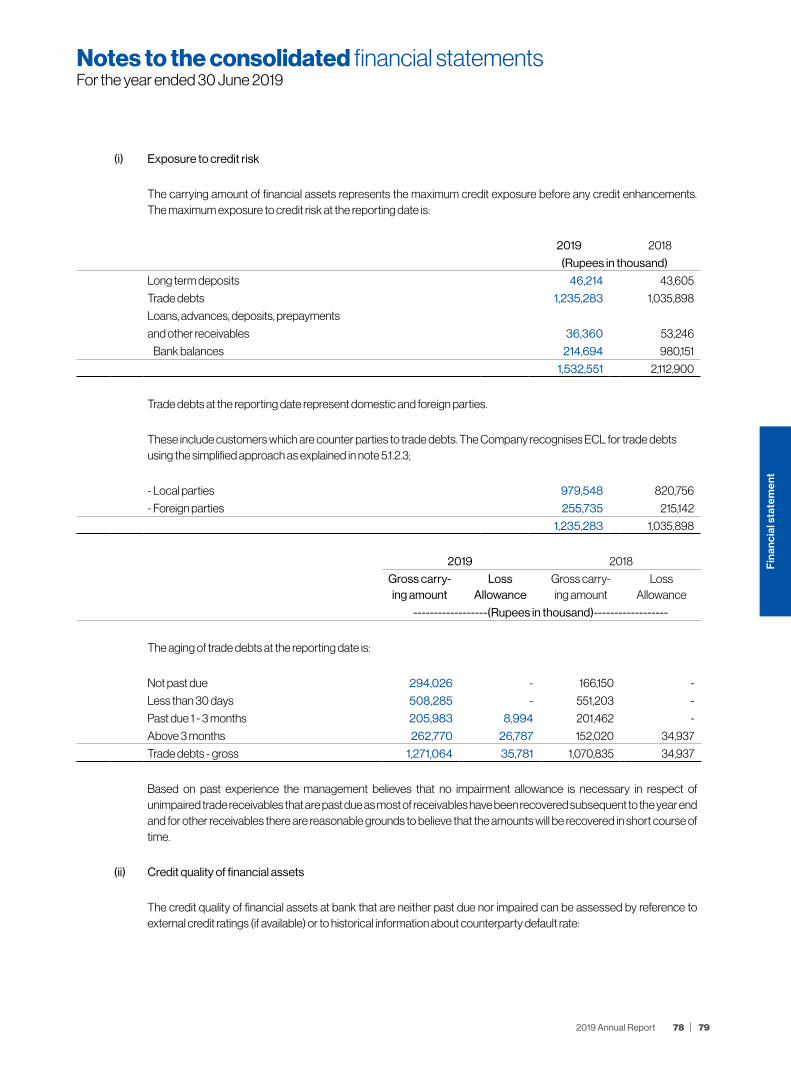
(i) Exposure to credit risk
The carrying amount of financial assets represents the maximum credit exposure before any credit enhancements. The maximum exposure to credit risk at the reporting date is:
2019 2018
(Rupees in thousand)
Long term deposits 46,214 43,605
Trade debts 1,235,283 1,035,898
Loans, advances, deposits, prepayments
and other receivables 36,360 53,246
Bank balances 214,694 980,151
1,532,551 2,112,900
Trade debts at the reporting date represent domestic and foreign parties.
These include customers which are counter parties to trade debts. The Company recognises ECL for trade debts using the simplified approach as explained in note 5.1.2.3;
- Local parties 979,548 820,756
- Foreign parties 255,735 215,142
1,235,283 1,035,898
Notes to the consolidated financial statementsFor the year ended 30 June 2019
2019 2018
Gross carry-ing amount
Loss Allowance
Gross carry-ing amount
Loss Allowance
------------------(Rupees in thousand)------------------
The aging of trade debts at the reporting date is:
Not past due 294,026 - 166,150 -
Less than 30 days 508,285 - 551,203 -
Past due 1 - 3 months 205,983 8,994 201,462 -
Above 3 months 262,770 26,787 152,020 34,937
Trade debts - gross 1,271,064 35,781 1,070,835 34,937
Based on past experience the management believes that no impairment allowance is necessary in respect of unimpaired trade receivables that are past due as most of receivables have been recovered subsequent to the year end and for other receivables there are reasonable grounds to believe that the amounts will be recovered in short course of time.
(ii) Credit quality of financial assets
The credit quality of financial assets at bank that are neither past due nor impaired can be assessed by reference to external credit ratings (if available) or to historical information about counterparty default rate:
7978 2019 Annual Report
Fin
anci
al s
tate
men
t
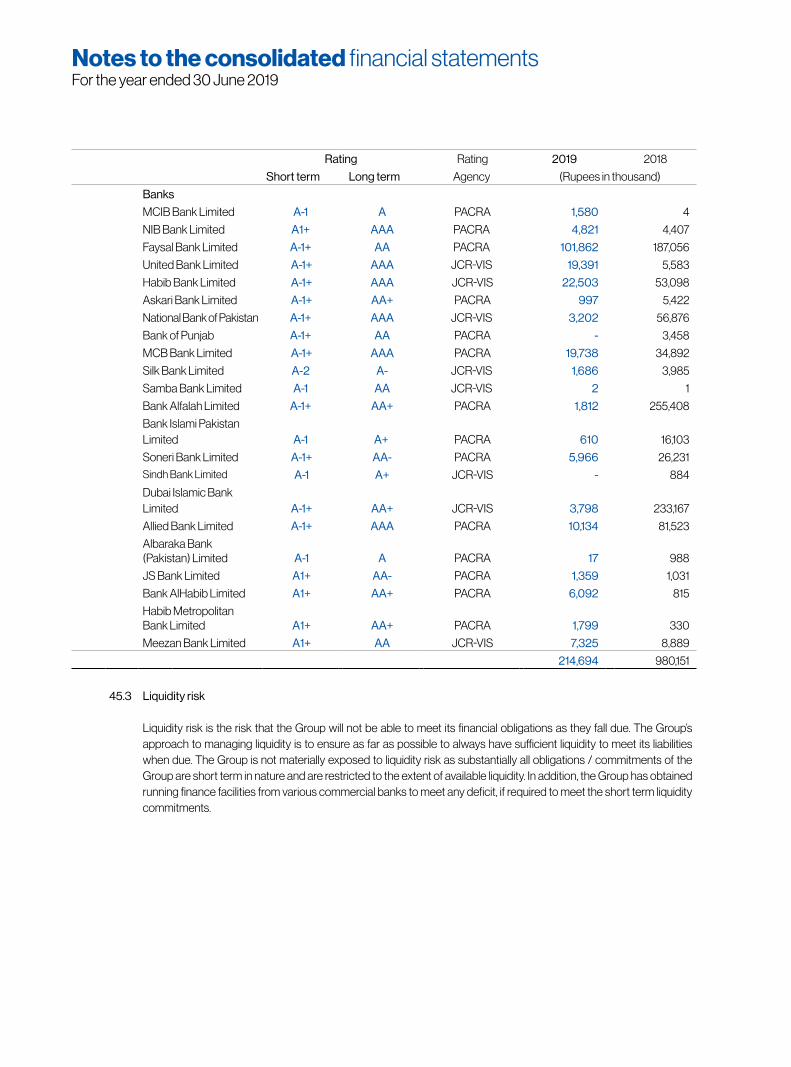
Rating Rating 2019 2018
Short term Long term Agency (Rupees in thousand)
Banks
MCIB Bank Limited A-1 A PACRA 1,580 4
NIB Bank Limited A1+ AAA PACRA 4,821 4,407
Faysal Bank Limited A-1+ AA PACRA 101,862 187,056
United Bank Limited A-1+ AAA JCR-VIS 19,391 5,583
Habib Bank Limited A-1+ AAA JCR-VIS 22,503 53,098
Askari Bank Limited A-1+ AA+ PACRA 997 5,422
National Bank of Pakistan A-1+ AAA JCR-VIS 3,202 56,876
Bank of Punjab A-1+ AA PACRA - 3,458
MCB Bank Limited A-1+ AAA PACRA 19,738 34,892
Silk Bank Limited A-2 A- JCR-VIS 1,686 3,985
Samba Bank Limited A-1 AA JCR-VIS 2 1
Bank Alfalah Limited A-1+ AA+ PACRA 1,812 255,408
Bank Islami Pakistan Limited A-1 A+ PACRA 610 16,103
Soneri Bank Limited A-1+ AA- PACRA 5,966 26,231 Sindh Bank Limited A-1 A+ JCR-VIS - 884
Dubai Islamic Bank Limited A-1+ AA+ JCR-VIS 3,798 233,167
Allied Bank Limited A-1+ AAA PACRA 10,134 81,523
Albaraka Bank (Pakistan) Limited A-1 A PACRA 17 988
JS Bank Limited A1+ AA- PACRA 1,359 1,031
Bank AlHabib Limited A1+ AA+ PACRA 6,092 815
Habib Metropolitan Bank Limited A1+ AA+ PACRA 1,799 330
Meezan Bank Limited A1+ AA JCR-VIS 7,325 8,889
214,694 980,151
45.3 Liquidity risk
Liquidity risk is the risk that the Group will not be able to meet its financial obligations as they fall due. The Group’s approach to managing liquidity is to ensure as far as possible to always have sufficient liquidity to meet its liabilities when due. The Group is not materially exposed to liquidity risk as substantially all obligations / commitments of the Group are short term in nature and are restricted to the extent of available liquidity. In addition, the Group has obtained running finance facilities from various commercial banks to meet any deficit, if required to meet the short term liquidity commitments.
Notes to the consolidated financial statementsFor the year ended 30 June 2019

The following are the contractual maturities of the financial liabilities, including estimated interest payments:
2 0 1 9
Carrying Amount
Contractual cash flows
Less than one year
One to five years
More than five years
(Rupees in thousand)
Financial liabilities
Short term borrowings 13,066,427 13,066,427 13,066,427 - -
Trade and other payables 1,096,471 1,096,471 1,096,471 - -
Unclaimed dividend 13,274 13,274 13,274 - -
Accrued mark-up 485,136 485,136 485,136 - -
Long term deposits 1,214 1,214 - 1,214 -
Redeemable capital 178,166 178,161 178,161 - -
Retention money 23,100 23,100 23,100 - -
14,863,788 14,863,783 14,862,569 1,214 -
2 0 1 8
Carrying Amount
Contractual cash flows
Less than one year
One to five years
More than five years
(Rupees in thousand)
Financial liabilities
Short term borrowings 9,700,404 9,700,404 9,700,404 - -
Trade and other payables 799,938 799,938 799,938 - -
Unclaimed dividend 13,335 13,335 13,335 - -
Accrued mark-up 298,001 298,001 298,001 - -
Long term deposits 1,214 1,214 - 1,214 -
Liability against purchase of land
56,426 56,426 56,426 - -
Redeemable capital 357,583 538,248 179,416 358,832 -
Retention money 54,734 54,734 54,734 - -
11,281,635 11,462,300 11,102,254 360,046 -
45.4 Market risk
Market risk is the risk that changes in market prices, such as foreign exchange rates, interest rates and equity prices will affect the Group’s income or the value of its holdings of financial instruments.
45.4.1 Currency risk
The Group is exposed to currency risk on import of raw materials and stores and spares and export of goods mainly denominated in US Dollars, GBP Pounds and Euros and on foreign currency bank accounts. The Group’s exposure to foreign currency risk for US Dollars, GBP Pounds and Euros is as follows.
Notes to the consolidated financial statementsFor the year ended 30 June 2019
8180 2019 Annual Report
Fin
anci
al s
tate
men
t

2019 2018(Rupees in thousand)
Outstanding letters of credit & creditors (US dollars) 226,336 740,904 Outstanding letters of credit (Euros) 136,616 84,398 Outstanding letters of credit (Pounds) 3,046 -
The following significant exchange rate has been applied: Average rate Reporting date rate
2019 2018 2019 2018
Rupees per USD 143.05 113.30 164.50 121.60 Rupees per Euros 164.28 130.86 186.99 141.57 Rupees per Pound 104.23 - 208.45 -
At reporting date, if the Pakistani Rupees has fluctuated by 10% against the above mentioned currencies with all other variables held constant, pre-tax loss would have been higher/ lower by Rs. 22.63 million (2018: Rs. 74.09 million) and Rs. 13.66 (2018: Rs. 8.44 million) and 0.30 million respectively, mainly as a result of net foreign exchange gain / loss on translation of foreign exchange denominated financial instruments.
The sensitivity analysis prepared is not necessarily indicative of the effects on loss for the year and assets / liabilities of the Group.
45.4.2 Interest rate risk
At the reporting date the interest rate profile of the Group’s significant interest bearing financial instruments were as follows:
2019 2018 2019 2018 Effective rate (Rupees in thousand) (Percentage)
Financial assets
Fixed rate instruments
Bank balances - deposit accounts 4 .25- 10.50 4 - 7 146,717 639,894
Financial liabilities
Floating rate instrument
Short term borrowings 2.40 - 14.14 2.4 -9.4 13,066,427 9,700,404
Fair value sensitivity analysis for fixed rate instruments
The Group does not account for any fixed rate financial assets and liabilities at fair value through profit or loss. Therefore a change in interest rates at the reporting date would not affect profit and loss account.
Cash flow sensitivity analysis for variable rate instruments
If interest rates on short term borrowings, at the year end rate, fluctuate by 1% with all the other variables held constant, pre-tax loss for the year would have been higher/ lower by Rs. 184.02 million (2018: Rs 49.44 million), mainly as a result of higher/ lower interest expense on floating rate borrowings.
Notes to the consolidated financial statementsFor the year ended 30 June 2019

45.5 Fair value measurement of financial instruments
Fair value is the price that would be received to sell an asset or paid to transfer a liability in an orderly transaction between market participants at the measurement date.
Underlying the definition of fair value is the presumption that the company is a going concern and there is no inten-tion or requirement to curtail materially the scale of its operations or to undertake a transaction on adverse terms.
A financial instrument is regarded as quoted in an active market if quoted prices are readily and regularly available from an exchange dealer, broker, industry group, pricing service, or regulatory agency and those prices represent actual and regularly occurring market transactions on an arm’s length basis.
IFRS 13 ‘Fair Value Measurement’ requires the company to classify fair value measurements and fair value hierarchy that reflects the significance of the inputs used in making the measurements of fair value hierarchy has the following levels:
- Quoted prices (unadjusted) in active markets for identical assets or liabilities (Level 1)
- Inputs other than quoted prices included within level 1 that are observable for the asset either directly (that is, derived from prices) (Level 2)
- Inputs for the asset or liability that are not based on observable market data (that is, unadjusted) inputs (Level 3)
Transfer between levels of the fair value hierarchy are recognized at the end of the reporting period during which the changes have occurred.
The following table shows the carrying amounts and fair values of financial assets and financial liabilities, including their levels in the fair value hierarchy. It does not include fair value information for financial assets and financial liabilities not measured at fair value if the carrying amount is a reasonable approximation of fair value.
Notes to the consolidated financial statementsFor the year ended 30 June 2019
45.4.3 Other price risk
Other price risk is the risk that the fair value or future cash flows of a financial instrument will fluctuate because of changes in market prices (other than those arising from interest rate risk or currency risk). Other price risk arises from the Group’s investment in units of mutual funds and ordinary shares of listed companies. To manage its price risk arising from aforesaid investments, the Group diversifies its portfolio and continuously monitors developments in equity markets. In addition the Group actively monitors the key factors that affect stock price movement.
A 10% increase in share prices at the year end would have impacted the Group’s profit in case of held for trading investments is as follows:
2019 2018 (Rupees in thousand)
Effect on profit and loss (43,535) (46,248)Effect on investments (43,535) (46,248)
The sensitivity analysis prepared is not necessarily indicative of the effects on profit and loss, equity and assets of the Group.
8382 2019 Annual Report
Fin
anci
al s
tate
men
t

Car
ryin
g am
ount
Fair
valu
e
Fair
valu
eth
roug
hO
CI
Fair
valu
eth
roug
h pr
ofit
or lo
ss
Loan
and
rece
ivab
les
Cas
h an
d ca
sh
equi
vale
nts
Oth
erfin
anci
allia
bilit
ies
Tota
lLe
vel 1
Leve
l 2Le
vel 3
Tota
l
Not
e--
----
----
----
----
----
----
----
----
----
----
----
----
----
----
--(R
upee
s in
thou
sand
)---
----
----
----
----
----
----
----
----
----
----
----
----
----
----
-
30-J
un-19
Fina
ncia
l ass
ets
- mea
sure
d at
fair
valu
e
Long
term
avai
labl
e fo
r sal
e in
vest
men
ts9
1,55
5 -
- -
- 1,
555
- -
1,55
5 1,
555
Shor
t ter
m in
vest
men
ts16
- 4
35,3
48
- -
- 4
35,3
48
435
,348
-
- 4
35,3
48
1,55
5 4
35,3
48
- -
- 4
36,9
03
435
,348
-
1,55
5 4
36,9
03
Fina
ncia
l ass
ets
- not
mea
sure
d at
fair
valu
e
Long
term
dep
osits
11
- -
46,
214
- -
46,
214
- -
- -
Trad
e de
bts
15 -
- 1,
235,
283
- -
1,23
5,28
3 -
- -
-
Adva
nces
, pre
paym
ents
and
oth
er re
ceiva
bles
17 -
- 3
6,36
0 -
- 3
6,36
0 -
- -
-
Cas
h an
d ba
nk b
alan
ces
18 -
- -
358
,990
-
358
,990
-
- -
-
- -
1,31
7,85
7 3
58,9
90
- 1,
676,
847
- -
- -
Fina
ncia
l liab
ilitie
s - m
easu
red
at fa
ir va
lue
- -
- -
- -
- -
- -
Fina
ncia
l liab
ilitie
s - n
ot m
easu
red
at fa
ir va
lue
Shor
t ter
m b
orro
win
gs21
- -
- -
13,0
66,4
27 1
3,06
6,42
7 -
- -
-
Trad
e an
d ot
her p
ayab
les
22 -
- -
- 1,
096,
471
1,09
6,47
1 -
- -
-
Unc
laim
ed d
ivide
nd -
- -
- 13
,274
13
,274
-
- -
-
Accr
ued
mar
k-up
23 -
- -
-
485
,136
485
,136
- -
- -
Long
term
dep
osits
-
- -
-
1,21
4 1,
214
- -
- -
Rede
emab
le c
apita
l25
- -
- -
17
8,16
6 17
8,16
6 -
- -
-
Rete
ntio
n m
oney
20 -
- -
- 2
3,10
0 2
3,10
0 -
- -
-
- -
- -
14,8
63,7
88 1
4,86
3,78
8 -
- -
-
Notes to the consolidated financial statementsFor the year ended 30 June 2019

Car
ryin
g am
ount
Fair v
alue
Fair v
alue
thro
ugh
OC
I
Fair v
alue
thro
ugh
profi
tor
loss
Loan
and
rece
ivabl
es
Cas
h an
d ca
sh
equi
vale
nts
Oth
erfin
anci
allia
biliti
esTo
tal
Leve
l 1Le
vel 2
Leve
l 3To
tal
Not
e--
----
----
----
----
----
----
----
----
----
----
----
----
----
----
--(R
upee
s in
thou
sand
)---
----
----
----
----
----
----
----
----
----
----
----
----
----
----
-
30-J
un-18
Fina
ncia
l ass
ets
- mea
sure
d at
fair
valu
e
Long
term
avai
labl
e fo
r sal
e in
vest
men
ts9
1,55
5 -
- -
- 1,
555
- -
1,55
5 1,
555
Shor
t ter
m in
vest
men
ts16
- 4
62,4
84
- -
- 4
62,4
84
462
,484
-
- 4
62,4
84
1,55
5 4
62,4
84
- -
- 4
64,0
39
462
,484
-
1,55
5 4
64,0
39
Fina
ncia
l ass
ets
- not
mea
sure
d at
fair
valu
e
Long
term
dep
osits
11 -
- 4
3,60
5 -
- 4
3,60
5 -
- -
-
Trad
e de
bts
15 -
- 1,0
35,8
98
- -
1,035
,898
-
- -
-
Adva
nces
, pre
paym
ents
and
oth
er re
ceiva
bles
17 -
- 5
3,24
6 -
- 5
3,24
6 -
- -
-
Cas
h an
d ba
nk b
alan
ces
18 -
- -
1,118
,210
-
1,118
,210
-
- -
-
- -
1,132
,749
1,118
,210
-
2,2
50,9
59
- -
- -
Fina
ncia
l liab
ilitie
s - m
easu
red
at fa
ir va
lue
- -
- -
- -
- -
- -
Fina
ncia
l liab
ilitie
s - n
ot m
easu
red
at fa
ir va
lue
Shor
t ter
m b
orro
win
gs21
- -
- -
9,70
0,40
4 9
,700,
404
- -
- -
Trad
e an
d ot
her p
ayab
les
22 -
- -
- 79
9,93
8 79
9,93
8 -
- -
-
Unc
laim
ed d
ivide
nd -
- -
- 13
,335
13
,335
-
- -
-
Accr
ued
mar
k-up
23 -
- -
- 2
98,0
01
298
,001
-
- -
-
Long
term
dep
osits
24 -
- -
- 1,
214
1,21
4 -
- -
-
Liab
ility a
gain
st p
urch
ase
of la
nd20
- -
- -
56,
426
56,
426
- -
- -
Rede
emab
le c
apita
l25
- -
- -
357
,583
3
57,5
83
- -
- -
Rete
ntio
n m
oney
20 -
- -
- 5
4,73
4 5
4,73
4 -
- -
-
- -
- -
11,2
81,6
35
11,2
81,6
35
- -
- -
Notes to the consolidated financial statementsFor the year ended 30 June 2019
8584 2019 Annual Report
Fin
anci
al s
tate
men
t
45.6 Operational risk
Operational risk is the risk of direct or indirect loss arising from a wide variety of causes associated with the Group’s processes, personnel, technology and infrastructure, and from external factors other than credit, market and liquidity risks such as those arising from legal and regulatory requirements and generally accepted standards of corporate behavior. Operational risks arise from all of the Group’s operations.
The Group’s objective is to manage operational risk so as to balance the avoidance of financial losses and damage to the Group’s reputation with overall cost effectiveness and to avoid control procedures that restrict initiative and creativity.
The primary responsibility for the development and implementation of controls to address operational risk is assigned to senior management within the Group. This responsibility is supported by the development of overall company standards for the management of operational risk in the following areas:
- Requirements for appropriate segregation of duties, including the independent authorization of transactions
- Requirements for the reconciliation and monitoring of transactions
- Compliance with regulatory and other legal requirements
- Documentation of controls and procedures
- Requirements for the periodic assessment of operational risks faced, and the adequacy of controls and procedures to address the risks identified
- Requirements for the reporting of operational losses and proposed remedial action
- Development of contingency plans
- Training and professional development
- Ethical and business standards
- Risk mitigation including insurance where this is effective
45.7 Capital risk management
The Group`s policy is to maintain an efficient capital base so as to maintain investor, creditor and market confidence and to sustain the future development of our business. The Board of Directors monitor the return on capital employed, which the Group defines as operating income divided by total capital employed. The Board of Directors also monitor the level of profit attributed to ordinary shareholders.
The Group’s objectives when managing capital are:
a) to safeguard the Group’s ability to continue as a going concern, so that it can continue to provide returns for shareholders and benefits for other stakeholders, and
b) to provide an adequate return to shareholders.
The Group manages the capital structure in the context of economic conditions and the risk characteristics of the underlying assets. In order to maintain or adjust the capital structure, the Group may, for example, adjust the amount of dividends attributed to shareholders, issue new shares, or sell assets to reduce debt. The Group monitors capital on the basis of the gearing ratio of total debt (current and non-current borrowings) to debt plus equity.
Notes to the consolidated financial statementsFor the year ended 30 June 2019

46 OPERATING SEGMENTS
46.1 Geographical Information
Significant sales are made by the Group in the following countries:
Pakistan 9,403,596 7,322,577
Saudi Arabia 514,322 511,192
United Arab Emirates 283,592 306,847
China 356,329 255,900
Bangladesh 246,110 189,865
Jordan 44,259 27,417
Singapore 234,951 163,489
Sri Lanka 111,107 -
Yemen 131,941 56,045
Brazil - 57,398
Lebanon 148,344 97,013
Uzbekistan 129,147 80,946
Tajikistan 68,417 -
Other countries 299,945 341,587
11,972,060 9,410,276
Sales are attributed to countries on the basis of the customers’ location.
46.2 Business segments
A business segment is a group of assets and operations engaged in providing products that are subject to risk and returns, that are different from those of other business segments. As at 30 June 2019 the Group is engaged into following main business segments:
(i) Manufacture and sale of blades;
(ii) Manufacture and sale of soaps
(iii) Manufacture and sale of corrugated boxes
(iv) Assembling and sale of motor bikes
(v) Manufacture and sale of battery;
(vi) Manufacturing and sale of hemodialysis concentrates (pharmaceutical products).
Notes to the consolidated financial statementsFor the year ended 30 June 2019
The debt to equity ratios were as follows:
2019 2018
(Rupees in thousand)
Total debt 13,267,693 10,169,147
Total equity and debt 23,414,016 18,876,743
Debt to equity ratio 57% 54%
The Group is not subject to externally imposed capital requirements.
8786 2019 Annual Report
Fin
anci
al s
tate
men
t

46
.3 B
lade
s
Bat
tery
S
oaps
C
orru
gate
d bo
xes
Bik
es
Pha
rmac
eutic
al P
rodu
cts
Oth
ers
Tot
al
2019
2018
2019
2018
2019
2018
2019
2018
2019
2018
2019
2018
2019
2018
2019
2018
Not
e --
----
----
----
----
----
----
----
----
----
----
----
----
----
----
---R
upee
s in
thou
sand
----
----
----
----
----
----
----
----
----
----
----
----
----
----
----
-
Rev
enue
- ex
tern
al c
usto
mer
s 7
,66
1,26
0
7,17
2,87
8 2
,20
9,6
79
410
,50
1 1,
09
3,0
66
8
41,5
18
2,13
3,3
22
1,90
2,0
13
317
,36
9
371
,633
4
23,6
88
3
21,5
22
1,78
2 -
13,8
40
,166
11
,020
,065
- in
ter s
egm
ent
- -
- -
- -
40
,04
5 3
6,77
9 -
13,4
34
- -
- -
40
,04
5 5
0,21
3
7,6
61,2
60
7
,172,
878
2,2
09
,679
4
10,5
01
1,0
93
,06
6
841
,518
2
,173
,36
7 1,
938,
792
317
,36
9
385
,067
4
23,6
88
3
21,5
22
1,78
2 -
13,8
80
,211
11
,070
,278
Les
s : S
ales
tax
80
7,116
7
79,7
00
3
13,4
29
59,
944
192,
155
148,
462
30
3,12
1 2
75,3
39
52,
60
9
62,
612
- -
24
6
- 1,
66
8,6
76
1,32
6,0
57
Tr
ade
disc
ount
11
4,17
8
299
,168
116
,028
2
1,033
6
08
1,
618
1,26
4
731
7
86
1,
979
6,6
11
2,0
81
- -
23
9,4
75
326
,610
Tr
ial r
un c
ost
- -
- 7
,335
-
- -
- -
- -
- -
- -
7,3
35
921
,29
4
1,07
8,86
8 4
29,4
57
88,
312
192,
763
15
0,0
80
30
4,3
85
276
,070
5
3,3
95
64,
591
6,6
11
2,0
81
24
6
- 1,
90
8,15
1 1,
660,
00
2
Net
reve
nue
6,7
39
,96
6
6,0
94,0
10
1,78
0,2
22
322
,189
90
0,3
03
6
91,4
38
1,8
68
,98
2 1,
662,
722
26
3,9
74
320
,476
4
17,0
77
319
,441
1,
536
-
11,9
72,0
60
9
,410
,276
Cos
t of s
ales
4
,64
4,3
37
4,4
55,74
7 2
,90
5,16
1 5
22,8
39
78
3,2
93
5
66,2
81
1,78
7,137
1,
527,4
53
279
,70
3
327
,368
3
25,5
39
2
53,2
08
- -
10,7
25,17
0
7,6
52,8
96
Gro
ss p
rofit
/ (lo
ss)
2,0
95,
629
1,
638,
263
(1,12
4,9
39
) (2
00,
650
) 11
7,0
10
125,
157
81,8
45
135,
269
(15,
729
) (6
,892
) 9
1,53
8
66,
233
1,53
6
- 1,
246
,89
0
1,75
7,38
0
Inte
r com
pany
/ in
ter
segm
ent -
net
sal
es
- -
- -
- -
40
,04
5 7
3,60
8 -
13,4
34
- -
- -
40
,04
5 8
7,042
Inte
r com
pany
/ in
ter
segm
ent -
pur
chas
es
(24
,90
2) (2
5,94
6) -
- -
(36,
779)
- -
- (1
3,43
4) (1
5,14
3)
(10,
883)
- -
(40
,04
5) (8
7,042
)
Gro
ss p
rofit
/ (lo
ss) -
seg
men
t w
ise
2,0
70,7
27
1,61
2,31
7 (1
,124
,93
9)
(20
0,65
0)
117,
010
8
8,37
8 12
1,89
0
20
8,87
7 (1
5,72
9)
(6,8
92)
76
,39
5 5
5,35
0
1,53
6
- 1,
246
,89
0
1,75
7,38
0
Adm
inis
trat
ive
expe
nses
3
5
Allo
cate
d 5
75,3
35
40
4,10
0
5,8
11
30,
089
3
6,6
98
3
,359
2
5,50
2 2
5,97
7 2
,926
6
,274
8
,49
5 10
,054
1,
46
4
- 6
56,2
31
479
,853
Una
lloca
ted
-
- -
- -
- -
- -
- -
- -
- 9
,276
6
,782
Dis
trib
utio
n co
st
36 8
80
,66
3
1,0
92,8
38
8,8
96
5
3,11
8 2
60
,054
19
,579
17
2,0
15
131,6
75
18,19
0
28,
649
26
,057
2
9,22
4 -
- 1,
36
5,8
75
1,35
5,0
83
Seg
men
t res
ults
- O
pera
ting
loss
6
14,7
29
115,
379
(1,13
9,6
46
) (2
83,8
57)
(179
,74
2) 6
5,44
0
(75,
627
)51
,225
(3
6,8
45)
(41,8
15)
41,8
42
16,0
72
72
- (7
84
,49
3)
(84,
338)
Impa
irmen
t los
s on
tr
ade
debt
s15
.3(8
,70
0)
(9,0
19)
Fin
ance
cos
t 37
(1,2
86
,39
2) (4
85,9
14)
Oth
er o
pera
ting
expe
nses
38
(121
,441
) (5
9,69
1)
Oth
er in
com
e 39
24
3,3
15
129,
509
(1,9
57,7
11)
(50
9,45
3)
Sha
re o
f pro
fit o
f ass
ocia
te in
clud
ing
dilu
tion
gain
8
,947
3
0,61
8
Pro
fit b
efor
e ta
xatio
n (1
,94
8,7
64
) (4
78,8
35)
Tax
atio
n (1
76,4
82)
(151
,677
)
Pro
fit a
fter
taxa
tion
(2,12
5,24
6)
(630
,512
)
46
.3.1
Seg
men
t as
sets
46.3
.2.1
1,37
9,5
60
1,
015
,238
10
,310
,03
2 9
,33
2,0
33
18
7,10
4
187,
354
2,6
78,6
26
2,4
64,6
54
142,
316
14
5,53
4 2
35,
792
136,
116
27,
471
- 14
,96
0,9
01
13,2
80,9
29
Una
lloca
ted
asse
ts
11,2
62,
178
7
,716
,154
Tota
l Ass
ets
26,2
23,0
79
20,
997,0
83
46
.3.2
Seg
men
t lia
bilit
ies
48.
3.2.
2 10
,54
9,5
89
8
,791
,134
44
2,0
35
175,
112
614
,89
9
455
,324
1,
06
3,9
98
1,
559,
812
136
,876
17
,565
4
45,
978
7
7,023
19
,214
-
13,2
72,5
89
11
,075
,970
Una
lloca
ted
liabi
litie
s
1,91
5,78
6 8
55,7
19
15,18
8,37
5 11
,931
,689
46
.3.2
.1U
nallo
cate
d as
sets
incl
udes
pro
pert
y, pl
ant a
nd e
quip
men
t, in
vest
men
t pro
pert
y, lo
ng te
rm in
vest
men
t, lo
ans,
adv
ance
s, d
epos
its, p
repa
ymen
ts a
nd o
ther
rece
ivab
les,
def
erre
d ta
xatio
n, s
hort
term
inve
stm
ents
, cas
h an
d ba
nk, lo
ng te
rm lo
ans
and
adva
nces
and
long
term
dep
osits
. A
ll non
cur
rent
ass
ets
of th
e G
roup
as
at th
e re
port
ing
date
are
loca
ted
in P
akis
tan.
The
bat
tery
seg
men
t is
expe
cted
to c
omm
ence
pro
duct
ion
in th
e ne
xt fi
nanc
ial y
ear f
or th
is re
ason
ther
e is
no
oper
atio
nal r
esul
ts.
46
.3.2
.2U
nallo
cate
d lia
bilit
ies
incl
ude
defe
rred
liabi
litie
s, re
deem
able
cap
ital, u
ncla
imed
div
iden
d an
d lo
ng te
rm d
epos
its.
Notes to the consolidated financial statementsFor the year ended 30 June 2019
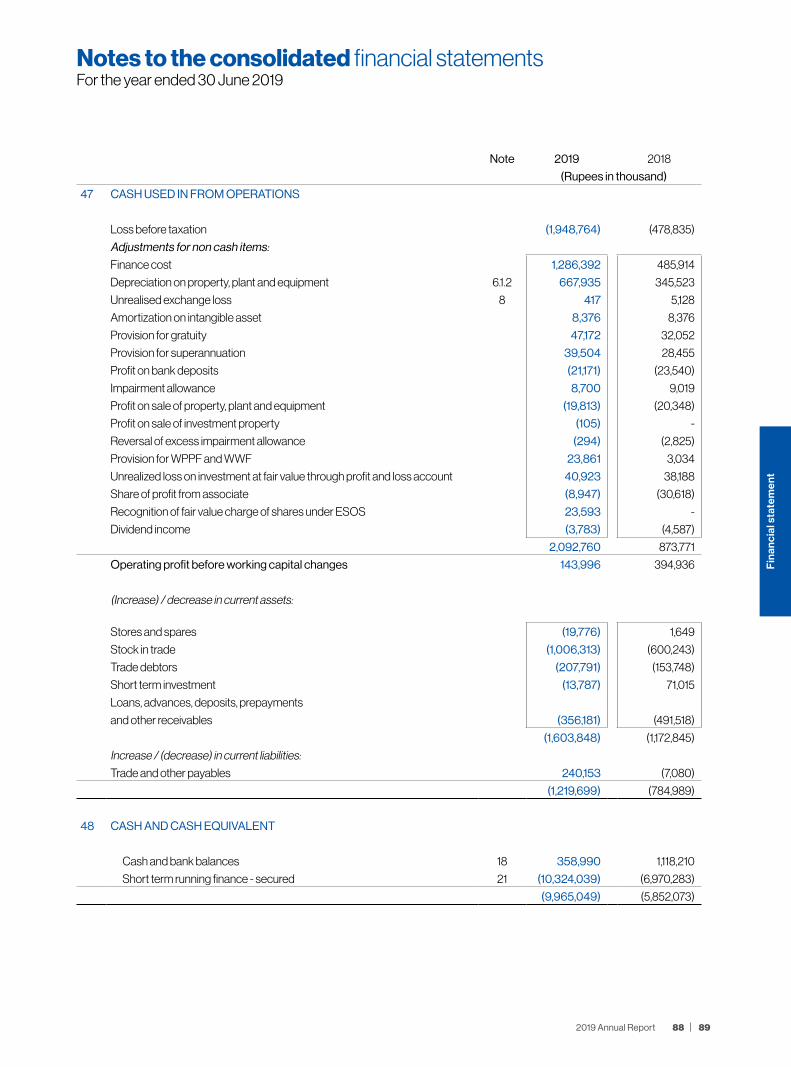
Note 2019 2018
(Rupees in thousand)
47 CASH USED IN FROM OPERATIONS
Loss before taxation (1,948,764) (478,835)
Adjustments for non cash items:
Finance cost 1,286,392 485,914
Depreciation on property, plant and equipment 6.1.2 667,935 345,523
Unrealised exchange loss 8 417 5,128
Amortization on intangible asset 8,376 8,376
Provision for gratuity 47,172 32,052
Provision for superannuation 39,504 28,455
Profit on bank deposits (21,171) (23,540)
Impairment allowance 8,700 9,019
Profit on sale of property, plant and equipment (19,813) (20,348)
Profit on sale of investment property (105) -
Reversal of excess impairment allowance (294) (2,825)
Provision for WPPF and WWF 23,861 3,034
Unrealized loss on investment at fair value through profit and loss account 40,923 38,188
Share of profit from associate (8,947) (30,618)
Recognition of fair value charge of shares under ESOS 23,593 -
Dividend income (3,783) (4,587)
2,092,760 873,771
Operating profit before working capital changes 143,996 394,936
(Increase) / decrease in current assets:
Stores and spares (19,776) 1,649
Stock in trade (1,006,313) (600,243)
Trade debtors (207,791) (153,748)
Short term investment (13,787) 71,015
Loans, advances, deposits, prepayments
and other receivables (356,181) (491,518)
(1,603,848) (1,172,845)
Increase / (decrease) in current liabilities:
Trade and other payables 240,153 (7,080)
(1,219,699) (784,989)
48 CASH AND CASH EQUIVALENT
Cash and bank balances 18 358,990 1,118,210
Short term running finance - secured 21 (10,324,039) (6,970,283)
(9,965,049) (5,852,073)
Notes to the consolidated financial statementsFor the year ended 30 June 2019
8988 2019 Annual Report
Fin
anci
al s
tate
men
t
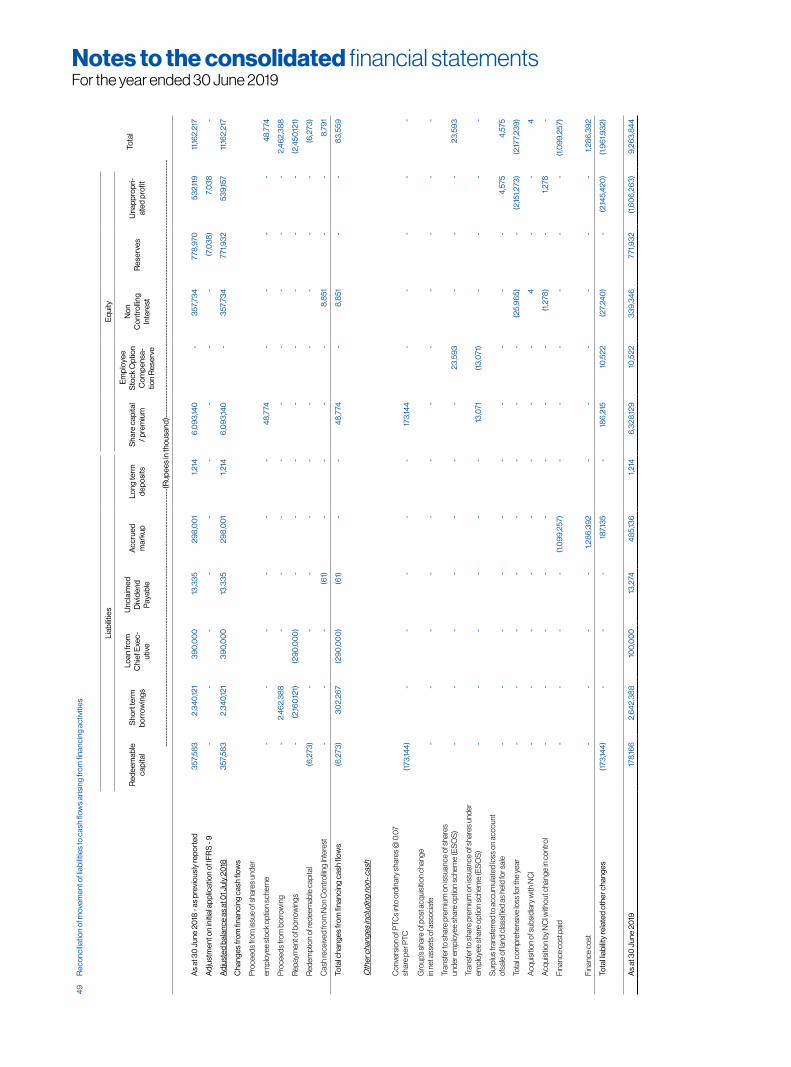
49
Rec
onci
liatio
n of
mov
emen
t of l
iabi
litie
s to
cas
h flo
ws
aris
ing
from
fina
ncin
g ac
tiviti
es
Liab
ilitie
sE
quity
Tota
lR
edee
mab
le
capi
tal
Sho
rt te
rm
borr
owin
gs
Loa
n fr
om
Chi
ef E
xec-
utiv
e
Unc
laim
ed
Div
iden
d P
ayab
le
Acc
rued
m
arku
pLo
ng te
rm
depo
sits
Sha
re c
apita
l / p
rem
ium
Em
ploy
ee
Sto
ck O
ptio
n C
ompe
nsa-
tion
Res
erve
Non
C
ontr
ollin
g In
tere
stR
eser
ves
Una
ppro
pri-
ated
pro
fit
----
----
----
----
----
----
----
----
----
----
----
----
----
----
----
----
----
----
----
----
----
----
----
--(R
upee
s in
thou
sand
)---
----
----
----
----
----
----
----
----
----
----
----
----
----
----
----
----
----
----
----
----
----
----
---
As
at 3
0 J
une
2018
- as
pre
viou
sly
repo
rted
357
,58
3
2,3
40
,121
39
0,0
00
13
,33
5 2
98
,00
1 1,
214
6
,09
3,14
0
- 3
57,7
34
7
78,9
70
53
2,11
9
11,16
2,21
7
Adj
ustm
ent o
n in
itial
app
licat
ion
of IF
RS
- 9
- -
- -
- -
- -
- (7
,03
8)
7,0
38
-
Adj
uste
d ba
lanc
e as
at 0
1 Jul
y 20
183
57,5
83
2,3
40
,121
39
0,0
00
13.3
35
29
8,0
01
1,21
4 6
,09
3,14
0 -
357
,73
477
1,93
253
9,15
7 11
,162,
217
Cha
nges
from
fina
ncin
g ca
sh fl
ows
Pro
ceed
s fro
m is
sue
of s
hare
s un
der
empl
oyee
sto
ck o
ptio
n sc
hem
e -
- -
- -
- 4
8,7
74
- -
- -
48
,774
Pro
ceed
s fro
m b
orro
win
g -
2,4
62,
38
8
- -
- -
- -
- -
- 2
,46
2,3
88
Rep
aym
ent o
f bor
row
ings
- (2
,160
,121)
(29
0,0
00
) -
- -
- -
- -
- (2
,450
,121)
Red
empt
ion
of re
deem
able
cap
ital
(6,2
73)
- -
- -
- -
- -
- -
(6,2
73)
Cas
h re
ceiv
ed fr
om N
on C
ontr
ollin
g In
tere
st -
- -
(61)
- -
- -
8,8
51 -
- 8
,79
1
Tota
l cha
nges
from
fina
ncin
g ca
sh fl
ows
(6,2
73)
30
2,26
7 (2
90
,00
0)
(61)
- -
48
,774
-
8,8
51 -
- 6
3,5
59
Oth
er c
hang
es in
clud
ing
non-
cas
h
Con
vers
ion
of P
TCs
into
ord
inar
y sh
ares
@ 0
.07
shar
e pe
r PTC
(173
,144
) -
- -
- -
173
,144
-
- -
- -
Gro
up’s
shar
e of
pos
t acq
uisi
tion
chan
ge
in n
et a
sset
s of
ass
ocia
te -
- -
- -
- -
- -
- -
-
Tran
sfer
to s
hare
pre
miu
m o
n is
suan
ce o
f sha
res
unde
r em
ploy
ee s
hare
opt
ion
sche
me
(ES
OS
) -
- -
- -
- -
23
,59
3
- -
- 2
3,5
93
Tran
sfer
to s
hare
pre
miu
m o
n is
suan
ce o
f sha
res
unde
r em
ploy
ee s
hare
opt
ion
sche
me
(ES
OS
) -
- -
- -
- 13
,071
(1
3,0
71)
- -
- -
Sur
plus
tran
sfer
red
to a
ccum
ulat
ed lo
ss o
n ac
coun
t of
sale
of l
and
clas
sifie
d as
hel
d fo
r sal
e -
- -
- -
- -
- -
- 4
,575
4
,575
Tota
l com
preh
ensi
ve lo
ss fo
r the
yea
r -
- -
- -
- -
- (2
5,9
65)
- (2
,151,2
73)
(2,17
7,23
9)
Acq
uisi
tion
of s
ubsi
diar
y w
ith N
CI
- -
- -
- -
- -
4
- -
4
Acq
uisi
tion
by N
CI w
ithou
t cha
nge
in c
ontr
ol -
- -
- -
- -
- (1
,278
) -
1,27
8
-
Fina
nce
cost
pai
d -
- -
- (1
,09
9,2
57)
- -
- -
- -
(1,0
99
,257
)
Fina
nce
cost
-
- -
- 1,
286
,39
2 -
- -
- -
- 1,
286
,39
2
Tota
l liab
ility
rela
ted
othe
r cha
nges
(1
73,14
4)
- -
- 18
7,13
5 -
186
,215
10
,522
(2
7,24
0)
- (2
,145,
420
) (1
,96
1,93
2)
As
at 3
0 J
une
2019
178
,166
2
,64
2,3
88
10
0,0
00
13
,274
4
85,
136
1,
214
6
,328
,129
10
,522
3
39
,34
6
771
,93
2 (1
,60
6,2
63
) 9
,26
3,8
44
Notes to the consolidated financial statementsFor the year ended 30 June 2019

Liab
ilitie
sE
quity
Tota
lR
edee
mab
le
capi
tal
Sho
rt te
rm
borr
owin
gs
Loa
n fro
m
Chi
ef
Exe
cutiv
e
Unc
laim
ed
Div
iden
d Pa
yabl
e
Acc
rued
m
arku
pLo
ng te
rm
depo
sits
Sha
re c
apita
l/
prem
ium
Non
Con
-tr
ollin
g In
tere
stR
eser
ves
Una
ppro
pria
t-ed
pro
fit
----
----
----
----
----
----
----
----
----
----
----
----
----
----
----
----
----
----
----
----
----
----
----
--(R
upee
s in
thou
sand
)---
----
----
----
----
----
----
----
----
----
----
----
----
----
----
----
----
----
----
----
----
----
----
---
As
at 3
0 J
une
2017
537
,00
0
1,70
3,0
44
390
,00
0
18,6
43
350
,859
1,
214
5,7
39,5
03
192,
213
778
,970
1,
255,
027
10
,966
,473
Cha
nges
from
finan
cing
cas
h flo
ws
Pro
ceed
s fro
m is
sue
of s
hare
s un
der
empl
oyee
sto
ck o
ptio
n sc
hem
e -
- -
- -
- 3
7,623
-
- -
37,6
23
Pro
ceed
s fro
m b
orro
win
g-
1,71
7,84
2 -
- -
- -
- -
- 1,
717,
842
Rep
aym
ent o
f bor
row
ings
- (1
,080
,765
) -
- -
- -
- -
- (1
,080
,765
)
Red
empt
ion
of re
deem
able
cap
ital
(6,2
73)
- -
- -
- -
- -
- (6
,273
)
Div
iden
d pa
id-
- -
(5,3
08)
- -
- (1
52)
- -
(5,4
60)
Cas
h re
ceiv
ed fr
om N
on C
ontr
ollin
g In
tere
st-
- -
- -
- -
242,
112
- -
242,
112
Tota
l cha
nges
from
fina
ncin
g ca
sh fl
ows
(6,2
73)
637
,077
-
(5,3
08)
- -
37,6
23
241,9
60-
- 9
05,
079
Oth
er c
hang
es in
clud
ing
non-
cas
h
Con
vers
ion
of P
TCs
into
ord
inar
y sh
ares
@ 0
.07
shar
e pe
r PTC
(173
,144)
- -
- -
- 17
3,14
4 -
- -
-
Issu
e of
ord
inar
y sh
ares
as
bonu
s @
10%
-
- -
- -
- 14
2,87
0
- -
(142
,870
) -
Gro
up’s
shar
e of
pos
t acq
uisi
tion
chan
ge
in n
et a
sset
s of
ass
ocia
te -
- -
- -
- -
- -
27,1
30
27,1
30
Cha
nges
in b
orro
win
gs -
- -
- -
- -
- -
- -
Tota
l com
preh
ensi
ve lo
ss fo
r the
yea
r -
- -
- -
- -
(1,3
73)
- (6
82,2
32)
(683
,607
)
Acq
uisi
tion
by N
CI w
ithou
t cha
nge
in c
ontr
ol -
- -
- -
- -
(75,
066
) -
75,
066
-
Fina
nce
cost
pai
d -
- -
- (5
38,7
72)
- -
- -
- (5
38,7
72)
Fina
nce
cost
-
- -
- 4
85,9
14
- -
- -
- 4
85,9
14
Tota
l liab
ility
rela
ted
othe
r cha
nges
(1
73,14
4) -
- -
(52,
858)
- 3
16,0
14
(76,
439)
- (7
22,9
06)
(70
9,33
5)
As
at 3
0 J
une
2018
357
,583
2
,340
,121
390
,00
0
13,3
35
298
,00
1 1,
214
6,0
93,14
0
357
,734
7
78,9
70
532
,121
11,16
2,21
7
Notes to the consolidated financial statementsFor the year ended 30 June 2019
9190 2019 Annual Report
Fin
anci
al s
tate
men
t
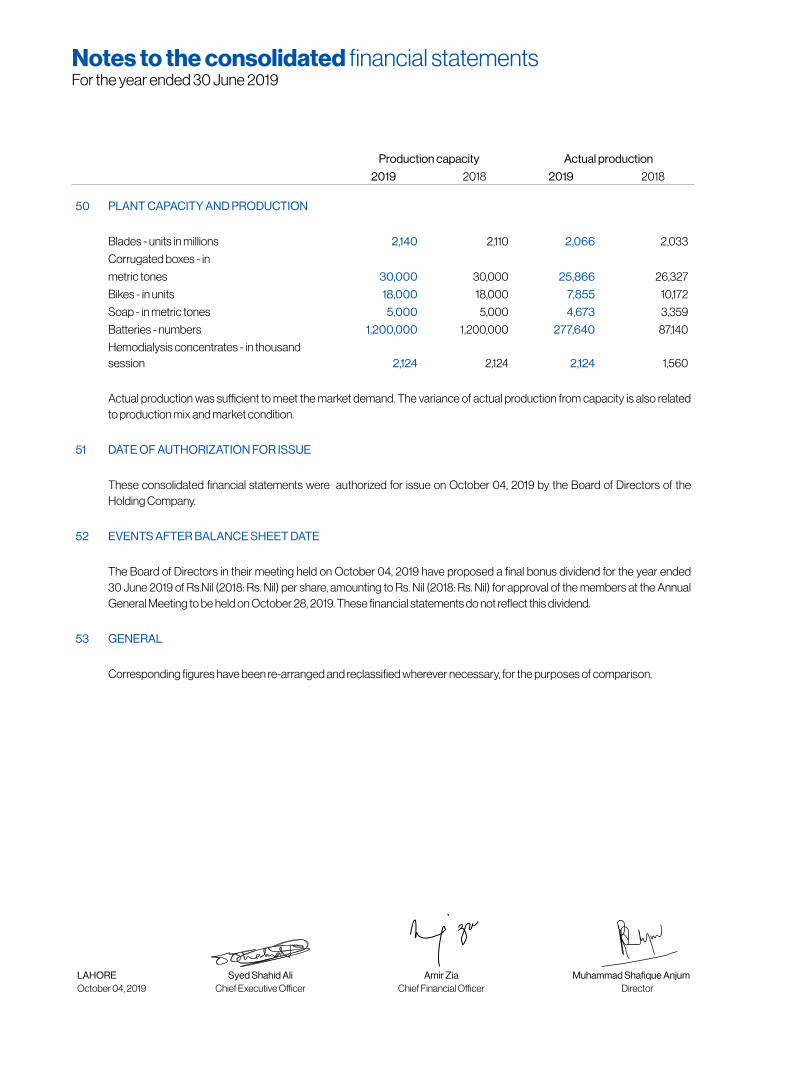
Production capacity Actual production
2019 2018 2019 2018
50 PLANT CAPACITY AND PRODUCTION
Blades - units in millions 2,140 2,110 2,066 2,033
Corrugated boxes - in
metric tones 30,000 30,000 25,866 26,327
Bikes - in units 18,000 18,000 7,855 10,172
Soap - in metric tones 5,000 5,000 4,673 3,359
Batteries - numbers 1,200,000 1,200,000 277,640 87,140
Hemodialysis concentrates - in thousand session 2,124 2,124 2,124 1,560
Actual production was sufficient to meet the market demand. The variance of actual production from capacity is also related to production mix and market condition.
51 DATE OF AUTHORIZATION FOR ISSUE
These consolidated financial statements were authorized for issue on October 04, 2019 by the Board of Directors of the Holding Company.
52 EVENTS AFTER BALANCE SHEET DATE
The Board of Directors in their meeting held on October 04, 2019 have proposed a final bonus dividend for the year ended 30 June 2019 of Rs.Nil (2018: Rs. Nil) per share, amounting to Rs. Nil (2018: Rs. Nil) for approval of the members at the Annual General Meeting to be held on October 28, 2019. These financial statements do not reflect this dividend.
53 GENERAL
Corresponding figures have been re-arranged and reclassified wherever necessary, for the purposes of comparison.
Syed Shahid AliChief Executive Officer
Muhammad Shafique AnjumDirector
LAHOREOctober 04, 2019
Amir ZiaChief Financial Officer
Notes to the consolidated financial statementsFor the year ended 30 June 2019

UNCONSOLIDATED
FINANCIAL STATEMENTSFor the year ended 30 June 2019
Independent Auditors’ report
To the members of Treet Corporation Limited
Report on the Audit of the Unconsolidated Financial Statements
We have audited the annexed unconsolidated financial statements of Treet Corporation Limited (“the Company”), which comprise the statement of financial position as at 30 June 2019, the statement of profit or loss, the statement of comprehensive income, the statement of changes in equity, the statement of cash flows for the year then ended, and notes to the unconsolidated financial statements, including a summary of significant accounting policies and other explanatory information, and we state that we have obtained all the information and explanations which, to the best of our knowledge and belief, were necessary for the purposes of the audit.
In our opinion and to the best of our information and according to the explanations given to us, the statement of financial position, statement of profit or loss, the statement of comprehensive income, the statement of changes in equity and the statement of cash flows together with the notes forming part thereof conform with the accounting and reporting standards as applicable in Pakistan and give the information required by the Companies Act, 2017 (XIX of 2017), in the manner so required and respectively give a true and fair view of the state of the Company’s affairs as at 30 June 2019 and of the profit, the comprehensive profit, the changes in equity and its cash flows for the year then ended.
Basis for Opinion
We conducted our audit in accordance with International Standards on Auditing (ISAs) as applicable in Pakistan. Our responsibilities under those standards are further described in the Auditor’s Responsibilities for the Audit of the Unconsolidated Financial Statements section of our report. We are independent of the Company in accordance with the International Ethics Standards Board for Accountants’ Code of Ethics for Professional Accountants as adopted by the Institute of Chartered Accountants of Pakistan (the Code) and we have fulfilled our other ethical responsibilities in accordance with the Code. We believe that the audit evidence we have obtained is sufficient and appropriate to provide a basis for our opinion.
Key Audit Matters
Key audit matters are those matters that, in our professional judgment, were of most significance in our audit of the unconsolidated financial statements of the current period. These matters were addressed in the context of our audit of the unconsolidated financial statements as a whole, and in forming our opinion thereon, and we do not provide a separate opinion on these matters.
Following are the Key audit matter(s):
Sr. No. Key audit matter(s) How the matter was addressed in our audit
1 Revenue
Refer to notes 5.19 and 30 to the unconsolidated financial statements\
The Company recognized revenue of Rs. 6,760 million from sale of goods to domestic as well as export customers during the year ended 30 June 2019.
We identified recognition of revenue as a key audit matter be-cause revenue is one of the key performance indicators of the Company and gives rise to an inherent risk of misstatement to meet expectations or targets.
Our audit procedures, amongst others, included the following:
• Obtaining an understanding of the process relating to revenue recognition and testing the design, implementa-tion and operating effectiveness of key internal controls;
• assessing the appropriateness of the Company’s ac-counting policy for revenue recognition and compliance of the policy with applicable accounting standards;
• comparing the sample of sale transactions recorded during the year with sales orders, sales invoices, delivery challans, bill of ladings and other relevant underlying documents;
• comparing the sample of sale transactions recorded near the year end with the sales orders, sales invoices, delivery challans, bill of ladings and other relevant under-lying documentation to assess if the sale was recorded in the appropriate accounting period;
• inspecting on a sample basis, credit notes issued in near and subsequent to year end to evaluate whether the adjustments to sales had been accurately recorded in the appropriate accounting period;

Independent Auditors’ report
Sr. No. Key audit matter(s) How the matter was addressed in our audit
• scanning for any manual journal entries relating to sales recorded during and near the year end which were con-sidered to be material or met other specific risk based criteria for inspecting underlying documentation.
2 Valuation of Stock-in-trade
Refer to notes 5.12 and 14 to the unconsolidated financial statements.
As at 30 June 2019, the Company’s carrying amount of stock-in-trade amounts to Rs. 898 million.
We identified valuation of stock-in-trade as a key audit matter as it involves significant management judgement in determin-ing the carrying value of stock in trade.
Our audit procedures, amongst others, included the following:
• Obtaining an understanding of internal controls over valuation of stock-in-trade and testing, their design, implementation and operating effectiveness;
• assessing the appropriateness of the Company’s accounting policies for valuation of stock-in-trade and compliance of those policies with applicable accounting standards;
• obtaining an understanding and assessing reason-ableness of the management’s determination of net realizable value (NRV) and the key estimates adopted, including future selling prices, future costs to complete work-in-progress and costs necessary to make the sales and their basis; and
• comparing the NRV, on a sample basis, to the cost of stock-in-trade to assess whether any adjustments are required to value stock in trade in accordance with the accounting policy.
3 Recoverability of investment in subsidiary
Refer notes 5.8 and 9.1 to the unconsolidated financial statements.
As at 30 June 2019, management conducted impairment test to assess the recoverability of the carrying value of the investments in subsidiaries. This was performed using discounted cash flow model.
We identified assessing the carrying value of investment in subsidiary as a key audit matter because significant degree of management judgment is involved in assessing the recoverable amount.
Our audit procedures, amongst others, included the following:
• discussing with the Company’s management key assumptions used in valuation model and testing the mathematical accuracy of the model;
• involving our internal valuation specialist to assist us in evaluating the assumptions and judgements adopted by management in its discounted cash flow analysis (i.e. growth rate, terminal values and the discount rate) used to derive the recoverable amount of the investment in subsidiary; and
• comparing the recoverable amount with the cost of the investment to identify impairment, if any.
4 Revaluation of freehold land and building on freehold land
Refer to notes 5.4, 6.1 and 29 to the unconsolidated financial statements.
The Company follows the revaluation model for subsequent measurement of freehold land and buildings on freehold land.
Latest revaluation was carried on 30 June 2019. The revaluation was performed by an external professional valuer engaged by the Company.
We identified the revaluation of the Company’s freehold land and building on freehold land as a key audit matter because the valuation involves a significant degree of judgment and estimation.
Our audit procedures, amongst others, included the following:
• obtaining and inspecting the valuation reports prepared by the external expert engaged by the Company and on which the management’s assessment of the valuation of freehold land and building on freehold land was based;
• evaluating the information provided by the Company to the external professional valuer by inspecting the relevant underlying documentation;
• involving our valuation expert to assist in evaluating the appropriateness of the valuation methodology and assessing the reasonableness of the key estimates and assumptions adopted in the valuation report by the valuer engaged by the Company; and
• assessing the completeness, appropriateness and adequacy of the disclosure in the Company’s financial statements with regard to the revaluation performed.
9594 2019 Annual Report
Fin
anci
al s
tate
men
t

Information other than the Unconsolidated Financial Statements and Auditor’s Report thereon
Management is responsible for the other information. Other information comprises the information included in the annual report for the year ended 30 June 2019, but does not include the consolidated and unconsolidated financial statements and our auditor’s report thereon.
Our opinion on the unconsolidated financial statements does not cover the other information and we do not express any form of assurance conclusion thereon.
In connection with our audit of the unconsolidated financial statements, our responsibility is to read the other information and, in doing so, consider whether the other information is materially inconsistent with the unconsolidated financial statements or our knowledge obtained in the audit or otherwise appears to be materially misstated. If, based on the work we have performed, we conclude that there is a material misstatement of this other information, we are required to report that fact. We have nothing to report in this regard.
Responsibilities of Management and Board of Directors for the Unconsolidated Financial Statements
Management is responsible for the preparation and fair presentation of the unconsolidated financial statements in accordance with the accounting and reporting standards as applicable in Pakistan and the requirements of Companies Act, 2017(XIX of 2017) and for such internal control as management determines is necessary to enable the preparation of unconsolidated financial statements that are free from material misstatement, whether due to fraud or error.
In preparing the unconsolidated financial statements, management is responsible for assessing the Company’s ability to continue as a going concern, disclosing, as applicable, matters related to going concern and using the going concern basis of accounting unless management either intends to liquidate the Company or to cease operations, or has no realistic alternative but to do so.
The Board of directors is responsible for overseeing the Company’s financial reporting process.
Auditor’s responsibilities for the Audit of the Unconsolidated Financial Statements
Our objectives are to obtain reasonable assurance about whether the unconsolidated financial statements as a whole are free from material misstatement, whether due to fraud or error and to issue an auditor’s report that includes our opinion. Reasonable assurance is a high level of assurance, but is not a guarantee that an audit conducted in accordance with ISAs as applicable in Pakistan will always detect a material misstatement when it exists. Misstatements can arise from fraud or error and are considered material if, individually or in the aggregate, they could reasonably be expected to influence the economic decisions of users taken on the basis of these unconsolidated financial statements.
As part of an audit in accordance with ISAs as applicable in Pakistan, we exercise professional judgment and maintain professional skepticism throughout the audit. We also:
• Identify and assess the risks of material misstatement of the unconsolidated financial statements, whether due to fraud or error, design and perform audit procedures responsive to those risks, and obtain audit evidence that is sufficient and appropriate to provide a basis for our opinion. The risk of not detecting a material misstatement resulting from fraud is higher than for one resulting from error, as fraud may involve collusion, forgery, intentional omissions, misrepresentations, or the override of internal control.
• Obtain an understanding of internal control relevant to the audit in order to design audit procedures that are appropriate in the circumstances, but not for the purpose of expressing an opinion on the effectiveness of the Company’s internal control.
• Evaluate the appropriateness of accounting policies used and the reasonableness of accounting estimates and related disclosures made by management.
• Conclude on the appropriateness of management’s use of the going concern basis of accounting and, based on the audit evidence obtained, whether a material uncertainty exists related to events or conditions that may cast significant doubt on the Company’s ability to continue as a going concern. If we conclude that a material uncertainty exists, we are required to draw attention in our auditor’s report to the related disclosures in the unconsolidated financial statements or, if such disclosures are inadequate, to modify our opinion. Our conclusions are based on the audit evidence obtained up to the date of our auditor’s report. However, future events or conditions may cause the Company to cease to continue as a going concern.
• Evaluate the overall presentation, structure and content of the unconsolidated financial statements, including the disclosures, and
Independent Auditors’ report
whether the unconsolidated financial statements represent the underlying transactions and events in a manner that achieves fair presentation.
We communicate with the board of directors regarding, among other matters, the planned scope and timing of the audit and significant audit findings, including any significant deficiencies in internal control that we identify during our audit. We also provide the board of directors with a statement that we have complied with relevant ethical requirements regarding indepen-dence, and to communicate with them all relationships and other matters that may reasonably be thought to bear on our indepen-dence, and where applicable, related safeguards. From the matters communicated with the board of directors, we determine those matters that were of most significance in the audit of the unconsolidated financial statements of the current period and are therefore the key audit matters. We describe these matters in our auditor’s report unless law or regulation precludes public disclosure about the matter or when, in extremely rare circumstances, we determine that a matter should not be communicated in our report because the adverse consequences of doing so would reasonably be expected to outweigh the public interest benefits of such communication.
Report on Other Legal and Regulatory Requirements
Based on our audit, we further report that in our opinion:
a) proper books of account have been kept by the Company as required by the Companies Act, 2017(XIX of 2017); b) the statement of financial position, the statement of profit or loss, the statement of comprehensive income, the statement of
changes in equity and the statement of cash flows together with the notes thereon have been drawn up in conformity with the Companies Act, 2017 (XIX of 2017) and are in agreement with the books of account and returns;
c) Investments made, expenditure incurred and guarantees extended during the year were for the purpose of the Company’s busi-ness; and
d) Zakat deductible at source under the Zakat and Usher Ordinance, 1980 (XVIII of 1980), was deducted by the Company and deposited in the Central Zakat Fund established under section 7 of that Ordinance.
The engagement partner on the audit resulting in this independent auditor’s report is Kamran Iqbal Yousafi
KPMG Taseer Hadi & Co.Chartered AccountantsLAHORE
Date: October 04, 2019
Independent Auditors’ report
9796 2019 Annual Report
Fin
anci
al s
tate
men
t

Note 2019 2018(Rupees in thousand)
AssetsNon-current assetsProperty, plant and equipment 6 6,125,918 3,058,815 Investment property 7 12,896 19,384 Intangible asset 8 21,704 30,080 Long term investments 9 6,204,687 5,248,094 Long term loans 10 1,973 623 Long term security deposits 11 23,644 19,757 Deferred taxation 12 - 32,530
12,390,822 8,409,283
Current assetsStores and spares 13 193,513 189,401 Stock in trade 14 898,201 606,005 Trade debts 15 287,846 267,764 Short term investments 16 431,865 458,506 Loans, advances, deposits, prepayments
and other receivables 17 7,507,794 6,751,453 Cash and bank balances 18 198,581 151,549
9,517,800 8,424,678 Assets held for sale 9.1.2 - 964,054
9,517,800 9,388,732
LiabilitiesCurrent liabilitiesCurrent portion of redeemable capital 23 178,166 179,417 Short term borrowings 19 8,755,727 7,753,403 Trade and other payables 20 624,455 681,761 Unclaimed dividend 13,240 13,301 Accrued mark-up 21 390,371 277,666 Provision for taxation 95,945 65,003
10,057,904 8,970,551 Net current (liabilities) / assets (540,104) 418,181
Non-current liabilitiesLong term deposits 22 1,214 1,214 Redeemable capital 23 - 178,166 Deferred liabilities - Employee retirement benefits 24 481,508 325,698 Deferred taxation 12 13,959 -
496,681 505,078 Contingencies and commitments 26
11,354,037 8,322,386 Represented by:Authorized capital
250,000,000 (2018: 250,000,000) ordinary shares of Rs. 10 each 2,500,000 2,500,000 150,000,000 (2018: 150,000,000) preference shares of Rs. 10 each 1,500,000 1,500,000
4,000,000 4,000,000
Issued, subscribed and paid up capital 27 1,654,508 1,600,846 Reserves 28 4,952,077 4,760,228 Fair value reserve on investment (7,038) - Unappropriated profit 904,360 695,265 Surplus on revaluation of land and buildings - net of tax 29 3,850,130 1,266,047
11,354,037 8,322,386 The annexed notes 1 to 49 form an integral part of these unconsolidated financial statements.
Statement of financial positionAs at 30 June 2019
Syed Shahid AliChief Executive Officer
Muhammad Shafique AnjumDirector
LAHOREOctober 04, 2019
Amir ZiaChief Financial Officer

Note 2019 2018
(Rupees in thousand)
Revenue - net 30 6,760,118 6,094,956
Cost of sales 31 (4,542,466) (4,674,810)
Gross profit 2,217,652 1,420,146
Administrative expenses 32 (581,147) (404,100)
Distribution cost 33 (889,558) (914,721)
(1,470,705) (1,318,821)
Operating profit 746,947 101,325
Finance cost 34 (973,198) (577,503)
Other operating expenses 35 (82,715) (41,370)
(1,055,913) (618,873)
Other income 36 732,108 531,218
Profit before taxation 423,142 13,670
Taxation 37 (140,515) (96,694)
Profit / (loss) after taxation 282,627 (83,024)
Earnings / (loss) per share - basic and diluted (Rupees) 38 1.73 (0.52)
The annexed notes 1 to 49 form an integral part of these unconsolidated financial statements.
Statement of profit or lossFor the year ended 30 June 2019
Syed Shahid AliChief Executive Officer
Muhammad Shafique AnjumDirector
LAHOREOctober 04, 2019
Amir ZiaChief Financial Officer
9998 2019 Annual Report
Fin
anci
al s
tate
men
t

2019 2018
(Rupees in thousand)
Profit / (loss) after taxation 282,627 (83,024)
Other comprehensive income
Items that will never be reclassified to statement of profit or loss:
- Re-measurement of employee retirement benefits - net of tax (89,464) (62,558)
- Surplus on revaluation of freehold land and building - net of tax 2,593,027 -
Total comprehensive income / (loss) for the year 2,786,190 (145,582)
The annexed notes 1 to 49 form an integral part of these unconsolidated financial statements.
Statement of comprehensive incomeFor the year ended 30 June 2019
Syed Shahid AliChief Executive Officer
Muhammad Shafique AnjumDirector
LAHOREOctober 04, 2019
Amir ZiaChief Financial Officer
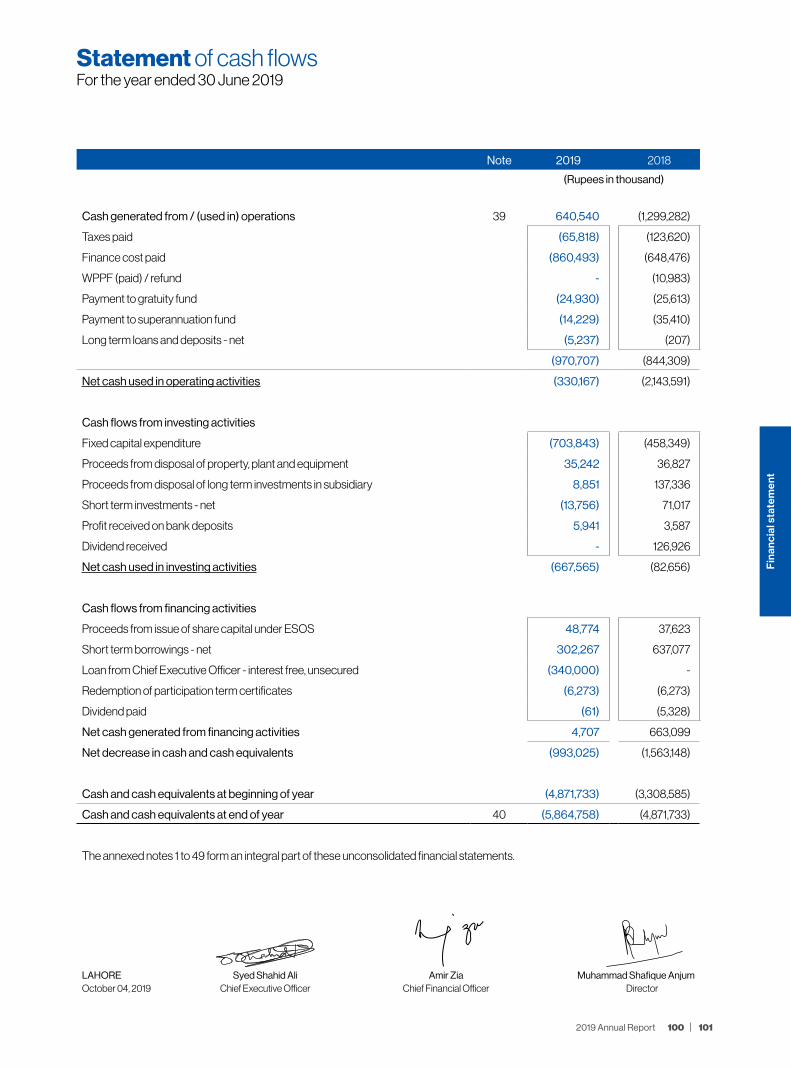
Note 2019 2018
(Rupees in thousand)
Cash generated from / (used in) operations 39 640,540 (1,299,282)
Taxes paid (65,818) (123,620)
Finance cost paid (860,493) (648,476)
WPPF (paid) / refund - (10,983)
Payment to gratuity fund (24,930) (25,613)
Payment to superannuation fund (14,229) (35,410)
Long term loans and deposits - net (5,237) (207)
(970,707) (844,309)
Net cash used in operating activities (330,167) (2,143,591)
Cash flows from investing activities
Fixed capital expenditure (703,843) (458,349)
Proceeds from disposal of property, plant and equipment 35,242 36,827
Proceeds from disposal of long term investments in subsidiary 8,851 137,336
Short term investments - net (13,756) 71,017
Profit received on bank deposits 5,941 3,587
Dividend received - 126,926
Net cash used in investing activities (667,565) (82,656)
Cash flows from financing activities
Proceeds from issue of share capital under ESOS 48,774 37,623
Short term borrowings - net 302,267 637,077
Loan from Chief Executive Officer - interest free, unsecured (340,000) -
Redemption of participation term certificates (6,273) (6,273)
Dividend paid (61) (5,328)
Net cash generated from financing activities 4,707 663,099
Net decrease in cash and cash equivalents (993,025) (1,563,148)
Cash and cash equivalents at beginning of year (4,871,733) (3,308,585)
Cash and cash equivalents at end of year 40 (5,864,758) (4,871,733)
The annexed notes 1 to 49 form an integral part of these unconsolidated financial statements.
Statement of cash flowsFor the year ended 30 June 2019
Syed Shahid AliChief Executive Officer
Muhammad Shafique AnjumDirector
LAHOREOctober 04, 2019
Amir ZiaChief Financial Officer
101100 2019 Annual Report
Fin
anci
al s
tate
men
t

Capital Reserves Revenue Reserves
Total Note
Share Capital
Share Premium
Capital Reserve
Surplus on revaluation of land and buildings - net of tax
Employee Stock Option
Compensation Reserve
Fair value reserve on investment
General Reserve
Un-appropriated
Profit
----------------------------(Rupees in thousand)------------------------------------
Balance as at 30 June 2017 1,421,436 4,318,972 629 1,273,982 - - 266,400 974,863 8,256,282
Total comprehensive loss for the year
Loss for the year - - - - - - - (83,024) (83,024)
Other comprehensive loss - - - - - - - (62,558) (62,558)
- - - - - - - (145,582) (145,582)
Incremental depreciation relating to surplus on revaluation of buildings - net of tax - - - (8,854) - - - 8,854 -
Effect of change in tax rate on account of surplus on revaluation of buildings - - - 919 - - - - 919
Transactions with owners of the Company,Contributions and distributions
Conversion of PTCs into ordinary shares @ 0.07 share per PTC
29,275 143,869 - - - - - - 173,144
Issuance of shares as fully paid bonus share @10% 142,870 - - - - - - (142,870) -
Issuance of shares under employee stock option scheme
7,265 30,358 - - - - - - 37,623
179,410 174,227 - - - - - (142,870) 210,767
Balance as at 30 June 2018 as previously reported
1,600,846 4,493,199 629 1,266,047 - - 266,400 695,265 8,322,386
Adjustment on initial application of IFRS 9, net of tax 5.1.2.2 - - - - - (7,038) - 7,038 -
Adjusted balance at 01 July 2018 1,600,846 4,493,199 629 1,266,047 - (7,038) 266,400 702,303 8,322,386
Total comprehensive Income for the year
Profit for the year - - - - - - - 282,627 282,627
Other comprehensive income - - - 2,593,027 - - - (89,464) 2,503,563
- - - 2,593,027 - - - 193,163 2,786,190
Incremental depreciation relating to surplus on revaluation of buildings - net of tax - - - (8,894) - - - 8,894 -
Effect of change in tax rate on account of surplus on revaluation of buildings - - - (50) - - - - (50)
Transactions with owners of the Company,Contributions and distributions
Conversion of PTCs into ordinary shares @ 0.07 share per PTC
29,275 143,869 - - - - - - 173,144
Issuance of shares under employee stock option scheme
24,387 24,387 - - - - - - 48,774
Recognition of fair value charge of shares under employee share option scheme (ESOS) - - - - 23,593 - - - 23,593
Transfer to share premium on issuance of shares under employee share option scheme (ESOS) - 13,071 - - (13,071) - - - -
53,662 181,327 - - 10,522 - - - 245,511
Balance as at 30 June 2019 1,654,508 4,674,526 629 3,850,130 10,522 (7,038) 266,400 904,360 11,354,037
The annexed notes 1 to 49 form an integral part of these unconsolidated financial statements.
Statement of changes in equityFor the year ended 30 June 2019
Syed Shahid AliChief Executive Officer
Muhammad Shafique AnjumDirector
LAHOREOctober 04, 2019
Amir ZiaChief Financial Officer

1 Status and nature of the business
1.1 Treet Corporation Limited (“the Company”) was incorporated in Pakistan on 22 January 1977 as a Public Limited Company under the Companies Ordinance, 1984 (now Companies Act, 2017). Its shares are quoted on Pakistan Stock Exchange. The principal activity of the Company is manufacturing and sale of razors and razor blades along with other trading activities. The registered office of the Company is situated at 72-B, Industrial Area Kot Lakhpat, Lahore. The manufacturing facilities of the Company are located at 72-B Kot Lakhpat, Industrial Area, Lahore and at Hali Road, Hyderabad.
2 Basis of preparation
2.1 Separate financial statements
These financial statements are the separate financial statements of the Company in which investments in subsidiaries and associates are accounted for on the basis of direct equity interest rather than on the basis of reported results and net assets of the investees. Consolidated financial statements of the Company are prepared and presented separately. The Company has the following long term investments:
2019 2018
Name of Company (Direct holding percentage)
Subsidiaries
- Treet Holdings Limited 85.93 85.93
- First Treet Manufacturing Modaraba 87.35 87.54
- Global Arts Limited 88.76 88.76
- Renacon Pharma Limited 45.45 45.45
Associate
- Loads Limited 12.49 12.49
2.2 Statement of compliance
These unconsolidated financial statements have been prepared in accordance with the accounting and reporting standards as applicable in Pakistan. The accounting and reporting standards applicable in Pakistan comprise of:
- International Financial Reporting Standards (IFRSs) issued by the International Accounting Standards Board (IASB) as are notified under the provisions of the Companies Act, 2017
- Islamic Financial Accounting Standards (IFAS) issued by the Institute of Chartered Accountants of Pakistan as notified under the Companies Act, 2017
- Provisions of and directives issued under the Companies Act, 2017
Where provisions of and directives issued under the Companies Act, 2017 differ from the IFRS Standards, the provisions of and directives issued under the Companies Act, 2017 have been followed.
2.3 Basis of measurement
These unconsolidated financial statements have been prepared on the historical cost convention except for certain items of property, plant and equipment that are stated at revalued amounts, investment in listed securities and financial instruments that are stated at their fair values and recognition of employee retirement benefits that are stated at present value. The methods used to measure fair values are discussed further in their respective policy notes.
Notes to the financial statementsFor the year ended 30 June 2019
103102 2019 Annual Report
Fin
anci
al s
tate
men
t
2.4 Functional and presentation currency
These unconsolidated financial statements are presented in Pakistan Rupees which is also the Company’s functional currency. All financial information presented in Pakistan Rupees has been rounded to the nearest thousand of rupees, unless otherwise indicated.
3 Use of estimates and judgments
The preparation of unconsolidated financial statements in conformity with approved accounting standards requires management to make judgments, estimates and assumptions that affect the application of policies and reported amounts of assets and liabilities, income and expenses. The estimates and associated assumptions and judgments are based on historical experience and various other factors that are believed to be reasonable under the circumstances, the result of which form the basis of making the judgments about carrying values of assets and liabilities that are not readily apparent from other sources. Actual results may differ from these estimates.
The estimates and underlying assumptions are reviewed on an ongoing basis. Revision to accounting estimates are recognized in the period in which the estimate is revised if the revision affects only that period, or in the period of revision and future periods if the revision affects both current and future periods.
The areas where various assumptions and estimates are significant to the Company’s unconsolidated financial statements or where judgments were exercised in application of accounting policies are as follows:
Note
- Employee retirement benefits 5.2
- Taxation 5.3
- Depreciation method, residual values and useful lives of property, plant and equipment 5.4
- Impairment 5.9
- Provisions 5.17
- Contingent liabilities 5.24
4 Standards, interpretations and amendments to published approved International Financial Reporting Standards that are not yet effective
4.1 The following International Financial Reporting Standards (IFRS Standards) as notified under the Companies Act, 2017 and the amendments and interpretations thereto will be effective for accounting periods beginning on or after 01 July 2019:
- IFRIC 23 ‘Uncertainty over Income Tax Treatments’ (effective for annual periods beginning on or after 01 January 2019) clarifies the accounting for income tax when there is uncertainty over income tax treatments under IAS 12. The interpretation requires the uncertainty over tax treatment be reflected in the measurement of current and deferred tax. The application of interpretation is not likely to have an impact on Company’s unconsolidated financial statements.
Notes to the financial statementsFor the year ended 30 June 2019
- IFRS 16 ‘Leases’ (effective for annual period beginning on or after 01 January 2019). IFRS 16 replaces existing leasing guidance, including IAS 17 ‘Leases’, IFRIC 4 ‘Determining whether an Arrangement contains a Lease’, SIC-15 ‘Operating Leases - Incentives’ and SIC-27 ‘Evaluating the Substance of Transactions Involving the Legal Form of a Lease’. IFRS 16 introduces a single, on-balance sheet lease accounting model for lessees. A lessee recognizes a right-of-use asset representing its right to use the underlying asset and a lease liability representing its obligation to make lease payments. There are recognition exemptions for short-term leases and leases of low-value items. Lessor accounting remains similar to the current standard i.e. lessors continue to classify leases as finance or operating leases. The management is in the process of analyzing the potential impacts on adoption of this standard.
- Amendment to IFRS 9 ‘Financial Instruments’ – Prepayment Features with Negative Compensation (effective for annual periods beginning on or after 01 January 2019). For a debt instrument to be eligible for measurement at amortized cost or FVOCI, IFRS 9 requires its contractual cash flows to meet the SPPI criterion – i.e. the cash flows are ‘solely payments of principal and interest’. Some prepayment options could result in the party that triggers the early termination receiving compensation from the other party (negative compensation). The amendment allows that financial assets containing prepayment features with negative compensation can be measured at amortized cost or at fair value through other comprehensive income (FVOCI) if they meet the other relevant requirements of IFRS 9. The application of amendment is not likely to have an impact on Company’s unconsolidated financial statements.
- Amendment to IAS 28 ‘Investments in Associates and Joint Ventures’ - Long Term Interests in Associates and Joint Ventures (effective for annual period beginning on or after 01 January 2019). The amendment will affect companies that finance such entities with preference shares or with loans for which repayment is not expected in the foreseeable future (referred to as long-term interests or ‘LTI’). The amendment and accompanying example state that LTI are in the scope of both IFRS 9 and IAS 28 and explain the annual sequence in which both standards are to be applied. The amendments are not likely to have an impact on Company’s unconsolidated financial statements.
- Amendments to IAS 19 ‘Employee Benefits’- Plan Amendment, Curtailment or Settlement (effective for annual periods beginning on or after 01 January 2019). The amendments clarify that on amendment, curtailment or settlement of a defined benefit plan, a company now uses updated actuarial assumptions to determine its current service cost and net interest for the period; and the effect of the asset ceiling is disregarded when calculating the gain or loss on any settlement of the plan and is dealt with separately in other comprehensive income. The application of amendments is not likely to have an impact on Company’s unconsolidated financial statements.
- Amendment to IFRS 3 ‘Business Combinations’ – Definition of a Business (effective for business combinations for which the acquisition date is on or after the beginning of annual period beginning on or after 01 January 2020). The IASB has issued amendments aiming to resolve the difficulties that arise when an entity determines whether it has acquired a business or a group of assets. The amendments clarify that to be considered a business, an acquired set of activities and assets must include, at a minimum, an input and a substantive process that together significantly contribute to the ability to create outputs. The amendments include an election to use a concentration test. The standard is effective for transactions in the future and therefore would not have an impact on past financial statements.
- Amendments to IAS 1 Presentation of Financial Statements and IAS 8 Accounting Policies, Changes in Accounting Estimates and Errors (effective for annual periods beginning on or after 01 January 2020). The amendments are intended to make the definition of material in IAS 1 easier to understand and are not intended to alter the underlying concept of materiality in IFRS Standards. In addition, the IASB has also issued guidance on how to make materiality judgments when preparing their general purpose financial statements in accordance with IFRS Standards.
Notes to the financial statementsFor the year ended 30 June 2019
105104 2019 Annual Report
Fin
anci
al s
tate
men
t
- On 29 March 2018, the International Accounting Standards Board (the IASB) has issued a revised Conceptual Framework for Financial Reporting which is applicable immediately contains changes that will set a new direction for IFRS in the future. The Conceptual Framework primarily serves as a tool for the IASB to develop standards and to assist the IFRS Interpretations Committee in interpreting them. It does not override the requirements of individual IFRSs and any inconsistencies with the revised Framework will be subject to the usual due process – this means that the overall impact on standard setting may take some time to crystallize. The companies may use the Framework as a reference for selecting their accounting policies in the absence of specific IFRS requirements. In these cases, companies should review those policies and apply the new guidance retrospectively as of 01 January 2020, unless the new guidance contains specific scope outs.
Annual Improvements to IFRS Standards 2015–2017 Cycle - the improvements address amendments to following approved accounting standards:
- IFRS 3 Business Combinations and IFRS 11 Joint Arrangement - the amendment aims to clarify the accounting treatment when a company increases its interest in a joint operation that meets the definition of a business. A company remeasures its previously held interest in a joint operation when it obtains control of the business. A company does not remeasure its previously held interest in a joint operation when it obtains joint control of the business.
- IAS 12 Income Taxes - the amendment clarifies that all income tax consequences of dividends (including payments on financial instruments classified as equity) are recognized consistently with the transaction that generates the distributable profits.
- IAS 23 Borrowing Costs - the amendment clarifies that a company treats as part of general borrowings any borrowing originally made to develop an asset when the asset is ready for its intended use or sale.
The above amendments are effective from annual period beginning on or after 01 January 2019 and are not likely to have an impact on Company’s unconsolidated financial statements.
5 Summary of significant accounting policies
The significant accounting policies adopted in preparation of these unconsolidated financial statements are set out below. These policies have been consistently applied to all years presented, except as described in note 5.1.
5.1 Changes in accounting policies
The Company has adopted IFRS 15 ‘Revenue from Contracts with Customers’ and IFRS 9 ‘Financial Instruments’ from 01 July 2018 which are effective from annual periods beginning on or after 01 July 2018. Due to the transition methods chosen by the Company in applying these standards, comparative information throughout these financial statements has not been restated to reflect the requirements of these new standards. The details of new significant accounting policies adopted and the nature and effect of the changes to previous accounting policies are set out below:
Notes to the financial statementsFor the year ended 30 June 2019
5.1.1 IFRS 15 - Revenue from Contracts with Customers
IFRS 15 establishes a comprehensive framework for determining whether, how much and when revenue is recognized. It replaced IAS 18 Revenue, IAS 11 Construction Contracts and related interpretations. Under IFRS 15, revenue is recognized when a customer obtains control of the goods or services. Determining the timing of the transfer of control – at a point in time or over time requires judgment. The Company is manufacturing and sale of razors and razor blades along with other trading activities which generally include single performance obligation. Management has concluded that revenue from sale of goods be recognized at the point in time when control of the asset is transferred to the customer. The above is generally consistent with the timing and amounts of revenue the Company recognized in accordance with the previous standard, IAS 18. Therefore, the adoption of IFRS 15 which replaced IAS 18 Revenue, IAS 11 Construction Contracts and related interpretations, did not have an impact on the timing and amounts of revenue recognition of the Company except for the reclassification of freight cost previously disclosed in distribution cost to cost of sales. Accordingly, selling and distribution costs of Rs. 233.47 million (2018: Rs. 178.12 million) have been reclassified to cost of sales. There was no adjustment required to beginning retained earnings on 01 July 2018 as a result of adopting the standard. This reclassification has no impact on the reported Earning per Share (“EPS”) of the corresponding year.
Similarly, the amounts received for future sale of goods were reclassified to ‘contract liabilities’ which were previously classified as “advances from customers”.
Impact on financial statements
As at 01 July 2018, contract liabilities were increased by Rs. 38.39 million and advance from customers decreased by the same amount.
5.1.2 IFRS 9 - Financial instruments
IFRS 9 replaced the provisions of IAS 39 ‘Financial Instruments: Recognition and Measurement’ that relates to the recognition, classification and measurement of financial assets and financial liabilities, derecognition of financial instruments, impairment of financial assets and hedge accounting. The details of new significant accounting policies adopted and the nature and effect of the changes to previous accounting policies are set out below:
5.1.2.1 Classification and measurement of financial instruments
IFRS 9 largely retains the existing requirements in IAS 39 for the classification and measurement of financial liabilities. However, it eliminates the previous IAS 39 categories for financial assets of held to maturity, loans and receivables and available for sale. Under IFRS 9, on initial recognition, the Company classifies its financial assets in the following measurement categories:
- those to be measured subsequently at fair value either through other comprehensive income (FVOCl), or through profit or loss (FVTPL); and
- those to be measured at amortized cost
The classification depends on the Company’s business model for managing the financial assets and the contractual terms of the cash flows.
A financial asset is measured at amortized cost if it meets both of the following conditions and is not designated as at fair value through profit or loss:
- It is held within business model whose objective is to hold assets to collect contractual cash flows; and
Notes to the financial statementsFor the year ended 30 June 2019
107106 2019 Annual Report
Fin
anci
al s
tate
men
t

- Its contractual terms give rise on specified dates to cash flows that are solely payments of principal and interest on principal amount outstanding.
Financial assets at amortized cost are subsequently measured using the effective interest rate method. Interest income, foreign exchange gains and losses and impairment are recognized in statement of profit or loss. Any gain or loss on derecognition is recognized in statement of profit or loss.
Equity investments at fair value through profit or loss are measured at fair value. Net gains and losses and dividend income is recognized in statement of profit or loss account.
5.1.2.2 Impact of change in classification and measurement of financial assets due to adoption of IFRS 9
The following table explains the original measurement categories under IAS 39 and the new measurement categories under IFRS 9 for each class of the Company’s financial assets as at 01 July 2018:
Financial AssetsOrignal classification
under IAS 39
New classificationunder IFRS 9
Orignal carrying Amount
New carrying Amount
(Rupees in thousand)
Long term loans Loans and receivable Amortized cost 623 623
Deposits and others Loans and receivable Amortized cost 19,757 19,757
Trade debts Loans and receivable Amortized cost 267,764 267,764
Long term investment Available for sale FVOCI 1,555 1,555
Short term investments Held for trading FVTPL 458,506 458,506
Loan and advances Loans and receivable Amortized cost 6,194,992 6,194,992
Cash and bank balances Loans and receivable Amortized cost 151,549 151,549
Pursuant to the requirement of IFRS-9, accumulated impairment loss on available for sale investment of Rs. 7.04 million at 01 July 2018 previously recognized in profit and loss statement has been recorded in fair value reserve in Statement of Changes in Equity with corresponding effect in accumulated profit.
The accounting policies that apply to financial instruments are stated in note 5.10 to the unconsolidated financial statements.
5.1.2.3 Impairment of financial assets
The adoption of IFRS 9 has changed the Company's impairment model by replacing the IAS 39 ‘incurred loss model’ with a forward looking ‘expected credit loss’ (ECL) model when assessing the impairment of financial assets in the scope of IFRS 9. IFRS 9 requires the Company to recognize ECLs for trade debts earlier than IAS 39. Cash and bank balances, long term loans to employees, intercompany loans and receivables, deposits and other receivables are also subject to ECL but there is no or immaterial impairment for the current year.
Under IFRS 9, the losses allowances are measured on either of the following bases:
- 12 months ECLs: these are the ECLs that result from possible default events within the 12 months after the reporting date; and
- lifetime ECLs: these are ECLs that result from all possible default events over the expected life of a financial instrument
Notes to the financial statementsFor the year ended 30 June 2019

The Company applies the IFRS 9 simplified approach to measure expected credit losses which uses a lifetime expected loss allowance for all trade and other receivables. Trade and other receivables are written off when there is no reasonable expectation of recovery.
Loss allowance on bank balances is measured at 12 months expected credit losses. Since they are short term in nature and there is no adverse change in credit rating of the banks where the balances are maintained, therefore no credit loss is expected on these balances.
5.2 Employee retirement benefits
Defined contribution plans
The Company has maintained five contributory schemes for the employees, as below:
i) A recognized contributory provident fund scheme namely “Treet Corporation Limited - Group Employees Provident Fund” is in operation covering all permanent employees. Equal monthly contributions are made both by the Company and employees in accordance with the rules of the scheme at 10% of the basic salary.
ii) A recognized contributory fund scheme namely “Treet Corporation Limited - Group Employee Service Fund” is in operation which covers all permanent management employees. In accordance with the rules of the scheme, equal monthly contributions are made both by the Company and employees at 10% of basic salary from the date the employee gets permanent status. Additional contributions may be made by the Company for those employees who have at most 15 years of service remaining before reaching retirement age, however, employee can start their additional contribution above the threshold limit of 10% of the basic salary at any time.
iii) A recognized contributory fund scheme namely “Treet Corporation Limited - Group Employees Benevolent Fund” in operation for the benefit of employees if the employee opts for the scheme. The contributions to the fund are made at 10% of employees basic salary on monthly basis by both employee and the employer. Periodic bonuses by the Company to all the employees in any year, not exceeding one month’s basic salary of an employee, is credited to his personal account in the Fund at the sole discretion of the Company.
iv) An unrecognized contributory fund scheme namely “Treet Corporation Limited - Group Employees Superannuation Fund - II” is in operation for the benefit of employees if the employee opts for it. Equal monthly contributions are made both by the Company and employees in accordance with the rules of the scheme at 12% of the basic salary.
v) An unrecognized contributory fund scheme namely, “Treet Corporation Limited - Group Employees Housing Fund Scheme” is in operation covering permanent management employees with minimum five years of service with the Company and on option of the employee. Equal contributions are made monthly both by the Company and employees in accordance with the rules of the scheme at 20% of the basic pay.
Defined benefit plans
An approved funded gratuity scheme and a funded superannuation scheme are in operation for all employees with qualifying service periods of six months and ten years respectively. These are operated through “Treet Corporation Limited - Group Employees Gratuity Fund” and “Treet Corporation Limited - Group Employee Superannuation Fund” respectively. The Company’s net obligation in respect of defined benefit plans is calculated separately for each plan by estimating the amount of future benefits that employees have earned in current and prior periods, discounting that amount and deducting the fair value of any plan assets.
Notes to the financial statementsFor the year ended 30 June 2019
109108 2019 Annual Report
Fin
anci
al s
tate
men
t
The calculation of defined benefit obligation is performed annually by a qualified actuary using the ‘Projected Unit Credit Method’ and latest actuarial valuation has been carried out at 30 June 2019. When calculation results in a potential asset for the Company, the recognized asset is limited to the present value of economic benefits available in the form of refunds from the plan or reductions in future contributions to the plan.
Actual gains and losses arising from experience, adjustments and changes in actuarial assumptions are charged to equity through other comprehensive income in the year in which they arise. Past service costs are recognized immediately in the statement of profit or loss. The main features of defined benefit schemes are mentioned in note 24.
Employee Stock Option Scheme
The Company operates an equity settled stock option scheme to be called ‘Treet Corporation Limited - Employees Stock Option Scheme, 2015’. The Compensation Committee (“Committee”) of the Board of Directors (“Board”) evaluates the performance and other criteria of employees and recommends to the Board for grant of options. The Board on the recommendation of the committee, on its discretion, grants recommended options to employees. These options vest after a specified period subject to fulfillment of certain conditions as defined in the scheme. Upon vesting, employees are eligible to apply and secure allotment of Company’s shares at a pre-determined price on the date of grant of options. The main features of the scheme are mentioned in note 25.
The grant date fair value of equity settled share based payments to employees, determined as option discount as allowed by Public Companies (Employee Stock Option Scheme) Rules 2001, is recognized as employee compensation expense on a straight line basis over the vesting period with a consequent credit to equity as employee stock option compensation reserve. The deferred employee stock option cost is shown as a deduction from employee stock option compensation reserve. Option discount means the excess of market price of the share at the date of grant of an option under a Scheme over exercise price of the option.
When an unvested option lapses by virtue of an employee not conforming to the vesting conditions after recognition of an employee compensation expense in the statement of profit or loss, such employee compensation expense is reversed in the profit or loss account equal to the amortized portion with a corresponding effect to employee stock option compensation reserve equal to the un-amortized portion.
When a vested option lapses on expiry of the exercise period, employee compensation expense already recognized in the statement of profit or loss is reversed with a corresponding reduction to employee stock option compensation reserve. When the options are exercised, employee stock option compensation reserve relating to these options is transferred to share capital and share premium. An amount equivalent to the face value of related shares is transferred to share capital. Any amount over and above the share capital is transferred to share premium.
5.3 Taxation
Current
Provision of current tax is based on the taxable income for the year determined in accordance with the prevailing law for taxation of income. The charge for current tax is calculated using prevailing tax rates or tax rates expected to apply to the profit for the year if enacted after taking into account tax credits, rebates and exemptions, if any. The charge for current tax also includes adjustments, where considered necessary, to provision for tax made in previous years arising from assessments framed during the year for such years.
Notes to the financial statementsFor the year ended 30 June 2019

Deferred
Deferred tax is recognized using the balance sheet liability method, on all temporary differences arising from differences between the carrying amount of assets and liabilities in the unconsolidated financial statements and the corresponding tax loses used in the computation of taxable profit. Deferred tax liabilities are recognized for all taxable temporary differences. Deferred tax assets are recognized for all deductible temporary differences and carry-forward of unused tax losses and tax credits, to the extent that it is probable that taxable profits will be available against which the deductible temporary differences, unused tax losses and tax credits can be utilized.
The carrying amount of all deferred tax assets is reviewed at each balance sheet date and reduced to the extent that it is no longer probable that sufficient taxable profits will be available to allow all or part of the deferred tax assets to be utilized.
Deferred tax assets and liabilities are measured at the tax rates that are expected to apply to the period when the asset is realized or the liability is settled, based on tax rates (and tax laws) that have been enacted or substantively enacted at the balance sheet date. In this regard, the effects on deferred taxation of the proportion of income that is subject to final tax regime is also considered in accordance with the treatment prescribed by the Institute of Chartered Accountants of Pakistan. Deferred tax is charged in the statement of profit or loss, except in the case of items charged to other comprehensive income or equity in which case it is included in other comprehensive income or equity.
5.4 Property, plant and equipment
Property, plant and equipment are carried at cost less accumulated depreciation and impairment loss, if any, except for freehold land and buildings on freehold land. Freehold land is stated at revalued amount carried out by independent valuers by reference to its current market price less impairment loss, if any. Buildings on freehold land is stated at revalued amount carried out by independent valuers by reference to its current market price less accumulated depreciation and impairment loss, if any. Any accumulated depreciation at the date of revaluation is eliminated against the gross carrying amount of the buildings, and the net amount is restated to the revalued amount of the buildings.
Increases in the carrying amount arising on revaluation of property, plant and equipment are credited to surplus on revaluation of property, plant and equipment. Decreases that offset previous increases of the same assets are charged against this surplus, all other decreases are charged to the statement of profit or loss. Each year the difference between depreciation based on the revalued carrying amount of the asset charged to the statement of profit or loss, and depreciation based on the asset’s original cost is transferred from ‘surplus on revaluation of property, plant and equipment’ to ‘equity’. All transfers to / from surplus on revaluation of property, plant and equipment are net of applicable deferred income tax.
Capitalization threshold
Following are the minimum threshold limits for capitalization of individual items:
Particulars Rupees
Building on freehold land 50,000
Plant and machinery 10,000
Office equipments 8,000
Furniture and fixture 10,000
Others 10,000
Depreciation is charged to statement of profit or loss, unless it is included in the carrying amount of another asset, on straight line method whereby cost of an asset is written off over its estimated useful life given in note 6.1.
Notes to the financial statementsFor the year ended 30 June 2019
111110 2019 Annual Report
Fin
anci
al s
tate
men
t

Depreciation on additions to property, plant and equipment is charged from the day on which an asset is available for use till the day the asset is fully depreciated or disposed off. Assets, which have been fully depreciated, are retained in the books at a nominal value of Rupee 1. Where an impairment loss is recognized, the depreciation charge is adjusted in the future periods to allocate the assets revised carrying amount over its estimated useful life.
Depreciation methods, residual value and the useful life of assets are reviewed at each financial year end, and adjusted if impact on depreciation is significant.
Subsequent costs are included in the asset’s carrying amount or recognized as a separate asset, as appropriate, only when it is probable that future economic benefits associated with the item will flow to the Company and cost of the item can be measured reliably. All other repairs and maintenance costs are charged to the statement of profit or loss as and when incurred.
On disposal or scrapping, the cost of the assets and the corresponding depreciation is adjusted and the resultant gain or loss is dealt with through the statement of profit or loss.
Capital work-in-progress
Capital work in progress is stated at cost, less any identified impairment loss. Capital work in progress represents expenditure on property, plant and equipment in the course of construction and installation. Transfers are made to relevant category of property, plant and equipment as and when assets are available for use.
5.5 Investment property
Property not held for own use or for the sale in the ordinary course of business is classified as investment property. The investment property of the Company comprises of land and are valued using the cost method and are stated at cost less any identified impairment loss.
The gain or loss on disposal or retirement of an asset represented by the difference between the sale proceeds and the carrying amount of the asset is recognized as income or expense in the statement of profit or loss.
5.6 Intangible assets
Intangible assets represent the cost of computer software (ERP system) and are stated at cost less accumulated amortization and any identified impairment loss. Subsequent expenditure is capitalized only when it increases the future economic benefits embodied in the specific asset to which it relates. All other expenditure is recognized in the statement of profit or loss as incurred.
All intangibles are amortized over the period of five years on a straight line basis as referred in note 8 so as to write off the cost of an asset over its estimated useful life. Amortization on additions to intangible assets is charged from the day on which an asset is available for use till the day the asset is fully amortized or disposed off.
5.7 Non-current assets held for sale
Non-current assets are classified as assets held for sale if it is highly probable that their carrying amount will be recovered principally through sale rather than through continuing use. They are stated at lower of carrying amount and fair value less costs to sell.
Notes to the financial statementsFor the year ended 30 June 2019

Once classified as held for sale, intangible assets and property plant and equipment are no longer amortized or depreciated, and any equity accounted investee is no longer equity accounted.
5.8 Investments
Investments intended to be held for less than twelve months from the reporting date or to be sold to raise operating capital are included in current assets, all other investments are classified as non-current. Management determines the classification of its investments at the time of purchase depending on the purpose for which the investments are required and re-evaluates this classification on regular basis.
Investment in subsidiaries and associates
Investments in subsidiaries and associates where the Company has control / significant influence are measured at cost less impairment, if any, in the Company’s separate financial statements. At subsequent reporting date, the recoverable amounts of investments are estimated to determine the extent of impairment losses, if any, and carrying amounts of investments are adjusted accordingly. Impairment losses are recognized as expense in the statement of profit or loss. Investments in subsidiaries and associates that have suffered an impairment are reviewed for possible reversal of impairment at each reporting date. Where impairment losses subsequently reverse, the carrying amounts of the investments are increased to the revised recoverable amounts but limited to the extent of initial cost of investments. Impairment losses recognized in the statement of profit or loss on investments in subsidiaries and associates are reversed through the statement of profit or loss.
The Company is required to issue consolidated financial statements along with its separate financial statements, in accordance with the requirements of IAS 27, ‘Separate Financial Statements’. Investments in associates, in the consolidated financial statements, are being accounted for using the equity method.
5.9 Impairment
Financial assets
The Company recognizes loss allowances for ECLs on:
- financial assets measured at amortized cost;
- debt investments measured at FVOCI; and
- contract assets.
The Company measures loss allowances at an amount equal to lifetime ECLs, except for the following, which are measured at 12-month ECLs:
- debt securities that are determined to have low credit risk at the reporting date; and
- other debt securities and bank balances for which credit risk (i.e. the risk of default occurring over the expected life of the financial instrument) has not increased significantly since initial recognition.
12 month ECLs are the portion of ECLs that result from default events that are possible within the 12 months after the reporting date (or a shorter period if the expected life of the instrument is less than 12 months).
When determining whether the credit risk of a financial asset has increased significantly since initial recognition and when estimating ECLs, the Company considers reasonable and supportable information that is relevant and available without undue cost or effort. This includes both quantitative and qualitative information and analysis, based on the Company’s historical experience and informed credit assessment and including forward-looking information.
Notes to the financial statementsFor the year ended 30 June 2019
113112 2019 Annual Report
Fin
anci
al s
tate
men
t
The Company assumes that the credit risk on a financial asset has increased significantly if it is more than past due for a reasonable period of time. Lifetime ECLs are the ECLs that result from all possible default events over the expected life of a financial instrument. 12-month ECLs are the portion of ECLs that result from default events that are possible within the 12 months after the reporting date (or a shorter period if the expected life of the instrument is less than 12 months). The maximum period considered when estimating ECLs is the maximum contractual period over which the Company is exposed to credit risk.
Loss allowances for financial assets measured at amortized cost are deducted from the Gross carrying amount of the assets.
The Gross carrying amount of a financial asset is written off when the Company has no reasonable expectations of recovering of a financial asset in its entirety or a portion thereof. The Company individually makes an assessment with respect to the timing and amount of write off based on whether there is a reasonable expectation of recovery. The Company expects no significant recovery from the amount written off.
Non-financial assets
The carrying amount of the Company’s non-financial assets, other than inventories and deferred tax assets are reviewed at each reporting date to determine whether there is any indication of impairment. If any such indication exists, then the asset’s recoverable amount is estimated. A cash-generating unit is the smallest identifiable asset group that generates cash flows that largely are independent from other assets and groups. The recoverable amount of an asset or cash generating unit is the greater of its value in use and its fair value less cost to sell. In assessing value in use, the estimated future cash flows are discounted to their present values using a pre-tax discount rate that reflects current market assessments of the time value of money and the risks specific to the asset or cash generating unit.
An impairment loss is recognized if the carrying amount of the assets or its cash generating unit exceeds its estimated recoverable amount. Impairment losses are recognized in the statement of profit or loss. Impairment losses recognized in respect of cash generating units are allocated first to reduce the carrying amount of any goodwill allocated to the cash-generating unit and then to reduce the carrying amounts of the other assets in the unit on a pro rata basis. Impairment losses recognized in prior periods are assessed at each reporting date for any indications that the loss has decreased or no longer exists. An impairment loss is reversed if there has been a change in the estimates used to determine the recoverable amount. An impairment loss is reversed only to that extent that the asset’s carrying amount after the reversal does not exceed the carrying amount that would have been determined, net of depreciation and amortization, if no impairment loss had been recognized.
5.10 Financial Instruments
5.10.1 Recognition and initial measurement
All financial assets or financial liabilities are initially recognized when the Company becomes a party to the contractual provisions of the instrument.
A financial asset (unless it is a trade receivable without a significant financing component) or financial liability is initially measured at fair value plus, for an item not at FVTPL, transaction costs that are directly attributable to its acquisition or issue. A receivable without a significant financing component is initially measured at the transaction price.
Notes to the financial statementsFor the year ended 30 June 2019
5.10.2 Classification and subsequent measurement
Financial assets
On initial recognition, a financial asset is classified as measured at amortized cost, fair value through other comprehensive income (FVOCI) and fair value through profit or loss (FVTPL).
A financial asset is initially measured at fair value plus, for an item not at FVTPL, transaction costs that are directly attributable to its acquisition.
Financial assets are not reclassified subsequent to their initial recognition unless the Company changes its business model for managing financial assets, in which case all affected financial assets are reclassified on the first day of the first reporting period following the change in the business model.
Amortized cost
A financial asset is measured at amortized cost if it meets both of the following conditions and is not designated as at FVTPL:
- it is held within a business model whose objective is to hold assets to collect contractual cash flows; and
- its contractual terms give rise on specified dates to cash flows that are solely payments of principal and interest on the principal amount outstanding.
These assets are subsequently measured at amortized cost using the effective interest method. The amortized cost is reduced by impairment losses. Interest income, foreign exchange gains and losses and impairment are recognized in statement of profit or loss. Any gain or loss on derecognition is recognized in statement of profit or loss.
Financial assets measured at amortized cost comprise of cash and bank balances, deposits, trade debts and other receivables.
Debt Instrument - FVOCI
A debt investment is measured at FVOCI if it meets both of the following conditions and is not designated as at FVTPL:
- it is held within a business model whose objective is achieved by both collecting contractual cash flows and selling financial assets; and
- its contractual terms give rise on specified dates to cash flows that are solely payments of principal and interest on the principal amount outstanding.
These assets are subsequently measured at fair value. Interest income calculated using the effective interest method, foreign exchange gains and losses and impairment are recognized in statement of profit or loss. Other net gains and losses are recognized in OCI. On derecognition, gains and losses accumulated in OCI are reclassified to statement of profit or loss. However, the Company has no such instrument at the reporting date.
Notes to the financial statementsFor the year ended 30 June 2019
115114 2019 Annual Report
Fin
anci
al s
tate
men
t

Equity Instrument - FVOCI
On initial recognition of an equity investment that is not held for trading, the Company may irrevocably elect to present subsequent changes in the investment’s fair value in OCI. This election is made on an investment-by-investment basis.
These assets are subsequently measured at fair value. Dividends are recognized as income in statement of profit or loss unless the dividend clearly represents a recovery of part of the cost of the investment. Other net gains and losses are recognized in OCI and are never reclassified to statement of profit or loss.
Fair value through profit or loss (FVTPL)
All financial assets not classified as measured at amortized cost or FVOCI as described above are measured at FVTPL.
On initial recognition, the Company may irrevocably designate a financial asset that otherwise meets the requirements to be measured at amortized cost or at FVOCI as at FVTPL if doing so eliminates or significantly reduces an accounting mismatch that would otherwise arise.
These assets are subsequently measured at fair value. Net gains and losses, including any interest or dividend income, are recognized in statement of profit or loss.
Financial assets – Business model assessment:
For the purposes of the assessment, ‘principal’ is defined as the fair value of the financial asset on initial recognition. ‘Interest’ is defined as consideration for the time value of money and for the credit risk associated with the principal amount outstanding during a particular period of time and for other basic lending risks and costs (e.g. liquidity risk and administrative costs), as well as a profit margin.
In assessing whether the contractual cash flows are solely payments of principal and interest, the Company considers the contractual terms of the instrument. This includes assessing whether the financial asset contains a contractual term that could change the timing or amount of contractual cash flows such that it would not meet this condition. In making this assessment, the Company considers:
- contingent events that would change the amount or timing of cash flows;
- terms that may adjust the contractual coupon rate, including variable-rate features;
- prepayment and extension features; and
- terms that limit the Company’s claim to cash flows from specified assets (e.g. non-recourse features).
Financial liabilities
Financial liabilities are classified as measured at amortized cost or FVTPL. A financial liability is classified as at FVTPL if it is classified as held-for-trading, it is a derivative or it is designated as such on initial recognition. Financial liabilities at FVTPL are measured at fair value and net gains and losses, including any interest expense, are recognized in statement of profit or loss. Other financial liabilities are subsequently measured at amortized cost using the effective interest method. Interest expense and foreign exchange gains and losses are recognized in statement of profit or loss. Any gain or loss on derecognition is also recognized in statement of profit or loss.
Financial liabilities comprise trade and other payables and short term financing.
Notes to the financial statementsFor the year ended 30 June 2019
5.10.3 Derecognition
Financial assets
The Company derecognizes a financial asset when the contractual rights to the cash flows from the financial asset expire, or it transfers the rights to receive the contractual cash flows in a transaction in which substantially all of the risks and rewards of ownership of the financial asset are transferred or in which the Company neither transfers nor retains substantially all of the risks and rewards of ownership and it does not retain control of the financial asset.
The Company might enter into transactions whereby it transfers assets recognized in its statement of financial position, but retains either all or substantially all of the risks and rewards of the transferred assets. In these cases, the transferred assets are not derecognized.
Financial liabilities
The Company derecognizes a financial liability when its contractual obligations are discharged or cancelled, or expire. The Company also derecognizes a financial liability when its terms are modified and the cash flows of the modified liability are substantially different, in which case a new financial liability based on the modified terms is recognized at fair value. On derecognition of a financial liability, the difference between the carrying amount extinguished and the consideration paid (including any non-cash assets transferred or liabilities assumed) is recognized in statement of profit or loss.
5.11 Stores and spares
These are valued at the moving average cost except for items in transit, which are valued at invoice price and related expenses incurred up to the balance sheet date. The Company reviews the carrying amount of stores and spares on a regular basis and provision is made for obsolescence if there is any change in usage pattern and physical form of related stores and spares.
5.12 Stock-in-trade
Stock of raw materials, packing materials, work in process and finished goods is valued at lower of moving average cost and net realizable value, except for stock in transit which is valued at invoice price and related expenses. Cost in relation to work in process and finished goods includes direct production costs such as raw materials, consumables, labor and appropriate proportion of production overheads. Finished goods purchased for resale are valued at moving average cost of purchase and comprise of purchase price and other costs incurred in bringing the material to its present location and condition.
Net realizable value signifies the estimated selling price in the ordinary course of business less estimated costs of completion and the estimated cost necessary to be incurred to make the sale.
5.13 Trade debts, loans, deposits and other receivables
These are classified at amortized cost and are initially recognized when they are originated and measured at fair value of consideration receivable. These assets are written off when there is no reasonable expectation of recovery. Actual credit loss experience over past years is used to base the calculation of expected credit loss.
Notes to the financial statementsFor the year ended 30 June 2019
117116 2019 Annual Report
Fin
anci
al s
tate
men
t
5.14 Cash and cash equivalents
Cash and cash equivalents are carried in the unconsolidated statement of financial position at amortized cost. For the purpose of cash flow statement, cash and cash equivalents comprise of cash in hand, current and deposit account balances with banks and outstanding balance of running finance facilities availed by the Company.
5.13 Borrowings
Borrowings are recognized initially at the proceeds received. Borrowings are subsequently stated at amortized cost, any difference between the proceeds (net of transaction costs) and the redemption value is recognized in the profit or loss account over the period of the borrowings using the effective interest rate method. Finance costs are accounted for on accrual basis and are reported under accrued markup to the extent of the amount remaining unpaid.
Borrowings are classified as current liabilities unless the company has an unconditional right to defer settlement of the liability for at least twelve months after the reporting date.
5.16 Trade and other payables
Liabilities for trade and other amounts payable are carried at cost which is the fair value of the consideration to be paid in future for goods and services received whether or not billed to the Company.
5.17 Provisions
Provisions are recognized when the Company has a present legal or constructive obligation as a result of past events, it is probable that an outflow of resources embodying economic benefits will be required to settle the obligation, and a reliable estimate can be made of the amount of obligation. Provisions are reviewed at each reporting date and adjusted to reflect the current best estimate.
A provision for warranties is recognized when the underlying products or services are sold, based on historical data and a weighting of possible outcomes against their associated probabilities.
5.18 Foreign currency translation
Foreign currency transactions are translated into Pakistan Rupees which is the Company’s functional and presentation currency using the exchange rates approximating those prevailing at the date of the transaction. All monetary assets and liabilities in foreign currencies are translated into Pakistan Rupees using the exchange rate at the reporting date. Exchange gains and losses resulting from the settlement of such transactions and from the translations at the year end exchange rates of monetary assets and liabilities denominated in foreign currencies are recognized in statement of profit or loss. All non-monetary assets and liabilities are translated in Pakistan Rupees using the exchange rates prevailing on the date of transaction or at the date when the fair value was determined.
5.19 Revenue recognition
(i) Revenue from the sale of goods is recognized at the point in time when the performance obligations arising from the contract with a customer is satisfied and the amount of revenue that it expects to be entitled to can be determined. This usually occurs when control of the asset is transferred to the customer, which is when goods are delivered to the customer.
Notes to the financial statementsFor the year ended 30 June 2019

Revenue is measured based on the consideration specified in a contract with a customer and excludes amounts collected on behalf of third parties. Revenue is disclosed net of returns, rebates, discounts and other allowances.
(ii) Dividend income and entitlement of bonus shares are recognized when the right to receive is established.
(iii) Return on bank deposits, investments and interest on loans is accounted for on a time proportionate basis using the applicable rate of return / interest.
5.20 Contract liabilities
A contract liability is the obligation of the Company to transfer goods or services to a customer for which the Company has received consideration (or an amount of consideration is due) from the customer. If a customer pays consideration before the Company transfers goods or services to the customer, a contract liability is recognized when the payment is made or the payment is due (whichever is earlier). Contract liabilities are recognized as revenue when the Company performs under the contract. It also includes refund liabilities arising out of customers’ right to claim amounts from the Company on account of contractual delays in delivery of performance obligations and incentive on target achievements.
5.21 Borrowing costs
General and specific borrowing costs directly attributable to the acquisition, construction or production of qualifying assets, which are assets that necessarily take a substantial period of time to get ready for their intended use or sale, are added to the cost of those assets, until such time as the assets are substantially ready for their intended use or sale. All other borrowing costs are recognized in statement of profit or loss in the period in which they are incurred.
5.22 Research and development costs
Research and development costs are charged to statement of profit or loss as and when incurred.
5.23 Dividends
Dividend distribution to the shareholders is recognized as a liability in the period in which the dividends are approved.
5.24 Contingent liabilities
A contingent liability is disclosed when:
- there is a possible obligation that arises from past events and whose existence will be confirmed only by the occurrence or non-occurrence of one or more uncertain future events not wholly within the control of the Company; or
- there is present obligation that arises from past events but it is not probable that an outflow of resources embodying economic benefits will be required to settle the obligation or the amount of the obligation cannot be measured with sufficient reliability.
Notes to the financial statementsFor the year ended 30 June 2019
119118 2019 Annual Report
Fin
anci
al s
tate
men
t
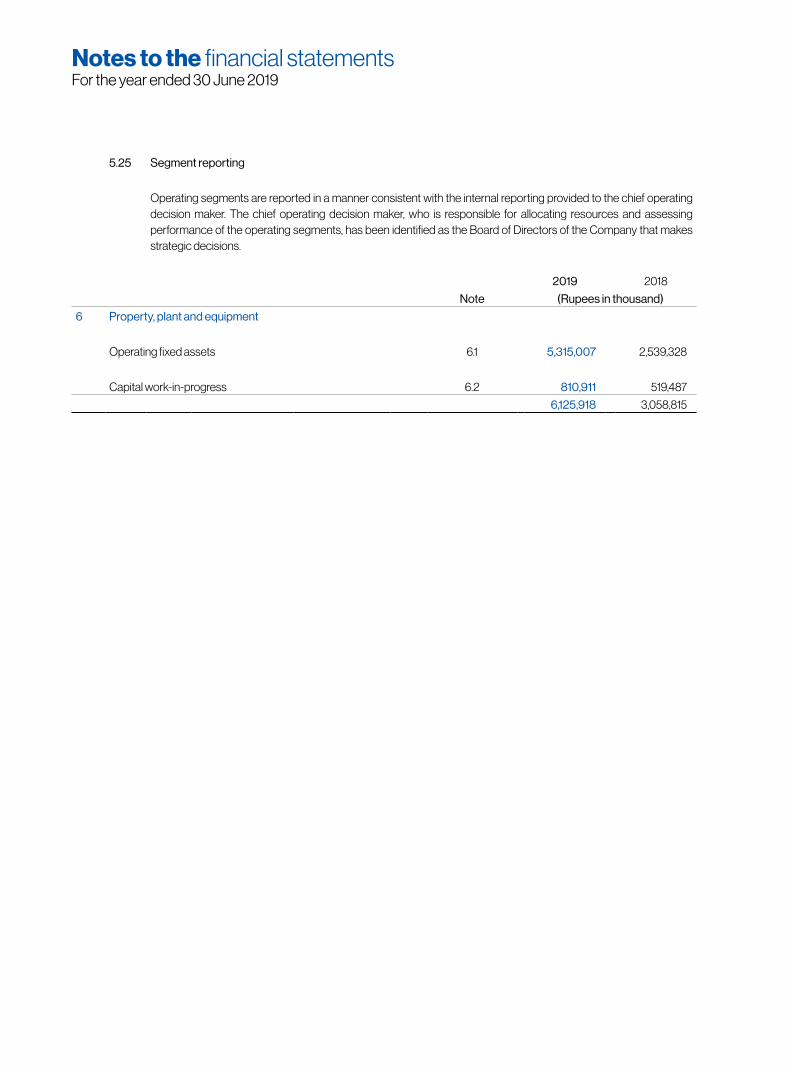
5.25 Segment reporting
Operating segments are reported in a manner consistent with the internal reporting provided to the chief operating decision maker. The chief operating decision maker, who is responsible for allocating resources and assessing performance of the operating segments, has been identified as the Board of Directors of the Company that makes strategic decisions.
2019 2018
Note (Rupees in thousand)
6 Property, plant and equipment
Operating fixed assets 6.1 5,315,007 2,539,328
Capital work-in-progress 6.2 810,911 519,487
6,125,918 3,058,815
Notes to the financial statementsFor the year ended 30 June 2019

6.1
Pro
pert
y, p
lant
and
equ
ipm
ent
Not
eA
nnua
l ra
te o
fde
prec
iatio
n
Cos
t/ re
valu
ed
amou
nt a
s at
01 J
uly
2018
Add
ition
s/
(Del
etio
ns)
Rev
alua
tion
surp
lus
durin
g th
e ye
ar
Cos
t as
at3
0 J
une
2019
Acc
umul
ated
depr
ecia
tion
as a
t0
1 Jul
y 20
18
Dep
reci
atio
n ch
arge
/ (d
elet
ions
) for
th
e ye
ar
Acc
umul
ated
depr
ecia
tion
as a
t3
0 J
une
2019
Boo
k va
lue
as a
t3
0 J
une
2019
%--
----
----
----
----
----
----
----
----
----
----
(Rup
ees
in th
ousa
nd)-
----
----
----
----
----
----
----
----
----
---
Ow
ned
Free
hold
land
6
.1.1 -
1,22
7,8
05
- 2
,48
6,6
30
3
,714
,43
5 -
- -
3,7
14,4
35
Bui
ldin
gs o
n fre
ehol
d la
nd5
49
5,75
8
89
,879
12
7,9
12
713
,54
9
126
,58
9
36
,69
1 16
3,2
80
5
50,2
69
Pla
nt &
mac
hine
ry10
1,6
84
,33
9
176
,56
4
- 1,
86
0,3
53
970
,757
12
4,5
60
1,
09
4,7
67
76
5,58
6
(550
) (5
50)
Furn
iture
and
equ
ipm
ent
10 -
25 10
8,8
89
5
9,3
23
- 16
6,9
37
62,
90
8
14,11
4
76
,198
9
0,7
39
(1
,275
) (8
24)
Vehi
cles
20 3
33
,021
8
6,6
52
- 3
69
,156
15
0,2
30
6
0,6
71
175,
178
19
3,9
78
(50
,517
) (3
5,72
3)
2019
3,8
49
,812
4
12,4
18
2,6
14,5
42
6,8
24,4
30
1,
310
,48
4
23
6,0
36
1,
509
,423
5
,315
,00
7
(52,
34
2) (3
7,0
97)
Ann
ual
rate
of
depr
ecia
tion
Cos
t/ re
valu
ed
amou
nt a
s at
01 J
uly
2018
Add
ition
s/
(Del
etio
ns)
Rev
alua
tion
surp
lus
durin
g th
e ye
ar
Cos
t as
at30
Jun
e 20
19
Acc
umul
ated
depr
ecia
tion
as a
t0
1 Jul
y 20
18
Dep
reci
atio
n ch
arge
/ (d
elet
ions
) for
the
year
Acc
umul
ated
depr
ecia
tion
as a
t30
Jun
e 20
19
Boo
k va
lue
as a
t30
Jun
e 20
19
%--
----
----
----
----
----
----
----
----
----
----
(Rup
ees
in th
ousa
nd)-
----
----
----
----
----
----
----
----
----
---
Ow
ned
Free
hold
land
- 1,
227,
805
- -
1,22
7,80
5 -
- -
1,22
7,80
5
Bui
ldin
gs o
n fre
e ho
ld la
nd5
495
,758
-
- 4
95,7
58
93,
642
32,
947
126,
589
369
,169
Pla
nt &
mac
hine
ry10
1,52
1,966
16
4,99
6 -
1,68
4,33
9 8
68,0
60
105,
320
9
70,7
57
713
,582
(2
,623
) (2
,623
)
Furn
iture
and
equ
ipm
ent
10 -
25 9
2,99
8 17
,069
-
108,
889
54,
092
9
,770
6
2,90
8 4
5,98
1 (1
,178)
(954
)
Vehi
cles
20 2
80,7
63
107,0
15
- 3
33,0
21
138,
039
5
0,69
2 15
0,23
0
182,
791
(54,
757)
(38,
501)
2018
3,6
19,2
90
289
,080
-
3,8
49,8
12
1,153
,833
19
8,72
9 1,
310,
484
2,5
39,3
28
(58,
558)
(42,
078)
Notes to the financial statementsFor the year ended 30 June 2019
121120 2019 Annual Report
Fin
anci
al s
tate
men
t

6.1.1 Particulars of immovable property (i.e. land and building) in the name of Company are as follows:
Location Usage of Immovable Property
Total area (acres)
Covered Area (Square Feet)
Main Haali / Link Road Hyderabad Manufacturing facility 5.49 Acres 98,696
72-b Main Peco Road, Kot Lakhpat Lahore Head Office & Manufacturing facility 14.06 Acres 231,440
Warehouse land, 14 Km Multan Road, Lahore Warehouse 1.5 Acres 10,752
05 Km off Ferozpur Road, Gajju Matta, Kacha Road, Lahore
Warehouse 10.76 Acres 82,913
2019 2018
Note (Rupees in thousand)
6.1.2 Depreciation charge for the year has been allocated as follows:
Cost of sales 31 185,930 156,432
Administrative expenses 32 33,126 27,109
Distribution cost 33 16,980 15,188
236,036 198,729
6.1.3 Had there been no revaluation, the net book value of specific classes of operating fixed assets would have amounted to:
Land 111,933 111,933
Buildings 262,397 198,518
374,330 310,451
6.1.4 The following assets were disposed off during the year:
Particulars CostAccumulated depreciation
Bookvalue
Saleproceeds
(Loss) / Profit
Mode of disposal
Relationship with the Company
Particulars of purchaser
-------------------------------- (Rupees in thousand)-----------------------------------
Plant and machinery 550 550 - 150 150 Negotiation Related Party/Third Party Various
Furniture and equipment 1,274 823 451 289 (162) Negotiation Related Party/Third Party Various
Vehicles
Toyota Corolla Gli 1.3 1,863 834 1,029 1,148 119 Company scheme Employee Mr. Ali Zulqernain Bukhari
Honda Vezel Hybrid 1,825 699 1,126 1,215 89 Company scheme Employee Mr. Arshad Latif
Suzuki Swift Auto 1,511 455 1,056 1,664 608 Company scheme Employee Mr. Mr. Umer
Suzuki Wagon R 1,125 263 862 875 13 Company scheme Employee Mr. M. Naseem Khan
Suzuki Wagon R 1,069 225 844 901 57 Company scheme Employee Mr. Azhar Saeed Butt
Suzuki Mehran 625 125 500 625 125 Company scheme Employee Mr. Javaid Ijaz
Suzuki Mehran 625 86 539 625 86 Company scheme Employee Mr. Tariq Mahmood
Suzuki Mehran 625 86 539 625 86 Company scheme Employee Mr. Zain Pervaiz Bhatti
Suzuki Mehran 625 185 440 625 185 Company scheme Employee Mr. Amer Ahmad Khan
Suzuki Wagon-R 1,274 113 1,161 1,274 113 Company scheme Employee Mr. Tallat Mehmood
Others 39,351 32,653 6,698 25,226 18,528 Company scheme Employees Various
2019 52,342 37,097 15,245 35,242 19,997
2018 58,558 42,078 16,480 36,827 20,348
Notes to the financial statementsFor the year ended 30 June 2019
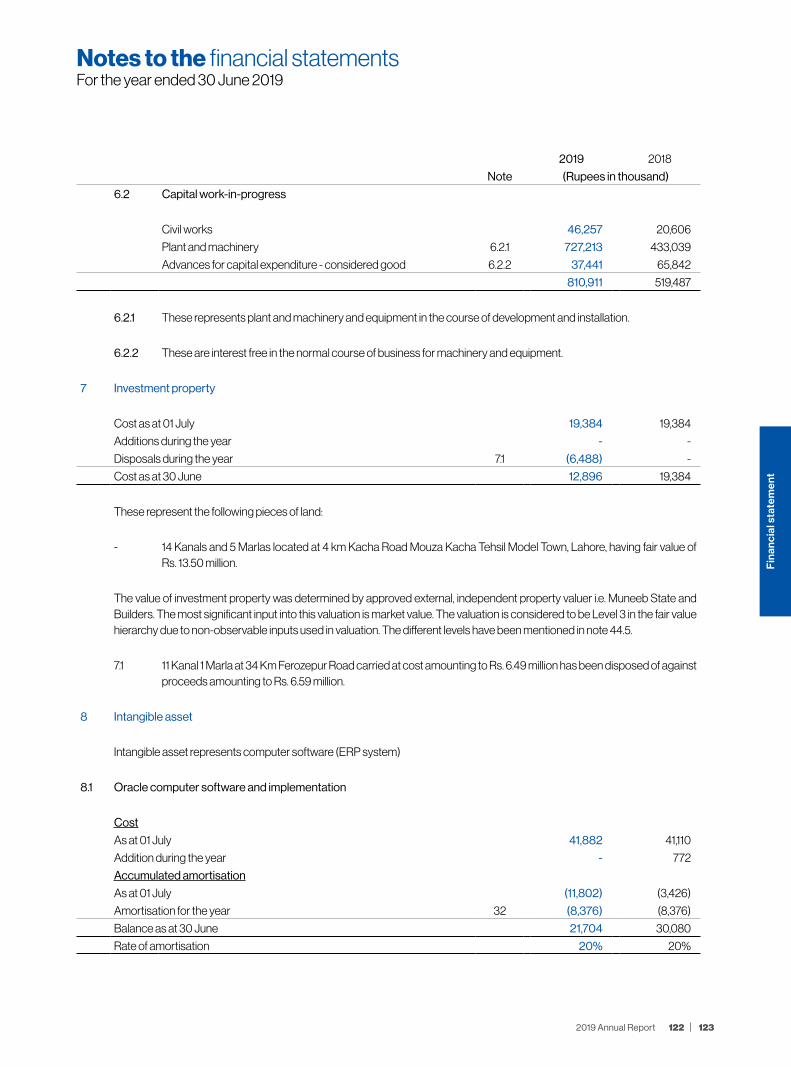
2019 2018
Note (Rupees in thousand)
6.2 Capital work-in-progress
Civil works 46,257 20,606
Plant and machinery 6.2.1 727,213 433,039
Advances for capital expenditure - considered good 6.2.2 37,441 65,842
810,911 519,487
6.2.1 These represents plant and machinery and equipment in the course of development and installation.
6.2.2 These are interest free in the normal course of business for machinery and equipment.
7 Investment property
Cost as at 01 July 19,384 19,384
Additions during the year - -
Disposals during the year 7.1 (6,488) -
Cost as at 30 June 12,896 19,384
These represent the following pieces of land:
- 14 Kanals and 5 Marlas located at 4 km Kacha Road Mouza Kacha Tehsil Model Town, Lahore, having fair value of Rs. 13.50 million.
The value of investment property was determined by approved external, independent property valuer i.e. Muneeb State and Builders. The most significant input into this valuation is market value. The valuation is considered to be Level 3 in the fair value hierarchy due to non-observable inputs used in valuation. The different levels have been mentioned in note 44.5.
7.1 11 Kanal 1 Marla at 34 Km Ferozepur Road carried at cost amounting to Rs. 6.49 million has been disposed of against proceeds amounting to Rs. 6.59 million.
8 Intangible asset
Intangible asset represents computer software (ERP system)
8.1 Oracle computer software and implementation
Cost
As at 01 July 41,882 41,110
Addition during the year - 772
Accumulated amortisation
As at 01 July (11,802) (3,426)
Amortisation for the year 32 (8,376) (8,376)
Balance as at 30 June 21,704 30,080
Rate of amortisation 20% 20%
Notes to the financial statementsFor the year ended 30 June 2019
123122 2019 Annual Report
Fin
anci
al s
tate
men
t

2019 2018
Note (Rupees in thousand)
9 Long term investments
In equity instruments of subsidiaries - at cost 9.1 6,040,603 6,048,064
In equity instruments of associate - at cost 9.2 162,529 162,529
Fair value through OCI 9.3 1,555 1,555
6,204,687 6,212,148
Less: Assets held for 9.1.2 - (964,054)
6,204,687 5,248,094
9.1 In equity instruments of subsidiaries - at cost
Treet Holdings Limited - unquoted
61,101,712 (2018: 61,101,712) fully paid ordinary
shares of Rs. 10 each 9.1.1 611,017 611,017
Equity held: 85.93 % (2018: 85.93 %)
Chief Executive Officer - Syed Shahid Ali
First Treet Manufacturing Modaraba - quoted
170,851,700 (2018: 171,224,700) fully paid
certificates of Rs. 10 each 9.1.2 3,417,441 3,424,902
Equity held: 87.35% (2018: 87.54%)
Chief Executive Officer - Syed Shahid Ali
Global Arts Limited - unquoted
160,540,320 (2018: 160,540,320) fully paid ordinary
shares of Rs. 10 each 9.1.3 1,605,403 1,605,403
Equity held: 88.76% (2018: 88.76%)
Chief Executive Officer - Syed Shahid Ali
Renacon Pharma Limited - unquoted
28,342,800 (2018: 28,342,800) fully paid ordinary
shares of Rs. 10 each 9.1.4 406,742 406,742
Equity held: 45.45% (2018: 45.45%)
Chief Executive Officer - Dr. Salman Shakoh
6,040,603 6,048,064
Assets held for sale
First Treet Manufacturing Modaraba - quoted
Nil (2018: 48,202,710) fully paid ordinary
shares of Rs. 10 each (cost Rs. 20 per share) 9.1.2 - (964,054)
6,040,603 5,084,010
Notes to the financial statementsFor the year ended 30 June 2019

9.1.1 The Company directly owns 85.93% (2018: 85.93%) equity interest in Treet Holdings Limited (THL) while the remaining 14.07% (2018: 14.07%) equity interest is indirectly owned through the Company’s subsidiary, Global Arts Limited.
9.1.2 The Company directly owns 87.35% (2018: 87.54%) equity interest in First Treet Manufacturing Modaraba (FTMM) and 10.02% (2018: 10.02%) equity interest is indirectly owned through the Company’s wholly owned subsidiary, Treet Holdings Limited. The decrease in equity interest is due to the sale of 0.37 million certificates during the year at an average rate of Rs. 23.73 per certificate.
The Company has changed its intention to sale its securities, previously classified as held for sale, and accordingly these have been reclassified to long term investments.
During the year, the Board of the Directors of the Modarba Management Company has decided in their meeting held on 21 January 2019 to spin off the battery segment into a new company named as Treet Battery Limited after complying with necessary legal formalities in this regard.
9.1.3 The Company directly owns 88.76% (2018: 88.76%) equity interest in Global Arts Limited (“GAL”) while the remain-ing 11.24% (2018: 11.24%) equity interest is indirectly owned through the Company’s subsidiaries, Treet Holdings Lim-ited (wholly owned) and Renacon Pharma Limited (“RPL”).
9.1.4 Renacon Pharma Limited (“RPL”) is a pharmaceutical manufacturing company incorporated on 07 July 2009. The Company directly owns 45.45% (2018: 45.45%) equity interest in RPL and 10.39% (2018: 10.39%) equity interest is indirectly owned through the Company’s subsidiary, Global Arts Limited (“GAL”).
2019 2018Note (Rupees in thousand)
9.2 In equity instruments of associate - at cost
Loads Limited - quoted18,895,057 (2018: 18,895,057 ) fully paid ordinary shares of Rs. 10 each 9.2.1 162,529 162,529 Equity held: 12.49% (2018: 12.49%)Chief Executive Officer - Munir K. Bana
162,529 162,529
9.2.1 The Company’s investment in Loads Limited is less than 20% but it is considered to be an associate in accordance with the requirements of IAS - 28 “Investments in Associates” because the Company has significant influence over its financial and operating policies through representation on the Board. The market value at reporting date is Rs. 15.11 per share.
9.3 Fair value through OCI
Techlogix International Limited - unquoted
748,879 (2018: 748,879) fully paid ordinary
shares of par value of USD 0.00015.
Equity held: 0.71% (2018: 0.71%)
Less: Provision for impairment
Investment classified as available for sale - 1,555
Investment classified as fair value through other
comprehensive income 1,555 -
9.3.1 1,555 1,555
Notes to the financial statementsFor the year ended 30 June 2019
125124 2019 Annual Report
Fin
anci
al s
tate
men
t

9.3.1 Techlogix International Limited (“Techlogix”) is a Bermuda registered company with the beneficial owners, Salman Akhtar and Kewan Khawaja of United States of America. Techlogix is engaged in providing specialized technical consultancy and software development services to national and international clients. The Company intends to hold this investment of USD 112 (2018: USD 112) over the long term and realise its returns. During the year, the company received a return amounting to Rs. Nil (2018: Rs. 0.12 million).
2019 2018
Note (Rupees in thousand)
10 Long term loans
Loans to employees - secured, considered good 10.1 15,484 12,941
Less : current portion of loan to employees - secured,
considered good 17 (13,511) (12,318)
1,973 623
10.1 These are interest free loans to the Company’s employees for construction of house and purchase of cycles, which are repayable in monthly installments over a period of 12 to 24 months and are secured against employee retirement benefits. These include an amount of Rs. 12.99 million (2018: Rs. 12.28 million) receivable from the executives of the Company. No loan has been given to directors or chief executive of the Company.
10.2 Reconciliation of the carrying amount of loans to executives:
Balance as at 01 July 12,283 15,933
Disbursements during the year 20,682 15,064
Repayments during the year (19,971) (18,714)
Balance as at 30 June 12,994 12,283
10.3 The maximum amount due from the executives at the end of any month during the year was Rs. 3.44 million (2018: Rs. 2.75 million). The maximum amount due from the executives at the end of any month during the year was Rs. 3.44 million (2018: Rs. 2.75 million).
11 Long term security deposits
Long term security deposits 11.1 23,644 19,757
11.1 This represents deposits against utilities.
12 Deferred taxation 12.1 (13,959) 32,530
Notes to the financial statementsFor the year ended 30 June 2019

2019 2018
Note (Rupees in thousand)
12.1 Deferred tax (liability) / asset arises in respect of following temporary differences:
Taxable temporary differences on: (71,148) (58,572)
- Accelerated tax depreciation (40,245) (20,477)
- Surplus on revaluation of buildings (111,393) (79,049)
Deductible temporary differences on:
- Unused tax losses 24,522 58,013
- Capital loss on short term investments 6,060 5,588
- Employee retirement benefits 66,551 47,722
- Provision for doubtful debts 301 256
97,434 111,579
(13,959) 32,530
12.1.1 Deferred tax asset on tax losses available for carry forward and other items have been recognized to the extent of realization of related tax benefits through future taxable profits is probable.
12.1.2 Movement in deferred tax asset / (liability) is as follows:
Balance as at 01 July 32,530 58,633
Recognized in statement of profit or loss:
- Accelerated tax depreciation (12,575) (2,132)
- Surplus on revaluation of buildings 1,797 1,836
- Capital loss on short term investments 472 (5,901)
- Unused tax losses (33,491) (32,574)
- Provision for doubtful debts 44 32
(43,753) (38,739)
Recognized in other comprehensive income/equity:
- Net off against re-measurement of employee retirement benefits recognized
18,829 11,717
- Effect of change in tax rate on account of surplus on revaluation of buildings
(50) 919
Net off against the surplus on revaluation of building (21,515) -
Balance as at 30 June (13,959) 32,530
13 Stores and spares
Stores 79,871 59,928
Spares 113,642 129,473
13.1 193,513 189,401
Notes to the financial statementsFor the year ended 30 June 2019
127126 2019 Annual Report
Fin
anci
al s
tate
men
t

13.1 It includes stores and spares in transit amounting to Rs. 8.02 million (2018: Rs. 17.15 million).
2019 2018Note (Rupees in thousand)
14 Stock-in-trade
Raw and packing material 14.1 666,974 395,318 Work in process 51,552 65,068 Finished goods 14.2 179,675 145,619
898,201 606,005
14.1 It includes raw material in transit amounting to Rs. 135.97 million (2018: Rs. 38.55 million).
14.2 The amount charged to statement of profit or loss on account of write down of finished goods to net realizable value amounts to Rs. 0.91 million (2018: 2.76). It also includes finished goods - chemicals in transit amounting to Rs. 7.36 million (2018: Rs. Nil).
15 Trade debts
Foreign debtors- secured - considered good 90,198 64,406 - unsecured - considered good 165,537 150,736
255,735 215,142
Local debtors - unsecured - considered good 32,111 52,622
287,846 267,764 Considered doubtful 15.1 1,785 1,785
289,631 269,549 Less: Provision for doubtful debts (1,785) (1,785)
287,846 267,764
15.1 The movement in provision for doubtful debts for the year is as follows:
Balance as at 01 July 1,785 1,785
Charge for the year - -
Balance as at 30 June 1,785 1,785
16 Short term investments
Investments at fair value through profit or loss
Listed equity securities 16.1 431,865 458,506
Notes to the financial statementsFor the year ended 30 June 2019

16.1 Details of investment in listed equity securities are stated below:
Share / certificates Carrying value Market value
2019 2018 2019 2018 2019 2018
Number Number ---------------------(Rupees in thousand)---------------------
Sector /Companies
a) Banks
Silk Bank Limited 256,072,500 252,572,500 348,050 424,207 302,166 343,499
b) Textile
Sunrays Textiles Mills Limited 27,200 30,600 4,566 6,044 6,135 5,216
Shahtaj Textile Limited 868,400 868,400 69,463 115,002 84,113 69,463
Maqbool Textiles Mills Limited 894,500 894,500 37,828 27,641 36,451 37,828
Kohinoor Spinning Mills
Limited
- 856,000 - 2,551 - 2,500
d) Mutual Funds
JS investments 30,462 - 3,145 - 3,000 -
d) Miscellaneous
Transmission Engineering
Industries Limited
133,000 133,000 - - - -
463,052 575,445 431,865 458,506
16.2 Investments (shares of Silk Bank Limited and Shahtaj Textile Limited) to the extent of Rs. 203.80 million (cost of Rs. 242.48 million) are pledged in
favour or under lien of the trustee as security against Participation Term Certificates as referred to in note 23.
Notes to the financial statementsFor the year ended 30 June 2019
129128 2019 Annual Report
Fin
anci
al s
tate
men
t

2019 2018
Note (Rupees in thousand)
17 Loans, advances, deposits, prepayments and other receivables
Current portion of loan to employees - secured, considered good 10 13,511 12,318
Advances to employees - secured, considered good 17.1 27,805 76,140
Advances to suppliers - unsecured, considered good 39,048 51,365
Margin deposits against letters of credits 6,971 3,785
Prepayments 17.2 24,607 11,564
Advances to associated undertakings - unsecured, considered good:
Loads Limited 5,426 70
IGI Insurance Limited - 127
17.3 5,426 197
Workers’ profit participation fund 17.4 - 7,793
Balances with statutory authorities:
Export rebate 82,218 61,950
Collector of customs - custom duty 5,722 18,707
Advance income tax 484,398 466,258
Sales tax receivable 37,403 -
609,741 546,915
Receivable from broker against sale of investments 6,669 43,519
Receivable from subsidiary company - First Treet Manufacturing Modaraba , unsecured - considered good 17.5 & 9.1.2 6,497,909 5,830,524
Other receivable - unsecured, considered good
Related parties
Treet Holdings Limited 115,125 107,441
Global Arts Limited 91,341 -
Renacon Pharma Limited 303 124
Treet Power Limited 4,555 4,555
Treet HR Management (Private) Limited 16,152 -
Superannuation Fund 2,590 1,161
Service Fund 239 -
Gratuity Fund 19,576 20,369
Employees Housing Fund 23,662 31,770
17.6 273,543 165,420
Others 2,564 1,913
7,507,794 6,751,453
17.1 These are interest free advances to employees in respect of salary, medical and travelling expenses and are secured against employees retirement benefits. These include an aggregate amount of Rs. 5.09 million (2018: Rs. 7.76 million) receivable from executives of the Company. No amount is advanced to CEO or directors of the Company.
Notes to the financial statementsFor the year ended 30 June 2019

17.2 Prepayments includes amount paid to IGI General Insurance Limited (associated undertaking) of Rs. 16.26 million (2018: Rs. 8.52 million ).
17.3 These represent advances for purchase of goods or services under normal business trade as per the agreed terms and are interest free.
2019 2018
Note (Rupees in thousand)
17.4 Workers profit participation fund
Balance as at 01 July 7,793 (2,470)
Charge for the year (21,157) (720)
(13,364) (3,190)
Payments during the year - 10,983
Balance as at 30 June 20 (13,364) 7,793
17.5 It includes Rs. 5,652.03 million (2018: 5,197.81 million) advanced to First Treet Manufacturing Modarba (“FTMM”) for the on going Battery Project out of the short term running finance facilities availed by the Company. Markup is cal-culated at average borrowing rate of the Company. It also includes receivable on account of reimbursement of ex-penses, sharing of common expenses and purchase of goods under normal business trade as per the agreed terms and are interest free. Consequently, the Company required approval from the shareholders in accordance with the provisions of section 199 of the Companies Act, 2017 for amount advanced to FTMM. The Company intends to take approval from the shareholders in the Annual General Meeting to be held in October 2019.
17.6 These represent amounts receivable from related parties for reimbursement of expenses, sharing of common ex-penses and purchase of goods or services under normal business trade as per the agreed terms and are interest free.
17.7 Ageing of balancesLess than 3
months3 to 6
monthsGreater than
6 months2019 2018
----------------------(Rupees in thousand)----------------------
First Treet Manufacturing Modaraba 834,428 (194,123) 5,851,017 6,491,322 5,830,524 Treet Holding Limited 3,532 23,195 88,398 115,125 107,441 Treet Power Limited - - 4,555 4,555 4,555 Treet HR Management 7,646 2,646 6,860 17,152 - Global Arts Limited 9,400 29,941 52,000 91,341 -
17.8 Maximum outstanding balance with reference to month end balances:In the
month of In the
month of 2019 2018
(Rupees in thousand)
First Treet Manufacturing Modaraba Jun-19 Jun-18 6,491,322 5,830,524 Treet Holding Limited Jun-19 Jun-18 115,125 107,441 Treet Power Limited Jul-17 Jul-17 4,555 4,555 Global Arts Limited Jun-19 N/A 91,341 - Treet HR Management Jun-19 N/A 17,152 -
Notes to the financial statementsFor the year ended 30 June 2019
131130 2019 Annual Report
Fin
anci
al s
tate
men
t
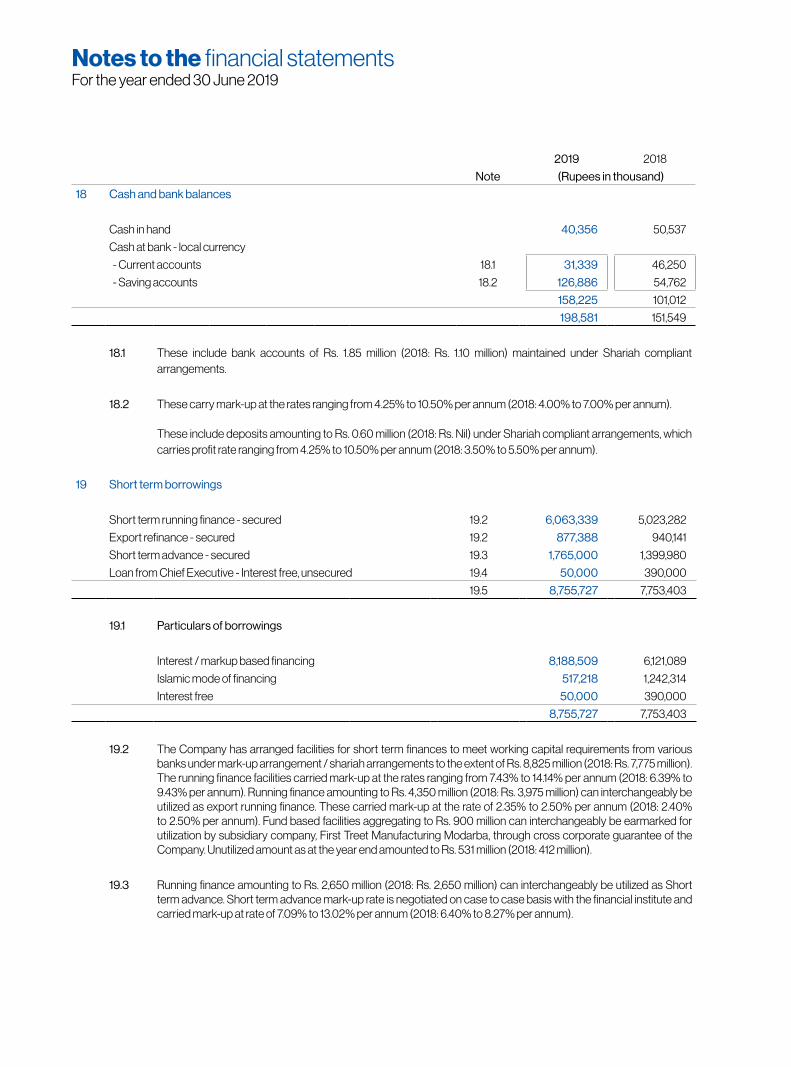
2019 2018
Note (Rupees in thousand)
18 Cash and bank balances
Cash in hand 40,356 50,537
Cash at bank - local currency
- Current accounts 18.1 31,339 46,250
- Saving accounts 18.2 126,886 54,762
158,225 101,012
198,581 151,549
18.1 These include bank accounts of Rs. 1.85 million (2018: Rs. 1.10 million) maintained under Shariah compliant arrangements.
18.2 These carry mark-up at the rates ranging from 4.25% to 10.50% per annum (2018: 4.00% to 7.00% per annum).
These include deposits amounting to Rs. 0.60 million (2018: Rs. Nil) under Shariah compliant arrangements, which carries profit rate ranging from 4.25% to 10.50% per annum (2018: 3.50% to 5.50% per annum).
19 Short term borrowings
Short term running finance - secured 19.2 6,063,339 5,023,282
Export refinance - secured 19.2 877,388 940,141
Short term advance - secured 19.3 1,765,000 1,399,980
Loan from Chief Executive - Interest free, unsecured 19.4 50,000 390,000
19.5 8,755,727 7,753,403
19.1 Particulars of borrowings
Interest / markup based financing 8,188,509 6,121,089
Islamic mode of financing 517,218 1,242,314
Interest free 50,000 390,000
8,755,727 7,753,403
19.2 The Company has arranged facilities for short term finances to meet working capital requirements from various banks under mark-up arrangement / shariah arrangements to the extent of Rs. 8,825 million (2018: Rs. 7,775 million). The running finance facilities carried mark-up at the rates ranging from 7.43% to 14.14% per annum (2018: 6.39% to 9.43% per annum). Running finance amounting to Rs. 4,350 million (2018: Rs. 3,975 million) can interchangeably be utilized as export running finance. These carried mark-up at the rate of 2.35% to 2.50% per annum (2018: 2.40% to 2.50% per annum). Fund based facilities aggregating to Rs. 900 million can interchangeably be earmarked for utilization by subsidiary company, First Treet Manufacturing Modarba, through cross corporate guarantee of the Company. Unutilized amount as at the year end amounted to Rs. 531 million (2018: 412 million).
19.3 Running finance amounting to Rs. 2,650 million (2018: Rs. 2,650 million) can interchangeably be utilized as Short term advance. Short term advance mark-up rate is negotiated on case to case basis with the financial institute and carried mark-up at rate of 7.09% to 13.02% per annum (2018: 6.40% to 8.27% per annum).
Notes to the financial statementsFor the year ended 30 June 2019

19.4 This represents interest free loan obtained from Chief Executive Officer of the Company for working capital requirements and is repayable on demand.
19.5 All short term borrowings of the Company are secured by way of joint first pari passu hypothecation charge of Rs. 10,704 million (2018: Rs. 10,371 million) on the entire present and future current assets of the Company. Export running finances are also covered through lien on documents.
19.5 The facilities for opening letters of credits and guarantees as at 30 June 2019 amounts to Rs. 4,150 million (2018: Rs. 3,707 million) of which unutilized amount as at year end amounted to Rs 2,985 million (2018: Rs. 2,784 million). Non- fund based facilities aggregating to Rs 2,350 million (2018: Rs. 1,890 million) out of which Rs 1,100 million can interchangeably be earmarked for utilization by subsidiary company, First Treet Manufacturing Modarba, through cross corporate guarantee of the Company.
19.6 As per the financing arrangements, the Company is required to comply with certain financial covenants and other conditions including dividend restrictions as imposed by the providers of finance.
2019 2018
Note (Rupees in thousand)
20 Trade and other payables
Trade creditors:
Related parties 20.1 697 41
Others 14,493 4,652
15,190 4,693
Other creditors:
Related parties 20.2 6,171 2,972
Others 187,831 38,058
194,002 41,030
Accrued liabilities 257,237 421,965
Contract liability 41,914 -
Advances from customers - 38,390
Advance against sale of land - unsecured - 6,593
Employees deposits - secured 70,408 63,199
Withholding sales tax payable 1,904 1,116
Workers profit participation fund 17.4 13,364 -
Security deposit 20.3 15,000 15,000
Sales tax payable - 26,986
Other payables 15,423 28,949
Payable to employee retirement benefit funds:
- Service fund - 2,044
- Employees Benevolent Fund - 2,065
- Superannuation fund (SF-II) - 4,764
- Employees provident fund 20.4 13 24,967
13 33,840
624,455 681,761
Notes to the financial statementsFor the year ended 30 June 2019
133132 2019 Annual Report
Fin
anci
al s
tate
men
t

20.3 The amount has been received from dealer by virtue of contract and is repayable at the time of termination of dealership or on demand. The amount has been kept in regular business accounts of the Company.
20.4 In respect of contributory retirement funds other than provident fund, the Company is not compliant with the requirement of section 218 of the Companies Act, 2017 and the rules formulated for this purpose.
21 Accrued mark-up
Accrued mark-up / return on:
Participation term certificates 171,889 173,144
Short term borrowings 218,482 104,522
390,371 277,666
22 Long term deposits
These represent interest free deposits received from freight forwarding agencies and other contractors repayable after performance of contracts.
2019 2018
(Rupees in thousand)
20.1 Related parties
Associated Undertakings
Packages Limited 697 -
IGI General Insurance Limited - 41
697 41
These are interest free in the normal course of business.
20.2 Related parties
Associated Undertakings
Packages Limited 5,510 2,696
Subsidiary company
First Treet Manufacturing Modaraba 661 276
6,171 2,972
These are interest free in the normal course of business
Notes to the financial statementsFor the year ended 30 June 2019

2019 2018
(Rupees in thousand)
23 Redeemable capital
Participation term certificates 178,166 357,583
Less: Current portion shown under current liabilities (178,166) (179,417)
- 178,166
In 2013, the Company issued 41,822,250 participation term certificates (PTCs) of Rs. 30 each to existing shareholders in the ratio of 1 PTC for every 1 ordinary share held. The PTCs are listed on Pakistan Stock Exchange. The term of PTCs is 07 years. The proceeds from the issue of PTC were utilised to repay existing bank borrowings of the Company at the date of issue. The Company has no option to prematurely call the PTCs for redemption and/or conversion. The PTC holders have no option to ask the Company to redeem and/or convert PTC’s prematurely. PTC holders shall have no preemptive right in any further issue of capital of the Company.
Terms of redemption
The principal amount of PTCs is reduced through redemption (in cash and through mandatory conversion) each year. The principal redemption through cash is Rs. 0.15 per PTC per annum for the year 2013 to year 2019. PTCs are mandatorily convertible into ordinary shares through share conversion at the rate of 0.07 share per PTC per annum (pre-agreed price of Rs. 59.14 per share) from year 2013 to year 2018 and 0.08 share per PTC (pre-agreed price of Rs. 51.38 per share) in the year 2019. Shares issued through conversion will rank pari passu with existing shares.
Profit payment
The PTC holder is entitled to a minimum profit (Category A profit) at Rs. 4.11 per annum for each PTC, alongwith a contingent profit (Category B profit) based on the consolidated profits before tax, Workers Welfare Fund (WWF), Workers Profit Participation Fund (WPPF) and finance cost relating to PTCs based on pay-off matrix. The pay-off matrix sets out various ranges for contingent profit pay out percentages.
23.1 The following table shows the redemption of PTC:
Principal redemption
in cash
Principal redemption in
shares
Principal value
redemption
Increase in ordinary
sharecapital
Increase in ordinary
share capital
Share premium of conversion
Category “A” profit payment
in cash
Category “B” profit
payment in cash
Year
( ------ Rupees in thousand --------) Shares ( ------ Rupees in thousand --------)
6,272 171,889 178,161 3,345,780 33,458 138,431 171,889 - 2019
6,272 173,145 179,417 2,927,557 29,275 143,869 173,144 - 2018
The Company will issue 3,345,780 ordinary shares of face value of Rs. 10 per share against Rs. 171.89 million.
The Chief Executive Officer and Directors of the Company holds 17,601,611 (2018: 17,601,611) PTCs of the Company. Finance cost paid to them during the year is Rs. 72.34 million (2018: Rs. 72.87 million). Loads Limited, an associated company, holds 1,831,500 (2018: 1,831,500) participation term certificates of the Company.
Notes to the financial statementsFor the year ended 30 June 2019
135134 2019 Annual Report
Fin
anci
al s
tate
men
t

24.1 Net retirement benefit obligation
Gratuity Superannuation
2019 2018 2019 2018
---------(Rupees in thousand)---------
Amounts recognized in balance sheet are as follows:
Present value of defined benefit obligation 415,192 349,276 389,555 330,390
Fair value of plan assets (181,248) (188,507) (141,991) (165,461)
Net retirement benefit obligation 233,944 160,769 247,564 164,929
2019 2018
Note (Rupees in thousand)
24 Deferred Liabilities - Employee retirement benefits
Gratuity fund 233,944 160,769
Superannuation fund 247,564 164,929
24.1 481,508 325,698
Securities
The PTCs are secured by the following:
First exclusive equitable mortgage of Rs. 1,254.67 million over the mortgaged property, i.e. land measuring 11.62 acres situated in Kot Lakhpat Industrial Area Scheme, Lahore (Quaid-e-Azam Industrial Estate) bearing plot no. 72-B together with all buildings, structures, fittings and fixtures permanently fastened to land and erections built or erected or to be built or erected thereon pursuant to Memorandum of Deposit of Title Deeds dated 16 May 2011.
First Exclusive Floating charge of Rs. 1,254.67 million over the present and future movable fixed assets of the Company pursuant to deed of floating charge dated 16 May 2011.
Pledge of Rs. 210.18 million over the liquid assets (i.e. listed securities having value of at least Rs. 210.18 million pledged in favor, or under lien, of the Security Trustee, which may include shares of Packages Limited, IGI Insurance Limited, ZIL Limited, Indus Dyeing Manufacturing Company Limited and/or any other liquid securities) pursuant to the letter of lien and pledge dated 16 May 2011. However, currently shares of Silk Bank Limited and Shahtaj Textile Limited are pledged with the Trustee as referred in note 16.
The above investment in shares/securities will be kept in CDC Account which shall be under pledge of security trustee. However movement in/from the said pledged account will not be restricted by the security trustee provided that aggregate value of Rs. 250 million is maintained. The security trustee shall ensure that the closing balance of shares in the pledged account at anytime shall not fall below the equivalent rupee value of Rs. 250 million.
Notes to the financial statementsFor the year ended 30 June 2019

Gratuity Superannuation
2019 2018 2019 2018
---------(Rupees in thousand)---------
24.2 Movement in net obligation
Net liability as at 01 July 160,769 122,823 164,929 129,116
Charge to profit and loss account
Treet Corporation Limited 42,062 30,232 37,412 27,587
Treet HR Management (Private) Limited 5,110 1,820 2,092 868
47,172 32,052 39,504 28,455
Re-measurements chargeable in other
comprehensive income
Treet Corporation Limited 48,386 39,239 54,492 31,322
Treet HR Management (Private) Limited 2,547 2,065 2,868 1,649
50,933 41,304 57,360 32,971
Contribution made by the Company (24,930) (35,410) (14,229) (25,613)
Net liability as at 30 June 233,944 160,769 247,564 164,929
24.3 Movement in the liability for funded defined benefit obligations
Liability for defined benefit obligations as at 01 July 349,276 311,121 330,390 296,556
Benefits paid by the plan (24,930) (36,928) (14,229) (27,088)
Current service costs 29,546 23,903 23,331 19,443
Past service cost 4,279 - 1,971 -
Interest cost 30,313 22,681 29,095 21,934
Re-measurments on obligation:
Actuarial losses on present value
- Changes in demographic assumptions - - - -
- Changes in financial assumptions 1,656 363 1,500 471
- Experience adjustments 25,052 28,136 17,497 19,074
26,708 28,499 18,997 19,545
Present value of defined benefit obligations as at 30 June 415,192 349,276 389,555 330,390
24.4 Movement in fair value of plan assets
Fair value of plan assets as at 01 July 188,507 188,298 165,461 167,440
Contributions into the plan 24,930 35,410 14,229 25,613
Benefits paid by the plan (24,930) (36,928) (14,229) (27,088)
Interest income on plan assets 16,966 14,534 14,893 12,921
Return on plan assets
excluding interest income (24,225) (12,807) (38,363) (13,425)
Fair value of plan assets as at 30 June 181,248 188,507 141,991 165,461
Notes to the financial statementsFor the year ended 30 June 2019
137136 2019 Annual Report
Fin
anci
al s
tate
men
t
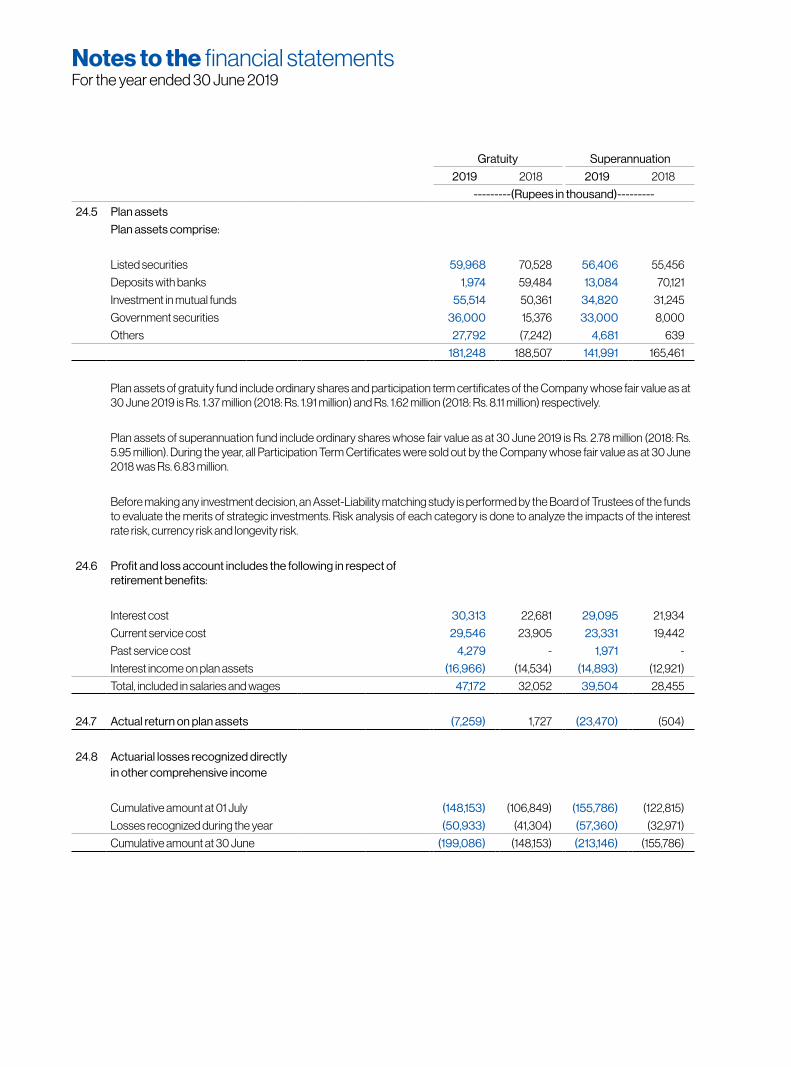
Gratuity Superannuation
2019 2018 2019 2018
---------(Rupees in thousand)---------
24.5 Plan assets
Plan assets comprise:
Listed securities 59,968 70,528 56,406 55,456
Deposits with banks 1,974 59,484 13,084 70,121
Investment in mutual funds 55,514 50,361 34,820 31,245
Government securities 36,000 15,376 33,000 8,000
Others 27,792 (7,242) 4,681 639
181,248 188,507 141,991 165,461
Plan assets of gratuity fund include ordinary shares and participation term certificates of the Company whose fair value as at 30 June 2019 is Rs. 1.37 million (2018: Rs. 1.91 million) and Rs. 1.62 million (2018: Rs. 8.11 million) respectively.
Plan assets of superannuation fund include ordinary shares whose fair value as at 30 June 2019 is Rs. 2.78 million (2018: Rs. 5.95 million). During the year, all Participation Term Certificates were sold out by the Company whose fair value as at 30 June 2018 was Rs. 6.83 million.
Before making any investment decision, an Asset-Liability matching study is performed by the Board of Trustees of the funds to evaluate the merits of strategic investments. Risk analysis of each category is done to analyze the impacts of the interest rate risk, currency risk and longevity risk.
24.6 Profit and loss account includes the following in respect of retirement benefits:
Interest cost 30,313 22,681 29,095 21,934
Current service cost 29,546 23,905 23,331 19,442
Past service cost 4,279 - 1,971 -
Interest income on plan assets (16,966) (14,534) (14,893) (12,921)
Total, included in salaries and wages 47,172 32,052 39,504 28,455
24.7 Actual return on plan assets (7,259) 1,727 (23,470) (504)
24.8 Actuarial losses recognized directlyin other comprehensive income
Cumulative amount at 01 July (148,153) (106,849) (155,786) (122,815)
Losses recognized during the year (50,933) (41,304) (57,360) (32,971)
Cumulative amount at 30 June (199,086) (148,153) (213,146) (155,786)
Notes to the financial statementsFor the year ended 30 June 2019
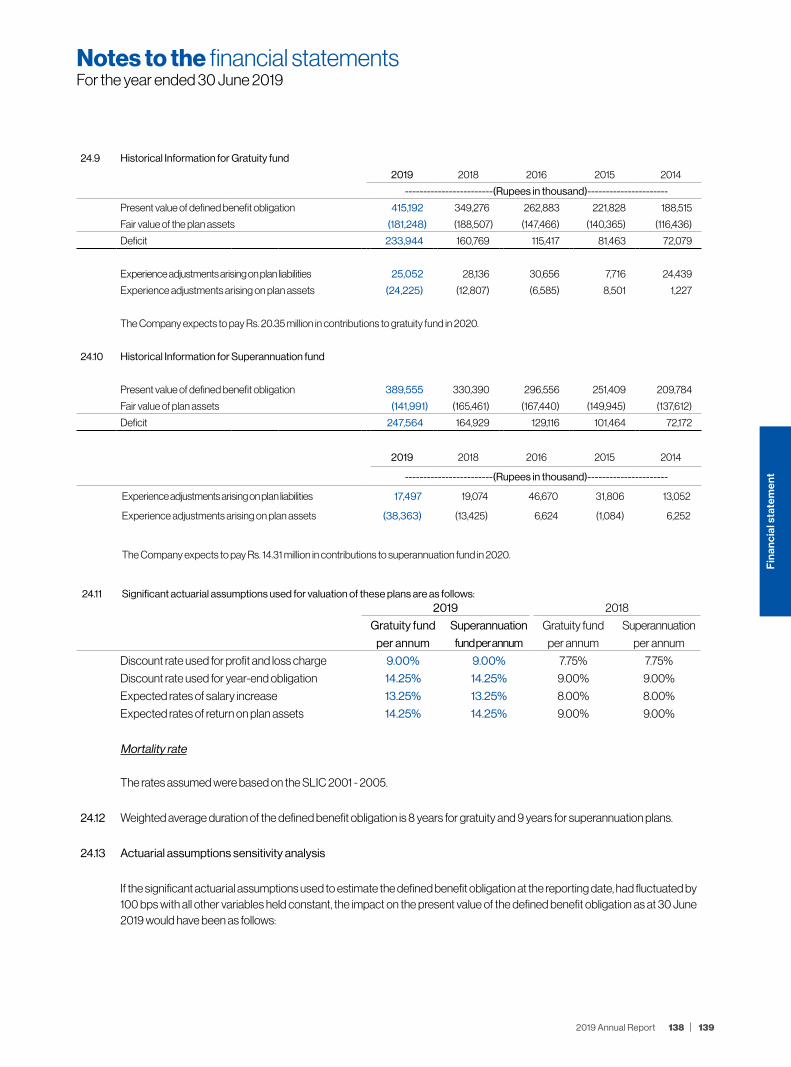
24.9 Historical Information for Gratuity fund
2019 2018 2016 2015 2014
------------------------(Rupees in thousand)----------------------
Present value of defined benefit obligation 415,192 349,276 262,883 221,828 188,515
Fair value of the plan assets (181,248) (188,507) (147,466) (140,365) (116,436)
Deficit 233,944 160,769 115,417 81,463 72,079
Experience adjustments arising on plan liabilities 25,052 28,136 30,656 7,716 24,439
Experience adjustments arising on plan assets (24,225) (12,807) (6,585) 8,501 1,227
The Company expects to pay Rs. 20.35 million in contributions to gratuity fund in 2020.
24.10 Historical Information for Superannuation fund
Present value of defined benefit obligation 389,555 330,390 296,556 251,409 209,784
Fair value of plan assets (141,991) (165,461) (167,440) (149,945) (137,612)
Deficit 247,564 164,929 129,116 101,464 72,172
2019 2018 2016 2015 2014
------------------------(Rupees in thousand)----------------------
Experience adjustments arising on plan liabilities 17,497 19,074 46,670 31,806 13,052
Experience adjustments arising on plan assets (38,363) (13,425) 6,624 (1,084) 6,252
The Company expects to pay Rs. 14.31 million in contributions to superannuation fund in 2020.
24.11 Significant actuarial assumptions used for valuation of these plans are as follows:2019 2018
Gratuity fund Superannuation Gratuity fund Superannuation
per annum fund per annum per annum per annum
Discount rate used for profit and loss charge 9.00% 9.00% 7.75% 7.75%
Discount rate used for year-end obligation 14.25% 14.25% 9.00% 9.00%
Expected rates of salary increase 13.25% 13.25% 8.00% 8.00%
Expected rates of return on plan assets 14.25% 14.25% 9.00% 9.00%
Mortality rate
The rates assumed were based on the SLIC 2001 - 2005.
24.12 Weighted average duration of the defined benefit obligation is 8 years for gratuity and 9 years for superannuation plans.
24.13 Actuarial assumptions sensitivity analysis
If the significant actuarial assumptions used to estimate the defined benefit obligation at the reporting date, had fluctuated by 100 bps with all other variables held constant, the impact on the present value of the defined benefit obligation as at 30 June 2019 would have been as follows:
Notes to the financial statementsFor the year ended 30 June 2019
139138 2019 Annual Report
Fin
anci
al s
tate
men
t

Impact on present value of defined benefit obligation as at 30 June 2019
Gratuity Superannuation
Change Increase Decrease Increase Decrease
---------(Rupees in thousand)---------
Discount rate 100 bps (383,252) 451,901 (358,178) 425,715
Future salary increase 100 bps 451,901 (382,722) 425,715 (357,658)
The sensitivity analysis of the defined benefit obligation to the significant actuarial assumptions has been performed using the same calculation techniques as applied for calculation of defined benefit obligation reported in the balance sheet.
25 Employee Stock Option Scheme
The Company has granted share options to its employees under the Treet Corporation Limited - Employee Stock Options Scheme, 2015 (“the scheme”) as approved by the shareholders in their annual general meeting held on 31 October 2014 and the Securities and Exchange Commission of Pakistan (SECP) vide its letter No. SMD/CIW/ESOS/02/2014 dated 19 February 2015.
Under the Scheme, the Company may grant options to eligible employees selected by the Board Compensation Committee, from time to time, which shall not at any time exceed 15% of the paid up capital of the Company (as increased from time to time). The option entitles an employee to purchase shares at an exercise prices determined in accordance with the mechanism defined in the scheme at the date of grant. The aggregate number of shares for all options to be granted under the scheme to any single eligible employee shall not, at any time, exceed 3% of the paid up capital of the Company (as increased from time to time). Further the grant of options in anyone calendar year exceeding 3% of the paid up capital shall require approval of the shareholders. The options carry neither right to dividends nor voting rights till shares are issued to employees on exercise of options.
The options will have a vesting period of one year and an exercise period of one year from the date options are vested as laid down in the scheme. These options shall be exercisable after completion of vesting period i.e. one year from date of grant. Upon vesting, employees are eligible to apply and secure allotment of Company’s shares at an exercise price determined on the date of grant of options. Option price shall be payable by the employee on the exercise of options in full or part. The options will lapse after completion of two years of grant date if not exercised.
The details of the share options granted under the scheme together with the status as at 30 June 2019 is as follows:
Notes to the financial statementsFor the year ended 30 June 2019

*Initially the shareholders of the Company in their Annual General Meeting held on 31 October 2016 approved re-pricing of 1,604,800 options already granted and pending for exercise under the scheme from initial price of Rs. 90.58 per share to revised price of Rs. 51.79 per share without any change or modification to any other terms.
Further, during the current period, the shareholders of the Company in their Annual General Meeting held on 26 October 2018 approved re-pricing of 4,259,400 options already granted and pending for exercise under the scheme from initial price of Rs. 66.45 per share to revised price of Rs. 20 per share without any change or modification in the vesting period / schedule, exercise period or any other specific terms and conditions under which such options have been granted.
Subsequent to the year end, the Company has granted 4.96 million stock options to its eligible employees at an exercise price of Rs 15.71 per share under “Treet Corporation Limited - Employee Stock Option Scheme, 2015” in respect of year 2018-2019. These options will have a vesting period of one year from grant date and an exercise period of one year from the date the options are vested. These options shall be exercisable after completion of vesting period i.e one year from date of grant.
26 Contingencies and commitments
26.1 Contingencies
- A tax demand amounting to Rs. 14.80 million had been created by Additional Commissioner Inland Revenue under section 12(9A) of the repealed Income Tax Ordinance, 1979 for assessment year 2000-2001. The tax demand was adjusted against income tax refunds of the Company for the tax year 2006. The Company has filed an appeal before Appellate Tribunal Inland Revenue.
Granted in year 2018
Granted in the year 2017
Granted in year 2016
Granted in the year 2015
(*Modified October 2018)
(*Modified October
2016)
(Rupees in thousand)
Original grant date 30-Jul-18 14 July 2017 16 July 2016 14 July 2015
Modified grant date N/A 26-Oct-18 N/A 31 October 2016
Options issued 4,769 4,259 4,114 1,605
Options no longer in issue N/A N/A - -
Options vested N/A 4,259 4,114 1,605
Options exercised N/A 2,439 533 1,605
Shares issued under the scheme N/A 2,439 533 1,605
Original exercise price per share 35.44 66.45 51.79 90.58
Market value per share at grant date 35.60 51.53 51.63 77.09
Option discount per share at grant date N/A NIL NIL NIL
Modified exercise price per share N/A 20 N/A 51.79
Market value per share at modified grant date N/A 25.36 N/A 47.08
Option discount per share at modified grant date N/A 5.36 N/A NIL
Options issued to key management personnel 2,416 2,003 3,224 1,367
Options exercised by key management personnel N/A 1,334 426 1,367
Notes to the financial statementsFor the year ended 30 June 2019
141140 2019 Annual Report
Fin
anci
al s
tate
men
t

- A tax demand amounting to Rs. 16.05 million had been raised by the tax department against the Company on the issue of proration of profits between local and export sales for the tax year 2003 and 2006. In 2010, Appellate Tribunal Inland Revenue dismissed the Company’s appeal, however, the Company filed an application under section 21 of General Clauses Act, 1997 to rescind or amend the order. Further, without conceding the legitimate position of this issue as stated above, a rectification application on account of incorrect computation has also been filed resulting in rectification amounting to Rs. 10.29 million. The Company is expecting a favorable outcome as this issue was decided in the favor of the Company in past.
- For the assessment year 1999 to 2000, the taxation officer charged additional tax amounting to Rs. 3.27 million on the grounds that the Company failed to deposit the due tax as per the return filed. The Company, on the grounds that the amount due has already been deposited, filed a rectification application against levy of additional tax on the basis that the mistake is apparent from the record.
- For the tax year 2004, the Additional Commissioner Inland Revenue passed an order under section 122(5A) of the Income Tax Ordinance, 2001 on the issue of proration of profits between local and export sales and created a tax demand of Rs. 6.56 million which was subsequently reduced to Rs. 2.62 million vide order dated 30 June 2015. The Company filed an appeal before Commissioner Inland Revenue (CIR) (Appeals) who decided the matter against the Company. Against the order of CIR (appeals), the Company filed an appeal before Appellate Tribunal Inland Revenue which is pending adjudication.
- For the tax year 2011, the Deputy Commissioner Inland Revenue passed an order under section 161/205 of the Income Tax Ordinance, 2001 and created a tax demand of Rs. 0.58 million. The Company filed an appeal before Commissioner Inland Revenue (Appeals) and obtained a relief of Rs. 0.21 million thereby reducing the overall demand to Rs. 0.37 million. The Company then filed a second appeal before the Appellate Tribunal Inland Revenue which is pending adjudication.
- For the tax year 2014, the Deputy Commissioner Inland Revenue passed an order under section 121(1)/122(5) after conducting a tax audit under section 177 of the of the Income Tax Ordinance, 2001. The additions made through the above order resulted in reduction of the brought forward losses of the respective tax year. The Company filed an appeal before Commissioner Inland Revenue (Appeals) which is pending adjudication.
- For the tax year 2016, the Assistant Commissioner Inland Revenue passed an order under section 161/205 of the Income Tax Ordinance, 2001 and created a tax demand of Rs. 3.12 million. The Company filed an ap-peal before Commissioner Inland Revenue (Appeals) which is pending adjudication.
A sales tax demand amounting to Rs. 1.56 million has been created by Deputy Commissioner Inland Reve-nue for alleged default of compliance of section 8(1)(CA) of the Sales Tax Act, 1990. The Company filed an appeal with Commissioner Appeals against this order and obtained relief of Rs. 0.42 million. The Company filed an appeal before Appellate Tribunal Inland Revenue and expects a favorable outcome on the grounds that Honorable Lahore High Court has declared the provision of section 8(1)(CA) ultra-vires.
In the year 2015, the Company was selected for sales tax audit in respect of tax period July 2013 to June 2014 under section 72B of the Sales Tax Act, 1990. After the conclusion of audit proceedings, a sales tax demand of Rs. 8.65 million including penalty was created by Deputy Commissioner Inland Revenue mainly on account of admissibility of input sales tax under SRO 490(I)/2004. The Company filed an appeal with Commissioner Inland Revenue (Appeals) against this order which is pending adjudication.
Notes to the financial statementsFor the year ended 30 June 2019

27.1 Reconciliation of number of shares
At 01 July 1,600,846 1,421,436
Issued on conversion of PTCs 27.4 29,275 29,275
Issued against bonus shares - 142,870
Issued against employee share option scheme 27.5 24,387 7,265
At 30 June 1,654,508 1,600,846
27.2 Syed Shahid Ali (Chief Executive Officer) holds 54,596,569 (2018: 45,385,542) and Syed Sheharyar Ali (Executive Director) holds 12,227,915 (2018: 12,026,428) ordinary shares of Rs. 10 each representing 33% (2018: 28.35%) and 7.39% (2018: 7.51%) of the paid up capital of the Company respectively.
27.3 Loads Limited, an associated company, holds 8,741,438 (2018: 8,613,233) ordinary shares of Rs. 10 each representing 5.28% (2018: 5.38%) of the paid up capital of the Company.
27 Issued, subscribed and paid-up capital
2019 2018 2019 2018
(Number of shares) Note (Rupees in thousand)
Ordinary shares of Rs. 10 each
89,793,463 89,793,463 fully paid-up in cash 897,935 897,935
Ordinary shares of Rs. 10 each issued
18,660,385 15,732,828 on conversion of PTCs 186,602 157,327
Ordinary shares of Rs. 10 each fully
52,420,143 52,420,143 issued as bonus shares 524,201 524,201
Ordinary shares of Rs. 10 each issued
4,576,951 2,138,251 against employee share option scheme 45,770 21,383
165,450,942 160,084,685 1,654,508 1,600,846
For the tax period July 2013 to June 2018 a sales tax demand of Rs. 138.044 million along with default sur-charge and penalty was created by ACIR, E & C Unit-03, Zone-1, LTU, Lahore on the contention that the Company has claiming inadmissible input sales tax adjustment on the strength of bogus invoices issued by the suspended units in voilation of section 8 of the Sales Tax Act, 1990 as well as insurance services on stock in trade and plant and machinary and illegally adjusted input sales tax of irrelevant sectors in contravention of the said section. The Company filed an appeal with Commissioner Inland Revenue (Appeals) against this order which is pending adjudication.
Based on the opinion of the Company’s legal counsel, management is expecting a favorable outcome of the above cases. Therefore no provision has been recognized in these unconsolidated financial statements.
26.2 Commitments
- Outstanding letters of credit as at 30 June 2019 amounted to Rs. 244.19 million (2018: Rs. 730.34 million).
Notes to the financial statementsFor the year ended 30 June 2019
143142 2019 Annual Report
Fin
anci
al s
tate
men
t
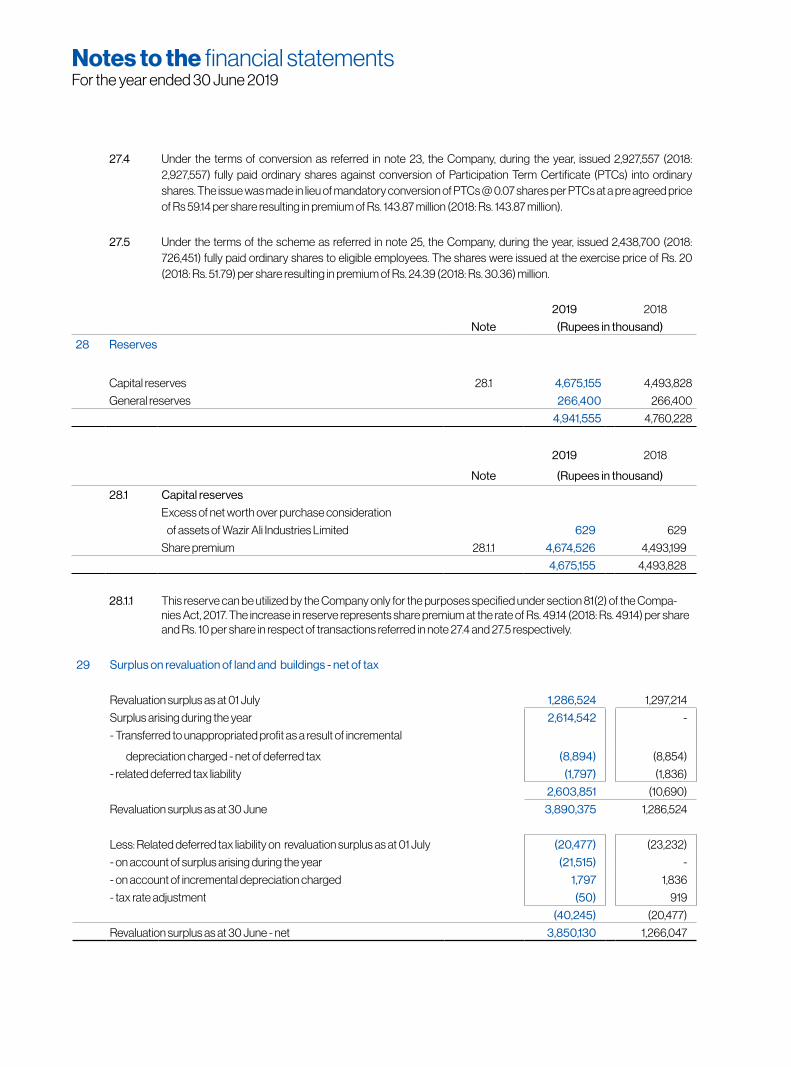
27.4 Under the terms of conversion as referred in note 23, the Company, during the year, issued 2,927,557 (2018: 2,927,557) fully paid ordinary shares against conversion of Participation Term Certificate (PTCs) into ordinary shares. The issue was made in lieu of mandatory conversion of PTCs @ 0.07 shares per PTCs at a pre agreed price of Rs 59.14 per share resulting in premium of Rs. 143.87 million (2018: Rs. 143.87 million).
27.5 Under the terms of the scheme as referred in note 25, the Company, during the year, issued 2,438,700 (2018: 726,451) fully paid ordinary shares to eligible employees. The shares were issued at the exercise price of Rs. 20 (2018: Rs. 51.79) per share resulting in premium of Rs. 24.39 (2018: Rs. 30.36) million.
2019 2018
Note (Rupees in thousand)
28 Reserves
Capital reserves 28.1 4,675,155 4,493,828
General reserves 266,400 266,400
4,941,555 4,760,228
2019 2018
Note (Rupees in thousand)
28.1 Capital reserves
Excess of net worth over purchase consideration
of assets of Wazir Ali Industries Limited 629 629
Share premium 28.1.1 4,674,526 4,493,199
4,675,155 4,493,828
28.1.1 This reserve can be utilized by the Company only for the purposes specified under section 81(2) of the Compa-nies Act, 2017. The increase in reserve represents share premium at the rate of Rs. 49.14 (2018: Rs. 49.14) per share and Rs. 10 per share in respect of transactions referred in note 27.4 and 27.5 respectively.
29 Surplus on revaluation of land and buildings - net of tax
Revaluation surplus as at 01 July 1,286,524 1,297,214
Surplus arising during the year 2,614,542 -
- Transferred to unappropriated profit as a result of incremental
depreciation charged - net of deferred tax (8,894) (8,854)
- related deferred tax liability (1,797) (1,836)
2,603,851 (10,690)
Revaluation surplus as at 30 June 3,890,375 1,286,524
Less: Related deferred tax liability on revaluation surplus as at 01 July (20,477) (23,232)
- on account of surplus arising during the year (21,515) -
- on account of incremental depreciation charged 1,797 1,836
- tax rate adjustment (50) 919
(40,245) (20,477)
Revaluation surplus as at 30 June - net 3,850,130 1,266,047
Notes to the financial statementsFor the year ended 30 June 2019
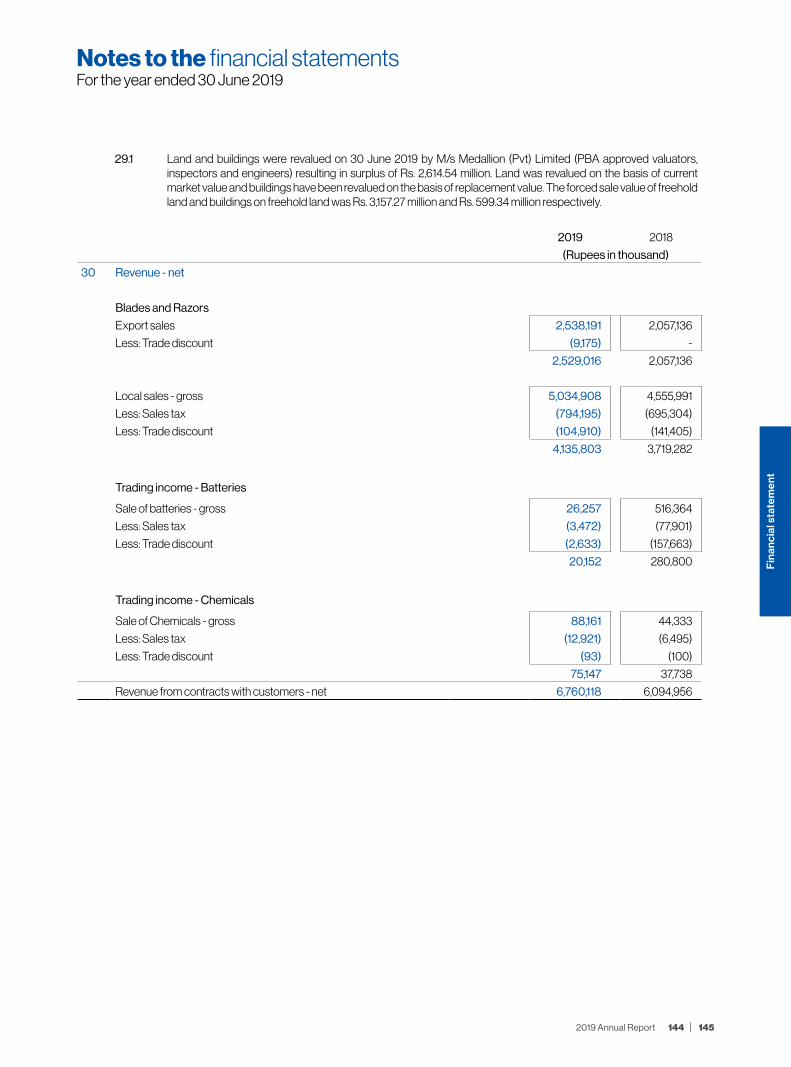
2019 2018
(Rupees in thousand)
30 Revenue - net
Blades and Razors
Export sales 2,538,191 2,057,136
Less: Trade discount (9,175) -
2,529,016 2,057,136
Local sales - gross 5,034,908 4,555,991
Less: Sales tax (794,195) (695,304)
Less: Trade discount (104,910) (141,405)
4,135,803 3,719,282
Trading income - Batteries
Sale of batteries - gross 26,257 516,364
Less: Sales tax (3,472) (77,901)
Less: Trade discount (2,633) (157,663)
20,152 280,800
Trading income - Chemicals
Sale of Chemicals - gross 88,161 44,333
Less: Sales tax (12,921) (6,495)
Less: Trade discount (93) (100)
75,147 37,738
Revenue from contracts with customers - net 6,760,118 6,094,956
29.1 Land and buildings were revalued on 30 June 2019 by M/s Medallion (Pvt) Limited (PBA approved valuators, inspectors and engineers) resulting in surplus of Rs. 2,614.54 million. Land was revalued on the basis of current market value and buildings have been revalued on the basis of replacement value. The forced sale value of freehold land and buildings on freehold land was Rs. 3,157.27 million and Rs. 599.34 million respectively.
Notes to the financial statementsFor the year ended 30 June 2019
145144 2019 Annual Report
Fin
anci
al s
tate
men
t

30
.1D
isag
greg
atio
n of
Rev
enue
In th
e fo
llow
ing
tabl
e, re
venu
e fro
m c
ontr
acts
with
cus
tom
ers
is d
isag
greg
ated
by
prim
ary
geog
rahi
cal m
arke
ts, m
ajor
pro
duct
s an
d se
rvic
e lin
e an
d tim
ing
of re
venu
e re
cogn
ition
.
Bla
des
& R
azor
sB
atte
ries
Che
mic
als
Tota
l
2019
2018
2019
2018
2019
2018
2019
2018
----
----
----
----
----
----
----
----
----
----
----
----
----
----
-Rup
ees
in th
ousa
nds-
----
----
----
----
----
----
----
----
----
----
----
----
----
----
-
Prim
ary
Geo
grap
hica
l Mar
kets
Asi
a 6
,50
2,23
6
5,6
25,8
64
20
,152
280
,80
0
75,
147
37,
738
6,5
97,
535
5,9
44,4
02
Eur
ope
126
,08
6
71,4
83
- -
- -
126
,08
6
71,4
83
US
3
6,4
97
79,
071
- -
- -
36
,49
7 7
9,07
1
6,6
64
,819
5
,776
,418
2
0,15
2 2
80,8
00
7
5,14
7 3
7,73
8 6
,76
0,11
8
6,0
94,9
56
Maj
or P
rodu
cts/
Ser
vice
Lin
es
Bla
des
and
razo
rs 6
,66
4,8
19
5,7
76,4
18
- -
- -
6,6
64
,819
5
,776
,418
Bat
trie
s -
- 2
0,15
2 2
80,8
00
-
- 2
0,15
2 2
80,8
00
Che
mic
als
- -
- -
75,
147
37,
738
75,
147
37,
738
6,6
64
,819
5
,776
,418
2
0,15
2 2
80,8
00
7
5,14
7 3
7,73
8 6
,76
0,11
8
6,0
94,9
56
Tim
ing
of re
venu
e re
cogn
ition
Pro
duct
s tra
nsfe
rred
at a
poi
nt in
tim
e 6
,66
4,8
19
5,7
76,4
18
20
,152
280
,80
0
75,
147
37,
738
6,7
60
,118
6
,094
,956
Notes to the financial statementsFor the year ended 30 June 2019

2019 2018Note (Rupees in thousand)
31 Cost of goods sold Raw and packing materials consumed 2,381,192 1,982,544 Stores and spares consumed 164,714 208,298 Salaries, wages and other benefits 31.1 1,046,236 1,179,526 Fuel and power 268,893 243,633 Freight, octroi and handling 214,297 178,117 Repairs and maintenance 22,632 29,683 Rent, rates and taxes 5,149 5,400 Insurance 76,210 79,270 Travelling and conveyance 24,453 18,785 Printing and stationery 22,340 17,956 Postage and telephone 8,005 7,373 Legal and professional charges 926 332 Entertainment 751 1,896 Staff training 949 631 Subscriptions 1,833 787 Depreciation on property, plant and equipment 6.1.2 185,930 156,432 Other expenses 35,505 34,261
4,460,015 4,144,924 Opening stock of work in process 65,068 61,311 Closing stock of work in process 14 (51,552) (65,068)Cost of goods manufactured 4,473,531 4,141,167
Opening stock of finished goods 148,377 234,914 Finished goods purchased for resale - batteries and chemicals 100,233 447,106 Closing stock of finished goods 14 (179,675) (148,377)
4,542,466 4,674,810
31.1 Salaries, wages and other benefits include Rs. 61.95 million (2018: Rs. 45.42 million) and Rs. 48.43 million (2018: Rs. 47.9 million) in respect of defined benefit schemes and defined contribution schemes respectively.
32 Administrative expenses
Salaries, wages and other benefits 32.1 260,557 205,206 Repairs and maintenance 2,466 2,415 Rent, rates and taxes 395 887 Travelling and conveyance 11,148 8,861 Entertainment 1,694 955 Postage and telephone 1,393 1,548 Printing and stationery 2,205 2,050 Legal and professional charges 32.2 29,313 20,734 Donations 32.3 & 32.4 211,427 115,538 Computer expenses 6,829 5,967 Directors' fee 41 570 409 Subscription 403 599 Depreciation on property, plant and equipment 6.1.2 33,126 27,109 Amortization on intangible asset 8.1 8,376 8,376 Others 11,245 3,446
581,147 404,100
Notes to the financial statementsFor the year ended 30 June 2019
147146 2019 Annual Report
Fin
anci
al s
tate
men
t

32.1 Salaries and other benefits include Rs. 9.06 million (2018: Rs. 6.26 million) and Rs. 13.32 million (2018: Rs. 8.34 million) in respect of defined benefit schemes and defined contribution schemes respectively.
2019 2018
Note (Rupees in thousand)
32.2 Legal and professional charges include the following in respect of auditors’ remuneration:
Statutory audit 2,211 1,711
Half yearly review 420 420
Certification charges 184 184
Out of pocket expenses 150 150
2,965 2,465
32.3 Donations include the payment to following institution in which the director is interested:
Gulab Devi Chest Hospital (GDCH) 779 4,822
Ferozepur Road, Lahore.
(Syed Shahid Ali, CEO is also Chairman of GDCH)
Society for Cultural Education 32.3.1 207,377 108,723
208,156 113,545
32.3.1 Society for Cultural Education (SCE) is a Society registered under the Societies Registration Act, XXI of 1860. SCE although does not have any share capital, the Company is entitled to nominate 70% of the members as well as governing body of SCE. The amount is given as donation to meet the working capital requirements of SCE for ongoing University project as is approved by the shareholders of the Company in their Annual General Meeting held on 26 October 2018.
32.4 Donations to following organizations exceeds Rs. 0.5 million:
Cancer Care Hospital and Research Centre 2,500 1,000
Information Technology University - 500
2,500 1,500
Notes to the financial statementsFor the year ended 30 June 2019

2019 2018
Note (Rupees in thousand)
33 Distribution cost
Salaries, wages and other benefits 33.1 300,787 314,183
Repairs and maintenance 33.2 21,115 57,858
Advertising 469,326 442,796
Service charges 4,452 5,097
Rent, rates and taxes 14,879 19,730
Travelling and conveyance 40,109 36,444
Postage and telephone 5,645 5,659
Depreciation on property, plant and equipment 6.1.2 16,980 15,188
Printing and stationery 672 973
Legal and professional charges 362 396
Write off 10 -
Others expenses 33.3 15,221 16,397
889,558 914,721
33.1 Salaries and other benefits include Rs. 7.94 million (2018: Rs. 6.12 million) and Rs. 15.59 million (2018: Rs. 12.77 million) in respect of defined benefit schemes and defined contribution schemes respectively.
33.2 This includes Rs. 18.70 million (2018: Rs. 55.07 million) on account of claims against batteries sold.
33.3 It includes Rs. 6.88 million (2018: Rs. 8.88 million) on account of expenses related to battery operations.
34 Finance cost
Markup on short term borrowings 777,684 384,999
Markup on participation term certificates 171,889 173,144
Bank charges 23,625 19,360
973,198 577,503
35 Other operating expenses
Exchange loss 20,744 3,400
Unrealized loss on short term investments at fair value
through profit or loss 40,397 37,250
Unrealized exchange loss 417 -
Workers’ profit participation fund 17.4 21,157 720
82,715 41,370
Notes to the financial statementsFor the year ended 30 June 2019
149148 2019 Annual Report
Fin
anci
al s
tate
men
t
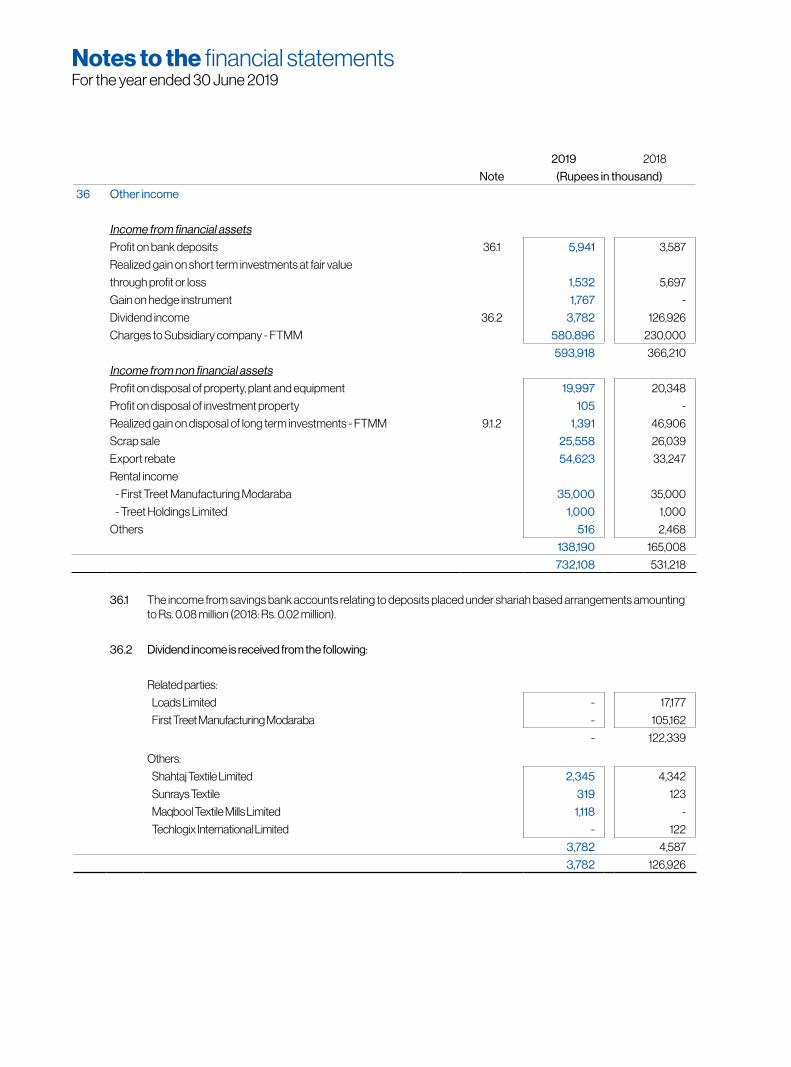
2019 2018
Note (Rupees in thousand)
36 Other income
Income from financial assets
Profit on bank deposits 36.1 5,941 3,587
Realized gain on short term investments at fair value
through profit or loss 1,532 5,697
Gain on hedge instrument 1,767 -
Dividend income 36.2 3,782 126,926
Charges to Subsidiary company - FTMM 580,896 230,000
593,918 366,210
Income from non financial assets
Profit on disposal of property, plant and equipment 19,997 20,348
Profit on disposal of investment property 105 -
Realized gain on disposal of long term investments - FTMM 9.1.2 1,391 46,906
Scrap sale 25,558 26,039
Export rebate 54,623 33,247
Rental income
- First Treet Manufacturing Modaraba 35,000 35,000
- Treet Holdings Limited 1,000 1,000
Others 516 2,468
138,190 165,008
732,108 531,218
36.1 The income from savings bank accounts relating to deposits placed under shariah based arrangements amounting to Rs. 0.08 million (2018: Rs. 0.02 million).
36.2 Dividend income is received from the following:
Related parties:
Loads Limited - 17,177
First Treet Manufacturing Modaraba - 105,162
- 122,339
Others:
Shahtaj Textile Limited 2,345 4,342
Sunrays Textile 319 123
Maqbool Textile Mills Limited 1,118 -
Techlogix International Limited - 122
3,782 4,587
3,782 126,926
Notes to the financial statementsFor the year ended 30 June 2019
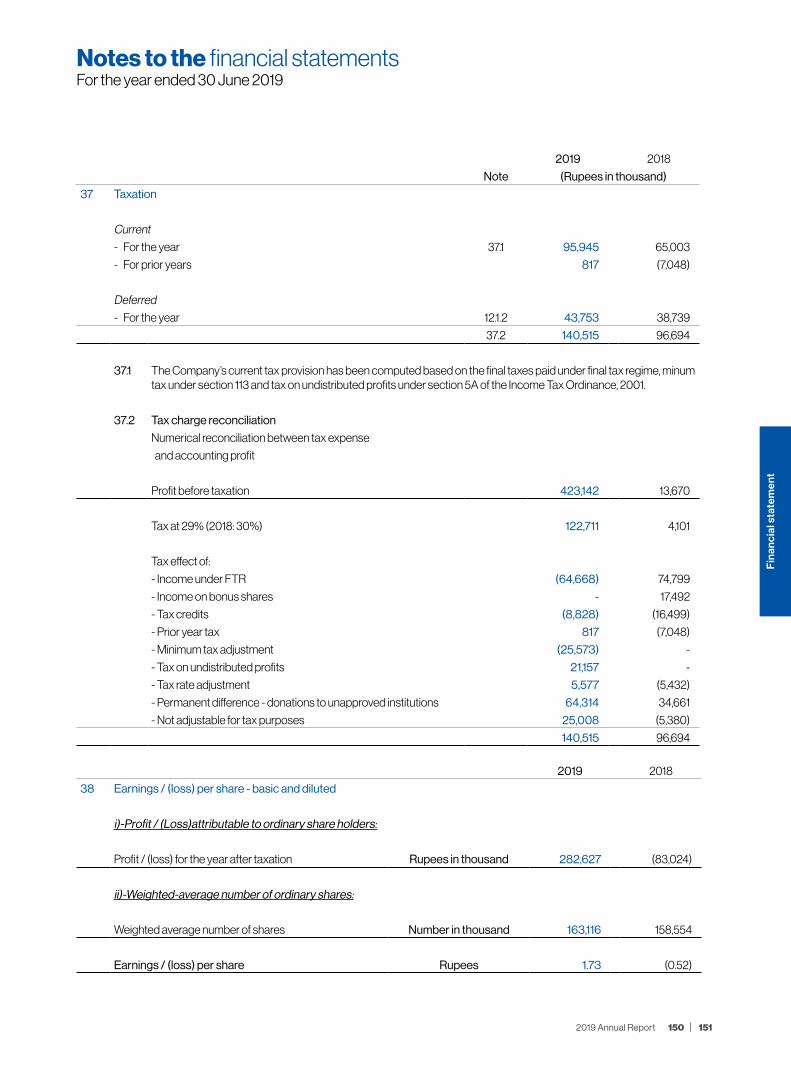
2019 2018
Note (Rupees in thousand)
37 Taxation
Current
- For the year 37.1 95,945 65,003
- For prior years 817 (7,048)
Deferred
- For the year 12.1.2 43,753 38,739
37.2 140,515 96,694
37.1 The Company’s current tax provision has been computed based on the final taxes paid under final tax regime, minum tax under section 113 and tax on undistributed profits under section 5A of the Income Tax Ordinance, 2001.
37.2 Tax charge reconciliation
Numerical reconciliation between tax expense
and accounting profit
Profit before taxation 423,142 13,670
Tax at 29% (2018: 30%) 122,711 4,101
Tax effect of:
- Income under FTR (64,668) 74,799
- Income on bonus shares - 17,492
- Tax credits (8,828) (16,499)
- Prior year tax 817 (7,048)
- Minimum tax adjustment (25,573) -
- Tax on undistributed profits 21,157 -
- Tax rate adjustment 5,577 (5,432)
- Permanent difference - donations to unapproved institutions 64,314 34,661
- Not adjustable for tax purposes 25,008 (5,380)
140,515 96,694
2019 2018
38 Earnings / (loss) per share - basic and diluted
i)-Profit / (Loss)attributable to ordinary share holders:
Profit / (loss) for the year after taxation Rupees in thousand 282,627 (83,024)
ii)-Weighted-average number of ordinary shares:
Weighted average number of shares Number in thousand 163,116 158,554
Earnings / (loss) per share Rupees 1.73 (0.52)
Notes to the financial statementsFor the year ended 30 June 2019
151150 2019 Annual Report
Fin
anci
al s
tate
men
t
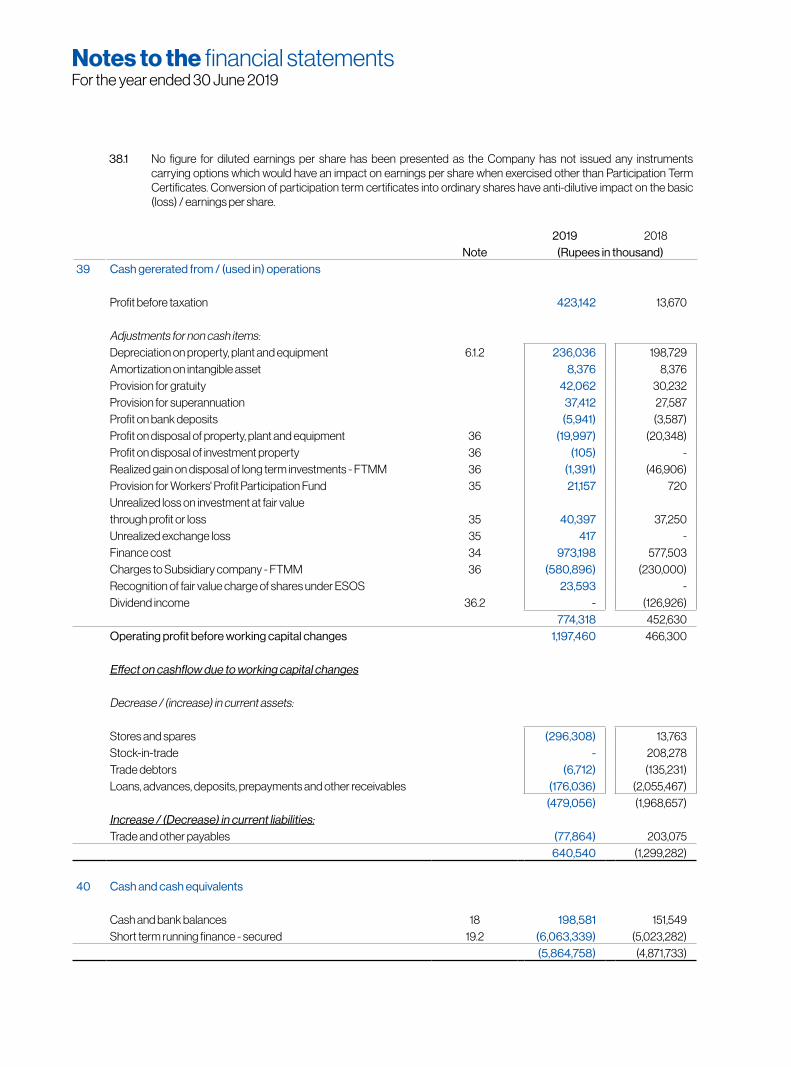
2019 2018Note (Rupees in thousand)
39 Cash gererated from / (used in) operations
Profit before taxation 423,142 13,670
Adjustments for non cash items:Depreciation on property, plant and equipment 6.1.2 236,036 198,729 Amortization on intangible asset 8,376 8,376 Provision for gratuity 42,062 30,232 Provision for superannuation 37,412 27,587 Profit on bank deposits (5,941) (3,587)Profit on disposal of property, plant and equipment 36 (19,997) (20,348)Profit on disposal of investment property 36 (105) - Realized gain on disposal of long term investments - FTMM 36 (1,391) (46,906)Provision for Workers' Profit Participation Fund 35 21,157 720 Unrealized loss on investment at fair value through profit or loss 35 40,397 37,250 Unrealized exchange loss 35 417 - Finance cost 34 973,198 577,503 Charges to Subsidiary company - FTMM 36 (580,896) (230,000)Recognition of fair value charge of shares under ESOS 23,593 - Dividend income 36.2 - (126,926)
774,318 452,630 Operating profit before working capital changes 1,197,460 466,300
Effect on cashflow due to working capital changes
Decrease / (increase) in current assets:
Stores and spares (296,308) 13,763 Stock-in-trade - 208,278 Trade debtors (6,712) (135,231)Loans, advances, deposits, prepayments and other receivables (176,036) (2,055,467)
(479,056) (1,968,657)Increase / (Decrease) in current liabilities:Trade and other payables (77,864) 203,075
640,540 (1,299,282)
40 Cash and cash equivalents
Cash and bank balances 18 198,581 151,549 Short term running finance - secured 19.2 (6,063,339) (5,023,282)
(5,864,758) (4,871,733)
38.1 No figure for diluted earnings per share has been presented as the Company has not issued any instruments carrying options which would have an impact on earnings per share when exercised other than Participation Term Certificates. Conversion of participation term certificates into ordinary shares have anti-dilutive impact on the basic (loss) / earnings per share.
Notes to the financial statementsFor the year ended 30 June 2019

41R
emun
erat
ion
of c
hief
exe
cutiv
e, d
irect
ors
and
exec
utiv
es
The
agg
rega
te a
mou
nt c
harg
ed in
the
unco
nsol
idat
ed fi
nanc
ial s
tate
men
ts fo
r the
yea
r for
rem
uner
atio
n, in
clud
ing
cert
ain
bene
fits
to th
e ch
ief e
xecu
tive,
exe
cutiv
e di
rect
ors,
non
-exe
cutiv
e di
rect
ors
and
exec
utiv
es o
f the
Com
pany
is a
s fo
llow
s:
Chi
ef E
xecu
tive
Exe
cutiv
e D
irect
ors
Non
- Exe
cutiv
e D
irect
ors
Exe
cutiv
es
2019
2018
2019
2018
2019
2018
2019
2018
----
----
----
----
----
----
----
----
----
----
-(R
upee
s in
thou
sand
)---
----
----
----
----
----
----
----
----
Man
ager
ial r
emun
erat
ion
36
,073
3
4,90
9 2
2,78
5 19
,911
-
- 18
1,09
2 14
6,27
6
Pro
vide
nt fu
nd -
- 1,
519
1,
308
- -
8,4
39
6
,663
Ser
vice
fund
- -
1,51
9
1,30
8 -
- 8
,43
9
6,6
63
Hou
sing
fund
- -
- -
- -
12,4
71
9,13
0
Sup
eran
nuat
ion
fund
- II
- -
- -
- -
4,0
20
3,0
26
Ben
evol
ent f
und
- -
- -
- -
3,5
48
2
,80
5
Bon
us -
- 16
,226
13
,80
9 -
- 9
2,15
3
71,7
94
Util
ities
- -
1,51
9
1,30
8 -
- 9
,183
7
,256
Med
ical
3,6
07
3,4
91
1,51
9
1,30
8 -
- 9
,49
0
7,5
35
Fees
- -
- -
570
4
09
- -
39
,68
0
38,
400
4
5,0
87
38,
952
570
4
09
328
,83
5 2
61,14
8
Num
ber o
f per
sons
1 1
2
2
5
5
39
3
3
41.1
T
he c
hief
exe
cutiv
e offi
cer, d
irect
ors
and
exec
utiv
es a
re p
rovi
ded
with
free
use
of C
ompa
ny m
aint
aine
d ca
rs a
nd te
leph
one
faci
lity,
acc
ordi
ng to
thei
r ent
itlem
ent a
nd a
re a
lso
gran
ted
optio
ns u
nder
the
empl
oyee
s st
ock
optio
n sc
hem
e as
refe
rred
in n
ote
25.
41.2
T
he C
ompa
ny h
as c
ontr
ibut
ed R
s. 2
.89
milli
on a
nd R
s. 2
.59
milli
on in
gra
tuity
and
sup
eran
nuat
ion
fund
resp
ectiv
ely
for k
ey m
anag
emen
t per
sonn
el.
42
Num
ber o
f em
ploy
ees
The
Com
pany
has
em
ploy
ed fo
llow
ing
num
ber o
f per
sons
incl
udin
g pe
rman
ent a
nd c
ontr
actu
al s
taff:
2019
2018
(Num
ber o
f per
sons
)
As
at 3
0 J
une:
2,2
08
2
,224
Ave
rage
num
ber o
f em
ploy
ees:
2,2
16
2,17
7
Notes to the financial statementsFor the year ended 30 June 2019
153152 2019 Annual Report
Fin
anci
al s
tate
men
t
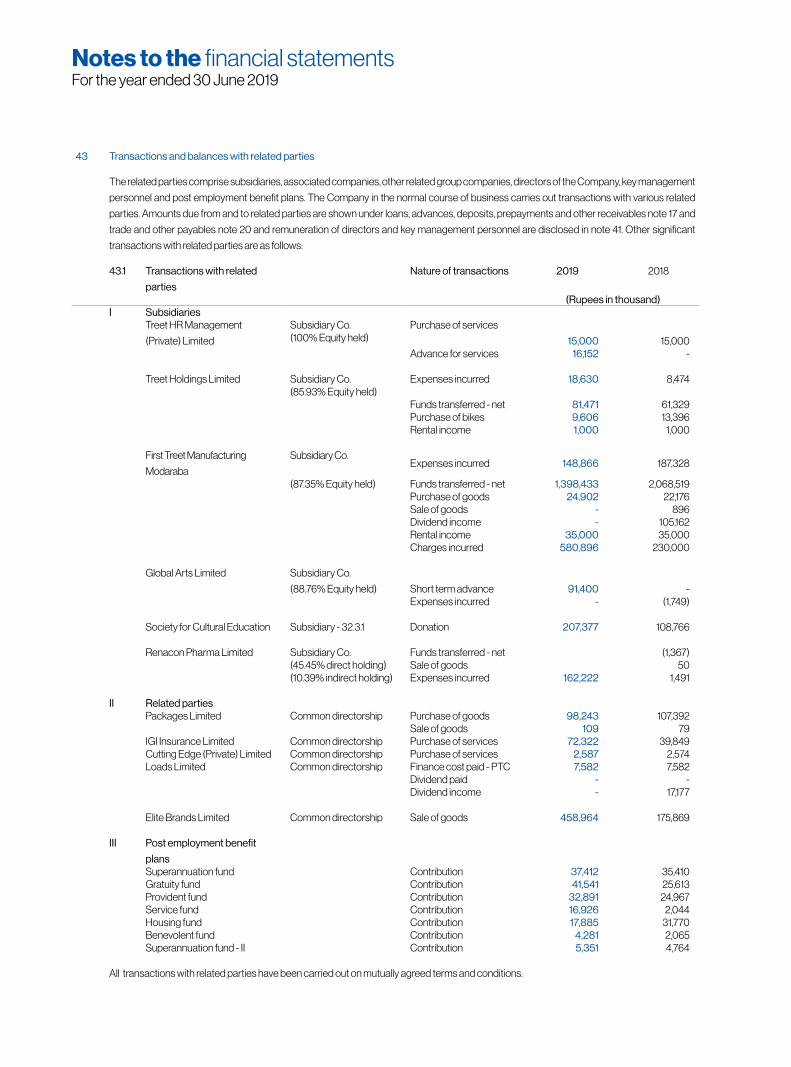
43 Transactions and balances with related parties
The related parties comprise subsidiaries, associated companies, other related group companies, directors of the Company, key management
personnel and post employment benefit plans. The Company in the normal course of business carries out transactions with various related
parties. Amounts due from and to related parties are shown under loans, advances, deposits, prepayments and other receivables note 17 and
trade and other payables note 20 and remuneration of directors and key management personnel are disclosed in note 41. Other significant
transactions with related parties are as follows:
43.1 Transactions with related
parties
Nature of transactions 2019 2018
(Rupees in thousand)I Subsidiaries
Treet HR Management
(Private) Limited
Subsidiary Co. (100% Equity held)
Purchase of services
15,000 15,000 Advance for services 16,152 -
Treet Holdings Limited Subsidiary Co.(85.93% Equity held)
Expenses incurred 18,630 8,474
Funds transferred - net 81,471 61,329 Purchase of bikes 9,606 13,396 Rental income 1,000 1,000
First Treet Manufacturing
Modaraba
Subsidiary Co.Expenses incurred 148,866 187,328
(87.35% Equity held) Funds transferred - net 1,398,433 2,068,519 Purchase of goods 24,902 22,176 Sale of goods - 896 Dividend income - 105,162 Rental income 35,000 35,000 Charges incurred 580,896 230,000
Global Arts Limited Subsidiary Co.
(88.76% Equity held) Short term advance 91,400 - Expenses incurred - (1,749)
Society for Cultural Education Subsidiary - 32.3.1 Donation 207,377 108,766
Renacon Pharma Limited Subsidiary Co. Funds transferred - net (1,367)(45.45% direct holding) Sale of goods 50 (10.39% indirect holding) Expenses incurred 162,222 1,491
II Related partiesPackages Limited Common directorship Purchase of goods 98,243 107,392
Sale of goods 109 79 IGI Insurance Limited Common directorship Purchase of services 72,322 39,849 Cutting Edge (Private) Limited Common directorship Purchase of services 2,587 2,574 Loads Limited Common directorship Finance cost paid - PTC 7,582 7,582
Dividend paid - - Dividend income - 17,177
Elite Brands Limited Common directorship Sale of goods 458,964 175,869
III Post employment benefit
plansSuperannuation fund Contribution 37,412 35,410 Gratuity fund Contribution 41,541 25,613 Provident fund Contribution 32,891 24,967 Service fund Contribution 16,926 2,044 Housing fund Contribution 17,885 31,770 Benevolent fund Contribution 4,281 2,065 Superannuation fund - II Contribution 5,351 4,764
All transactions with related parties have been carried out on mutually agreed terms and conditions.
Notes to the financial statementsFor the year ended 30 June 2019

44 Financial risk management
44.1 Financial risk factors
The Company’s activities expose it to a variety of financial risks: credit risk, liquidity risk and market risk (including currency risk, interest rate risk and other price risk). The Company’s overall risk management program focuses on the unpredictability of financial markets and seeks to minimize potential adverse effects on the financial performance.
The Company’s Board of Directors (“the Board”) has overall responsibility for establishment and oversight of the Company’s risk management framework. The Board is responsible for developing and monitoring the Company’s risk management policies.
The Company’s risk management policies are established to identify and analyze the risks faced by the Company, to set appropriate risk limits and controls, and to monitor risk and adherence to limits. Risk management policies and systems are reviewed regularly to reflect changes in market conditions and Company’s activities. The Company, through its training and management standards and procedures, aims to develop a disciplined and constructive control environment in which all employees understand their roles and obligations.
The Company’s audit committee oversees how management monitors compliance with the Company’s risk management policies and procedures and reviews the adequacy of the risk management framework in relation to the risks faced by the Company. Audit committee is assisted in its oversight role by internal audit department. Internal audit department undertakes both regular and adhoc reviews of risk management controls and procedures, the results of which are reported to the audit committee.
The Company’s exposure to financial risk, the way these risks affect the financial position and performance and the manner in which such risks are managed is as follows:
44.2 Credit risk
Credit risk represents the risk of financial loss if a customer or counterparty to a financial instrument fails to meet its contractual obligations and arises principally from trade receivables. Out of the total financial assets of Rs. 7,774.41 million (2018: Rs. 7,037.58 million), the financial assets which are subject to credit risk amounted to Rs. 7,298.66 million (2018: Rs. 6,526.36 million).
To manage exposure to credit risk in respect of trade receivables, management performs credit reviews taking into account the customer’s financial position, past experience and other factors. Export sales are either secured through letter of credit or a foreign bank guarantee is obtained. Majority of the local sales are made through distributors.
The Company provides unsecured loans and advances to inter-companies. The Company monitors the ability of the inter-companies to repay the loans and advances on an individual basis.
As at the end of the reporting period, the maximum exposure to credit risk is represented by their carrying amounts in the statement of financial position.
Loans and advances provided to intercompanies are not secured by any collateral or supported by any other credit enhancements.
Notes to the financial statementsFor the year ended 30 June 2019
155154 2019 Annual Report
Fin
anci
al s
tate
men
t
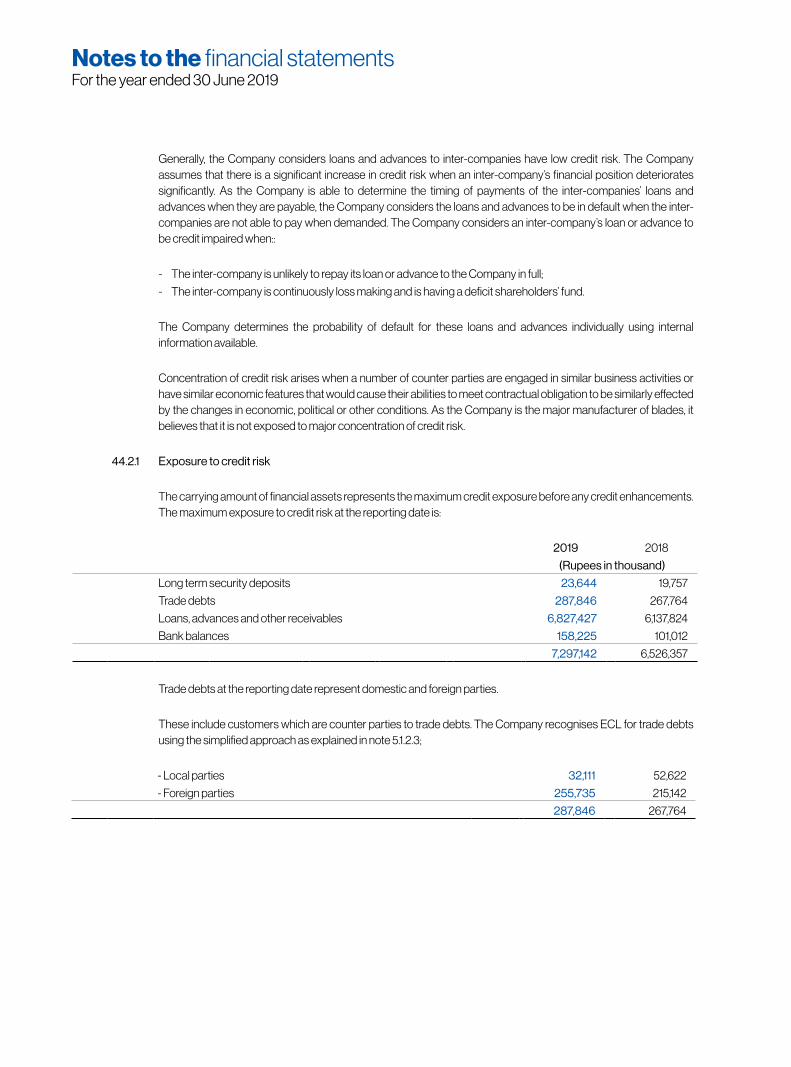
- Local parties 32,111 52,622
- Foreign parties 255,735 215,142
287,846 267,764
Generally, the Company considers loans and advances to inter-companies have low credit risk. The Company assumes that there is a significant increase in credit risk when an inter-company’s financial position deteriorates significantly. As the Company is able to determine the timing of payments of the inter-companies’ loans and advances when they are payable, the Company considers the loans and advances to be in default when the inter-companies are not able to pay when demanded. The Company considers an inter-company’s loan or advance to be credit impaired when::
- The inter-company is unlikely to repay its loan or advance to the Company in full;
- The inter-company is continuously loss making and is having a deficit shareholders’ fund.
The Company determines the probability of default for these loans and advances individually using internal information available.
Concentration of credit risk arises when a number of counter parties are engaged in similar business activities or have similar economic features that would cause their abilities to meet contractual obligation to be similarly effected by the changes in economic, political or other conditions. As the Company is the major manufacturer of blades, it believes that it is not exposed to major concentration of credit risk.
44.2.1 Exposure to credit risk
The carrying amount of financial assets represents the maximum credit exposure before any credit enhancements. The maximum exposure to credit risk at the reporting date is:
2019 2018
(Rupees in thousand)
Long term security deposits 23,644 19,757
Trade debts 287,846 267,764
Loans, advances and other receivables 6,827,427 6,137,824
Bank balances 158,225 101,012
7,297,142 6,526,357
Trade debts at the reporting date represent domestic and foreign parties.
These include customers which are counter parties to trade debts. The Company recognises ECL for trade debts using the simplified approach as explained in note 5.1.2.3;
Notes to the financial statementsFor the year ended 30 June 2019

44.2.2 Credit quality of major financial assets
The credit quality of financial assets at bank that are neither past due nor impaired can be assessed by reference to external credit ratings (if available) or to historical information about counterparty default rate:
30 June 30 June
Rating Rating 2019 2018
Banks Short term Long term Agency Rupees Rupees
MCIB Bank Limited A-1 A PACRA 1,210 4
NIB Bank Limited A1+ AAA PACRA 4,821 3,913
Faysal Bank Limited A-1+ AA PACRA 97,026 2,887
United Bank Limited A-1+ AAA JCR-VIS 10,516 779
Habib Bank Limited A-1+ AAA JCR-VIS 21,435 52,020
Askari Bank Limited A-1+ AA+ PACRA 49 47
National Bank of Pakistan A-1+ AAA JCR-VIS 1,388 4,010
Bank of Punjab A-1+ AA PACRA - 3,458
MCB Bank Limited A-1+ AAA PACRA 18,156 24,932
Silk Bank Limited A-2 A- JCR-VIS 1,686 3,985
Samba Bank Limited A-1 AA JCR-VIS 2 1
Bank Alfalah Limited A-1+ AA+ PACRA - -
Bank Islami Pakistan Limited A-1 A+ PACRA 641 112
Soneri Bank Limited A-1+ AA- PACRA - -
Sindh Bank Limited A-1 A+ JCR-VIS 371 884
Dubai Islamic Bank Limited A-1+ AA+ JCR-VIS 596 -
Allied Bank Limited A-1+ AAA PACRA - 2,992
Albaraka Bank (Pakistan) Limited
A-1 A PACRA 328 988
158,225 101,012
The aging of trade debts at the reporting date is:
2019 2018
Gross carry-ing amount
Loss Allowance
Gross carry-ing amount
Loss Allowance
(Rupees in thousand)
Less than 30 days 238,889 - 218,864 -
Past due 1 - 3 months 44,256 - 48,838 -
Above one year 4,701 1,785 1,847 1,785
287,846 1,785 269,549 1,785
Based on past experience the management believes that no impairment allowance is necessary in respect of unimpaired trade receivables that are past due as most of receivables have been recovered subsequent to the year end and for other receivables there are reasonable grounds to believe that the amounts will be recovered in short course of time.
Notes to the financial statementsFor the year ended 30 June 2019
157156 2019 Annual Report
Fin
anci
al s
tate
men
t
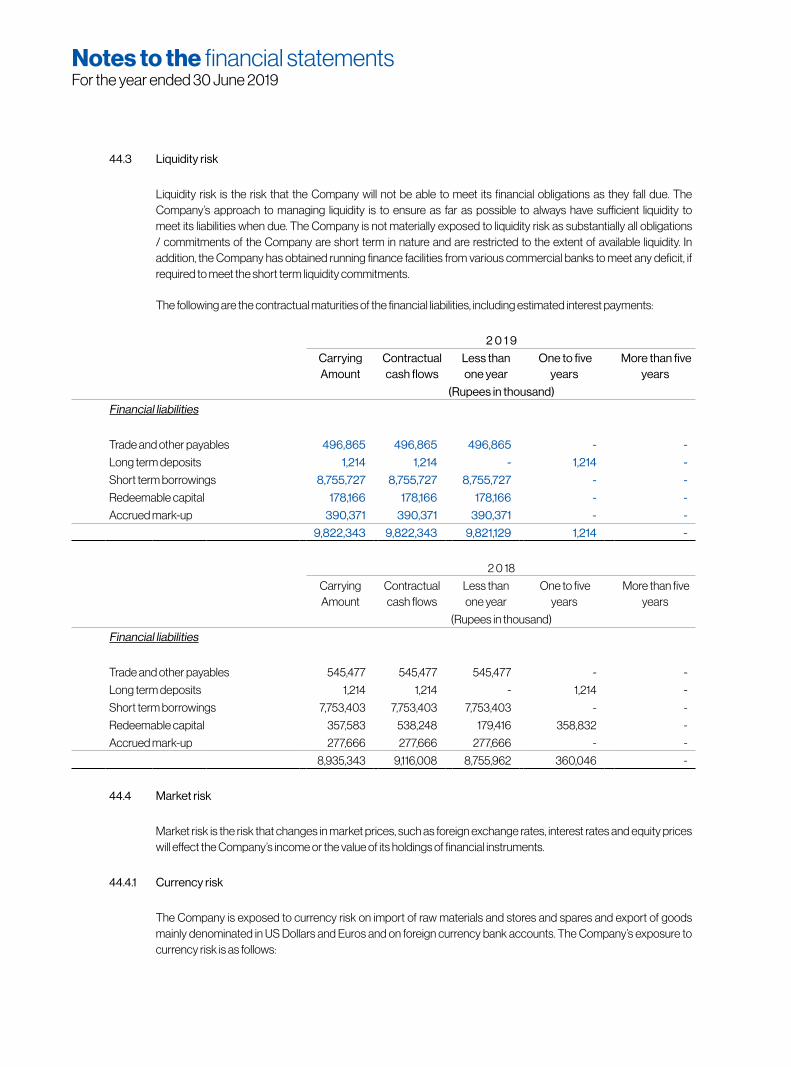
44.3 Liquidity risk
Liquidity risk is the risk that the Company will not be able to meet its financial obligations as they fall due. The Company’s approach to managing liquidity is to ensure as far as possible to always have sufficient liquidity to meet its liabilities when due. The Company is not materially exposed to liquidity risk as substantially all obligations / commitments of the Company are short term in nature and are restricted to the extent of available liquidity. In addition, the Company has obtained running finance facilities from various commercial banks to meet any deficit, if required to meet the short term liquidity commitments.
The following are the contractual maturities of the financial liabilities, including estimated interest payments:
2 0 1 9
Carrying Amount
Contractual cash flows
Less than one year
One to five years
More than five years
(Rupees in thousand)
Financial liabilities
Trade and other payables 496,865 496,865 496,865 - -
Long term deposits 1,214 1,214 - 1,214 -
Short term borrowings 8,755,727 8,755,727 8,755,727 - -
Redeemable capital 178,166 178,166 178,166 - -
Accrued mark-up 390,371 390,371 390,371 - -
9,822,343 9,822,343 9,821,129 1,214 -
2 0 18
Carrying Amount
Contractual cash flows
Less than one year
One to five years
More than five years
(Rupees in thousand)
Financial liabilities
Trade and other payables 545,477 545,477 545,477 - -
Long term deposits 1,214 1,214 - 1,214 -
Short term borrowings 7,753,403 7,753,403 7,753,403 - -
Redeemable capital 357,583 538,248 179,416 358,832 -
Accrued mark-up 277,666 277,666 277,666 - -
8,935,343 9,116,008 8,755,962 360,046 -
44.4 Market risk
Market risk is the risk that changes in market prices, such as foreign exchange rates, interest rates and equity prices will effect the Company’s income or the value of its holdings of financial instruments.
44.4.1 Currency risk
The Company is exposed to currency risk on import of raw materials and stores and spares and export of goods mainly denominated in US Dollars and Euros and on foreign currency bank accounts. The Company’s exposure to currency risk is as follows:
Notes to the financial statementsFor the year ended 30 June 2019
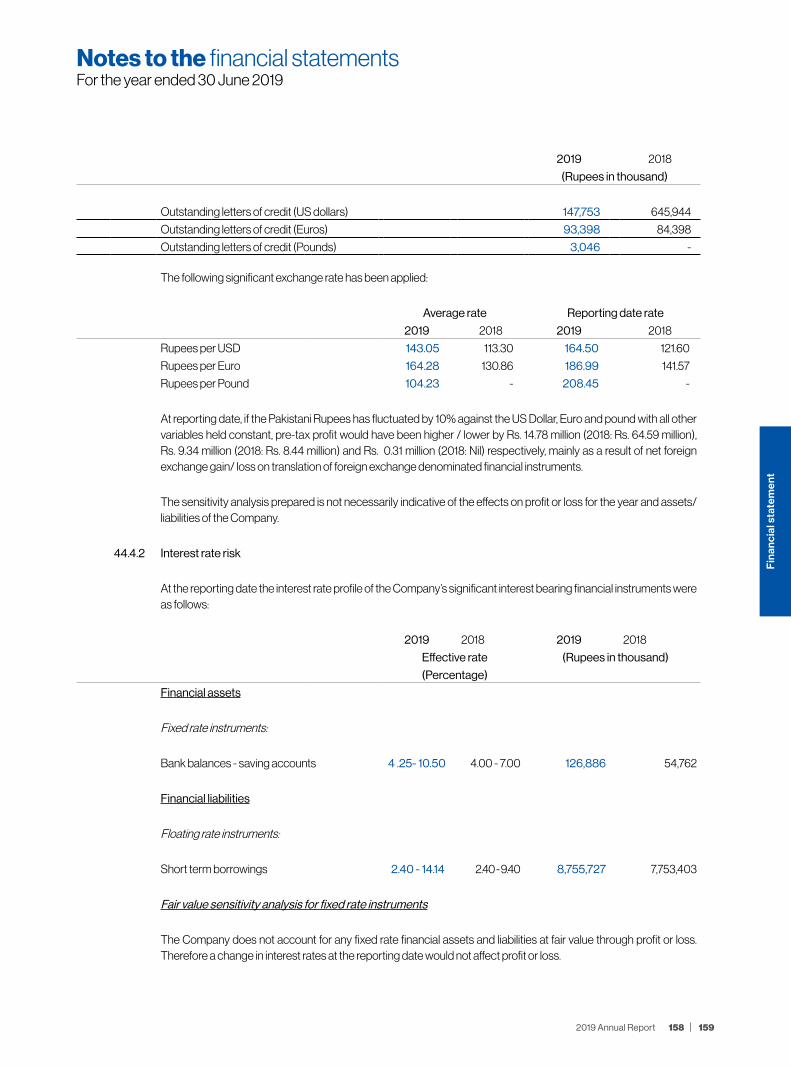
The following significant exchange rate has been applied:
Average rate Reporting date rate
2019 2018 2019 2018
Rupees per USD 143.05 113.30 164.50 121.60
Rupees per Euro 164.28 130.86 186.99 141.57
Rupees per Pound 104.23 - 208.45 -
At reporting date, if the Pakistani Rupees has fluctuated by 10% against the US Dollar, Euro and pound with all other variables held constant, pre-tax profit would have been higher / lower by Rs. 14.78 million (2018: Rs. 64.59 million), Rs. 9.34 million (2018: Rs. 8.44 million) and Rs. 0.31 million (2018: Nil) respectively, mainly as a result of net foreign exchange gain/ loss on translation of foreign exchange denominated financial instruments.
The sensitivity analysis prepared is not necessarily indicative of the effects on profit or loss for the year and assets/ liabilities of the Company.
44.4.2 Interest rate risk
At the reporting date the interest rate profile of the Company’s significant interest bearing financial instruments were as follows:
2019 2018 2019 2018
Effective rate (Rupees in thousand)
(Percentage)
Financial assets
Fixed rate instruments:
Bank balances - saving accounts 4 .25- 10.50 4.00 - 7.00 126,886 54,762
Financial liabilities
Floating rate instruments:
Short term borrowings 2.40 - 14.14 2.40 - 9.40 8,755,727 7,753,403
Fair value sensitivity analysis for fixed rate instruments
The Company does not account for any fixed rate financial assets and liabilities at fair value through profit or loss. Therefore a change in interest rates at the reporting date would not affect profit or loss.
2019 2018
(Rupees in thousand)
Outstanding letters of credit (US dollars) 147,753 645,944
Outstanding letters of credit (Euros) 93,398 84,398
Outstanding letters of credit (Pounds) 3,046 -
Notes to the financial statementsFor the year ended 30 June 2019
159158 2019 Annual Report
Fin
anci
al s
tate
men
t

44.4.3 Other price risk
Other price risk is the risk that the fair value or future cash flows of a financial instrument will fluctuate because of changes in market prices (other than those arising from interest rate risk or currency risk). Other price risk arises from the Company’s investment in ordinary shares of listed companies. To manage its price risk arising from aforesaid investments, the Company diversifies its portfolio and continuously monitors developments in equity markets. In addition the Company actively monitors the key factors that affect stock price movement.
A 10% increase in share prices at the year end would have increased the Company’s profit in case of held for trading investments as follows:
2019 2018 (Rupees in thousand)
Effect on profit and loss (43,187) (45,851)Effect on investments (43,187) (45,851)
The sensitivity analysis prepared is not necessarily indicative of the effects on profit or loss, equity and assets of the Company.
44.5 Fair value of financial instruments
Fair value is the price that would be received to sell an asset or paid to transfer a liability in an orderly transaction between market participants at the measurement date.
Underlying the definition of fair value is the presumption that the company is a going concern and there is no intention or requirement to curtail materially the scale of its operations or to undertake a transaction on adverse terms.
A financial instrument is regarded as quoted in an active market if quoted prices are readily and regularly available from an exchange dealer, broker, industry group, pricing service, or regulatory agency, and those prices represent actual and regularly occurring market transactions on an arm’s length basis.
IFRS 13 ‘Fair Value Measurement’ requires the company to classify fair value measurements and fair value hierarchy that reflects the significance of the inputs used in making the measurements of fair value hierarchy has the following levels:- Quoted prices (unadjusted) in active markets for identical assets or liabilities (Level 1)- Inputs other than quoted prices included within level 1 that are observable for the asset either directly
(that is, derived from prices) (Level 2)- Inputs for the asset or liability that are not based on observable market data (that is, unadjusted) inputs
(Level 3)Transfer between levels of the fair value hierarchy are recognized at the end of the reporting period during which the changes have occurred.
The following table shows the carrying amounts and fair values of financial assets and financial liabilities, including their levels in the fair value hierarchy. It does not include fair value information for financial assets and financial liabilities not measured at fair value if the carrying amount is a reasonable approximation of fair value.
Cash flow sensitivity analysis for variable rate instruments
If interest rates on short term borrowings, at the year end rate, fluctuate by 1% higher / lower with all the other variables held constant, pre-tax profit for the year would have been lower / higher by Rs. 94.04 million (2018: Rs. 77.78 million), mainly as a result of higher / lower interest expense on floating rate borrowings.
Notes to the financial statementsFor the year ended 30 June 2019
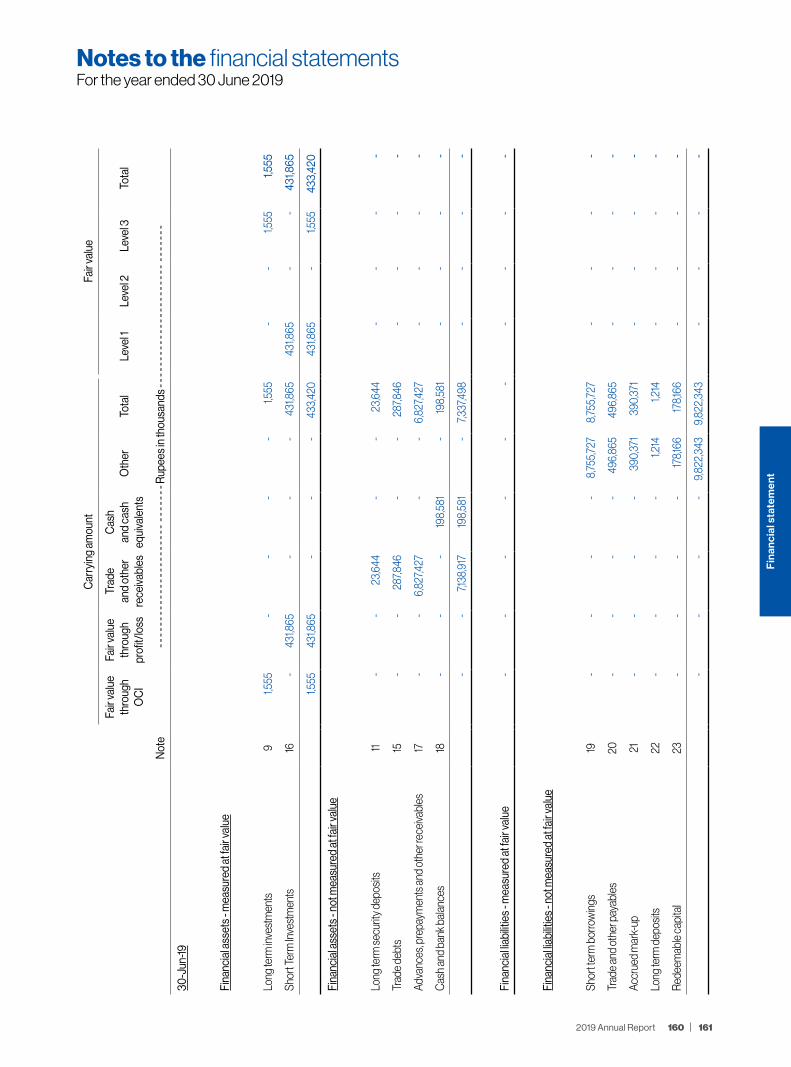
Car
ryin
g am
ount
Fair
valu
e
Fair
valu
e th
roug
h O
CI
Fair
valu
e th
roug
h pr
ofit/
loss
Trad
e an
d ot
her
rece
ivab
les
Cas
h an
d ca
sh
equi
vale
nts
Oth
erTo
tal
Leve
l 1Le
vel 2
Leve
l 3To
tal
Not
e- -
- - -
- - -
- - -
- - -
- - -
- - -
- - -
- -
- - -
- - R
upee
s in
thou
sand
s - -
- - -
- - -
- - -
- - -
- - -
- - -
- - -
- -
- - -
- -
30-J
un-19
Fina
ncia
l ass
ets
- mea
sure
d at
fair
valu
e
Long
term
inve
stm
ents
9 1,
555
- -
- -
1,55
5 -
- 1,
555
1,55
5
Shor
t Ter
m In
vest
men
ts16
- 4
31,8
65
- -
- 4
31,8
65
431
,865
-
- 4
31,8
65
1,55
5 4
31,8
65
- -
- 4
33,4
20
431
,865
-
1,55
5 4
33,4
20
Fina
ncia
l ass
ets
- not
mea
sure
d at
fair
valu
e
Long
term
secu
rity d
epos
its11
- -
23,
644
- -
23,
644
- -
- -
Trad
e de
bts
15 -
- 2
87,8
46
- -
287
,846
-
- -
-
Adva
nces
, pre
paym
ents
and
oth
er re
ceiva
bles
17 -
- 6
,827
,427
-
- 6
,827
,427
-
- -
-
Cas
h an
d ba
nk b
alan
ces
18 -
- -
198,
581
- 19
8,58
1 -
- -
-
- -
7,13
8,91
7 19
8,58
1 -
7,33
7,498
-
- -
-
Fina
ncia
l liab
ilitie
s - m
easu
red
at fa
ir va
lue
- -
- -
- -
- -
- -
Fina
ncia
l liab
ilitie
s - n
ot m
easu
red
at fa
ir va
lue
Shor
t ter
m b
orro
win
gs19
- -
- -
8,75
5,72
7 8
,755,
727
- -
- -
Trad
e an
d ot
her p
ayab
les
20 -
- -
- 4
96,8
65
496
,865
-
- -
-
Accr
ued
mar
k-up
21 -
- -
- 3
90,3
71
390
,371
-
- -
-
Long
term
dep
osits
22 -
- -
- 1,
214
1,21
4 -
- -
-
Rede
emab
le c
apita
l23
- -
- -
178,1
66
178,1
66
- -
- -
- -
- -
9,8
22,3
43
9,8
22,3
43
- -
- -
Notes to the financial statementsFor the year ended 30 June 2019
161160 2019 Annual Report
Fin
anci
al s
tate
men
t

Car
ryin
g am
ount
Fair
valu
e
Fair
valu
e th
roug
h O
CI
Fair
valu
e th
roug
h pr
ofit/
loss
Trad
e an
d ot
her
rece
ivab
les
Cas
h an
d ca
sh
equi
vale
nts
Oth
erTo
tal
Leve
l 1Le
vel 2
Leve
l 3To
tal
Not
e- -
- - -
- - -
- - -
- - -
- - -
- - -
- - -
- -
- - -
- - R
upee
s in
thou
sand
s - -
- - -
- - -
- - -
- - -
- - -
- - -
- - -
- -
- - -
- -
30-J
un-18
Fina
ncia
l ass
ets
- mea
sure
d at
fair
valu
e
Long
term
inve
stm
ents
9 1,
555
- -
- -
1,55
5 -
- 1,
555
1,55
5
Shor
t Ter
m In
vest
men
ts16
- 4
58,5
06
- -
- 4
58,5
06
458
,506
-
- 4
58,5
06
1,55
5 4
58,5
06
- -
- 4
60,0
61
458
,506
-
1,55
5 4
60,0
61
Fina
ncia
l ass
ets
- not
mea
sure
d at
fair
valu
e
Long
term
secu
rity d
epos
its11
- -
19,75
7 -
- 19
,757
- -
- -
Trad
e de
bts
15 -
- 2
67,76
4 -
- 2
67,76
4 -
- -
-
Adva
nces
, pre
paym
ents
and
oth
er re
ceiva
bles
17 -
- 6
,137,8
24
- -
6,13
7,824
-
- -
-
Cas
h an
d ba
nk b
alan
ces
18 -
- -
151,5
49
- 15
1,549
-
- -
-
- -
6,4
25,3
45
151,5
49
- 6
,576
,894
-
- -
-
Fina
ncia
l liab
ilitie
s - m
easu
red
at fa
ir va
lue
- -
- -
- -
- -
- -
Fina
ncia
l liab
ilitie
s - n
ot m
easu
red
at fa
ir va
lue
Shor
t ter
m b
orro
win
gs19
-
- -
- 7,
753,
403
7,75
3,40
3 -
- -
-
Trad
e an
d ot
her p
ayab
les
20
- -
- -
545
,477
5
45,4
77
- -
- -
Accr
ued
mar
k-up
21
- -
- -
277
,666
2
77,6
66
- -
- -
Long
term
dep
osits
22
- -
- -
1,21
4 1,
214
- -
- -
Rede
emab
le c
apita
l23
-
- -
- 3
57,5
83
357
,583
-
- -
-
- -
- -
8,9
35,3
43
8,9
35,3
43
- -
- -
Notes to the financial statementsFor the year ended 30 June 2019
44.6 Operational risk
Operational risk is the risk of direct or indirect loss arising from a wide variety of causes associated with the Company’s processes, personnel, technology and infrastructure, and from external factors other than credit, market and liquidity risks such as those arising from legal and regulatory requirements and generally accepted standards of corporate behavior. Operational risks arise from all of the Company’s operations.
The Company’s objective is to manage operational risk so as to balance the avoidance of financial losses and dam-age to the Company’s reputation with overall cost effectiveness and to avoid control procedures that restrict initiative and creativity.
The primary responsibility for the development and implementation of controls to address operational risk is assigned to senior management within the Company. This responsibility is supported by the development of overall company standards for the management of operational risk in the following areas:
- requirements for appropriate segregation of duties, including the independent authorization of transactions
- requirements for the reconciliation and monitoring of transactions- compliance with regulatory and other legal requirements- documentation of controls and procedures- requirements for the periodic assessment of operational risks faced, and the adequacy of controls and
procedures to address the risks identified- requirements for the reporting of operational losses and proposed remedial action- development of contingency plans - training and professional development- ethical and business standards- risk mitigation including insurance where this is effective
44.7 Capital risk management
The Company’s objectives when managing capital are:
a) to safeguard the entity’s ability to continue as a going concern, so that it can continue to provide returns for shareholders and benefits for other stakeholders, and
b) to provide an adequate return to shareholders.
The Company manages the capital structure in the context of economic conditions and the risk characteristics of the underlying assets. In order to maintain or adjust the capital structure, the Company may, for example, adjust the amount of dividends paid to shareholders, issue new shares, or sell assets to reduce debt. The Company monitors capital on the basis of the gearing ratio calculated as total debt (current and non-current borrowings) to debt plus equity.
The debt to equity ratios were as follows:2019 2018
(Rupees in thousand)
Total debt 8,933,893 8,110,986 Total equity and debt 20,287,930 16,433,372 Debt to equity ratio 44% 49%
Debt to equity ratio has improves primarily due to revaluation surplus and current year profits.
Notes to the financial statementsFor the year ended 30 June 2019
163162 2019 Annual Report
Fin
anci
al s
tate
men
t

45
Rec
onci
liatio
n of
mov
emen
t of l
iabi
litie
s to
cas
h flo
ws
aris
ing
from
fina
ncin
g ac
tiviti
es
Liab
ilitie
sE
quity
Tota
lR
edee
m-
able
cap
ital
Sho
rt te
rm
borr
owin
gs
Loa
n fr
om C
hief
E
xecu
tive
Unc
laim
ed
Div
iden
d P
ayab
le
Acc
rued
m
arku
pLo
ng te
rm
depo
sits
Sha
re
capi
tal/
pr
emiu
m
Em
ploy
ee
Sto
ck O
p-tio
n C
om-
pens
atio
n R
eser
ve
Res
erve
sU
napp
ropr
i-at
ed p
rofit
----
----
----
----
----
----
----
----
----
----
----
----
----
----
----
----
--(R
upee
s in
thou
sand
)---
----
----
----
----
----
----
----
----
----
----
----
----
----
----
----
---
As
at 3
0 J
une
2018
357
,58
3
2,3
40
,121
39
0,0
00
13
,30
1 2
77,6
66
1,
214
6
,09
4,0
45
- 2
59,9
91
70
2,3
03
10
,43
6,2
24
Cha
nges
from
fina
ncin
g ca
sh fl
ows
Pro
ceed
s fro
m is
sue
of s
hare
s un
der
empl
oyee
sto
ck o
ptio
n sc
hem
e -
- -
- -
- 4
8,7
74
- -
- 4
8,7
74
Pro
ceed
s fro
m b
orro
win
g -
2,4
62,
38
8
- -
- -
- -
- -
2,4
62,
38
8
Rep
aym
ent o
f bor
row
ings
- (2
,160
,121)
(34
0,0
00
) -
- -
- -
- -
(2,5
00
,121)
Red
empt
ion
of re
deem
able
cap
ital
(6,2
73)
- -
- -
- -
- -
- (6
,273
)
Div
iden
d pa
id -
- -
(61)
- -
- -
- -
(61)
Tota
l cha
nges
from
fina
ncin
g ca
sh fl
ows
(6,2
73)
30
2,26
7 (3
40
,00
0)
(61)
- -
48
,774
-
- -
4,7
07
Oth
er c
hang
es in
clud
ing
non-
cas
h
Con
vers
ion
of P
TCs
into
ord
inar
y sh
ares
@ 0
.07
shar
e pe
r PTC
(173
,144
) -
- -
- -
173
,144
-
- -
-
Issu
e of
ord
inar
y sh
ares
as
bonu
s @
10%
-
- -
- -
- -
- -
- -
Rec
ogni
tion
of fa
ir va
lue
char
ge o
f sha
res
unde
r em
ploy
ee s
hare
opt
ion
sche
me
(ES
OS
) -
- -
- -
- -
23
,59
3
- -
-
Tran
sfer
to s
hare
pre
miu
m o
n is
suan
ce o
f sha
res
unde
r em
ploy
ee s
hare
opt
ion
sche
me
(ES
OS
) -
- -
- -
- 13
,071
(1
3,0
71)
- -
-
Cha
nges
in b
orro
win
gs -
- -
- -
- -
- -
- -
Tota
l com
preh
ensi
ve lo
ss fo
r the
yea
r -
- -
- -
- -
- -
20
2,0
57
20
2,0
57
Fina
nce
cost
pai
d -
- -
- (8
60
,49
3)
- -
- -
- (8
60
,49
3)
Fina
nce
cost
-
- -
- 9
73,19
8
- -
- -
- 9
73,19
8
Tota
l liab
ility
rela
ted
othe
r cha
nges
(1
73,14
4)
- -
- 11
2,70
5 -
186
,215
10
,522
-
20
2,0
57
314
,76
2
As
at 3
0 J
une
2019
178
,166
2
,64
2,3
88
5
0,0
00
13
,24
0
39
0,3
71
1,21
4
6,3
29,0
34
10
,522
2
59,9
91
90
4,3
60
10
,755
,69
3
Notes to the financial statementsFor the year ended 30 June 2019

Liab
ilitie
sE
quity
Tota
lR
edee
mab
le
capi
tal
Sho
rt te
rm
borr
owin
gs
Loa
n fro
m
Chi
ef E
xec-
utiv
e
Unc
laim
ed
Div
iden
d Pa
yabl
e
Acc
rued
m
arku
pLo
ng te
rm
depo
sits
Sha
re c
apita
l/
prem
ium
Res
erve
sU
napp
ropr
iat-
ed p
rofit
----
----
----
----
----
----
----
----
----
----
----
----
----
----
----
----
--(R
upee
s in
thou
sand
)---
----
----
----
----
----
----
----
----
----
----
----
----
----
----
----
---
As
at 3
0 J
une
2017
537
,00
0
1,70
3,0
44
390
,00
0
18,6
29
348
,639
1,
214
5,74
0,40
8 2
67,0
29
974
,863
9
,980
,826
Cha
nges
from
finan
cing
cas
h flo
ws
Pro
ceed
s fro
m is
sue
of s
hare
s un
der
empl
oyee
sto
ck o
ptio
n sc
hem
e -
- -
- -
- 3
7,623
-
- 3
7,623
Pro
ceed
s fro
m b
orro
win
g -
1,71
7,84
2 -
- -
- -
- -
1,71
7,84
2
Rep
aym
ent o
f bor
row
ings
- (1
,080
,765
) -
- -
- -
- -
(1,0
80,7
65)
Red
empt
ion
of re
deem
able
cap
ital
(6,2
73)
- -
- -
- -
- -
(6,2
73)
Div
iden
d pa
id -
- -
(5,3
28)
- -
- -
- (5
,328
)
Tota
l cha
nges
from
fina
ncin
g ca
sh fl
ows
(6,2
73)
637
,077
-
(5,3
28)
- -
37,6
23
- -
663
,099
Oth
er c
hang
es in
clud
ing
non-
cas
h
Con
vers
ion
of P
TCs
into
ord
inar
y sh
ares
@ 0
.07
shar
e pe
r PTC
(173
,144)
- -
- -
- 17
3,14
4 -
- -
Issu
e of
ord
inar
y sh
ares
as
bonu
s @
10%
-
- -
- -
- 14
2,87
0
- (1
42,8
70)
-
Tota
l com
preh
ensi
ve lo
ss fo
r the
yea
r -
- -
- -
- -
- (1
36,7
28)
(136
,728
)
Fina
nce
cost
pai
d -
- -
- (6
48,4
76)
- -
- -
(648
,476
)
Fina
nce
cost
-
- -
- 5
77,5
03
- -
- -
577
,50
3
Tota
l liab
ility
rela
ted
othe
r cha
nges
(1
73,14
4) -
- -
(70,
973)
- 3
16,0
14
- (2
79,5
98)
(207
,70
1)
As
at 3
0 J
une
2018
357
,583
2
,340
,121
390
,00
0
13,3
01
277
,666
1,
214
6,0
94,0
45
267
,029
6
95,2
65
10,4
36,2
24
Notes to the financial statementsFor the year ended 30 June 2019
165164 2019 Annual Report
Fin
anci
al s
tate
men
t

Production capacity Actual production
2019 2018 2019 2018
(Units in millions) (Units in millions)
46 Plant capacity and production
Hyderabad plant 840 810 814 764
Lahore plant 1,300 1,300 1,252 1,269
2,140 2,110 2,066 2,033
The variance of actual production from capacity is primarily on account of the product mix.
47 Date of authorization for issue
These unconsolidated financial statements were authorized for issue on October 04, 2019 by the Board of Directors of the Company.
48 Events after balance sheet date
The Board of Directors in their meeting held on October 04, 2019 have proposed a final cash dividend for the year ended 30 June 2018 of Rs. Nil (2018: Rs. Nil) per share, amounting to Rs. Nil (2018: Rs. Nil) for approval of the members at the Annual General Meeting to be held on October 28, 2019. These unconsolidated financial statements do not reflect this dividend.
49 General
Corresponding figures have been re-arranged or reclassified whenever necessary, for the purpose of comparison.
Syed Shahid AliChief Executive Officer
Muhammad Shafique AnjumDirector
LAHOREOctober 04, 2019
Amir ZiaChief Financial Officer
Notes to the financial statementsFor the year ended 30 June 2019
SOCIETY FOR CULTURAL EDUCATION
FINANCIAL STATEMENTSFor the year ended 30 June 2019

Society Institute of Arts
and CultureCONSOLIDATED
Note 2019 2019 2019 2018
----------------------- Rupees in thousands -----------------------
ASSETS
CURRENT ASSETS
Consumable stores 93 221 314 55
Advances, prepayments and other receivables 3 12,372 1,188 1,400 1,239
Tax refund due from Government 4 1,103 1,215 2,318 851
Cash and bank balances 5 55 32,051 32,106 18,580
TOTAL ASSETS 13,623 34,675 36,138 20,725
FUNDS AND LIABILITIES
ACCUMULATED FUNDS
General fund
Opening balance 2,183 - 2,183 10,593
Add: Surplus / (deficit) for the year (3,781) 19,709 15,928 (8,410)
(1,598) 19,709 18,111 2,183
Endowment fund 6 15,000 - 15,000 15,000
13,402 19,709 33,111 17,183
CURRENT LIABILITIES
Trade and other payables 7 221 14,966 3,027 3,542
CONTINGENCIES AND COMMITMENTS 9 - - - -
TOTAL FUND AND LIABILITIES 13,623 34,675 36,138 20,725
The annexed notes 1 to 14 form an integral part of these financial statements.
Statement of Financial Positionas at June 30, 2019
Syed Shahid AliChief Executive Officer
Muhammad Shafique AnjumDirector
LAHOREOctober 04, 2019
Amir ZiaChief Financial Officer
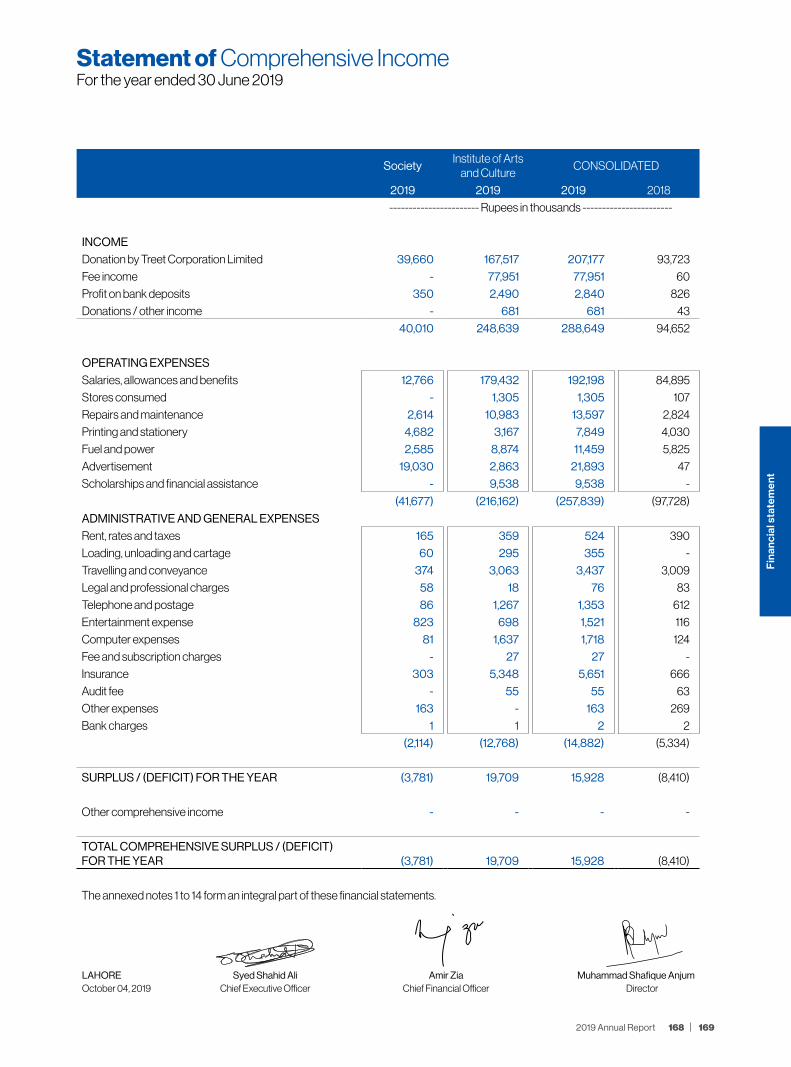
Society Institute of Arts
and CultureCONSOLIDATED
2019 2019 2019 2018
----------------------- Rupees in thousands -----------------------
INCOME
Donation by Treet Corporation Limited 39,660 167,517 207,177 93,723
Fee income - 77,951 77,951 60
Profit on bank deposits 350 2,490 2,840 826
Donations / other income - 681 681 43
40,010 248,639 288,649 94,652
OPERATING EXPENSES
Salaries, allowances and benefits 12,766 179,432 192,198 84,895
Stores consumed - 1,305 1,305 107
Repairs and maintenance 2,614 10,983 13,597 2,824
Printing and stationery 4,682 3,167 7,849 4,030
Fuel and power 2,585 8,874 11,459 5,825
Advertisement 19,030 2,863 21,893 47
Scholarships and financial assistance - 9,538 9,538 -
(41,677) (216,162) (257,839) (97,728)
ADMINISTRATIVE AND GENERAL EXPENSES
Rent, rates and taxes 165 359 524 390
Loading, unloading and cartage 60 295 355 -
Travelling and conveyance 374 3,063 3,437 3,009
Legal and professional charges 58 18 76 83
Telephone and postage 86 1,267 1,353 612
Entertainment expense 823 698 1,521 116
Computer expenses 81 1,637 1,718 124
Fee and subscription charges - 27 27 -
Insurance 303 5,348 5,651 666
Audit fee - 55 55 63
Other expenses 163 - 163 269
Bank charges 1 1 2 2
Bank charges (2,114) (12,768) (14,882) (5,334)
SURPLUS / (DEFICIT) FOR THE YEAR (3,781) 19,709 15,928 (8,410)
Other comprehensive income - - - -
TOTAL COMPREHENSIVE SURPLUS / (DEFICIT) FOR THE YEAR (3,781) 19,709 15,928 (8,410)
The annexed notes 1 to 14 form an integral part of these financial statements.
Statement of Comprehensive IncomeFor the year ended 30 June 2019
Syed Shahid AliChief Executive Officer
Muhammad Shafique AnjumDirector
LAHOREOctober 04, 2019
Amir ZiaChief Financial Officer
169168 2019 Annual Report
Fin
anci
al s
tate
men
t
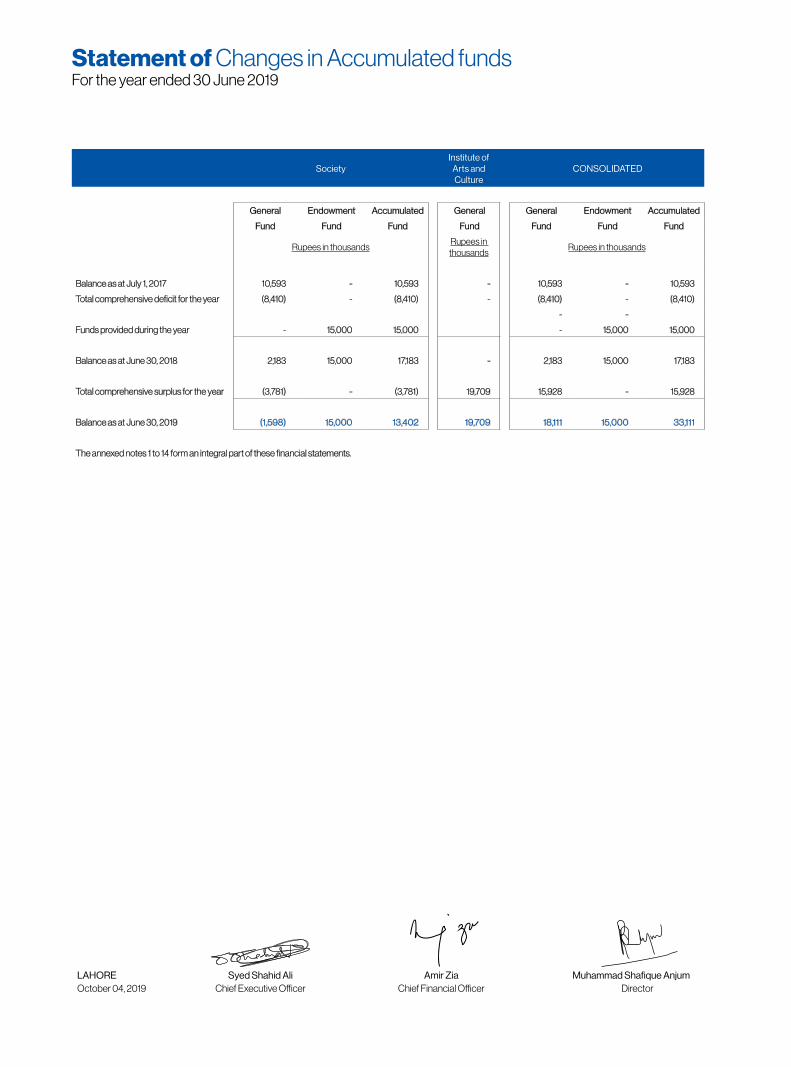
Statement of Changes in Accumulated fundsFor the year ended 30 June 2019
Society Institute of
Arts and Culture
CONSOLIDATED
General Endowment Accumulated General General Endowment Accumulated
Fund Fund Fund Fund Fund Fund Fund
Rupees in thousandsRupees in
thousandsRupees in thousands
Balance as at July 1, 2017 10,593 - 10,593 - 10,593 - 10,593
Total comprehensive deficit for the year (8,410) - (8,410) - (8,410) - (8,410)
- -
Funds provided during the year - 15,000 15,000 - 15,000 15,000
Balance as at June 30, 2018 2,183 15,000 17,183 - 2,183 15,000 17,183
Total comprehensive surplus for the year (3,781) - (3,781) 19,709 15,928 - 15,928
Balance as at June 30, 2019 (1,598) 15,000 13,402 19,709 18,111 15,000 33,111
The annexed notes 1 to 14 form an integral part of these financial statements.
Syed Shahid AliChief Executive Officer
Muhammad Shafique AnjumDirector
LAHOREOctober 04, 2019
Amir ZiaChief Financial Officer

Society Institute of Arts
and CultureCONSOLIDATED
2019 2019 2019 2018
----------------------- Rupees in thousands -----------------------
CASH FLOW FROM OPERATING ACTIVITIES
Surplus / (deficit) for the year before working capital changes (3,781) 19,709 15,928 (8,410)
Net Changes in operating assets and liabilities:
Consumable stores (38) (221) (259) (55)
Advances, prepayments and other receivables (11,134) (1,188) (161) (345)
Trade and other payables (3,321) 14,966 (515) 2,940
(14,493) 13,557 (935) 2,541
Cash inflows / (outflows) from operating activities (18,274) 33,266 14,993 (5,869)
Income tax paid (251) (1,215) (1,467) (246)
Net cash inflows / (outflows) from operating activities (18,525) 32,051 13,526 (6,115)
CASH FLOWS FROM INVESTING ACTIVITIES
Net cash flows from investing activities - - - -
CASH FLOW FROM FINANCING ACTIVITIES - - - 15,000
Endowment Fund - - - 15,000
Net cash inflows from financing activities - - - 15,000
NET INCREASE IN CASH AND CASH EQUIVALENTS (18,525) 32,051 13,526 8,885
CASH AND CASH EQUIVALENTS AT BEGINNING OF THE YEAR 18,580 - 18,580 9,695
CASH AND CASH EQUIVALENTS AT END OF THE YEAR 55 32,051 32,106 18,580
The annexed notes 1 to 14 form an integral part of these financial statements.
Statement of Cash flowsFor the year ended 30 June 2019
Syed Shahid AliChief Executive Officer
Muhammad Shafique AnjumDirector
LAHOREOctober 04, 2019
Amir ZiaChief Financial Officer
171170 2019 Annual Report
Fin
anci
al s
tate
men
t
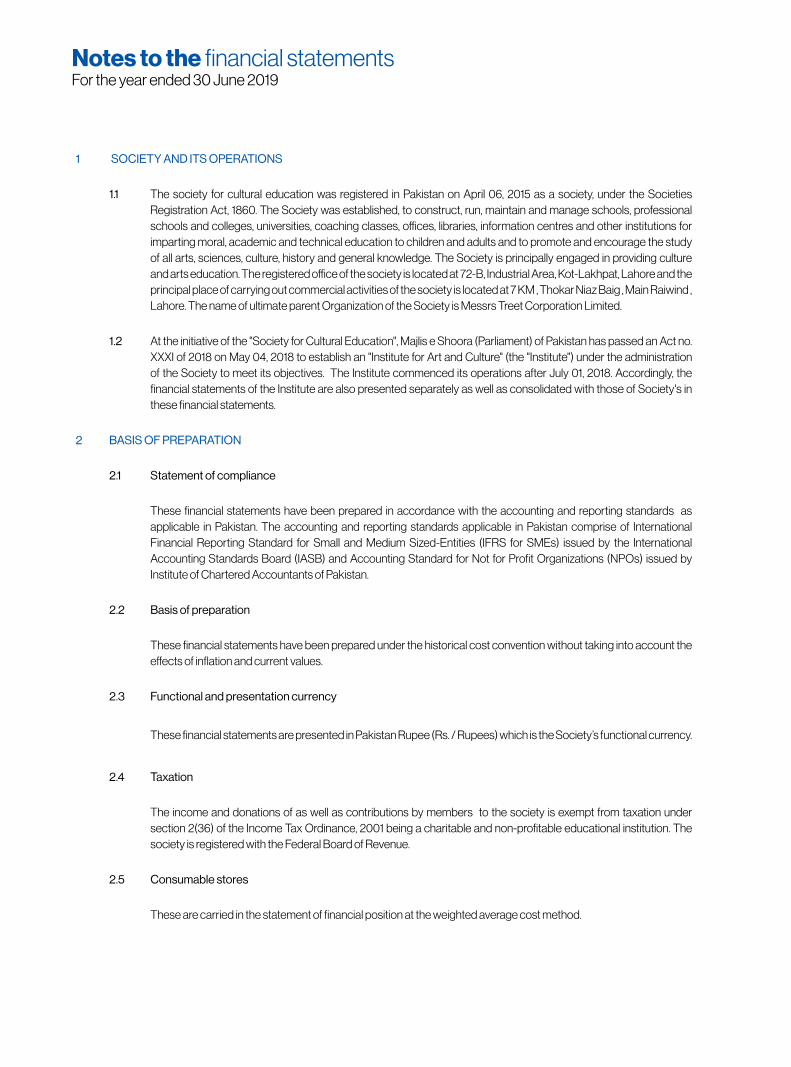
1 SOCIETY AND ITS OPERATIONS
1.1 The society for cultural education was registered in Pakistan on April 06, 2015 as a society, under the Societies Registration Act, 1860. The Society was established, to construct, run, maintain and manage schools, professional schools and colleges, universities, coaching classes, offices, libraries, information centres and other institutions for imparting moral, academic and technical education to children and adults and to promote and encourage the study of all arts, sciences, culture, history and general knowledge. The Society is principally engaged in providing culture and arts education. The registered office of the society is located at 72-B, Industrial Area, Kot-Lakhpat, Lahore and the principal place of carrying out commercial activities of the society is located at 7 KM , Thokar Niaz Baig , Main Raiwind , Lahore. The name of ultimate parent Organization of the Society is Messrs Treet Corporation Limited.
1.2 At the initiative of the "Society for Cultural Education", Majlis e Shoora (Parliament) of Pakistan has passed an Act no. XXXI of 2018 on May 04, 2018 to establish an "Institute for Art and Culture" (the "Institute") under the administration of the Society to meet its objectives. The Institute commenced its operations after July 01, 2018. Accordingly, the financial statements of the Institute are also presented separately as well as consolidated with those of Society's in these financial statements.
2 BASIS OF PREPARATION
2.1 Statement of compliance
These financial statements have been prepared in accordance with the accounting and reporting standards as applicable in Pakistan. The accounting and reporting standards applicable in Pakistan comprise of International Financial Reporting Standard for Small and Medium Sized-Entities (IFRS for SMEs) issued by the International Accounting Standards Board (IASB) and Accounting Standard for Not for Profit Organizations (NPOs) issued by Institute of Chartered Accountants of Pakistan.
2.2 Basis of preparation
These financial statements have been prepared under the historical cost convention without taking into account the effects of inflation and current values.
2.3 Functional and presentation currency
These financial statements are presented in Pakistan Rupee (Rs. / Rupees) which is the Society’s functional currency.
2.4 Taxation
The income and donations of as well as contributions by members to the society is exempt from taxation under section 2(36) of the Income Tax Ordinance, 2001 being a charitable and non-profitable educational institution. The society is registered with the Federal Board of Revenue.
2.5 Consumable stores
These are carried in the statement of financial position at the weighted average cost method.
Notes to the financial statementsFor the year ended 30 June 2019

2.6 Cash and cash equivalents
Cash equivalents are carried in the statement of financial position at cost for the purposes of statement of cash flows. Cash equivalents comprise of cash in hand and bank balances in current accounts.
2.7 Advances / receivables
These are valued at cost which is the fair value of the consideration to be received in future less any estimate of balances doubtful of recovery based on review of outstanding balances at the financial position date. Balances considered bad are written off as and when identified.
2.8 Trade and other payables
Liabilities for trade and other amounts payable are carried at cost which is the fair value of the consideration to be paid in future for goods and services received / hired, whether or not billed to the Society.
2.9 Provisions
A provision is recognized in the financial position when the Society has a legal and constructive obligation as a result of past events; it is probable that an outflow of economic resources embodying economic benefits will be required to settle the obligation and a reliable estimate can be made of the amount of the obligation. However, provisions are reviewed at each financial position date and adjusted to reflect the current best estimate. If it is no longer probable that outflow of resources will be required to settle the obligation, the provisions are reversed.
2.10 Commitments and Contingencies
Capital commitments and contingencies, unless those are actual liabilities, are not incorporated in the books of account.
2.11 Basic Financial Instruments
Financial assets and financial liabilities are initially measured at fair value, except for certain non-arm's length transactions.
These are subsequently measured at amortized cost, except for investment in equity instruments. Investments in equity instruments that are quoted in an active market shall be measured at fair value and investments in equity instruments that do not have active market shall be carried out at cost less impairment, if any.
Financial assets measured at amortized cost include advances adjustable in cash, other receivables and cash & bank balances. Financial liabilities measured at amortized cost include trade and other payables.
Any gain or loss on the recognition and de-recognition of the financial assets and liabilities is included in the statement of income and expenditure for the period in which it arises.
2.12 Related party transactions
All transactions arising in the normal course of business, are conducted at arm's length at normal commercial rate on the same terms and conditions as third party transactions using valuation modes as admissible, except in rarely extreme circumstances where, subject to approval of the Board of Directors, it is in the interest of the Society to do so.
Notes to the financial statementsFor the year ended 30 June 2019
173172 2019 Annual Report
Fin
anci
al s
tate
men
t
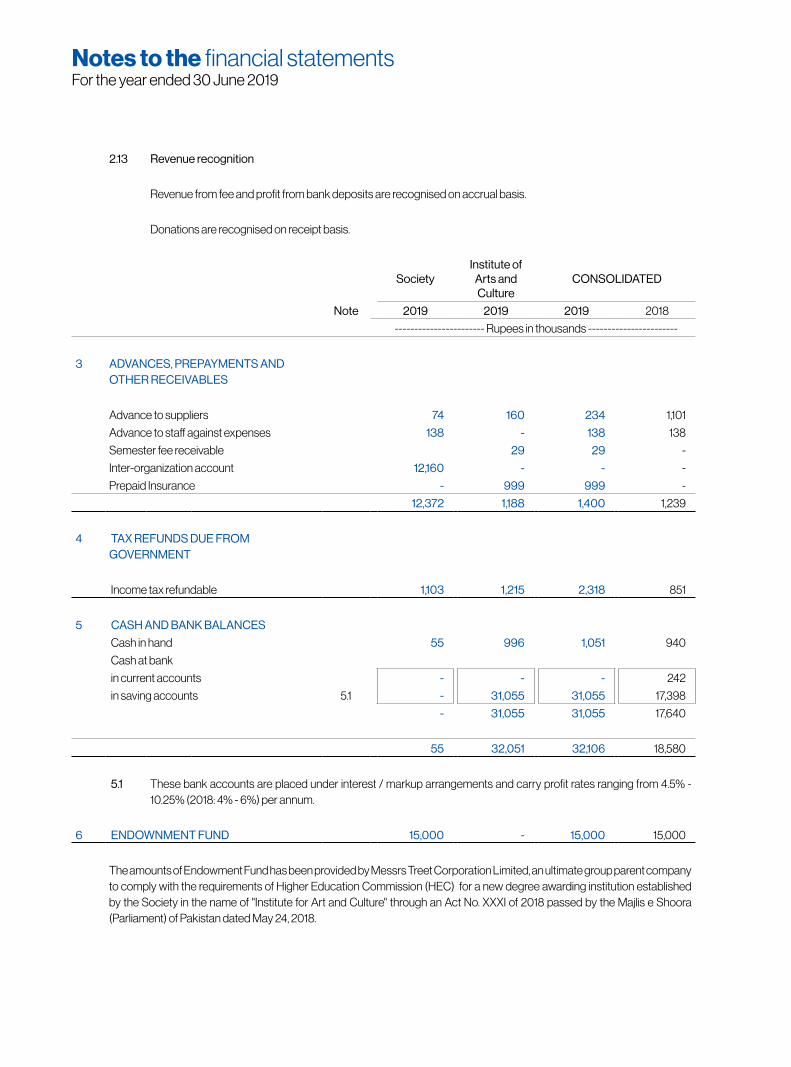
2.13 Revenue recognition
Revenue from fee and profit from bank deposits are recognised on accrual basis.
Donations are recognised on receipt basis.
Notes to the financial statementsFor the year ended 30 June 2019
Society Institute of
Arts and Culture
CONSOLIDATED
Note 2019 2019 2019 2018
----------------------- Rupees in thousands -----------------------
3 ADVANCES, PREPAYMENTS AND OTHER RECEIVABLES
Advance to suppliers 74 160 234 1,101
Advance to staff against expenses 138 - 138 138
Semester fee receivable - 29 29 -
Inter-organization account 12,160 - - -
Prepaid Insurance - 999 999 -
12,372 1,188 1,400 1,239
4 TAX REFUNDS DUE FROM GOVERNMENT
Income tax refundable 1,103 1,215 2,318 851
5 CASH AND BANK BALANCES
Cash in hand 55 996 1,051 940
Cash at bank
in current accounts - - - 242
in saving accounts 5.1 - 31,055 31,055 17,398
- 31,055 31,055 17,640
55 32,051 32,106 18,580
5.1 These bank accounts are placed under interest / markup arrangements and carry profit rates ranging from 4.5% - 10.25% (2018: 4% - 6%) per annum.
6 ENDOWNMENT FUND 15,000 - 15,000 15,000
The amounts of Endowment Fund has been provided by Messrs Treet Corporation Limited, an ultimate group parent company to comply with the requirements of Higher Education Commission (HEC) for a new degree awarding institution established by the Society in the name of "Institute for Art and Culture" through an Act No. XXXI of 2018 passed by the Majlis e Shoora (Parliament) of Pakistan dated May 24, 2018.

Notes to the financial statementsFor the year ended 30 June 2019
Society Institute of
Arts and Culture
CONSOLIDATED
2019 2019 2019 2018
----------------------- Rupees in thousands -----------------------
7 TRADE AND OTHER PAYABLES
Accrued liabilities - 167 167 1,653
Creditors for services 199 1,708 1,907 492
Income tax deducted at source payable - 890 890 432
Withholding sales tax payable 22 6 28 22
Inter-organization account - 12,160 - -
Other payables - 35 35 943
221 14,966 3,027 3,542
8 INTER ORGANIZATION ACCOUNT
The inter-organization accounts i.e. payable to the Society and receivable from the Institute in the sum of Rs. 12.160 million (2018: Rs. Nil) have been offset in the consolidated column of these financial statements.
9 CONTINGENCIES AND COMMITMENTS
9.1 There was no contingent liability of the society at the terminal date. (2018: NIL)
9.2 There was no capital commitment of the society at the terminal date. (2018: NIL)
10 FINANCIAL INSTRUMENTS - by category
The Society manages its operations mainly through donation from Treet Corporation Limited and working capital with a view to maintaining an approximate mix between various sources of finance to minimize risk. Taken as a whole, the Society's risk arising from financial instruments is limited as there is no significant exposure to price and cash flow risk in respect of such instruments.
Financial assets:
Cash and bank balances 55 32,051 32,106 18,580
Financial liabilities:
Accrued liabilities - 167 167 1,653
Creditors for services 199 1,708 1,907 492
Other Payables - 35 35 943
199 1,910 2,109 3,088
11 TRANSACTION WITH RELATED PARTIES
The related parties comprise of group parent company, associates and key management personnel. The Society in the normal course of business carries out transactions with various related parties. The outstanding balances and transactions carried out with these parties during the year have been disclosed in the relevant notes to these financial statements. There were no significant transactions carried out with related parties that require disclosure in these financial statements except donations and key management personnel's remunerations disclosed hereunder.
175174 2019 Annual Report
Fin
anci
al s
tate
men
t

Society Institute of
Arts and Culture
CONSOLIDATED
2019 2019 2019 2018
----------------------- Rupees in thousands -----------------------
Treet Corporation Limited (Group parent company)
Donation 39,660 167,517 207,177 93,723
Endowment Fund - - - 15,000
Key management personnel's remuneration 9,642 133,154 142,796 1,600
12 NUMBER OF EMPLOYEES
Number of contractual employees at year end - 127 127 83
Average number of contractual employees during the year - 120 120 81
13 DATE OF AUTHORIZATION
The Executive Council has authorized the financial statements for issuance on October 04, 2019.
14 GENERAL
14.1 Treet Corporation Limited has constitutional right to nominate 70% of the members of the executive council of the Society.
14.2 Corresponding figures have been rearranged where necessary to facilitate comparison. However, no major reclassification has been made in these financial statements.
14.3 Figures in these financial statements have been rounded off to the nearest thousand of rupees.
Syed Shahid AliChief Executive Officer
Muhammad Shafique AnjumDirector
LAHOREOctober 04, 2019
Amir ZiaChief Financial Officer
Notes to the financial statementsFor the year ended 30 June 2019

INVESTORS’INFORMATION
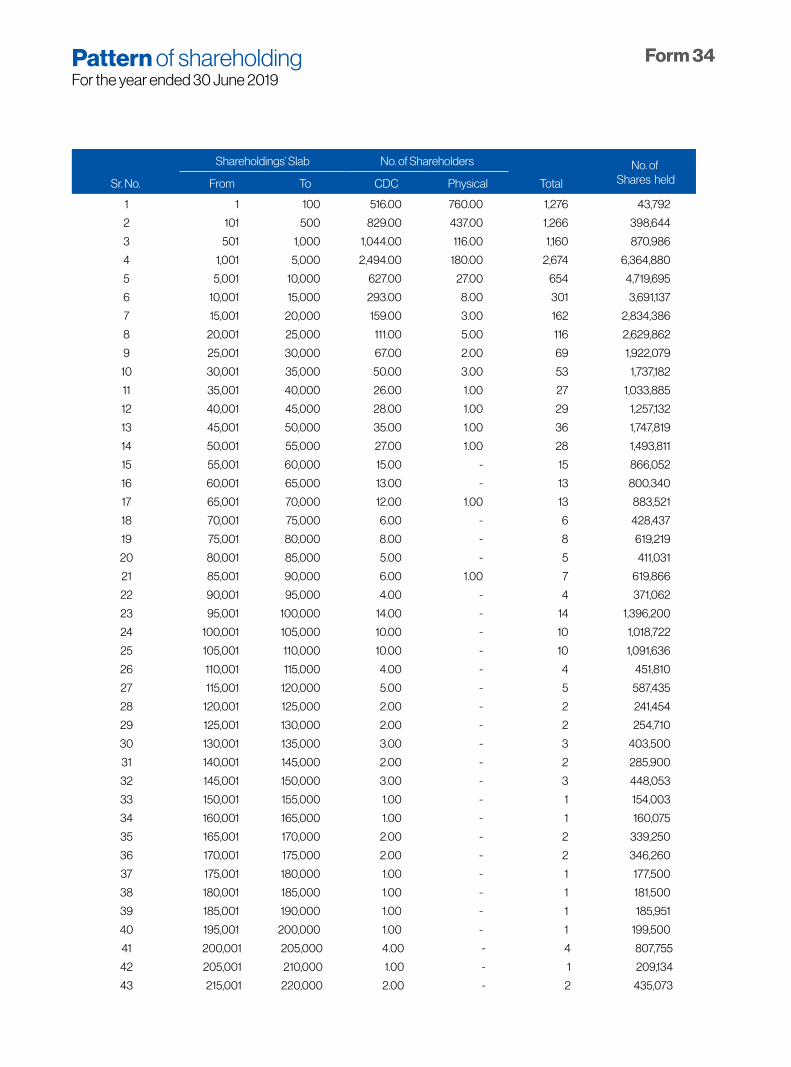
Shareholdings’ Slab No. of Shareholders No. of Shares heldSr. No. From To CDC Physical Total
1 1 100 516.00 760.00 1,276 43,792
2 101 500 829.00 437.00 1,266 398,644
3 501 1,000 1,044.00 116.00 1,160 870,986
4 1,001 5,000 2,494.00 180.00 2,674 6,364,880
5 5,001 10,000 627.00 27.00 654 4,719,695
6 10,001 15,000 293.00 8.00 301 3,691,137
7 15,001 20,000 159.00 3.00 162 2,834,386
8 20,001 25,000 111.00 5.00 116 2,629,862
9 25,001 30,000 67.00 2.00 69 1,922,079
10 30,001 35,000 50.00 3.00 53 1,737,182
11 35,001 40,000 26.00 1.00 27 1,033,885
12 40,001 45,000 28.00 1.00 29 1,257,132
13 45,001 50,000 35.00 1.00 36 1,747,819
14 50,001 55,000 27.00 1.00 28 1,493,811
15 55,001 60,000 15.00 - 15 866,052
16 60,001 65,000 13.00 - 13 800,340
17 65,001 70,000 12.00 1.00 13 883,521
18 70,001 75,000 6.00 - 6 428,437
19 75,001 80,000 8.00 - 8 619,219
20 80,001 85,000 5.00 - 5 411,031
21 85,001 90,000 6.00 1.00 7 619,866
22 90,001 95,000 4.00 - 4 371,062
23 95,001 100,000 14.00 - 14 1,396,200
24 100,001 105,000 10.00 - 10 1,018,722
25 105,001 110,000 10.00 - 10 1,091,636
26 110,001 115,000 4.00 - 4 451,810
27 115,001 120,000 5.00 - 5 587,435
28 120,001 125,000 2.00 - 2 241,454
29 125,001 130,000 2.00 - 2 254,710
30 130,001 135,000 3.00 - 3 403,500
31 140,001 145,000 2.00 - 2 285,900
32 145,001 150,000 3.00 - 3 448,053
33 150,001 155,000 1.00 - 1 154,003
34 160,001 165,000 1.00 - 1 160,075
35 165,001 170,000 2.00 - 2 339,250
36 170,001 175,000 2.00 - 2 346,260
37 175,001 180,000 1.00 - 1 177,500
38 180,001 185,000 1.00 - 1 181,500
39 185,001 190,000 1.00 - 1 185,951
40 195,001 200,000 1.00 - 1 199,500
41 200,001 205,000 4.00 - 4 807,755
42 205,001 210,000 1.00 - 1 209,134
43 215,001 220,000 2.00 - 2 435,073
Pattern of shareholdingFor the year ended 30 June 2019
Form 34

44 220,001 225,000 3.00 - 3 663,916
45 225,001 230,000 3.00 - 3 681,377
46 230,001 235,000 1.00 - 1 231,000
47 235,001 240,000 3.00 - 3 716,086
48 245,001 250,000 1.00 - 1 246,500
49 260,001 265,000 2.00 - 2 527,955
50 265,001 270,000 1.00 - 1 266,000
51 270,001 275,000 2.00 - 2 549,134
52 295,001 300,000 1.00 - 1 300,000
53 300,001 305,000 1.00 - 1 301,000
54 305,001 310,000 1.00 - 1 308,313
55 315,001 320,000 1.00 - 1 317,628
56 320,001 325,000 1.00 - 1 321,382
57 325,001 330,000 2.00 - 2 660,000
58 335,001 340,000 1.00 - 1 338,500
59 345,001 350,000 1.00 - 1 350,000
60 355,001 360,000 3.00 - 3 1,069,228
61 395,001 400,000 1.00 - 1 396,794
62 410,001 415,000 1.00 - 1 414,578
63 415,001 420,000 1.00 - 1 419,500
64 455,001 460,000 1.00 - 1 460,000
65 470,001 475,000 1.00 - 1 471,500
66 535,001 540,000 3.00 - 3 1,613,750
67 565,001 570,000 1.00 - 1 570,000
68 600,001 605,000 - 1.00 1 602,922
69 605,001 610,000 1.00 - 1 607,000
70 660,001 665,000 - 1.00 1 660,471
71 750,001 755,000 1.00 - 1 754,547
72 995,001 1,000,000 1.00 - 1 998,500
73 1,015,001 1,020,000 1.00 - 1 1,018,500
74 1,290,001 1,295,000 1.00 - 1 1,292,500
75 1,700,001 1,705,000 1.00 - 1 1,703,108
76 2,275,001 2,280,000 1.00 - 1 2,277,000
77 2,655,001 2,660,000 - 1.00 1 2,658,577
78 3,440,001 3,445,000 1.00 - 1 3,441,327
79 3,885,001 3,890,000 1.00 - 1 3,887,950
80 4,785,001 4,790,000 1.00 - 1 4,788,546
81 7,715,001 7,720,000 1.00 - 1 7,718,995
82 8,340,001 8,345,000 1.00 - 1 8,344,644
83 11,675,001 1,680,000 1.00 - 1 11,679,663
84 12,050,001 12,055,000 1.00 - 1 12,053,315
85 43,645,001 43,650,000 1.00 - 1 43,648,997
6,499 1,550 8,049 165,450,942
Shareholdings’ Slab No. of Shareholders No. of Shares heldSr. No. From To CDC Physical Total
179178 2019 Annual Report
Fin
anci
al s
tate
men
t

NAME & CATEGORY WISE DETAILS IN ACCORDANCE WITH THE CCG 2012
Name of Shareholders StatusCDC*
ShareholdersNo. of Shares
in CDC*Physical
ShareholdersNo. of Shares in
Physical
Total Share-holders
Total No. of Shares Held
%
Syed Shahid Ali Director 3 51,937,992 1 2,658,577 4 54,596,569 33.00%
Syed Sheharyar Ali Director 2 12,227,915 - - 2 12,227,915 7.39%
Dr. Mrs. Niloufer Mahdi Director 1 4,788,546 1 660,471 2 5,449,017 3.29%
Saulat Said Director 2 10,559 - - 2 10,559 0.01%
Imran Azim Director - Nominee NIT - - - - - - 0.00%
Munir Karim Bana Director - Nominee Loads Limited 2 221,673 - - 2 221,673 0.13%
Dr. Salman Faridi Director 1 110 - - 1 110 0.00%
Shafique Anjum Director 1 47,630 1 27,555 2 75,185 0.05%
Loads Limited Associated Company 2 8,741,438 - - 2 8,741,438 5.28%
IGI Inurance Limited Associated Company - - - - - - 0.00%
National Bank of Pakistan / NIT Government Institution 5 15,491,096 - - 5 15,491,096 9.36%
Foreign Company 4 977,900 - - 4 977,900 0.59%
Bank, DFI, Insurance 7 4,344,846 1 129 8 4,344,975 2.63%
Joint Stock Companies 34 1,033,841 2 10,424 36 1,044,265 0.63%
Investment Companies 52 4,931,788 3 610 55 4,932,398 2.98%
Public Sector Government Institution 1 274,134 1 51,767 2 325,901 0.20%
Modaraba 3 179,667 - - 3 179,667 0.11%
Executive 5 270,793 - - 5 270,793 0.16%
Company Secretary 2 11,000 - - 2 11,000 0.01%
Others 30 2,012,791 1 2,097 31 2,014,888 1.22%
Individual 6,342 52,480,924 1,539 2,054,669 7,881 54,535,593 32.96%
6,499 159,984,643 1,550 5,466,299 8,049 165,450,942 100.00%
*based on no. of accounts in CDC / folios
SHAREHOLDERS HOLDING 5% SHARES OR MORE
Sr. No. Name of Shareholder Shares held
1 Syed Shahid Ali 54,596,569
2 National Bank of Pakistan 15,491,096
3 Syed Sheharyar Ali 12,227,915
4 Loads Limited 8,741,438
Intimation under Clause (I) of sub-regulation (XVI) of Regulation 35 of Chapter (XI) of Listing Regulations of Pakistan Stock Exchange during the year.
Opening Balance
30-06-2018Through TCLTC* Conversion Market Trade : Buy/(Sell) Shares under ESOS
Closing Balance
(30/06/2019)
No. of Shares No. of Shares Conversion
Price*No. of Shares Market Price No. of Shares ESOS Price** No. of Shares
Syed Shahid Ali 45,385,542 1,173,340 59.14 7,044,187 15.75 993,500 20.00 54,596,569
Syed Sheharyar Ali 12,026,428 26,887 59.14 174,600 20.00 12,227,915
Dr. Mrs. Niloufer Mahdi 5,441,842 7,175 59.14 5,449,017
Saulat Said 9,859 700 59.14 10,559
Munir Karim Bana 196,613 25,060 59.14 221,673
Shafique Anjum 75,185 75,185
Pattern of shareholdingFor the year ended 30 June 2019
Form 34
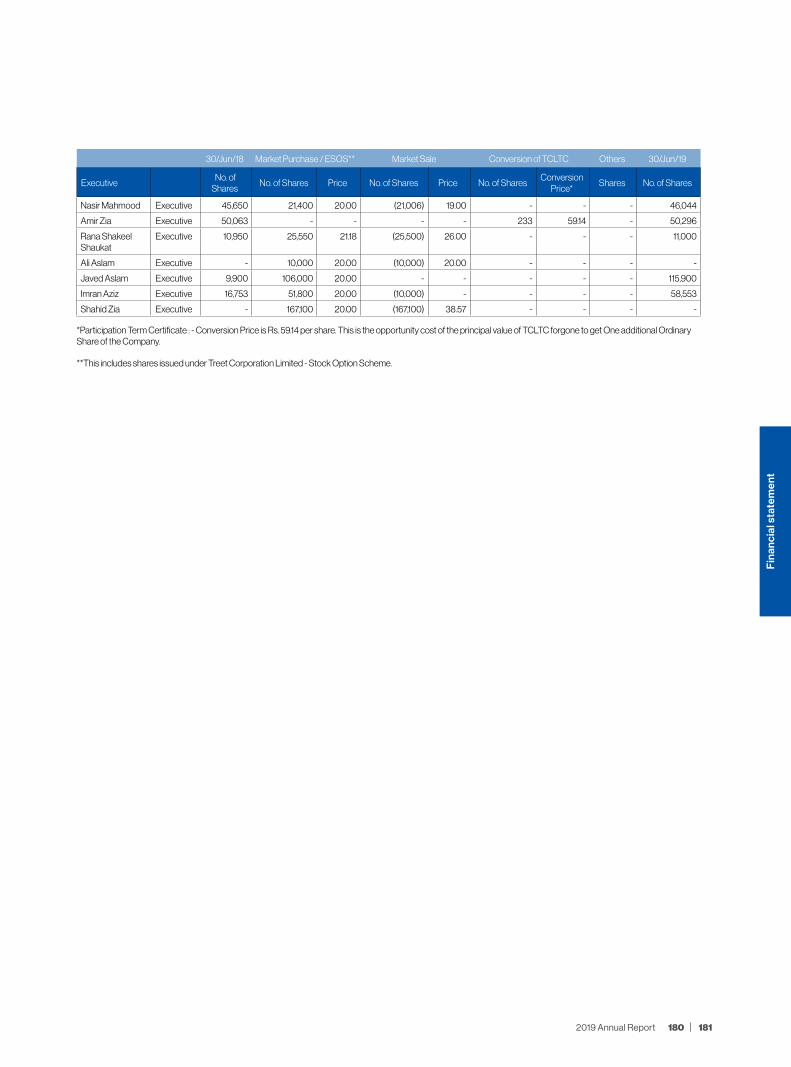
30/Jun/18 Market Purchase / ESOS** Market Sale Conversion of TCLTC Others 30/Jun/19
Executive No. of
Shares No. of Shares Price No. of Shares Price No. of Shares
Conversion Price*
Shares No. of Shares
Nasir Mahmood Executive 45,650 21,400 20.00 (21,006) 19.00 - - - 46,044
Amir Zia Executive 50,063 - - - - 233 59.14 - 50,296
Rana Shakeel Shaukat
Executive 10,950 25,550 21.18 (25,500) 26.00 - - - 11,000
Ali Aslam Executive - 10,000 20.00 (10,000) 20.00 - - - -
Javed Aslam Executive 9,900 106,000 20.00 - - - - - 115,900
Imran Aziz Executive 16,753 51,800 20.00 (10,000) - - - - 58,553
Shahid Zia Executive - 167,100 20.00 (167,100) 38.57 - - - -
*Participation Term Certificate : - Conversion Price is Rs. 59.14 per share. This is the opportunity cost of the principal value of TCLTC forgone to get One additional Ordinary Share of the Company.
**This includes shares issued under Treet Corporation Limited - Stock Option Scheme.
181180 2019 Annual Report
Fin
anci
al s
tate
men
t
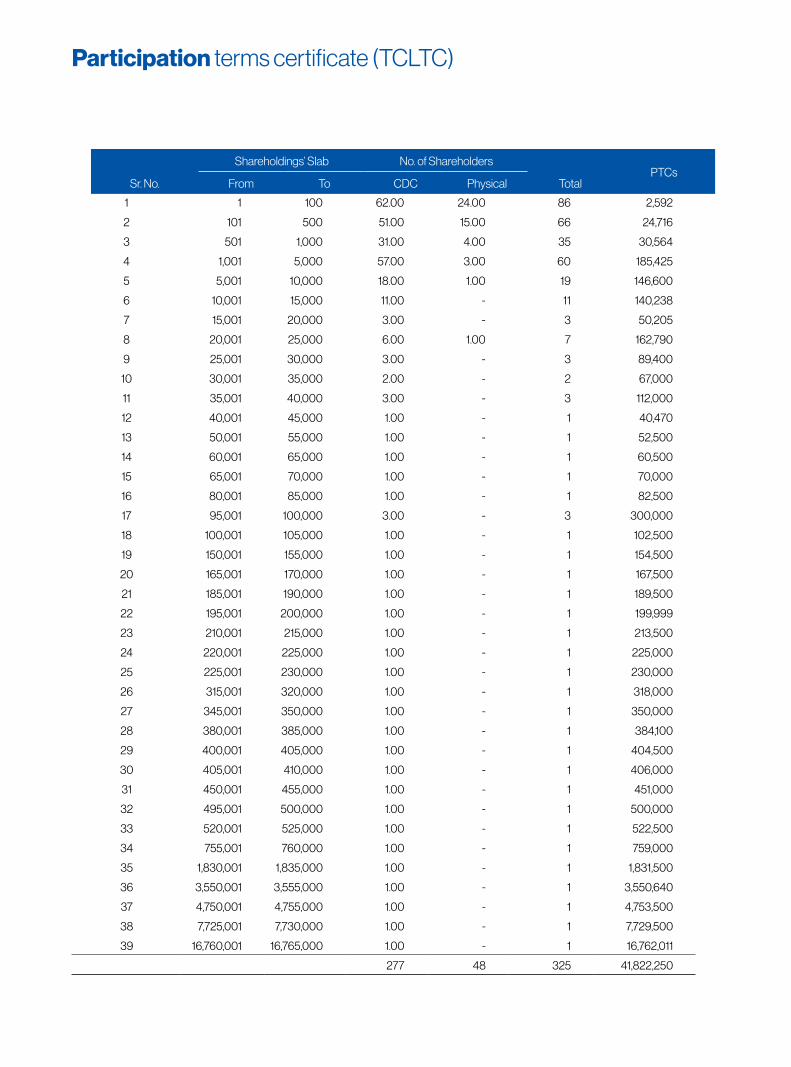
1 1 100 62.00 24.00 86 2,592
2 101 500 51.00 15.00 66 24,716
3 501 1,000 31.00 4.00 35 30,564
4 1,001 5,000 57.00 3.00 60 185,425
5 5,001 10,000 18.00 1.00 19 146,600
6 10,001 15,000 11.00 - 11 140,238
7 15,001 20,000 3.00 - 3 50,205
8 20,001 25,000 6.00 1.00 7 162,790
9 25,001 30,000 3.00 - 3 89,400
10 30,001 35,000 2.00 - 2 67,000
11 35,001 40,000 3.00 - 3 112,000
12 40,001 45,000 1.00 - 1 40,470
13 50,001 55,000 1.00 - 1 52,500
14 60,001 65,000 1.00 - 1 60,500
15 65,001 70,000 1.00 - 1 70,000
16 80,001 85,000 1.00 - 1 82,500
17 95,001 100,000 3.00 - 3 300,000
18 100,001 105,000 1.00 - 1 102,500
19 150,001 155,000 1.00 - 1 154,500
20 165,001 170,000 1.00 - 1 167,500
21 185,001 190,000 1.00 - 1 189,500
22 195,001 200,000 1.00 - 1 199,999
23 210,001 215,000 1.00 - 1 213,500
24 220,001 225,000 1.00 - 1 225,000
25 225,001 230,000 1.00 - 1 230,000
26 315,001 320,000 1.00 - 1 318,000
27 345,001 350,000 1.00 - 1 350,000
28 380,001 385,000 1.00 - 1 384,100
29 400,001 405,000 1.00 - 1 404,500
30 405,001 410,000 1.00 - 1 406,000
31 450,001 455,000 1.00 - 1 451,000
32 495,001 500,000 1.00 - 1 500,000
33 520,001 525,000 1.00 - 1 522,500
34 755,001 760,000 1.00 - 1 759,000
35 1,830,001 1,835,000 1.00 - 1 1,831,500
36 3,550,001 3,555,000 1.00 - 1 3,550,640
37 4,750,001 4,755,000 1.00 - 1 4,753,500
38 7,725,001 7,730,000 1.00 - 1 7,729,500
39 16,760,001 16,765,000 1.00 - 1 16,762,011
277 48 325 41,822,250
Shareholdings’ Slab No. of ShareholdersPTCs
Sr. No. From To CDC Physical Total
Participation terms certificate (TCLTC)

Name of Shareholders Status CDC CDC Physical Physical TOTAL TOTAL %
Syed Shahid Ali Director 1 16,762,011 - - 1 16,762,011 40.08%
Syed Sheharyar Ali Director 1 384,100 - - 1 384,100 0.92%
Dr. Mrs. Niloufer Mahdi Director 1 102,500 - - 1 102,500 0.25%
Dr. Salman Faridi Director - - - - - - 0.00%
Imran Azim Director - Nominee NIT - - - - - - 0.00%
Munir Karim Bana Director - Nominee Loads Limited 2 358,000 - - 2 358,000 0.86%
Saulat Said Director 1 25,000 - - 1 25,000 0.06%
Shafique Anjum Director - - - - - - 0.00%
Loads Limited Associated Company 1 1,831,500 - - 1 1,831,500 4.38%
IGI Inurance Limited Associated Company - - - - - - 0.00%
NIT Government Institution 2 11,280,140 - - 2 11,280,140 26.97%
Foreign Company - - - - - - 0.00%
Bank, DFI, Insurance - - - - - - 0.00%
Joint Stock Companies 3 727,000 - - 3 727,000 1.74%
Investment Companies 3 271,420 - - 3 271,420 0.65%
Public Sector - - - - - - 0.00%
Modaraba - - - - - - 0.00%
Executive 1 3,334 - - 1 3,334 0.01%
Company Secretary - - - - - - 0.00%
Others 8 1,440,499 - - 8 1,440,499 3.44%
Individual 325 8,594,370 48 42,376 373 8,636,746 20.65%
349 41,779,874 48 42,376 397 41,822,250 100.00%
Physical CDC Total
No. of Shares Outstanding 42,376.00 41,779,874 41,822,250
Shares held by Directors - 17,273,611 17,273,611
Shares held by Associates - 2,189,500 2,189,500
Shares held by Government Institutions - 11,280,140 11,280,140
Shares held by Foreign Companies - - -
Others 42,376 11,036,623 11,078,999
42,376 41,779,874 41,822,250
Free Float of Shares as on June 30, 2015 11,036,623 11,036,623
% of Free Float 26.42% 26.39%
Free Float
183182 2019 Annual Report
Fin
anci
al s
tate
men
t
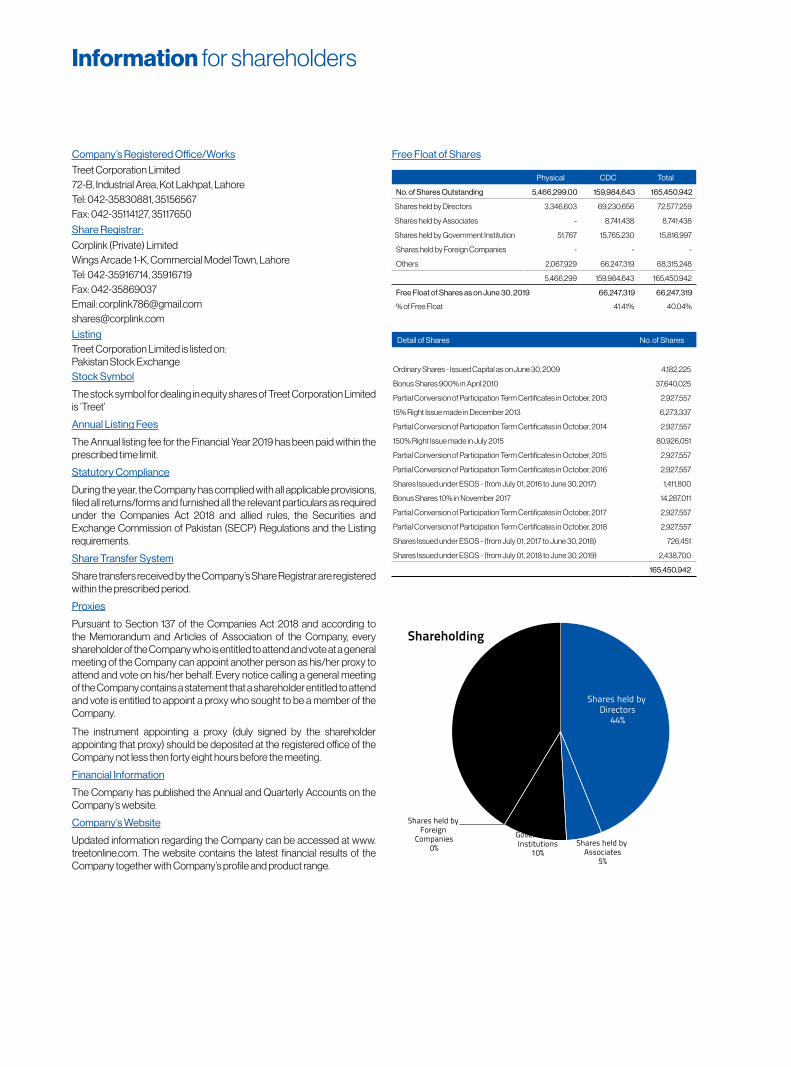
Company’s Registered Office/Works
Treet Corporation Limited72-B, Industrial Area, Kot Lakhpat, LahoreTel: 042-35830881, 35156567Fax: 042-35114127, 35117650
Share Registrar:
Corplink (Private) LimitedWings Arcade 1-K, Commercial Model Town, LahoreTel: 042-35916714, 35916719Fax: 042-35869037Email: [email protected]@corplink.com
ListingTreet Corporation Limited is listed on:Pakistan Stock Exchange Stock Symbol
The stock symbol for dealing in equity shares of Treet Corporation Limited is ‘Treet’
Annual Listing Fees
The Annual listing fee for the Financial Year 2019 has been paid within the prescribed time limit.
Statutory Compliance
During the year, the Company has complied with all applicable provisions, filed all returns/forms and furnished all the relevant particulars as required under the Companies Act 2018 and allied rules, the Securities and Exchange Commission of Pakistan (SECP) Regulations and the Listing requirements.
Share Transfer System
Share transfers received by the Company’s Share Registrar are registered within the prescribed period.
Proxies
Pursuant to Section 137 of the Companies Act 2018 and according to the Memorandum and Articles of Association of the Company, every shareholder of the Company who is entitled to attend and vote at a general meeting of the Company can appoint another person as his/her proxy to attend and vote on his/her behalf. Every notice calling a general meeting of the Company contains a statement that a shareholder entitled to attend and vote is entitled to appoint a proxy who sought to be a member of the Company.
The instrument appointing a proxy (duly signed by the shareholder appointing that proxy) should be deposited at the registered office of the Company not less then forty eight hours before the meeting.
Financial Information
The Company has published the Annual and Quarterly Accounts on the Company’s website.
Company’s Website
Updated information regarding the Company can be accessed at www.treetonline.com. The website contains the latest financial results of the Company together with Company’s profile and product range.
Free Float of Shares
Physical CDC Total
No. of Shares Outstanding 5,466,299.00 159,984,643 165,450,942
Shares held by Directors 3,346,603 69,230,656 72,577,259
Shares held by Associates - 8,741,438 8,741,438
Shares held by Government Institution 51,767 15,765,230 15,816,997
Shares held by Foreign Companies - - -
Others 2,067,929 66,247,319 68,315,248
5,466,299 159,984,643 165,450,942
Free Float of Shares as on June 30, 2019 66,247,319 66,247,319
% of Free Float 41.41% 40.04%
Detail of Shares No. of Shares
Ordinary Shares - Issued Capital as on June 30, 2009 4,182,225
Bonus Shares 900% in April 2010 37,640,025
Partial Conversion of Participation Term Certificates in October, 2013 2,927,557
15% Right Issue made in December 2013 6,273,337
Partial Conversion of Participation Term Certificates in October, 2014 2,927,557
150% Right Issue made in July 2015 80,926,051
Partial Conversion of Participation Term Certificates in October, 2015 2,927,557
Partial Conversion of Participation Term Certificates in October, 2016 2,927,557
Shares Issued under ESOS - (from July 01, 2016 to June 30, 2017) 1,411,800
Bonus Shares 10% in November 2017 14,287,011
Partial Conversion of Participation Term Certificates in October, 2017 2,927,557
Partial Conversion of Participation Term Certificates in October, 2018 2,927,557
Shares Issued under ESOS - (from July 01, 2017 to June 30, 2018) 726,451
Shares Issued under ESOS - (from July 01, 2018 to June 30, 2019) 2,438,700
165,450,942
Shares held by Directors
44%
Shares held by Associates
5%
Shares held by Government Institutions
10%
Shares held by Foreign
Companies0%
Others41%
Shareholding
Information for shareholders

I/We ___________________________________________________________________________________
of________________________ being a Member of Treet Corporation Limited and holder(s) of
_________________________Ordinary Shares as per Share Register Folio No. __________________________
For beneficial owners as per CDC List
CDC Participant I.D. No. ________________ Sub Account No. __________________
CNIC No. Passport No. _____________________
hereby appoint Mr./Mrs./Miss.______________________________________of__________________person or failing him/her Miss/
Mrs/ Mr. _________________________________________
of _________________ another person on my / our proxy to attend and vote for me / us and my /our behalf at Annual General
Meeting of the Company to be held on Monday, October 28, 2019, at 11:00 A.M. and at every adjournment thereof, if any.
(Signature should agree with the specimen
signature registered with the Company)
Signed this _________ day of October 2019 Signature of Shareholder______________________
Signature of Proxy___________________________
1. WITNESS
Signature: ______________________________
Name: _________________________________
Address: _______________________________
_______________________________________
CNIC No.
or Passport No.______________________
Please affix Rupees Five Revenue Stamp
1. This Proxy Form. duly completed and signed, must be received at above mentioned address the Registered Office of the Company, not less than 48 hours before the time of holding the meeting.
2. If a member appoints more than one proxy and more than one instruments of proxy are deposited by a member with the Company, all such instruments of proxy shall be rendered invalid.
3. For CDC Account Holders / Corporate Entities In addition to the above the following requirements have to be met
i. Attested copies of CNIC or the passport of the beneficial
owners and the proxy shall be provided with the proxy forms.ii. The proxy shall produce his original CNIC or original
passport at the time of the meeting.
iii. In case of a corporate entity, the Board of Directors resolution/power of attorney with specimen signature shall be submitted (unless it has been provided earlier) alongwith proxy form to the Company.
2. WITNESS
Signature: ______________________________
Name: _________________________________
Address: _______________________________
_______________________________________
CNIC No.
or Passport No.______________________
Form of proxy
185184 2019 Annual Report
Fin
anci
al s
tate
men
t
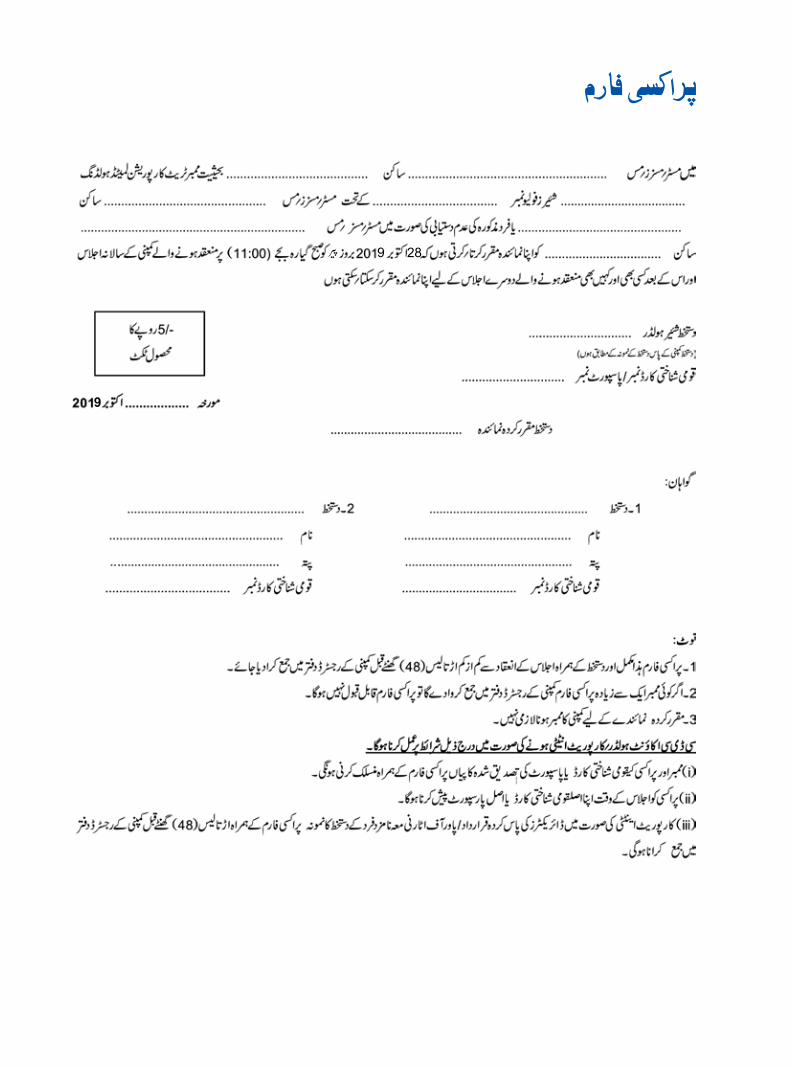


2019 Annual Report
Treet Corporation Limited
“Today’s Accomplishments
were Yesterday’s Impossibilites”
TREET GROUPOF COMPANIES
Head O�ce72-B, Industrial Area Kot Lakhpat,Lahore-54770, PakistanPhone +92 42 5830881, 35156567, 35122296Fax +92 42 35114127, 35836770www.treetonline.com
Robert H. Schuller