More Public Control and Proper Incentives for Investment ... · DB 1 More Public Control and Proper...
12
DB 1 More Public Control and Proper Incentives for Investment Buridan’s Donkey in the Railways? Deutsche Bahn AG Joachim Fried Group Representative for European Affairs, Competition and Regulatory Affairs Berlin, 5 October 2007
Transcript of More Public Control and Proper Incentives for Investment ... · DB 1 More Public Control and Proper...
DB1
More Public Control and Proper Incentives for Investment
Buridan’s Donkey in the Railways?
Deutsche Bahn AGJoachim Fried
Group Representative for European Affairs, Competition and Regulatory Affairs
Berlin, 5 October 2007
DB2
74.2
5.4
433
1.3
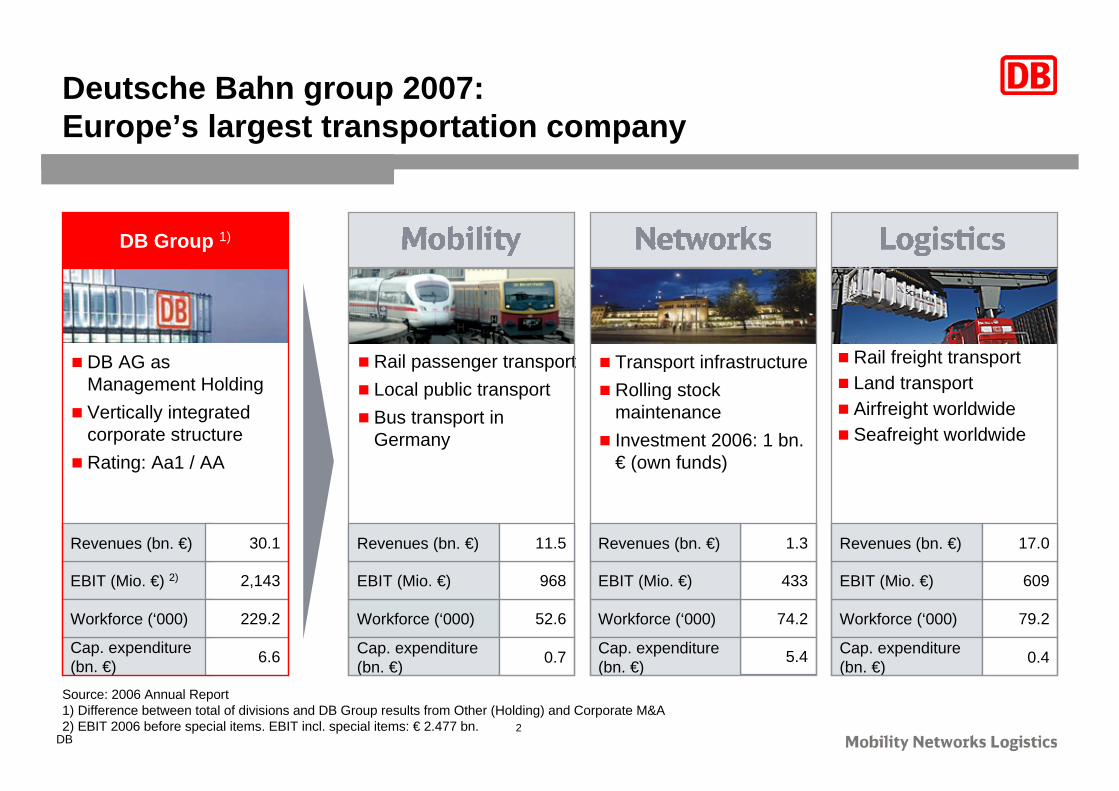
Cap. expenditure (bn. €) 6.6
EBIT (Mio. €) 2) 2,143
Workforce (‘000) 229.2
Deutsche Bahn group 2007:Europe’s largest transportation company
DB AG as Management HoldingVertically integrated corporate structureRating: Aa1 / AA
Workforce (‘000) 52.6
Rail passenger transportLocal public transportBus transport in Germany
Cap. expenditure (bn. €) 0.7
EBIT (Mio. €) 968
Workforce (‘000)
Transport infrastructureRolling stock maintenanceInvestment 2006: 1 bn. € (own funds)
Cap. expenditure(bn. €)
EBIT (Mio. €)
Workforce (‘000) 79.2
Rail freight transportLand transportAirfreight worldwideSeafreight worldwide
Cap. expenditure (bn. €) 0.4
EBIT (Mio. €) 609
Revenues (bn. €) 30.1 Revenues (bn. €) 11.5 Revenues (bn. €) Revenues (bn. €) 17.0
DB Group 1)
Source: 2006 Annual Report1) Difference between total of divisions and DB Group results from Other (Holding) and Corporate M&A2) EBIT 2006 before special items. EBIT incl. special items: € 2.477 bn.

DB3
Rail freight transport achieved higher growth than the overall market in 2006
The overall market again achieved substantial growth in 2006 (+7.0%)
Rail booked the highest growth rate of 12.0%
The dominant road haulage sector also booked clear growth of 8.0 % in 2006
Traffic performance by inland shipping was down
Growth of approx. 4.5% is forecast for rail for 2007, which also means a further improvement in the modal split.
Source: Federal Statistical Office and DB data1) Total market (rail, road, inland shipping, pipelines)2) Road = inclusive of local transports by German trucks, exclusive of cabotage transports by foreign trucks in Germany
2006 estimate
2005
Freight transport in Germanyyear-on-year change in per cent; basis: traffic performance
Total rail 3.8
Inland shipping 0.7
Total market1) 3.1
Road2) 3.3
DB
55.4Other railways
12.0
-0.2
7.0
8.0
28.0
9.5- 1.7
DB4
2006 estimate
Air transport (inner-German) 2.5
Private cartransport -1.5
Public road transport - 0.5
3.3Total rail
Total passenger transport -1.0
Other railways
3.3DB
31.1
4.1
-1.7
0.9
-1.0
3.1
25.0
3.8
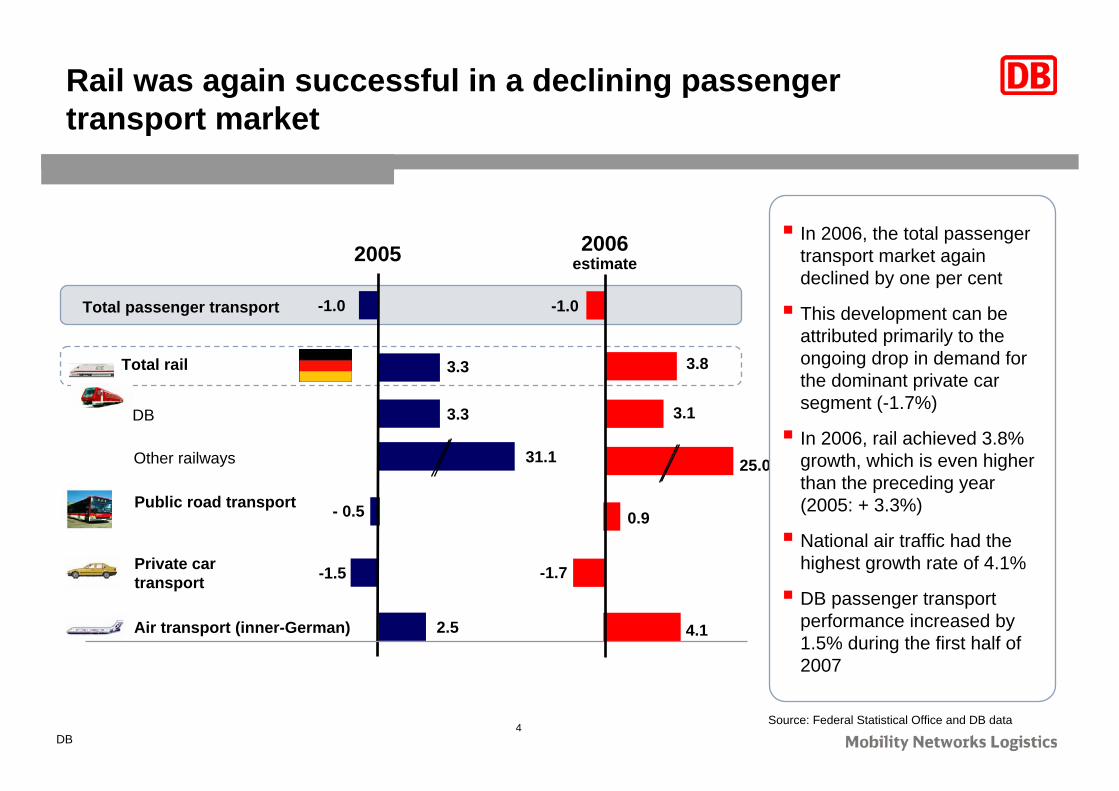
Rail was again successful in a declining passenger transport market
In 2006, the total passenger transport market again declined by one per cent
This development can be attributed primarily to the ongoing drop in demand for the dominant private car segment (-1.7%)
In 2006, rail achieved 3.8% growth, which is even higher than the preceding year (2005: + 3.3%)
National air traffic had the highest growth rate of 4.1%
DB passenger transport performance increased by 1.5% during the first half of 2007
2005
Source: Federal Statistical Office and DB data
DB5
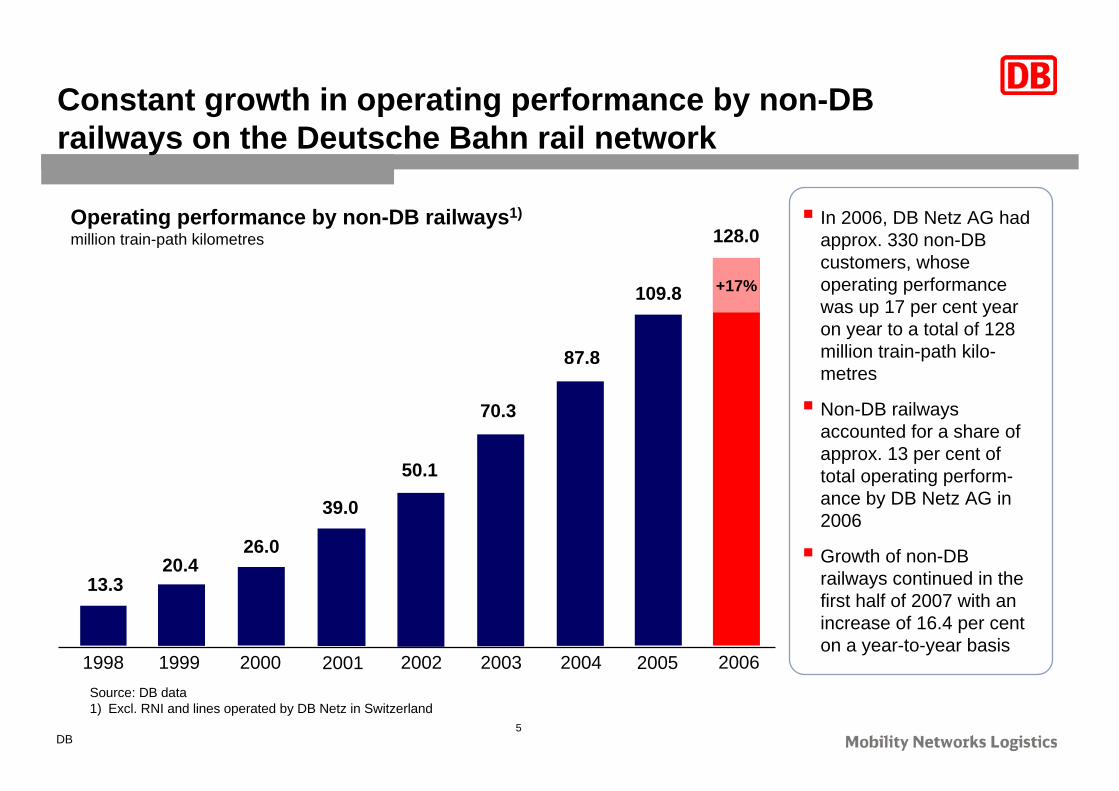
Constant growth in operating performance by non-DB railways on the Deutsche Bahn rail network
1998 1999 2000 2001 2002 2003 2004
20.413.3
26.0
39.0
50.1
70.3
87.8
2005
109.8
128.0
+17%
2006
Operating performance by non-DB railways1)
million train-path kilometresIn 2006, DB Netz AG had approx. 330 non-DB customers, whose operating performance was up 17 per cent year on year to a total of 128 million train-path kilo-metres
Non-DB railways accounted for a share of approx. 13 per cent of total operating perform-ance by DB Netz AG in 2006
Growth of non-DB railways continued in the first half of 2007 with an increase of 16.4 per cent on a year-to-year basis
Source: DB data1) Excl. RNI and lines operated by DB Netz in Switzerland
DB6
Rail freight transport – competitors again achieved substantial increases in their market shares in 2006
2002 2003 2004
4.8%6.9%
9.6%
3.977.2
5.979.2
8.883.181.1
85.1
91.9
2005
14.4%
13.781.7
95.4
Deutsche Bahn other freight railways
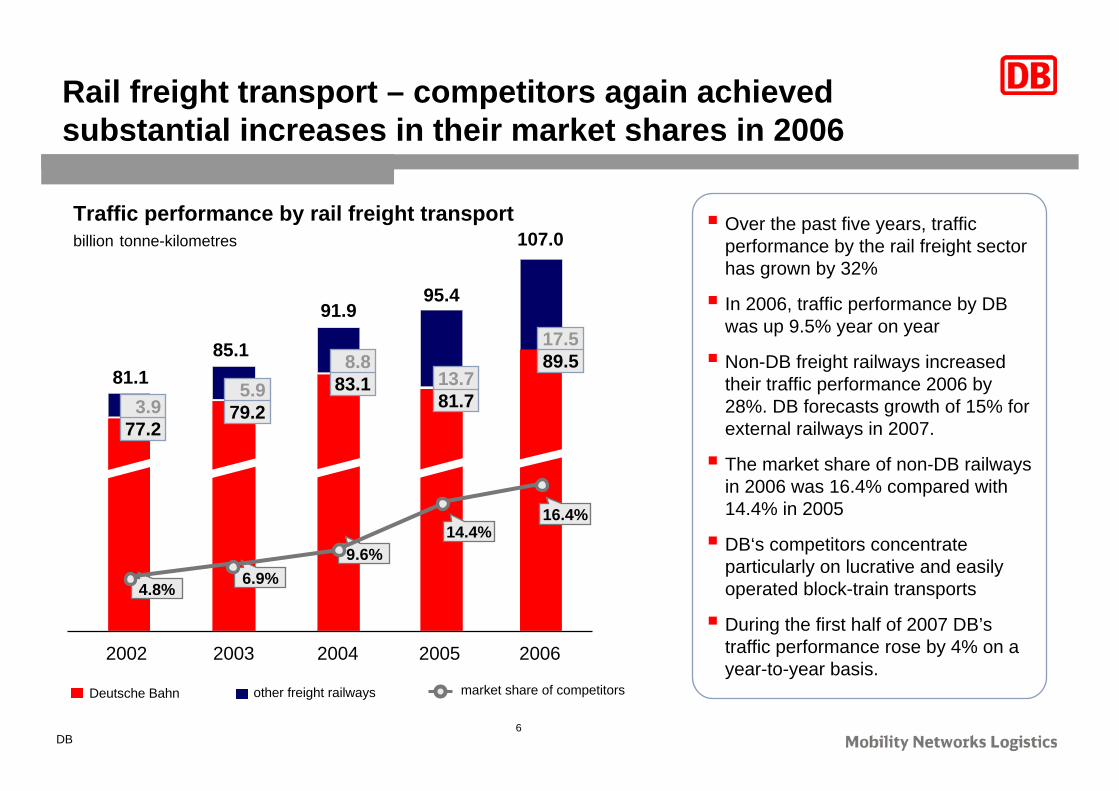
Traffic performance by rail freight transportbillion tonne-kilometres
Over the past five years, traffic performance by the rail freight sector has grown by 32%
In 2006, traffic performance by DB was up 9.5% year on year
Non-DB freight railways increased their traffic performance 2006 by 28%. DB forecasts growth of 15% for external railways in 2007.
The market share of non-DB railways in 2006 was 16.4% compared with 14.4% in 2005
DB‘s competitors concentrate particularly on lucrative and easily operated block-train transports
During the first half of 2007 DB’s traffic performance rose by 4% on a year-to-year basis.
17.589.5
107.0
16.4%
2006
market share of competitors

DB7
Regional transport – DB competitors have substantially expanded their market share
2002 2003 2004 2005
619 628 63260452
55284
54975
55361
558
Deutsche Bahn Market share of competitorsCompetitors
8.6% 9.9% 11.9% 13.2%
Train services ordered for regional transportmillion train-kilometres
2006
97540
637
15.2%
The cutbacks in regionalisation funds have not yet affected the volumes ordered by the Federal Laender
In 2006, the Federal Laender ordered 0.7% more train-kilometres than in 2005 – more than ever before
Train services provided by DB competitors have doubled over the last five years
in 2006, the market share of DB competitors amounted to 15.2%
In 2006, DB competitors achieved a 25 per cent increase in traffic performance. According to a DB forecast, their growth is expected to rise again by approx. 10% in 2007.
In the first half of 2007, DB in-creased its traffic performance by 2.4 per cent on a year-to-year basis
Source: DB data

DB8
DB long-distance business unit also increased traffic performance in 2006
Long-distance traffic performancebillion passenger-kilometres
33.6
2005
33.2
2002
31.6
2003
32.3
2004
Traffic performance by the long-distance BU rose by 2.4 per cent in 2006
Growth was due to improved products, additional traffic for the 2006 World Cup 2006 and attractive special offers
There are still only three competitors who operate regular long-distance services
Their traffic performance rose to an estimated 70 million pkm, but their market share is still less than one per cent
Market entry is difficult due to high investment costs and low margins
Traffic performance continued to grow in the first half of 2007 with an increase of 0.2 per cent compared to the first half of 2006
34.5
2006
Traffic performance by long-distance business unit (incl.night and motorail services)
DB9
First example: Danger of over-regulation through untuned implementation of price cap
In the course of the privatisation of Deutsche Bahn, the regulator (Bundesnetzagentur) proposed to implement a so-called “incentive regulation” of the German railway infrastructure.
On the other hand, the privatisation law stipulates a contractual agreement (“LuFV”) that guarantees high infrastructure quality and incentives for an efficient provision of infrastructure.
An access price regulation that does not take full account of this contract would have perverse effects.
If the charges for the use of infrastructure that do not suffice to cover full costs to date should be regulated downwards, underfunding of the infrastructure and quality problems will result.
Too low infrastructure prices constrain the infrastructure manager’s ability to invest and maintain a high quality.

DB10
Second example: Too extensive regulation
If the regulator forces a firm to provide external rail-way undertakings access – under equal conditions – to facilities that could in principle be duplicated, he lowers the incentive to invest.
A firm investing in such a facility faces three problems:
free-riding competitors use the facility to their benefit while the former firm bears all risk associated with the investment
Optimisation of the sequences of operation is impeded.
Bureaucracy costs both for the regulator and the firm
Underinvestment to the disadvantage of all railway undertakings

DB11
Third example: Regulation causes inflexibility
Renewals usually come along with nuisance for the railway undertakings.
To reduce this to a minimum, measures must be announced several month in advance.
On the other hand, railway undertakings depend on a high quality of the network .
In order to increase the quality of the railway infrastructure without unnecessary delays, static terms are not adequate.
A regulation that reduces the flexi-bility of the infrastructure manager will lower the quality of the network and impede the willingness to invest.

DB12
Conclusion: Need to trust markets where they can work
Admittedly, the hypotheses I made regarding the role of regulation in the railway markets are somewhat provocative.
On the other hand, we are planning to use private capital to develop and further improve our infrastructure and transport services. I am concerned that over-regulation could damage the attractiveness of the DB group for investors.
In these discussions, the benefits of a more market-oriented operation of the infrastructure are under-estimated, and the benefits of regulation are over-estimated.
As a conclusion, I strongly advocate to enhance the regulatory framework only with a strong sense of proportion:
The two stacks of hay have not the same size!