MORE for Banks - web - cra.modefinance.com the CAMEL approach has been used. ... MORE for Banks An...
20
1 di 20 modefinance srl IT01168840328 AREA Science Park, Padriciano 99 34149 Trieste, Italy Contacts T.+39 040 3755337 F.+39 040 3756741 [email protected] July, 2017 MORE for Banks MORE for Banks Scoring Methodology & Validation modefinance srl IT01168840328 AREA Science Park, Padriciano 99 34149 Trieste, Italy Contacts T.+39 040 3755337 F.+39 040 3756741 [email protected]
Transcript of MORE for Banks - web - cra.modefinance.com the CAMEL approach has been used. ... MORE for Banks An...

1 di 20
modefinance srl IT01168840328 AREA Science Park, Padriciano 99 34149 Trieste, Italy
Contacts T.+39 040 3755337 F.+39 040 3756741 [email protected]
July, 2017 MORE for Banks
MORE for Banks
Scoring Methodology & Validation
modefinance srl IT01168840328 AREA Science Park, Padriciano 99 34149 Trieste, Italy
Contacts T.+39 040 3755337 F.+39 040 3756741 [email protected]

2 di 20
modefinance srl IT01168840328 AREA Science Park, Padriciano 99 34149 Trieste, Italy
Contacts T.+39 040 3755337 F.+39 040 3756741 [email protected]
July, 2017 MORE for Banks
Table of contents
1. modefinance Bank Creditworthiness Analysis: The Multi Objective Rating Evaluation Model (MORE) for Banks - version 1.0 ............................................................................................................... 3
1.1 Overview ................................................................................................................................ 3
2. MORE Rating for Banks - vision ................................................................................................ 4 .................................................................................................................................................. 5
3. MORE Model ......................................................................................................................... 53.1 Overview ............................................................................................................................... 63.2 The ratios ............................................................................................................................. 6
Categories for the financial ratios ................................................................................................... 83.3 Fuzzy Logic ........................................................................................................................... 9 ................................................................................................................................................. 10
4. The Core of MORE ................................................................................................................ 11
5. MORE for Banks .................................................................................................................. 125.1 The risk class ........................................................................................................................ 125.2 The confidence level ............................................................................................................ 125.3 The opinion about the ratios ................................................................................................. 13
6. Validation ........................................................................................................................... 136.1 Testing sample ...................................................................................................................... 136.2 Discriminant power analysis .................................................................................................. 146.3 Discriminating power by geographical area ............................................................................ 166.4 Bankruptcy dynamics ........................................................................................................... 18
Disclaimer .............................................................................................................................. 20
3 di 20
modefinance srl IT01168840328 AREA Science Park, Padriciano 99 34149 Trieste, Italy
Contacts T.+39 040 3755337 F.+39 040 3756741 [email protected]
July, 2017 MORE for Banks
1. modefinance Bank Creditworthiness Analysis: The Multi Objective Rating Evaluation Model (MORE) for Banks - version 1.0
1.1 Overview The Multi Objective Rating Evaluation (MORE) model has been developed by modefinance in order to evaluate the level of creditworthiness of a financial institution by using data included in the financial statements. It rates financial institutions based on how well they can meet their financial commitments.
The MORE evaluation has been developed by modefinance and it represents a snapshot of a bank’s financial health.
The MORE evaluation is divided into four macro-categories:
• Healthy Banks
• Balanced Banks
• Vulnerable Banks
• Risky Banks
Within these four evaluation categories there are ten subclasses, for more details see the table below:

4 di 20
modefinance srl IT01168840328 AREA Science Park, Padriciano 99 34149 Trieste, Italy
Contacts T.+39 040 3755337 F.+39 040 3756741 [email protected]
July, 2017 MORE for Banks
Rating Category
MORE Rating
Assessment
Healthy Banks AAA AA A
The bank's capacity to meet its financial commitments is extremely strong. The bank has a strong creditworthiness. The bank has a high trustworthiness.
Balanced Banks BBB BB
Capital adequacy and economic-financial equilibrium are considered more than adequate. The bank’s performances are adequate.
Vulnerable Banks B CCC
The bank presents signals of vulnerability with regard to its fundamentals. The bank has a dangerous disequilibrium on the capital adequacy and on its economic and financial fundamentals.
Risky Banks CC C D
The bank shows signals of high vulnerability. The bank shows considerable pathological situations. The bank has no longer the capacity to meet its financial commitments.
The MORE model is used by modefinance analysts as a fundamental base for their rating assessment activities.
The basic idea of the model is to analyze a set of financial and economic ratios, which are the most predictive, under a bankruptcy perspective, with the final purpose of creating a fundamental credit scoring model.
Results of the model are obtained by applying newly developed numerical methodologies, drawing together financial theory, data mining and engineering design methodologies. The hearth of MORE is a multi-dimensional and multi-objective algorithm that produces a classification of each bank, by taking into account attributes (country and specialization) characterizing a bank.
The model gives the opportunity to assign a risk class to a bank even when a full data set of needed variable is not available, in this event it also displays the quality of the analyzed information.
The model assesses a bank’s strengths and weaknesses by merging both sophisticated numerical techniques and the knowledge of modefinance’s analysts.
2. MORE Rating for Banks - vision

5 di 20
modefinance srl IT01168840328 AREA Science Park, Padriciano 99 34149 Trieste, Italy
Contacts T.+39 040 3755337 F.+39 040 3756741 [email protected]
July, 2017 MORE for Banks
The MORE looks at the fundamentals of a financial institution, in order to understand its financial and economic equilibrium, other than strengths and weaknesses. modefinance’s vision is that, the better the financial and economic equilibrium of a bank, the higher its capability to meet its financial commitments.
The main idea is based on the ‘CAMEL’ analysis where the considered key elements are: Capital Adequacy, Asset quality, Management, Earnings and Liquidity. Theoretically speaking, these are the most important areas that have to be considered when analyzing a bank creditworthiness. In the MORE analysis, the CAMEL approach has been used. As a consequence, the most relevant areas have been identified, in order to pursue a quantitative analysis and the ratios’ definition.
This credit analysis has been performed through a massive data mining process on several financial statement areas as: Profitability, Capital Adequacy, Asset Quality, Liquidity and Efficiency.
3. MORE Model

6 di 20
modefinance srl IT01168840328 AREA Science Park, Padriciano 99 34149 Trieste, Italy
Contacts T.+39 040 3755337 F.+39 040 3756741 [email protected]
July, 2017 MORE for Banks
3.1 Overview In order to assess the riskiness of a financial institution, it is necessary to understand the context where the bank is operating in. In order to assess the context, it is necessary to consider the following variables:
• The specialization of the business model (Commercial banks, Savings Banks, Cooperative Banks);
• The country where it is operating;
• The availability of financial information.
According to the data mining process previously described, modeFinance has defined a specific set of ratios to be analyzed. The analysis is performed through fuzzy logic techniques. For each bank specialization (Commercial banks, Savings Banks, Cooperative Banks), it has been defined a specific set of fuzzy functions, which transforms the quantitative result of the ratio into a qualitative opinion.
Country risk is dealt specifically considering the metric provided by the spread over the Credit Default Swap.
Finally, the model is capable to assess even financial institutions with limited financials available. It will automatically reset the ratios’ importance so to retrieve the best out of the available data. At the same time the model itself will express the liability of the specific assessment, through an indicator defined as “Confidence Level”.
3.2 The ratios The ratios’ definition has been performed with a double-approach: on one hand it was based on financial and economic theory (through the contribution of modeFinance analysts), on the other hand, it considered the statistical analysis performed for each bank’s specialization and geographical area.

7 di 20
modefinance srl IT01168840328 AREA Science Park, Padriciano 99 34149 Trieste, Italy
Contacts T.+39 040 3755337 F.+39 040 3756741 [email protected]
July, 2017 MORE for Banks
An example of the analysis performed for each ratio, is provided in the following figures:
In this case, there is a clear distinction between failed (RED) and active (GREEN) banks. So, the ratios are able to discriminate the “good” banks from the “bad” banks.
There is a lack of separation between active (GREEN) and failed (RED) banks. Such ratio is meaningless from a statistical point of view.
After studying, selecting and verifying over 40 ratios, the following ones have been chosen as the most relevant for each key area:
-0,14 -0,12 -0,1
-0,08 -0,06 -0,04 -0,02
0
0,02
0,04
0 0,2 0,4 0,6 0,8 1
Prc
Significative ratio (statistically)
-0,3 -0,25 -0,2
-0,15 -0,1
-0,05
0
0,05
0 0,2 0,4 0,6 0,8 1
Prc
Less significative ratio (statistically)
8 di 20
modefinance srl IT01168840328 AREA Science Park, Padriciano 99 34149 Trieste, Italy
Contacts T.+39 040 3755337 F.+39 040 3756741 [email protected]
July, 2017 MORE for Banks
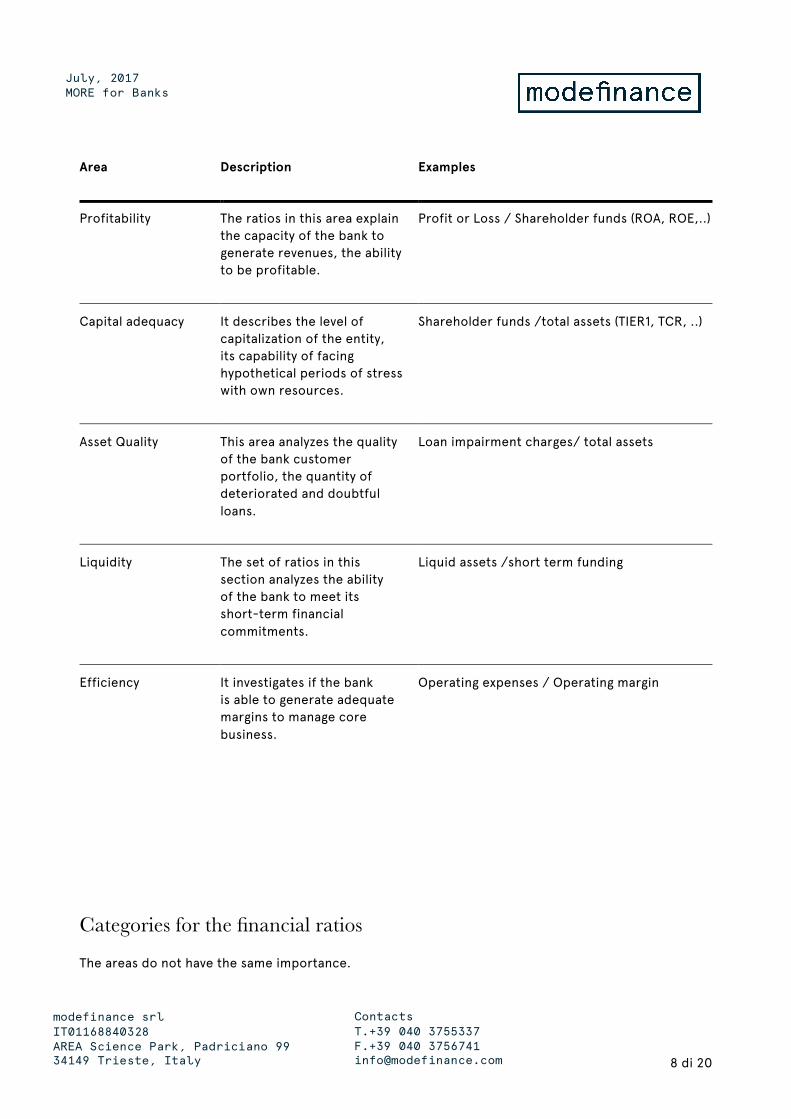
Area Description Examples
Profitability The ratios in this area explain the capacity of the bank to generate revenues, the ability to be profitable.
Profit or Loss / Shareholder funds (ROA, ROE,..)
Capital adequacy It describes the level of capitalization of the entity, its capability of facing hypothetical periods of stress with own resources.
Shareholder funds /total assets (TIER1, TCR, ..)
Asset Quality This area analyzes the quality of the bank customer portfolio, the quantity of deteriorated and doubtful loans.
Loan impairment charges/ total assets
Liquidity The set of ratios in this section analyzes the ability of the bank to meet its short-term financial commitments.
Liquid assets /short term funding
Efficiency It investigates if the bank is able to generate adequate margins to manage core business.
Operating expenses / Operating margin
Categories for the financial ratios
The areas do not have the same importance.

9 di 20
modefinance srl IT01168840328 AREA Science Park, Padriciano 99 34149 Trieste, Italy
Contacts T.+39 040 3755337 F.+39 040 3756741 [email protected]
July, 2017 MORE for Banks
It is obvious that, under a creditworthiness perspective, some areas are more important than others.
In the following table, we reported the different importance given to each different area of analysis:
Area Meaning
Profitability First cause of bankruptcy
Capital Adequacy Very important for operational purposes and regulatory requirements. Equity represents the cushion to eventual losses, so it has to be adequate.
Asset Quality First cause of 2008 crisis
Liquidity Regulatory improvements by Basel 3 and ECB
Efficiency It might be an indirect cause of bank failure, excessive operating costs could absorb margins and worsen profitability.
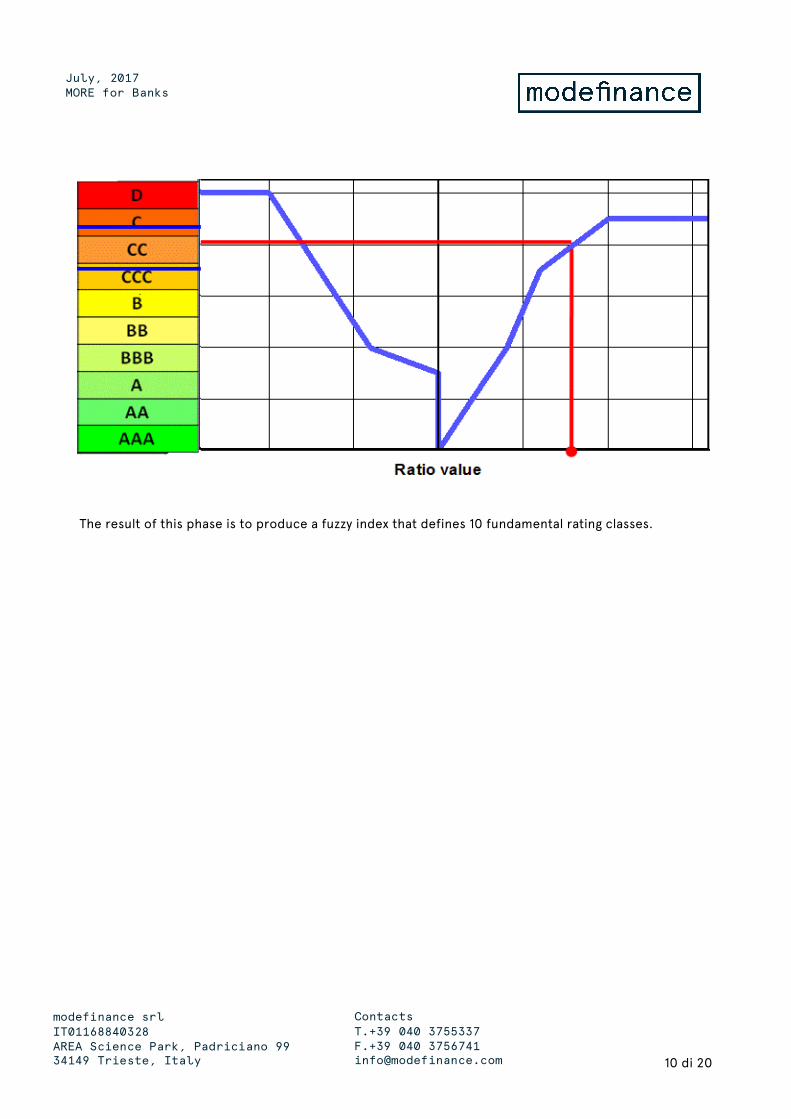
3.3 Fuzzy Logic The interpretation of every ratio has been achieved by using fuzzy logic: the value of a financial ratio is directly translated into a rating class with high non-linearity and without monotone problems.
Fuzzy theory is a mathematical model that expresses quantitative values in terms of qualitative terms: this theory is used in order to associate an opinion on each ratio’s value, translating the ratio values (numerical information) into rating classes (qualitative information).
10 di 20
modefinance srl IT01168840328 AREA Science Park, Padriciano 99 34149 Trieste, Italy
Contacts T.+39 040 3755337 F.+39 040 3756741 [email protected]
July, 2017 MORE for Banks
The result of this phase is to produce a fuzzy index that defines 10 fundamental rating classes.

11 di 20
modefinance srl IT01168840328 AREA Science Park, Padriciano 99 34149 Trieste, Italy
Contacts T.+39 040 3755337 F.+39 040 3756741 [email protected]
July, 2017 MORE for Banks
4. The Core of MORE The collection of the analysis of every single ratio (fuzzy transformation) gives the final MORE class.
The core of the MORE model is a “Decision Support” algorithm that collects all of the different opinions about the ratios and assesses the final rating. The principle is to award a company if it has a good financial equilibrium among the different financial figures (which represent different financial and economic aspects of the company behavior).

12 di 20
modefinance srl IT01168840328 AREA Science Park, Padriciano 99 34149 Trieste, Italy
Contacts T.+39 040 3755337 F.+39 040 3756741 [email protected]
July, 2017 MORE for Banks
5. MORE for Banks The MORE for Banks model displays several outputs aimed to ease the comprehension of credit risk assessment by the final user. To be precise, the outputs are:
• The risk class;
• The confidence level;
• The opinion about the ratios.
5.1 The risk class The risk class is the main output: it is modeFinance’s opinion about the creditworthiness of a bank. It is expressed according to a ten-class scale as described in table 1.
The score class is displayed for the last three FYs (if available) so to underline eventual trend shown by the analyzed institution.
5.2 The confidence level
This does not indicate the financial confidence in the bank. It is an expression of the availability of the financial information. Availability of financial information largely depends on filing regulations applied by the different countries considered.
The confidence level defines the accuracy of the MORE evaluation. When we have a fully populated dataset of variables, the confidence level is 100%, consequently the banks with no financials will have 0%.
Such indicators help the final user understand the reliability of the assessment.

13 di 20
modefinance srl IT01168840328 AREA Science Park, Padriciano 99 34149 Trieste, Italy
Contacts T.+39 040 3755337 F.+39 040 3756741 [email protected]
July, 2017 MORE for Banks
5.3 The opinion about the ratios The opinion on each ratio is displayed through a color map, easily understandable even by those users who are not keen on banks’ analysis.
The color map of the ratios is readable by two different perspectives: vertical and horizontal.
By looking at the colors in the same column (vertical) it is possible to interpret the risk assessment in the different areas for the assessment of a specific year; by looking at the dots on the same row (horizontal) it is possible to analyze the evolution and trend of the ratios’ quality throughout the years.
6. Validation The validation process is aimed to understand if and how the model is capable of discriminating the active banks from defaulted banks and, eventually, how promptly it reacts to the deteriorations of their fundamentals.
In order to do so, we performed the analysis in two steps:
• Discriminating power analysis: capability of distinguish active banks from bankrupted ones;
• Bankruptcy dynamics: behavior of the model, approaching the defaulting date.
6.1 Testing sample The back testing has been performed constructing a sample of purely active banks and a sample of only defaulted ones.
The following types of banks have been included:
• Commercial banks;
• Savings banks;
• Cooperative banks.
14 di 20
modefinance srl IT01168840328 AREA Science Park, Padriciano 99 34149 Trieste, Italy
Contacts T.+39 040 3755337 F.+39 040 3756741 [email protected]
July, 2017 MORE for Banks
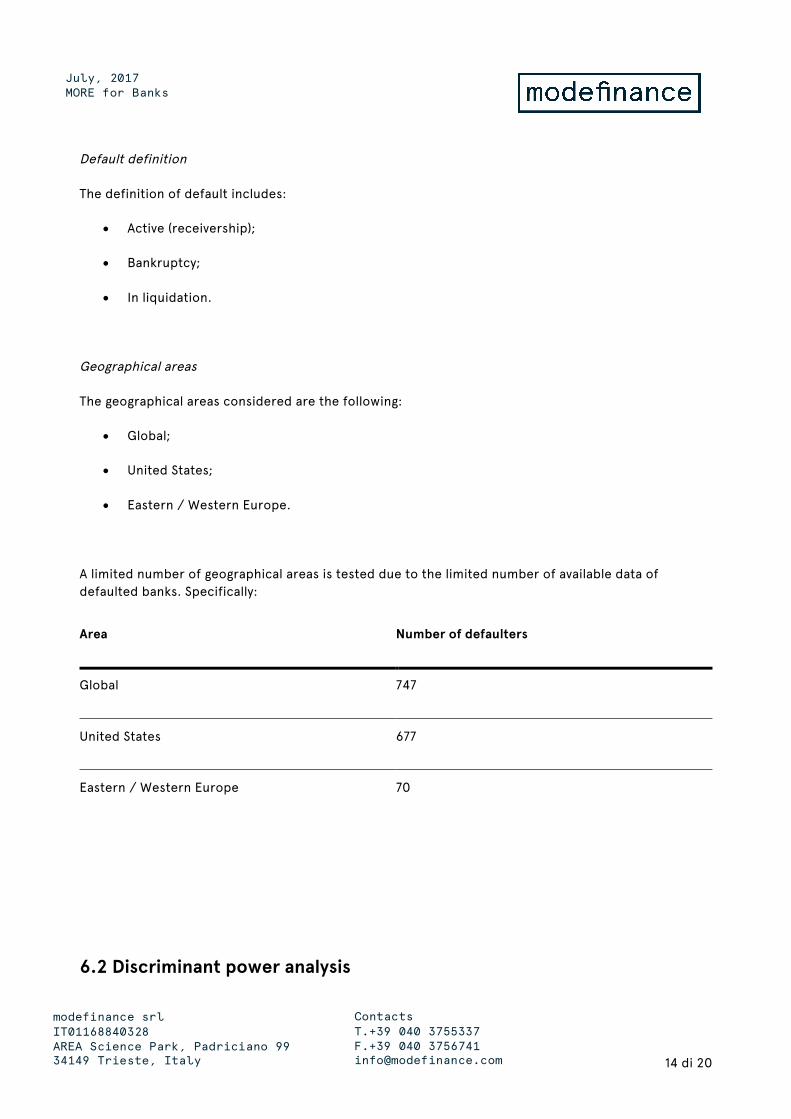
Default definition
The definition of default includes:
• Active (receivership);
• Bankruptcy;
• In liquidation.
Geographical areas
The geographical areas considered are the following:
• Global;
• United States;
• Eastern / Western Europe.
A limited number of geographical areas is tested due to the limited number of available data of defaulted banks. Specifically:
Area Number of defaulters
Global 747
United States 677
Eastern / Western Europe 70
6.2 Discriminant power analysis

15 di 20
modefinance srl IT01168840328 AREA Science Park, Padriciano 99 34149 Trieste, Italy
Contacts T.+39 040 3755337 F.+39 040 3756741 [email protected]
July, 2017 MORE for Banks
The testing of the discriminating capacity has been performed utilizing the classical ROC (Receiver Operating Characteristic) curve test.
The curves have been obtained with the Score assessed by the model on the basis of both the last available financial statement and the one before the last available financial statement for each bank.
This means that we are analyzing the discriminating capacity of the model up to 12 months before the material default and between 12 and 24 months in advance.
ROC curves
ROCs are constructed by scoring all credits and ordering the non-defaulters from worst to best on the x axis and then plotting the percentage of defaults excluded at each level on the y axis. So, the y axis is formed by associating every score on the x axis with the cumulative percentage of defaults with a score equal to or worse than that score in the test data. In other words, the y axis gives the percentage of defaults excluded as a function of the number of non-defaults excluded.
A convenient measure for summarizing the graph of the ROC is the area under the ROC (AUC), which is calculated as the proportion of the area below the ROC relative to the total area of the unit square. A value of 0.5 indicates a random model, and a value of 1.0 indicates perfect discrimination.
A rough guide for classifying the accuracy of a diagnostic test is the traditional academic point system:
a) 1,00-0,90: excellent
b) 0,90-0,80: good
c) 0,80-0,70: adequate
d) 0,70-0,60: poor
e) 0,60-0,50: fail

16 di 20
modefinance srl IT01168840328 AREA Science Park, Padriciano 99 34149 Trieste, Italy
Contacts T.+39 040 3755337 F.+39 040 3756741 [email protected]
July, 2017 MORE for Banks
6.3 Discriminating power by geographical area The ROC curves obtained for the specified geographical areas are displayed in the following figures:
United States Eastern / Western Europe
17 di 20
modefinance srl IT01168840328 AREA Science Park, Padriciano 99 34149 Trieste, Italy
Contacts T.+39 040 3755337 F.+39 040 3756741 [email protected]
July, 2017 MORE for Banks
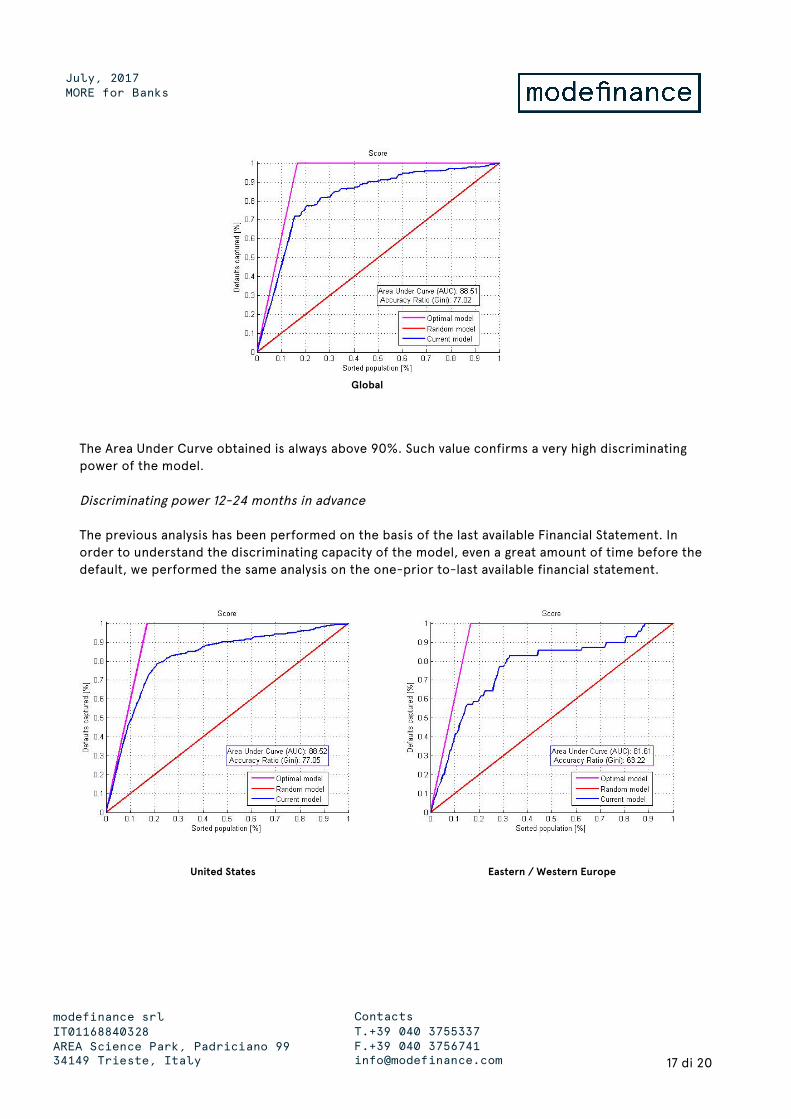
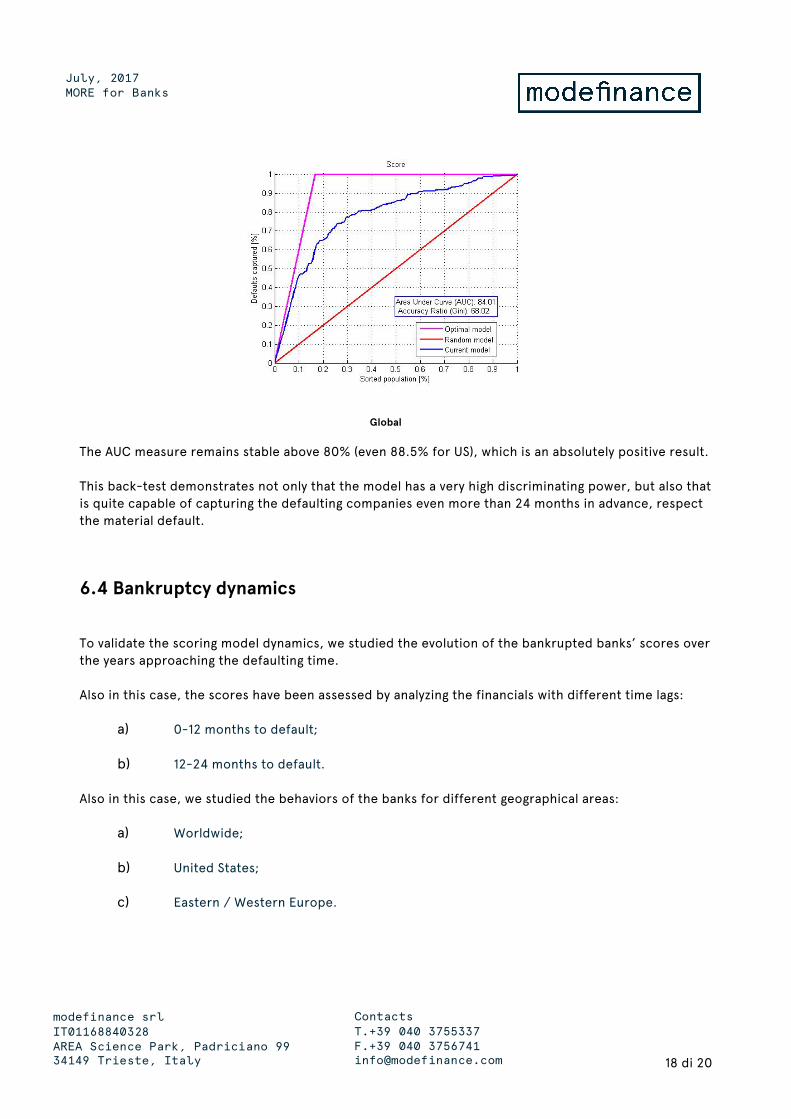
Global
The Area Under Curve obtained is always above 90%. Such value confirms a very high discriminating power of the model.
Discriminating power 12-24 months in advance
The previous analysis has been performed on the basis of the last available Financial Statement. In order to understand the discriminating capacity of the model, even a great amount of time before the default, we performed the same analysis on the one-prior to-last available financial statement.
United States Eastern / Western Europe
18 di 20
modefinance srl IT01168840328 AREA Science Park, Padriciano 99 34149 Trieste, Italy
Contacts T.+39 040 3755337 F.+39 040 3756741 [email protected]
July, 2017 MORE for Banks
Global
The AUC measure remains stable above 80% (even 88.5% for US), which is an absolutely positive result.
This back-test demonstrates not only that the model has a very high discriminating power, but also that is quite capable of capturing the defaulting companies even more than 24 months in advance, respect the material default.
6.4 Bankruptcy dynamics
To validate the scoring model dynamics, we studied the evolution of the bankrupted banks’ scores over the years approaching the defaulting time.
Also in this case, the scores have been assessed by analyzing the financials with different time lags:
a) 0-12 months to default;
b) 12-24 months to default.
Also in this case, we studied the behaviors of the banks for different geographical areas:
a) Worldwide;
b) United States;
c) Eastern / Western Europe.

19 di 20
modefinance srl IT01168840328 AREA Science Park, Padriciano 99 34149 Trieste, Italy
Contacts T.+39 040 3755337 F.+39 040 3756741 [email protected]
July, 2017 MORE for Banks
The results of the analysis are displayed below:
0,05
0,15
0,25
12-24months 0-12months
Global
AvgScore
CC
C
D
0%10%20%30%40%50%60%70%80%90%
100%
12-24months 0-12months
Global
Healthy Balanced Vulnerable Risky
0,0500
0,1500
0,2500
12-24months 0-12months
US
AvgScore
CC
C
D
0%10%20%30%40%50%60%70%80%90%100%
12-24months 0-12months
US
Healthy Balanced Vulnerable Risky
0,0500
0,1500
0,2500
12-24months 0-12months
Europe
AvgScore
CC
C
D
0%10%20%30%40%50%60%70%80%90%100%
12-24months 0-12months
Europe
Healthy Balanced Vulnerable Risky

20 di 20
modefinance srl IT01168840328 AREA Science Park, Padriciano 99 34149 Trieste, Italy
Contacts T.+39 040 3755337 F.+39 040 3756741 [email protected]
July, 2017 MORE for Banks
Besides the fact that the average score of the banks is already extremely low in the period of 12 to 24 months prior to the default, it’s clear with the graphs on the left column illustrating how it worsens approaching default time.
It is remarkable (graphs on the right) that already 12-24 months before the defaulting time, 80% of defaulted banks were already classified as Risky or Vulnerable.
Disclaimer The present Corporate Credit rating is issued by modefinance under EU Regulation 1060/2009 and following amendments.
The facts of this report are believed to be correct at the time of publication but cannot be guaranteed.
For the quality assessment of information, please check Key Rating Information and Disclosures part of the present report.
The credit rating was notified to the rated entity in order to identify potential factual errors, as prescribed by the CRA Regulation.
A Summary of Notification and Appeal Process is reported in the dedicated paragraph.
Please note that the findings and the conclusions that modefinance delivers are based on public information gathered in good faith from both primary and secondary sources, whose accuracy we are not in a position to guarantee.
As such, modefinance can accept no liability whatsoever for actions taken based on any information that may subsequently prove to be incorrect.
For all other information on Credit Ratings or for other disclosures and key information please go to “Key Information and Disclosures” part.
All Rights Reserved. No part of this publication may be reproduced, stored in a retrieval system or transmitted in any form by any means, electronic, mechanical, photocopying, recording or otherwise, without the prior permission of the publisher modefinance.