Morbidity and Mortality Weekly Report - Centers for … · Morbidity and Mortality Weekly Report...
24
Morbidity and Mortality Weekly Report Weekly May 3, 2002 / Vol. 51 / No. 17 Centers for Disease Control and Prevention Centers for Disease Control and Prevention Centers for Disease Control and Prevention Centers for Disease Control and Prevention Centers for Disease Control and Prevention SAFER • HEAL SAFER • HEAL SAFER • HEAL SAFER • HEAL SAFER • HEALTHIER • PEOPLE THIER • PEOPLE THIER • PEOPLE THIER • PEOPLE THIER • PEOPLE TM Tropical Storm Allison Rapid Needs Assessment — Houston, Texas, June 2001 INSIDE 369 Laboratory Surveillance for Wild Poliovirus and Vaccine- Derived Poliovirus, 2000–2001 371 Trends in Deaths from Systemic Lupus Erythematosus, United States, 1979–1998 374 Interpretation of Provisional Data Presented in Morbidity and Mortality Weekly Report Tables 374 Notices to Readers On June 5, 2001, Tropical Storm Allison made landfall on Galveston Island, Texas. During the next 2 days, the system soaked much of southeast Texas and south-central Louisiana with more than 10 inches of rain as it moved slowly north- ward. On June 7, the storm made a clockwise loop back to the southwest, bringing even more rain to already drenched areas. The record rainfall caused billions of dollars in flood- related damage and approximately 25 deaths and led to a presidential disaster declaration covering 31 Texas counties (Figure 1) and 28 Louisiana parishes. Harris County, Texas (2000 population: 3,400,578), center of the Houston metro- politan area, was among the hardest hit with some areas receiving up to 37 inches of rain in 24 hours (1) (Figure 2). To evaluate the community’s immediate public health needs, the City of Houston Department of Health and Human Services (HDHHS) conducted a rapid needs assessment in the areas most affected by flooding. This report summarizes assessment results, which identified increased illness in persons living in flooded homes, suggesting a need for rapid resolution of flood-related damage and the possibility that residents should seek temporary housing during clean-up and repair. The findings underscore the usefulness of rapid needs assessment as a tool to minimize misinformation, identify actual health threats, and ensure delivery of resources to those with the greatest and most immediate need. Severely flood-affected areas of Houston, identified by the City of Houston Office of Emergency Management, were divided into two sectors: Area A, in the northeast section of the city, comprised 96 census tracts, 148,654 housing units, and 443,356 residents; and Area B, covering the western part of the city, comprised 72 census tracts, 167,158 housing units, and 400,868 residents. Using modified cluster sampling (2,3), HDHHS obtained a random sample of 30 census tracts from each of the two areas by using statistical software (SPSS V.10). One neighborhood from each of these 60 tracts was selected by delineating block groups using 1997 household estimates (housing unit data from the 2000 census were not yet avail- able), breaking into quintiles the distribution of household population, and selecting the block group with the highest population and concentration of streets. A standardized question- naire was developed to collect information about demograph- ics, extent of home damage, number of residents forced to FIGURE 1. Texas counties included in June 9, 2001 disaster declaration as a result of Tropical Storm Allison New Mexico Oklahoma Arkansas Louisiana Mexico Gulf of Mexico Galveston Bay Houston
Transcript of Morbidity and Mortality Weekly Report - Centers for … · Morbidity and Mortality Weekly Report...
Morbidity and Mortality Weekly Report
Weekly May 3, 2002 / Vol. 51 / No. 17
Centers for Disease Control and PreventionCenters for Disease Control and PreventionCenters for Disease Control and PreventionCenters for Disease Control and PreventionCenters for Disease Control and PreventionSAFER • HEALSAFER • HEALSAFER • HEALSAFER • HEALSAFER • HEALTHIER • PEOPLETHIER • PEOPLETHIER • PEOPLETHIER • PEOPLETHIER • PEOPLETM
Tropical Storm Allison Rapid Needs Assessment — Houston, Texas, June 2001
INSIDE
369 Laboratory Surveillance for Wild Poliovirus and Vaccine-Derived Poliovirus, 2000–2001
371 Trends in Deaths from Systemic Lupus Erythematosus,United States, 1979–1998
374 Interpretation of Provisional Data Presented inMorbidity and Mortality Weekly Report Tables
374 Notices to Readers
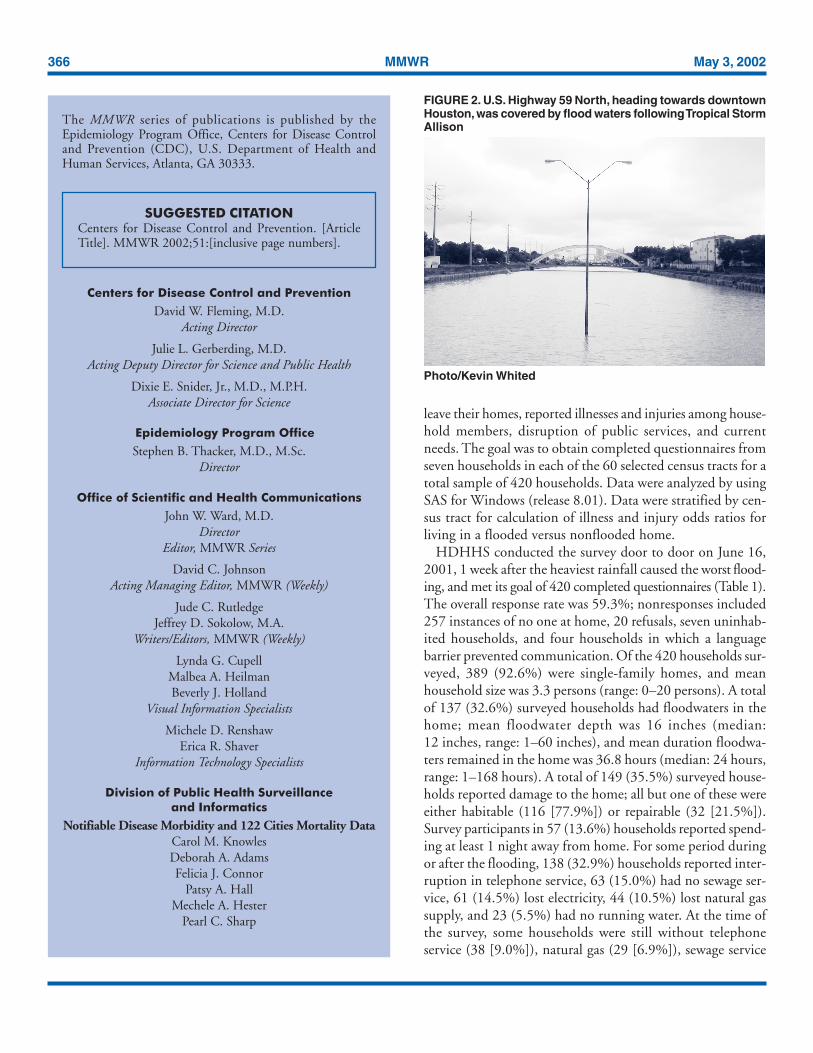
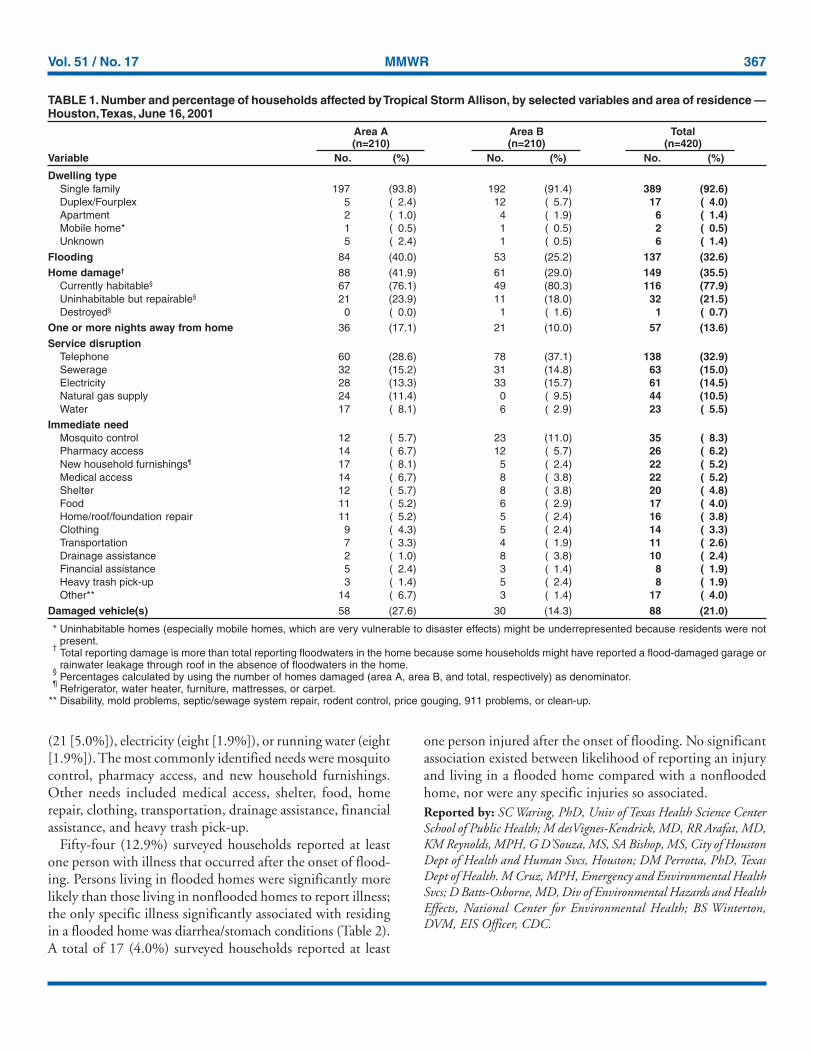
On June 5, 2001, Tropical Storm Allison made landfall onGalveston Island, Texas. During the next 2 days, the systemsoaked much of southeast Texas and south-central Louisianawith more than 10 inches of rain as it moved slowly north-ward. On June 7, the storm made a clockwise loop back tothe southwest, bringing even more rain to already drenchedareas. The record rainfall caused billions of dollars in flood-related damage and approximately 25 deaths and led to apresidential disaster declaration covering 31 Texas counties(Figure 1) and 28 Louisiana parishes. Harris County, Texas(2000 population: 3,400,578), center of the Houston metro-politan area, was among the hardest hit with some areasreceiving up to 37 inches of rain in 24 hours (1) (Figure 2).To evaluate the community’s immediate public health needs,the City of Houston Department of Health and HumanServices (HDHHS) conducted a rapid needs assessment inthe areas most affected by flooding. This report summarizesassessment results, which identified increased illness in
persons living in flooded homes, suggesting a need for rapidresolution of flood-related damage and the possibility thatresidents should seek temporary housing during clean-up andrepair. The findings underscore the usefulness of rapid needsassessment as a tool to minimize misinformation, identifyactual health threats, and ensure delivery of resources to thosewith the greatest and most immediate need.
Severely flood-affected areas of Houston, identified by theCity of Houston Office of Emergency Management, weredivided into two sectors: Area A, in the northeast section ofthe city, comprised 96 census tracts, 148,654 housing units,and 443,356 residents; and Area B, covering the western partof the city, comprised 72 census tracts, 167,158 housing units,and 400,868 residents. Using modified cluster sampling (2,3),HDHHS obtained a random sample of 30 census tracts fromeach of the two areas by using statistical software (SPSS V.10).One neighborhood from each of these 60 tracts was selectedby delineating block groups using 1997 household estimates(housing unit data from the 2000 census were not yet avail-able), breaking into quintiles the distribution of householdpopulation, and selecting the block group with the highestpopulation and concentration of streets. A standardized question-naire was developed to collect information about demograph-ics, extent of home damage, number of residents forced to
FIGURE 1. Texas counties included in June 9, 2001 disasterdeclaration as a result of Tropical Storm Allison
New Mexico
Oklahoma
Arkansas
Louisiana
Mexico Gulf ofMexico
GalvestonBay
Houston
366 MMWR May 3, 2002
SUGGESTED CITATIONCenters for Disease Control and Prevention. [ArticleTitle]. MMWR 2002;51:[inclusive page numbers].
Centers for Disease Control and Prevention
David W. Fleming, M.D.Acting Director
Julie L. Gerberding, M.D.Acting Deputy Director for Science and Public Health
Dixie E. Snider, Jr., M.D., M.P.H.Associate Director for Science
Epidemiology Program Office
Stephen B. Thacker, M.D., M.Sc.Director
Office of Scientific and Health Communications
John W. Ward, M.D.Director
Editor, MMWR Series
David C. JohnsonActing Managing Editor, MMWR (Weekly)
Jude C. RutledgeJeffrey D. Sokolow, M.A.
Writers/Editors, MMWR (Weekly)
Lynda G. CupellMalbea A. HeilmanBeverly J. Holland
Visual Information Specialists
Michele D. RenshawErica R. Shaver
Information Technology Specialists
Division of Public Health Surveillanceand Informatics
Notifiable Disease Morbidity and 122 Cities Mortality DataCarol M. KnowlesDeborah A. AdamsFelicia J. Connor
Patsy A. HallMechele A. Hester
Pearl C. Sharp
The MMWR series of publications is published by theEpidemiology Program Office, Centers for Disease Controland Prevention (CDC), U.S. Department of Health andHuman Services, Atlanta, GA 30333.
leave their homes, reported illnesses and injuries among house-hold members, disruption of public services, and currentneeds. The goal was to obtain completed questionnaires fromseven households in each of the 60 selected census tracts for atotal sample of 420 households. Data were analyzed by usingSAS for Windows (release 8.01). Data were stratified by cen-sus tract for calculation of illness and injury odds ratios forliving in a flooded versus nonflooded home.
HDHHS conducted the survey door to door on June 16,2001, 1 week after the heaviest rainfall caused the worst flood-ing, and met its goal of 420 completed questionnaires (Table 1).The overall response rate was 59.3%; nonresponses included257 instances of no one at home, 20 refusals, seven uninhab-ited households, and four households in which a languagebarrier prevented communication. Of the 420 households sur-veyed, 389 (92.6%) were single-family homes, and meanhousehold size was 3.3 persons (range: 0–20 persons). A totalof 137 (32.6%) surveyed households had floodwaters in thehome; mean floodwater depth was 16 inches (median:12 inches, range: 1–60 inches), and mean duration floodwa-ters remained in the home was 36.8 hours (median: 24 hours,range: 1–168 hours). A total of 149 (35.5%) surveyed house-holds reported damage to the home; all but one of these wereeither habitable (116 [77.9%]) or repairable (32 [21.5%]).Survey participants in 57 (13.6%) households reported spend-ing at least 1 night away from home. For some period duringor after the flooding, 138 (32.9%) households reported inter-ruption in telephone service, 63 (15.0%) had no sewage ser-vice, 61 (14.5%) lost electricity, 44 (10.5%) lost natural gassupply, and 23 (5.5%) had no running water. At the time ofthe survey, some households were still without telephoneservice (38 [9.0%]), natural gas (29 [6.9%]), sewage service
FIGURE 2. U.S. Highway 59 North, heading towards downtownHouston, was covered by flood waters following Tropical StormAllison
Photo/Kevin Whited
Vol. 51 / No. 17 MMWR 367
TABLE 1. Number and percentage of households affected by Tropical Storm Allison, by selected variables and area of residence —Houston, Texas, June 16, 2001
Area A Area B Total(n=210) (n=210) (n=420)
Variable No. (%) No. (%) No. (%)
Dwelling typeSingle family 197 (93.8) 192 (91.4) 389 (92.6)Duplex/Fourplex 5 ( 2.4) 12 ( 5.7) 17 ( 4.0)Apartment 2 ( 1.0) 4 ( 1.9) 6 ( 1.4)Mobile home* 1 ( 0.5) 1 ( 0.5) 2 ( 0.5)Unknown 5 ( 2.4) 1 ( 0.5) 6 ( 1.4)
Flooding 84 (40.0) 53 (25.2) 137 (32.6)Home damage† 88 (41.9) 61 (29.0) 149 (35.5)
Currently habitable§ 67 (76.1) 49 (80.3) 116 (77.9)Uninhabitable but repairable§ 21 (23.9) 11 (18.0) 32 (21.5)Destroyed§ 0 ( 0.0) 1 ( 1.6) 1 ( 0.7)
One or more nights away from home 36 (17.1) 21 (10.0) 57 (13.6)Service disruption
Telephone 60 (28.6) 78 (37.1) 138 (32.9)Sewerage 32 (15.2) 31 (14.8) 63 (15.0)Electricity 28 (13.3) 33 (15.7) 61 (14.5)Natural gas supply 24 (11.4) 0 ( 9.5) 44 (10.5)Water 17 ( 8.1) 6 ( 2.9) 23 ( 5.5)
Immediate needMosquito control 12 ( 5.7) 23 (11.0) 35 ( 8.3)Pharmacy access 14 ( 6.7) 12 ( 5.7) 26 ( 6.2)New household furnishings¶ 17 ( 8.1) 5 ( 2.4) 22 ( 5.2)Medical access 14 ( 6.7) 8 ( 3.8) 22 ( 5.2)Shelter 12 ( 5.7) 8 ( 3.8) 20 ( 4.8)Food 11 ( 5.2) 6 ( 2.9) 17 ( 4.0)Home/roof/foundation repair 11 ( 5.2) 5 ( 2.4) 16 ( 3.8)Clothing 9 ( 4.3) 5 ( 2.4) 14 ( 3.3)Transportation 7 ( 3.3) 4 ( 1.9) 11 ( 2.6)Drainage assistance 2 ( 1.0) 8 ( 3.8) 10 ( 2.4)Financial assistance 5 ( 2.4) 3 ( 1.4) 8 ( 1.9)Heavy trash pick-up 3 ( 1.4) 5 ( 2.4) 8 ( 1.9)Other** 14 ( 6.7) 3 ( 1.4) 17 ( 4.0)
Damaged vehicle(s) 58 (27.6) 30 (14.3) 88 (21.0)
* Uninhabitable homes (especially mobile homes, which are very vulnerable to disaster effects) might be underrepresented because residents were notpresent.
†Total reporting damage is more than total reporting floodwaters in the home because some households might have reported a flood-damaged garage orrainwater leakage through roof in the absence of floodwaters in the home.
§Percentages calculated by using the number of homes damaged (area A, area B, and total, respectively) as denominator.
¶Refrigerator, water heater, furniture, mattresses, or carpet.
** Disability, mold problems, septic/sewage system repair, rodent control, price gouging, 911 problems, or clean-up.
(21 [5.0%]), electricity (eight [1.9%]), or running water (eight[1.9%]). The most commonly identified needs were mosquitocontrol, pharmacy access, and new household furnishings.Other needs included medical access, shelter, food, homerepair, clothing, transportation, drainage assistance, financialassistance, and heavy trash pick-up.
Fifty-four (12.9%) surveyed households reported at leastone person with illness that occurred after the onset of flood-ing. Persons living in flooded homes were significantly morelikely than those living in nonflooded homes to report illness;the only specific illness significantly associated with residingin a flooded home was diarrhea/stomach conditions (Table 2).A total of 17 (4.0%) surveyed households reported at least
one person injured after the onset of flooding. No significantassociation existed between likelihood of reporting an injuryand living in a flooded home compared with a nonfloodedhome, nor were any specific injuries so associated.Reported by: SC Waring, PhD, Univ of Texas Health Science CenterSchool of Public Health; M desVignes-Kendrick, MD, RR Arafat, MD,KM Reynolds, MPH, G D’Souza, MS, SA Bishop, MS, City of HoustonDept of Health and Human Svcs, Houston; DM Perrotta, PhD, TexasDept of Health. M Cruz, MPH, Emergency and Environmental HealthSvcs; D Batts-Osborne, MD, Div of Environmental Hazards and HealthEffects, National Center for Environmental Health; BS Winterton,DVM, EIS Officer, CDC.
368 MMWR May 3, 2002
Editorial Note: Flooding is the most common type of natu-ral disaster worldwide, and flash flooding, often associatedwith the heavy, localized rainfall that occurs in a tropical storm,is the leading cause of weather-related deaths in the UnitedStates (4). Public health impacts of flooding include damageto homes and consequent displacement of occupants, infec-tious disease morbidity exacerbated by crowded living condi-tions and compromised personal hygiene, contamination ofwater sources, disruption of sewage service and solid-wastecollection, increased vector populations, injuries sustained dur-ing clean-up, stress-related mental health and substance-abuseproblems, and death (5–7).
The finding of increased illness prevalence is consistent withprevious reports of flood-related morbidity (5,8); this reportshows the increase as significantly associated with residing ina flooded versus a nonflooded home. Conversely, recovery-period surveillance conducted at selected emergency depart-ments, shelters, and contingency clinics immediately after theonset of flooding detected neither outbreaks of specific dis-eases nor unusual incidence of injuries or gastrointestinal orrespiratory disease (HDHHS, unpublished data, 2001).Although these contradictory findings might be attributed todifficulties associated with collecting adequate surveillanceinformation from clinics and shelters during the immediatepost-disaster response, they also might represent potential limi-tations of the rapid needs assessment approach. Differencesmight exist between the nature of illnesses and injuries
TABLE 2. Number and percentage of households with one or more persons reporting illness or injury within 1 week after TropicalStorm Allison, by flood status of home — Houston, Texas, June 16, 2001
Flooded Nonflooded(n=137) (n=283)
Condition No. (%) No. (%) OR* (95% CI†) p value§
Illness 35 (25.5) 19 (6.7) 4.7 (1.8– 12.0) <0.001Diarrhea/Stomach condition 15 (10.9) 9 (3.2) 6.2 (1.4– 28.0) 0.017Respiratory symptoms/Cold 14 (10.2) 7 (2.5) 3.2 (0.9– 10.9) 0.046Headache/Dizziness 10 ( 7.3) 4 (1.4) 4.4 (0.8– 25.6) 0.056Anxiety/Distress 5 ( 3.6) 0 (0.0) undefined undefined 0.059Heart attack/Heart problems 4 ( 2.9) 0 (0.0) undefined undefined 0.059Chronic illness made worse 3 ( 2.2) 0 (0.0) undefined undefined 0.134Undefined generalized illness 1 ( 0.7) 1 (0.4) undefined undefined 0.149Sleep disturbance/Nightmare 12 ( 8.8) 2 (7.1) 3.3 (0.5– 22.3) 0.240Rash 2 ( 1.5) 2 (0.7) 6.0 (0.2–149.6) 0.286Allergies 0 ( 0.0) 1 (0.4) undefined undefined 0.527
Injury 11 ( 8.0) 6 (2.1) 1.9 (0.4– 8.4) 0.463Fall 2 ( 1.5) 0 (0.0) undefined undefined 0.153Blunt injury 1 ( 0.7) 0 (0.0) undefined undefined 0.387Insect bite 3 ( 2.2) 0 (0.0) undefined undefined 0.394Abrasion/Cut/Puncture 2 ( 1.5) 3 (1.1) 0.4 (0.0– 8.1) 0.596Auto accident 0 ( 0.0) 1 (0.4) undefined undefined 0.683Other undefined injury 1 ( 0.7) 0 (0.0) undefined undefined 0.683Animal bite 2 ( 1.5) 2 (0.7) 1.0 (0.1– 20.0) 1.000
* Odds ratio.†
Confidence interval.§
Analysis of odds ratio, confidence interval, and p value stratified by census tract.
reported by clinic-based surveillance conducted immediatelypost-disaster and those self-reported through a survey a weeklater. Furthermore, persons not at home and therefore unableto participate in the needs assessment survey might have beenaway from home because of illness or injury.
In addition to the potential for actual flood-related healthimpacts, rumors of epidemics often follow floods and othernatural disasters and quickly gain public credibility whenreported by the media (5,9,10). Actual threats and the poten-tial for rumors combine to underscore the need for rapidinformation gathering to facilitate decision making and ad-dress public concerns. Rapid needs assessment—combiningepidemiologic, anthropologic, and statistical methods—provides accurate information quickly and at low cost to mini-mize misinformation and identify actual health threats (2).
This assessment was planned, conducted, and analyzedwithin 1 week and quickly provided important informationto the City of Houston Mayor’s Office, City Council mem-bers, City of Houston Office of Emergency Management,American Red Cross, Federal Emergency Management Agency,CDC’s Emergency Response team, Texas Department ofHealth, and other agencies assisting with flood recoveryefforts. These findings underscore the usefulness of rapid needsassessment as a practical and responsive data-gathering tool tocomplement clinic-based surveillance in disaster settings. Theresults were integral in assessing damage, setting priorities forservice delivery, and directing assistance efforts. Numerous
Vol. 51 / No. 17 MMWR 369
persons with special needs were identified and the appropri-ate assistance agencies quickly notified, heavy trash pick-upcrews were redirected to neighborhoods where they wereneeded most, and residents of an area with chronic drainageproblems were put in contact with the city engineeringdepartment to work out plans for future improvements. Theresults of this assessment will guide future needs assessments,disaster-response planning, and disaster-effects mitigation.References1. National Weather Service. Storm summary number 52 for the history
of Allison. Camp Springs, Maryland: National Centers for Environ-mental Protection, Hydrological Prediction Center, National WeatherService, 2001.
2. Malilay J, Flanders WD, Brogan D. A modified cluster-samplingmethod for post-disaster rapid assessment of needs. Bull World HealthOrgan 1996;74:399–405.
3. Hlady GW, Quenemoen LE, Armenia-Cope RR, et al. Use of a modi-fied cluster sampling method to perform rapid needs assessment afterHurricane Andrew. Ann Emerg Med 1994;23:719–25.
4. French JG, Holt KW. Floods. In: Gregg MB, ed. The public healthconsequences of disasters. New York, New York: Oxford, 1997.
5. CDC. Public health consequences of a flood disaster—Iowa, 1993.MMWR 1993;42:653–6.
6. French JG, Ing R, Von Allmen S, Wood R. Mortality from flash floods:a review of National Weather Service reports, 1969–81. Public HealthRep 1983;98:584–8.
7. Cotton P. Health threat from mosquitoes rises as flood of the centuryrecedes. JAMA 1993;270:685–6.
8. CDC. Morbidity surveillance following the Midwest flood—Missouri,1993. MMWR 1993;42:797–8.
9. Seaman J, Leivesley S, Hogg C. Epidemiology of natural disasters. In:Klingberg MA, Papier C, eds. Contributions to epidemiology and bio-statistics. Vol 5. Basel, New York: Karger, 1984.
10. Glass RI, Noji EK. Epidemiologic surveillance following disasters. In:Halperin WE, Baker EL, Monson RR, eds. Public health surveillance.New York, New York: Van Nostrand Reinhold, 1992:195–205.
Laboratory Surveillance for WildPoliovirus and Vaccine-Derived
Poliovirus, 2000–2001After the 1988 World Health Assembly resolution to eradi-
cate poliomyelitis (1), the Global Laboratory Networkfor Poliomyelitis Eradication (the laboratory network) wasestablished by the World Health Organization (WHO). Thelaboratory network is one component of the international sur-veillance system for detecting polio through notification of casesof acute flaccid paralysis (AFP)*. As progress is made in eradi-cating polio worldwide (2), the laboratory network providescritical virologic evidence about where poliovirus is circulat-ing as a guide to supplementary vaccination activities aimed
at interrupting transmission. This report summarizes the labo-ratory data for documenting the decline in wild poliovirustransmission and the occurrence of vaccine-derived poliovi-ruses and highlights the expanding role of the laboratory net-work in global polio eradication.
In December 2001, the laboratory network was fullyoperational in all six WHO regions and included 147 labora-tories: seven global specialized laboratories, 16 regional refer-ence laboratories, 84 national laboratories, and 40 subnationallaboratories in large countries. As of April 2002, a total of135 (92%) laboratories were fully accredited, six (4%)laboratories were provisionally† accredited, four (3%) labora-tories were pending an accreditation review, and two (1%)subnational laboratories had failed to reach accreditationstandards.
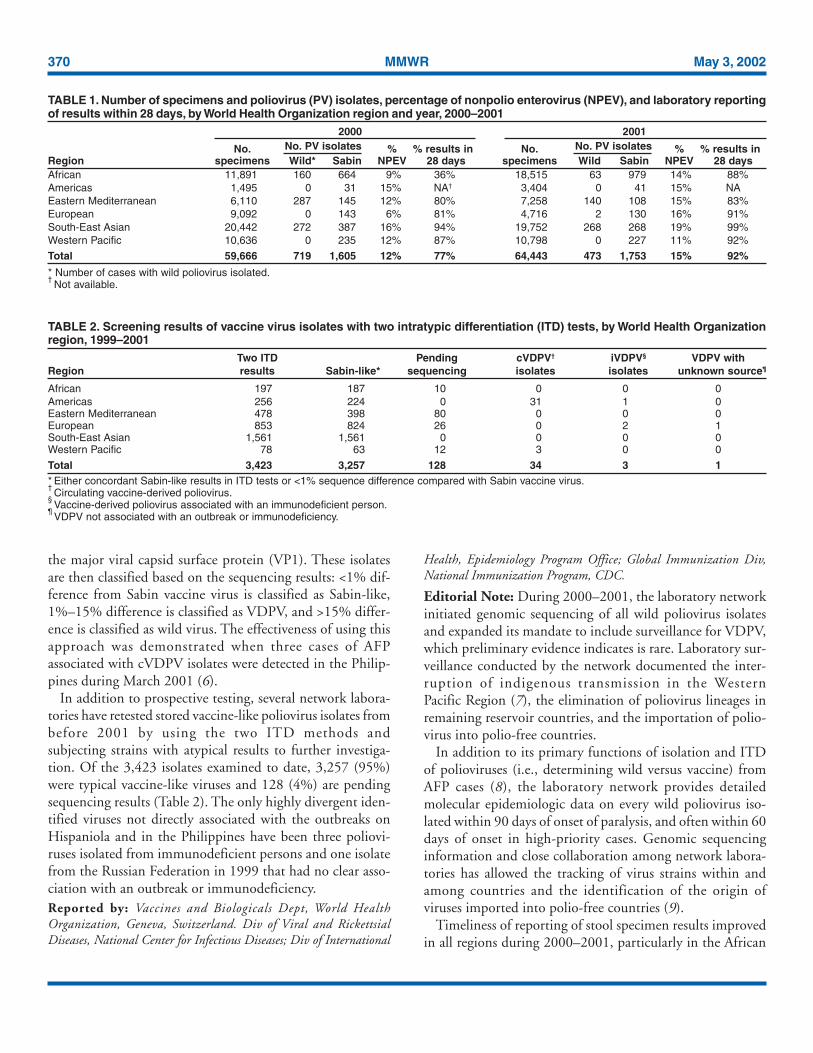
Laboratories are evaluated according to several key perfor-mance indicators, including the timeliness of reportingpoliovirus isolation results to national programs (i.e., within28 days of receipt of a specimen) and the nonpolio enterovi-rus (NPEV) rate, which indicates both an adequate reversecold chain during specimen transportation and the technicalcapability of the laboratory to detect enteroviruses. During2000–2001, the time taken to report virus isolation resultsdecreased, with 92% of results reported within 28 days ofreceipt of the specimen in the laboratory in 2001 comparedwith 77% in 2000 (Table 1).
Although the number of stool specimens tested increasedfrom 59,666 in 2000 to 64,443 in 2001, the number ofpolioviruses isolated from AFP cases declined from 719 to473; substantial disappearance of poliovirus lineages wasdetected through genomic sequencing. Approximately 10,000NPEV isolates were identified each year from these stoolspecimens.
Vaccine-derived poliovirus (VDPV) associated with an out-break of polio (circulating VDPV [cVDPV]) was detected onthe island of Hispaniola during October 2000 (3–5). Labora-tory network activities were extended subsequently to includescreening for these viruses (Table 2), which have acquired wild-like neurovirulence and transmissibility and possess molecu-lar characteristics that differentiate them from either vaccineor wild virus. Since January 2001, all poliovirus isolates aresubjected to two methods of intratypic differentiation (ITD):one antigenic and one molecular. Concordant non-Sabin–likeITD results are classified as wild polioviruses, concordantSabin-like results are classified as Sabin-like (vaccine virus),and any discordant results or Sabin-like isolates lacking twoITD tests are forwarded immediately for sequence analysis of
† Deficient in one of the areas examined and given a limited time to improveperformance before re-assessment.
* This system is supported by WHO member countries and the Training inEpidemiology and Public Health Interventions Network.
370 MMWR May 3, 2002
the major viral capsid surface protein (VP1). These isolatesare then classified based on the sequencing results: <1% dif-ference from Sabin vaccine virus is classified as Sabin-like,1%–15% difference is classified as VDPV, and >15% differ-ence is classified as wild virus. The effectiveness of using thisapproach was demonstrated when three cases of AFPassociated with cVDPV isolates were detected in the Philip-pines during March 2001 (6).
In addition to prospective testing, several network labora-tories have retested stored vaccine-like poliovirus isolates frombefore 2001 by using the two ITD methods andsubjecting strains with atypical results to further investiga-tion. Of the 3,423 isolates examined to date, 3,257 (95%)were typical vaccine-like viruses and 128 (4%) are pendingsequencing results (Table 2). The only highly divergent iden-tified viruses not directly associated with the outbreaks onHispaniola and in the Philippines have been three poliovi-ruses isolated from immunodeficient persons and one isolatefrom the Russian Federation in 1999 that had no clear asso-ciation with an outbreak or immunodeficiency.Reported by: Vaccines and Biologicals Dept, World HealthOrganization, Geneva, Switzerland. Div of Viral and RickettsialDiseases, National Center for Infectious Diseases; Div of International
Health, Epidemiology Program Office; Global Immunization Div,National Immunization Program, CDC.
Editorial Note: During 2000–2001, the laboratory networkinitiated genomic sequencing of all wild poliovirus isolatesand expanded its mandate to include surveillance for VDPV,which preliminary evidence indicates is rare. Laboratory sur-veillance conducted by the network documented the inter-ruption of indigenous transmission in the WesternPacific Region (7), the elimination of poliovirus lineages inremaining reservoir countries, and the importation of polio-virus into polio-free countries.
In addition to its primary functions of isolation and ITDof polioviruses (i.e., determining wild versus vaccine) fromAFP cases (8), the laboratory network provides detailedmolecular epidemiologic data on every wild poliovirus iso-lated within 90 days of onset of paralysis, and often within 60days of onset in high-priority cases. Genomic sequencinginformation and close collaboration among network labora-tories has allowed the tracking of virus strains within andamong countries and the identification of the origin ofviruses imported into polio-free countries (9).
Timeliness of reporting of stool specimen results improvedin all regions during 2000–2001, particularly in the African
TABLE 1. Number of specimens and poliovirus (PV) isolates, percentage of nonpolio enterovirus (NPEV), and laboratory reportingof results within 28 days, by World Health Organization region and year, 2000–2001
2000 2001
No. No. PV isolates % % results in No. No. PV isolates % % results inRegion specimens Wild* Sabin NPEV 28 days specimens Wild Sabin NPEV 28 daysAfrican 11,891 160 664 9% 36% 18,515 63 979 14% 88%Americas 1,495 0 31 15% NA† 3,404 0 41 15% NAEastern Mediterranean 6,110 287 145 12% 80% 7,258 140 108 15% 83%European 9,092 0 143 6% 81% 4,716 2 130 16% 91%South-East Asian 20,442 272 387 16% 94% 19,752 268 268 19% 99%Western Pacific 10,636 0 235 12% 87% 10,798 0 227 11% 92%
Total 59,666 719 1,605 12% 77% 64,443 473 1,753 15% 92%
* Number of cases with wild poliovirus isolated.†
Not available.
TABLE 2. Screening results of vaccine virus isolates with two intratypic differentiation (ITD) tests, by World Health Organizationregion, 1999–2001
Two ITD Pending cVDPV† iVDPV§ VDPV withRegion results Sabin-like* sequencing isolates isolates unknown source¶
African 197 187 10 0 0 0Americas 256 224 0 31 1 0Eastern Mediterranean 478 398 80 0 0 0European 853 824 26 0 2 1South-East Asian 1,561 1,561 0 0 0 0Western Pacific 78 63 12 3 0 0
Total 3,423 3,257 128 34 3 1* Either concordant Sabin-like results in ITD tests or <1% sequence difference compared with Sabin vaccine virus.†
Circulating vaccine-derived poliovirus.§
Vaccine-derived poliovirus associated with an immunodeficient person.¶
VDPV not associated with an outbreak or immunodeficiency.
Vol. 51 / No. 17 MMWR 371
Region, where the rate more than doubled. Although theexpected isolation rate for NPEV can vary widely because ofclimate, hygiene, and altitude, all regions achieved a rate >10%by 2001. During 2000–2001, the status of the EnterovirusResearch Center in Mumbai, India, was upgraded to a GlobalSpecialized Laboratory, and the laboratory in Pyongyang inthe Democratic People’s Republic of Korea was provisionallyaccredited. The remaining network laboratories that are notfully accredited have made arrangements to have their speci-mens processed in parallel in a fully accredited laboratory.
In 2001, the Technical Consultative Group on Polio Eradi-cation (TCG) recommended that laboratories reduce the timeinterval between paralysis onset and reporting of ITD resultsfrom 90 days to <60 days and the interval between ITDresults and sequencing of wild polioviruses to <28 days. Bythe end of 2000, almost all reports of wild poliovirus isola-tion were available within 45 days of receipt of the specimen,and sequence information about almost all critical isolates in2001 was available within 60 days of receipt of an originalstool specimen. Further progress in meeting TCG recommen-dations will require improved specimen transport among labo-ratories and more timely analysis and communication ofsequencing results.
Extending their activities and reducing time intervals hasincreased the workload of laboratories conducting ITD andsequence analysis, placing substantial pressure on the labora-tory network to meet the demands for providing essentialreagents for ITD. To ensure that regional reference laborato-ries are not overburdened, three national laboratories have beenaccredited to conduct ITD, and several more will be accred-ited during 2002. Support for laboratories in polio-free areasmust continue to ensure early detection of imported wildpoliovirus or emergence of cVDPV.
The laboratory network is developing and validating meth-ods of supplementary surveillance for polioviruses, includingenvironmental surveillance and enterovirus surveillance. Evi-dence generated through these methods will be essential forcertification of eradication in some areas of the world and forenhanced surveillance and early detection of VDPV after cer-tification. Timely integration of data from the laboratory net-work into programmatic planning of vaccination responsesand identification of the frequency and risk factors associatedwith cVDPV will be critical for planning in the final stages ofthe polio eradication effort. All regions will need to continueto support their national and regional laboratories well afterinterrupting transmission to assure the achievement and main-tenance of polio eradication globally.
References1. World Health Assembly. Global eradication of poliomyelitis by the year
2000. Geneva, Switzerland: World Health Organization, 1988 (WHAresolution no. 41.28)
2. CDC. Progress toward global eradication of poliomyelitis, 2001.MMWR 2002;51:253–6.
3. CDC. Outbreak of poliomyelitis—Dominican Republic and Haiti,2000. MMWR 2000;48:1094,1103.
4. CDC. Outbreak of poliomyelitis—Dominican Republic and Haiti,2000–2001. MMWR 2001;50:147–8.
5. CDC. Update: outbreak of poliomyelitis—Dominican Republic andHaiti, 2000–2001. MMWR 2001;50:855–6.
6. CDC. Acute flaccid paralysis associated with circulating vaccine-derivedpoliovirus—Philippines, 2001. MMWR 2001;50:874–5.
7. CDC. Certification of poliomyelitis eradication—Western PacificRegion, October 2000. MMWR 2001;50:1–3.
8. CDC. Developing and expanding contributions of the Global Labora-tory Network for Poliomyelitis Eradication, 1997–1999. MMWR2000;49:156–60.
9. CDC. Imported wild poliovirus causing poliomyelitis—Bulgaria, 2001.MMWR 2001;50:1033–5.
Trends in Deaths from SystemicLupus Erythematosus — United
States, 1979–1998Systemic lupus erythematosus (SLE) is a serious autoim-
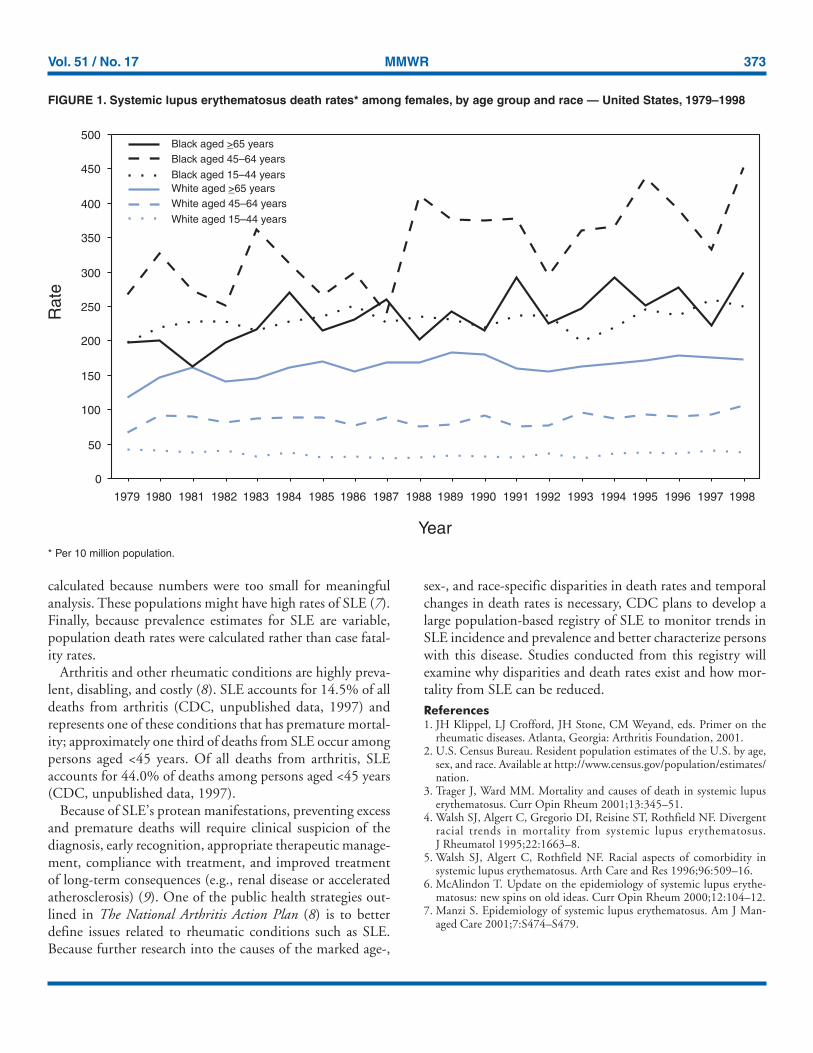
mune disease of unknown etiology that can affect severalorgans. Because SLE affects connective tissues and becausepainful joints and arthritis are among its most common mani-festations, this disease is classified with arthritis and otherrheumatic diseases (1). SLE is one of the more fatal forms ofrheumatic diseases and non-Causcasian race is a risk factorfor death from SLE; however, trends in death from SLE havenot been analyzed recently. To characterize deaths from SLE,CDC reviewed SLE deaths during 1979–1998. This reportpresents the results of that analysis, which indicate that markedage-, sex-, and race-specific disparities exist in SLE death ratesand that death rates have increased by approximately 70%during the study period among black women aged 45–64years. Prevention of deaths requires early recognition anddiagnosis of SLE and appropriate therapeutic management.
The analysis used National Center for Health StatisticsMultiple Cause-of-Death Public Use Data Tapes for 1979–1998.These national mortality statistics were based on data fromdeath certificates filed in state vital statistics offices. Demo-graphic data (e.g., age and race/ethnicity) listed on death cer-tificates were reported by funeral directors, usually frominformation provided by the decedent’s family. Causes of deathlisted on death certificates were reported by a physician,
372 MMWR May 3, 2002
medical examiner, or coroner by using a format specified bythe World Health Organization and endorsed by CDC. AnSLE death was defined as any death of a U.S. resident codedwith an underlying cause of death of systemic lupus erythe-matosus (International Classification of Diseases, Ninth Revi-sion, code 710.0). Death rates were calculated by using annualdeaths and corresponding U.S. residential population estimates(2). Death rates were calculated for whites and blacks. Ratesfor other races were not calculated because numbers were toosmall for meaningful analysis.
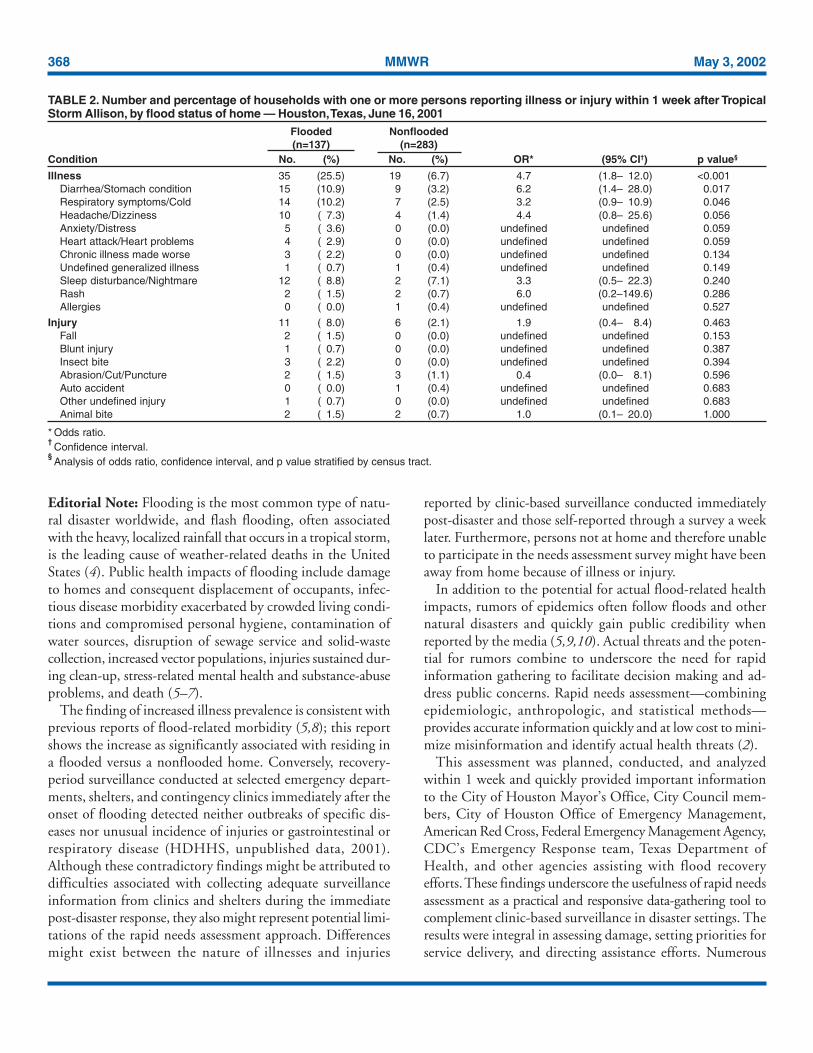
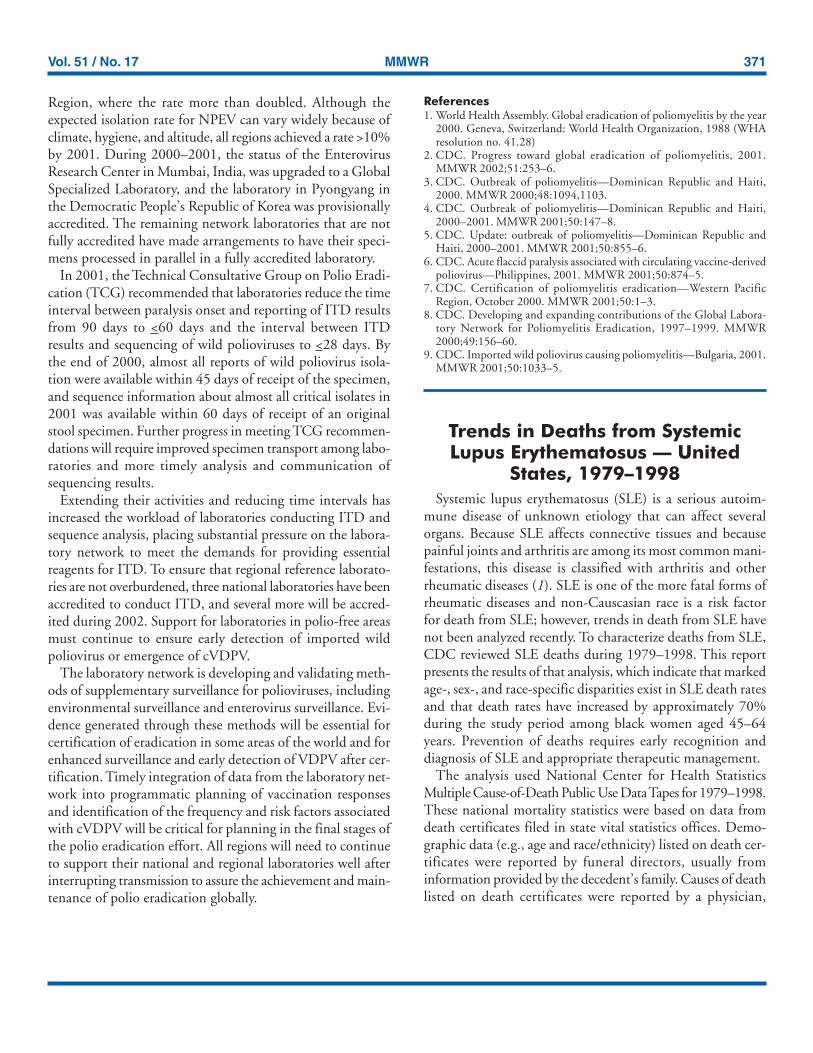
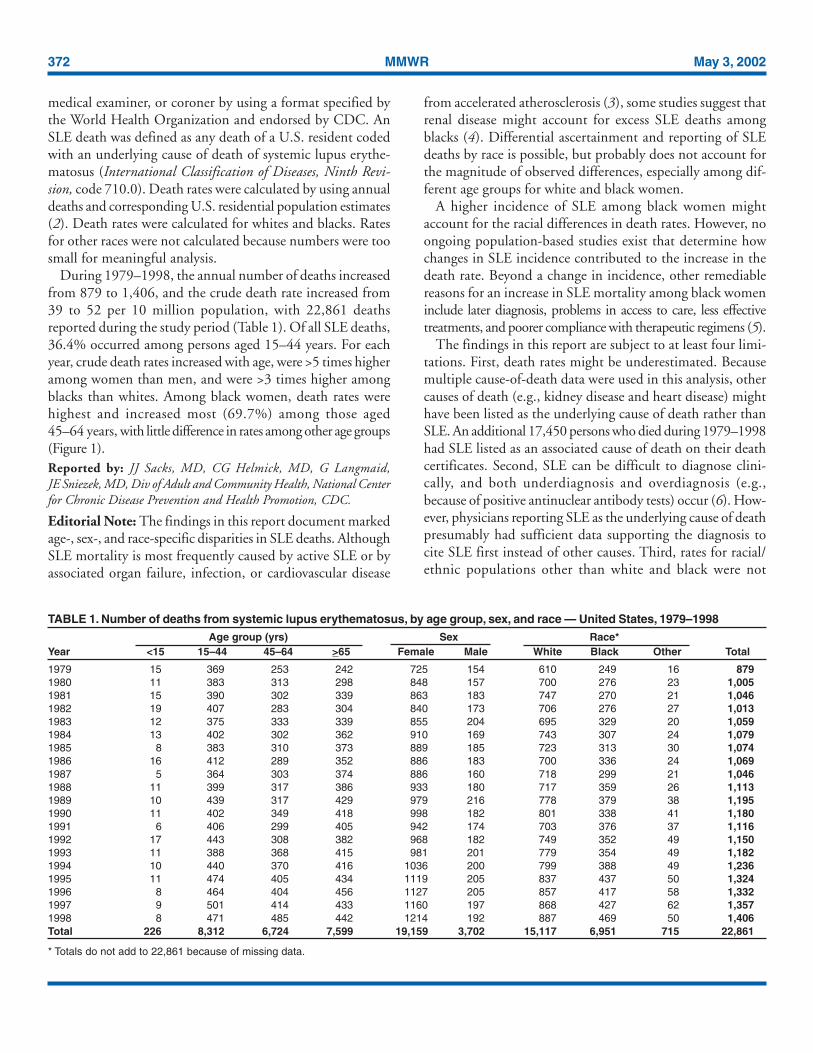
During 1979–1998, the annual number of deaths increasedfrom 879 to 1,406, and the crude death rate increased from39 to 52 per 10 million population, with 22,861 deathsreported during the study period (Table 1). Of all SLE deaths,36.4% occurred among persons aged 15–44 years. For eachyear, crude death rates increased with age, were >5 times higheramong women than men, and were >3 times higher amongblacks than whites. Among black women, death rates werehighest and increased most (69.7%) among those aged45–64 years, with little difference in rates among other age groups(Figure 1).Reported by: JJ Sacks, MD, CG Helmick, MD, G Langmaid,JE Sniezek, MD, Div of Adult and Community Health, National Centerfor Chronic Disease Prevention and Health Promotion, CDC.
Editorial Note: The findings in this report document markedage-, sex-, and race-specific disparities in SLE deaths. AlthoughSLE mortality is most frequently caused by active SLE or byassociated organ failure, infection, or cardiovascular disease
from accelerated atherosclerosis (3), some studies suggest thatrenal disease might account for excess SLE deaths amongblacks (4). Differential ascertainment and reporting of SLEdeaths by race is possible, but probably does not account forthe magnitude of observed differences, especially among dif-ferent age groups for white and black women.
A higher incidence of SLE among black women mightaccount for the racial differences in death rates. However, noongoing population-based studies exist that determine howchanges in SLE incidence contributed to the increase in thedeath rate. Beyond a change in incidence, other remediablereasons for an increase in SLE mortality among black womeninclude later diagnosis, problems in access to care, less effectivetreatments, and poorer compliance with therapeutic regimens (5).
The findings in this report are subject to at least four limi-tations. First, death rates might be underestimated. Becausemultiple cause-of-death data were used in this analysis, othercauses of death (e.g., kidney disease and heart disease) mighthave been listed as the underlying cause of death rather thanSLE. An additional 17,450 persons who died during 1979–1998had SLE listed as an associated cause of death on their deathcertificates. Second, SLE can be difficult to diagnose clini-cally, and both underdiagnosis and overdiagnosis (e.g.,because of positive antinuclear antibody tests) occur (6). How-ever, physicians reporting SLE as the underlying cause of deathpresumably had sufficient data supporting the diagnosis tocite SLE first instead of other causes. Third, rates for racial/ethnic populations other than white and black were not
TABLE 1. Number of deaths from systemic lupus erythematosus, by age group, sex, and race — United States, 1979–1998Age group (yrs) Sex Race*
Year <15 15–44 45–64 >65 Female Male White Black Other Total
1979 15 369 253 242 725 154 610 249 16 8791980 11 383 313 298 848 157 700 276 23 1,0051981 15 390 302 339 863 183 747 270 21 1,0461982 19 407 283 304 840 173 706 276 27 1,0131983 12 375 333 339 855 204 695 329 20 1,0591984 13 402 302 362 910 169 743 307 24 1,0791985 8 383 310 373 889 185 723 313 30 1,0741986 16 412 289 352 886 183 700 336 24 1,0691987 5 364 303 374 886 160 718 299 21 1,0461988 11 399 317 386 933 180 717 359 26 1,1131989 10 439 317 429 979 216 778 379 38 1,1951990 11 402 349 418 998 182 801 338 41 1,1801991 6 406 299 405 942 174 703 376 37 1,1161992 17 443 308 382 968 182 749 352 49 1,1501993 11 388 368 415 981 201 779 354 49 1,1821994 10 440 370 416 1036 200 799 388 49 1,2361995 11 474 405 434 1119 205 837 437 50 1,3241996 8 464 404 456 1127 205 857 417 58 1,3321997 9 501 414 433 1160 197 868 427 62 1,3571998 8 471 485 442 1214 192 887 469 50 1,406Total 226 8,312 6,724 7,599 19,159 3,702 15,117 6,951 715 22,861
* Totals do not add to 22,861 because of missing data.
Vol. 51 / No. 17 MMWR 373
calculated because numbers were too small for meaningfulanalysis. These populations might have high rates of SLE (7).Finally, because prevalence estimates for SLE are variable,population death rates were calculated rather than case fatal-ity rates.
Arthritis and other rheumatic conditions are highly preva-lent, disabling, and costly (8). SLE accounts for 14.5% of alldeaths from arthritis (CDC, unpublished data, 1997) andrepresents one of these conditions that has premature mortal-ity; approximately one third of deaths from SLE occur amongpersons aged <45 years. Of all deaths from arthritis, SLEaccounts for 44.0% of deaths among persons aged <45 years(CDC, unpublished data, 1997).
Because of SLE’s protean manifestations, preventing excessand premature deaths will require clinical suspicion of thediagnosis, early recognition, appropriate therapeutic manage-ment, compliance with treatment, and improved treatmentof long-term consequences (e.g., renal disease or acceleratedatherosclerosis) (9). One of the public health strategies out-lined in The National Arthritis Action Plan (8) is to betterdefine issues related to rheumatic conditions such as SLE.Because further research into the causes of the marked age-,
sex-, and race-specific disparities in death rates and temporalchanges in death rates is necessary, CDC plans to develop alarge population-based registry of SLE to monitor trends inSLE incidence and prevalence and better characterize personswith this disease. Studies conducted from this registry willexamine why disparities and death rates exist and how mor-tality from SLE can be reduced.References1. JH Klippel, LJ Crofford, JH Stone, CM Weyand, eds. Primer on the
rheumatic diseases. Atlanta, Georgia: Arthritis Foundation, 2001.2. U.S. Census Bureau. Resident population estimates of the U.S. by age,
sex, and race. Available at http://www.census.gov/population/estimates/nation.
3. Trager J, Ward MM. Mortality and causes of death in systemic lupuserythematosus. Curr Opin Rheum 2001;13:345–51.
4. Walsh SJ, Algert C, Gregorio DI, Reisine ST, Rothfield NF. Divergentracial trends in mortality from systemic lupus erythematosus.J Rheumatol 1995;22:1663–8.
5. Walsh SJ, Algert C, Rothfield NF. Racial aspects of comorbidity insystemic lupus erythematosus. Arth Care and Res 1996;96:509–16.
6. McAlindon T. Update on the epidemiology of systemic lupus erythe-matosus: new spins on old ideas. Curr Opin Rheum 2000;12:104–12.
7. Manzi S. Epidemiology of systemic lupus erythematosus. Am J Man-aged Care 2001;7:S474–S479.
0
50
100
150
200
250
300
350
400
450
500
1979 1980 1981 1982 1983 1984 1985 1986 1987 1988 1989 1990 1991 1992 1993 1994 1995 1996 1997 1998
Year
Rat
e
Black aged 65 years>Black aged 45–64 years
Black aged 15–44 yearsWhite aged 65 years>White aged 45–64 years
White aged 15–44 years
FIGURE 1. Systemic lupus erythematosus death rates* among females, by age group and race — United States, 1979–1998
* Per 10 million population.
374 MMWR May 3, 2002
8. Arthritis Foundation, Association of State and Territorial Health Offi-cials, CDC. National arthritis action plan: a public health strategy.Atlanta, Georgia: Arthritis Foundation, 1999.
9. American College of Rheumatology Ad Hoc Committee on SystemicLupus Erythematosus. Guidelines for referral and management of sys-temic lupus erythematosus in adults. Arth Rheum 1999;42:1785–96.
Notice to Readers
Interpretation of Provisional DataPresented in Morbidity and Mortality
Weekly Report TablesPeriodically, readers of MMWR interpret provisional data
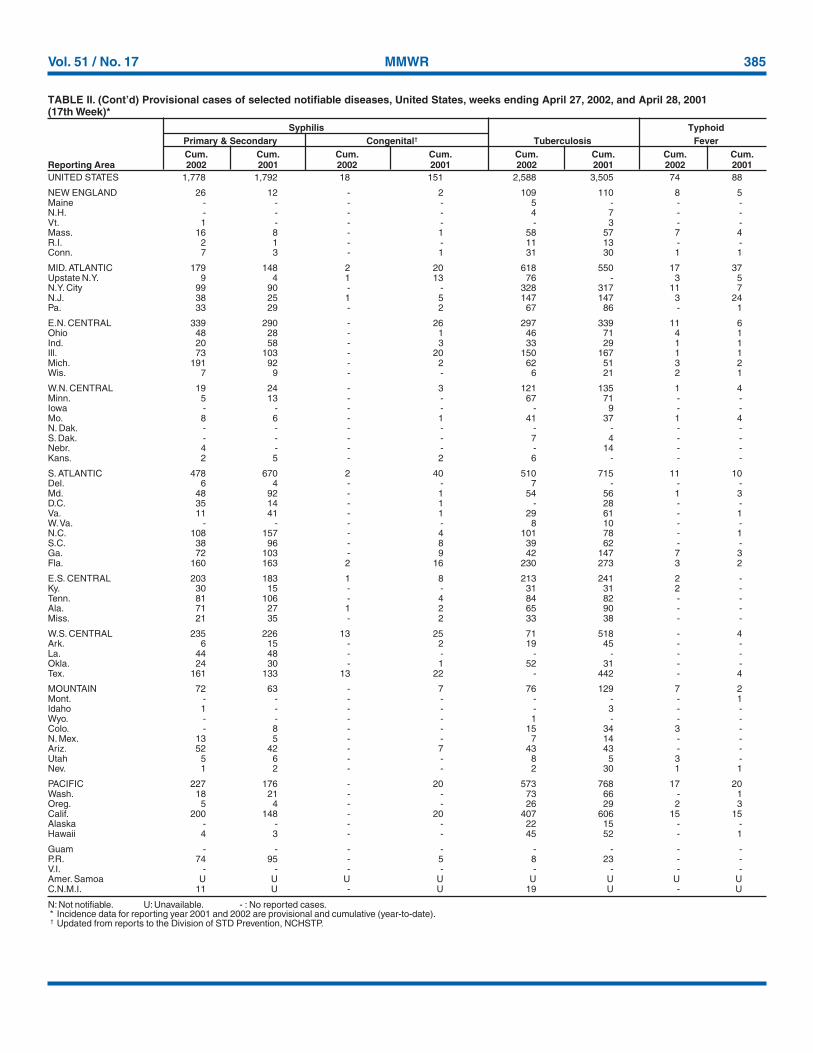
about the incidence of notifiable infectious disease presentedin MMWR incorrectly as finalized incidence data. Thisoccurred recently in a media report that included a misinter-pretation of the provisional acquired immunodeficiency syn-drome (AIDS) data reported to the National NotifiableDiseases Surveillance System (NNDSS) and presented inMMWR Table II (1). Although the characteristics of theMMWR morbidity data (provisional versus finalized) are foot-noted, this notice reminds readers about the different charac-teristics of provisional and finalized data.
Provisional NNDSS data are a running count of infectiousdisease (including AIDS) cases that have not been adjustedfor variations in reporting procedures across different statesor for delays in reporting. In addition, data in MMWR Table IIreflect the date cases were reported to CDC rather than thedate persons were actually diagnosed with the notifiable con-dition. Morbidity data adjusted to reflect the number of noti-fiable disease cases diagnosed during a given year reflect diseaseincidence trends more accurately than a comparison of end-of-year provisional data (e.g., week 52 data for a current year)with finalized data. For example, although 46,143 AIDS caseswere reported to CDC in 1999, an estimated 41,850 personswere diagnosed with AIDS; duplicates, errors, or persons whohad AIDS diagnosed earlier than 1999 accounted for theremainder of cases (2).
To provide timely NNDSS data, state and territorial healthdepartments voluntarily report notifiable disease incidencedata to CDC as soon as they become aware of these cases.These provisional data are published each week in MMWRto disseminate the most current national information aboutinfectious diseases to public health officials and health-careproviders so they can initiate prevention and control activi-ties. These data include case reports considered “suspect” or“probable” for surveillance purposes in addition to those con-sidered “confirmed”(3). As a result, provisional data are sub-ject to change based on the outcome of further caseinvestigation. As part of the process for finalizing surveillance
data, provisional NNDSS data, including AIDS incidencedata, also are adjusted for variations in reporting practicesand delayed reporting. CDC amends and edits provisionaldata periodically throughout the year as updates are reportedby states. The process for finalizing case counts can take severalmonths to complete after the end of the year. Cumulative (i.e.,year-to-date) incidence data from the previous year also arepresented in Table II as a crude method to identify aberra-tions or discrepancies in reported disease incidence data—whether because of disease incidence or reporting artifacts.Because of differences in timing of reports, the source of thedata, and the use of different case definitions, NNDSS datapublished in the weekly edition of MMWR also might differfrom data published in other CDC surveillance reports.References1. CDC. Table II. Provisional cases of selected notifiable diseases, United
States, weeks ending December 29, 2001 and December 30, 2000 (52ndweek). MMWR 2002;51&52:1170–3.
2. CDC. Letter dated January 22, 2002 to the Editor, Knight Ridder Wash-ington Bureau, from Harold W. Jaffe, MD, Acting Director of theNational Center for HIV, STD, and TB Prevention.
3. CDC. Case definitions for infectious conditions under public healthsurveillance. MMWR 1997;46(no. RR-10).
Notice to Readers
National Arthritis Month — May 2002May is National Arthritis Month. Systemic lupus erythe-
matosus, one of more than 100 arthritis and rheumatic con-ditions, is a chronic and potentially life-threateninginflammatory disease that can affect various parts of the body,especially the skin, joints, blood, and kidneys. Arthritis andother rheumatic conditions are the leading cause of disabilityin the United States, affecting approximately 43 million per-sons in 1997 and possibly 60 million by 2020 (1,2). Earlydiagnosis and appropriate management are needed for bettercontrol of arthritis. CDC, the Arthritis Foundation, theLupus Foundation of America, and other organizationscontinue to work to meet the goals of the National ArthritisAction Plan: A Public Health Strategy (3) and the arthritis-related national health objectives for 2010 (4).
Additional information about arthritis, National ArthritisMonth, Arthritis Action Day, the National Arthritis ActionPlan, and local Arthritis Foundation programs and servicesis available from the Arthritis Foundation, telephone800-283-7800, or at http://www.arthritis.org. Informationabout systemic lupus erythematosus, patient educationprograms, and support services is available from the LupusFoundation of America, telephone 800-558-0121, or athttp://www.lupus.org.
Vol. 51 / No. 17 MMWR 375
References1. CDC. Prevalence of disabilities and associated health conditions among
adults—United States, 1999. MMWR 2001;50:120–5.2. CDC. Arthritis prevalence and activity limitations—United States, 1990.
MMWR 1994;43:433–8.3. Arthritis Foundation, Association of State and Territorial Health Offi-
cials, and CDC. National arthritis action plan: a public health strategy.Atlanta, Georgia: Arthritis Foundation, 1999.
4. U.S. Department of Health and Human Services. Healthy people 2010(conference ed., 2 vols). Washington, DC: U.S. Department of Healthand Human Services, 2000.
Notice to Readers
Satellite Broadcast: EnhancingEnvironmental Health Services
in the 21st Century“Enhancing Environmental Health Services in the 21st
Century,” a live, interactive satellite program, will be broad-cast Thursday, May 9, 2002, from 1:00–2:30 p.m., EST.During this program, environmental health services (EHS)experts will address six goals CDC developed in collabora-tion with its many environmental health partners to revitalizethe EHS system. The program will highlight the issues, chal-lenges, and activities facing the EHS system in the 21st cen-tury. The broadcast will feature a question-and-answer sessionin which participants nationwide can interact with CDC staffthrough toll-free telephone lines.
Environmental health services and sanitation have beenan important part of public health in the United States formany decades. In recent years, the capabilities of the EHSsystem at state, tribal, territorial, and local levels havedecreased. The emergence of many new issues and threats(e.g., Cryptosporidium in drinking water, hantavirus, E. coliO157:H7, West Nile virus, and domestic terrorism) under-score the need for a well-prepared EHS system and workforcethat can anticipate, recognize, and respond to these types ofthreats.
This broadcast is designed for environmental health practi-tioners and managers, directors of health departments andother public health officials, environmental health programdirectors and managers, agriculture program directors andmanagers, food protection program directors and managers,public health nurses, environmental protection practitioners,policy makers, boards of health, academic institutions,national advocacy organizations, and civic leaders.
Additional information about the program is availableat http://www.phppo.cdc.gov/phtn/envhlth. Registration isavailable at http://www.phppo.cdc.gov/phtnonline.Assistance registering online is available at 800-418-7246 or404-639-1292.
Notice to Readers
Public Meeting: Annual Report onAntimicrobial Resistance Action Plan
A public meeting will be held June 26, 2002, to present thefirst annual report on implementation of “A Public HealthAction Plan to Combat Antimicrobial Resistance (Part I:Domestic Issues)” and to receive comments from the public.The plan was prepared by the Interagency Task Force onAntimicrobial Resistance, co-chaired by CDC, the Food andDrug Administration, the National Institutes of Health, andseven other federal agencies and departments. The meetingwill be from 10:00 a.m.–5:00 p.m., EST at the Holiday InnSelect, Versailles Ballroom, 8120 Wisconsin Avenue, Bethesda,Maryland, 20814, telephone 877-888-3001.
Time will be available for oral questions, comments, andsuggestions from the public. A time limit of 3 minutes mightbe imposed. Visual aids will not be permitted, although writ-ten material may be submitted for subsequent review by thetask force.
The Action Plan is available at http://www.cdc.gov/drugresistance; the meeting agenda and annual report will beposted when available. Persons who anticipate attending themeeting should send written notification by June 22, 2002,including name, organization (if applicable), address, phone,fax, and e-mail address. Written comments and suggestionsshould be submitted by July 31, 2002. Notification of atten-dance and/or written comments should be submitted toMs. Vickie Garrett, Antimicrobial Resistance, CDC, 1600Clifton Rd., MS C-12, Atlanta, GA 30333; telephone 404-639-2603; fax 404-639-4197; or e-mail [email protected].
376 MMWR May 3, 2002
Notice to Readers
Applied EpidemiologyCDC and Emory University’s Rollins School of Public
Health will co-sponsor a course, “International Course inApplied Epidemiology,” during September 30–October 25,2002, in Atlanta, Georgia. The course is directed at publichealth professionals from countries other than the UnitedStates and will include presentations and discussions of epi-demiologic principles, basic statistical analysis, public healthsurveillance, field investigations, surveys and sampling, anddiscussions of the epidemiologic aspects of current majorpublic health problems in international health. Included aresmall group discussions of epidemiologic case exercises basedon field investigations. Participants are encouraged to give ashort presentation reviewing some epidemiologic data fromtheir own country.
Computer training using Epi Info 2000 (Windows version),a software program developed by CDC and the World HealthOrganization for epidemiologists, is included. Prerequisitesinclude familiarity with the vocabulary and principles ofbasic epidemiology or completion of CDC’s “Principles ofEpidemiology” home-study course (SS3030) or equivalent.Preference will be given to applicants whose work involvespriority public health problems in international health. Earlyregistration deadline is June 1, 2002; late registration dead-line is September 1, 2002. There is a tuition charge.
Additional information and applications are available fromEmory University’s Rollins School of Public Health, Interna-tional Health Dept. (PIA), 1518 Clifton Rd. N.E., Rm. 746,Atlanta, GA 30322; telephone 404-727-3485; fax 404-727-4590;or at http://www.sph.emory.edu/epicourses, or [email protected].
Vol. 51 / No. 17 MMWR 377
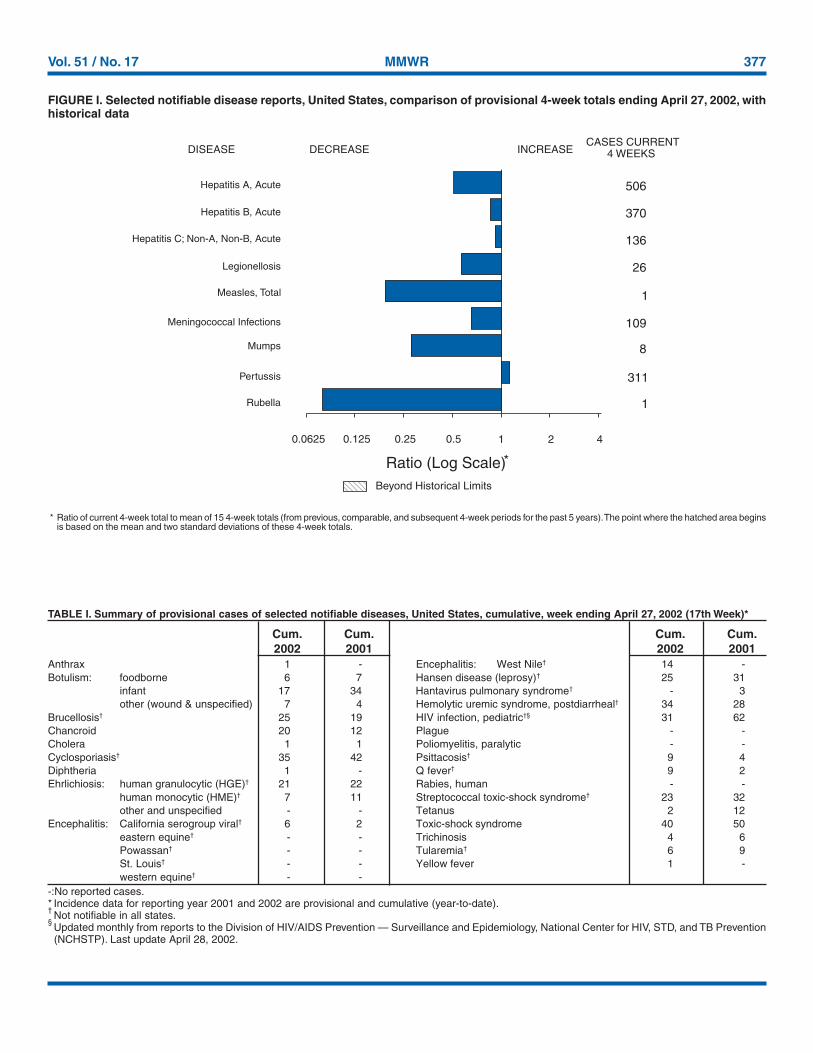
FIGURE I. Selected notifiable disease reports, United States, comparison of provisional 4-week totals ending April 27, 2002, withhistorical data
* Ratio of current 4-week total to mean of 15 4-week totals (from previous, comparable, and subsequent 4-week periods for the past 5 years). The point where the hatched area beginsis based on the mean and two standard deviations of these 4-week totals.
DISEASE DECREASE INCREASECASES CURRENT
4 WEEKS
Ratio (Log Scale)*
Beyond Historical Limits
4210.50.250.125
506
370
136
26
1
109
8
311
1
Hepatitis A, Acute
Hepatitis B, Acute
Hepatitis C; Non-A, Non-B, Acute
Legionellosis
Measles, Total
Mumps
Pertussis
Rubella
Meningococcal Infections
0.0625
TABLE I. Summary of provisional cases of selected notifiable diseases, United States, cumulative, week ending April 27, 2002 (17th Week)*
Anthrax 1 - Encephalitis: West Nile† 14 -Botulism: foodborne 6 7 Hansen disease (leprosy)† 25 31
infant 17 34 Hantavirus pulmonary syndrome† - 3other (wound & unspecified) 7 4 Hemolytic uremic syndrome, postdiarrheal† 34 28
Brucellosis† 25 19 HIV infection, pediatric†§ 31 62Chancroid 20 12 Plague - -Cholera 1 1 Poliomyelitis, paralytic - -Cyclosporiasis† 35 42 Psittacosis† 9 4Diphtheria 1 - Q fever† 9 2Ehrlichiosis: human granulocytic (HGE)† 21 22 Rabies, human - -
human monocytic (HME)† 7 11 Streptococcal toxic-shock syndrome† 23 32other and unspecified - - Tetanus 2 12
Encephalitis: California serogroup viral† 6 2 Toxic-shock syndrome 40 50eastern equine† - - Trichinosis 4 6Powassan† - - Tularemia† 6 9St. Louis† - - Yellow fever 1 -western equine† - -
Cum. Cum. Cum. Cum.2002 2001 2002 2001
-:No reported cases.* Incidence data for reporting year 2001 and 2002 are provisional and cumulative (year-to-date).†Not notifiable in all states.
§Updated monthly from reports to the Division of HIV/AIDS Prevention — Surveillance and Epidemiology, National Center for HIV, STD, and TB Prevention(NCHSTP). Last update April 28, 2002.
378 MMWR May 3, 2002
N: Not notifiable. U: Unavailable. -: No reported cases. C.N.M.I.: Commonwealth of Northern Mariana Islands.* Incidence data for reporting year 2001 and 2002 are provisional and cumulative (year-to-date).† Chlamydia refers to genital infections caused by C. trachomatis.§ Updated monthly from reports to the Division of HIV/AIDS Prevention — Surveillance and Epidemiology, National Center for HIV, STD, and TB Prevention. Last update
April 28, 2002.
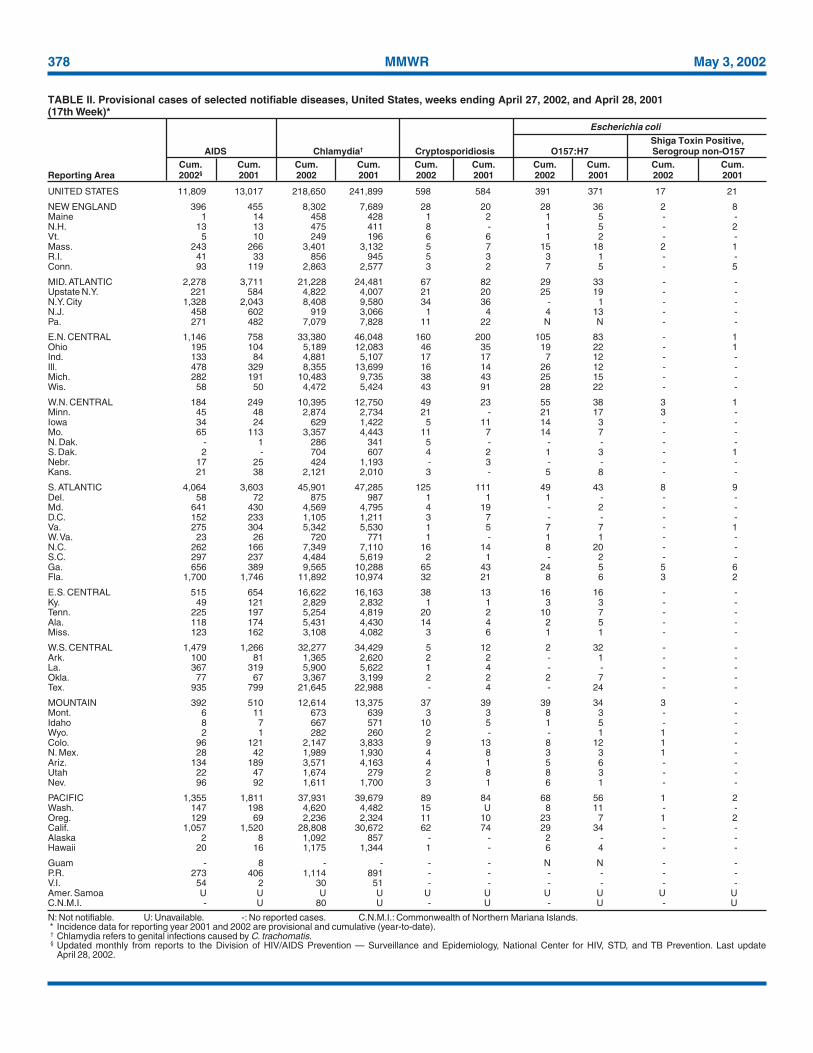
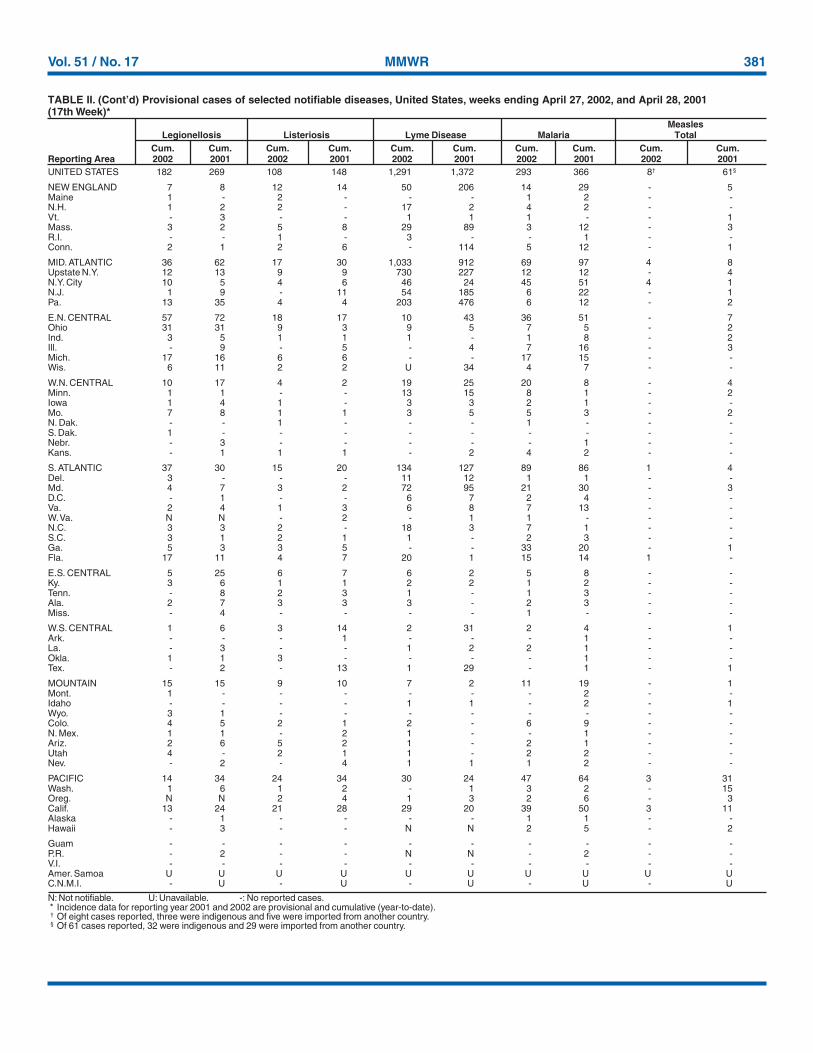
TABLE II. Provisional cases of selected notifiable diseases, United States, weeks ending April 27, 2002, and April 28, 2001(17th Week)*
UNITED STATES 11,809 13,017 218,650 241,899 598 584 391 371 17 21
NEW ENGLAND 396 455 8,302 7,689 28 20 28 36 2 8Maine 1 14 458 428 1 2 1 5 - -N.H. 13 13 475 411 8 - 1 5 - 2Vt. 5 10 249 196 6 6 1 2 - -Mass. 243 266 3,401 3,132 5 7 15 18 2 1R.I. 41 33 856 945 5 3 3 1 - -Conn. 93 119 2,863 2,577 3 2 7 5 - 5
MID. ATLANTIC 2,278 3,711 21,228 24,481 67 82 29 33 - -Upstate N.Y. 221 584 4,822 4,007 21 20 25 19 - -N.Y. City 1,328 2,043 8,408 9,580 34 36 - 1 - -N.J. 458 602 919 3,066 1 4 4 13 - -Pa. 271 482 7,079 7,828 11 22 N N - -
E.N. CENTRAL 1,146 758 33,380 46,048 160 200 105 83 - 1Ohio 195 104 5,189 12,083 46 35 19 22 - 1Ind. 133 84 4,881 5,107 17 17 7 12 - -Ill. 478 329 8,355 13,699 16 14 26 12 - -Mich. 282 191 10,483 9,735 38 43 25 15 - -Wis. 58 50 4,472 5,424 43 91 28 22 - -
W.N. CENTRAL 184 249 10,395 12,750 49 23 55 38 3 1Minn. 45 48 2,874 2,734 21 - 21 17 3 -Iowa 34 24 629 1,422 5 11 14 3 - -Mo. 65 113 3,357 4,443 11 7 14 7 - -N. Dak. - 1 286 341 5 - - - - -S. Dak. 2 - 704 607 4 2 1 3 - 1Nebr. 17 25 424 1,193 - 3 - - - -Kans. 21 38 2,121 2,010 3 - 5 8 - -
S. ATLANTIC 4,064 3,603 45,901 47,285 125 111 49 43 8 9Del. 58 72 875 987 1 1 1 - - -Md. 641 430 4,569 4,795 4 19 - 2 - -D.C. 152 233 1,105 1,211 3 7 - - - -Va. 275 304 5,342 5,530 1 5 7 7 - 1W. Va. 23 26 720 771 1 - 1 1 - -N.C. 262 166 7,349 7,110 16 14 8 20 - -S.C. 297 237 4,484 5,619 2 1 - 2 - -Ga. 656 389 9,565 10,288 65 43 24 5 5 6Fla. 1,700 1,746 11,892 10,974 32 21 8 6 3 2
E.S. CENTRAL 515 654 16,622 16,163 38 13 16 16 - -Ky. 49 121 2,829 2,832 1 1 3 3 - -Tenn. 225 197 5,254 4,819 20 2 10 7 - -Ala. 118 174 5,431 4,430 14 4 2 5 - -Miss. 123 162 3,108 4,082 3 6 1 1 - -
W.S. CENTRAL 1,479 1,266 32,277 34,429 5 12 2 32 - -Ark. 100 81 1,365 2,620 2 2 - 1 - -La. 367 319 5,900 5,622 1 4 - - - -Okla. 77 67 3,367 3,199 2 2 2 7 - -Tex. 935 799 21,645 22,988 - 4 - 24 - -
MOUNTAIN 392 510 12,614 13,375 37 39 39 34 3 -Mont. 6 11 673 639 3 3 8 3 - -Idaho 8 7 667 571 10 5 1 5 - -Wyo. 2 1 282 260 2 - - 1 1 -Colo. 96 121 2,147 3,833 9 13 8 12 1 -N. Mex. 28 42 1,989 1,930 4 8 3 3 1 -Ariz. 134 189 3,571 4,163 4 1 5 6 - -Utah 22 47 1,674 279 2 8 8 3 - -Nev. 96 92 1,611 1,700 3 1 6 1 - -
PACIFIC 1,355 1,811 37,931 39,679 89 84 68 56 1 2Wash. 147 198 4,620 4,482 15 U 8 11 - -Oreg. 129 69 2,236 2,324 11 10 23 7 1 2Calif. 1,057 1,520 28,808 30,672 62 74 29 34 - -Alaska 2 8 1,092 857 - - 2 - - -Hawaii 20 16 1,175 1,344 1 - 6 4 - -
Guam - 8 - - - - N N - -P.R. 273 406 1,114 891 - - - - - -V.I. 54 2 30 51 - - - - - -Amer. Samoa U U U U U U U U U UC.N.M.I. - U 80 U - U - U - U
Shiga Toxin Positive,AIDS Chlamydia† Cryptosporidiosis O157:H7 Serogroup non-O157
Cum. Cum. Cum. Cum. Cum. Cum. Cum. Cum. Cum. Cum.Reporting Area 2002§ 2001 2002 2001 2002 2001 2002 2001 2002 2001
Escherichia coli
Vol. 51 / No. 17 MMWR 379
N: Not notifiable. U: Unavailable. - : No reported cases.* Incidence data for reporting year 2001 and 2002 are provisional and cumulative (year-to-date).
UNITED STATES 3 3 4,070 93,576 110,300 554 572 4 9
NEW ENGLAND - - 448 2,520 2,044 45 19 - 1Maine - - 56 22 45 1 1 - -N.H. - - 17 39 43 4 - - -Vt. - - 35 34 28 3 - - -Mass. - - 193 1,126 933 19 16 - 1R.I. - - 36 304 245 8 - - -Conn. - - 111 995 750 10 2 - -
MID. ATLANTIC - - 858 9,445 11,683 94 85 1 -Upstate N.Y. - - 327 2,609 2,479 49 20 1 -N.Y. City - - 382 3,421 4,020 27 24 - -N.J. - - - 651 1,411 10 35 - -Pa. - - 149 2,764 3,773 8 6 - -
E.N. CENTRAL 2 2 767 15,871 23,299 70 87 1 1Ohio 2 2 269 2,853 6,377 41 27 - 1Ind. - - - 2,200 2,136 16 16 - -Ill. - - 126 4,684 7,270 - 32 - -Mich. - - 259 4,631 5,618 8 4 1 -Wis. - - 113 1,503 1,898 5 8 - -
W.N. CENTRAL - - 476 4,447 5,188 19 19 - 1Minn. - - 192 890 846 14 9 - -Iowa - - 77 170 379 1 - - -Mo. - - 141 2,302 2,555 2 9 - -N. Dak. - - 6 13 11 - - - -S. Dak. - - 20 84 72 - - - -Nebr. - - - 131 439 - 1 - 1Kans. - - 40 857 886 2 - - -
S. ATLANTIC - - 735 26,426 29,293 151 169 - 1Del. - - 14 558 528 - - - -Md. - - 32 2,542 2,783 37 41 - -D.C. - - 14 943 1,029 - - - -Va. - - 52 3,457 2,919 8 9 - -W. Va. - - 9 304 168 2 4 - 1N.C. - - - 4,748 5,899 13 22 - -S.C. - - 11 2,587 4,305 3 3 - -Ga. - - 280 5,035 5,540 56 46 - -Fla. - - 323 6,252 6,122 32 44 - -
E.S. CENTRAL - 1 99 9,376 10,299 20 32 1 -Ky. - 1 - 1,099 1,091 2 1 - -Tenn. - - 43 2,875 3,165 11 12 - -Ala. - - 56 3,488 3,482 5 17 1 -Miss. - - - 1,914 2,561 2 2 - -
W.S. CENTRAL - - 14 14,418 16,537 21 17 - 1Ark. - - 14 873 1,677 1 - - -La. - - - 3,706 3,804 1 2 - -Okla. - - - 1,476 1,498 19 14 - -Tex. - - - 8,363 9,558 - 1 - 1
MOUNTAIN 1 - 371 2,969 3,221 77 76 1 2Mont. - - 25 38 34 - - - -Idaho - - 19 28 29 1 1 - -Wyo. - - 2 20 17 1 - - -Colo. 1 - 124 1,035 1,072 16 17 - -N. Mex. - - 47 368 318 14 12 - -Ariz. - - 48 864 1,102 35 37 1 1Utah - - 67 132 26 8 2 - -Nev. - - 39 484 623 2 7 - 1
PACIFIC - - 302 8,104 8,736 57 68 - 2Wash. - - 117 973 1,002 1 1 - -Oreg. - - 125 286 390 30 18 - -Calif. - - - 6,509 7,013 9 32 - 2Alaska - - 24 183 107 1 1 - -Hawaii - - 36 153 224 16 16 - -
Guam - - - - - - - - -P.R. - - - 206 223 - - - -V.I. - - - 17 7 - - - -Amer. Samoa U U U U U U U U UC.N.M.I. - U - 5 U - U - U
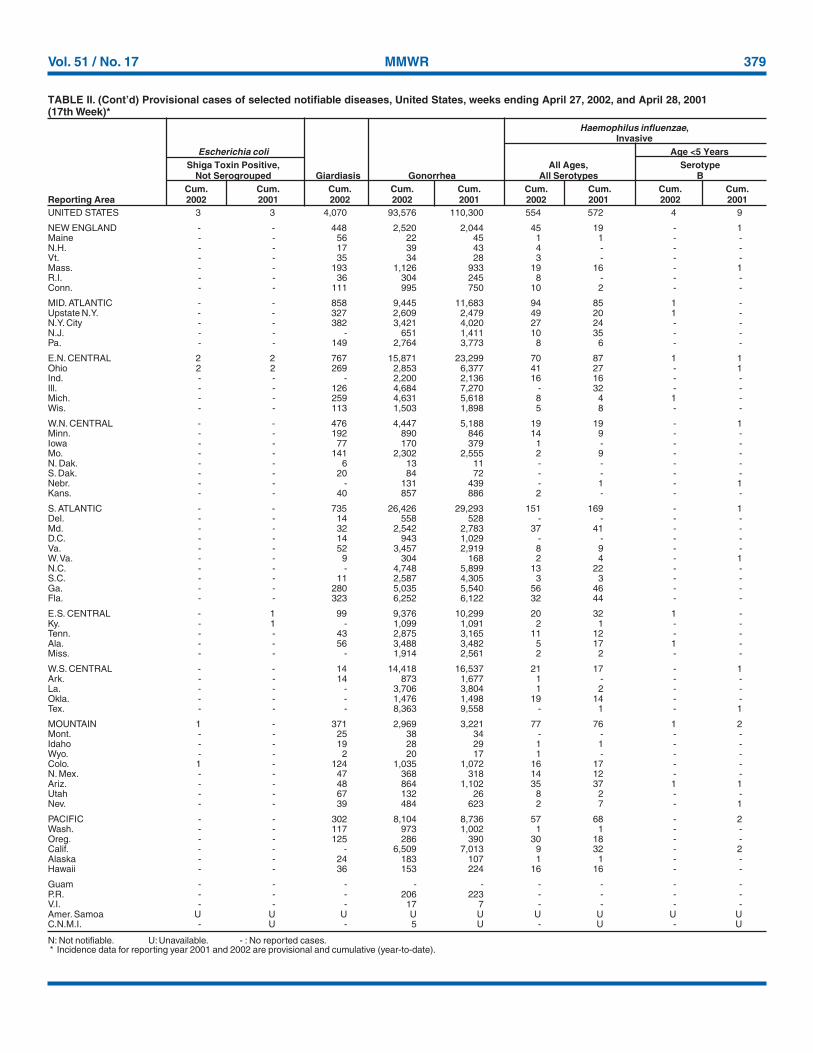
TABLE II. (Cont’d) Provisional cases of selected notifiable diseases, United States, weeks ending April 27, 2002, and April 28, 2001(17th Week)*
Haemophilus influenzae,Invasive
Escherichia coli Age <5 YearsShiga Toxin Positive, All Ages, Serotype
Not Serogrouped Giardiasis Gonorrhea All Serotypes BCum. Cum. Cum. Cum. Cum. Cum. Cum. Cum. Cum.
Reporting Area 2002 2001 2002 2002 2001 2002 2001 2002 2001
380 MMWR May 3, 2002
N: Not notifiable. U: Unavailable. -: No reported cases.* Incidence data for reporting year 2001 and 2002 are provisional and cumulative (year-to-date).
UNITED STATES 96 105 5 11 2,793 3,787 1,902 2,364 650 1,622
NEW ENGLAND 5 5 - - 128 148 64 42 13 20Maine - - - - 4 3 1 3 - -N.H. - - - - 6 4 5 6 - -Vt. - - - - - 2 2 3 6 5Mass. 3 4 - - 61 50 35 8 7 15R.I. - - - - 17 6 9 6 - -Conn. 2 1 - - 40 83 12 16 - -
MID. ATLANTIC 14 14 - - 355 449 450 495 221 770Upstate N.Y. 7 2 - - 63 80 43 38 18 10N.Y. City 5 4 - - 156 132 263 212 - -N.J. 2 4 - - 38 177 76 149 197 736Pa. - 4 - - 98 60 68 96 6 24
E.N. CENTRAL 11 16 - 1 370 756 273 227 33 88Ohio 5 3 - - 123 90 31 41 5 5Ind. 5 4 - 1 19 33 9 6 - -Ill. - 7 - - 103 481 21 20 4 20Mich. - - - - 85 123 212 160 24 63Wis. 1 2 - - 40 29 - - - -
W.N. CENTRAL 2 1 2 2 120 130 65 77 189 449Minn. 2 1 1 - 19 9 3 6 - -Iowa - - - - 30 14 9 6 1 -Mo. - - 1 2 24 27 44 49 188 445N. Dak. - - - - 1 - 1 - - -S. Dak. - - - - 3 1 - 1 - -Nebr. - - - - - 19 - 6 - 1Kans. - - - - 43 60 8 9 - 3
S. ATLANTIC 24 30 - 4 870 662 520 545 53 34Del. - - - - 3 3 2 5 3 1Md. 1 4 - - 110 82 43 49 8 8D.C. - - - - 31 15 9 3 - -Va. 2 4 - - 30 45 65 44 1 -W. Va. - - - - 9 2 11 8 1 4N.C. 1 1 - 4 105 38 72 83 8 7S.C. 1 1 - - 17 21 22 5 3 2Ga. 13 13 - - 206 287 183 232 10 1Fla. 6 7 - - 359 169 113 116 19 11
E.S. CENTRAL 4 6 - 1 54 102 56 129 64 30Ky. - - - - 23 16 13 18 1 3Tenn. 2 2 - - - 44 - 42 15 21Ala. 2 3 - 1 12 36 21 37 2 1Miss. - 1 - - 19 6 22 32 46 5
W.S. CENTRAL 4 3 - - 34 636 95 275 4 167Ark. - - - - 11 18 26 34 - 3La. - - - - 10 38 6 37 4 81Okla. 4 3 - - 12 57 1 31 - 2Tex. - - - - 1 523 62 173 - 81
MOUNTAIN 18 8 2 1 191 251 125 165 23 26Mont. - - - - 5 4 3 1 - -Idaho - - - - - 26 - 4 - 1Wyo. - - - - 3 1 6 - 4 4Colo. 2 - - - 36 26 34 37 13 5N. Mex. 4 5 - 1 6 8 15 38 - 9Ariz. 8 3 1 - 98 131 41 59 - 4Utah 3 - - - 19 22 11 10 - -Nev. 1 - 1 - 24 33 15 16 6 3
PACIFIC 14 22 1 2 671 653 254 409 50 38Wash. 1 - - 1 51 24 18 31 4 9Oreg. 4 3 - - 37 45 47 57 7 6Calif. 6 18 1 1 576 568 184 310 39 23Alaska 1 - - - 7 10 3 3 - -Hawaii 2 1 - - - 6 2 8 - -
Guam - - - - - - - - - -P.R. - - - - 25 42 15 69 - 1V.I. - - - - - - - - - -Amer. Samoa U U U U U U U U U UC.N.M.I. - U - U - U 22 U - U
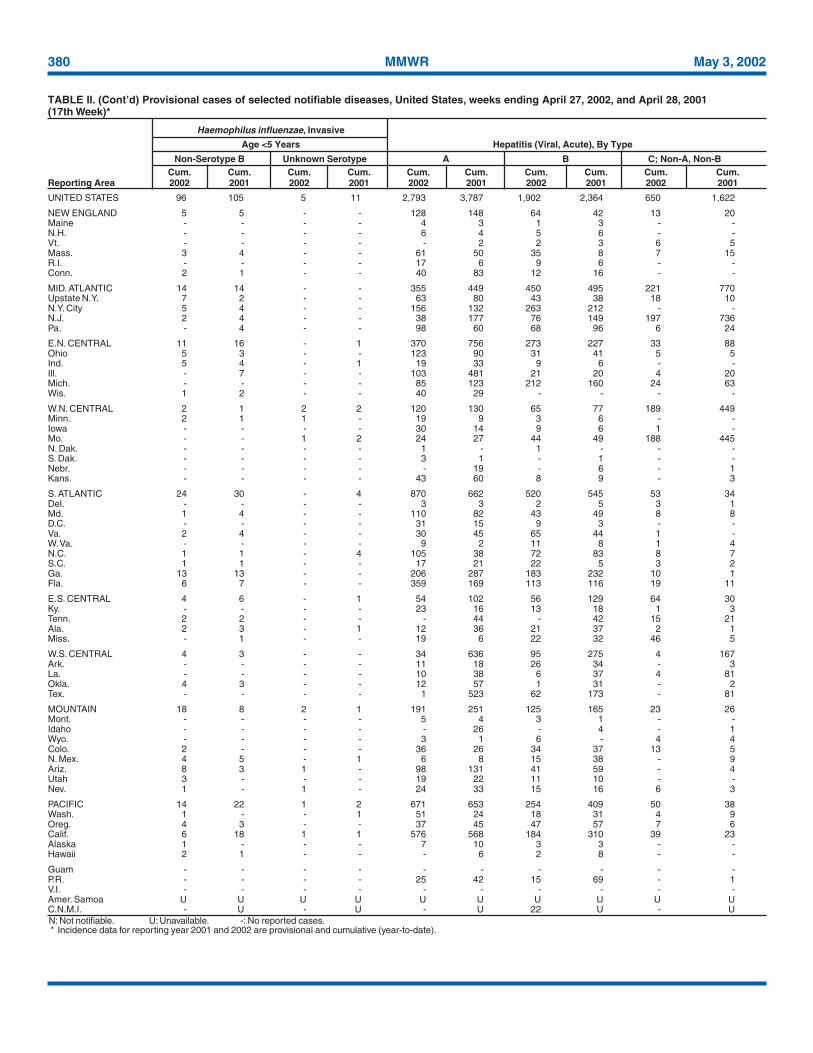
TABLE II. (Cont’d) Provisional cases of selected notifiable diseases, United States, weeks ending April 27, 2002, and April 28, 2001(17th Week)*
Haemophilus influenzae, Invasive
Age <5 Years Hepatitis (Viral, Acute), By Type
Non-Serotype B Unknown Serotype A B C; Non-A, Non-BCum. Cum. Cum. Cum. Cum. Cum. Cum. Cum. Cum. Cum.
Reporting Area 2002 2001 2002 2001 2002 2001 2002 2001 2002 2001
Vol. 51 / No. 17 MMWR 381
N: Not notifiable. U: Unavailable. -: No reported cases.* Incidence data for reporting year 2001 and 2002 are provisional and cumulative (year-to-date).† Of eight cases reported, three were indigenous and five were imported from another country.§ Of 61 cases reported, 32 were indigenous and 29 were imported from another country.
UNITED STATES 182 269 108 148 1,291 1,372 293 366 8† 61§
NEW ENGLAND 7 8 12 14 50 206 14 29 - 5Maine 1 - 2 - - - 1 2 - -N.H. 1 2 2 - 17 2 4 2 - -Vt. - 3 - - 1 1 1 - - 1Mass. 3 2 5 8 29 89 3 12 - 3R.I. - - 1 - 3 - - 1 - -Conn. 2 1 2 6 - 114 5 12 - 1
MID. ATLANTIC 36 62 17 30 1,033 912 69 97 4 8Upstate N.Y. 12 13 9 9 730 227 12 12 - 4N.Y. City 10 5 4 6 46 24 45 51 4 1N.J. 1 9 - 11 54 185 6 22 - 1Pa. 13 35 4 4 203 476 6 12 - 2
E.N. CENTRAL 57 72 18 17 10 43 36 51 - 7Ohio 31 31 9 3 9 5 7 5 - 2Ind. 3 5 1 1 1 - 1 8 - 2Ill. - 9 - 5 - 4 7 16 - 3Mich. 17 16 6 6 - - 17 15 - -Wis. 6 11 2 2 U 34 4 7 - -
W.N. CENTRAL 10 17 4 2 19 25 20 8 - 4Minn. 1 1 - - 13 15 8 1 - 2Iowa 1 4 1 - 3 3 2 1 - -Mo. 7 8 1 1 3 5 5 3 - 2N. Dak. - - 1 - - - 1 - - -S. Dak. 1 - - - - - - - - -Nebr. - 3 - - - - - 1 - -Kans. - 1 1 1 - 2 4 2 - -
S. ATLANTIC 37 30 15 20 134 127 89 86 1 4Del. 3 - - - 11 12 1 1 - -Md. 4 7 3 2 72 95 21 30 - 3D.C. - 1 - - 6 7 2 4 - -Va. 2 4 1 3 6 8 7 13 - -W. Va. N N - 2 - 1 1 - - -N.C. 3 3 2 - 18 3 7 1 - -S.C. 3 1 2 1 1 - 2 3 - -Ga. 5 3 3 5 - - 33 20 - 1Fla. 17 11 4 7 20 1 15 14 1 -
E.S. CENTRAL 5 25 6 7 6 2 5 8 - -Ky. 3 6 1 1 2 2 1 2 - -Tenn. - 8 2 3 1 - 1 3 - -Ala. 2 7 3 3 3 - 2 3 - -Miss. - 4 - - - - 1 - - -
W.S. CENTRAL 1 6 3 14 2 31 2 4 - 1Ark. - - - 1 - - - 1 - -La. - 3 - - 1 2 2 1 - -Okla. 1 1 3 - - - - 1 - -Tex. - 2 - 13 1 29 - 1 - 1
MOUNTAIN 15 15 9 10 7 2 11 19 - 1Mont. 1 - - - - - - 2 - -Idaho - - - - 1 1 - 2 - 1Wyo. 3 1 - - - - - - - -Colo. 4 5 2 1 2 - 6 9 - -N. Mex. 1 1 - 2 1 - - 1 - -Ariz. 2 6 5 2 1 - 2 1 - -Utah 4 - 2 1 1 - 2 2 - -Nev. - 2 - 4 1 1 1 2 - -
PACIFIC 14 34 24 34 30 24 47 64 3 31Wash. 1 6 1 2 - 1 3 2 - 15Oreg. N N 2 4 1 3 2 6 - 3Calif. 13 24 21 28 29 20 39 50 3 11Alaska - 1 - - - - 1 1 - -Hawaii - 3 - - N N 2 5 - 2
Guam - - - - - - - - - -P.R. - 2 - - N N - 2 - -V.I. - - - - - - - - - -Amer. Samoa U U U U U U U U U UC.N.M.I. - U - U - U - U - U
TABLE II. (Cont’d) Provisional cases of selected notifiable diseases, United States, weeks ending April 27, 2002, and April 28, 2001(17th Week)*
MeaslesLegionellosis Listeriosis Lyme Disease Malaria Total
Cum. Cum. Cum. Cum. Cum. Cum. Cum. Cum. Cum. Cum.Reporting Area 2002 2001 2002 2001 2002 2001 2002 2001 2002 2001
382 MMWR May 3, 2002
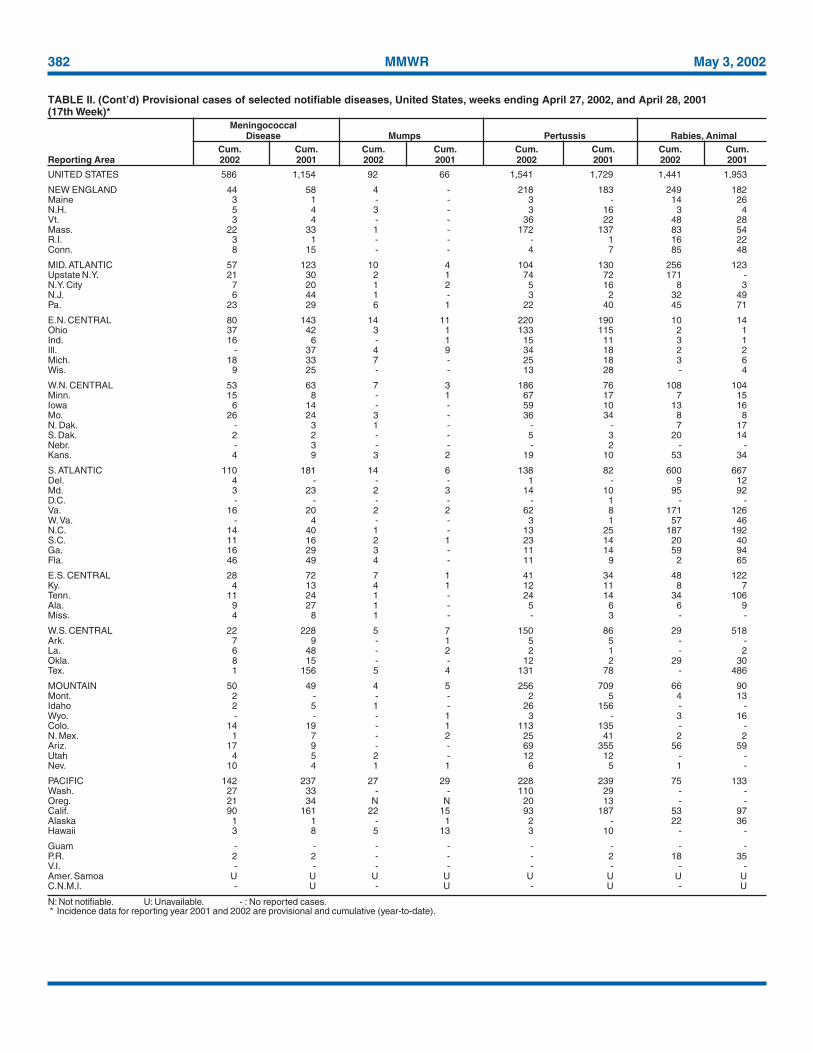
N: Not notifiable. U: Unavailable. - : No reported cases.* Incidence data for reporting year 2001 and 2002 are provisional and cumulative (year-to-date).
UNITED STATES 586 1,154 92 66 1,541 1,729 1,441 1,953
NEW ENGLAND 44 58 4 - 218 183 249 182Maine 3 1 - - 3 - 14 26N.H. 5 4 3 - 3 16 3 4Vt. 3 4 - - 36 22 48 28Mass. 22 33 1 - 172 137 83 54R.I. 3 1 - - - 1 16 22Conn. 8 15 - - 4 7 85 48
MID. ATLANTIC 57 123 10 4 104 130 256 123Upstate N.Y. 21 30 2 1 74 72 171 -N.Y. City 7 20 1 2 5 16 8 3N.J. 6 44 1 - 3 2 32 49Pa. 23 29 6 1 22 40 45 71
E.N. CENTRAL 80 143 14 11 220 190 10 14Ohio 37 42 3 1 133 115 2 1Ind. 16 6 - 1 15 11 3 1Ill. - 37 4 9 34 18 2 2Mich. 18 33 7 - 25 18 3 6Wis. 9 25 - - 13 28 - 4
W.N. CENTRAL 53 63 7 3 186 76 108 104Minn. 15 8 - 1 67 17 7 15Iowa 6 14 - - 59 10 13 16Mo. 26 24 3 - 36 34 8 8N. Dak. - 3 1 - - - 7 17S. Dak. 2 2 - - 5 3 20 14Nebr. - 3 - - - 2 - -Kans. 4 9 3 2 19 10 53 34
S. ATLANTIC 110 181 14 6 138 82 600 667Del. 4 - - - 1 - 9 12Md. 3 23 2 3 14 10 95 92D.C. - - - - - 1 - -Va. 16 20 2 2 62 8 171 126W. Va. - 4 - - 3 1 57 46N.C. 14 40 1 - 13 25 187 192S.C. 11 16 2 1 23 14 20 40Ga. 16 29 3 - 11 14 59 94Fla. 46 49 4 - 11 9 2 65
E.S. CENTRAL 28 72 7 1 41 34 48 122Ky. 4 13 4 1 12 11 8 7Tenn. 11 24 1 - 24 14 34 106Ala. 9 27 1 - 5 6 6 9Miss. 4 8 1 - - 3 - -
W.S. CENTRAL 22 228 5 7 150 86 29 518Ark. 7 9 - 1 5 5 - -La. 6 48 - 2 2 1 - 2Okla. 8 15 - - 12 2 29 30Tex. 1 156 5 4 131 78 - 486
MOUNTAIN 50 49 4 5 256 709 66 90Mont. 2 - - - 2 5 4 13Idaho 2 5 1 - 26 156 - -Wyo. - - - 1 3 - 3 16Colo. 14 19 - 1 113 135 - -N. Mex. 1 7 - 2 25 41 2 2Ariz. 17 9 - - 69 355 56 59Utah 4 5 2 - 12 12 - -Nev. 10 4 1 1 6 5 1 -
PACIFIC 142 237 27 29 228 239 75 133Wash. 27 33 - - 110 29 - -Oreg. 21 34 N N 20 13 - -Calif. 90 161 22 15 93 187 53 97Alaska 1 1 - 1 2 - 22 36Hawaii 3 8 5 13 3 10 - -
Guam - - - - - - - -P.R. 2 2 - - - 2 18 35V.I. - - - - - - - -Amer. Samoa U U U U U U U UC.N.M.I. - U - U - U - U
TABLE II. (Cont’d) Provisional cases of selected notifiable diseases, United States, weeks ending April 27, 2002, and April 28, 2001(17th Week)*
MeningococcalDisease Mumps Pertussis Rabies, Animal
Cum. Cum. Cum. Cum. Cum. Cum. Cum. Cum.Reporting Area 2002 2001 2002 2001 2002 2001 2002 2001
Vol. 51 / No. 17 MMWR 383
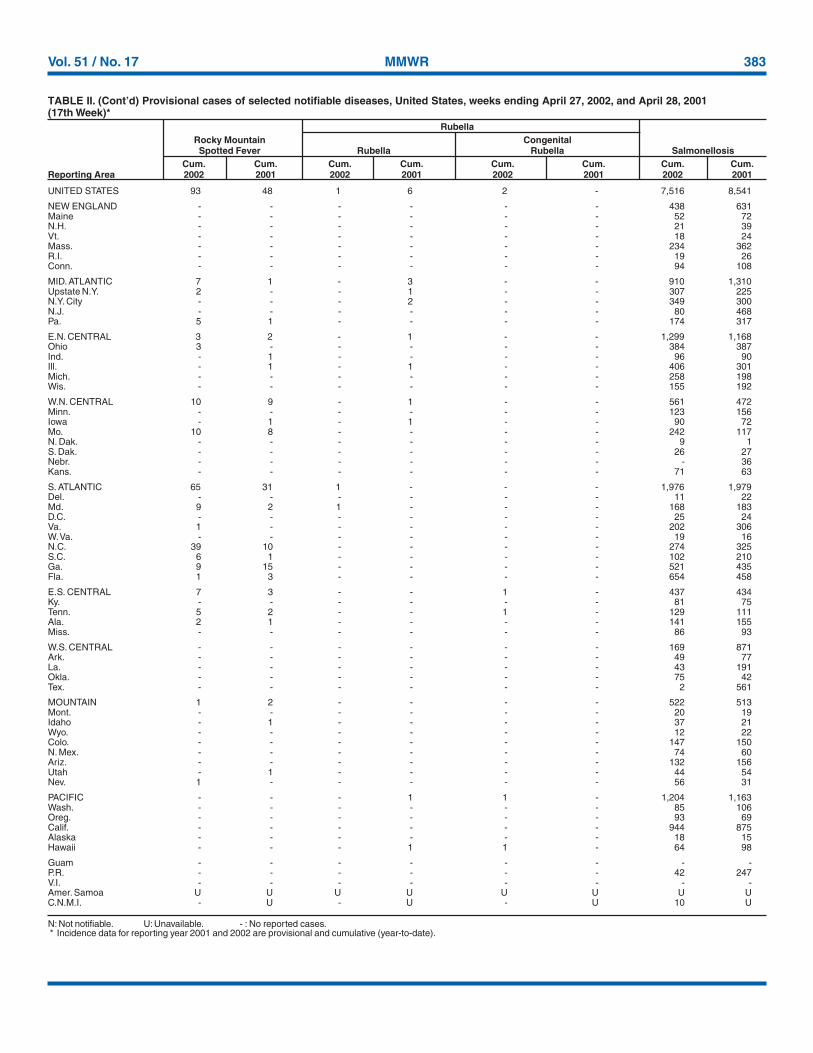
N: Not notifiable. U: Unavailable. - : No reported cases.* Incidence data for reporting year 2001 and 2002 are provisional and cumulative (year-to-date).
UNITED STATES 93 48 1 6 2 - 7,516 8,541
NEW ENGLAND - - - - - - 438 631Maine - - - - - - 52 72N.H. - - - - - - 21 39Vt. - - - - - - 18 24Mass. - - - - - - 234 362R.I. - - - - - - 19 26Conn. - - - - - - 94 108
MID. ATLANTIC 7 1 - 3 - - 910 1,310Upstate N.Y. 2 - - 1 - - 307 225N.Y. City - - - 2 - - 349 300N.J. - - - - - - 80 468Pa. 5 1 - - - - 174 317
E.N. CENTRAL 3 2 - 1 - - 1,299 1,168Ohio 3 - - - - - 384 387Ind. - 1 - - - - 96 90Ill. - 1 - 1 - - 406 301Mich. - - - - - - 258 198Wis. - - - - - - 155 192
W.N. CENTRAL 10 9 - 1 - - 561 472Minn. - - - - - - 123 156Iowa - 1 - 1 - - 90 72Mo. 10 8 - - - - 242 117N. Dak. - - - - - - 9 1S. Dak. - - - - - - 26 27Nebr. - - - - - - - 36Kans. - - - - - - 71 63
S. ATLANTIC 65 31 1 - - - 1,976 1,979Del. - - - - - - 11 22Md. 9 2 1 - - - 168 183D.C. - - - - - - 25 24Va. 1 - - - - - 202 306W. Va. - - - - - - 19 16N.C. 39 10 - - - - 274 325S.C. 6 1 - - - - 102 210Ga. 9 15 - - - - 521 435Fla. 1 3 - - - - 654 458
E.S. CENTRAL 7 3 - - 1 - 437 434Ky. - - - - - - 81 75Tenn. 5 2 - - 1 - 129 111Ala. 2 1 - - - - 141 155Miss. - - - - - - 86 93
W.S. CENTRAL - - - - - - 169 871Ark. - - - - - - 49 77La. - - - - - - 43 191Okla. - - - - - - 75 42Tex. - - - - - - 2 561
MOUNTAIN 1 2 - - - - 522 513Mont. - - - - - - 20 19Idaho - 1 - - - - 37 21Wyo. - - - - - - 12 22Colo. - - - - - - 147 150N. Mex. - - - - - - 74 60Ariz. - - - - - - 132 156Utah - 1 - - - - 44 54Nev. 1 - - - - - 56 31
PACIFIC - - - 1 1 - 1,204 1,163Wash. - - - - - - 85 106Oreg. - - - - - - 93 69Calif. - - - - - - 944 875Alaska - - - - - - 18 15Hawaii - - - 1 1 - 64 98
Guam - - - - - - - -P.R. - - - - - - 42 247V.I. - - - - - - - -Amer. Samoa U U U U U U U UC.N.M.I. - U - U - U 10 U
TABLE II. (Cont’d) Provisional cases of selected notifiable diseases, United States, weeks ending April 27, 2002, and April 28, 2001(17th Week)*
RubellaRocky Mountain CongenitalSpotted Fever Rubella Rubella Salmonellosis
Cum. Cum. Cum. Cum. Cum. Cum. Cum. Cum.Reporting Area 2002 2001 2002 2001 2002 2001 2002 2001
384 MMWR May 3, 2002
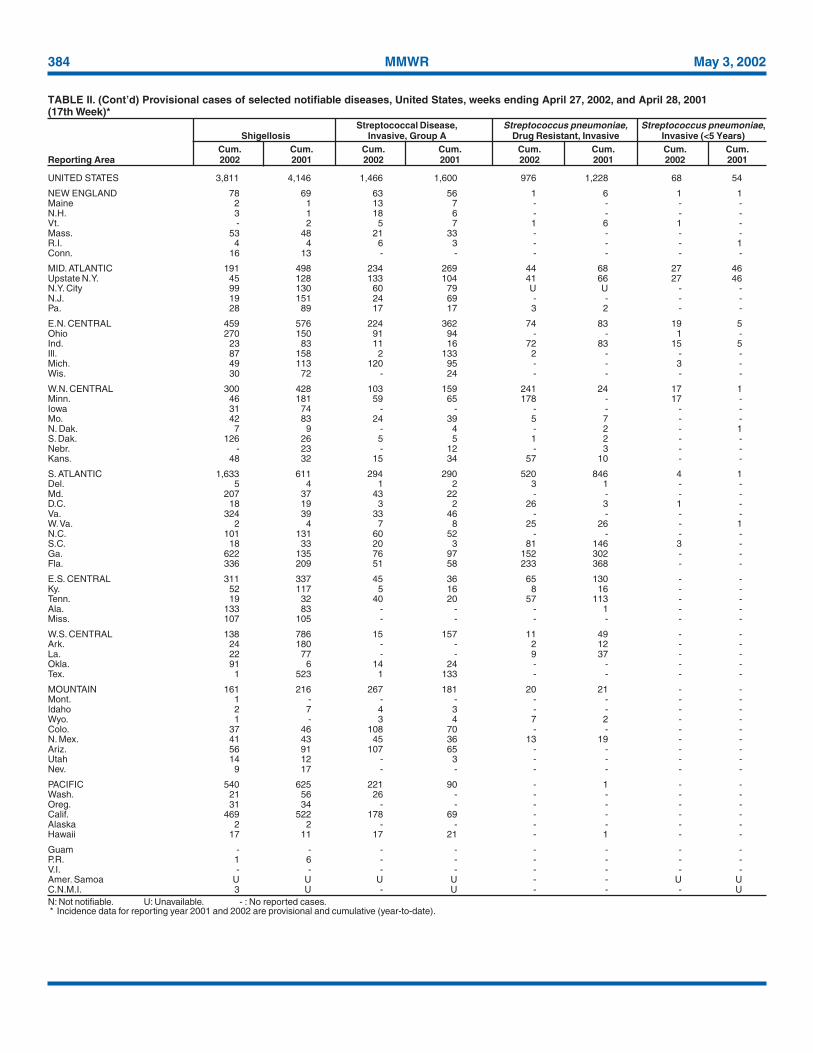
N: Not notifiable. U: Unavailable. - : No reported cases.* Incidence data for reporting year 2001 and 2002 are provisional and cumulative (year-to-date).
UNITED STATES 3,811 4,146 1,466 1,600 976 1,228 68 54
NEW ENGLAND 78 69 63 56 1 6 1 1Maine 2 1 13 7 - - - -N.H. 3 1 18 6 - - - -Vt. - 2 5 7 1 6 1 -Mass. 53 48 21 33 - - - -R.I. 4 4 6 3 - - - 1Conn. 16 13 - - - - - -
MID. ATLANTIC 191 498 234 269 44 68 27 46Upstate N.Y. 45 128 133 104 41 66 27 46N.Y. City 99 130 60 79 U U - -N.J. 19 151 24 69 - - - -Pa. 28 89 17 17 3 2 - -
E.N. CENTRAL 459 576 224 362 74 83 19 5Ohio 270 150 91 94 - - 1 -Ind. 23 83 11 16 72 83 15 5Ill. 87 158 2 133 2 - - -Mich. 49 113 120 95 - - 3 -Wis. 30 72 - 24 - - - -
W.N. CENTRAL 300 428 103 159 241 24 17 1Minn. 46 181 59 65 178 - 17 -Iowa 31 74 - - - - - -Mo. 42 83 24 39 5 7 - -N. Dak. 7 9 - 4 - 2 - 1S. Dak. 126 26 5 5 1 2 - -Nebr. - 23 - 12 - 3 - -Kans. 48 32 15 34 57 10 - -
S. ATLANTIC 1,633 611 294 290 520 846 4 1Del. 5 4 1 2 3 1 - -Md. 207 37 43 22 - - - -D.C. 18 19 3 2 26 3 1 -Va. 324 39 33 46 - - - -W. Va. 2 4 7 8 25 26 - 1N.C. 101 131 60 52 - - - -S.C. 18 33 20 3 81 146 3 -Ga. 622 135 76 97 152 302 - -Fla. 336 209 51 58 233 368 - -
E.S. CENTRAL 311 337 45 36 65 130 - -Ky. 52 117 5 16 8 16 - -Tenn. 19 32 40 20 57 113 - -Ala. 133 83 - - - 1 - -Miss. 107 105 - - - - - -
W.S. CENTRAL 138 786 15 157 11 49 - -Ark. 24 180 - - 2 12 - -La. 22 77 - - 9 37 - -Okla. 91 6 14 24 - - - -Tex. 1 523 1 133 - - - -
MOUNTAIN 161 216 267 181 20 21 - -Mont. 1 - - - - - - -Idaho 2 7 4 3 - - - -Wyo. 1 - 3 4 7 2 - -Colo. 37 46 108 70 - - - -N. Mex. 41 43 45 36 13 19 - -Ariz. 56 91 107 65 - - - -Utah 14 12 - 3 - - - -Nev. 9 17 - - - - - -
PACIFIC 540 625 221 90 - 1 - -Wash. 21 56 26 - - - - -Oreg. 31 34 - - - - - -Calif. 469 522 178 69 - - - -Alaska 2 2 - - - - - -Hawaii 17 11 17 21 - 1 - -
Guam - - - - - - - -P.R. 1 6 - - - - - -V.I. - - - - - - - -Amer. Samoa U U U U - - U UC.N.M.I. 3 U - U - - - U
TABLE II. (Cont’d) Provisional cases of selected notifiable diseases, United States, weeks ending April 27, 2002, and April 28, 2001(17th Week)*
Streptococcal Disease, Streptococcus pneumoniae, Streptococcus pneumoniae,Shigellosis Invasive, Group A Drug Resistant, Invasive Invasive (<5 Years)
Cum. Cum. Cum. Cum. Cum. Cum. Cum. Cum.Reporting Area 2002 2001 2002 2001 2002 2001 2002 2001
Vol. 51 / No. 17 MMWR 385
N: Not notifiable. U: Unavailable. - : No reported cases.* Incidence data for reporting year 2001 and 2002 are provisional and cumulative (year-to-date).† Updated from reports to the Division of STD Prevention, NCHSTP.
UNITED STATES 1,778 1,792 18 151 2,588 3,505 74 88
NEW ENGLAND 26 12 - 2 109 110 8 5Maine - - - - 5 - - -N.H. - - - - 4 7 - -Vt. 1 - - - - 3 - -Mass. 16 8 - 1 58 57 7 4R.I. 2 1 - - 11 13 - -Conn. 7 3 - 1 31 30 1 1
MID. ATLANTIC 179 148 2 20 618 550 17 37Upstate N.Y. 9 4 1 13 76 - 3 5N.Y. City 99 90 - - 328 317 11 7N.J. 38 25 1 5 147 147 3 24Pa. 33 29 - 2 67 86 - 1
E.N. CENTRAL 339 290 - 26 297 339 11 6Ohio 48 28 - 1 46 71 4 1Ind. 20 58 - 3 33 29 1 1Ill. 73 103 - 20 150 167 1 1Mich. 191 92 - 2 62 51 3 2Wis. 7 9 - - 6 21 2 1
W.N. CENTRAL 19 24 - 3 121 135 1 4Minn. 5 13 - - 67 71 - -Iowa - - - - - 9 - -Mo. 8 6 - 1 41 37 1 4N. Dak. - - - - - - - -S. Dak. - - - - 7 4 - -Nebr. 4 - - - - 14 - -Kans. 2 5 - 2 6 - - -
S. ATLANTIC 478 670 2 40 510 715 11 10Del. 6 4 - - 7 - - -Md. 48 92 - 1 54 56 1 3D.C. 35 14 - 1 - 28 - -Va. 11 41 - 1 29 61 - 1W. Va. - - - - 8 10 - -N.C. 108 157 - 4 101 78 - 1S.C. 38 96 - 8 39 62 - -Ga. 72 103 - 9 42 147 7 3Fla. 160 163 2 16 230 273 3 2
E.S. CENTRAL 203 183 1 8 213 241 2 -Ky. 30 15 - - 31 31 2 -Tenn. 81 106 - 4 84 82 - -Ala. 71 27 1 2 65 90 - -Miss. 21 35 - 2 33 38 - -
W.S. CENTRAL 235 226 13 25 71 518 - 4Ark. 6 15 - 2 19 45 - -La. 44 48 - - - - - -Okla. 24 30 - 1 52 31 - -Tex. 161 133 13 22 - 442 - 4
MOUNTAIN 72 63 - 7 76 129 7 2Mont. - - - - - - - 1Idaho 1 - - - - 3 - -Wyo. - - - - 1 - - -Colo. - 8 - - 15 34 3 -N. Mex. 13 5 - - 7 14 - -Ariz. 52 42 - 7 43 43 - -Utah 5 6 - - 8 5 3 -Nev. 1 2 - - 2 30 1 1
PACIFIC 227 176 - 20 573 768 17 20Wash. 18 21 - - 73 66 - 1Oreg. 5 4 - - 26 29 2 3Calif. 200 148 - 20 407 606 15 15Alaska - - - - 22 15 - -Hawaii 4 3 - - 45 52 - 1
Guam - - - - - - - -P.R. 74 95 - 5 8 23 - -V.I. - - - - - - - -Amer. Samoa U U U U U U U UC.N.M.I. 11 U - U 19 U - U
TABLE II. (Cont’d) Provisional cases of selected notifiable diseases, United States, weeks ending April 27, 2002, and April 28, 2001(17th Week)*
Syphilis TyphoidPrimary & Secondary Congenital† Tuberculosis FeverCum. Cum. Cum. Cum. Cum. Cum. Cum. Cum.
Reporting Area 2002 2001 2002 2001 2002 2001 2002 2001
386 MMWR May 3, 2002
NEW ENGLAND 355 253 79 14 5 4 34Boston, Mass. U U U U U U UBridgeport, Conn. U U U U U U UCambridge, Mass. 17 14 1 2 - - 1Fall River, Mass. 22 19 1 2 - - 3Hartford, Conn. 66 52 11 2 - 1 3Lowell, Mass. 29 24 5 - - - 1Lynn, Mass. 14 10 3 1 - - -New Bedford, Mass. 24 18 5 1 - - 3New Haven, Conn. 39 22 13 2 - 2 5Providence, R.I. U U U U U U USomerville, Mass. 2 1 1 - - - -Springfield, Mass. 47 31 12 2 1 1 5Waterbury, Conn. 29 20 8 - 1 - 4Worcester, Mass. 66 42 19 2 3 - 9
MID. ATLANTIC 2,692 1,887 512 205 51 36 135Albany, N.Y. 68 41 22 4 - 1 3Allentown, Pa. 19 16 2 1 - - -Buffalo, N.Y. 99 73 16 7 1 2 13Camden, N.J. 19 11 6 1 - 1 2Elizabeth, N.J. 31 25 4 1 - 1 1Erie, Pa. 41 35 6 - - - 1Jersey City, N.J. 47 29 11 5 1 1 -New York City, N.Y. 1,160 776 232 108 25 18 44Newark, N.J. 46 18 17 10 - 1 4Paterson, N.J. 28 16 6 2 2 2 1Philadelphia, Pa. 707 512 129 45 18 3 32Pittsburgh, Pa.§ 35 25 7 3 - - 3Reading, Pa. 18 13 4 1 - - 2Rochester, N.Y. 124 89 23 9 2 1 8Schenectady, N.Y. 22 17 3 1 1 - 5Scranton, Pa. 30 23 4 3 - - 1Syracuse, N.Y. 134 111 16 2 - 5 9Trenton, N.J. 17 14 2 1 - - 1Utica, N.Y. 24 22 1 - 1 - 3Yonkers, N.Y. 23 21 1 1 - - 2
E.N. CENTRAL 1,649 1,134 335 107 34 39 132Akron, Ohio U U U U U U UCanton, Ohio 36 26 6 2 - 2 6Chicago, Ill. U U U U U U UCincinnati, Ohio 125 80 22 13 5 5 17Cleveland, Ohio 136 76 36 19 2 3 2Columbus, Ohio 180 137 26 6 7 4 12Dayton, Ohio 140 104 26 6 2 2 12Detroit, Mich. 173 106 40 17 7 3 15Evansville, Ind. 54 35 14 3 - 2 4Fort Wayne, Ind. 81 57 14 8 1 1 10Gary, Ind. 20 12 6 1 - 1 2Grand Rapids, Mich. 65 48 9 3 2 3 6Indianapolis, Ind. 198 129 47 14 5 3 14Lansing, Mich. 34 20 11 2 - 1 4Milwaukee, Wis. 110 73 28 3 2 4 10Peoria, Ill. 48 36 7 3 - 2 4Rockford, Ill. 47 37 9 1 - - 3South Bend, Ind. 53 41 6 5 - 1 3Toledo, Ohio 95 73 18 1 1 2 7Youngstown, Ohio 54 44 10 - - - 1
W.N. CENTRAL 355 234 76 24 12 9 25Des Moines, Iowa 41 32 8 1 - - 3Duluth, Minn. U U U U U U UKansas City, Kans. U U U U U U UKansas City, Mo. 96 61 21 7 4 3 12Lincoln, Nebr. U U U U U U UMinneapolis, Minn. U U U U U U UOmaha, Nebr. 96 62 21 7 3 3 10St. Louis, Mo. 122 79 26 9 5 3 -St. Paul, Minn. U U U U U U UWichita, Kans. U U U U U U U
S. ATLANTIC 1,372 908 283 117 35 27 86Atlanta, Ga. 185 109 41 25 5 5 6Baltimore, Md. 192 126 33 24 6 3 19Charlotte, N.C. 92 67 16 4 2 3 9Jacksonville, Fla. 154 98 34 12 4 6 11Miami, Fla. 112 87 12 7 3 3 7Norfolk, Va. 67 45 15 5 - 2 -Richmond, Va. 59 37 11 6 1 2 3Savannah, Ga. 46 33 10 2 1 - 5St. Petersburg, Fla. 67 53 8 5 1 - 11Tampa, Fla. 186 129 36 14 5 2 12Washington, D.C. 200 117 62 13 7 1 3Wilmington, Del. 12 7 5 - - - -
E.S. CENTRAL 921 630 190 60 24 17 79Birmingham, Ala. 174 122 38 12 2 - 20Chattanooga, Tenn. 120 96 16 6 1 1 10Knoxville, Tenn. 85 59 14 6 6 - 2Lexington, Ky. 73 44 20 6 - 3 9Memphis, Tenn. 241 160 58 12 7 4 13Mobile, Ala. 59 44 6 4 3 2 3Montgomery, Ala. 40 28 6 4 - 2 6Nashville, Tenn. 129 77 32 10 5 5 16
W.S. CENTRAL 1,387 906 291 113 44 33 122Austin, Tex. 92 43 17 19 12 1 11Baton Rouge, La. 54 32 18 3 1 - 2Corpus Christi, Tex. 41 28 9 3 1 - -Dallas, Tex. 197 124 43 16 6 8 15El Paso, Tex. 109 71 27 8 2 1 7Ft. Worth, Tex. 147 100 32 9 4 2 14Houston, Tex. 362 239 74 33 7 9 42Little Rock, Ark. 52 32 11 3 3 3 3New Orleans, La. U U U U U U USan Antonio, Tex. 164 114 28 11 7 4 15Shreveport, La. 46 33 9 2 - 2 3Tulsa, Okla. 123 90 23 6 1 3 10
MOUNTAIN 994 697 182 67 23 25 79Albuquerque, N.M. 132 90 22 12 3 5 9Boise, Idaho 43 37 6 - - - 4Colo. Springs, Colo. 69 48 11 8 1 1 4Denver, Colo. 121 71 28 8 4 10 10Las Vegas, Nev. 295 212 54 17 9 3 17Ogden, Utah 34 27 4 1 2 - 4Phoenix, Ariz. U U U U U U UPueblo, Colo. 28 22 6 - - - 2Salt Lake City, Utah 126 80 30 8 3 5 12Tucson, Ariz. 146 110 21 13 1 1 17
PACIFIC 1,845 1,298 342 133 32 40 124Berkeley, Calif. 22 14 5 2 - 1 1Fresno, Calif. 130 98 21 5 2 4 12Glendale, Calif. 18 15 3 - - - -Honolulu, Hawaii 70 57 10 1 1 1 7Long Beach, Calif. 65 48 11 5 1 - 14Los Angeles, Calif. 370 250 77 28 7 8 2Pasadena, Calif. 31 23 2 3 - 3 2Portland, Oreg. 236 159 49 22 3 3 14Sacramento, Calif. 205 151 31 12 8 3 20San Diego, Calif. 177 127 33 12 2 3 20San Francisco, Calif. U U U U U U USan Jose, Calif. 182 125 33 13 4 7 11Santa Cruz, Calif. 34 27 4 3 - - 5Seattle, Wash. 149 94 38 11 3 3 6Spokane, Wash. 60 47 6 4 - 3 7Tacoma, Wash. 96 63 19 12 1 1 3
TOTAL 11,570¶ 7,947 2,290 840 260 230 816
U: Unavailable. -:No reported cases.* Mortality data in this table are voluntarily reported from 122 cities in the United States, most of which have populations of >100,000. A death is reported by the place of its
occurrence and by the week that the death certificate was filed. Fetal deaths are not included.† Pneumonia and influenza.§ Because of changes in reporting methods in this Pennsylvania city, these numbers are partial counts for the current week. Complete counts will be available in 4 to 6 weeks.¶ Total includes unknown ages.
TABLE III. Deaths in 122 U.S. cities,* week ending April 27, 2002 (17th Week)All Causes, By Age (Years) All Causes, By Age (Years)
All P&I† All P&I†
Reporting Area Ages >65 45-64 25-44 1-24 <1 Total Reporting Area Ages >65 45-64 25-44 1-24 <1 Total
Vol. 51 / No. 17 MMWR 387
All MMWR references are available on the Internet at http://www.cdc.gov/mmwr. Use the search function to find specific articles.——————
Use of trade names and commercial sources is for identification only and does not imply endorsement by the U.S. Department of Healthand Human Services.
——————References to non-CDC sites on the Internet are provided as a service to MMWR readers and do not constitute or imply endorsement ofthese organizations or their programs by CDC or the U.S. Department of Health and Human Services. CDC is not responsible for thecontent of these sites. URL addresses listed in MMWR were current as of the date of publication.
MMWR
The Morbidity and Mortality Weekly Report (MMWR) Series is prepared by the Centers for Disease Control and Prevention (CDC) andis available free of charge in electronic format and on a paid subscription basis for paper copy. To receive an electronic copy on Friday of eachweek, send an e-mail message to [email protected]. The body content should read SUBscribe mmwr-toc. Electronic copy also is availablefrom CDC’s World-Wide Web server at http://www.cdc.gov/mmwr or from CDC’s file transfer protocol server at ftp://ftp.cdc.gov/pub/Publications/mmwr. To subscribe for paper copy, contact Superintendent of Documents, U.S. Government Printing Office, Washington,DC 20402; telephone 202-512-1800.
Data in the weekly MMWR are provisional, based on weekly reports to CDC by state health departments. The reporting week concludesat close of business on Friday; compiled data on a national basis are officially released to the public on the following Friday. Addressinquiries about the MMWR Series, including material to be considered for publication, to Editor, MMWR Series, Mailstop C-08, CDC,1600 Clifton Rd., N.E., Atlanta, GA 30333; telephone 888-232-3228.
All material in the MMWR Series is in the public domain and may be used and reprinted without permission; citation as to source,however, is appreciated.
✩U.S. Government Printing Office: 2002-733-100/69026 Region IV
388 May 3, 2002