Morbidity and Mortality Weekly Report - Centers for · Vol. 51 / No. 24 MMWR 523 mixture of P1...
24
Morbidity and Mortality Weekly Report Weekly June 21, 2002 / Vol. 51 / No. 24 Centers for Disease Control and Prevention Centers for Disease Control and Prevention Centers for Disease Control and Prevention Centers for Disease Control and Prevention Centers for Disease Control and Prevention SAFER • HEAL SAFER • HEAL SAFER • HEAL SAFER • HEAL SAFER • HEALTHIER • PEOPLE THIER • PEOPLE THIER • PEOPLE THIER • PEOPLE THIER • PEOPLE TM Progress Toward Poliomyelitis Eradication — Pakistan and Afghanistan, January 2000–April 2002 Since 1988, when the World Health Assembly resolved to eradicate poliomyelitis worldwide, the estimated global inci- dence of polio has decreased 99% (1). Pakistan began polio eradication activities in 1994 and Afghanistan in 1997 (2). Although polio remains endemic in the two countries, both the incidence and the geographic distribution of poliovirus have been reduced substantially. This report summarizes progress toward eradicating polio in Pakistan and Afghani- stan during January 2000–April 2002. Both countries aim to stop transmission of poliovirus by the end of 2002; however, the unstable security situation in the region might threaten this success. Routine Vaccination During 2000–2001 in Pakistan, reported routine coverage of infants with 3 doses of oral poliovirus vaccine (OPV3) ranged from 33% in Balochistan province to 82% in Punjab. In Afghanistan, reported national routine OPV3 coverage increased from 35% in 1999 to 45% in 2001; coverage rates in 2001 ranged from 15% in the Northeastern region to 83% in the Eastern region. Supplemental Immunization Activities At least two rounds of National Immunization Days (NIDs)* have been conducted annually in Pakistan since 1994 (3). During 1999, vaccination activities were intensified by adding a house-to-house vaccination strategy and extra rounds of NIDs. Four rounds of NIDs were conducted during 2000 and five during 2001, and an additional subnational immu- nization day (SNID) † was conducted in August 2001. During 2002, one SNID round was conducted in January, and two rounds of NIDs were conducted in March and April. Two additional SNID rounds will be conducted in June and July, and full NIDs are planned for September and October. Surveillance and genetic sequencing data are being used to target polio-virus reservoir districts (i.e., districts in which persistent year-round indigenous transmission occurs, par- ticularly during the low transmission season [January– March]). Following subnational campaigns during 1994–1996 that included OPV and other antigens, NIDs for polio began in Afghanistan in April and May 1997; since then, at least two rounds of NIDs have been conducted annually (4). During 2000, efforts were intensified by adding a house-to-house vaccination strategy and increasing the number of rounds of NIDs. In the spring of 2001, a house-to-house vaccination strategy was used to reach 5.8 million children; in the spring of 1999, 4.0 million children were reached by using fixed vaccination posts. Supplemental immunization activities (SIAs) have been coordinated with Afghanistan’s neighbors, particularly Pakistan and Iran. During January–August 2001, three rounds of NIDs, a mop-up vaccination campaign in Kandahar and three neighboring districts, and a SNID round in high-risk provinces and districts were conducted. In September and November 2001, NIDs were conducted despite the absence of international support staff caused by armed conflict in the region. * Nationwide mass campaigns over a short period (days to weeks) in which 2 doses of OPV are administered to all children (usually aged <5 years), regardless of vaccination history, with an interval of 4–6 weeks between doses. † Same procedure as NIDs but in a smaller geographic area. INSIDE 524 Update: Rashes Among Schoolchildren — 27 States, October 4, 2001– June 3, 2002 527 Cancer Death Rates — Appalachia, 1994–1998 529 Notices to Readers
Transcript of Morbidity and Mortality Weekly Report - Centers for · Vol. 51 / No. 24 MMWR 523 mixture of P1...
Morbidity and Mortality Weekly Report
Weekly June 21, 2002 / Vol. 51 / No. 24
Centers for Disease Control and PreventionCenters for Disease Control and PreventionCenters for Disease Control and PreventionCenters for Disease Control and PreventionCenters for Disease Control and PreventionSAFER • HEALSAFER • HEALSAFER • HEALSAFER • HEALSAFER • HEALTHIER • PEOPLETHIER • PEOPLETHIER • PEOPLETHIER • PEOPLETHIER • PEOPLETM
Progress Toward Poliomyelitis Eradication — Pakistan and Afghanistan,January 2000–April 2002
Since 1988, when the World Health Assembly resolved toeradicate poliomyelitis worldwide, the estimated global inci-dence of polio has decreased 99% (1). Pakistan began polioeradication activities in 1994 and Afghanistan in 1997 (2).Although polio remains endemic in the two countries, boththe incidence and the geographic distribution of poliovirushave been reduced substantially. This report summarizesprogress toward eradicating polio in Pakistan and Afghani-stan during January 2000–April 2002. Both countries aim tostop transmission of poliovirus by the end of 2002; however,the unstable security situation in the region might threatenthis success.
Routine VaccinationDuring 2000–2001 in Pakistan, reported routine coverage
of infants with 3 doses of oral poliovirus vaccine (OPV3)ranged from 33% in Balochistan province to 82% in Punjab.In Afghanistan, reported national routine OPV3 coverageincreased from 35% in 1999 to 45% in 2001; coverage ratesin 2001 ranged from 15% in the Northeastern region to 83%in the Eastern region.
Supplemental Immunization ActivitiesAt least two rounds of National Immunization Days
(NIDs)* have been conducted annually in Pakistan since 1994(3). During 1999, vaccination activities were intensified byadding a house-to-house vaccination strategy and extra roundsof NIDs. Four rounds of NIDs were conducted during 2000and five during 2001, and an additional subnational immu-nization day (SNID)† was conducted in August 2001.
During 2002, one SNID round was conducted in January,and two rounds of NIDs were conducted in March and April.Two additional SNID rounds will be conducted in June andJuly, and full NIDs are planned for September and October.Surveillance and genetic sequencing data are being used totarget polio-virus reservoir districts (i.e., districts in whichpersistent year-round indigenous transmission occurs, par-ticularly during the low transmission season [January–March]).
Following subnational campaigns during 1994–1996 thatincluded OPV and other antigens, NIDs for polio began inAfghanistan in April and May 1997; since then, at least tworounds of NIDs have been conducted annually (4). During2000, efforts were intensified by adding a house-to-housevaccination strategy and increasing the number of rounds ofNIDs. In the spring of 2001, a house-to-house vaccinationstrategy was used to reach 5.8 million children; in the springof 1999, 4.0 million children were reached by using fixedvaccination posts. Supplemental immunization activities(SIAs) have been coordinated with Afghanistan’s neighbors,particularly Pakistan and Iran. During January–August 2001,three rounds of NIDs, a mop-up vaccination campaign inKandahar and three neighboring districts, and a SNID roundin high-risk provinces and districts were conducted. InSeptember and November 2001, NIDs were conducteddespite the absence of international support staff caused byarmed conflict in the region.
* Nationwide mass campaigns over a short period (days to weeks) in which 2doses of OPV are administered to all children (usually aged <5 years), regardlessof vaccination history, with an interval of 4–6 weeks between doses.
† Same procedure as NIDs but in a smaller geographic area.
INSIDE
524 Update: Rashes Among Schoolchildren — 27 States,October 4, 2001– June 3, 2002
527 Cancer Death Rates — Appalachia, 1994–1998529 Notices to Readers
522 MMWR June 21, 2002
Centers for Disease Control and Prevention
David W. Fleming, M.D.Acting Director
Julie L. Gerberding, M.D.Acting Deputy Director for Science and Public Health
Dixie E. Snider, Jr., M.D., M.P.H.Associate Director for Science
Epidemiology Program Office
Stephen B. Thacker, M.D., M.Sc.Director
Office of Scientific and Health Communications
John W. Ward, M.D.Director
Daniel M. Sosin, M.D., M.P.H.Acting Editor, MMWR Series
David C. JohnsonActing Managing Editor, MMWR (Weekly)
Jude C. RutledgeTeresa F. Rutledge
Jeffrey D. Sokolow, M.A.Writers/Editors, MMWR (Weekly)
Lynda G. CupellMalbea A. HeilmanBeverly J. Holland
Visual Information Specialists
Quang M. DoanMichele D. Renshaw
Erica R. ShaverInformation Technology Specialists
Division of Public Health Surveillanceand Informatics
Notifiable Disease Morbidity and 122 Cities Mortality DataRobert F. Fagan
Deborah A. AdamsFelicia J. ConnorLateka Dammond
Patsy A. HallPearl C. Sharp
The MMWR series of publications is published by theEpidemiology Program Office, Centers for Disease Controland Prevention (CDC), U.S. Department of Health andHuman Services, Atlanta, GA 30333.
Acute Flaccid Paralysis SurveillanceThe quality of acute flaccid paralysis (AFP) surveillance is
evaluated by two key WHO-established indicators: sensitiv-ity of reporting (target: nonpolio AFP rate of >1 case per100,000 children aged <15 years) and completeness of speci-men collection (target: two adequate stool specimens§ from>80% of all persons with AFP). Since 2001, AFP surveillancein Pakistan has met these indicators. During 2000–2001, thenonpolio AFP rate increased from 1.5 per 100,000 childrenaged <15 years to 2.2, and the rate for adequate stool collec-tion increased from 67% to 83% (Table). DuringJanuary–April 2002, rates remained above targets, with anannualized nonpolio AFP rate of 2.2 and an adequate stoolcollection rate of 88%. The nonpolio enterovirus (NPEV)isolation rate (target: >10%), a marker for laboratory perfor-mance and the integrity of the reverse cold chain for speci-mens, was 13% in 2000 and 19% in 2001.
Since Afghanistan’s AFP surveillance system began in 1997,surveillance indicators have improved steadily. During 2000,the nonpolio AFP rate was 1.3, and the adequate stool collec-tion rate was 50%; during 2001, the rates were 1.8 and 73%,respectively. In January 2001, the country switched fromclinical to virologic classification of polio cases. DuringSeptember–December 2001, a period marked by armed con-flict, 42 AFP cases were identified (27 [64%] with adequatestool samples). AFP surveillance in the Southern region, whichreported nine of the 11 polio cases in 2001, was affected morethan other regions by lack of security and displacement ofstaff. Since January 2002, a total of 72 AFP cases has beenreported nationally, with adequate specimens collected from62 (86%) cases. The NPEV isolation rate was 19% in 2000,16% in 2001, and 11% during January–April 2002.
The WHO-accredited Regional Reference Poliovirus Labo-ratory in Islamabad performs virologic testing of stool speci-mens from both Afghanistan and Pakistan. During 2001,laboratory results were reported within 28 days of specimenreceipt for 81% of the 1,584 AFP cases in Pakistan and for72% of the 215 AFP cases in Afghanistan (target: >80%).
Incidence of PolioDuring 2000–2001, the number of polio cases confirmed
virologically declined 42% in Pakistan, from 199 in 59 dis-tricts to 116 in 39 districts; during January–April 2002, atotal of 18 cases has been confirmed virologically (Figure).Of the 116 cases in 2001, a total of 69 was caused by polio-virus type 1 (P1), 46 by poliovirus type 3 (P3), and one by a
§ Two stool specimens collected at an interval of at least 24 hours within 14 daysof paralysis onset and shipped properly to the laboratory.
SUGGESTED CITATIONCenters for Disease Control and Prevention. [ArticleTitle]. MMWR 2002;51:[inclusive page numbers].

Vol. 51 / No. 24 MMWR 523
mixture of P1 and P3. Epidemiologic data from polio casesin 2001 indicated several high-risk groups, including Afghanrefugees and children whose parents are uneducated.
During 2000 in Afghanistan, 27 polio cases that were con-firmed virologically were reported from 22 districts; during2001, a total of 11 cases was reported from seven districts.During January–August 2001, nine cases of wild polioviruswere reported, of which seven were from Kandahar and threeneighboring districts, and two were from a district in a neigh-boring province. During the same period in 2000, a total of21 polio cases was reported. No polio cases have beenreported for the Northern, Northeastern, Central, and West-ern regions since late 2000. Each of the 11 cases (one P3 and10 P1) reported in 2001 came from regions that border Paki-stan. As of April 2002, one case of polio (P3) was confirmedin the Eastern region, with onset in February. One case hasbeen reported in the Southern region of Afghanistan withonset in early May 2002, indicating that transmission isongoing in that region.
Reported by: National Institutes of Health; Country Office of the WorldHealth Organization; United Nations Children’s Fund, Islamabad,Pakistan. Ministry of Public Health; Country Office of the World HealthOrganization; United Nations Children’s Fund, Kabul, Afghanistan.Regional Office for the Eastern Mediterranean Region, World HealthOrganization, Cairo, Egypt. Dept of Vaccines and Biologicals, WorldHealth Organization, Geneva, Switzerland. Div of Viral and RickettsialDiseases, National Center for Infectious Diseases; Global ImmunizationDiv, National Immunization Program, CDC.
Editorial Note: Pakistan and Afghanistan constitute a singleepidemiologic block representing one of the three remainingmajor global reservoirs for poliovirus transmission (the othertwo being northern India and Nigeria). Improvements in thequality of SIAs and AFP surveillance since January 2000 havebrought both countries closer to interrupting poliovirus trans-mission.
Although armed conflict in Afghanistan has posed manychallenges to surveillance and vaccination activities, data fromJanuary–April 2002 indicate that progress toward eradicationhas resumed. The improved quality of SIAs and the additionof targeted SNID rounds in Afghanistan before September2001 appear to have prevented a widespread resurgence ofpoliovirus in the country during the recent conflict. Despitecontinuing military and political instability, public health staffin Afghanistan and Pakistan succeeded in implementing NIDsin late September and November and continued essential sur-veillance activities.
The AFP surveillance system in Pakistan provides reliabledata on which to base programmatic decisions. AFP surveil-lance quality in Afghanistan appears to be recovering from adecline during the recent conflict. Rapid restoration of thesystem in the remaining regions bordering Pakistan wherepolio is endemic is a top program priority. Both countrieswill conduct intense SIAs targeting high-risk populations dur-ing the summer of 2002 followed by NIDs in September andOctober. Mop-up vaccination activities to terminate the finalchains of transmission will be implemented in 2003 inresponse to any isolation of wild poliovirus. Vaccination andsurveillance activities are coordinated closely between the twocountries and include synchronization of SIAs, establishmentof border vaccination posts, and regular exchange of data.
TABLE. Number of reported cases of acute flaccid paralysis (AFP) and confirmed wild virus cases, and key surveillance indicators— Afghanistan and Pakistan, January 2000–April 2002*
January–December 2000 January–December 2001 January–April 2002No. % No. % No. %
No. confirmed Nonpolio adequate No. confirmed Nonpolio adequate No. confirmed Nonpolio adequateAFP wild virus AFP stool AFP wild virus AFP stool AFP wild virus AFP stool
cases cases rate specimens† cases cases rate specimens cases cases rate specimens
Afghanistan 252 27 1.3 50 214 11 1.8 73 72 1 1.8 86Pakistan 1,152 199 1.5 67 1,573 116 2.2 83 512 18 2.2 88
* Data for 2002 annualized as of March 31, 2002.†Two stool specimens collected at an interval of at least 24 hours within 14 days of paralysis onset and shipped properly to the laboratory.
Afghanistan
Pakistan
Punjab
Balochistan
Sindh
Helmand
Kandahar
Oruzgan Paktia
NangarharNW
Frontier
Federallyadministered
tribalareas
January–April 2002January–December 2001
Kabul
Islamabad
FIGURE. Distribution of wild poliovirus isolates from acuteflaccid paralysis cases — Afghanistan and Pakistan, January2001–April 2002

524 MMWR June 21, 2002
A number of risks might threaten the interruption of virustransmission by the end of 2002, including armed conflictand deterioration of security throughout the region, suddenlarge population movements that might spread the virus toareas where it is now absent, persistence of virus transmissionin reservoirs shared between the two countries, failure to reachhigh-risk groups in SIAs, shortfall in human and financialresources, increasing complacency, and inability to balancecompeting priorities. In Afghanistan, the new interim adminis-tration is committed to polio eradication, and in Pakistan,political commitment from the newly formed district gov-ernments to the federal government is high. Close collabora-tion between local governments and their global partners¶
has been critical in sustaining eradication activities in bothcountries and will continue to be essential to achieve polioeradication.References1. CDC. Progress toward global eradication of poliomyelitis, 2001.
MMWR 2002;51:253–6.2. CDC. Progress toward poliomyelitis eradication—Eastern Mediterra-
nean Region, January 2000–September 2001. MMWR 2001;50:1113–6.3. CDC. Progress toward poliomyelitis eradication—Pakistan, 1999–June
2000. MMWR 2000;49:758–62.4. CDC. Progress toward poliomyelitis eradication—Afghanistan, 1999–
2000. MMWR 2001;50:144–7.
¶Polio eradication efforts in Pakistan and Afghanistan are supported by thegovernments of both countries, Japan, the United Kingdom, and theNetherlands; the Bill and Melinda Gates Foundation, the United NationsFoundation; the United Nations Children’s Fund (UNICEF); the InternationalCommittee of the Red Cross; the International Federation of Red Cross andRed Crescent Societies; Rotary International; the U.S. Agency for InternationalDevelopment; WHO; and CDC.
Update: Rashes AmongSchoolchildren — 27 States,
October 4, 2001– June 3, 2002Since October 2001, a total of 27 states has reported
investigations of multiple groups of schoolchildren who havedeveloped rashes. Rash illnesses among schoolchildren in 14states were reported in March (1); since the initial report,rashes have been reported in 13 additional states (Alabama,Alaska, Illinois, Iowa, Kansas, Kentucky, Maine, Maryland,Massachusetts, Minnesota, Missouri, New Hampshire, andNew Jersey). Rashes also have been reported among school-children in Canada. The investigations have not identified acommon source for the reported cases of rashes among U.S.schoolchildren. This report summarizes available data on theserashes and provides examples for three states. CDC iscontinuing to monitor reports of rashes and is providing
technical assistance to state and local health departmentsinvestigating these reports.
United StatesAlthough rashes among schoolchildren are common, pub-
lic concern has been growing because of the number ofsimultaneous cases reported in schools across the United States.During October 2001–May 2002, rashes among groups ofstudents were reported in approximately 110 U.S. elemen-tary, middle, and high schools. The number of studentsaffected in each school ranged from five to 274; the propor-tion of students affected ranged from <1% to 47%. The sexdistribution of cases varied among the schools, ranging from33% to 100% female. Rashes varied by presentation, loca-tion on the body, and duration. Most affected children werereported as having 1) a pruritic, sunburn-like rash thatappeared on the cheeks and arms, 2) a burning sensation onthe skin that might be associated with pruritis, or 3) a hive-or nettle-like reaction that was observed moving from onepart of the body to another. Rashes tended to be self-limitingand ranged in duration from <1 hour to >1 month. Becauseof the transient nature of the rashes, most children who wereevaluated were seen by school nurses; some children who hadrecurring or persistent rashes were seen by dermatologists.Accompanying signs and symptoms such as conjunctivitis,fever, vomiting, sore throat, or headaches were absent in allbut a few cases. The etiology of the rash illnesses remainsunknown in several states. Alaska, Illinois, Kentucky, Minne-sota, Mississippi, and New York have received reports of casesassociated with parvovirus B19, and other states haveinvestigated small reports of rash illness that appear to be pri-marily psychogenic in response to a child with a diagnosedrash or infection.
Case ReportsNew York. On March 8, 2002, the New York State
Department of Health (NYSDOH) sent a notice to localhealth units and school superintendents across the state toincrease awareness and reporting of outbreaks of rash illness.At the time, NYSDOH and a county health department werefollowing an ongoing outbreak of rash illness, which began inJanuary and by April 2 involved 242 (7%) elementary- andmiddle-school students in a school district with 3,371 chil-dren. No fevers or other major signs and symptoms werereported to accompany the rashes, and no rash illness wasreported among employees in affected schools. To assess theoutbreak, school nurses selected a sample of affected studentswith active rashes from five elementary schools and one middleschool; 17 children with rashes were interviewed on April 2

Vol. 51 / No. 24 MMWR 525
and evaluated by a team of health-care providers by physicalexamination, serology for parvovirus B19, and viral culturesof throat and stool specimens. Dates of rash onset for these17 children ranged from March 11 to April 1. Of the 17 chil-dren interviewed, 12 (71%) were females. The ages of thestudents ranged from 5–13 years (mean: 9 years). Five (29%)children reported having had symptoms (e.g., fatigue, stuffynose, and sore throat) that occurred within 4 days before rashonset. Of six (35%) children who reported that another fam-ily member had a rash, four (67%) had family members whoserashes occurred before the child’s rash onset, and two (33%)had family members whose onset followed the child’s rash.Fifteen (88%) children reported their rashes to be itchy; ofthese, nine (60%) children reported no association with timeof day or place. Three (18%) of the 17 children that wereinterviewed reported having a low-grade fever (i.e., <100.3º F[37.9º C]), nine (53%) children reported that the rashes werewarm to the touch, eight (47%) children associated the rasheswith a burning sensation, and 13 (77%) children reportedthat the rashes reappeared; information for one child was notrecorded. Five (29%) children had rashes that began on theface and nine (53%) children rashes that began on theextremities or stomach before spreading; two (12%) childrenhad rashes that did not spread. On examination, health-careproviders described the rashes as maculopapular in 13 (77%)cases, lacy and reticular in 14 (82%) cases, and morbilliformin six (35%) cases. All 17 children submitted specimens forviral studies; 16 (94%) had negative viral throat cultures, andone was positive for influenza A. Stool specimens were sub-mitted by nine children; all were negative on viral culture.Human parvovirus B19 antibody assays were performed on14 children; 13 (93%) were positive for IgM antibodies, and14 (100%) were positive for IgG antibodies. The results ofthis investigation support the conclusion that the outbreakwas due to parvovirus B19, which causes erythema infectiosum(i.e., fifth disease).
Georgia. During January, the Georgia Division of PublicHealth received a report that 12 students from an elementaryschool had developed pruritic rashes in a single day; 10 chil-dren were in the same class. Dermatologists who examinedall 12 children diagnosed the rashes as contact dermatitis. Therashes resolved by the next day, and no additional casesoccurred. The school cleaned the classroom on the day therashes occurred, including vacuuming the carpet, washingtable tops, and wet dusting all surfaces. The school nursedetermined that the pruritic rashes were the only sign or symp-tom; one child had a history of a preceding illness (a cold theprevious week). The onset of rash illnesses began after onechild developed a pruritic eczematic rash on one arm. Afterseveral minutes, a second child complained that her arm was
itching; within the hour, eight children seated at the sametable also were scratching their arms and complaining aboutrashes. A child from another classroom reported a pruriticrash after sitting with the other children at lunch; anotherchild, also from another class, reported a rash after seeing theindex child in the school clinic. Although environmental orallergic exposure cannot be ruled out, the school nurse’sdescription suggests that all the rashes (with the exception ofthe index case) were caused by scratching secondary toobserving, encountering, or interacting with the child withthe eczematic rash.
Missouri. During February 5–March 19, a total of 33 (21%)students with rash illness was reported in a rural elementaryschool with 161 students; 12 (36%) of the 33 affected stu-dents sought medical care. The illnesses were mild and lasteda median of 4 days (range: 6 hours–14 days). Of the 71 chil-dren in kindergarten through fourth grade, 25 (35%) wereaffected. Most affected students had rashes limited to the handsand forearms, but five (15%) children had rashes that weregeneralized or involved the face; five (15%) children had pru-ritic rashes. Dates of rash onset were February 19 for six casesand February 28 for 12 cases; these 18 cases accounted for55% of cases among students. However, single cases contin-ued to be reported as late as March 19. Of the 33 casesreported, 23 (70%) occurred among girls. Two siblingsdeveloped rashes 4 days apart; no other rashes among familymembers were reported to the school nurse. Contact derma-titis was the most likely explanation for most cases, possiblyfrom frequent use of hand cleaners and alcohol-based sanitizersor from surfaces cleaned with ammonia-based products. Otherpossible etiologies offered by clinicians for these rashesincluded scabies, dry skin, and parvovirus B19 infection; how-ever, none of these diagnoses was confirmed.
Public Health ResponseDespite public perceptions that all rash cases are inter-
related, even in a single school, children’s rashes can resultfrom a variety of etiologies, including medications, dry orsensitive skin, eczema, allergies, viral infections, and psy-chogenic or environmental factors. Investigations have iden-tified cases for some of the rashes reported. In other cases, theetiology remains unknown.
CDC is continuing to monitor reports of groups of school-children with rashes and is providing technical assistance tostate and local health departments investigating these reports.In addition, CDC is receiving public inquiries from adults(with or without exposure to children) who suspect they mighthave a related rash. These public inquiries are forwarded tostate or local health departments for follow-up.
526 MMWR June 21, 2002
Reported by: MA Kacica, MD, P Drabkin, MPH, PF Smith, MD,New York State Dept of Health; J Crucetti, MD, Albany County HealthDept, Albany, New York. P Blake, MD, S Lance-Parker, PhD, J Fletcher,MD, C Morin, MD, Georgia Dept of Human Resources, Div of PublicHealth. E Simoes, MD, Missouri Dept of Health and Senior Svcs.C Rubin, DVM, Div of Environmental Hazards and Health Effects,National Center for Environmental Health; J Malone, MD, N Smith,MPH, EIS officers, CDC.
Editorial Note: Rashes reported in schools have affectedschool policies and practices. Normal school operations weredisrupted when students were moved or evacuated from theirclassrooms, and the costs of conducting environmentalassessments have added a financial burden. In the absence ofan identifiable etiology for the rashes, many school adminis-trators and board members had to consider whether short-term school closures were warranted and to decide if childrenwith rashes should be excluded from school or if childrenwithout rashes should be permitted to stay home from school.
Schools that identify groups of students and/or staff withrashes should report cases to their state or local health depart-ment to determine what kind of investigation should be con-ducted to ensure that no identifiable hazards exist within theschool setting. To assist with these efforts, CDC has devel-oped and distributed to health departments a document withsuggested approaches for investigating reports of rashes amonggroups of schoolchildren. In particular, efforts should be madeto 1) collect uniform information from affected persons socases of rashes reportedly associated with school settings canbe differentiated from rashes occurring from other causes;2) monitor reported cases to ensure that the rashes haveresolved; 3) determine whether similar rashes are occurringamong household members who have not been exposed tothe school setting; and 4) confirm that no other associatedsigns and symptoms are occurring or developing subsequentto the rashes.
At least five challenges might impede the investigation ofreported rashes among schoolchildren and the identificationof the underlying causes. First, school mechanisms for report-ing and tracking students’ health vary. Second, because manyrashes are of short duration, health-care providers other thanschool nurses usually do not observe them. Third, parentsand health-care providers might be reluctant to collect bio-logic specimens that would assist with determining an infec-tious etiology from otherwise healthy children. Fourth, thelogistics of organizing an environmental assessment candelay collection of timely and complete information. Finally,inconclusive and possibly misleading data might be collectedif a methodical environmental sampling plan is not followed (2).
When accompanied by other signs and symptoms, rashescan be an important indicator of serious health conditions;
however, few schoolchildren with rashes had any accompa-nying signs and symptoms. The level of parental concern andmedia attention elicited by reports of rashes among school-children underscores the need for continuing investigation.References1. CDC. Rashes among schoolchildren—14 States, October 4, 2001–
February 27, 2002. MMWR 2001;51:161–4.2. American Conference of Governmental Industrial Hygienists. Devel-
oping a sampling plan (chapter 5). In: Bioaerosols Assessment and Con-trol. Cincinnati, Ohio: American Conference of Governmental IndustrialHygienists, 1999.
AcknowledgmentsThis report is based on data contributed by: J Lofgren, MD,
B Whitley, MD, Alabama Dept of Public Health; B Eichold, MD,P Wilson, MPH, B Bodie, MD, A Morris, MD, W Hannon, MSN,W McCullum, S McRae, MA, S Baker, MA, A Lamar, MA,K Micher, MS, G Clausell, R Pelt, Mobile County Health Dept;B Estrada, MD, J Quinonez MD, Univ of South Alabama, Mobile.J Middaugh, MD, Alaska Dept of Health and Social Svcs. C McRill,MD, K Komatsu, MPH, W Humble, MPH, Arizona Dept of HealthSvcs; L Sands, DO, MPH, Maricopa County Dept of Public Health,Phoenix, Arizona. J Hadler, MD, M Cartter, MD, P Mshar,T Wegrzyn, MPH, Connecticut Dept of Health. S Wiersma, MD,Florida Dept of Health; P Blake, MD, S Lance-Parker, PhD,J Fletcher, MD, C Morin, MD, Georgia Dept of Human Resources,Div of Public Health. M Dworkin, MD, C Jennings, MPH, IllinoisDept of Public Health. R Teclaw, DVM, H Messersmith,M Wilkinson, Indiana State Dept of Health. P Quinlisk, MD,J Goddard, Iowa Dept of Public Health. G Pezzino, MD, G Hansen,MD, Kansas Dept of Health and Environment. S Englender, MD,T Johnson, Kentucky Cabinet for Health Svcs, Dept for PublicHealth. K Gensheimer, MD, G Beckett, MPH, J Gunderman-King,Maine Dept of Human Svcs, Bur of Health. D Blyth, MD,K Fujii, MHS, J Casani, MD, Maryland Dept of Health and MentalHygiene. A DeMaria, Jr, MD, M Horine, MPH, D Heisey, MPH,E Traphagen, MPH, E Gould, MPH, Massachusetts Dept of PublicHealth. H Hull, MD, M Feaver, MPH, Minnesota Dept of Health.M Currier, MD, S Slavinski, DVM, Mississippi Dept of Health.C Reddick, P Robinson, G Storm, B Owen, H Marx, F Khan, MD,J Gilliam, Missouri Dept of Health and Senior Svcs. J Greenblatt,MD, J Montero, MD, R Dipentima, New Hampshire State Deptof Health and Human Svcs. E Bresnitz, MD, J Brook, MD, NewJersey Dept of Health and Senior Svcs. P Thomas, MD, H Mackley,MPH, B Asante, MD, G Krigsman, MD, New York City Dept ofHealth; M Lepow, MD, J Mysliborski, MD, J Hill, MD, P Hughes,MD, Albany Medical College; S Brandt-Ruzza, P McAllister,N Jones, Albany County Health Dept; J Menrath, BethlehemCentral School District, Albany County; T Giombetti, MD, Delmar;S Hayes, N Chatterjee, PhD, E Rizzo, MPH, New York State Deptof Health. F Smith, MD, M Burkett, MD, Ohio Dept of Health.M Kohn, MD, K Southwick, MD, K Hedberg, MD, E DeBess,DVM, L Davidoff, MD, M Scott, M Heumann, MA, OregonHealth Div. Y Chilcoat, G Stevens, V Barbour, MSN, J Baures,

Vol. 51 / No. 24 MMWR 527
J Manwaring, B Thomas, G Chakarun, Jackson County PublicHealth Dept, Medford; R Parlier, M Jaqua, M Breedlove, MPA,N Nunley, Yamhill County Health Dept, McMinnville, Oregon.J Rankin, Jr, DVM, J Hersh, MEd, K Nalluswami, MD, M Moll,MD, K Waller, MD, C Coventon, MD, C Teacher, MSN,Pennsylvania Dept of Health. F Sassano, Bucks County Dept ofHealth, Doylestown; J Maher, MD, E Walls, Chester County HealthDept, Westchester; C Bayesinger, M Supplee, MS, MontgomeryCounty Human Svcs Center, Norristown; J Jahre, MD, St. Luke’sHospital Network, Bethlehem; N Sykes, MD, Jefferson MedicalCollege, Philadelphia; S Naides, MD, Hershey Medical Center,Hershey, Pennsylvania. D Perrotta, PhD, J Perdue, Texas Dept ofHealth. R Stroube, MD, E Barrett, DMD, S Jenkins, VMD, VirginiaHealth Dept; J Florance, MD, A Ansher, MD, L Estrada, MPH,B Bradshaw, Prince William Health Dept, Manassas, Virginia.L Haddy, MA, D Bixler, MD, West Virginia Dept of Health andHuman Resources, Bur for Public Health; P Gordon, MD,R Moodispaugh, R Swiger, Harrison-Clarksburg Health Dept,Clarksburg, West Virginia. Local health and education departmentsand schools. A Tepper, PhD, B Lushniak, MD, G Burr, Div ofSurveillance, Hazard Evaluation, and Field Studies, NationalInstitute for Occupational Safety and Health;L Anderson, MD, N Khetsuriani, MD, Div of Viral and RickettsialDiseases, National Center for Infectious Diseases. L Kolbe, PhD,S Everett, ScD, Div of Adolescent and School Health, NationalCenter for Chronic Disease Prevention and Health Promotion;A Adija, MD, K Griffith, MD, J McLaughlin, MD, J Mullins, DVM,M Traeger, MD, EIS officers, CDC.
Cancer Death Rates — Appalachia,1994–1998
Cancer is the second leading cause of death in the UnitedStates (1). Although descriptive analyses of mortality data areused often to identify variations by time and person, analysesthat focus on regional variations are less common. Appala-chia* is a U.S. region with a high prevalence of risk factors forcancer (e.g., tobacco use, physical inactivity, and inadequateaccess to medical care). Analyses that focus on Appalachiaprovide valuable information for cancer control, research,and intervention (2). To assess the impact of cancer inAppalachia, researchers from the University of Kentucky andPennsylvania State University, in collaboration with CDC,analyzed mortality data from CDC’s National Center forHealth Statistics for 1994–1998. This report summarizes the
results of that analysis, which indicate elevated cancer mor-tality, underscoring the need for ongoing cancer preventionand control programs as a major public health priority in thisregion.
Appalachia encompasses 406 counties in 13 states alongthe spine of the Appalachian mountains ranging from NewYork to Mississippi (Figure). The population of Appalachia(1994–1998 average population: 21,927,337) is approxi-mately 8.3% of the total U.S. population. Cancer death rateswere age-adjusted by using the 1970 U.S. standard millionpopulation; this standard was used instead of the 2000 stan-dard effective with data for 1999 to allow comparability ofrates with earlier internal state reports. Rates were calculatedby sex and by selected anatomic sites for the United States, allAppalachia, rural Appalachia, and the Appalachian regionsof each of the 13 states (3). Rural Appalachian counties wereidentified according to urban-rural continuum codes (1994–1998 average rural population: 6,835,378) (4,5). Populationfiles from the National Cancer Institute (NCI) Surveillance,Epidemiology, and End Results (SEER) program were usedto calculate the age-adjusted death rates (6). Cancers were
* As determined by the Appalachian Regional Commission, which was mandatedfederally in 1965 to support economic and social development in theAppalachian region. The Commission is a partnership composed of thegovernors of the 13 Appalachian states and a presidential appointee representingthe federal government.
FIGURE. Location of Appalachia*
* Includes the 406 counties comprising Appalachia, as determined by theAppalachian Regional Commission.
528 MMWR June 21, 2002
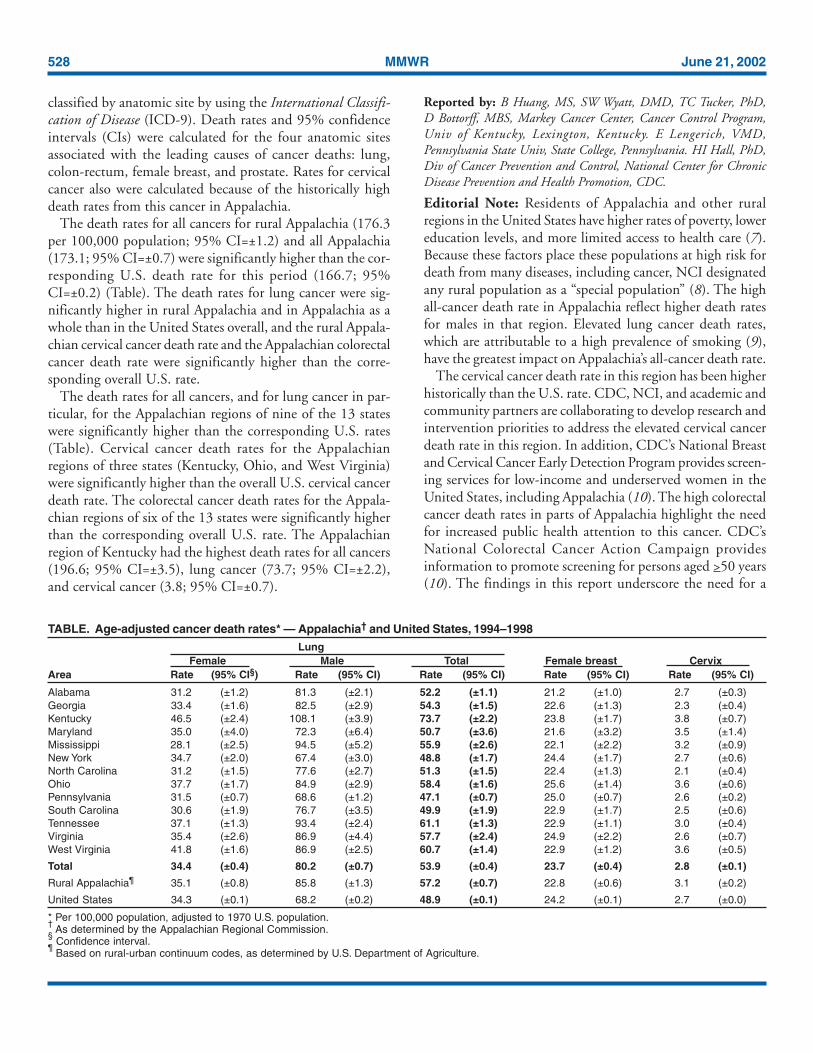
classified by anatomic site by using the International Classifi-cation of Disease (ICD-9). Death rates and 95% confidenceintervals (CIs) were calculated for the four anatomic sitesassociated with the leading causes of cancer deaths: lung,colon-rectum, female breast, and prostate. Rates for cervicalcancer also were calculated because of the historically highdeath rates from this cancer in Appalachia.
The death rates for all cancers for rural Appalachia (176.3per 100,000 population; 95% CI=±1.2) and all Appalachia(173.1; 95% CI=±0.7) were significantly higher than the cor-responding U.S. death rate for this period (166.7; 95%CI=±0.2) (Table). The death rates for lung cancer were sig-nificantly higher in rural Appalachia and in Appalachia as awhole than in the United States overall, and the rural Appala-chian cervical cancer death rate and the Appalachian colorectalcancer death rate were significantly higher than the corre-sponding overall U.S. rate.
The death rates for all cancers, and for lung cancer in par-ticular, for the Appalachian regions of nine of the 13 stateswere significantly higher than the corresponding U.S. rates(Table). Cervical cancer death rates for the Appalachianregions of three states (Kentucky, Ohio, and West Virginia)were significantly higher than the overall U.S. cervical cancerdeath rate. The colorectal cancer death rates for the Appala-chian regions of six of the 13 states were significantly higherthan the corresponding overall U.S. rate. The Appalachianregion of Kentucky had the highest death rates for all cancers(196.6; 95% CI=±3.5), lung cancer (73.7; 95% CI=±2.2),and cervical cancer (3.8; 95% CI=±0.7).
Reported by: B Huang, MS, SW Wyatt, DMD, TC Tucker, PhD,D Bottorff, MBS, Markey Cancer Center, Cancer Control Program,Univ of Kentucky, Lexington, Kentucky. E Lengerich, VMD,Pennsylvania State Univ, State College, Pennsylvania. HI Hall, PhD,Div of Cancer Prevention and Control, National Center for ChronicDisease Prevention and Health Promotion, CDC.
Editorial Note: Residents of Appalachia and other ruralregions in the United States have higher rates of poverty, lowereducation levels, and more limited access to health care (7).Because these factors place these populations at high risk fordeath from many diseases, including cancer, NCI designatedany rural population as a “special population” (8). The highall-cancer death rate in Appalachia reflect higher death ratesfor males in that region. Elevated lung cancer death rates,which are attributable to a high prevalence of smoking (9),have the greatest impact on Appalachia’s all-cancer death rate.
The cervical cancer death rate in this region has been higherhistorically than the U.S. rate. CDC, NCI, and academic andcommunity partners are collaborating to develop research andintervention priorities to address the elevated cervical cancerdeath rate in this region. In addition, CDC’s National Breastand Cervical Cancer Early Detection Program provides screen-ing services for low-income and underserved women in theUnited States, including Appalachia (10). The high colorectalcancer death rates in parts of Appalachia highlight the needfor increased public health attention to this cancer. CDC’sNational Colorectal Cancer Action Campaign providesinformation to promote screening for persons aged >50 years(10). The findings in this report underscore the need for a
TABLE. Age-adjusted cancer death rates* — Appalachia† and United States, 1994–1998Lung
Female Male Total Female breast CervixArea Rate (95% CI§) Rate (95% CI) Rate (95% CI) Rate (95% CI) Rate (95% CI)
Alabama 31.2 (±1.2) 81.3 (±2.1) 52.2 (±1.1) 21.2 (±1.0) 2.7 (±0.3)Georgia 33.4 (±1.6) 82.5 (±2.9) 54.3 (±1.5) 22.6 (±1.3) 2.3 (±0.4)Kentucky 46.5 (±2.4) 108.1 (±3.9) 73.7 (±2.2) 23.8 (±1.7) 3.8 (±0.7)Maryland 35.0 (±4.0) 72.3 (±6.4) 50.7 (±3.6) 21.6 (±3.2) 3.5 (±1.4)Mississippi 28.1 (±2.5) 94.5 (±5.2) 55.9 (±2.6) 22.1 (±2.2) 3.2 (±0.9)New York 34.7 (±2.0) 67.4 (±3.0) 48.8 (±1.7) 24.4 (±1.7) 2.7 (±0.6)North Carolina 31.2 (±1.5) 77.6 (±2.7) 51.3 (±1.5) 22.4 (±1.3) 2.1 (±0.4)Ohio 37.7 (±1.7) 84.9 (±2.9) 58.4 (±1.6) 25.6 (±1.4) 3.6 (±0.6)Pennsylvania 31.5 (±0.7) 68.6 (±1.2) 47.1 (±0.7) 25.0 (±0.7) 2.6 (±0.2)South Carolina 30.6 (±1.9) 76.7 (±3.5) 49.9 (±1.9) 22.9 (±1.7) 2.5 (±0.6)Tennessee 37.1 (±1.3) 93.4 (±2.4) 61.1 (±1.3) 22.9 (±1.1) 3.0 (±0.4)Virginia 35.4 (±2.6) 86.9 (±4.4) 57.7 (±2.4) 24.9 (±2.2) 2.6 (±0.7)West Virginia 41.8 (±1.6) 86.9 (±2.5) 60.7 (±1.4) 22.9 (±1.2) 3.6 (±0.5)
Total 34.4 (±0.4) 80.2 (±0.7) 53.9 (±0.4) 23.7 (±0.4) 2.8 (±0.1)
Rural Appalachia¶ 35.1 (±0.8) 85.8 (±1.3) 57.2 (±0.7) 22.8 (±0.6) 3.1 (±0.2)
United States 34.3 (±0.1) 68.2 (±0.2) 48.9 (±0.1) 24.2 (±0.1) 2.7 (±0.0)
* Per 100,000 population, adjusted to 1970 U.S. population.†
As determined by the Appalachian Regional Commission.§ Confidence interval.
¶ Based on rural-urban continuum codes, as determined by U.S. Department of Agriculture.

Vol. 51 / No. 24 MMWR 529
strengthened focus on cancer prevention and control programsas major public health priorities for communities, health-careproviders, and public health agencies throughout this region.References1. American Cancer Society. Cancer facts & figures 2002. Atlanta,
Georgia: American Cancer Society, 2002.2. Friedell GH, Rubio A, Maretzki A, et al. Community cancer control
in a rural, underserved population: the Appalachian Leadership Initia-tive on Cancer Project. J Health Care Poor Underserved 2001;12:5–19.
3. Appalachian Regional Commission. Counties in the AppalachianRegion, June 1998. Available at http://www.arc.gov/aboutarc/region/counties.htm.
4. Economic Research Service, U.S. Department of Agriculture. Mea-suring rurality: rural-urban continuum codes, June 1993. Available athttp://www.ers.usda.gov/briefing/Rural/Data/Codes.
5. Couto RA, Simpson NK, Harris G, eds. Appendix F: defining urbanand rural places. In: Sowing seeds in the mountains: community-basedcoalitions for cancer prevention and control. Bethesda, Maryland:Appalachia Leadership Initiative on Cancer, National Cancer Insti-tute, 1993;330–1 (NIH Publication No. 94-3779).
6. Surveillance, Epidemiology and End Results, National Cancer Insti-tute. U.S. population data, 1998. Available at http://seer.cancer.gov/popdata.
7. Friedell GH, Linville LH, Hullet S. Cancer control in rural Appala-chia. Cancer 1998;83:1868–71.
8. Portnoy B. Healthy people in rural America by the year 2000. In:Couto RA, Simpson NK, Harris G, eds. Sowing seeds in the moun-tains: community-based coalitions for cancer prevention and control.Bethesda, Maryland: Appalachia Leadership Initiative on Cancer,National Cancer Institute, 1994;102–19 (NIH Publication No.94-3779).
9. CDC. Behavioral Risk Factor Surveillance System online prevalencedata, 1995–2000. Available at http://apps.nccd.cdc.gov/brfss/index.asp.
10. CDC. Cancer prevention and control. Available at http://www.cdc.gov/cancer.
Notice to Readers
Change in Reporting Congenital SyphilisBeginning with this issue, congenital syphilis incidence data
in Table 2, “Provisional cases of selected notifiable diseases,United States,” will no longer be provided through updatedreports to the Division of STD Prevention, National Centerfor HIV, STD and TB Prevention (NCHSTP), as noted bypreviously published footnotes in Table 2. Congenital syphi-lis incidence data presented in Table 2 will be based on inci-dence data reported from state health departments to theNational Notifiable Disease Surveillance System each week.Additional information about this change is available fromthe Statistics and Data Management Branch, Division of STDPrevention, NCHSTP, telephone 404-639-8356.
Notice to Readers
Resumption of Routine Schedule forTetanus and Diphtheria Toxoids
The supply of adult tetanus and diphtheria toxoids (Td) inthe United States has become sufficient to permit the resump-tion of the routine schedule for Td use as recommended bythe Advisory Committee on Immunization Practices (1,2).Adolescents and adults for whom routine Td booster doseswere deferred should be recalled by their health-care providersto receive the delayed dose. School attendance provisionsrequiring students to have received a Td booster at age >11years can be reinstituted.
TABLE. (Continued) Age-adjusted cancer death rates — Appalachia and United States, 1994–1998Colorectal All cancers
Female Male Total Prostate Female Male TotalArea Rate (95% CI) Rate (95% CI) Rate (95% CI) Rate (95% CI) Rate (95% CI) Rate (95% CI) Rate (95% CI)
Alabama 12.1 (±0.7) 17.9 (±1.0) 14.5 (±0.6) 26.0 (±1.2) 135.3 (±2.4) 230.4 ( ±3.5) 173.3 (±2.0)Georgia 12.1 (±0.9) 18.2 (±1.3) 14.8 (±0.8) 23.1 (±1.6) 130.1 (±3.1) 215.1 ( ±4.6) 164.9 (±2.6)Kentucky 16.1 (±1.3) 21.5 (±1.7) 18.4 (±1.0) 22.5 (±1.7) 155.3 (±4.2) 251.6 ( ±5.9) 196.6 (±3.5)Maryland 16.2 (±2.7) 26.4 (±3.8) 20.3 (±2.2) 20.8 (±3.3) 134.0 (±7.8) 206.5 (±10.8) 163.2 (±6.3)Mississippi 12.6 (±1.6) 17.7 (±2.2) 14.9 (±1.3) 25.0 (±2.5) 128.9 (±5.3) 235.5 ( ±8.2) 171.8 (±4.6)New York 15.7 (±1.2) 22.0 (±1.7) 18.5 (±1.0) 24.3 (±1.7) 142.7 (±3.9) 206.2 ( ±5.1) 168.6 (±3.1)North Carolina 12.6 (±0.9) 18.8 (±1.3) 15.3 (±0.8) 23.0 (±1.4) 128.1 (±3.1) 208.3 ( ±4.4) 161.6 (±2.6)Ohio 17.2 (±1.1) 24.6 (±1.5) 20.4 (±0.9) 22.0 (±1.4) 149.9 (±3.4) 226.6 ( ±4.6) 182.2 (±2.8)Pennsylvania 15.7 (±0.5) 22.9 (±0.7) 18.8 (±0.4) 23.3 (±0.7) 140.0 (±1.5) 212.4 ( ±2.1) 169.1 (±1.3)South Carolina 12.5 (±1.2) 19.4 (±1.8) 15.4 (±1.0) 25.0 (±2.0) 128.6 (±3.9) 211.1 ( ±5.8) 161.9 (±3.3)Tennessee 13.1 (±0.8) 19.8 (±1.1) 15.9 (±0.6) 23.6 (±1.2) 139.9 (±2.6) 233.4 ( ±3.7) 178.2 (±2.1)Virginia 13.8 (±1.5) 19.5 (±2.1) 16.3 (±1.3) 21.0 (±2.1) 141.0 (±5.1) 222.9 ( ±7.1) 175.2 (±4.2)West Virginia 15.7 (±0.9) 21.5 (±1.2) 18.2 (±0.7) 22.6 (±1.2) 150.4 (±2.9) 229.9 ( ±4.1) 182.5 (±2.4)
Total 14.5 (±0.3) 21.0 (±0.4) 17.2 (±0.2) 23.5 (±0.4) 139.8 (±0.8) 221.4 ( ±1.2) 173.1 (±0.7)
Rural Appalachia 14.1 (±0.5) 20.3 (±0.6) 16.8 (±0.4) 22.6 (±0.6) 140.3 (±1.5) 225.5 ( ±2.1) 176.3 (±1.2)
United States 14.1 (±0.1) 20.6 (±0.1) 16.9 (±0.1) 23.8 (±0.1) 139.0 (±0.3) 206.7 ( ±0.3) 166.7 (±0.2)

530 MMWR June 21, 2002
The Td shortage began in the last quarter of 2000 andresulted from 1) decreased production in 2000 by both U.S.manufacturers (Wyeth Lederle [Pearl River, New York] andAventis Pasteur [Swiftwater, Pennsylvania]), 2) the decisionby Wyeth Lederle to cease Td production in 2001, and 3) the11-month period required for vaccine production, which ledto a lag before increased Td supplies were available from theremaining manufacturer distributing vaccine nationally(Aventis Pasteur) (3–5). The amount of Td distributednationally decreased 40% during 2001–2002, compared withpreshortage distribution levels (Biological Surveillance Sys-tem, unpublished data, 2002). To ensure vaccine availabilityfor priority indications (3), CDC recommended in May 2001that all routine Td boosters in adolescents and adults bedeferred and that health-care providers record the names ofpatients whose booster doses were delayed for call-back onceTd supplies are restored (5). Health-care providers shouldreview the vaccination status of their patients and administerTd and other indicated vaccines as appropriate.References1. Immunization Practices Advisory Committee. Diphtheria, tetanus, and
pertussis: recommendations for vaccine use and other preventivemeasures—recommendations of the Immunization Practices AdvisoryCommittee (ACIP). MMWR 1991;40(No. RR-10).
2. CDC. Immunization of adolescents: recommendations of the AdvisoryCommittee on Immunization Practices, the American Academy ofPediatrics, the American Academy of Family Physicians, and the Ameri-can Medical Association. MMWR 1996;45(No. RR-13).
3. CDC. Shortage of tetanus and diphtheria toxoids. MMWR2000;49:1029–30.
4. CDC. Update on the supply of tetanus and diphtheria toxoids and ofdiphtheria and tetanus toxoids and acellular pertussis vaccine. MMWR2001;50:189–90.
5. CDC. Deferral of routine booster doses of tetanus and diphtheria tox-oids for adolescents and adults. MMWR 2001;50:418,427.
Notice to Readers
National Immunization Programand Public Health Training Network
Satellite Broadcast and WebcastCDC will present “The Immunization Encounter: Critical
Issues,” a live satellite broadcast and webcast, on June 27,2002, from 12:30 to 2:30 p.m. (EST). This program will ad-dress issues related to a routine vaccination clinic encounter,including recommended standards of practice for patientintake and screening, vaccine administration, vaccine man-agement, documentation, vaccine adverse events managementand reporting, and resources for staff orientation and devel-opment. The broadcast is targeted toward vaccination clinicmanagers, staff supervisors, and staff who administer vaccines(e.g., physicians, nurse practitioners, pharmacists, physicians’assistants, medical assistants, and students).
Online registration is available at http://www.phppo.cdc.gov/phtnonline. Information about registration also isavailable at 800-418-7246 or 404-639-1292.
Notice to Readers
National HIV Testing Day, June 27, 2002The National Association of People with AIDS will spon-
sor the eighth annual National HIV Testing Day on June 27.Testing Day is a nationwide campaign promoting humanimmunodeficiency virus (HIV) education and voluntary HIVcounseling, testing, and referral to encourage persons at riskfor HIV infection to know their status and to reduce theirrisks for HIV transmission.
Public health departments and other partners are encour-aged to support community HIV education and testingefforts during June 23–29. Activities can include sponsoringmobile HIV counseling, testing, and referral units; partici-pating in health fairs at which HIV education, counseling,testing, and referral services are offered; and partnering withlocal media to promote HIV prevention and testing messages.
Additional information about HIV counseling, testing, andreferral services is available at http://www.hivtest.org.

Vol. 51 / No. 24 MMWR 531
FIGURE I. Selected notifiable disease reports, United States, comparison of provisional 4-week totals ending June 15, 2002, withhistorical data
* No measles cases were reported for the current 4-week period yielding a ratio for week 24 of zero (0).† Ratio of current 4-week total to mean of 15 4-week totals (from previous, comparable, and subsequent 4-week periods for the past 5 years). The point where the hatched area begins
is based on the mean and two standard deviations of these 4-week totals.
DISEASE DECREASE INCREASECASES CURRENT
4 WEEKS
Ratio (Log Scale)†
Beyond Historical Limits
4210.50.250.125
334
308
90
44
0
81
9
339
2
Hepatitis A, Acute
Hepatitis B, Acute
Hepatitis C; Non-A, Non-B, Acute
Legionellosis
Measles, Total
Mumps
Pertussis
Rubella
Meningococcal Infections
0.06250.03125
*
TABLE I. Summary of provisional cases of selected notifiable diseases, United States, cumulative, week ending June 15, 2002 (24th Week)*
Anthrax 1 - Encephalitis: West Nile† 1 -Botulism: foodborne 7 9 Hansen disease (leprosy)† 36 31
infant 27 47 Hantavirus pulmonary syndrome† 5 4other (wound & unspecified) 9 5 Hemolytic uremic syndrome, postdiarrheal† 54 43
Brucellosis† 32 48 HIV infection, pediatric†§ 31 75Chancroid 28 21 Plague - 1Cholera 2 2 Poliomyelitis, paralytic - -Cyclosporiasis† 66 40 Psittacosis† 11 5Diphtheria - 1 Q fever† 15 5Ehrlichiosis: human granulocytic (HGE)† 59 30 Rabies, human 1 -
human monocytic (HME)† 28 31 Streptococcal toxic-shock syndrome† 38 47other and unspecified 2 1 Tetanus 5 21
Encephalitis: California serogroup viral† 5 2 Toxic-shock syndrome 52 62eastern equine† - - Trichinosis 8 5Powassan† - - Tularemia† 18 34St. Louis† - - Yellow fever 1 -western equine† - -
Cum. Cum. Cum. Cum.2002 2001 2002 2001
-:No reported cases.* Incidence data for reporting year 2001 and 2002 are provisional and cumulative (year-to-date).†Not notifiable in all states.
§Updated monthly from reports to the Division of HIV/AIDS Prevention — Surveillance and Epidemiology, National Center for HIV, STD, and TB Prevention(NCHSTP). Last update May 26, 2002.
532 MMWR June 21, 2002
N: Not notifiable. U: Unavailable. -: No reported cases. C.N.M.I.: Commonwealth of Northern Mariana Islands.* Incidence data for reporting year 2001 and 2002 are provisional and cumulative (year-to-date).† Chlamydia refers to genital infections caused by C. trachomatis.§ Updated monthly from reports to the Division of HIV/AIDS Prevention — Surveillance and Epidemiology, National Center for HIV, STD, and TB Prevention. Last update
April 28, 2002.
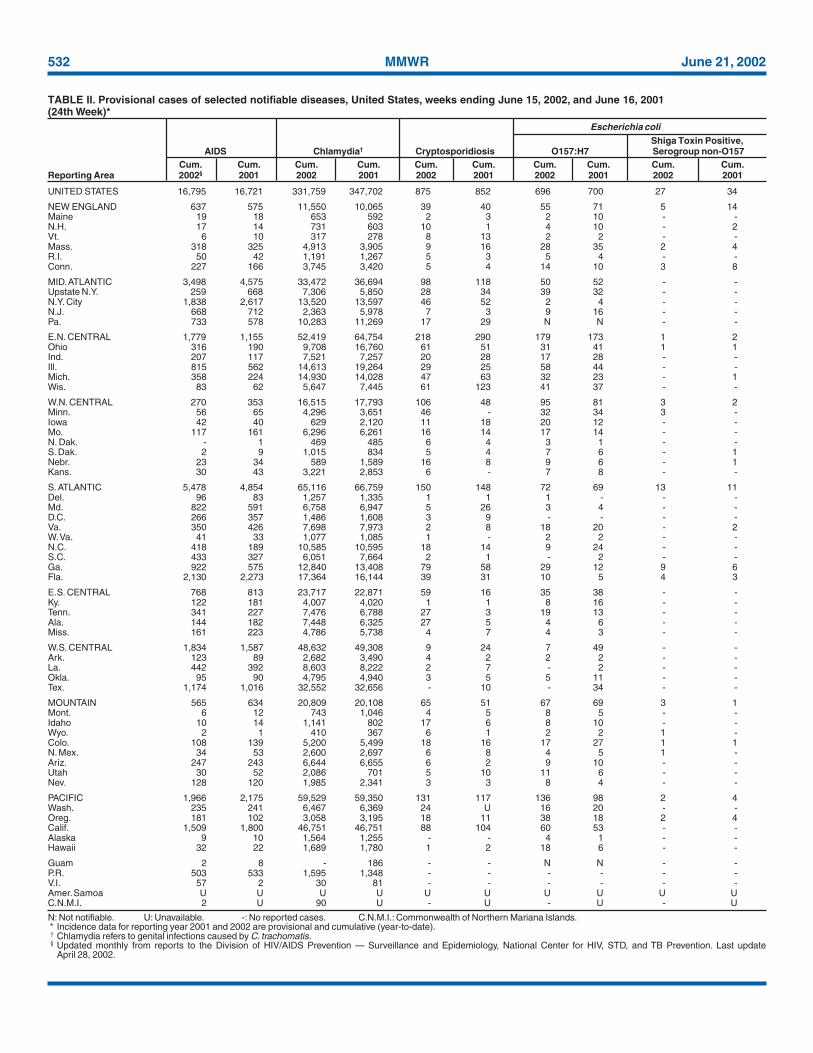
TABLE II. Provisional cases of selected notifiable diseases, United States, weeks ending June 15, 2002, and June 16, 2001(24th Week)*
UNITED STATES 16,795 16,721 331,759 347,702 875 852 696 700 27 34
NEW ENGLAND 637 575 11,550 10,065 39 40 55 71 5 14Maine 19 18 653 592 2 3 2 10 - -N.H. 17 14 731 603 10 1 4 10 - 2Vt. 6 10 317 278 8 13 2 2 - -Mass. 318 325 4,913 3,905 9 16 28 35 2 4R.I. 50 42 1,191 1,267 5 3 5 4 - -Conn. 227 166 3,745 3,420 5 4 14 10 3 8
MID. ATLANTIC 3,498 4,575 33,472 36,694 98 118 50 52 - -Upstate N.Y. 259 668 7,306 5,850 28 34 39 32 - -N.Y. City 1,838 2,617 13,520 13,597 46 52 2 4 - -N.J. 668 712 2,363 5,978 7 3 9 16 - -Pa. 733 578 10,283 11,269 17 29 N N - -
E.N. CENTRAL 1,779 1,155 52,419 64,754 218 290 179 173 1 2Ohio 316 190 9,708 16,760 61 51 31 41 1 1Ind. 207 117 7,521 7,257 20 28 17 28 - -Ill. 815 562 14,613 19,264 29 25 58 44 - -Mich. 358 224 14,930 14,028 47 63 32 23 - 1Wis. 83 62 5,647 7,445 61 123 41 37 - -
W.N. CENTRAL 270 353 16,515 17,793 106 48 95 81 3 2Minn. 56 65 4,296 3,651 46 - 32 34 3 -Iowa 42 40 629 2,120 11 18 20 12 - -Mo. 117 161 6,296 6,261 16 14 17 14 - -N. Dak. - 1 469 485 6 4 3 1 - -S. Dak. 2 9 1,015 834 5 4 7 6 - 1Nebr. 23 34 589 1,589 16 8 9 6 - 1Kans. 30 43 3,221 2,853 6 - 7 8 - -
S. ATLANTIC 5,478 4,854 65,116 66,759 150 148 72 69 13 11Del. 96 83 1,257 1,335 1 1 1 - - -Md. 822 591 6,758 6,947 5 26 3 4 - -D.C. 266 357 1,486 1,608 3 9 - - - -Va. 350 426 7,698 7,973 2 8 18 20 - 2W. Va. 41 33 1,077 1,085 1 - 2 2 - -N.C. 418 189 10,585 10,595 18 14 9 24 - -S.C. 433 327 6,051 7,664 2 1 - 2 - -Ga. 922 575 12,840 13,408 79 58 29 12 9 6Fla. 2,130 2,273 17,364 16,144 39 31 10 5 4 3
E.S. CENTRAL 768 813 23,717 22,871 59 16 35 38 - -Ky. 122 181 4,007 4,020 1 1 8 16 - -Tenn. 341 227 7,476 6,788 27 3 19 13 - -Ala. 144 182 7,448 6,325 27 5 4 6 - -Miss. 161 223 4,786 5,738 4 7 4 3 - -
W.S. CENTRAL 1,834 1,587 48,632 49,308 9 24 7 49 - -Ark. 123 89 2,682 3,490 4 2 2 2 - -La. 442 392 8,603 8,222 2 7 - 2 - -Okla. 95 90 4,795 4,940 3 5 5 11 - -Tex. 1,174 1,016 32,552 32,656 - 10 - 34 - -
MOUNTAIN 565 634 20,809 20,108 65 51 67 69 3 1Mont. 6 12 743 1,046 4 5 8 5 - -Idaho 10 14 1,141 802 17 6 8 10 - -Wyo. 2 1 410 367 6 1 2 2 1 -Colo. 108 139 5,200 5,499 18 16 17 27 1 1N. Mex. 34 53 2,600 2,697 6 8 4 5 1 -Ariz. 247 243 6,644 6,655 6 2 9 10 - -Utah 30 52 2,086 701 5 10 11 6 - -Nev. 128 120 1,985 2,341 3 3 8 4 - -
PACIFIC 1,966 2,175 59,529 59,350 131 117 136 98 2 4Wash. 235 241 6,467 6,369 24 U 16 20 - -Oreg. 181 102 3,058 3,195 18 11 38 18 2 4Calif. 1,509 1,800 46,751 46,751 88 104 60 53 - -Alaska 9 10 1,564 1,255 - - 4 1 - -Hawaii 32 22 1,689 1,780 1 2 18 6 - -
Guam 2 8 - 186 - - N N - -P.R. 503 533 1,595 1,348 - - - - - -V.I. 57 2 30 81 - - - - - -Amer. Samoa U U U U U U U U U UC.N.M.I. 2 U 90 U - U - U - U
Shiga Toxin Positive,AIDS Chlamydia† Cryptosporidiosis O157:H7 Serogroup non-O157
Cum. Cum. Cum. Cum. Cum. Cum. Cum. Cum. Cum. Cum.Reporting Area 2002§ 2001 2002 2001 2002 2001 2002 2001 2002 2001
Escherichia coli

Vol. 51 / No. 24 MMWR 533
N: Not notifiable. U: Unavailable. - : No reported cases.* Incidence data for reporting year 2001 and 2002 are provisional and cumulative (year-to-date).
UNITED STATES 10 4 6,077 140,041 155,911 784 776 11 13
NEW ENGLAND - 1 628 3,408 2,705 56 47 - 1Maine - - 69 45 63 1 1 - -N.H. - - 22 58 61 4 - - -Vt. - 1 49 44 39 3 2 - -Mass. - - 297 1,550 1,174 26 28 - 1R.I. - - 52 431 326 9 2 - -Conn. - - 139 1,280 1,042 13 14 - -
MID. ATLANTIC - - 1,359 15,541 16,701 142 108 2 3Upstate N.Y. - - 471 3,747 3,529 65 32 2 -N.Y. City - - 547 5,496 5,667 32 30 - -N.J. - - 121 2,327 2,050 31 25 - -Pa. - - 220 3,971 5,455 14 21 - 3
E.N. CENTRAL 4 2 1,128 24,782 32,938 127 134 2 1Ohio 4 2 358 5,300 8,948 48 41 - 1Ind. - - - 3,255 3,003 28 22 1 -Ill. - - 253 7,941 10,303 36 49 - -Mich. - - 348 6,498 8,088 9 8 1 -Wis. - - 169 1,788 2,596 6 14 - -
W.N. CENTRAL - - 731 6,725 7,278 26 32 - 1Minn. - - 266 1,265 1,149 17 15 - -Iowa - - 102 170 529 1 - - -Mo. - - 203 3,704 3,686 6 12 - -N. Dak. - - 11 27 16 - 3 - -S. Dak. - - 28 113 132 - - - -Nebr. - - 52 137 545 - 1 - 1Kans. - - 69 1,309 1,221 2 1 - -
S. ATLANTIC - - 1,030 37,883 40,235 201 195 1 1Del. - - 19 760 729 - - - -Md. - - 42 3,722 3,992 46 48 1 -D.C. - - 19 1,256 1,352 - - - -Va. - - 91 4,774 4,000 13 16 - -W. Va. - - 16 436 278 4 5 - 1N.C. - - - 7,361 7,646 21 28 - -S.C. - - 30 3,558 5,796 11 4 - -Ga. - - 400 6,910 7,281 63 53 - -Fla. - - 413 9,106 9,161 43 41 - -
E.S. CENTRAL - 1 142 13,461 14,628 25 50 1 -Ky. - 1 - 1,572 1,571 2 2 - -Tenn. - - 65 4,221 4,429 14 23 - -Ala. - - 77 4,752 4,963 6 23 1 -Miss. - - - 2,916 3,665 3 2 - -
W.S. CENTRAL - - 59 21,279 23,769 32 28 2 1Ark. - - 56 1,501 2,175 1 - - -La. - - - 5,312 5,644 2 5 - -Okla. - - 3 2,085 2,231 27 22 - -Tex. - - - 12,381 13,719 2 1 2 1
MOUNTAIN 6 - 570 4,455 4,733 107 93 2 2Mont. - - 32 40 57 - - - -Idaho - - 31 39 35 2 1 - -Wyo. - - 10 28 29 1 - - -Colo. 6 - 187 1,474 1,429 19 26 - -N. Mex. - - 69 493 436 17 13 - -Ariz. - - 80 1,613 1,844 54 40 1 1Utah - - 103 165 61 10 5 - -Nev. - - 58 603 842 4 8 1 1
PACIFIC - - 430 12,507 12,924 68 89 1 3Wash. - - 173 1,282 1,365 2 1 1 -Oreg. - - 174 373 529 36 30 - -Calif. - - - 10,358 10,583 9 39 - 3Alaska - - 39 259 159 1 3 - -Hawaii - - 44 235 288 20 16 - -
Guam - - - - 22 - - - -P.R. - - 1 233 306 - 1 - -V.I. - - - 17 14 - - - -Amer. Samoa U U U U U U U U UC.N.M.I. - U - 7 U - U - U
TABLE II. (Continued) Provisional cases of selected notifiable diseases, United States, weeks ending June 15, 2002, and June 16, 2001(24th Week)*
Haemophilus influenzae,Invasive
Escherichia coli Age <5 YearsShiga Toxin Positive, All Ages, Serotype
Not Serogrouped Giardiasis Gonorrhea All Serotypes BCum. Cum. Cum. Cum. Cum. Cum. Cum. Cum. Cum.
Reporting Area 2002 2001 2002 2002 2001 2002 2001 2002 2001

534 MMWR June 21, 2002
N: Not notifiable. U: Unavailable. -: No reported cases.* Incidence data for reporting year 2001 and 2002 are provisional and cumulative (year-to-date).
UNITED STATES 125 134 11 14 3,865 4,085 2,875 3,115 1,395 1,905
NEW ENGLAND 6 10 - - 160 212 92 62 18 25Maine - - - - 6 5 3 5 - -N.H. - - - - 10 4 11 9 - -Vt. - - - - - 5 2 4 11 6Mass. 3 7 - - 73 77 49 11 7 19R.I. - - - - 21 8 14 10 - -Conn. 3 3 - - 50 113 13 23 - -
MID. ATLANTIC 20 17 1 2 481 529 640 608 618 520Upstate N.Y. 8 5 - 1 92 113 73 55 27 15N.Y. City 6 4 - - 205 198 364 301 - -N.J. 4 2 - - 51 125 114 112 580 473Pa. 2 6 1 1 133 93 89 140 11 32
E.N. CENTRAL 17 25 - 1 518 492 378 371 52 101Ohio 5 6 - - 163 111 45 58 5 5Ind. 6 4 - 1 27 38 16 15 - 1Ill. 5 10 - - 152 148 33 49 7 8Mich. - - - - 116 156 284 228 40 87Wis. 1 5 - - 60 39 - 21 - -
W.N. CENTRAL 2 1 3 2 164 175 98 99 428 605Minn. 2 1 1 - 23 14 7 10 - 1Iowa - - - - 41 18 10 10 1 -Mo. - - 2 2 41 37 57 58 419 599N. Dak. - - - - 1 1 1 - - -S. Dak. - - - - 3 1 - 1 - -Nebr. - - - - 5 22 14 11 6 2Kans. - - - - 50 82 9 9 2 3
S. ATLANTIC 29 27 1 4 1,156 724 727 552 76 28Del. - - - - 8 4 7 10 3 2Md. 1 4 - - 136 104 62 61 9 3D.C. - - - - 44 21 8 7 - -Va. 2 4 - - 41 62 102 62 1 -W. Va. - - 1 - 10 6 13 14 1 6N.C. 3 1 - 4 122 55 106 98 14 8S.C. 4 1 - - 42 27 39 10 4 3Ga. 13 13 - - 281 393 235 178 17 -Fla. 6 4 - - 472 52 155 112 27 6
E.S. CENTRAL 7 10 - 2 134 165 161 199 87 119Ky. - - - 1 31 33 23 24 2 5Tenn. 5 5 - - 55 69 70 91 17 31Ala. 2 4 - 1 23 52 35 44 3 2Miss. - 1 - - 25 11 33 40 65 81
W.S. CENTRAL 6 4 - - 56 482 174 398 12 411Ark. - - - - 22 29 53 49 1 4La. 1 - - - 11 53 12 62 11 98Okla. 5 4 - - 22 78 1 48 - 3Tex. - - - - 1 322 108 239 - 306
MOUNTAIN 24 12 5 1 309 364 226 234 40 30Mont. - - - - 9 5 3 2 - -Idaho 1 - - - 20 34 3 7 - 1Wyo. - - - - 2 2 9 - 5 4Colo. 2 - - - 50 35 45 53 18 5N. Mex. 4 6 1 1 8 14 39 63 - 10Ariz. 12 4 3 - 164 191 84 71 3 6Utah 4 2 - - 30 37 18 15 2 1Nev. 1 - 1 - 26 46 25 23 12 3
PACIFIC 14 28 1 2 887 942 379 592 64 66Wash. 1 - - 1 86 46 30 49 12 15Oreg. 4 5 - - 43 62 72 74 11 10Calif. 6 21 1 1 750 813 271 455 41 41Alaska 1 1 - - 7 12 3 4 - -Hawaii 2 1 - - 1 9 3 10 - -
Guam - - - - - 1 - - - -P.R. - 1 - - 47 83 31 116 - 1V.I. - - - - - - - - - -Amer. Samoa U U U U U U U U U UC.N.M.I. - U - U - U 26 U - U
TABLE II. (Continued) Provisional cases of selected notifiable diseases, United States, weeks ending June 15, 2002, and June 16, 2001(24th Week)*
Haemophilus influenzae, Invasive
Age <5 Years Hepatitis (Viral, Acute), By Type
Non-Serotype B Unknown Serotype A B C; Non-A, Non-BCum. Cum. Cum. Cum. Cum. Cum. Cum. Cum. Cum. Cum.
Reporting Area 2002 2001 2002 2001 2002 2001 2002 2001 2002 2001

Vol. 51 / No. 24 MMWR 535
N: Not notifiable. U: Unavailable. -: No reported cases.* Incidence data for reporting year 2001 and 2002 are provisional and cumulative (year-to-date).† Of nine cases reported, three were indigenous and six were imported from another country.§ Of 74 cases reported, 34 were indigenous and 40 were imported from another country.
UNITED STATES 292 371 173 220 2,190 2,711 469 556 9† 74§
NEW ENGLAND 14 16 20 23 121 618 28 38 - 5Maine 2 1 2 - - - 1 3 - -N.H. 2 3 2 - 26 12 5 2 - -Vt. 1 4 - - 3 3 1 - - 1Mass. 5 3 13 13 70 272 10 17 - 3R.I. - 1 1 1 22 47 2 3 - -Conn. 4 4 2 9 - 284 9 13 - 1
MID. ATLANTIC 66 79 30 39 1,648 1,472 103 146 5 9Upstate N.Y. 18 21 13 12 1,102 398 18 19 - 4N.Y. City 14 7 8 9 68 35 64 89 5 1N.J. 10 5 3 6 144 386 13 21 - 1Pa. 24 46 6 12 334 653 8 17 - 3
E.N. CENTRAL 75 100 22 32 25 221 56 73 - 10Ohio 35 43 9 5 22 8 11 9 - 3Ind. 6 5 3 3 3 2 1 11 - 4Ill. - 13 1 9 - 15 15 29 - 3Mich. 26 20 7 13 - 1 22 16 - -Wis. 8 19 2 2 U 195 7 8 - -
W.N. CENTRAL 21 25 8 6 45 53 35 16 - 4Minn. 2 6 - - 25 30 12 6 - 2Iowa 4 5 1 - 6 9 2 1 - -Mo. 10 8 5 3 12 11 9 5 - 2N. Dak. - 1 1 - - - 1 - - -S. Dak. 1 1 - - - - - - - -Nebr. 4 3 - 1 - 1 5 2 - -Kans. - 1 1 2 2 2 6 2 - -
S. ATLANTIC 63 49 26 27 270 242 139 110 1 4Del. 5 - - 1 30 30 1 1 - -Md. 7 12 4 2 147 150 36 44 - 3D.C. 2 2 - - 9 7 5 4 - -Va. 6 7 2 5 17 45 11 24 - -W. Va. N N - 4 3 1 2 1 - -N.C. 5 5 3 - 38 6 8 2 - -S.C. 5 1 3 2 3 2 4 4 - -Ga. 8 7 8 7 1 - 50 19 - 1Fla. 25 15 6 6 22 1 22 11 1 -
E.S. CENTRAL 8 31 8 8 15 14 8 11 - 2Ky. 5 7 2 2 7 5 2 2 - 2Tenn. - 12 3 3 3 5 2 5 - -Ala. 3 8 3 3 5 2 3 3 - -Miss. - 4 - - - 2 1 1 - -
W.S. CENTRAL 3 15 3 19 2 48 3 39 - 1Ark. - - - 1 - - 1 3 - -La. 1 6 - - 1 2 2 2 - -Okla. 2 3 3 1 - - - 1 - -Tex. - 6 - 17 1 46 - 33 - 1
MOUNTAIN 19 24 17 20 11 4 18 23 - 1Mont. 1 - - - - - - 2 - -Idaho - 1 2 1 2 2 - 2 - 1Wyo. 3 2 - 1 - 1 - - - -Colo. 4 9 2 5 3 - 8 12 - -N. Mex. 1 1 2 3 1 - 1 1 - -Ariz. 3 7 8 4 1 - 3 2 - -Utah 6 2 3 1 3 - 3 2 - -Nev. 1 2 - 5 1 1 3 2 - -
PACIFIC 23 32 39 46 53 39 79 100 3 38Wash. 3 6 3 2 - 1 9 3 - 15Oreg. N N 2 4 4 4 3 8 - 2Calif. 20 21 30 39 48 34 59 82 3 15Alaska - 1 - - 1 - 2 1 - -Hawaii - 4 4 1 N N 6 6 - 6
Guam - - - - - - - - - -P.R. - 2 1 - N N - 3 - -V.I. - - - - - - - - - -Amer. Samoa U U U U U U U U U UC.N.M.I. - U - U - U - U - U
TABLE II. (Continued) Provisional cases of selected notifiable diseases, United States, weeks ending June 15, 2002, and June 16, 2001(24th Week)*
MeaslesLegionellosis Listeriosis Lyme Disease Malaria Total
Cum. Cum. Cum. Cum. Cum. Cum. Cum. Cum. Cum. Cum.Reporting Area 2002 2001 2002 2001 2002 2001 2002 2001 2002 2001

536 MMWR June 21, 2002
N: Not notifiable. U: Unavailable. - : No reported cases.* Incidence data for reporting year 2001 and 2002 are provisional and cumulative (year-to-date).
UNITED STATES 836 1,389 134 107 2,610 2,338 2,329 3,173
NEW ENGLAND 56 67 5 - 276 215 342 283Maine 4 1 - - 3 - 22 34N.H. 5 8 3 - 5 8 11 6Vt. 4 4 - - 49 23 58 35Mass. 28 39 2 - 213 171 113 96R.I. 4 2 - - 1 1 25 28Conn. 11 13 - - 5 12 113 84
MID. ATLANTIC 79 146 12 9 129 166 414 483Upstate N.Y. 28 42 2 2 90 96 245 303N.Y. City 10 25 1 4 7 26 10 12N.J. 11 25 1 - 3 8 61 70Pa. 30 54 8 3 29 36 98 98
E.N. CENTRAL 127 197 15 15 315 265 27 29Ohio 48 57 3 1 182 143 5 8Ind. 23 22 1 1 22 20 7 1Ill. 20 45 6 10 48 29 6 3Mich. 24 43 5 2 33 25 9 11Wis. 12 30 - 1 30 48 - 6
W.N. CENTRAL 79 92 10 5 247 103 177 162Minn. 20 13 2 2 70 31 11 18Iowa 11 20 - - 95 11 27 32Mo. 31 32 3 - 51 42 18 13N. Dak. - 5 1 - - - 11 21S. Dak. 2 4 - - 5 3 20 24Nebr. 10 9 - 1 4 2 - 1Kans. 5 9 4 2 22 14 90 53
S. ATLANTIC 142 200 17 17 184 108 1,039 1,106Del. 6 - - - 2 - 9 22Md. 4 27 3 4 18 16 138 230D.C. - - - - 1 1 - -Va. 21 25 3 2 83 12 237 204W. Va. - 6 - - 6 1 79 60N.C. 16 48 1 1 19 39 301 278S.C. 14 19 2 1 26 18 36 57Ga. 21 31 4 7 14 12 132 163Fla. 60 44 4 2 15 9 107 92
E.S. CENTRAL 50 87 9 3 67 42 76 132Ky. 8 15 4 1 22 12 13 10Tenn. 20 33 2 - 35 17 46 106Ala. 15 29 2 - 10 10 17 16Miss. 7 10 1 2 - 3 - -
W.S. CENTRAL 48 221 10 9 572 209 49 676Ark. 20 12 - - 272 8 - -La. 13 55 1 2 2 4 - 4Okla. 14 18 - - 27 3 49 39Tex. 1 136 9 7 271 194 - 633
MOUNTAIN 57 68 7 8 377 862 87 118Mont. 2 2 - - 2 6 4 16Idaho 3 7 1 - 42 162 - 1Wyo. - 4 - 1 6 - 12 20Colo. 18 25 1 2 158 162 - -N. Mex. 1 8 - 2 44 45 4 4Ariz. 18 11 - 1 89 456 66 75Utah 4 7 4 1 26 22 - 1Nev. 11 4 1 1 10 9 1 1
PACIFIC 198 311 49 41 443 368 118 184Wash. 38 39 - 1 174 53 - -Oreg. 31 37 N N 64 19 - -Calif. 123 225 42 23 196 278 94 148Alaska 1 2 - 1 2 1 24 36Hawaii 5 8 7 16 7 17 - -
Guam - - - - - - - -P.R. 2 4 - - 1 - 39 54V.I. - - - - - - - -Amer. Samoa U U U U U U U UC.N.M.I. - U - U - U - U
TABLE II. (Continued) Provisional cases of selected notifiable diseases, United States, weeks ending June 15, 2002, and June 16, 2001(24th Week)*
MeningococcalDisease Mumps Pertussis Rabies, Animal
Cum. Cum. Cum. Cum. Cum. Cum. Cum. Cum.Reporting Area 2002 2001 2002 2001 2002 2001 2002 2001

Vol. 51 / No. 24 MMWR 537
N: Not notifiable. U: Unavailable. - : No reported cases.* Incidence data for reporting year 2001 and 2002 are provisional and cumulative (year-to-date).
UNITED STATES 217 117 6 11 2 - 11,978 13,013
NEW ENGLAND - - - - - - 728 945Maine - - - - - - 64 96N.H. - - - - - - 43 68Vt. - - - - - - 29 35Mass. - - - - - - 412 524R.I. - - - - - - 36 49Conn. - - - - - - 144 173
MID. ATLANTIC 12 6 2 4 - - 1,502 1,795Upstate N.Y. 2 - 1 1 - - 481 404N.Y. City 2 1 - 2 - - 536 483N.J. 1 2 1 1 - - 184 407Pa. 7 3 - - - - 301 501
E.N. CENTRAL 2 7 - 2 - - 1,993 1,820Ohio 2 1 - - - - 571 575Ind. - - - - - - 164 164Ill. - 6 - 2 - - 587 497Mich. - - - - - - 353 305Wis. - - - - - - 318 279
W.N. CENTRAL 24 24 - 3 - - 924 796Minn. - - - - - - 204 251Iowa 1 1 - 1 - - 145 126Mo. 22 21 - 1 - - 362 188N. Dak. - - - - - - 22 15S. Dak. - 2 - - - - 29 49Nebr. - - - - - - 51 61Kans. 1 - - 1 - - 111 106
S. ATLANTIC 142 41 2 1 - - 2,899 2,769Del. 1 - - - - - 15 30Md. 18 7 1 - - - 293 280D.C. - - - - - - 31 32Va. 4 3 - - - - 330 443W. Va. 1 - - - - - 41 41N.C. 75 16 - - - - 443 421S.C. 28 7 - - - - 189 297Ga. 14 5 - - - - 695 480Fla. 1 3 1 1 - - 862 745
E.S. CENTRAL 21 27 - - 1 - 752 717Ky. 1 1 - - - - 123 132Tenn. 15 22 - - 1 - 201 189Ala. 5 1 - - - - 229 215Miss. - 3 - - - - 199 181
W.S. CENTRAL 13 7 1 - - - 413 1,395Ark. - 4 - - - - 205 174La. - 1 - - - - 75 264Okla. 13 2 - - - - 131 106Tex. - - 1 - - - 2 851
MOUNTAIN 3 5 - - - - 887 843Mont. 1 1 - - - - 42 30Idaho - 1 - - - - 56 47Wyo. 1 1 - - - - 22 27Colo. - - - - - - 224 234N. Mex. - - - - - - 116 106Ariz. - - - - - - 273 232Utah - 2 - - - - 63 89Nev. 1 - - - - - 91 78
PACIFIC - - 1 1 1 - 1,880 1,933Wash. - - - - - - 179 188Oreg. - - - - - - 167 117Calif. - - 1 - - - 1,394 1,455Alaska - - - - - - 32 22Hawaii - - - 1 1 - 108 151
Guam - - - - - - - 4P.R. - - - 3 - - 69 393V.I. - - - - - - - -Amer. Samoa U U U U U U U UC.N.M.I. - U - U - U 17 U
TABLE II. (Continued) Provisional cases of selected notifiable diseases, United States, weeks ending June 15, 2002, and June 16, 2001(24th Week)*
RubellaRocky Mountain CongenitalSpotted Fever Rubella Rubella Salmonellosis
Cum. Cum. Cum. Cum. Cum. Cum. Cum. Cum.Reporting Area 2002 2001 2002 2001 2002 2001 2002 2001

538 MMWR June 21, 2002
N: Not notifiable. U: Unavailable. - : No reported cases.* Incidence data for reporting year 2001 and 2002 are provisional and cumulative (year-to-date).
UNITED STATES 5,697 6,424 2,168 2,046 1,277 1,693 115 292
NEW ENGLAND 105 111 107 149 6 80 11 67Maine 3 4 14 10 - - - -N.H. 4 2 23 9 - - - -Vt. - 3 9 9 3 7 1 -Mass. 74 75 53 46 - - 10 40R.I. 5 7 8 6 3 - - 1Conn. 19 20 - 69 - 73 - 26
MID. ATLANTIC 321 720 387 348 71 99 40 65Upstate N.Y. 70 273 192 151 64 97 40 65N.Y. City 179 196 95 108 U U - -N.J. 24 127 71 59 - - - -Pa. 48 124 29 30 7 2 - -
E.N. CENTRAL 595 946 319 489 111 117 32 74Ohio 315 364 130 125 4 - - -Ind. 35 117 20 39 102 117 24 36Ill. 141 229 4 163 2 - - 26Mich. 63 140 165 119 3 - 8 12Wis. 41 96 - 43 - - - -
W.N. CENTRAL 528 630 149 209 228 81 25 25Minn. 103 220 74 79 135 40 25 24Iowa 45 133 - - - - - -Mo. 61 120 32 51 5 9 - -N. Dak. 15 13 - 7 1 2 - 1S. Dak. 147 67 9 7 1 3 - -Nebr. 104 36 13 23 23 7 - -Kans. 53 41 21 42 63 20 - -
S. ATLANTIC 2,247 891 410 365 730 893 6 4Del. 6 4 1 2 3 2 - -Md. 375 49 62 26 - - - -D.C. 25 24 5 3 33 3 1 3Va. 411 71 43 54 - - - -W. Va. 2 4 9 13 34 32 - 1N.C. 132 170 80 85 - - - -S.C. 42 102 25 6 120 189 5 -Ga. 777 120 119 117 240 263 - -Fla. 477 347 66 59 300 404 - -
E.S. CENTRAL 543 637 60 45 84 164 - -Ky. 60 236 8 18 10 18 - -Tenn. 26 43 52 27 74 145 - -Ala. 263 122 - - - 1 - -Miss. 194 236 - - - - - -
W.S. CENTRAL 301 1,232 30 195 22 229 1 57Ark. 89 292 4 - 5 12 - -La. 53 130 - - 17 187 1 57Okla. 158 18 25 26 - 30 - -Tex. 1 792 1 169 - - - -
MOUNTAIN 259 350 384 220 25 29 - -Mont. 1 - - - - - - -Idaho 2 16 5 3 - - - -Wyo. 3 2 6 5 8 5 - -Colo. 51 70 138 87 - - - -N. Mex. 49 53 62 46 17 22 - -Ariz. 123 159 173 76 - - - -Utah 15 23 - 3 - - - -Nev. 15 27 - - - 2 - -
PACIFIC 798 907 322 26 - 1 - -Wash. 52 75 36 - - - - -Oreg. 40 49 - - - - - -Calif. 682 759 252 - - - - -Alaska 2 3 - - - - - -Hawaii 22 21 34 26 - 1 - -
Guam - 25 - 1 - - - -P.R. 1 10 - - - - - -V.I. - - - - - - - -Amer. Samoa U U U U - - U UC.N.M.I. 7 U - U - - - U
TABLE II. (Continued) Provisional cases of selected notifiable diseases, United States, weeks ending June 15, 2002, and June 16, 2001(24th Week)*
Streptococcal Disease, Streptococcus pneumoniae, Streptococcus pneumoniae,Shigellosis Invasive, Group A Drug Resistant, Invasive Invasive (<5 Years)
Cum. Cum. Cum. Cum. Cum. Cum. Cum. Cum.Reporting Area 2002 2001 2002 2001 2002 2001 2002 2001

Vol. 51 / No. 24 MMWR 539
N: Not notifiable. U: Unavailable. - : No reported cases.* Incidence data for reporting year 2001 and 2002 are provisional and cumulative (year-to-date).
UNITED STATES 2,725 2,586 133 250 4,939 5,659 107 137
NEW ENGLAND 50 20 - 3 150 209 10 7Maine - - - - 5 7 - 1N.H. 1 1 - - 7 10 - 1Vt. 1 2 - - - 4 - -Mass. 36 10 - 2 89 106 8 4R.I. 2 2 - - 15 30 - -Conn. 10 5 - 1 34 52 2 1
MID. ATLANTIC 307 218 21 35 946 986 27 41Upstate N.Y. 19 5 2 1 133 141 4 9N.Y. City 188 125 10 18 494 503 13 14N.J. 50 40 9 16 224 224 9 17Pa. 50 48 - - 95 118 1 1
E.N. CENTRAL 485 442 23 39 496 583 12 19Ohio 69 43 - 2 82 111 4 2Ind. 33 80 - 5 49 40 1 2Ill. 122 138 18 25 248 305 1 9Mich. 253 165 5 4 111 94 3 3Wis. 8 16 - 3 6 33 3 3
W.N. CENTRAL 44 33 - 5 226 233 4 6Minn. 17 17 - 1 99 99 3 2Iowa - 1 - - 14 18 - -Mo. 13 7 - 3 67 56 1 4N. Dak. - - - - - 3 - -S. Dak. - - - - 9 6 - -Nebr. 4 - - - 9 17 - -Kans. 10 8 - 1 28 34 - -
S. ATLANTIC 684 933 25 65 969 1,051 12 19Del. 8 7 - - 7 9 - -Md. 75 119 2 2 104 91 2 5D.C. 41 14 1 1 - 34 - -Va. 33 60 1 3 75 106 - 5W. Va. - - - - 10 15 - -N.C. 147 217 9 8 132 144 - 1S.C. 57 134 3 18 68 92 - -Ga. 100 145 1 12 167 188 6 6Fla. 223 237 8 21 406 372 4 2
E.S. CENTRAL 259 273 8 21 320 361 2 -Ky. 41 22 - - 57 43 2 -Tenn. 103 151 3 13 110 131 - -Ala. 87 48 4 4 107 128 - -Miss. 28 52 1 4 46 59 - -
W.S. CENTRAL 374 324 39 42 689 878 - 9Ark. 12 20 1 4 54 63 - -La. 57 62 - - - - - -Okla. 30 34 2 3 61 65 - -Tex. 275 208 36 35 574 750 - 9
MOUNTAIN 144 91 8 12 130 220 8 5Mont. - - - - 4 - - 1Idaho 7 - 1 - - 3 - -Wyo. - - - - 2 1 - -Colo. 10 14 1 - 21 58 4 -N. Mex. 21 9 - - 8 32 - -Ariz. 97 59 6 12 80 82 - 1Utah 6 6 - - 13 8 3 -Nev. 3 3 - - 2 36 1 3
PACIFIC 378 252 9 28 1,013 1,138 32 31Wash. 22 30 1 - 106 99 3 2Oreg. 5 7 - - 43 47 2 3Calif. 346 209 8 28 772 895 27 24Alaska - - - - 26 21 - -Hawaii 5 6 - - 66 76 - 2
Guam - 2 - - - 33 - 1P.R. 109 118 10 2 8 47 - -V.I. - - - - - - - -Amer. Samoa U U U U U U U UC.N.M.I. 13 U - U 26 U - U
TABLE II. (Continued) Provisional cases of selected notifiable diseases, United States, weeks ending June 15, 2002, and June 16, 2001(24th Week)*
Syphilis TyphoidPrimary & Secondary Congenital Tuberculosis FeverCum. Cum. Cum. Cum. Cum. Cum. Cum. Cum.
Reporting Area 2002 2001 2002 2001 2002 2001 2002 2001

540 MMWR June 21, 2002
NEW ENGLAND 466 316 97 32 8 13 50Boston, Mass. 143 86 35 14 1 7 13Bridgeport, Conn. 30 23 4 3 - - 3Cambridge, Mass. 19 14 4 1 - - -Fall River, Mass. 31 28 2 1 - - 8Hartford, Conn. 50 35 7 4 1 3 5Lowell, Mass. 19 12 6 1 - - 1Lynn, Mass. 8 5 3 - - - 2New Bedford, Mass. 23 16 4 1 - 2 -New Haven, Conn. 30 21 6 2 1 - 5Providence, R.I. U U U U U U USomerville, Mass. 2 2 - - - - -Springfield, Mass. 33 24 7 1 1 - 4Waterbury, Conn. 23 18 3 1 1 - 2Worcester, Mass. 55 32 16 3 3 1 7
MID. ATLANTIC 2,192 1,502 422 185 41 40 121Albany, N.Y. 38 25 6 2 3 2 3Allentown, Pa. 20 16 3 1 - - 1Buffalo, N.Y. 70 58 6 4 1 1 12Camden, N.J. 34 18 10 5 - 1 2Elizabeth, N.J. 24 17 3 3 - 1 -Erie, Pa. 49 41 5 3 - - 4Jersey City, N.J. 39 27 6 4 1 1 -New York City, N.Y. 1,049 718 216 89 15 11 42Newark, N.J. 63 33 13 10 - 7 5Paterson, N.J. 19 12 2 3 - 2 1Philadelphia, Pa. 393 250 75 43 14 9 31Pittsburgh, Pa.§ 33 20 11 1 1 - 1Reading, Pa. 17 14 1 - - 2 1Rochester, N.Y. 122 93 17 9 2 1 2Schenectady, N.Y. 20 17 3 - - - 2Scranton, Pa. 33 21 9 1 2 - 3Syracuse, N.Y. 129 91 27 7 2 2 10Trenton, N.J. 20 13 7 - - - 1Utica, N.Y. 20 18 2 - - - -Yonkers, N.Y. U U U U U U U
E.N. CENTRAL 1,622 1,130 313 94 30 54 104Akron, Ohio 55 41 6 4 - 4 2Canton, Ohio 37 27 7 3 - - 8Chicago, Ill. U U U U U U UCincinnati, Ohio 83 58 13 2 1 8 6Cleveland, Ohio 115 67 31 11 1 5 3Columbus, Ohio 182 121 44 7 5 5 10Dayton, Ohio 137 102 26 6 1 2 11Detroit, Mich. 184 116 46 10 4 8 16Evansville, Ind. 36 30 5 - - 1 2Fort Wayne, Ind. 51 39 7 2 2 1 4Gary, Ind. 24 12 7 4 1 - -Grand Rapids, Mich. 64 45 7 6 3 3 9Indianapolis, Ind. 184 134 34 7 2 7 11Lansing, Mich. 61 46 10 1 1 3 3Milwaukee, Wis. 117 76 26 10 3 2 7Peoria, Ill. 41 30 7 3 - 1 1Rockford, Ill. 53 39 9 3 1 1 3South Bend, Ind. 59 50 4 4 1 - 2Toledo, Ohio 78 54 10 8 3 3 5Youngstown, Ohio 61 43 14 3 1 - 1
W.N. CENTRAL 570 399 100 48 14 9 46Des Moines, Iowa 48 40 6 2 - - 7Duluth, Minn. 40 30 7 2 - 1 5Kansas City, Kans. 27 17 6 - 4 - 2Kansas City, Mo. 88 61 16 8 3 - 10Lincoln, Nebr. 29 14 11 2 2 - -Minneapolis, Minn. 56 42 6 6 1 1 5Omaha, Nebr. 67 55 9 1 1 1 10St. Louis, Mo. 86 49 18 13 2 4 -St. Paul, Minn. 52 40 7 3 1 1 2Wichita, Kans. 77 51 14 11 - 1 5
S. ATLANTIC 1,120 685 260 119 31 25 62Atlanta, Ga. 179 101 46 22 6 4 9Baltimore, Md. 204 110 51 32 4 7 16Charlotte, N.C. 115 80 19 10 4 2 8Jacksonville, Fla. U U U U U U UMiami, Fla. 102 65 21 8 4 4 4Norfolk, Va. 50 32 8 7 2 1 4Richmond, Va. 45 28 13 3 1 - 1Savannah, Ga. 68 41 14 8 2 3 5St. Petersburg, Fla. 85 63 16 5 1 - 3Tampa, Fla. 165 109 34 14 6 2 12Washington, D.C. 101 54 34 10 1 2 -Wilmington, Del. 6 2 4 - - - -
E.S. CENTRAL 698 470 149 52 13 14 45Birmingham, Ala. 200 139 47 14 - - 13Chattanooga, Tenn. 71 49 13 4 1 4 7Knoxville, Tenn. 100 71 22 5 1 1 2Lexington, Ky. 70 44 19 4 - 3 3Memphis, Tenn. U U U U U U UMobile, Ala. 66 40 16 7 2 1 1Montgomery, Ala. 63 42 10 4 4 3 7Nashville, Tenn. 128 85 22 14 5 2 12
W.S. CENTRAL 1,557 988 347 130 50 42 101Austin, Tex. 82 51 22 7 2 - 3Baton Rouge, La. 67 39 17 7 - 4 2Corpus Christi, Tex. 52 35 14 2 - 1 4Dallas, Tex. 215 118 53 25 9 10 11El Paso, Tex. 85 54 14 13 4 - 2Ft. Worth, Tex. 118 63 27 11 8 9 8Houston, Tex. 390 261 78 33 10 8 31Little Rock, Ark. 57 32 15 6 1 3 3New Orleans, La. 37 26 7 - 3 1 -San Antonio, Tex. 218 145 46 17 9 1 15Shreveport, La. 94 60 22 6 2 4 8Tulsa, Okla. 142 104 32 3 2 1 14
MOUNTAIN 841 567 176 71 14 13 53Albuquerque, N.M. 130 81 35 11 3 - 9Boise, Idaho 39 25 8 3 1 2 1Colo. Springs, Colo. 53 34 12 6 - 1 -Denver, Colo. 104 64 23 11 2 4 8Las Vegas, Nev. 226 147 57 18 3 1 19Ogden, Utah 21 17 3 1 - - 2Phoenix, Ariz. U U U U U U UPueblo, Colo. 25 19 3 2 1 - 1Salt Lake City, Utah 97 76 12 6 2 1 11Tucson, Ariz. 146 104 23 13 2 4 2
PACIFIC 1,244 886 223 78 28 29 90Berkeley, Calif. 14 9 5 - - - 1Fresno, Calif. 108 72 22 8 4 2 7Glendale, Calif. U U U U U U UHonolulu, Hawaii 84 66 13 3 1 1 3Long Beach, Calif. 67 50 10 4 2 1 10Los Angeles, Calif. U U U U U U UPasadena, Calif. 21 17 2 2 - - 3Portland, Oreg. 108 85 12 6 2 3 6Sacramento, Calif. 218 152 45 13 7 1 18San Diego, Calif. 151 111 26 5 2 7 15San Francisco, Calif. U U U U U U USan Jose, Calif. 181 133 29 9 3 7 10Santa Cruz, Calif. 30 20 7 2 1 - 2Seattle, Wash. 114 68 23 15 3 5 11Spokane, Wash. 50 35 8 6 - 1 2Tacoma, Wash. 98 68 21 5 3 1 2
TOTAL 10,310¶ 6,943 2,087 809 229 239 672
U: Unavailable. -:No reported cases.* Mortality data in this table are voluntarily reported from 122 cities in the United States, most of which have populations of >100,000. A death is reported by the place of its
occurrence and by the week that the death certificate was filed. Fetal deaths are not included.† Pneumonia and influenza.§ Because of changes in reporting methods in this Pennsylvania city, these numbers are partial counts for the current week. Complete counts will be available in 4 to 6 weeks.¶ Total includes unknown ages.
TABLE III. Deaths in 122 U.S. cities,* week ending June 15, 2002 (24th Week)All Causes, By Age (Years) All Causes, By Age (Years)
All P&I† All P&I†
Reporting Area Ages >65 45-64 25-44 1-24 <1 Total Reporting Area Ages >65 45-64 25-44 1-24 <1 Total

Vol. 51 / No. 24 MMWR 541

542 MMWR June 21, 2002

Vol. 51 / No. 24 MMWR 543
All MMWR references are available on the Internet at http://www.cdc.gov/mmwr. Use the search function to find specific articles.——————
Use of trade names and commercial sources is for identification only and does not imply endorsement by the U.S. Department of Healthand Human Services.
——————References to non-CDC sites on the Internet are provided as a service to MMWR readers and do not constitute or imply endorsement ofthese organizations or their programs by CDC or the U.S. Department of Health and Human Services. CDC is not responsible for thecontent of these sites. URL addresses listed in MMWR were current as of the date of publication.

MMWR
The Morbidity and Mortality Weekly Report (MMWR) Series is prepared by the Centers for Disease Control and Prevention (CDC) andis available free of charge in electronic format and on a paid subscription basis for paper copy. To receive an electronic copy each week, sendan e-mail message to [email protected]. The body content should read SUBscribe mmwr-toc. Electronic copy also is available fromCDC’s World-Wide Web server at http://www.cdc.gov/mmwr or from CDC’s file transfer protocol server at ftp://ftp.cdc.gov/pub/publications/mmwr. To subscribe for paper copy, contact Superintendent of Documents, U.S. Government Printing Office, Washington, DC 20402;telephone 202-512-1800.
Data in the weekly MMWR are provisional, based on weekly reports to CDC by state health departments. The reporting week concludesat close of business on Friday; compiled data on a national basis are officially released to the public on the following Friday. Addressinquiries about the MMWR Series, including material to be considered for publication, to Editor, MMWR Series, Mailstop C-08, CDC,1600 Clifton Rd., N.E., Atlanta, GA 30333; telephone 888-232-3228.
All material in the MMWR Series is in the public domain and may be used and reprinted without permission; citation as to source,however, is appreciated.
✩U.S. Government Printing Office: 2002-733-100/69036 Region IV
544 June 21, 2002