MORAL FIBRE - Environmental Justice Foundation
36
1 MORAL FIBRE A report produced by the Environmental Justice Foundation The Cool Option for a Heating Planet
Transcript of MORAL FIBRE - Environmental Justice Foundation

1
MORAL FIBRE
A report produced by the Environmental Justice Foundation
The Cool Option for a Heating Planet

2
The Environmental Justice Foundation (EJF) is a UK-based environmental and human rights charity registered in England and Wales (1088128). 1 Amwell StreetLondon, EC1R 1ULUnited Kingdomwww.ejfoundation.org
Comments on the report, requests for further copies or specific queries about EJF should be directed to: [email protected]
This document should be cited as: EJF (2020) Moral Fibre. The Cool Option for a Heating Planet.
This report was made possible by the generous support of Durham University Charity Fashion Show (DUCFS), the largest student-run charity event in the UK. With a strong focus on sustainability, attendees were encouraged to consider where their garments came from and how they were made. Along with a ‘Festival of Sustainability’ to spark discussion, the show also exclusively featured ethical designers. The DUCFS students, and other grassroots activists, bring an important voice to the conversation on addressing the impact of fashion on the environment. By raising awareness of sustainable fashion and holding designers to account, they are showing that individual consumer choices matter. This is vital to shifting the attitude of the fashion industry as a whole. EJF would like to sincerely thank the Durham students for their efforts in fighting for a more responsible, ethical and sustainable fashion industry.
In thanking DUCFS we in no way suggest their endorsement of the contents of this report.
OUR MISSION
EJF believes environmental security is a human right. EJF strives to: • Protect the natural environment and the people and wildlife that
depend upon it by linking environmental security, human rights and social need
• Create and implement solutions where they are needed most – training local people and communities who are directly affected to investigate, expose and combat environmental degradation and associated human rights abuses
• Provide training in the latest video technologies, research and advocacy skills to document both the problems and solutions, working through the media to create public and political platforms for constructive change
• Raise international awareness of the issues our partners are working locally to resolve
EJF’s cotton and textiles campaign: Making clothing sustainable and ethical.
Textiles are the fourth highest-pressure category for the use of primary raw materials and water, after food, housing and transport, and fifth for GHG, affecting both our natural environment and having profound implications for human rights.
Every year the fashion industry produces 8.1% of global carbon dioxide emissions; uses around 93 billion cubic metres of water, and is responsible for toxic chemical and microplastic pollution and human rights abuses.
EJF’s cotton and textiles campaign aims to combat the negative environmental and human rights impacts of production and consumption of clothing. Our work aims to create a circular textiles economy, while making our clothing environmentally sustainable and ethical.
We focus on the global impact of textiles and clothing as a major primary source of carbon emissions; on the unsustainable use of toxic pesticides; and the mismanagement of water in cotton production.
EJF exposes the environmental injustice of our demand for ‘fast fashion’ and campaigns to eradicate human rights abuses linked to the production of cotton and other raw materials in our textiles. We expose human rights abuses such as the use of forced, bonded and slave labour in the sector.
EJF highlights the extensive and high-impact advantages of moving rapidly to organic cotton production.
Special emphasis is given to the role of European countries both in contributing to abuses and in delivering solutions, and we aim to address all stakeholders, specifically including consumers, workers, businesses and governments.
For further information visit www.ejfoundation.orgAll images copyright EJF unless
stated otherwise.

Contents
Executive summar y 4
Introduction 7
Fast fashion – what’s the problem? 8
Fashion’s impact on global climate 11
Case study: Australian cotton and climate change 14
Water usage 16
Chemical clothing 18
Genetically-modif ied clothes 19
Alternative f ibres are worse than cotton 20
Case study: Pesticides in India 22
The Sensible, sustainable, circular solution 23
Case study: Organic cotton in India 26
Clothing and carbon leakage 28
3
Glossary:
Anoxia: Acute hypoxia (see below): total depletion of oxygen
Boll: Seed-bearing part of the cotton plantEutrophication: Excessive nutrients in water, usually caused
by fertilisers, which create algae blooms and deplete oxygen content within the water
Gigaton: Equivalent to a billion metric tonsGinning: The process of removing cotton seeds and
debris from the cotton lintHypoxia: Insufficient oxygen supply to tissuesLint: The raw fibre from the cotton plantPyroconvection: Strong convection which occurs within
a fire plume
Abbreviations: BCA: Border Carbon AdjustmentBt: Bacillus thuringiensis (a biological pesticide)CO2: Carbon DioxideCO2eq: Equivalent Carbon Dioxide: a measurement of
various Greenhouse Gases’ global warming potential expressed in terms of Carbon Dioxide.
EU: European UnionFAO: The United Nation’s Food & Agriculture Organization
FFDI: Forest Fire Danger IndexGHG: Greenhouse GasGM: Genetically-modifiedGOTS: Global Organic Textile StandardGWP: Global Warming PotentialHa: Hectare (10,000m²)Kg: KilogramLCA: Life-Cycle AssessmentMJ: One million JoulesMMCF: Man-made cellulosic fibresMT: Metric tonneNASA: National Aeronautics and Space Agency (USA)NCRB: National Crime Records Bureau (India)NSW: New South Wales (Australia)OCFTP: Organic Cotton Farmer Training ProgrammePET: Polyethylene terephthalate (polyester)PED: Primary Energy DemandPM2.5: Particulate Matter with a diameter of 2.5 μm
(micrometres) or lessREACH: The European Chemical Agency’s regulation
body (“Registration, Evaluation, Authorisation and Restriction of Chemicals”)
SO2: Sulphur DioxideUK: United KingdomWEF: World Economic ForumWHO: World Health Organisation

4
Executive summaryIn the last 45 years, the global production of textile fibres has almost tripled. Clothing is now produced, consumed and thrown away so fast, and in such huge quantities, that textiles and footwear are believed to be responsible for 8.1% of the world’s carbon dioxide equivalent (CO2eq) emissions.
Polyester now enjoys over half the market share of global fibre production (51.5%). The principle ingredient of polyester is petroleum oil. It requires c.342 million barrels every year to meet demand for plastic-based fibres meaning that polyester is not a sustainable clothing solution.
Cotton currently has less than a quarter of the market share of global fibre production (24.4%). In May 2020, Cotton sells on commodity markets for the same price – US$ 0.57 per pound (0.45kg) – as it did in December 1975.
Because cotton prices are depressed, farmers have had to use intensive applications of synthetic fertilisers to increase yields and maintain profitability. The global average per hectare yield has almost doubled from 411kg/ha in 1980-81 to 771 kg/ha in 2019-20, but these increases have acute environmental costs resulting from high levels in chemical inputs.
Every year on cotton plantations, synthetic fertilisers are responsible for between 3 and 4 tonnes of CO2eq emissions per hectare. It’s calculated that globally cotton cultivation accounts for 220 million tonnes of CO2eq emissions per annum. Cotton, as it’s currently farmed, seems no more sustainable than polyester.
Wholescale conversion to organic production of cotton could reduce its Global Warming Potential by up to 46%. If the improved carbon sequestration by the soil and the carbon uptake by the fibre when it is farmed organically are included in calculations, zero or negative carbon emissions can be achieved.
Organic cotton has seen its market share boom in recent years – up 56% between 2017 and 2018. Many countries have witnessed double-digit increases in production. It’s a viable alternative to conventional cotton because the knowledge, infrastructure and consumer confidence are all, already, in place. However, organic cotton production still only accounts for 0.93% of global totals.
As global heating presents an existential crisis, threatening our global environment, economy, food production, health, social cohesion and well-being, organic cotton is currently the only viable option with the potential for mass-market reach that will not exacerbate the climate emergency.
Clothing is now produced, consumed and thrown away so fast, and in such huge
quantities, that textiles and footwear are believed to be responsible for 8.1%
of the world’s CO2eq emissions.
Credit: Ryan Oriecuia (CC BY-NC 2.0)

5
Recommendations:
EU and Member States
In March 2020, the EU published its Circular Economy Action Plan in which it recognised the detrimental environmental impact of the fashion industry: “textiles are the fourth highest-pressure category for the use of primary raw materials and water, after food, housing and transport, and fifth for GHG emissions.” The plan duly called for a “comprehensive EU Strategy for Textiles”, which would boost “the EU market for sustainable and circular textiles...”1
The EU has also recognised the dilemma of “carbon leakage”, saying in its “initial roadmap” (December 2019) to the Green Deal: “As long as many international partners do not share the same ambition as the EU, there is a risk of carbon leakage, either because production is transferred from the EU to other countries with lower ambition for emission reduction, or because EU products are replaced by more carbon-intensive imports.”2 The EU has pledged to be a net-zero economy by 20503.
Recommendation:
• The EU should introduce a Border Carbon Adjustment on conventional cotton, the proceeds of which should underwrite the cost of transition to, and the certification process for, organic cotton.
Public procurement
It is estimated that €8.6 billion was spent on public sector textile and workwear procurement across Europe in 20154. Green Public Procurement (GPP) is a stated aim of the EU to drive a market for more sustainable textiles.
Recommendation:
• National governments should commit to public procurement contracts which prioritise organic cotton.
Fashion industry
Recommendation:
• The Fashion Industry Charter for Climate Action, that was launched in 2018, should publicise commitments and targets against which companies report, if net-zero emissions by 2050 are to be achieved.
• Fashion producers and retailers should commit to ambitious, time-bound targets for inclusion of alternative or new materials with “low-climate impact”5 (including organic cotton) in their supply chains.
• Companies that have committed to the 2025 Sustainable Cotton Challenge (100% sustainable cotton by 2025) should accelerate their transition from conventional cotton by prioritising organic cotton in their supply chains.
• Clothing retail outlets should offer in-store recycling points and incentivise consumer participation.
Consumers Recommendation:
• Consumers can drive rapid industry decarbonisation efforts through their purchasing decisions.
• Consumers who care about the global climate, natural environment and farming communities producing the cotton for their clothing, should support brands and retailers using organic cotton.
• Ask your favourite retail brands to accelerate their transition from carbon-intensive materials to those with a demonstrable reduced impact, including organic cotton; and to reduce their carbon emissions throughout the product supply chains.
• Reject the ‘fast fashion’ culture: buy less, and buy quality. Recycle clothes at the end of their life-cycle to reduce landfill and incineration.

6
Global fibre production has doubled in the last two decades to 107 million
tonnes in 2018 and is expected to reach 145 million tonnes by 2030.
Cotton has an enormous carbon footp
rint:
the use of fertilisers and pesticides alone are resp
onsibl
e for
over 3 metric tonnes of CO2eq per hectare of cotton pla
ntat
ion.

7
Introduction
The fashion industry is now recognised as one of the greatest polluters on the planet. It is responsible for 8.1%6 of global CO2 (and equivalent) emissions and its contribution to global heating and the climate emergency is very clear: estimates suggest that the industry pumps between 1.27 and 2.98 gigatonnes of CO2eq into the atmosphere every year – that’s comparable to the entire annual emissions of Japan or, at the higher end, of India and the UK combined.
Other estimates of the annual emissions from the production of clothing and footwear are even higher, suggesting that the fashion industry is responsible for 3.99 billion9 tonnes of CO2eq. According to that calculation, if the fashion industry were a country, it would rank third in global CO2 emissions, behind only China and the United States.
Global fibre production has doubled in the last two decades to 107 million tonnes in 2018 and is expected to reach 145 million tonnes by 2030.10 In the United States the demand for fibre is 37.6kg per capita11. This increase in production and consumption is causing large-scale environmental degradation. The quantity of polyester in our garments has doubled since 200012, meaning that now over half of all global fibre production (51.5%13) is made from petroleum oil.
The earth’s natural resources are being stripped so we can clothe ourselves. 150 million trees are felled annually to produce the wood pulp required to manufacture the cellulosic fibre viscose14. The area of land required by the fashion industry is predicted to increase by 35% by 2030, meaning that an additional 115 million hectares - an area more than three times the size of Germany - will soon be unavailable for food crops, carbon sequestration and wildlife habitats15.
Water resources, too, are being depleted. The textiles industry is responsible for 4% of global freshwater withdrawal16, using 93 billion cubic metres of water annually. It’s estimated that it takes 200 tonnes of water to produce one tonne of fabric17. In Europe (where per capita consumption of textiles is 31.21 kg), the water consumption would be 65,430 litres18. That’s the same as everyone in Europe leaving their tap running for 182 hours every year.
Water-shortages are exacerbated by contaminated effluents the textile industry produces. A fifth of all industrial water pollution is caused by the textile production19. In Cambodia, the fashion industry has caused an estimated 60% of the country’s water pollution and 34% of its chemical pollution20.
The disintegration of synthetic fibres like polyester, nylon and acrylic is responsible for between 20 and 35%21 of all microplastics in the marine environment.22 Every year half a million tonnes of plastic microfibres enter the ocean as a consequence of the laundering of textiles like nylon, acrylic and polyester.23
Whilst the fashion industry is assiduously increasing volume, it is also depressing wages. The textiles industry is closely associated with social injustice and, according to the Global Slavery Index, is the third most likely sector in the world to contain modern slavery24. In its rapacious attempts to source ever-cheaper clothing, the fashion industry creates working conditions which are exploitative, dangerous and sometimes fatal.
With a 25% share of the global fibre market, and 2.3% of the world’s available arable land, cotton is in a position either to exacerbate or remedy fashion’s environmental destruction. It enjoys an iconic reputation as a quality natural fibre. In 2018 a survey found that 83% of consumers in the United Kingdom preferred clothing made from cotton or cotton blends, with a further 80% believing that cotton was the most suitable fibre for modern fashion.25
In recent decades, however, that reputation has been sullied by replacing traditional, natural cotton with genetically-modified alternatives. This biotech cotton now accounts for roughly 74% of the global crop. Cotton’s intensive applications of agrochemicals – it uses 16.1% of global insecticide26 - also means it has caused widespread pollution to soils and waterways, creating an acute biodiversity, and human health, crisis.
A notoriously thirsty crop which grows in semi-arid areas, cotton is also responsible for a drastic reduction of water resources. It is notoriously difficult to arrive at global estimates of water consumption, but academic research has suggested that cotton alone has a water footprint of 233 billion cubic metres a year27, a figure far beyond the estimate of 93 billion cubic metres for the entire fashion industry. Cotton also has an enormous carbon footprint: the use of fertilisers and pesticides alone are responsible for over 3 metric tonnes of CO2eq per hectare of cotton plantation28. One report has suggested that global cotton production prior to ginning generates global emissions of 220 million tonnes of CO2eq, meaning that it is responsible for 0.4% of overall global emissions29. It’s little surprise that most people see cotton as part of the problem, not the solution. But there is a way of growing this vital fibre, using organic production techniques, which reduces its global warming potential by 46%, that reduces its bluewater footprint by 91%, and its primary energy demand by 62%30. The annual savings of 96.2million tonnes of CO2eq offered by this sustainable cultivation is the equivalent of driving an average car around the world 14,112 times31.
Organic cotton isn’t only the answer to fashion’s environmental degradation, but also its social injustices. Its supply chains are short, transparent and supportive instead of long, opaque and exploitative. It eliminates the need for toxic chemical pesticides that have led to vast numbers of human poisonings and deaths, alongside the negative environmental consequences32. Because there are already an estimated 100 million family units involved in cotton farming throughout the world33, organic cotton can be scaled up faster than any other natural fibre. It’s a transition which wouldn’t require redundancies, but which could safeguard, and even enrich, both farmers’ lives and our planetary home.

8
Clothes used to be an essential, simple means to protect ourselves from the cold, to cover our nudity and, occasionally, display our participation in personal, tribal or national celebrations. Until the 1940s, garments were made entirely from natural resources: cotton, wool, silk, hemp, jute (hessian), linen and leather. Those materials were the product of long-established agricultural traditions which employed large sectors of the local population. Garments were repeatedly repaired and often lasted a lifetime, even being passed down through generations.
Now, however, clothing has become the opposite. Rather than lasting for decades, garments often come apart after a few outings. Because they’re often priced as rags, made on the other side of the world by people we never see, clothes are sometimes considered by consumers to be single-use. In 2016, British consumers sent around £140 million worth of garments to landfill.34
Clothing is no longer essential but excessive: since 1975, the global production of textile fibres has almost tripled. Between 2000 and 2015 clothing production approximately doubled from over 50 billion to 100 billion pieces,35 and it’s predicted that figure could triple by 205036.
The huge rise in output is not explained by population increases. Textiles – not just clothing, but also fabrics like curtains, cushions etc. – now offer a daunting array of cuts and colours so that consumers have an unprecedented level of choice, alongside the perception - pushed by industry - that regular change and new products are desirable and affordable. Such fashion choices, which
used to be the reserve of a relatively small number of wealthy consumers, is now common across all developed and many developing economies.
Fashion has been democratised because clothes are now available at pocket-money prices. Between 1996 and 2018, there was a 30% drop, relative to inflation, in the price of clothing within the European Union.37 Although consumers are purchasing more clothing, they’re spending less money in doing so.
Prices have plummeted not just because of the ample supply, but because textile retailers have realised that high quantity, low quality clothing is better for business. It’s preferable to have small margins on huge volumes than vice versa. The UK fashion industry enjoyed a growth rate of 5.4% in 2017, and is now worth an estimated £32 billion to the UK economy38. Consultants McKinsey have reported that the global apparel, fashion and luxury industry outperformed all other sectors between 2003-2013, “outstripping even high-growth sectors like technology and telecommunications.”39
That extraordinary profitability is predicated on sourcing raw materials as cheaply as possible, regardless of the environmental or human consequences. Because companies chase the cheapest needle to sew their clothes, they invariably outsource to areas of the globe where labour costs are lowest and where environmental and labor regulations may be lax or unenforced. People who pay the price for our cheap apparel are those working in factories or in the fields outside the EU.
Between 2000 and 2015 clothing production approximately doubled from over 50 billion
to 100 billion pieces, and it’s predicted that figure could triple by 2050.
Fast fashion – what’s the problem?
Public Domain

9
In many wealthy economies consumers now have the opportunity and, arguably, the appetite to reinvent their fashion identity increasingly frequently, purchasing new clothing while discarding garments that may be hardly worn. The fashion and apparel industry has all too often preyed on this new consumerism, encouraging it further to grow profits. Aggressive advertising, combined with the access to previously unknown highly detailed data sets and the opportunity to buy from your bedroom without even visiting the high-street has fuelled a consumer fashion binge never seen before in history.
In the first half of 2019, fast fashion brands accounted for 66% of all online clothing sales. The sector experienced growth of 21% over the last three years.40 Consumers increasingly buy on impulse and growing volumes of clothing remain unused in full wardrobes. The average number of times clothing is worn before it is discarded has decreased 36% compared to 15 years ago.41 The industry stokes this incessant turnover by releasing evermore collections. The average number of collections has increased from two in the year 2000 to five in 2011. The clothing retailer Zara now offers 24 collections a year, and H&M between 12 and 16. This incessant renovation reinforces many consumers’ conviction that their clothes are disposable items.42 EU consumers discard about 11 kg of textiles per person per year. The industry’s insistence on novelty means that it drives a linear, not circular, economy: it’s estimated that 300,000 tonnes of textiles43 end up in household waste in the UK per annum.
Less than 1% of clothing is recycled into new clothing. It’s common practise for retailers to incinerate unsold stock to protect the value, and perceived exclusiveness, of their brand: in 2018 it was revealed in Burberry’s Annual Report that it had physically destroyed £28.6million worth of goods to avoid them being sold cheaply and undercutting the market. It’s estimated that the company had incinerated over £90million over the course of five years44.
Even if there were the will, the repair, reuse and recycling of textiles is difficult. Mixed yarns mean that it’s often expensive, or impossible, to separate the different fibres used in clothes. Labelling is complicated, and not subject to the same recycling instructions as on many other household items. The traditional knowledge base regarding how to repair clothing, and those cottage industries that grew up around garment-maintenance, have all been eroded.
Even those who work in the fashion industry are shocked by the wastefulness:
“ The overproduction of ‘fast’ fashion which will never be purchased or used, and the insane speed which the sector churns out new designs almost every week, means that the never-ending production of cheap fashion which is poorly made and will last only a few weeks and then be thrown away, has made our sector a monstrous disposable industry. I believe that we will look back on the practices of today’s fashion industry in the same way we now look back at Victorian Workhouses, with utter incredulous horror.”45
Credit: Vail Marston (CC BY 2.0)

10
In 2016, British consumers sent around £140 million worth of garments to landfill.
It’s estimated that 300,000 tonnes of textiles end up in household waste in the UK per
annum. Less than 1% of clothing is recycled into new clothing.
Credit: GRID-Arendal/ Tina Schoolmeester (CC BY-NC-SA 2.0)

11
Fashion’s impact on global climate
It is well-known that CO2 and other Greenhouse Gases are contributing to global heating and the climate emergency. Emissions need to plummet to 25 gigatonnes by 2030 to limit temperature increases to 1.5 C above pre-industrial levels. We are currently on-track to produce double that figure, 56 gigatonnes. The UN’s 2019 Emissions Gap Report suggests that to meet the 2030 targets, emissions need to reduce by 7.6% per annum. The longer we delay, the steeper the reductions will need to be46.
The fashion industry is responsible for 8.1% of global climate impacts.47 The production of textiles is an energy intensive process: depending on the fabric, a tonne of textiles generates between 15 and 35 tonnes of CO2eq48 (compared to 3.5 for plastic and less than one for paper).49
Every estimate suggests that those figures are likely to rise dramatically in the coming decade. The apparel industry’s impact on climate change increased 35% between 2005 and 2016, and is projected to grow rapidly throughout the 2020s. Some researchers have predicted a 49% increase on the 2016 figure, with projections of 4.91 gigatonnes of CO2eq per annum in 203050. In the UK alone, the total carbon footprint for clothing rose from 24 million tonnes of CO2eq in 2012 to 26.2 million tonnes in 201651.
Cotton has the potential for environmental degradation (or repair) because of the vast scale on which it is cultivated. The crop accounts for c.2.3% of the world’s arable land, or approximately 33.6 million hectares52. Cotton is the most important natural fibre in the apparel
and textile industry,53 and is the most widespread non-food crop in the world. In 2018, 26 million metric tonnes of cotton were produced,54 accounting for nearly a quarter of all fibres produced that year.55
It is cultivated in over 75 countries, although about 80% of production is concentrated in seven countries: China, India, the United States, Pakistan, Brazil, Turkey and Uzbekistan56. In recent decades, cotton yields have increased dramatically, almost doubling from an average of 411 kg / ha in 1980/81 to 771 kg/ha in 2019-2057.
But just as in fast fashion – where volumes have increased and prices plummeted – so cotton’s value has steadily declined in real terms. Cotton prices today are only one-half to one-third of what they were in 1990/91 when compared to competing crops like wheat, maize and soybean. Having been worth US$2.04 per pound in March 2011, cotton now sells on commodity markets for as little as 57 cents – exactly the same price as December 197558.
The predominant reason for that collapsing price is that cotton – having been the world’s preferred fibre for centuries – now has a formidable, oil-fuelled rival. Polyester (polyethylene terephthalate) is a synthetic polymer (a molecule which has replicating subunits) derived from petroleum. First patented in the 1940s, this synthetic fibre had many advantages over natural fibres: for much of the post-war years oil was abundant and cheap, polyester had minimal labour costs and, for decades, there was widespread ignorance about its environmental impact.
ChinaUzbekistan
Pakistan
United States Turkey
Brazil
India
About 80% of production is concentrated in seven countries: China, India, the United States, Pakistan, Brazil, Turkey and Uzbekistan.

12
Polyester was also cheap because of its chemistry: over a third of its chemical compound is made up of an element which is free and plentiful – oxygen. The more polyester became adopted as a replacement for cotton, the greater the economies of scale, making it ever more competitive with its historical rival.
In the mid-1990s, polyester surpassed cotton in terms of market share. According to the Textile Exchange’s Preferred Fiber Market Report (2019), 66.6 million tonnes of synthetic fibres were produced in 2018, meaning that synthetics accounted for 62% of global fibre production. Polyester alone had a market share of 51.5%, responsible for more than 55.1 million tonnes. Continuing the trend of decades, cotton’s market share fell from 27% in 201559 to 24.4% in 2018.60
With cotton prices seemingly in freefall, farmers have attempted to wring ever greater yields from their farms through an intensive application of pesticides and fertilisers. Cotton accounts for 5.7% of the US$58.5 billion of worldwide pesticide sales, for 16.1% of all global sales of insecticide, 3.9% of herbicides and 4% of desiccants / defoliants61.
Cotton also uses 4% of the world’s artificial nitrogen and phosphorus fertilisers62, the manufacture and use of which accounts for 1.2% of total global GHG emissions63.
This intensive spraying equates to 8.2 million tonnes of chemicals used to sustain annually the mass production of the fibre64. The world’s two largest producers of cotton – China and India – also have a significantly higher use of nitrogen fertiliser than in other countries (0.21kg and 0.18kg nitrogen/kg lint respectively, compared to c.0.11 in the United States)65.
That excess use of fertiliser has no correlative increase in yields. Artificial fertilisers have been called “ecological narcotics” because the more you use them, the more you need them. Excessive use of synthetic fertilisers has been shown to begin “the destruction of soil biodiversity by suppressing the role of nitrogen-fixing bacteria and enhancing the role of everything that feeds on nitrogen. These feeders then amplify the decomposition of organic matter and humus. As organic matter decreases, the physical structure of soil changes.”66
This soil compaction increases penetration resistance (affecting root growth), reduces aeration and decreases porosity. The result is that “root development and plant growth will be limited by reducing water and nutrient uptake which decreases yields.”67 The soil becomes increasingly compacted and infertile, and it duly requires evermore inputs. That overuse of fertilisers also diminishes the soil’s natural ability to sequester atmospheric CO2.
Cotton accounts for 5.7% of the US$58.5 billion of worldwide pesticide sales, for 16.1% of all global sales of insecticide, 3.9% of herbicides and 4% of desiccants / defoliants.

13
That chemical addiction is the same with pesticides: because the target species often builds up resistance, the number of applications, and the dosage, is increased with each growing season. In some countries, it’s not uncommon to spray the cotton crop an average of 36 times during the growing season with devastating effects on wildlife68.
But perhaps the greatest effect of that chemically-intensive form of farming is on global heating. Two separate analyses of conventional cotton farming have shown that the CO2eq emissions resulting from fertiliser (and to a lesser extent, pesticide) usage are vast. Nitrogen fertilisers are particularly pernicious as they release nitrous oxide, a gas which has 298 times the global warming potential of CO269.
A technical analysis from the International Trade Centre entitled “Cotton and Climate Change” suggested that 79% GHGs released during the cultivation of conventional cotton (or 3,166 kg/ha of CO2eq) derives from the manufacture and application of fertilisers and pesticides and the resultant field emissions of nitrous oxide70. The WWF’s “Cutting Cotton’s Carbon Emissions” reached even more stark conclusions, with fertilisers and pesticides combined responsible for a staggering 3,983 kg/ha of CO2eq emissions71.
The CO2eq emissions of a hectare of cottoncan be as much as 4 tonnes.
This is the equivalent to:
The average, modern cardriving 40,000 kilometresor driving between Londonand Rome 22 times
A single air-passenger'semissions after 10 return �ightsbetween Paris and Moscow
The CO2eq emissionsof 150 kg of beef
Cotton's impact on climate change
Public Domain

14
Case study: Australian cotton and climate change
Australia ranks as the third largest exporter of cotton in the world behind the United States and India72. It produces, annually, around five million bales of cotton with a value, according to price fluctuations, of between two and three billion Australian dollars73. The country’s c.1,500 cotton farms cover 583,000 hectares and tend to be large, industrialised operations. Over 95% of the crop in 2018/19 was planted with GM cotton74.
Australian cotton farmers are both responsible for, and victims of, disrupted hydrological and meteorological patterns. Cotton alone accounts for 0.2 percent of Australia’s GHG emissions75. A recent sustainability report revealed that between 2014 and 2019 carbon emissions from Australian cotton farming increased 12.6%. This increase is largely the result of intensive use of nitrogen fertilisers which account for 58% of those emissions76.
80% of the country’s cotton production is irrigated77, meaning it relies not on rainfall but on water drawn from mains supplies, rivers, lakes, aquifers and dams. In Australia, it takes over a million litres of water to produce two bales (227kg each) of cotton lint, meaning that the country’s cotton crop uses, annually, approximately 1.5 trillion litres of water78.
The two main regions of cotton production in Australia are both experiencing prolonged droughts: 66% of Queensland is currently in drought, as is 99.8 percent of New South Wales79. Dams are perilously low: Dubbo’s Burrendong Dam, fed by the Macquarie River, is currently at a mere 3% of its storage capacity. The Suma Park and Spring Creek Dams are at only 26.72% of capacity80.
Rivers and dams are critically low because of a lack of rainfall. In 2017, 2018 and 2019, rainfall in 12 districts of New South Wales was at least 50% below average. From January to August 2019, rainfall in the Southern Downs (Queensland) and Northern Tablelands (New South Wales) was the lowest ever recorded. Nationwide, in 2019, rainfall was 40% below the 1961-90 average81, making it the driest year since measurements began in 1900.
These drought conditions increase local temperatures because there is less evaporative cooling. So begins a feedback-loop in which higher temperatures, in turn, increase the “evaporative demand” (the extent to which the environment is ‘attempting’ to evaporate water), further adding to drought conditions. Those conditions duly affect the cotton crop too: in 2017-18, the harvested area of cotton in Australia was reduced by c.100,000 hectares (down to 473,000 hectares) because of adverse climactic conditions82.
By now every summer in Australia is hotter than the last. The 2018-19 summer broke over 200 extreme weather records, including the highest ever summer temperature in 87 different locations and the lowest summer total rainfall in another 9683. The mean national average temperature was 2.09 degrees above average. In New South Wales the average summer temperature was 3.41°C above average and the monthly mean temperatures over the year were 5.86 °C above average84. Nine of the ten hottest years on record have occurred since 200585.
AUST
RALI
AN C
OTTO
N A
ND C
LIM
ATE
CHA
NGE
Australia Bushfire Assistance. Photo: Clay Stephens, BLM (CC BY 2.0)

15
Increased temperatures create more storms, meaning that lightning often acts as the ignition for bushfires86. That ignition is more likely to occur because continued reductions in rainfall, and increases in evaporation and long-term temperatures, have drastically reduced the moisture content within vegetation87. Fires caused by lightning are also problematic as lightning causes multiple ignitions, often in inaccessible areas. The result is that the country’s Forest Fire Danger Index (FFDI) has had to be redesigned. Originally covering a scale from 0 to 100, with 50-100 categorised as extreme, a new category (“catastrophic”) has now been added (100+).
During the Australian summer of 2019-20 hundreds of ferocious bushfires burnt 18.6 million hectares, destroyed almost 6,000 buildings and killed 34 people88. Here, too, a feedback loop began, whereby storms created bushfires which created more storms: on 8th November 2019, the NSW Rural Fire Service released an alert regarding pyroconvection: the intense heat of bushfires were creating their own thunderstorms, thereby generating more lightning and, consequently, yet more bushfires89.
It’s been estimated that 800 million animals lost their lives90, with many more likely to perish as their habitats have been destroyed. Others will be pushed closer to extinction. Australia already has the world’s highest rate for extinction, with 34 species disappearing in the last 200 years91.
Particulate matter in densely-populated areas also led to a public health crisis: in December 2019, the PM2.5 average exceeded 100 µg/m³ (four times higher than the WHO guideline value of 25 µg/m³)92, leading to increases in hospitalisation due to respiratory diseases and cardiovascular morbidity93.
According to the Global Fire Emissions Database, part-funded by NASA, the Australian bushfires of 2019-2020 released 306 million tonnes of CO2 into the atmosphere94, the equivalent of half of Australia’s annual GHG emissions. The Copernicus Atmospheric Monitoring Service estimated that in the first 11 months of 2019 wildfires throughout the globe (not only in Australia, but also in the Amazon, Arctic Circle, Indonesia, Venezuela, Syria, Mexico and Colombia) released 6.7 billion tonnes of CO2 into the atmosphere95.
As a result of these climactic changes, the area planted to cotton in Australia during the 2019-2020 growing season is forecast to fall by 76% to a mere 82,000 hectares96. This is mainly because water levels in dams, which service cotton-growing areas, are now too low to service the crop. Production is expected to decline by 63% to 177,000 tonnes97.
In Australia, as elsewhere across the globe, conventionally-grown cotton is both causing, and suffering the consequences of, the climate crisis.

16
Water usage
Water scarcity has been identified by the World Economic Forum (WEF) as one of the top ten threats to society in the next ten years98. It’s estimated that two thirds of the world’s population will face water shortages by 2050.99
Cotton consumption is responsible for as much as 2.6% of global water use100. According to some estimates, cotton alone accounts for an estimated 69% of the total water consumption of the fashion and textile industry101. The global water footprint of cotton items across all industries is around 233 billion cubic metres a year, the same as 238 bathtubs of water per person.102
There are two stages to that water usage: the agricultural and the industrial stages. During field cultivation, water is a vital input because there’s a linear relationship between water use and yield. The more water a plantation receives, the greater the quality, and length, of the resultant fibres103. The consequence is, inevitably, a very liberal application of water to the crop.
Some of that hydration arrives via “green water” (soil moisture from precipitation). The necessary precipitation varies according to, amongst other factors, soil characteristics and atmospheric humidity, but the range

17
across the globe is similar: 390-780 mm. on the southern High Plains of Texas104, 590–780 mm. in the Central Valley of California105 and 430–740 mm. in Uzbekistan106.
“Blue water” is the freshwater (from mains supplies, aquifers, lakes, rivers etc.) which is deployed to irrigate the crop. Often blue water is only 5-10% of the total water used, but the figures are still huge: a recent study found that farms using drip irrigation used 382 m³/ha, whilst those using drench irrigation from furrows averaged 427 m³/ha107. 95% of the c.44 trillion litres of water used to irrigate natural fibres annually is used in cotton production108.
But it is cotton’s grey water footprint which shows its deleterious environmental impact. The grey water footprint is the volume of water required to assimilate a pollutant load (from fertilisers, insecticides, herbicides etc.) to meet recommended water-quality standards. With its intensive applications of chemicals, the cotton-growing area of Madhya Pradesh, in India, was shown to have an average grey water footprint 496,657 cubic metres per hectare (or 333,766 m³/tonne of cotton lint). One hundred farms, cultivating 192 hectares of cotton, in Madhya Pradesh had an annual grey water footprint of over 95 million cubic metres. Unsurprisingly, this damning grey water footprint is rarely used in life-cycle assessments of cotton.
The industrial stage of cotton production – scouring, bleaching, dyeing, softening and so on – is equally dependent on extreme quantities of water. Conservative estimates from the cotton industry suggest that 16,100-17,500 cubic metres of water are required to treat a tonne of cotton109.
Quite how many litres it takes to produce a kilogram of cotton, from field to final product, is a hotly-debated statistic. A report by the United Nation’s Food and Agriculture Organization suggested that “3,000 to 7,000 litres of water are needed to produce 1 kg of cotton lint plus 1.4 kg of cottonseed”110 whilst the UK parliament’s Environmental Audit Committee has written “that it can require between 10 and 20,000 litres” to produce that kilogram of cotton.111 Assuming it takes 10,000 litres, that would imply 8,000 litres of water (or 50 bathtubs of water) to produce a pair of cotton jeans112.
Since cotton is grown in semi-arid regions, that water usage is doubly problematic. Scarcity-based weighting models have suggested that the textiles sector is responsible for 7% of local groundwater and drinking water losses globally113. This widespread withdrawal of water from freshwater sources - from rivers, lakes and aquifers – leaves limited supplies for essential human activities such as drinking, sanitation and cooking.
In 2018, more than 600 million people in India experienced water stress due to unsustainable groundwater depletion114. It has been estimated that by 2030, 40% of India’s population may be without a supply of fresh drinking water115. Studies show that the water consumed by the country’s 2013 cotton exports would have been enough to provide 85% of India’s 1.3 billion population with 100 litres of water every day for a year.116
Bangladesh, too, is experiencing significant problems of water scarcity. With a large concentration of textile mills using on average 100,000 cubic metres of water every month, the capital city Dhaka is seeing groundwater reductions of two to three meters every year.117 Groundwater depletion and the gradual erosion of wetlands also lead to loss of plant and wildlife species and higher pumping costs for communities and businesses as the distance from freshwater increases.
As well as water depletion, cotton is also responsible for soil salinisation. This occurs through the application of saline or sodic water onto the soil and through the evaporation, in semi-arid areas, of surface irrigation, leading to the accumulation of salt minerals in the soil surface118. One study has suggested that in six leading cotton-producing countries, 12-36% of the irrigated landmass had suffered soil salinisation119.
Eutrophication of water supplies also occurs as industrial fertilisers, rich in nitrogen and phosphorus, leach into waterways. These nutrients cause an anomalous over-production of algae which, in turn, creates high water turbidity, diminishing the light available to submerged plant-life. The decomposition of that algae also drastically reduces the availability of oxygen (anoxia or, in severe cases, hypoxia), leading to the death of fish and other aquatic organisms.
50
8,000litres
It can require 8,000 litres of water (or 50 bathtubs) to produce a pair of cotton jeans

18
Chemical clothingThe pollution resulting from pesticides and fertilisers has had devastating effects on both land and marine ecosystems. In 2015 the United Nation’s Food and Agricultural Organization (FAO) reported on the widespread poisoning of fish and marine organisms, livestock and wildlife - including pollinators120. There were also further cases of significant wildlife loss, contaminated groundwater and aquifers, soil erosion and salinisation, as well as persistent losses in soil organisms and underground ecosystems121.
As with cotton cultivation, almost all stages of textile manufacture involve intensive chemical input. It has been estimated that the fashion industry uses between 8,000 and 15,000122 different chemicals and that 43 million tonnes are used annually to produce textiles, many of them profoundly harmful to humans and our environment.
Solvents (like carbon disulfide) are used to dissolve dye pigments or extract cellulose. Surfactants including alkyl phenol ethoxylates (which lower the surface tension between two liquids, and are thus used as wetting agents, softeners, anti-static agents and so on) are common inputs. They can be metabolised, meaning that when leached into the environment they interfere with the hormonal systems of mammals and fish123. Exposure to surfactants can also cause allergic reaction in human skin as they disrupt the protective lipid membrane.
Textile dyes are deliberately long-lasting because no-one wants their clothes to fade. But that means that “azo-dyes” are insoluble in water and other solvents, and resistant to biodegradation. Some pigments (like dinitroaniline orange and ortho-nitroaniline orange) are mutagenic and carcinogenic, and others contain heavy metals like cadmium and lead124.
Fluorinated and perfluorinated compounds are used to give textiles the desired water and stain repellence, but they often contain perfluorooctanoic acid and perfluorooctanesulfonic acid. Because of the exceptional stability of these compounds, they have been found to bioaccumulate across the globe125 and are thought to have detrimental effects on the immune, liver and endocrine systems126. Similar concerns have been raised about flame-retardants like perfluorohexane sulfonate.
Attempts to protect clothing from mould, odour or moth-holes means that many are treated with biocides like triclosan, triclocarban and nano-silver. These anti-bacterial treatments are so common that scientists fear they could play a part in bacteria developing antibiotic resistance. Some of these chemicals have now been recommended for inclusion in the EU’s Registration, Evaluation, Authorisation and Restriction of Chemicals (REACH) list. But because almost 90% of textiles bought in the EU are imports, and produced overseas, the effectiveness of EU protocols is limited. Textile manufacturers frequently choose to produce clothing overseas where environmental controls and regulations are far more lax.
As a consequence, the waterways close to textile factories are invariably contaminated. The Citarum river in Indonesia, which has a dense concentration of textile manufacturers, is now considered one of the most polluted rivers in the world with dangerously high levels of lead and mercury. Samples of effluents from one factory were shown to contain nonylphenol, antimony, and tributyl phosphate and the alkalinity of the river water has killed 60% of the fish species living there. Instead of fishing, residents now eke out a living by collecting plastic debris from the river127.
Turag river. Dhaka, Bangladesh. Photo credit: Shamima Prodhan/REACH (CC BY 2.0)

19
Genetically-modified clothesCotton cultivation is now dominated by genetically-modified (GM) cultivars. In 2012/13, Bt cotton and other biotech varieties were planted on 23 million hectares, or 68% of the total area of the world’s cotton plantations. Today, the figure is closer to 24 million hectares, and 74%.
GM cotton is usually referred to as Bt cotton since it is created by the insertion of genes from the Bacillus thuringiensis (Bt) into the cotton plant. Bt produces toxins which turn the plant itself into a form of insecticide. In the United States, Bt cotton plants are registered as pesticides128.
Since Bt cotton was introduced in India by Mahyco Monsanto Biotech Limited in 2002 it has created various environmental disasters and human tragedies. The new Bt seeds were expensive, and many farmers took out loans to pay for them because there was a promise of greater profits in the future: Bt cotton was supposed to decrease costs by removing the necessity of purchasing pesticides and increase yields because less of the plantation was lost to pests.
However, the genetic modification of Bt cotton made it vulnerable to other parasites because it contained less of the plant’s naturally-occurring pest-repellents (aromatic terpenoids)129. Although Bt cotton was supposed to be resistant to the pink bollworm, other pests filled the vacuum with whitefly, jassid and thrips attacking plantations. Additional pesticide applications were thus required, increasing unexpectedly farmers’ expenditure. These included Imidacloprid, a chemical from the neonicotinoid family which has been linked to a drastic drop in pollinator species, waterway pollution and the deaths of both birds and mammals130.
Within four years of the introduction of Bt cotton to India, the very animal it had been intended to resist – the pink bollworm – had developed a resistance to it. A more expensive, second generation Bt cotton was released by Monsanto – Bollgard II – but the bollworm had developed a resistance to that too131. Having turned a natural plant into a delivery mechanism of insecticide, Bt cotton now required not less but additional applications of poison:
“ Rapid development of resistance occurs because Bt cotton plants are engineered to continuously release toxins, and this constant, long term exposure encourages the survival of any pests that are genetically resistant to the toxin. As a result, insecticide use has increased in recent years, from a reported 0.5 kg per hectare in 2006 up to 1.20 kg per hectare in 2015.”132
Having been proposed as a solution to the climate emergency, Bt cotton has been revealed as complicit in it:
“ every GM crop likely to be available in the next (crucial) two or three decades put forward as a solution to climate change will require application of manufactured nitrogen fertiliser. With GM accounting for some 68% of the world’s total cotton output, and bearing in mind the increasing emissions related to cotton cultivation, GM technology is evidently not a panacea – it is simply another facet of the same system of farming which is contributing so significantly to the climate change crisis.”133
The predominance of GM cotton has drastically diminished the availability of local or organic seeds. In one survey, 90% of respondents in areas where GM cotton was grown claimed to have difficulty sourcing organic seeds134. Contamination problems were experienced by 50% of respondents, thus putting at risk the integrity of organic cotton. The problem of contamination only increases the diffidence of brands towards paying an “organic premium” for products which they understandably fear might not be pure.
Today Bt cotton and other biotech varieties are planted on 24 million hectares, or 74% of the total area of the world’s cotton plantations

20
Synthetic fibres now account for a quarter of all global plastic production.135 It has been estimated that it requires 342 million barrels of oil per annum to meet our demand for plastic-based fibres136, meaning that the clothing industry has a voracious appetite for oil as a feedstock and shares a major responsibility for the environmental impact of oil extraction and refining: the disturbance of unique ecosystems, saline and thermal pollution of groundwaters, the release of nitrogen oxides, ammonia, acid mist and fluorine compounds, and the regular occurrence of leakages and accidents.
The vast majority of synthetics come from virgin plastics. Oil is now so under-priced that it’s easier to create the necessary polymers from scratch than collect, clean and recycle extant polyester. “One problem preventing greater uptake of recycled polyester is that low oil prices make new virgin plastics cheaper than recycled PET.”137
Polyester requires an intensive use of chemicals. Antimony Trioxide (suspected of causing cancer in humans) is used as a catalyst in the manufacture of polyester and is retained in its fibres138. Plasticisers are used to make plastics more flexible and less likely to break. Phthalates can leak out when clothing is worn or washed with hazardous consequences for reproductive health.
Synthetic fibres slowly deteriorate and shred over time. It has been estimated that every year half a million tonnes of plastic microfibres from the laundering of textiles like nylon, acrylic and polyester pollute the ocean.139 Between 20 and 35% of all microplastics in the marine environment are fibres from synthetic clothing140/141. A single, six kilogramme wash has the potential to release as many as 700,000 microfibres142 and over 9 trillion could be released per week according to a National Federation of Women’s Institutes (NFWI) “In a Spin” report143.
Man-Made Cellulosic Fibres (MMCF) have a 6.2% share of the entire fibre market, producing 6.7 million metric tonnes144. Viscose is by far the most common MMCF, with 5.3 million MT produced in 2018. It is expected to enjoy a 6-7% compound annual growth rate over the next five years.
Viscose is derived from wood pulp and commonly leads to deforestation. The global forest area has decreased from 31.2% of global land mass in 2000 to 30.77 in 2015. This represents a loss of more than 56 million hectares of forest in only fifteen years145. It has been estimated that 150 million trees are cut down annually for viscose production, many from ancient and endangered forests in Indonesia, from Canada’s boreal forest and from the rainforests of the Amazon146.
Alternative fibres are worse than cotton
Microplastics (fibres from clothing magnified with a microscope). Photo credit: Tiffany Woods/Oregon Sea Grant (CC BY-NC-SA 2.0)

21
To produce the pulp necessary for viscose, wood chips are submitted to a process of purification and separation of the wood fibres. This requires steam and various corrosive compounds like sodium hydroxide (NaOH) and carbon disulfide (CS2) which have been shown to cause neurological and vascular pathologies in factory workers and acute aquatic poisoning147. The pulp is then bleached with chemicals. This often involves chlorines which generate toxic effluents. The resulting orange-brown solution is called viscose (sodium cellulose xanthate), which is forced through a spinneret into an acid bath to create cellulose filaments.
Air pollutants during this process include sulphur compounds like carbon disulfide and hydrogen sulfide. Waterways are contaminated by oxygen-depleting organic compounds like zinc sulphate and by chlorates and dioxins.
The water footprint of both of these alternative fibres is very high: 71,000 cubic metres per tonne of polyester, which is particularly problematic as many sites of polyester production are located in water sustainability hotspots (Asia accounts for roughly 92% of global polyester fibre production)148. The water footprint of viscose staple fibre is thought to be c.3,000 cubic metres per tonne of year. That figure increases to 30,000 cubic metres when produced through batch washing149.
According to research by the Stockholm Environment Institute, the total energy required to produce a tonne of spun fibre is far higher for synthetics: it takes 104,479 Megajoules (MJ) to produce a tonne of polyester fibre in Europe and 126,706 MJ in the US. The equivalent figure for conventional cotton in the US is 25,591 MJ150. Other studies have suggested that the carbon footprint of a polyester shirt is more than double that of a cotton shirt (5.5kg CO2eq as compared to 2.1)151.
In a Joint Research Council’s report, “Environmental Improvement Potential of Textiles”, it was calculated that 35.7 kilogrammes of CO2 equivalent was generated for every kilogramme of acrylic. The figures for PA6 (a type of nylon) and for polyester were 30.9 kg CO2 eq/kg and 27.2 kg CO2 eq/kg. The authors of the JRC reported concluded:
“ …synthetic fibres show a higher impact on climate change than natural fibres. This gap would result still higher if end-of-life emissions were included in the assessment since synthetic fibres are based on fossil feedstock.”152
It has been estimated that 150 million trees are cut down annually for viscose
production, many from ancient and endangered forests in Indonesia,
from Canada’s boreal forest and from the rainforests of the Amazon.
xxxxxxxxxxxxxxxxxxCredit: EU FLEGT and REDD facilities (CC BY-NC-SA 2.0)

22
Case study: Pesticides in India
There are currently 318 pesticides registered for use in India.
Of these, 18 are listed by the World Health Organisation as extremely or highly hazardous (1A and 1B according to the WHO classification).
Pesticides in the extremely hazardous category include: Bromadiolone, Captafol, Dichlorvos, Phorate and Phosphamidon.
One of the most controversial pesticides is Monocrotophos, which is banned in 112 countries. In October 2018, 40 farmers in the Maharashtra state died from Monocrotophos poisoning.
Another common and controversial herbicide is Paraquat (often sold under the commercial name Gramoxone). Banned in the European Union since 2007, it can be fatal in tiny doses (10 ml.) and is still common throughout India.
The country’s National Crime Records Bureau (NCRB) registered 441,918 pesticide suicides between 1995-2015. In 2015, 23,930 pesticide suicides were recorded.
Since 2015, the NCRB has stopped keeping records of pesticide poisonings as it was causing embarrassment to the government.
PEST
ICID
ES I
N IN
DIA

23
There is, however, a sustainable solution to the ecological devastation caused by the fashion industry. There is a fibre which is renewable, which enriches soils, leaves waterways pure and which builds, rather than dissolves, social bonds: organic cotton.
Organic farming is a holistic method which works in harmony with, rather that counter to, nature. It prohibits the use of pesticides, manufactured fertilisers and weed killers. Weeds and pests are inhibited through companion-planting. Crops are regularly rotated and fed through green manures and nitrogen-fixing legumes which improve the soil’s structure, nutrient content and water retention.
Nineteen countries currently cultivate organic cotton across 418,935 hectares of land.153 97% of organic cotton, however, is grown in just seven countries: India is by far the largest at 51% of total global production, followed by China (17%), Kyrgyzstan (10%), Turkey (10%), Tajikistan (5%), the United States (2%) and Tanzania (2%).154 Organic cotton production is still small. It only represents 0.93% of the global cotton market.155 But it is growing: its market share increased an impressive 56% between 2016/17 and 2017/18,156 and 31% between 2017/18 and 2018/2019.157 55,833 hectares of land was converted during that time, meaning that there are now 222,134 organic cotton farmers worldwide.158
Other countries are also experiencing significant growth in the production of Global Organic Textile Standard (GOTS) certified cotton including Bangladesh (+29%), North America (+25%), Pakistan (+23%) and South Korea (+23%).159
Because of the lower inputs of organic farming, it has been estimated that organic cotton has 40% less global warming potential (GWP) compared to conventional cotton160. Other research suggests that the reduction in GWP could be as high as 46%, with CO2eq emissions per tonne of organic cotton at 978kg compared to 1,808 for conventional cotton161. 54% of organic cotton’s GWP162 is the result simply of microbial processes in the soil during which nitrous oxide is created from the nitrogen fixed by leguminous plants in natural processes163.
If the (temporary) uptake of carbon into the cotton fibre were included, that emissions figure would actually be negative: -562 kg CO2eq per tonne of lint164. Organic soils are also able to sequester 450 kilograms more carbon per hectare than their non-organic equivalents165. But because those carbon sequestration rates are not constant (saturation dynamics affect carbon uptake, meaning that the absorption of carbon can simply reach its maximum level) they are not usually included. When soil’s sequestration potential is included in analysis, it’s thought that organic farming leads to an 89% reduction in GHG emissions compared to conventional cultivation166.
CO2 emissionsper tonne lint
water consumptionper tonne
Primary Energy Demand (PED)MJ
CO2
IMPACT ON CLIMATE CHANGE
978 kg/ tonne lint
1,808 kg/ tonne lint
organic cotton
182 m³/ tonne
2120 m³/ tonne
5,759 MJ
15,000 MJ
conventional cotton
Conventional versus organic cotton
The sensible, sustainable, circular solution

24
to be more stable: farmers are less vulnerable to price instabilities because they cultivate cotton as part of an integrated system, and that crop diversification counterbalances price fluctuations in cotton173.
Studies of organic cotton in Burkina Faso have shown that farmers there spend 90% less on inputs, and yet received a 65% higher price for their cotton. Those percentages meant that, despite 39% lower yields, organic cotton farmers enjoy 30% greater gross margin. The benefits weren’t only financial: farmers reported that both human and livestock health had improved, and that there was a renewed peace of mind at not being indebted before the crop was harvested174.
A smaller study conducted in the Indian state of Maharashtra found a 60% decrease in global warming potential with organic cotton.167 They found that the removal of synthetic fertilisers in global organic cotton production between 2004 and 2015 saved around 11 million tonnes of CO2 emissions, equivalent to the annual emissions of over 2.3 million cars168/169.
Organic cotton is still a thirsty crop – using 14, 595 cubic metres of water per tonne of cotton lint – but 95% of that water consumption is green water (precipitation or extant soil moisture)170. There is a 91% reduction in blue water consumption in organic cotton. In conventional cotton cultivation it is reported to be 2120 m³/tonne fibre, whereas one LCA of organic cotton suggests it is merely 182 m³/tonne171. It has been estimated that organic cotton farming is responsible for an annual water saving equivalent to 95,000 Olympic-sized swimming pools172.
Organic cotton makes sense from every angle. Because organically cultivated systems protect the soil and prevent erosion, there’s a 26% less eutrophication potential. The acidification potential of organic cotton is 70% less than for conventional cotton (5.7 kg of SO2eq. per tonne of lint, compared to 18.7 kg.) The Primary Energy Demand (PED) for organic cotton is, on average, 5,759 MJ/tonne lint. This is a reduction of 62% of the PED of conventional cotton (c.15,000 MJ/tonne).
Organic cotton even proves more profitable for farmers: although yields are marginally lower than GM cotton (14%), the costs of growing organic cotton are 38% less. The income from organic growing is also considered
Organic cotton farming is responsible for an annual water saving equivalent to 95,000 Olympic-sized swimming pools

25
Organic cultivation has also had dramatic effects on gender equality. In Mali, 30% of organic cotton farmers are women. Their participation in the cash crop had previously been forbidden due to its notoriety for toxicity. In Burkina Faso, the figure is even higher, with female participation in organic farming rising to 38% in the 2015-16 growing season (1,669 women farmers).175
Organic cotton farmers benefit from the greater resilience of their land: increased biodiversity, better water-retention in soil and a diversification of crops can mitigate climactic unpredictability. Household costs also tend to be greatly reduced for organic farmers. Without the acute medical conditions caused by pesticides, there are fewer medical bills and lost work days. Crop diversity ensures that there is less expenditure on basic foodstuffs and there are none of the debts associated with sourcing seed from monopolistic suppliers.
It’s a form of farming which replaces competitive and cut-throat practises with collaborative and cooperative ones.“ Throughout history, trading systems have been
characterized by the anonymity of participants, encouraging fluidity in relationships and the freedom to move from one supplier to another in the search for the ‘best deal’. Anonymity allows the disconnection, which, in turn, can enable participants to pursue their economic rationality without concern for the personal or moral consequences of their choice.”176
In organic cotton farming, however, there’s a decisive move away from anonymity towards relationships because supply networks for ethical products rely on
reputation and responsibility. A shared sense of mission amongst organic farmers means that they unite to form buying clubs (for seeds, farm tools and machinery etc.) and create selling cooperatives and “cluster partnerships”177. Loyalty and commitment replace exploitation, meaning that financial relationships have a longevity which further insulates the farmers against the whims of the market. Rather than being inordinately long and opaque, organic cotton supply chains tend to be short and transparent. Ethical brands often source their organic cotton directly meaning that value isn’t extracted (and payments to producers reduced) in dozens of transactions between farm and the eventual high-street shop. For once in the linear industry of fashion, there is a virtuous circle.
26
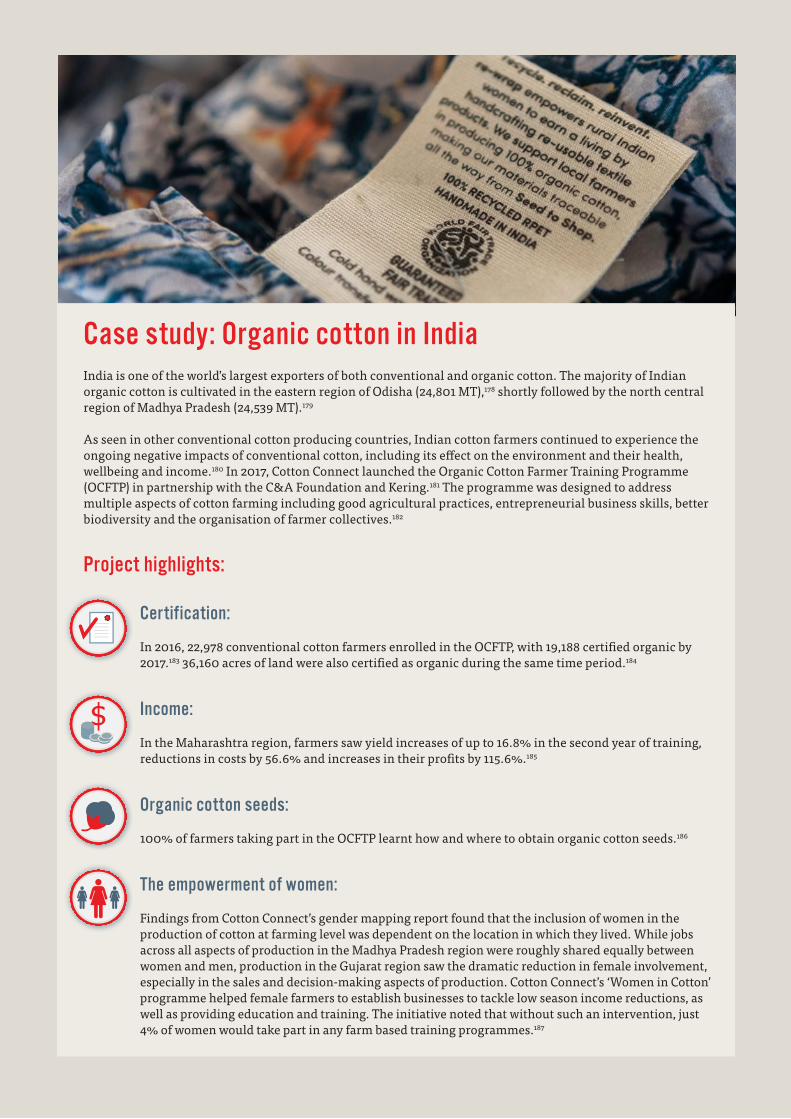
Case study: Organic cotton in IndiaIndia is one of the world’s largest exporters of both conventional and organic cotton. The majority of Indian organic cotton is cultivated in the eastern region of Odisha (24,801 MT),178 shortly followed by the north central region of Madhya Pradesh (24,539 MT).179
As seen in other conventional cotton producing countries, Indian cotton farmers continued to experience the ongoing negative impacts of conventional cotton, including its effect on the environment and their health, wellbeing and income.180 In 2017, Cotton Connect launched the Organic Cotton Farmer Training Programme (OCFTP) in partnership with the C&A Foundation and Kering.181 The programme was designed to address multiple aspects of cotton farming including good agricultural practices, entrepreneurial business skills, better biodiversity and the organisation of farmer collectives.182
Project highlights:
Certification: In 2016, 22,978 conventional cotton farmers enrolled in the OCFTP, with 19,188 certified organic by 2017.183 36,160 acres of land were also certified as organic during the same time period.184
Income: In the Maharashtra region, farmers saw yield increases of up to 16.8% in the second year of training, reductions in costs by 56.6% and increases in their profits by 115.6%.185
Organic cotton seeds: 100% of farmers taking part in the OCFTP learnt how and where to obtain organic cotton seeds.186
The empowerment of women: Findings from Cotton Connect’s gender mapping report found that the inclusion of women in the production of cotton at farming level was dependent on the location in which they lived. While jobs across all aspects of production in the Madhya Pradesh region were roughly shared equally between women and men, production in the Gujarat region saw the dramatic reduction in female involvement, especially in the sales and decision-making aspects of production. Cotton Connect’s ‘Women in Cotton’ programme helped female farmers to establish businesses to tackle low season income reductions, as well as providing education and training. The initiative noted that without such an intervention, just 4% of women would take part in any farm based training programmes.187

27
Organic cotton isn’t only the answer to fashion’s environmental degradation, but also its social injustices. Its supply chains are short, transparent and supportive instead of long, opaque and exploitative.

28
Clothing and carbon leakage
Clothing is particularly problematic for climate change because it’s a prime example of globalised capitalism’s ability to by-pass environmental regulations. This is commonly called “carbon leakage”, whereby much of the benefit of emissions-reductions in one country is off-set by the tendency to burn hydrocarbons in another. If a company wants to reduce its emissions to avoid sanction or penalties it can out-source to a nation where there is less intent to combat carbon. Where legislation is more lax, there is also, usually, a source of cheap labour, making the out-sourcing only more appealing. It’s now estimated that as much as 25% of all carbon emissions result from the production of goods ultimately consumed in a different country188.
Carbon leakage is an acute problem in the textiles industry because its long supply chains span the globe. With the liberalisation of the textiles industry, the gradual phasing out of the World Trade Organisation’s textile quotas between the 1990s and 2005, and with China’s admission to the WTO, the share of imports in European clothing consumption leapt from 33% in 2004 to 87% in 2012. By 2017, the EU had a huge trade imbalance in the textile sector: it was importing US$198 billion worth of textiles (mainly from China, Bangladesh, Turkey, India, Cambodia and Vietnam)189.
As well as making clothes cheap, that outsourcing of production has also meant that it’s all too easy, in the developed world, to turn a blind eye to the environmental consequences of our clothing. Those vast carbon emissions are accounted for in another jurisdiction, like a smoker throwing their cigarette butts in a neighbour’s garden.
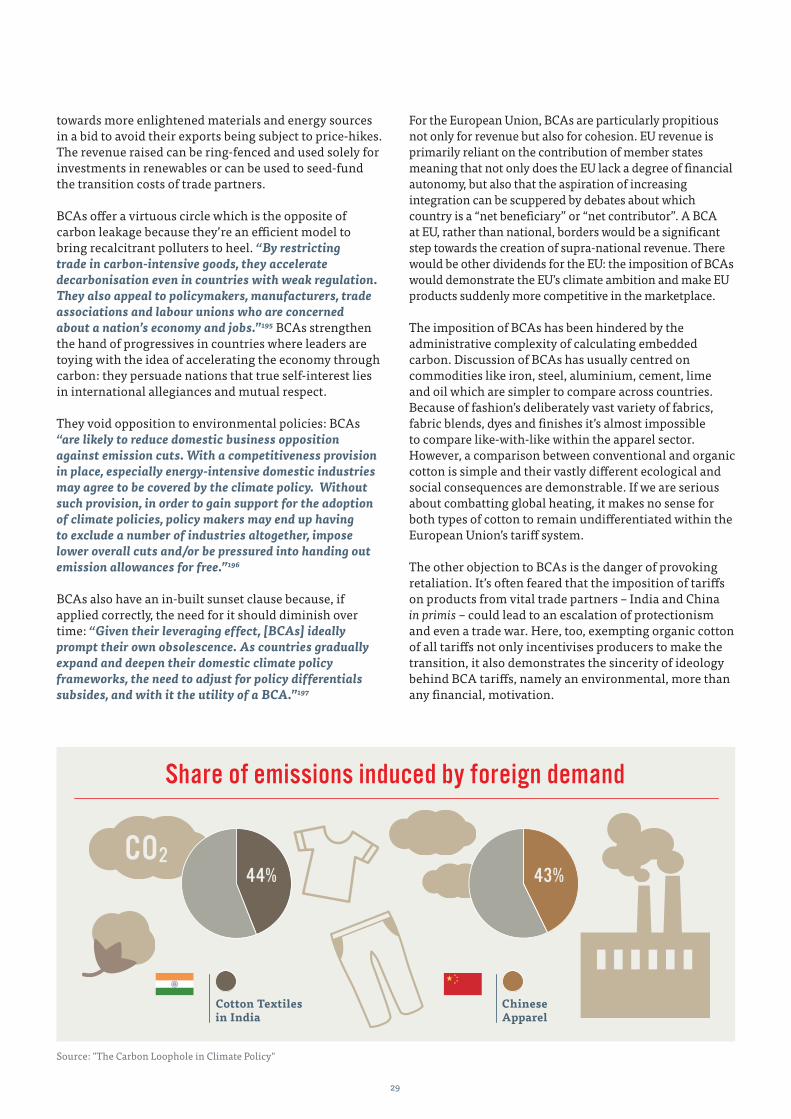
The figures are stark: 43% of the GHG emissions in China’s apparel production are a consequence of foreign demand190. In India’s cotton industry, those percentages are even higher: 44% of India’s emissions related to cotton, and 49% related to leather, are induced by foreign final demand.191 If one calculates carbon emissions in the EU according to consumption-accounting, the emissions between 1990 and 2015 would be, on average, 21% higher. The difference, in recent years, is closer to 25-30%192. Until consumers, as well as producers, are included in carbon accounting any rhetoric about climate change seems barely credible because carbon leakage negates all the environmental benefits that were intended to accrue from emissions-commitments.
It is clear that preferential or punitive tariffs are required in order to accelerate or deter certain products. This is something the EU itself has frequently recognised, calling – in its “EU Flagship Initiative on the Garment Sector” - for the introduction of “tariff preferences for demonstrably proven sustainably produced textiles…”
More recently, in its “initial roadmap” (Dec. 2019) towards the New Green Deal, the European Commission wrote:
“ As long as many international partners do not share the same ambition as the EU, there is a risk of carbon leakage, either because production is transferred from the EU to other countries with lower ambition for emission reduction, or because EU products are replaced by more carbon-intensive imports. If this risk materialises, there will be no reduction in global emissions, and this will frustrate the efforts of the EU and its industries to meet the global climate objectives of the Paris Agreement. Should differences in levels of ambition worldwide persist, as the EU increases its climate ambition, the Commission will propose a carbon border adjustment mechanism, for selected sectors, to reduce the risk of carbon leakage. This would ensure that the price of imports reflect more accurately their carbon content.”193
A Carbon Border Adjustment, also known as a Border Carbon Adjustment (BCA), is a widely-admired mechanism which addresses carbon leakage. The Nobel-Prize winning economist, Joseph Stiglitz put the case for BCAs almost 15 years ago:
“ Not paying the cost of damage to the environment is a subsidy, just as not paying the full costs of workers would be. In most of the developed countries of the world today, firms are paying the cost of pollution to the global environment, in the form of taxes imposed on coal, oil, and gas.”
To the problem of those countries which are not imposing emissions controls, Stiglitz says: “there is a simple remedy: …impose a high tax on them, to offset the subsidy. All that is asked is that everyone pay the social cost of their emissions, and that the tax be set high enough that the reductions in emissions is large enough to meet the required targets.” He suggests that the revenue raised replace taxes on capital and labour: “it makes much more sense to tax ‘bads’ (pollution, like greenhouse gas emissions) than to tax ‘goods,’ like work and saving.”194
BCAs are about equity in global trading. Through imposing a tariff on imported goods which reflects their embedded carbon, BCAs impose identical economic burdens (and therefore environmental standards) on domestic and foreign producers. BCAs immediately address the asymmetrical nature of global emissions policies with beneficial consequences: they disincentivise the out-sourcing of production to places with looser carbon legislation. Trade partners abroad are nudged
29
towards more enlightened materials and energy sources in a bid to avoid their exports being subject to price-hikes. The revenue raised can be ring-fenced and used solely for investments in renewables or can be used to seed-fund the transition costs of trade partners.
BCAs offer a virtuous circle which is the opposite of carbon leakage because they’re an efficient model to bring recalcitrant polluters to heel. “By restricting trade in carbon-intensive goods, they accelerate decarbonisation even in countries with weak regulation. They also appeal to policymakers, manufacturers, trade associations and labour unions who are concerned about a nation’s economy and jobs.”195 BCAs strengthen the hand of progressives in countries where leaders are toying with the idea of accelerating the economy through carbon: they persuade nations that true self-interest lies in international allegiances and mutual respect.
They void opposition to environmental policies: BCAs“are likely to reduce domestic business opposition against emission cuts. With a competitiveness provision in place, especially energy-intensive domestic industries may agree to be covered by the climate policy. Without such provision, in order to gain support for the adoption of climate policies, policy makers may end up having to exclude a number of industries altogether, impose lower overall cuts and/or be pressured into handing out emission allowances for free.”196
BCAs also have an in-built sunset clause because, if applied correctly, the need for it should diminish over time: “Given their leveraging effect, [BCAs] ideally prompt their own obsolescence. As countries gradually expand and deepen their domestic climate policy frameworks, the need to adjust for policy differentials subsides, and with it the utility of a BCA.”197
For the European Union, BCAs are particularly propitious not only for revenue but also for cohesion. EU revenue is primarily reliant on the contribution of member states meaning that not only does the EU lack a degree of financial autonomy, but also that the aspiration of increasing integration can be scuppered by debates about which country is a “net beneficiary” or “net contributor”. A BCA at EU, rather than national, borders would be a significant step towards the creation of supra-national revenue. There would be other dividends for the EU: the imposition of BCAs would demonstrate the EU’s climate ambition and make EU products suddenly more competitive in the marketplace.
The imposition of BCAs has been hindered by the administrative complexity of calculating embedded carbon. Discussion of BCAs has usually centred on commodities like iron, steel, aluminium, cement, lime and oil which are simpler to compare across countries. Because of fashion’s deliberately vast variety of fabrics, fabric blends, dyes and finishes it’s almost impossible to compare like-with-like within the apparel sector. However, a comparison between conventional and organic cotton is simple and their vastly different ecological and social consequences are demonstrable. If we are serious about combatting global heating, it makes no sense for both types of cotton to remain undifferentiated within the European Union’s tariff system.
The other objection to BCAs is the danger of provoking retaliation. It’s often feared that the imposition of tariffs on products from vital trade partners – India and China in primis – could lead to an escalation of protectionism and even a trade war. Here, too, exempting organic cotton of all tariffs not only incentivises producers to make the transition, it also demonstrates the sincerity of ideology behind BCA tariffs, namely an environmental, more than any financial, motivation.
CO2
Share of emissions induced by foreign demand
43%44%
ChineseApparel
Cotton Textilesin India
Source: "The Carbon Loophole in Climate Policy"

30
In an era of global heating, organic co
tton
is the cool option: the only fibre which has the p
oten
tial
to be mass-market without exacerbating the climate
emer
genc
y.

31
Recommendations:
EU and Member States
In March 2020, the EU published its Circular Economy Action Plan in which it recognised the detrimental environmental impact of the fashion industry: “textiles are the fourth highest-pressure category for the use of primary raw materials and water, after food, housing and transport, and fifth for GHG emissions.” The plan duly called for a “comprehensive EU Strategy for Textiles”, which would boost “the EU market for sustainable and circular textiles...”198
The EU has also recognised the dilemma of “carbon leakage”, saying in its “initial roadmap” (December 2019) to the Green Deal: “As long as many international partners do not share the same ambition as the EU, there is a risk of carbon leakage, either because production is transferred from the EU to other countries with lower ambition for emission reduction, or because EU products are replaced by more carbon-intensive imports.”199 The EU has pledged to be a net-zero economy by 2050200.
Recommendation:
• The EU should introduce a Border Carbon Adjustment on conventional cotton, the proceeds of which should underwrite the cost of transition to, and the certification process for, organic cotton.
Public procurement
It is estimated that €8.6 billion was spent on public sector textile and workwear procurement across Europe in 2015201. Green Public Procurement (GPP) is a stated aim of the EU to drive a market for more sustainable textiles.
Recommendation:
• National governments should commit to public procurement contracts which prioritise organic cotton.
Fashion industry
Recommendation:
• The Fashion Industry Charter for Climate Action, that was launched in 2018, should publicise commitments and targets against which companies report, if net-zero emissions by 2050 are to be achieved.
• Fashion producers and retailers should commit to ambitious, time-bound targets for inclusion of alternative or new materials with “low-climate impact”202 (including organic cotton) in their supply chains.
• Companies that have committed to the 2025 Sustainable Cotton Challenge (100% sustainable cotton by 2025) should accelerate their transition from conventional cotton by prioritising organic cotton in their supply chains.
• Clothing retail outlets should offer in-store recycling points and incentivise consumer participation.
Consumers
Recommendation:
• Consumers can drive rapid industry decarbonisation efforts through their purchasing decisions.
• Consumers who care about the global climate, natural environment and farming communities producing the cotton for their clothing, should support brands and retailers using organic cotton.
• Ask your favourite retail brands to accelerate their transition from carbon-intensive materials to those with a demonstrable reduced impact, including organic cotton; and to reduce their carbon emissions throughout the product supply chains.
• Reject the ‘fast fashion’ culture: buy less, and buy quality. Recycle clothes at the end of their life-cycle to reduce landfill and incineration.

32
1 European Commission (2020) Communication from the Commission to the European Parliament, The Council, The European Economic and Social Committee and the Committee of the Regions: A New Circular Economy Action Plan. https://eur-lex.europa.eu/legal-content/EN/TXT/?uri=COM%3A2020%3A98%3AFIN
2 European Commission (2019) Communication from the Commission to the European Parliament, The Council, The European Economic and Social Committee and the Committee of the Regions: The European Green Deal. 24 pp. https://eur-lex.europa.eu/resource.html?uri=cellar:b828d165-1c22-11ea-8c1f-01aa75ed71a1.0002.02/DOC_1&format=PDF
3 https://ec.europa.eu/clima/policies/strategies/2050_en
4 European Clothing Action Plan (2017) European Textiles & Workwear Market: The role of Public Procurement in making textiles circular. 65pp. http://www.ecap.eu.com/wp-content/uploads/2016/09/ECAP-Workwear-Report-Pt-1-def-final.pdf
5 Fashion Industry Charter for Climate Change, 7pp, https://unfccc.int/sites/default/files/resource/Industry%20Charter%20%20Fashion%20and%20Climate%20Action%20-%2022102018.pdf
6 Quantis (2018), Kibbey J., Johnson D., McGill L., Pepper L.R., Eds., Measuring Fashion: Environmental Impact of the Global Apparel and Footwear Industries Study, 65pp., https://quantis-intl.com/report/measuring-fashion-report/
7 Ellen MacArthur Foundation (2017), A New Textiles Economy: Redesigning Fashion’s Future, 148pp., http://www.ellenmacarthurfoundation.org/publications
8 Niinimäki et al., (2020) The Environmental Price of Fast Fashion, Nature Reviews Earth and Environment, 1 (4), pp.189-200
9 Quantis (2018), Kibbey J., Johnson D., McGill L., Pepper L.R., Eds., Measuring Fashion: Environmental Impact of the Global Apparel and Footwear Industries Study, 65pp., https://quantis-intl.com/report/measuring-fashion-report/
10 Textile Exchange (2019), Preferred Fiber and Materials Market Report 2019, 88pp., https://store.textileexchange.org/product/2019-preferred-fiber-materials-report/
11 Quantis (2018), Kibbey J., Johnson D., McGill L., Pepper L.R., Eds., Measuring Fashion: Environmental Impact of the Global Apparel and Footwear Industries Study, 65pp., https://quantis-intl.com/report/measuring-fashion-report/
12 Written Evidence Submitted by the London Textile Forum (SFI0044) in House of Commons Environmental Audit Committee (2019) Fixing Fashion: Clothing Consumption and Sustainability, House of Commons, London, 69pp., https://publications.parliament.uk/pa/cm201719/cmselect/cmenvaud/1952/1952.pdf, http://data.parliament.uk/WrittenEvidence/CommitteeEvidence.svc/EvidenceDocument/Environmental%20Audit/Sustainability%20of%20the%20fashion%20industry/Written/88459.html
13 Textile Exchange (2019), Preferred Fiber and Materials Market Report 2019, 88pp., https://store.textileexchange.org/product/2019-preferred-fiber-materials-report/
14 Canopy (2018) Canopy Style Five Year Anniversary Report https://canopyplanet.org/wp-content/uploads/2019/02/CanopyStyle-5th-Anniversary-Report.pdf
15 Global Fashion Agenda & The Boston Consulting Group (2017) Kerr, J., Landry, J., Pulse of the Fashion Industry, 138pp., https://globalfashionagenda.com/wp-content/uploads/2017/05/Pulse-of-the-Fashion-Industry_2017.pdf
16 Ellen MacArthur Foundation (2017), A New Textiles Economy: Redesigning Fashion’s Future, 148pp., http://www.ellenmacarthurfoundation.org/publications
17 Anguelov, N. The Dirty Side of the Garment Industry: Fast Fashion and its Negative Impact on Environment and Society (CRC, Taylor & Francis, 2015).
18 Quantis (2018), Kibbey J., Johnson D., McGill L., Pepper L.R., Eds., Measuring Fashion: Environmental Impact of the Global Apparel and Footwear Industries Study, 65pp., https://quantis-intl.com/report/measuring-fashion-report/
19 Global Fashion Agenda & The Boston Consulting Group (2017) Kerr, J., Landry, J., Pulse of the Fashion Industry, 138pp., https://globalfashionagenda.com/wp-content/uploads/2017/05/Pulse-of-the-Fashion-Industry_2017.pdf
20 Anguelov, N. The Dirty Side of the Garment Industry: Fast Fashion and its Negative Impact on Environment and Society (CRC, Taylor & Francis, 2015).
21 International Union for Conservation of Nature (2017) Boucher, J. Friot, D. Primary Microplastics in the Oceans: A Global Evaluation of Sources, Gland, Switzerland, 43pp., https://portals.iucn.org/library/node/46622
22 Eunomia (2016) Plastics in the Marine Environment, Bristol, UK, 13pp., www.eunomia.co.uk/reports-tools/plastics-in-the-marine-environment/
23 International Union for Conservation of Nature (2017) Boucher, J. Friot, D. Primary Microplastics in the Oceans: A Global Evaluation of Sources, Gland, Switzerland, 43pp., https://portals.iucn.org/library/node/46622
24 Walk Free Foundation (2018) Global Slavery Index 2018, https://www.globalslaveryindex.org/resources/downloads/
25 Fibre2Fashion (2018) ‘Man-made fibres falling out of fashion in the UK: Report’ https://www.fibre2fashion.com/news/apparel-news/man-made-fibres-falling-out-of-fashion-in-uk-report-244135-newsdetails.htm
26 Pesticide Action Network UK (2018) Ferrigno, S., Guadagnini R., & Tyrell K., Is Cotton Conquering its Chemical Addiction? A Review of Pesticide Use in Global Cotton Production, Brighton, UK, 76pp. https://www.pan-uk.org/cottons-chemical-addiction/
27 Water Footprint Network (2016) Safaya, S., Zhang, G., Mathews, R., Toward Sustainable Water Use in the Cotton Supply Chain, The Hague, Netherlands, 99pp. https://waterfootprint.org/media/downloads/Assessm_water_footprint_cotton_India.pdf
28 International Trade Centre (2011) Cotton and Climate Change: Impacts and Options to Mitigate and Adapt, Geneva, Switzerland, 32 pp. http://www.intracen.org/Cotton-and-Climate-Change-Impacts-and-options-to-mitigate-and-adapt/
29 Soil Association (2016) Farnworth, G., Cool Cotton: Organic Cotton and Climate Change, https://www.soilassociation.org/media/11662/coolcotton.pdf
30 Textile Exchange (2014) The Life Cycle Assessment of Organic Cotton Fiber: A Global Average, 83pp. https://store.textileexchange.org/product/life-cycle-assessment-of-organic-cotton/
31 Soil Association (2015) Cool Cotton: Organic Cotton and Climate Change 16pp., https://www.soilassociation.org/media/18947/cool-cotton-soil-association-report-2015.pdf
32 Pesticide Action Network UK (2018) Ferrigno, S., Guadagnini R., & Tyrell, K. “Is Cotton Conquering Its Chemical Addiction?”, PAN-UK, Brighton, UK, 76pp. https://www.pan-uk.org/site/wp-content/uploads/Cottons-chemical-addiction-FINAL-LOW-RES-2017.pdf
33 FAO & ICAC (2015) Measuring Sustainability in Cotton Farming Systems, Rome, Italy, 149pp. http://www.fao.org/3/a-i4170e.pdf
34 WRAP (2017) Valuing our Clothes: The Cost of UK Fashion, What is the impact of clothing? 54pp., https://wrap.org.uk/sustainable-textiles/valuing-our-clothes%20
35 Ellen Macarthur Foundation (2017) A New Textiles Economy: Redesigning Fashion’s Future, p. 18-21, https://www.ellenmacarthurfoundation.org/assets/downloads/publications/A-New-Textiles-Economy_Full-Report_Updated_1-12-17.pdf
36 Ibid.
37 European Environment Agency (2019) Textiles in Europe’s Circular Economy, 12pp., https://www.eea.europa.eu/themes/waste/resource-efficiency/textiles-in-europe-s-circular-economy
38 House of Commons Environmental Audit Committee (2019) Fixing Fashion: Clothing Consumption and Sustainability, House of Commons, London, 69pp., https://publications.parliament.uk/pa/cm201719/cmselect/cmenvaud/1952/1952.pdf
39 McKinsey & Company and Business of Fashion (2019) Amed, I., et al., The State of Fashion 2020: Navigating Uncertainty, New York, USA, 107pp., https://www.mckinsey.com/industries/retail/our-insights/the-state-of-fashion-2020-navigating-uncertainty
40 Hitwise (2018) The UK Fashion Report: Digital Challenges and Tactics, from Fast Fashion to Luxury, 18pp., https://www.hitwise.com/en/wp-content/uploads/sites/2/2019/01/UK_Fashion_Report_2018_Hitwise.pdf
41 Ellen MacArthur Foundation (2017), A New Textiles Economy: Redesigning Fashion’s Future, 148pp., http://www.ellenmacarthurfoundation.org/publications)
42 European Parliamentary Research Service (2019) Šajn, N., Environmental Impact of the Clothing Industry, 10pp., https://www.europarl.europa.eu/RegData/etudes/BRIE/2019/633143/EPRS_BRI(2019)633143_EN.pdf
43 House of Commons Environmental Audit Committee (2019) Fixing Fashion: Clothing Consumption and Sustainability, House of Commons, London, 69pp., https://publications.parliament.uk/pa/cm201719/cmselect/cmenvaud/1952/1952.pdf
44 Ibid.
45 Ibid.
46 United Nations Environment Programme (2019) Emissions Gap Report 2019, UNEP, Nairobi, Kenya, 81pp., https://www.unenvironment.org/resources/emissions-gap-report-2019
References

33
47 Quantis (2018), Kibbey J., Johnson D., McGill L., Pepper L.R., Eds., Measuring Fashion: Environmental Impact of the Global Apparel and Footwear Industries Study, 65pp., https://quantis-intl.com/report/measuring-fashion-report/
48 European Environment Agency (2019) Textiles in Europe’s Circular Economy, 12pp., https://www.eea.europa.eu/themes/waste/resource-efficiency/textiles-in-europe-s-circular-economy
49 Eunomia (2015) Hogg, D., Ballinger, A., The Potential Contribution of Waste Management to a Low Carbon Economy, Bristol, UK, 66pp., https://zerowasteeurope.eu/downloads/the-potential-contribution-of-waste-management-to-a-low-carbon-economy/
50 WRAP (2017) Valuing our Clothes: The Cost of UK Fashion, What is the impact of clothing? 54pp., https://wrap.org.uk/sustainable-textiles/valuing-our-clothes%20
51 House of Commons Environmental Audit Committee (2019) Fixing Fashion: Clothing Consumption and Sustainability, House of Commons, London, 69pp., https://publications.parliament.uk/pa/cm201719/cmselect/cmenvaud/1952/1952.pdf
52 ICAC Data Portal: https://www.icac.org/DataPortal/DataPortal?Units=Area&Year=2019/20%20for
53 Textile Exchange (2019), Preferred Fiber and Materials Market Report 2019, 88pp., https://store.textileexchange.org/product/2019-preferred-fiber-materials-report/
54 Ibid.
55 Ibid.
56 FAO & ICAC (2015) Measuring Sustainability in Cotton Farming Systems, Rome, Italy, 149pp. http://www.fao.org/3/a-i4170e.pdf
57 ICAC Data Portal: https://www.icac.org/DataPortal/DataPortal/?menuId=23
58 https://www.macrotrends.net/2533/cotton-prices-historical-chart-data
59 Textile Exchange (2019), Preferred Fiber and Materials Market Report 2019, 88pp., https://store.textileexchange.org/product/2019-preferred-fiber-materials-report/
60 Ibid.
61 Pesticide Action Network UK (2018) Ferrigno, S., Guadagnini R., & Tyrell K., Is Cotton Conquering its Chemical Addiction? A Review of Pesticide Use in Global Cotton Production, Brighton, UK, 76pp. https://www.pan-uk.org/cottons-chemical-addiction/
62 Soil Association (2019) Thirsty for fashion?: How Organic Cotton Delivers in a Water-Stressed World, London, UK, 23pp., https://www.soilassociation.org/media/19674/thirsty-for-fashion-soil-association-report.pdf
63 IEA Bioenergy (2004) Wood S. and Cowie A., A review of greenhouse gas emission factors for fertiliser production, 20pp. https://www.researchgate.net/publication/235704822_A_Review_of_Greenhouse_Gas_Emission_Factors_for_Fertiliser_Production
64 Soil Association (2019) Thirsty for fashion?: How Organic Cotton Delivers in a Water-Stressed World, London, UK, 23pp., https://www.soilassociation.org/media/19674/thirsty-for-fashion-soil-association-report.pdf
65 Carbon Trust (2012) Peters, G. et al, International Carbon Flows: Cotton (London, UK, 12pp.)
66 Sachchidanand, T., Pratap S., Rajkumari S.D., & Bhadouria R. “Influence of synthetic fertilizers and pesticides on soil health and soil microbiology” in Agrochemicals, Detection, Treatment and Remediation, Majeti Narasimha Vara Prasad (ed.), Butterworth-Heinemann, Oxford, 2020
67 Massah J., Azadegan, B. (2016) Effect of Chemical Fertilizers on Soil Compaction and Degradation. Agricultural Mechanization in Asia, Africa and Latin America, 47, pp. 44-50
68 WWF (2013) Roy, S., Dhar, M., Krishna P.V., May, R. Cutting Cotton Carbon Emissions: Findings from Warangal, India. New Delhi, India, 38pp. http://awsassets.wwfindia.org/downloads/wwf___cotton_carbon_emission.pdf
69 International Trade Centre (2011) ‘Cotton and Climate Change: Impacts and Options to Mitigate and Adapt’, Geneva, Switzerland, 32pp., http://www.intracen.org/Cotton-and-Climate-Change-Impacts-and-options-to-mitigate-and-adapt/
70 Ibid.
71 WWF (2013) Roy, S., Dhar, M., Krishna P.V., May, R. Cutting Cotton Carbon Emissions: Findings from Warangal, India. New Delhi, India, 38pp. http://awsassets.wwfindia.org/downloads/wwf___cotton_carbon_emission.pdf
72 USDA Foreign Agricultural Service (2018) Farrell, R., Australia: Cotton and Products Annual, https://apps.fas.usda.gov/newgainapi/api/report/downloadreportbyfilename?filename=Cotton%20and%20Products%20Annual_Canberra_Australia_3-28-2018.pdf
73 https://cottonaustralia.com.au/industry-overview
74 Ibid.
75 Cotton Australia & Cotton Research and Development Council Australia (2020) Cotton Sustainability Report, 31pp. https://www.crdc.com.au/publications/australian-cotton-sustainability-report
76 Ibid.
77 USDA Foreign Agricultural Service (2018) Australia Cotton and Products Annual https://apps.fas.usda.gov/newgainapi/api/report/downloadreportbyfilename?filename=Cotton%20and%20Products%20Annual_Canberra_Australia_3-28-2018.pdf
78 https://cottonaustralia.com.au/cottons-water-use
79 Climate Council (2019) Steffen, W., et al. Dangerous Summer: Escalating Heat, Fire and Drought Risk, 38pp., https://www.climatecouncil.org.au/resources/dangerous-summer-escalating-bushfire-heat-drought-risk/
80 Ibid.
81 Bureau of Meteorology, Annual Climate Statement, 2019: http://www.bom.gov.au/climate/current/annual/aus/
82 USDA Foreign Agricultural Service: Australia Cotton and Products Annual, April 2018 https://apps.fas.usda.gov/newgainapi/api/report/downloadreportbyfilename?filename=Cotton%20and%20Products%20Annual_Canberra_Australia_3-28-2018.pdf
83 Bureau of Meteorology, Annual Climate Statement, 2019: http://www.bom.gov.au/climate/current/annual/aus/
84 Climate Council (2019) Steffen, W., et al. Dangerous Summer: Escalating Heat, Fire and Drought Risk, 38pp., https://www.climatecouncil.org.au/resources/dangerous-summer-escalating-bushfire-heat-drought-risk/
85 Ibid.
86 Abatzoglou JT and Williams AP (2016) Impact of anthropogenic climate change on wildfire across western US forests, Proceedings of the National Academy of Sciences, 113(42), pp.1170–1177
87 Dowdy AJ and Pepler A (2018) Pyroconvection risk in Australia: Climatological changes in atmospheric stability and surface fire weather conditions, Geophysical Research Letters, 45
88 Tiernan, Finbar; O'Mallon, Eamonn (10 January 2020). "Australia's 2019–20 bushfire season". The Canberra Times. https://www.canberratimes.com.au/story/6574563/australias-2019-20-bushfire-season/
89 Climate Council (2019) This is Not Normal: Climate Change and Escalating Bushfire Risk, 15pp., https://www.climatecouncil.org.au/wp-content/uploads/2019/11/CC-nov-Bushfire-briefing-paper.pdf
90 https://www.sydney.edu.au/news-opinion/news/2020/01/08/australian-bushfires-more-than-one-billion-animals-impacted.html
91 Ibid.
92 The Lancet (2020) Yu, P. et al. Bushfires in Australia: a serious health emergency under climate change, https://www.thelancet.com/pdfs/journals/lanplh/PIIS2542-5196(19)30267-0.pdf
93 Ibid.
94 Global Fire Emissions Data: https://www.globalfiredata.org/
95 Copernicus Atmospheric Monitoring Service: https://atmosphere.copernicus.eu/copernicus-year-fire
96 Australian Bureau of Agricultural and Resource Economics and Sciences (2019) Australian Crop Report: https://www.agriculture.gov.au/sites/default/files/documents/austcroprrt20191203_v1.0.0.pdf
97 Ibid.
98 The World Economic Forum (2019) Collins, A., et al. The Global Risks Report 2019, Geneva, Switzerland, 107pp. http://www3.weforum.org/docs/WEF_Global_Risks_Report_2019.pdf
99 Ibid.
100 Hoekstra, A., and Chapagain, A., (2008) Globalization of Water: Sharing the Planet’s Freshwater Resources, Blackwells, Oxford, 224pp.
101 Soil Association (2019) Thirsty for fashion?: How Organic Cotton Delivers in a Water-Stressed World, London, UK, 23pp., https://www.soilassociation.org/media/19674/thirsty-for-fashion-soil-association-report.pdf
102 Water Footprint Network (2016) Safaya, S., Zhang, G., Mathews, R., Towards Sustainable Water Use In the Cotton Supply Chain, The Hague, The Netherlands, 99pp., https://waterfootprint.org/media/downloads/Assessm_water_footprint_cotton_India.pdf

34
103 FAO & ICAC (2015) Measuring Sustainability in Cotton Farming Systems, Rome, Italy, 149pp. http://www.fao.org/3/a-i4170e.pdf
104 Howell, T.A., Evett, S.R., Tolk, J.A. & Schneider, A.D. (2004) Evapotranspiration of full-, deficit-irrigated, and dryland cotton on the Northern Texas High Plains. Journal of Irrigation and Drainage Engineering, 130 (4). pp.277–285
105 Grismer, M.E. (2002) Regional cotton lint yield, etc and water value in Arizona and California. Agricultural Water Management, 54. pp.227–242.
106 Ibragimov, N., Evet, S.R., Esanbekov, Y., Kamilov, B., Mirzaev, L. & Lamers, J.P.A. (2007) Water use efficiency of irrigated cotton in Uzbekistan under drip and furrow irrigation. Agricultural Water Management, 90. pp. 112–120
107 Water Footprint Network (2016) Safaya, S., Zhang, G., Mathews, R., Towards Sustainable Water Use In the Cotton Supply Chain, The Hague, The Netherlands, 99pp., https://waterfootprint.org/media/downloads/Assessm_water_footprint_cotton_India.pdf
108 Pfister, S., Bayer, P., Koehler, A. & Hellweg, S. (2011) Projected water consumption in future global agriculture: Scenarios and related impacts. Science of the Total Environment, 409 (20). pp. 4206–4216.
109 Cotton Incorporated (2011) Life Cycle Assessment of Cotton Fiber and Fabric, 147pp. https://cottoncultivated.cottoninc.com/research_reports/2012-cotton-lca-full-report/
110 FAO & ICAC (2015) Measuring Sustainability in Cotton Farming Systems, Rome, Italy, 149pp. http://www.fao.org/3/a-i4170e.pdf
111 House of Commons Environmental Audit Committee (2019) Fixing Fashion: Clothing Consumption and Sustainability, House of Commons, London, 69pp., https://publications.parliament.uk/pa/cm201719/cmselect/cmenvaud/1952/1952.pdf
112 Mekonnen, M. M. and Hoekstra A. Y. (2010). The green, blue and grey water footprint of crops and derived crop products. Value of Water Research Report Series No. 47. Delft, The Netherlands.
113 Weinzettel, J. & Pfister, S. (2019) International trade of global scarce water use in agriculture: Modelling on watershed level with monthly resolution. Ecological Economics, 159, pp.301–311
114 NITI Aayog (2018) Composite Water Management Index, 177pp., https://niti.gov.in/writereaddata/files/document_publication/2018-05-18-Water-index-Report_vS6B.pdf
115 Ibid.
116 Institute for Water Education (2005) Hoekstra, A., et al., The Water Footprint of Cotton Consumption, Delft, The Netherlands, 39pp., https://waterfootprint.org/media/downloads/Report18.pdf
117 Textile Network, ‘Water sustainability in Bangladesh’, https://textile-network.com/en/Fashion/Water-sustainability-in-Bangladesh
118 Qadir, M., Noble, A.D., Qureshi, A.S., Gupta, R.K., Yuldashev, T. & Karimov, A. (2009). Salt-induced land and water degradation in the Aral Sea basin: A challenge to sustainable agriculture in Central Asia. Natural Resources Forum, 33, pp.134–14
119 Dinar, A. (1998) Irrigated agriculture and the environment: Problems and issues in water policy. In OECD (eds.) Sustainable management of water in agriculture: Issues and policies, pp. 41–56
120 FAO & ICAC (2015) Measuring Sustainability in Cotton Farming Systems, Rome, Italy, 149pp., http://www.fao.org/3/a-i4170e.pdf
121 Ibid.
122 Roos, S., Jönsson, C., Posner, S., Arvidsson, R. & Svanström, M. (2019) An Inventory Framework for Inclusion of Textile Chemicals in Life Cycle Assessment. The International Journal of Life Cycle Assessment, 24. pp. 838–847
123 Chemsec (2017), Textiles Come With a Toxic Footprint, https://textileguide.chemsec.org/find/textiles-come-with-a-toxic-footprint/
124 KEMI (2016) Hazardous Chemical Substances in Textiles: Proposals for Risk Management Measures, Stockholm, Sweden, 65pp., https://www.kemi.se/global/rapporter/2016/report-8-16-hazardous-chemical-substances-in-textiles.pdf
125 Davies, A., (2014) An Evaluation of the Test Methods Used for Assessing Durable Water Repellent Fabrics Within the outdoor industry, 38pp. https://pdfs.semanticscholar.org/c8be/8da1755644ea244665808bd9073b8397f6e5.pdf
126 Steenland, K., Fletcher, T., Savitz, D.A. (2010). Epidemiologic evidence on the Health Effects of Perfluorooctanoic Acid (PFOA). Environmental Health Perspectives, 118 (8), pp. 1100-1108.
127 Ellen MacArthur Foundation (2017), A New Textiles Economy: Redesigning Fashion’s Future, 148pp., http://www.ellenmacarthurfoundation.org/publications
128 United States Environmental Protection Agency, ‘Introduction to Biotechnology Regulation for Pesticides’, https://www.epa.gov/regulation-biotechnology-under-tsca-and-fifra/introduction-biotechnology-regulation-pesticides
129 Hagenbucher, S. et al. (2013) ‘Pest Trade-Offs in Technology: Reduced Damage by Caterpillars in BT Cotton Benefits Aphids’, Proceedings of the Royal Society B, 280, http://rspb.royalsocietypublishing.org/content/280/1758/20130042
130 Goulson, D. (2013). ‘An Overview of the Environmental Risks Posed by Neonicotinoid Insecticides’. Journal of Applied Ecology, 50 (4), pp.977–987, https://besjournals.onlinelibrary.wiley.com/doi/full/10.1111/1365-2664.12111
131 Fabrick, J.A., et al., (2015) ‘Multi-Toxin Resistance Enables Pink Bollworm Survival on Pyramided Bt Cotton’, Scientific Reports, Nature Scientific Reports, pp. 1-13
132 Soil Association (2017) Compson, S., Failed Promises: The Rise and Fall of GM Cotton in India, 22pp., https://www.soilassociation.org/media/13510/failed-promises-e-version.pdf
133 Ibid.
134 Louis Bolk Institute (2015), Seed availability for Non-GM Cotton Production: An Explorative Study, Wageningen, The Netherlands, 30pp., https://orgprints.org/28910/1/Seed-Availability-for-non-GM-Cotton-Production_final_30042015-LouisBolkInstitute.pdf
135 Ellen MacArthur Foundation (2017), A New Textiles Economy: Redesigning Fashion’s Future, 148pp., http://www.ellenmacarthurfoundation.org/publications
136 Ibid.
137 House of Commons Environmental Audit Committee (2019) Fixing Fashion: Clothing Consumption and Sustainability, House of Commons, London, 69pp., https://publications.parliament.uk/pa/cm201719/cmselect/cmenvaud/1952/1952.pdf
138 New Jersey Department of Health and Senior Services (2004) Hazardous substance fact sheet: Antimony trioxide 6pp., https://www.nj.gov/health/eoh/rtkweb/documents/fs/0141.pdf
139 International Union for Conservation of Nature (2017) Boucher, J. Friot, D. Primary Microplastics in the Oceans: A Global Evaluation of Sources, Gland, Switzerland, 43pp., https://portals.iucn.org/library/node/46622
140 Eunomia (2016) Plastics in the Marine Environment, Bristol, UK, 13pp., www.eunomia.co.uk/reports-tools/plastics-in-the-marine-environment/
141 International Union for Conservation of Nature (2017) Boucher, J. Friot, D. Primary Microplastics in the Oceans: A Global Evaluation of Sources, Gland, Switzerland, 43pp., https://portals.iucn.org/library/node/46622
142 House of Commons Environmental Audit Committee (2019) Fixing Fashion: Clothing Consumption and Sustainability, House of Commons, London, 69pp., https://publications.parliament.uk/pa/cm201719/cmselect/cmenvaud/1952/1952.pdf
143 National Federation of Women’s Institutes (2018) Page, S., In a Spin: How Our Laundry is Contributing to Plastic Pollution, London, UK, 18pp., https://www.thewi.org.uk/__data/assets/pdf_file/0007/327418/WI_EndPlasticSoup_Report_Stakeholders.pdf
144 Lenzing Investor Presentation (2019) Innovative By Nature, 87pp.
145 Textile Exchange (2019), Preferred Fiber and Materials Market Report 2019, 88pp., https://store.textileexchange.org/product/2019-preferred-fiber-materials-report/
146 Water Footprint Network (2017) Freitas, A., Mathews, R., Viscose Fibre Sustainability: An Assessment of Sustainability Issues, The Hague, Netherlands, 47pp., https://waterfootprint.org/media/downloads/Viscose_fibres_Sustainability.pdf
147 World Health Organisation (2000) Air Quality Guidelines: Carbon Disulfide, Second Edition http://www.euro.who.int/en/health-topics/environment-and-health/air-quality/publications/pre2009/who-air-quality-guidelines-for-europe,-2nd-edition,-2000-cd-rom-version
148 Water Footprint Network (2017) Freitas, A., Zhang, G., Mathews, R., Water Footprint Assessment of Polyester and Viscose and Comparison to Cotton, The Hague, Netherlands, 62pp. https://waterfootprint.org/media/downloads/WFA_Polyester_and__Viscose_2017.pdf
149 Ibid.
150 SEI (2005) Cherrett N, Barrett J, Clemett A, Chadwick M, Chadwick MJ., Ecological Footprint and Water Analysis of Cotton, Hemp and Polyester, Stockholm, Sweden, 38pp. https://mediamanager.sei.org/documents/Publications/SEI-Report-EcologicalFootprintAndWaterAnalysisOfCottonHempAndPolyester-2005.pdf
151 MIT (2015) Kirchain, R., Olivetti, E., Reed Miller, T. & Greene, S., Sustainable Apparel Materials, Cambridge, Massachusetts, USA, 34pp., https://matteroftrust.org/wp-content/uploads/2015/10/SustainableApparelMaterials.pdf

35
152 Joint Research Council (2014) Beton, A., et al., Environmental Improvement Potential of Textiles, JRC, Seville, Spain, 185pp., https://publications.jrc.ec.europa.eu/repository/bitstream/JRC85895/impro%20textiles_final%20report%20edited_pubsy%20web.pdf
153 Textile Exchange (2020) Organic Cotton Market Report 2020, 89pp. https://textileexchange.org/wp-content/uploads/2020/08/Textile-Exchange_Organic-Cotton-Market-Report_2020-20200810.pdf
154 Ibid.
155 Ibid.
156 Ibid.
157 Ibid.
158 Ibid.
159 GOTS (2019) ‘Global Organic Textile Standard (GOTS) New Figures show continued significant growth’, https://global-standard.org/images/stories/pressreleases/Annual_Press_Release_2019/GOTS_Press_Release_-_Japan_ENNew_figures_show_continued_significant_growth.pdf
160 Slotyuk, L. (2013) Life Cycle Assessment of Organic Cotton Cultivation in India. MSc Thesis. Universität Hohenheim.
161 Textile Exchange and PE International (2014) Life Cycle Assessment (LCA) of organic cotton: A global Average, 83pp., https://store.textileexchange.org/product/life-cycle-assessment-of-organic-cotton/
162 Ibid.
163 International Trade Centre (2011) ‘Cotton and Climate Change: Impacts and Options to Mitigate and Adapt’, ITC, Geneva, Switzerland, 32pp., http://www.intracen.org/Cotton-and-Climate-Change-Impacts-and-options-to-mitigate-and-adapt/
164 Textile Exchange and PE International (2014) Life Cycle Assessment (LCA) of organic cotton: A global Average, 83pp., https://store.textileexchange.org/product/life-cycle-assessment-of-organic-cotton/
165 Gattinger, A., Mullera, A., Haenia, M., Skinner, C., Fliessbach, A., Buchmann, N., Mädera, P., Stolzea, M., Smith, Scialabba, N., and Niggli, U. (2012) ‘Enhanced top soil carbon stocks under organic farming’ Proceedings of the National Academy of Sciences 109 (44) 18226 – 18231
166 Soil Association (2015) Cool Cotton: Organic Cotton and Climate Change 16pp., https://www.soilassociation.org/media/18947/cool-cotton-soil-association-report-2015.pdf
167 Shah, P. et al. (2018) “Life Cycle Assessment of Organic, BCI and Conventional Cotton: A Comparative Study of Cotton Cultivation Practices in India”, in Design Sustainable Technologies, Products and Policies, Benetto E., Gericke, K., Guiton, M. (Eds), pp.67-77, https://link.springer.com/chapter/10.1007/978-3-319-66981-6_8
168 Helvetas (2017) Kaegi S. et al., Organic Cotton Experiences – Learnings and recommendations from Mali, Burkina Faso and Kyrgzystan. Zurich, Switzerland, 171pp. https://www.helvetas.org/Publications-PDFs/OrganicCottonExperiences_2017.pdf
169 United States Environmental Protection Agency (EPA), ‘Greenhouse Gas Equivalencies Calculator’, https://www.epa.gov/energy/greenhouse-gas-equivalencies-calculator
170 Textile Exchange and PE International (2014) Life Cycle Assessment (LCA) of organic cotton: A global Average, 83pp., https://store.textileexchange.org/product/life-cycle-assessment-of-organic-cotton/
171 Ibid.
172 Soil Association (2016) Farnworth, G., Cool Cotton: Organic Cotton and Climate Change, 16pp., https://www.soilassociation.org/media/11662/coolcotton.pdf
173 Forster D., Andres C., Verma R., Zundel C., Messmer M.M., Mäder P., (2013) Yield and Economic Performance of Organic and Conventional Cotton-Based Farming Systems – Results from a Field Trial in India. PLoS ONE 8(12)
174 Helvetas (2017) Kaegi S. et al., Organic Cotton Experiences – Learnings and recommendations from Mali, Burkina Faso and Kyrgzystan. Zurich, Switzerland, 171pp. https://www.helvetas.org/Publications-PDFs/OrganicCottonExperiences_2017.pdf
175 Ibid.
176 Kering & Textile Exchange, A World Beyond Certification: A Best Practises in Organic Cotton’, 65pp., https://store.textileexchange.org/wp-content/uploads/woocommerce_uploads/2019/11/Textile-Exchange_Organic-Cotton-Market-Report_2019_3.pdf
177 Ibid.
178 Textile Exchange (2019) Organic Cotton Market Report 2019, 80pp., https://store.textileexchange.org/wp-content/uploads/woocommerce_uploads/2019/11/Textile-Exchange_Organic-Cotton-Market-Report_2019_3.pdf
179 Ibid.
180 Cotton Connect, ‘About us,’ http://cottonconnect.org/about-us
181 Ibid.
182 Cotton Connect, ‘How we work,’ accessed: 29.11.19, http://cottonconnect.org/how-we-work
183 Cotton Connect (2017) Planting The Seed: The Role Of Organic In Creating A Sustainable Cotton Supply Chain, 17pp., http://cottonconnect.org/wp-content/uploads/the-role-of-organic-cotton-in-creating-a-sustainable-cotton-supply-chain.pdf
184 Ibid.
185 Textile Exchange, ‘Organic Cotton Market Report 2019 Initiative Insights’, https://textileexchange.org/ocmr-2019-initiative-insights/
186 Cotton Connect (2017) Planting The Seed: The Role Of Organic In Creating A Sustainable Cotton Supply Chain, 17pp., http://cottonconnect.org/wp-content/uploads/the-role-of-organic-cotton-in-creating-a-sustainable-cotton-supply-chain.pdf
187 Cotton Connect, Women in Cotton: Findings from a Gendered Value Chain Mapping’, London, UK, 8pp., http://cottonconnect.org/women-in-cotton-findings-from-a-gendered-value-chain-mapping
188 Climate Works & Sum of Us (2018) Closing Europe’s Carbon Loophole in Climate Policy, 74pp., https://www.climateworks.org/report/europes-carbon-loophole/
189 Statista (2020) Apparel Market in Europe, 64pp. https://www.statista.com/study/27600/apparel-market-in-europe-statista-dossier/
190 KGM & Associates, Global Efficiency Intelligence, Climate Works (2018) The Carbon Loophole in Climate Policy, 64pp., https://www.globalefficiencyintel.com/carbon-loophole-in-climate-policy
191 Ibid.
192 Climate Works & Sum of Us (2018) Closing Europe’s Carbon Loophole in Climate Policy, 74pp., https://www.climateworks.org/report/europes-carbon-loophole/
193 European Commission (2019) Communication from the Commission to the European Parliament, the European Council, the Council, the European Economic and Social Committee and the Committee of the Regions. Brussels, Belgium, 24pp., https://eur-lex.europa.eu/resource.html?uri=cellar:b828d165-1c22-11ea-8c1f-01aa75ed71a1.0002.02/DOC_1&format=PDF
194 https://www.carbontax.org/wp-content/uploads/2007/09/stiglitz-_-a-new-agenda-for-global-warming-_-economists-voice-_-july-2006.pdf
195 Nature (2018) Beat Protectionism and Emissions at a Stroke: https://www.nature.com/articles/d41586-018-05708-7?sf193755110=1
196 Pauwelyn, J. (2012) “Carbon Leakage Measures and Border Tax Adjustments under WTO Law”, in D. Prevost and G. Van Calster (eds.), Research Handbook on Environment, Health and the WTO (Edward Elgar, Cheltenham, 2012)
197 Mehling M, van Asselt, H., Das, K., Droege, S., (2019) Designing Border Carbon Adjustments for Enhanced Climate Action. The American Society of International Law, 113 (3), pp. 433-481
198 European Commission (2020) Communication from the Commission to the European Parliament, The Council, The European Economic and Social Committee and the Committee of the Regions: A New Circular Economy Action Plan. https://eur-lex.europa.eu/legal-content/EN/TXT/?uri=COM%3A2020%3A98%3AFIN
199 European Commission (2019) Communication from the Commission to the European Parliament, The Council, The European Economic and Social Committee and the Committee of the Regions: The European Green Deal. 24 pp. https://eur-lex.europa.eu/resource.html?uri=cellar:b828d165-1c22-11ea-8c1f-01aa75ed71a1.0002.02/DOC_1&format=PDF
200 https://ec.europa.eu/clima/policies/strategies/2050_en
201 European Clothing Action Plan (2017) European Textiles & Workwear Market: The role of Public Procurement in making textiles circular. 65pp. http://www.ecap.eu.com/wp-content/uploads/2016/09/ECAP-Workwear-Report-Pt-1-def-final.pdf
202 Fashion Industry Charter for Climate Change, 7pp, https://unfccc.int/sites/default/files/resource/Industry%20Charter%20%20Fashion%20and%20Climate%20Action%20-%2022102018.pdf

36
EJF, 1 Amwell Street, London, EC1R 1UL, United Kingdom Tel: +44 (0) 207 239 3310 | Email: [email protected] www.ejfoundation.org | Registered charity, No. 1088128


![“Justice needs to be justified in terms of lives,” adding that “the [international] criminal justice system is isolated from the moral consequences of.](https://static.fdocuments.in/doc/165x107/56649cce5503460f94998de3/justice-needs-to-be-justified-in-terms-of-lives-adding-that-the-international.jpg)