
Moore’s Law and Network Optimization
44
1 Moore’s Law and Network Optimization Constantine D. Polychronopoulos University of Illinois at Urbana-Champaign Onassis Foundation Science Lecture Series 2008 Computer Science ITE - Crete July 2008
Transcript of Moore’s Law and Network Optimization

1
Moore’s Law and Network Optimization
Constantine D. PolychronopoulosUniversity of Illinois at Urbana-Champaign
Onassis Foundation Science Lecture Series 2008 Computer ScienceITE - CreteJuly 2008

2
Moore’s Law: Guiding IC and processor evolution for 40+ years
Capacity Speed (latency)Logic 2x in 3 years 2x in 3 yearsDRAM 4x in 3 years 2x in 10 yearsDisk 4x in 3 years 2x in 10 years
• Popular version: –Double CPU performance every 18 months

3
Tremendous impact on society• Mapping of human genome • Weather prediction and climate change
monitoring• Speech synthesis, AI applications, etc• Other Grand Challenge/NAE applications…
• … the above notwithstanding, what’s the impact of Moore’s Law (other than forcing us to spend a lot of money) on your and my experience using computers?

4
Moore’s Law versus User Experience• What is user experience?
The response/latency perceived by a user on a given application:
- web page download- file transfer, VOD- compilation task- IM - electronic games- VoIP- streaming media - …

5
Moore’s Law Paradox
User experience remains constant or improves marginally according to a step function
• Why? – Software layering & interoperability– Component, modular design => layers of libraries– Increasing application dimensioning– New, higher quality content (media) and interfaces– Complex HW, more difficult to fully utilize– Inefficient ways of writing software!
6
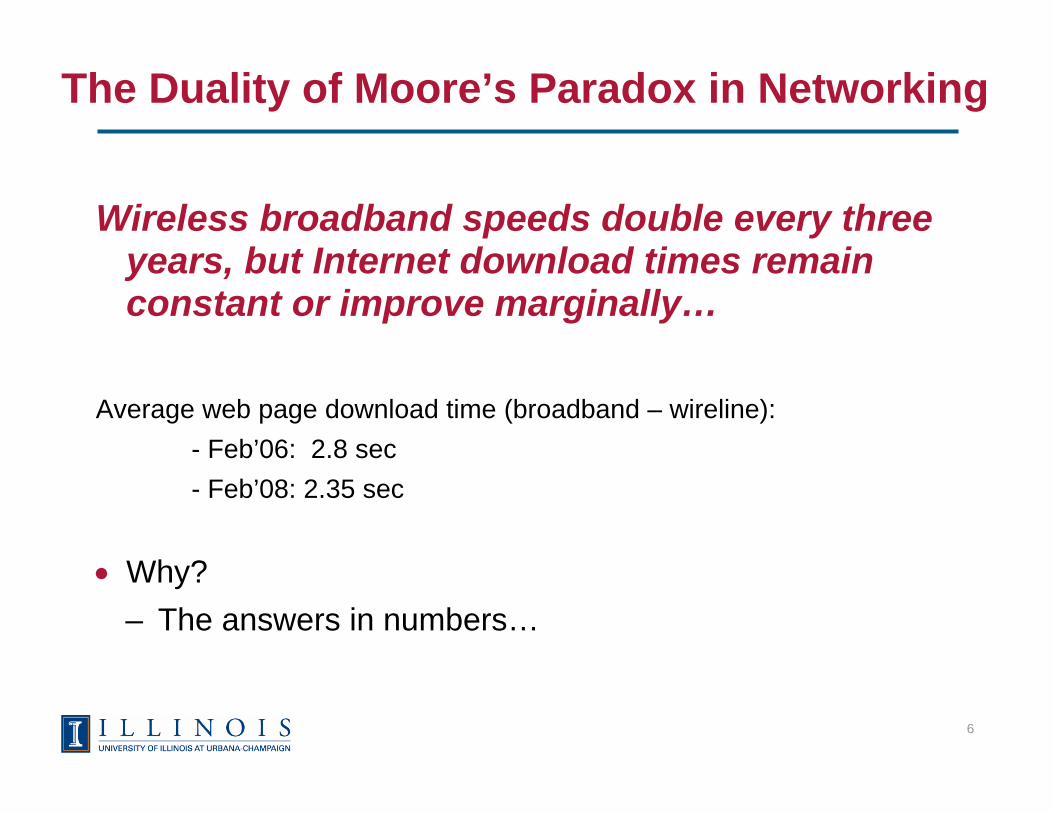
The Duality of Moore’s Paradox in Networking
Wireless broadband speeds double every three years, but Internet download times remain constant or improve marginally…
Average web page download time (broadband – wireline):- Feb’06: 2.8 sec- Feb’08: 2.35 sec
• Why? – The answers in numbers…

7
Broadband Internet - Performance Trends • Web pages are composed of XHTML container
objects (CO) and external objects (EO): images, video, audio, external CSS and JavaScript files
• Average web page has grown by 22x in the last 10 years – quadrupled from 2003-2007– Average page size close to 400KB– Average number of objects to 55/page– Top 1000 web pages grew by 26% 12/06-12/07

8
Key Metrics - 2007 (Cont’.)• JavaScript: 89% of web pages used the script
element:– Avrg no. of external scripts: 7– Avrg size of external script: 8.9KB– Total avrg script size: 69KB
• Use of CSS: 83% used the link tag and 55% used the style tag. Avrg size of external style sheets was 6.6KB. Total avrg style size was 15.2KB
• Use of images: 92% of web pages use them

9
Typical image objects in Web pages
Image Encoding Frequency 2006 Frequency 2007GIF 77.9% 84.6%JPEG 55.8% 64.5%PNG 7.2% 32.2%BMP 0.8%
Average aggregate graphic view area in a web page: 221X221 pixels[Gonzalez-Canete, Casilari, & Trivino-Cabrera, 2007]

10
Average Web page size: tripled 2003-2007

11
Size and number of objects growth

12
And the “bad” news…• Use of streaming media on the Web grew by
more than 100% each year from 2003-2007• In the period 2000-05 the total volume of
streaming media files stored on the Web grew by more than 600%
• More than 87% of all streaming media is abandoned by users within 10 seconds of session initiation (wasting more than 20% of server bandwidth)
• YouTube: Only 3% of server responses are for video, but account for over 98.6% of the bytes transferred

13
More video traffic metrics• Over 40% of business users experienced quality
degradation with videos over 30secs (re-buffering, stream switching, video cancelation etc).
• As broadband penetration increases so does video size, bit rate and duration.
• Median bit rate of web videos grew from 200Kbps in 2005 to 328Kbps on YouTube in 2007.
– Median video file size at over 63MB in 2007– Average YouTube video size was 10MB in ’07 with
65K new videos added every day

14
Video content growth: Average video object
Duration ≠ Size

15
Aggregate data traffic growth in WWANs• Europe and North America networks experience a
15-20% growth month over month or more than 3x compounded annually!
– What is even more impressive is the slop of growth continues to grow…i.e., exponential growth
• Current response: Ad hoc - no good solution– Block any non-HTTP traffic– Throttle downloads and streaming traffic to a crawl
• Projection: Over 80% of all Internet traffic will be streaming media by 2015 … or sooner?

16
What does this all mean?• Latency due to object overhead now dominates
most web page delays• Narrowband users (ISDN) are experiencing a
slowdown• Broadband users have experienced a marginal
improvement with average download time decreasing from 2.8sec in 2/06 to 2.35sec in 2/08 (KB40 – Keynote Business 40 Internet Performance Index) [Berkowitz & Gonzalez 2008]
• As video applications become of age, bandwidth will become a scarce resource
17
An Imperative for Network Optimization• We have invested in code optimization and
compilers since the early days of computers• Computational and memory optimization has
been the fabric of algorithms and complexity theory
• But how about (Wireless) Network Optimization?– Limited success in transport protocols (TCP)– Niche use of WWANs (circuit switched voice in
early cellular networks)– The world is changing rapidly and high
bandwidth “pipes” can’t keep up

18
The cost factor: Network Provisioning• Cost of wireless/cellular networks measures in
the $$ billions (spectrum, infrastructure, operations)
– Average of $0.20 per MB transported
• Provisioning around peak usage patterns• Over-provisioned networks are becoming
congested with the introduction of wireless broadband
– Dropped calls & connections– Long latencies– Unnecessary limitations on usage

19
Network Optimization• Affects every aspect of the cellular network
architecture: – Radio spectrum opimization (OFDM)– Physical link layer – IP layer– Transport protocol layer – Application layer
• Standards specifications bodies– IEEE, ITU, IETF, 3GPP

20
Abstraction of Wireless Wide Area Networks
Optimization function

21
Protocol Stacks – that was yesterday: toward all IP

22
Transparency of Optimization is Important
ServerClient
TCP
socketSocket
Interface
IP
TCP
socketSocket
Interface
IP
TCP
Socket
MobileCore
NetworkClient Gateway
Internet
Classifier
Interface
Server
Optimization

23
How Optimization Works: Bearer Layer Agnostic
Network Operator’s IP Services Core
$500M – $10B Infrastructure
Internet

24
384 Kbps Unoptimized
UMTS
How Optimization Works: Bearer Layer Agnostic

25
384 Kbps Unoptimized
UMTS
How Optimization Works: Bearer Layer Agnostic
1Mbps Optimized

26
1.8 Mbps Unoptimized
HSDPA
How Optimization Works: Bearer Layer Agnostic

27
1.8 Mbps Unoptimized
Unoptimized Optimized
HSDPA
How Optimization Works: Bearer Layer Agnostic
3.6Mbps Optimized

28
Example: Unoptimized Web Page Download
JavaScript 2
HTMLDNS
Web
Pag
e O
bjec
t Ret
rieva
l
Unoptimized
JavaScript 1DNS
Image 8
Image 7
Image 6
Image 5
Image 4
Image 3
Image 2
Image 1
Image 10
Image 9
Time– Page Done

29
JavaScript 2
JavaScript 1DNS
Image 8
Image 7
Image 6
Image 5
Image 4
Image 3
Image 2
Image 1
Image 10
Image 9
HTML
With Universal Application Compression,
DNS
Web
Pag
e O
bjec
t Ret
rieva
l
Universal Application Compression makes objects smaller…
JS 2
HTML
I 8
I 7
I 6
I 5
I 4
I 3
I 2
I 1
I 10
I 9
JS 1DNS
TimeUnoptimized– Page Done

30
With Dynamic Optimization
HTMLDNS
Web
Pag
e O
bjec
t Ret
rieva
l
JS 1DNS
JS 2
I 8
I 7
I 6
I 5
I 4
I 3
I 2
I 1
I 10
I 9
Compression
Smaller objects download faster…
… average speed-up of 2x (1.5x to 4x)
TimeUnoptimized– Page Done

31
Performance Gain
HTMLDNS
Web
Pag
e O
bjec
t Ret
rieva
l
Compression
Objects are retrieved in parallel and don’t need to be in order…
JS 2
JS 1DNS
I 8
I 7
I 6
I 5
I 3
I 2
I 1
I 10
I 9
MDI-1
I 4
TimeUnoptimized
… average speed-up of 3x (2x to 7x)
– Page Done

32
With Object Prediction
HTMLDNS
Web
Pag
e O
bjec
t Ret
rieva
l
Compression
Client-Based Object Prediction: Objects are requested and retrieved earlier…
MDI-1
JS 1DNS
I 8
I 7
I 6
I 5
I 4
I 3
I 2
I 1
I 10
I 9
JS 2
MDI-2Time
Unoptimized
… average speed-up of 4x (2.5x to 10x)
– Page Done

33
High-Speed InternetWireless Network
LocalServer
CentralServer
AdServer
Step 1: Set up the connection
In practice, CNN has more than 75 objects on 9 servers.For simplicity, here we show only 12 objectson 3 servers.
Image
Image
Image
Image
Image
Image
Image
Image Image Image
Image
Image
Image
Standard HTTP in Wireless: First Access

34
High-Speed InternetWireless Network
Standard HTTP in Wireless: First Access
LocalServer
CentralServer
AdServer
Step 1: Set up the connection
In practice, CNN has more than 75 objects on 9 servers.For simplicity, here we show only 12 objectson 3 servers.
Image
Image
Image
Image
Image
Image
Image
Image Image Image
Image
Image
Image
Image
Image
Image
Image
Image
Image
Image
Image Image Image
Image
Image
Image
ImageImage
Image
Image
Image
Image
Image
ImageImage
Image Image Image
Image

35
High-speed InternetWireless Network
LocalServer
CentralServer
AdServer
OSNOSN
With Dynamic Interleaving, web sites download 3 to 10 times faster
Image
Image
Image
Image
Image
Image
Image
Image Image Image
Image
Image
Image
Image
Image
Image
Image
Image
Image
Image
Image Image Image
Image
Image
Image
ImageImage
Image
Image
Image
Image
Image
ImageImage
Image Image Image
Image
Dynamic Interleaving

36
Sources and Effect of Clientless Optimization
Local cacheJavaScript/CSS in-liningIncreased number ofsimultaneous HTTP requestsMulti-part optimization
End-to-End Latency Reduction Data Reduction
• Gzip compression of HTML• Lossy image reduction (and
other multimedia types)• Remove non-functional data
from HTML/Java-scripts/CSS• Aggressive caching in
browser (reduce latency too)

37
Performance Improvements
20-Second Bar
0
20
40
60
80
100
120
Banking Travel Shopping News Info Sports
Unoptimized Optimized
Seconds
Type of Web Site Downloaded

38
0
1
2
3
4
5
6
7
8
9
10
Banking Travel Shopping News Info Sports
Speedup Factor
Type of Web Site Downloaded
Performance Improvements

39
Increase in Network Efficiency
72%
74%
76%
78%
80%
82%
84%
86%
88%
90%
92%
Banking Travel Shopping News Info Sports
Data Reduction
Type of Web Site Downloaded

40
Reduction of 3G Network LatencySeconds Until Done
Type of Web Site Downloaded
0
10
20
30
40
50
60
Gaming News Banking Reference Portal
Unoptimized
Optimized

41
QUANTITATIVE QUALITATIVE
Expanding network capacity
Improving user experience – enabling new applications
The many faces of Optimization
PerformanceEnhancements
LatencyReduction
BandwidthImprovement
TransportProtocol
Optimization
ApplicationProtocol
Optimization
ContentCaching
AdaptiveContent-awareCompression
IntelligentContent
Reduction
Accessibility
ContentTranscoding
ProtocolTranslation Usability
PolicyEnforcement QoS Content
AdaptationTraffic
Shaping
OPTIMIZATION
42
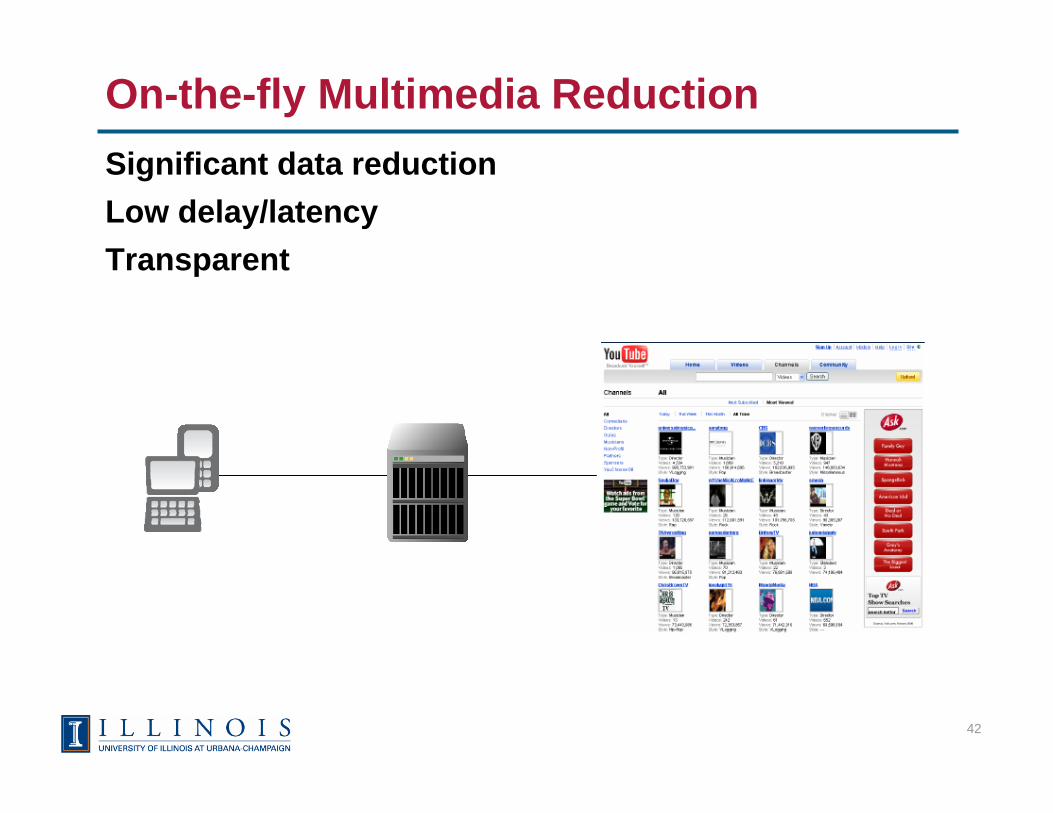
On-the-fly Multimedia ReductionSignificant data reductionLow delay/latencyTransparent

43
Dynamic Bandwidth Shaping
Media function constantly monitors the network connection with the client and shapes the multimedia stream to adapt to current network conditions.
Ensures uninterrupted streams at optimal rates.

44
Optimization as a catalyst for rich applications
Optimization provides perpetual value – more important in 4G: • No “fast” is “fast enough” – otherwise, no need for 3G, 4G,…• Optimization is as much about user experience as net utilization• In a congested network, user experience deteriorates exponentially This is
independent of 3G, 4G or beyond• 3G and 4G address bandwidth, but not latency• New services require ever increasing bandwidth and ever decreasing
latency (real-time applications: video conferencing, network gaming, etc)• Optimization addresses multiple dimensions of performance:
– Bandwidth and latency– Network congestion– Protocol and application inefficiencies– Device CPU and memory limitations– Content packaging– Access enablement– Radio Access Network agnostic optimization!


