Monthly Stock Market Report - Home - Federal Reserve · PDF fileMonthly Stock Market Report...
26
August 27, 2001 Monthly Stock Market Report Market Analysis for Period Ending Wednesday, August 1, 2001 This document presents technical and fundamental analysis commonly used by investment professionals to interpret the direction and valuation of equity markets, as well as tools commonly used by economists to determine the health of financial markets and their impact on the domestic United States economy. The purpose of the report is to provide a synopsis of equity markets from as many disciplines as possible, but is in no way an endorsement of any one mode of study or source of advice on which one should base investment decisions. Definitions of terms and explanations of indicator interpretation follow the charts in the Endnotes section. Price Trends Figure 1 presents price trends and daily volumes for the New York Stock Exchange and Nasdaq Composite Indices. The New York Stock Exchange Composite Index (NYSE Index) closed Wednesday, August 1 at 625.7. This level marked a 5.4 percent decline since the recent high of 661.39 on May 22, and it is 3.1 percent below the opening value on January 1, 2001. The index declined 1.6 percent during the month of July. The National Association of Securities Dealers Composite Index (Nasdaq Index) closed at 2068.38. Between January 1, 2001 and August 1, the Nasdaq Index fell 9.8 percent. Market Technicals Figures 2, 3, and 4 present some technical indicators commonly cited by stock market analysts. As of August 1, the Relative Strength Index (RSI) for the NYSE Composite had a value of 49.4 percent, showing no recent rapid rise or fall in the index price and putting it in what is commonly viewed as neutral territory (figure 2, upper panel). Figure 3, upper panel, shows that the number of stocks falling to new 52-week lows has been declining. The middle panel shows that momentum (overbought/oversold oscillator) is also essentially neutral, while the Market Breadth indicator (figure 3, bottom panel) shows approximate balance between the numbers of advancing and declining stocks. For the Nasdaq Index, the relative strength index is also in neutral range (figure 2). The upper panel in Figure 4 shows that both the number of stocks reaching new 52-week lows and the number reaching new highs have been increasing in recent weeks. However, declining stocks still outnumber advancing ones (bottom panel, figure 4). The momentum indicator is slightly in oversold territory,
Transcript of Monthly Stock Market Report - Home - Federal Reserve · PDF fileMonthly Stock Market Report...

August 27, 2001
Monthly Stock Market ReportMarket Analysis for Period Ending Wednesday, August 1, 2001
This document presents technical and fundamental analysis commonly used byinvestment professionals to interpret the direction and valuation of equity markets, aswell as tools commonly used by economists to determine the health of financial marketsand their impact on the domestic United States economy. The purpose of the report isto provide a synopsis of equity markets from as many disciplines as possible, but is inno way an endorsement of any one mode of study or source of advice on which oneshould base investment decisions.
Definitions of terms and explanations of indicator interpretation follow the charts in theEndnotes section.
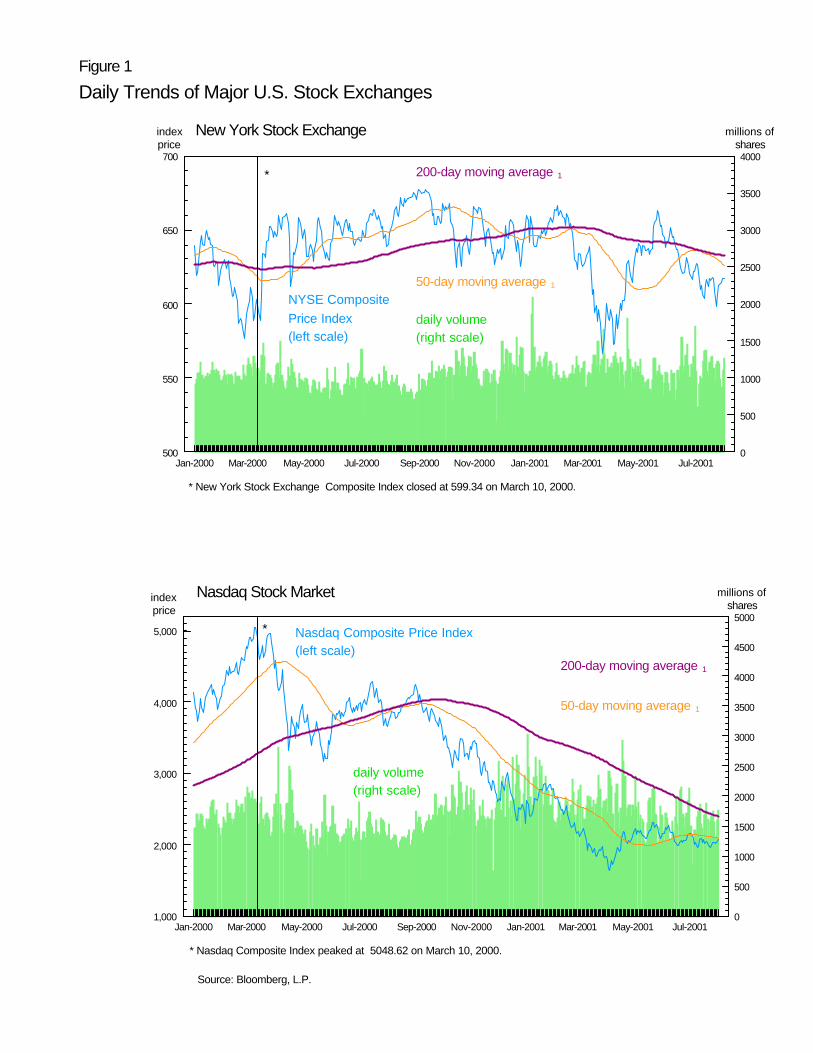
Price TrendsFigure 1 presents price trends and daily volumes for the New York Stock Exchange andNasdaq Composite Indices.
The New York Stock Exchange Composite Index (NYSE Index)closed Wednesday, August 1 at 625.7. This level marked a 5.4percent decline since the recent high of 661.39 on May 22, and it is3.1 percent below the opening value on January 1, 2001. The indexdeclined 1.6 percent during the month of July. The National Association of Securities Dealers Composite Index(Nasdaq Index) closed at 2068.38. Between January 1, 2001 andAugust 1, the Nasdaq Index fell 9.8 percent.
Market TechnicalsFigures 2, 3, and 4 present some technical indicators commonly cited by stockmarket analysts.
As of August 1, the Relative Strength Index (RSI) for the NYSEComposite had a value of 49.4 percent, showing no recent rapid rise orfall in the index price and putting it in what is commonly viewed asneutral territory (figure 2, upper panel). Figure 3, upper panel, showsthat the number of stocks falling to new 52-week lows has beendeclining. The middle panel shows that momentum(overbought/oversold oscillator) is also essentially neutral, while theMarket Breadth indicator (figure 3, bottom panel) shows approximatebalance between the numbers of advancing and declining stocks. For the Nasdaq Index, the relative strength index is also in neutralrange (figure 2). The upper panel in Figure 4 shows that both thenumber of stocks reaching new 52-week lows and the numberreaching new highs have been increasing in recent weeks. However,declining stocks still outnumber advancing ones (bottom panel,figure 4). The momentum indicator is slightly in oversold territory,

but has not changed recently (figure 4, middle panel).
VolatilityPut/call ratios appear in figure 5.
Monthly data are shown from January 1997 through July 2001.Both the CBOE individual equity put/call ratio and the S&P 100put/call ratio are at the high end of the range for the past year. TheCBOE ratio for individual equities (figure 5, top panel) reached whatsome analysts considered "bullish" territory in July.
Indicators of market volatility are shown in figure 6.
The Chicago Board of Options Exchange (CBOE) provides dailymeasures of volatility for the S&P 500 (VIX) and for the Nasdaq 100(VXN). Both volatility indicators have fallen in recent weeks and areat relatively low levels compared to the past year's experience.
ValuationFigure 7 shows three measures of historical and future valuation: historical PE ratiosin the top panel, forward and trailing PE ratios using analysts' estimates of operatingearnings in the middle panel, and strategists’ two-year forecasts of earnings growthin the lower panel. Figure 8 displays historical and current price-earnings ratios andearnings growth for the S&P 500 economic sector groups described above.
As earnings expectations deteriorate, the macro projections fromstrategists for the growth of earnings of the Standard and Poor’s 500index over the next two years have been revised downward to 5.9 percentin the second quarter, below the 6.7 percent historical average annualgrowth rate (figure 7, bottom panel). The S&P 500 trailing price-earningsratio increased to 25.4 in the second quarter from 24.2 in the first quarter(figure 7, top panel). During the same period the price-earnings ratio forthe Russell 2000 increased to 79.8 from 54.4. The third quarter forecastfor the S&P 500 forward price to operating earnings ratio, using bottom-up forecasts from analysts, declined to 21.4 from 22.8 in the secondquarter (figure 7, middle panel).
Among the economic sectors, price-earnings ratios generally haveincreased since the fourth quarter of 2000. The ratio for consumercyclicals increased from 17.9 to 33.1 during that period. The technologysector price-earnings ratio increased from 31.2 to 185.5. Despite theyear-to-date decline in the price of the S&P 500 Utility Index of 16.9percent, earnings of utility stocks fell more than prices, causing the price-earnings ratio to increase dramatically in 2001. It was estimated at 34.3on August 1, up from 25.2 in the fourth quarter of 2000 (figure 8).

Comparative Returns The earnings-price ratio fell slightly to 3.6 percent in the first quarterfrom 3.7 percent in the fourth quarter. Typically, the earnings-price ratiofalls below the real return on bonds when analysts expect earnings to riserapidly.
The dividend-price ratio, an indication of the yield investors receivethrough dividends by holding stocks, increased to 1.3 percent in the firstquarter from 1.2 percent in the fourth quarter, but is still substantiallybelow the 5.3 percent real rate of interest on corporate bonds and the 3.39percent historical average annual dividend yield (figure 10).
Nonfinancial corporate businesses have tried to maintain dividends inthe face of sagging profits, resulting in an unusually high dividend tooperating profit payout rate of 64.7 percent (figure 11).
Sector PerformanceFigure 12 compares the performance of the various economic sectors within theS&P 500 as well as other international and style indices.
Consumer cyclicals returned 12.0 percent between January 1 andAugust 1, 2001, outperforming all other economic sectors within theS&P 500. Conversely, technology lagged all sectors, losing 18.3percent in 2001 after returning 34.8 percent annually over the past fiveyears.
The Wilshire 5000, composed of all U.S. equity issues, fell 7.9percent year-to-date. Similarly, the German DAX declined 9.3percent, the British FTSE 100 fell 10.9 percent, and the JapaneseNikkei 225 lost 13.3 percent of its value as of August 1, 2001.
Over the last five years the Russell 1000 Large-Cap Index returned21.9 percent, while the 2000 Small-Cap Index returned on average12.8 percent annually. Year-to-date, however, the 1000 Large-CapIndex depreciated 2.5 percent, while the Russell 2000 Small-CapIndex appreciated 1.2 percent.
Please contact Richard Brauman for questions and comments (617) 973-3198,[email protected].
Jan-2000 Mar-2000 May-2000 Jul-2000 Sep-2000 Nov-2000 Jan-2001 Mar-2001 May-2001 Jul-20011,000
2,000
3,000
4,000
5,000
0
500
1000
1500
2000
2500
3000
3500
4000
4500
5000Nasdaq Composite Price Index(left scale)
Jan-2000 Mar-2000 May-2000 Jul-2000 Sep-2000 Nov-2000 Jan-2001 Mar-2001 May-2001 Jul-2001500
550
600
650
700
0
500
1000
1500
2000
2500
3000
3500
4000
daily volume(right scale)
NYSE Composite Price Index(left scale)
50-day moving average 1
200-day moving average 1
*
*
* Nasdaq Composite Index peaked at 5048.62 on March 10, 2000.
* New York Stock Exchange Composite Index closed at 599.34 on March 10, 2000.
Figure 1
Daily Trends of Major U.S. Stock Exchanges
New York Stock Exchange
Nasdaq Stock Market
millions of shares
index price
index price
millions of shares
50-day moving average 1
200-day moving average 1
daily volume(right scale)
Source: Bloomberg, L.P.

550
600
650
700
1,500
1,800
2,100
2,400
2,700
3,000
NYSE Composite Price Index
9-day moving average 2
18-day moving average 2
Figure 2
Moving Averages and Relative Strength
New York Stock Exchangeindex price
Source: Bloomberg, L.P.
Feb-2001 Mar-2001 Apr-2001 May-2001 Jun-2001 Jul-2001 Aug-2000
20
40
60
80
100percent
Relative Strength Index 3 Overbought
Oversold
Nasdaq CompositePrice Index
9-day moving average 2
18-day moving average 2
Nasdaq Stock Marketindex price
Feb-2001 Mar-2001 Apr-2001 May-2001 Jun-2001 Jul-2001 Aug-2000
20
40
60
80
100percent
Relative Strength Index 3Overbought
Oversold

Feb-2001 Mar-2001 Apr-2001 May-2001 Jun-2001 Jul-2001 Aug-2001560
580
600
620
640
660
680
0
50
100
150
200
250
New Highs(right scale)
New Lows(right scale)
Feb-2001 Mar-2001 Apr-2001 May-2001 Jun-2001 Jul-2001 Aug-2001(1,000)
(750)
(500)
(250)
0
250
500
750
Feb-2001 Mar-2001 Apr-2001 May-2001 Jun-2001 Jul-2001 Aug-2001500
550
600
650
700
(20,000)
(15,000)
(10,000)
(5,000)
0
5,000
Overbought
Oversold
Momentum Oscillator 5
Cumulative Advances - Declines(right scale)
NYSE Price Index(left scale)
NYSE Composite price(left scale)
Figure 3
Index Breadth and Momentum Indicators - New York Stock Exchange
New Highs and New Lows 4
Market Breadth 6
number of stocks
index price
index price
number of stocks
Source: Bloomberg, L.P.

Feb-2001 Mar-2001 Apr-2001 May-2001 Jun-2001 Jul-2001 Aug-2001
1,600
1,800
2,000
2,200
2,400
2,600
2,800
3,000
0
50
100
150
200
250
300
NASDAQ New Highs(right scale)
NASDAQ New Lows(right scale)
Feb-2001 Mar-2001 Apr-2001 May-2001 Jun-2001 Jul-2001 Aug-2001(1,250)
(1,000)
(750)
(500)
(250)
0
250
500
750
Feb-2001 Mar-2001 Apr-2001 May-2001 Jun-2001 Jul-2001 Aug-20011,000
1,500
2,000
2,500
3,000
(215,000)
(210,000)
(205,000)
(200,000)
(195,000)
(190,000)
Overbought
Oversold
Cumulative Advances - Declines(right scale)
NASDAQ Composite Price Index(left scale)
Figure 4
Index Breadth and Momentum Indicators - Nasdaq Stock Market
NASDAQComposite Price Index(left scale)
New Highs and New Lows 4
Momentum Oscillator 5
Market Breadth 6
index price
index price
number of stocks
number of stocks
Source: Bloomberg, L.P.

Figure 5
Put / Call Ratio
Jan:1997 Apr:1997 Jul:1997 Oct:1997 Jan:1998 Apr:1998 Jul:1998 Oct:1998 Jan:1999 Apr:1999 Jul:1999 Oct:1999 Jan:2000 Apr:2000 Jul:2000 Oct:2000 Jan:2001 Apr:2001 Jul:2001600
800
1,000
1,200
1,400
1,600
0.3
0.4
0.5
0.6
0.7
Ratio for Individual Equity Options(right scale)
CBOE Index and Individual Equity Put/Call Ratios 7
Jan:1997 Apr:1997 Jul:1997 Oct:1997 Jan:1998 Apr:1998 Jul:1998 Oct:1998 Jan:1999 Apr:1999 Jul:1999 Oct:1999 Jan:2000 Apr:2000 Jul:2000 Oct:2000 Jan:2001 Apr:2001 Jul:2001600
800
1,000
1,200
1,400
1,600
0.75
1
1.25
1.5
1.75
Ratio(right scale)
S&P 100 Price Index and Put/Call Ratio
Index Price(left scale)
Jan:1997 Apr:1997 Jul:1997 Oct:1997 Jan:1998 Apr:1998 Jul:1998 Oct:1998 Jan:1999 Apr:1999 Jul:1999 Oct:1999 Jan:2000 Apr:2000 Jul:2000 Oct:2000 Jan:2001 Apr:2001 Jul:20010
1,000
2,000
3,000
4,000
5,000
0
0.5
1
1.5
2
2.5
3
3.5
4
Ratio(right scale)
Nasdaq 100 Price Index and Put/Call Ratio
Index Price(left scale)
S&P 500 Price Index(left scale)
ratio
ratio
ratio
index price
index price
index price
Source: Chicago Board of Options Exchange, Wall Street Journal / Haver Analytics
High Put Trading Volume = High Put/Call Ratio = Extreme Pessimism = Potentially Bullish
High Call Trading Volume = Low Put/Call Ratio = Extreme Optimism = Potentially Bearish

Aug-2000 Sep-2000 Oct-2000 Nov-2000 Dec-2000 Jan-2001 Feb-2001 Mar-2001 Apr-2001 May-2001 Jun-2001 Jul-2001 Aug-2001500
550
600
650
700
750
800
850
15
20
25
30
35
40
45
S&P100 Price Index(left scale)
VIX(right scale)
Figure 6
Volatility 8
Aug-2000 Sep-2000 Oct-2000 Nov-2000 Dec-2000 Jan-2001 Feb-2001 Mar-2001 Apr-2001 May-2001 Jun-2001 Jul-2001 Aug-20011,000
1,500
2,000
2,500
3,000
3,500
4,000
4,500
30
40
50
60
70
80
90
100
Nasdaq 100Price Index(left scale)
VXN(right scale)
S&P100 and CBOE's OEX Volatility Index 9
Nasdaq 100 and CBOE's NDX Volatility Index 10
S&P500 Index Return and Implied Volatility1-year average Returns(left scale)
Implied Volatility(right scale)
percent
index price
index price
Source: Bloomberg, L.P. Aug-2000 Sep-2000 Oct-2000 Nov-2000 Nov-2000 Jan-2001 Feb-2001 Mar-2001 Apr-2001 May-2001 Jun-2001 Jul-2001 Aug-2001
(30)
(20)
(10)
0
10
20
10
15
20
25
30
35

Price-Earnings Ratio (left scale)
2 yr Growth of Earnings 11
(right scale)
percent
Price-Earnings Ratios
S&P500 Price-Earnings Ratio and the Growth of Earnings
S&P500 Price-Operating Earnings Ratio
4-qtr Trailing Earnings
4-qtr Forward Earnings
S&P 500
S&P Smallcap 600
Source: Bloomberg L.P.; Standard & Poor's / Haver Analytics; First Call; DRI
Russell 2000
Wilshire 50001959:Q1 1963:Q1 1967:Q1 1971:Q1 1975:Q1 1979:Q1 1983:Q1 1987:Q1 1991:Q1 1995:Q1 1999:Q10
20
40
60
80
Figure 7
PE Ratios and the Growth of Earnings
1968:Q1 1972:Q1 1976:Q1 1980:Q1 1984:Q1 1988:Q1 1992:Q1 1996:Q1 2000:Q15
10
15
20
25
30
35
1959:Q1 1963:Q1 1967:Q1 1971:Q1 1975:Q1 1979:Q1 1983:Q1 1987:Q1 1991:Q1 1995:Q1 1999:Q15
10
15
20
25
30
35
(40)
(20)
0
20
40
60

SP500Financial
Utility
Transportation
Basic Materials
Capital Goods
Communication
Consumer Cyclicals
Consumer StaplesEnergy
Health CareTechnology0
20
40
60
80Q4 96 Q4 98 Q4 00 August 1
Figure 8
S&P 500 Economic Sectors - Earnings Growth
PE Ratios for S&P 500 Economic Sectors
SP500Financial
Utility
Transportation
Basic Materials
Capital Goods
Communication
Consumer Cyclicals
Consumer StaplesEnergy
Health CareTechnology(40)
(20)
0
20
40
60
80
100 5-YEAR 3-YEAR 1-YEAR
SP500Financial Utility
Transportation
Basic Materials
Capital Goods
Communication
Consumer Cyclicals
Consumer StaplesEnergy
Health CareTechnology
(40)
(20)
0
20
40
60
80
100
120
140
5-YEAR 3-YEAR 1-YEAR
Earnings Growth for S&P 500 Economic Sectors(annualized percent change for period ending December 31, 2000)
Operating Earnings Growth for S&P 500 Economic Sectors(annualized percent change for period ending December 31, 2000)
Source: Standard & Poor's Compustat Special Projects; Bloomberg, L.P.
(185.5)

Real Rate of Return on Nonfinancial Corporate Equity 12
(from National Income and Flow of Funds Accounts)
1958 1962 1966 1970 1974 1978 1982 1986 1990 1994 19984
6
8
10
12percent
1958:Q1 1963:Q1 1968:Q1 1973:Q1 1978:Q1 1983:Q1 1988:Q1 1993:Q1 1998:Q12
4
6
8
10
12
Profits of Nonfinancial Corporations(percent of GDP)
Tobin's q 13
Earnings Before Interest Payments
Profits
Figure 9Economic Measures of Equity Valuation
1952:Q1 1958:Q1 1964:Q1 1970:Q1 1976:Q1 1982:Q1 1988:Q1 1994:Q1 2000:Q10
0.5
1
1.5
2
Source: National Income and Product Accounts, Flow of Funds Accounts of the United States (Federal Reserve Board), Bureau of Economic Analysis / Haver Analytics; NYSE Fact Book

Figure 10
Comparative Returns
1982:Q1 1985:Q1 1988:Q1 1991:Q1 1994:Q1 1997:Q1 2000:Q10
2
4
6
8
10
12
Yield on A-Corporate Bonds Less Inflation Expectations
DP Ratio
Earnings-Price Ratio 14 for the S&P 500 and the Real Corporate Bond Rate 15
Growth of Real Earnings for S&P 500(average rate of growth for 2 years forward)
1982:Q1 1985:Q1 1988:Q1 1991:Q1 1994:Q1 1997:Q1 2000:Q12
4
6
8
10
12
14
Yield on A-Corporate Bonds Less Inflation Expectations
EP Ratio
Dividend-Price Ratio 14 for the S&P 500 and the Real Corporate Bond Rate 15
1982:Q1 1985:Q1 1988:Q1 1991:Q1 1994:Q1 1997:Q1 2000:Q1(40)
(20)
0
20
40
60percent
Source: Federal Reserve Board, Standard & Poor's / Haver Analytics; Federal Reserve Bank of Philadelphia / FAME; DRI
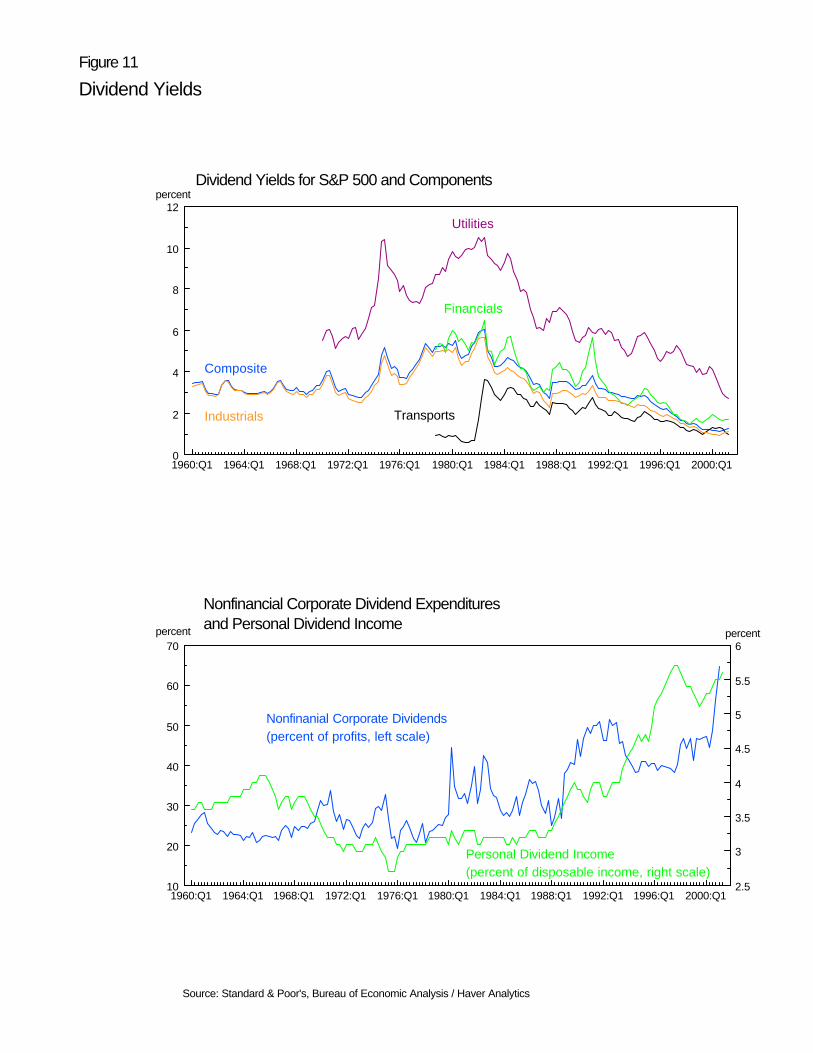
Figure 11
Dividend Yields
1960:Q1 1964:Q1 1968:Q1 1972:Q1 1976:Q1 1980:Q1 1984:Q1 1988:Q1 1992:Q1 1996:Q1 2000:Q10
2
4
6
8
10
12
Composite
Industrials
Dividend Yields for S&P 500 and Components
Utilities
Financials
Transports
1960:Q1 1964:Q1 1968:Q1 1972:Q1 1976:Q1 1980:Q1 1984:Q1 1988:Q1 1992:Q1 1996:Q1 2000:Q110
20
30
40
50
60
70
2.5
3
3.5
4
4.5
5
5.5
6
Nonfinanial Corporate Dividends(percent of profits, left scale)
Nonfinancial Corporate Dividend Expenditures and Personal Dividend Income
Personal Dividend Income(percent of disposable income, right scale)
percent
percent percent
Source: Standard & Poor's, Bureau of Economic Analysis / Haver Analytics

Figure 12
S&P 500 Economic Sectors - Index Returns
34.8
25.6
24.7
19.2
19.1
18.2
18.2
13.9
13.7
8.7
4.1
0 10 20 30 40
Year-to-Date* Performance of S&P 500 Economic Sectors
Utilities
Basic Materials
Communication Services
Consumer Cyclicals
Technology
Consumer Staples
Transportations
Capital Goods
Energy
Health Care
Financials
percent
-16.6
-2.5
-8.5
1.2
(18) (15) (12) (9) (6) (3) 0 3
Year-to-Date* Performance of Selected Russell Style Indexes
2000 Small-Cap
1000 Value
1000 Large-Cap
percent
-18.3
-12.8
-4.5
-8.7
12.0
2.0
-16.9
-6.3
-6.5
2.2
1.3
(20) (15) (10) (5) 0 5 10 15
5-Year Annualizedψ Performance of S&P 500 Economic Sectors
percent
1000 Growth25.6
21.9
17.6
12.8
0 5 10 15 20 25 30
5-Year Annualizedψ Performance of Selected Russell Style Indexes
percent
Year-to-Date* Performance of Selected Geographical Indexes
5-Year Annualizedψ Performance of Selected Geographical Indexes
-9.3
-7.9
-10.9
-13.3
(15) (12) (9) (6) (3) 0Nikkei 225, Japan
FTSE 100, U.K.
Wilshire 5000
percent
DAX, Germany24.9
16.0
11.7
-4.7
(10) (5) 0 5 10 15 20 25 30
percent
Source: Bloomberg, L.P. ψ Five-year annualized performance for period ending December 31, 2000.∗ Year-to-Date performance covers period between December 31, 2000 and August 1, 2001.

One-Year Price Changes for Companies(median percentage change for each decile, ranked by performance)
PE Ratios for Companies(median ratio for each decile, ranked by PE ratio)
PE=14.4
Figure 13
Breadth of the S&P 500
1968 1970 1972 1974 1976 1978 1980 1982 1984 1986 1988 1990 1992 1994 1996 1998 2000(100)
(50)
0
50
100
150
1967 1969 1971 1973 1975 1977 1979 1981 1983 1985 1987 1989 1991 1993 1995 1997 19990
20
40
60
80
100
Proportion of the S&P 500 Stocks Whose Price Increased Over One Year
1968 1970 1972 1974 1976 1978 1980 1982 1984 1986 1988 1990 1992 1994 1996 1998 20000
20
40
60
80
100percent
Source: Standard & Poor's Compustat Special Projects

Figure 14
Ratings and Default Rates
JUL98 OCT98 JAN99 APR99 JUL99 OCT99 JAN00 APR00 JUL00 OCT00 JAN01 APR010
20
40
60
80
20
25
30
35Upgrades(left scale)S&P 500 PE Ratio
(right scale)
Changes in Moody's Ratings of Investment Grade Securities 16
and the S&P 500 PE Ratio
Downgrades(left scale)
$ billions
JUL98 OCT98 JAN99 APR99 JUL99 OCT99 JAN00 APR00 JUL00 OCT00 JAN01 APR0120
30
40
50
60
0
2
4
6
8
10
12
Business Failure Rate 16
(left scale)
S&P 500 PE Ratio(left scale)
Moody's Default and Failure Rates 17
and the S&P 500 PE Ratio
Default Rate on Junk Bonds 16
(right scale)
percent
JUL98 OCT98 JAN99 APR99 JUL99 OCT99 JAN00 APR00 JUL00 OCT00 JAN01 APR010
10
20
30
40
50
60
70
20
22
24
26
28
30
32
34
36
Upgrades(left scale)
S&P 500 PE Ratio(right scale)
Changes in Moody's Ratings of Speculative Grade Securities 16
and the S&P 500 PE Ratio
Downgrades(left scale)
(145.9)
Source: Board of Governors of the Federal Reserve System / FAME
$ billions
percent
PE ratio
PE ratio

Figure 15
Margin Debt and Expected Returns
Margin Debt and Stock Volatility
1987:Q1 1989:Q1 1991:Q1 1993:Q1 1995:Q1 1997:Q1 1999:Q1 2001:Q10
10
20
30
40
50
60
0.6
0.8
1
1.2
1.4
1.6
Outstanding Margin Debt Relative to Total Market Value of Equities (right scale)
Source: Nasdaq, NYSE, CBOE, Standard & Poor's / Haver Analytics; Board of Governors of the Federal Reserve System / FAME
Gross New Issuance 18of Securities by Nonfinancial Corporations
1987:Q1 1989:Q1 1991:Q1 1993:Q1 1995:Q1 1997:Q1 1999:Q1 2001:Q10
20,000
40,000
60,000
80,000
100,000
120,000
Bonds
$ millions
Equity
1987:Q1 1989:Q1 1991:Q1 1993:Q1 1995:Q1 1997:Q1 1999:Q1 2001:Q110
15
20
25
30
35
0
0.1
0.2
0.3
0.4
0.5
0.6
0.7ratio Gross New Issuance and the S&P 500 PE Ratio
New Equity Security Issuance Relative to Total Market Value (right scale)
VIX(left scale)
PE Ratio(left scale)

Outstandings
1985:Q1 1987:Q1 1989:Q1 1991:Q1 1993:Q1 1995:Q1 1997:Q1 1999:Q1 2001:Q10
500
1,000
1,500
2,000
2,500
US Resident Holdings of Foreign Securities
Foreign Holdings of US Securities
$ billions
Foreign Holdings of U.S. Equity Securities Relative to Total Market Value of U.S. Equity
1985:Q1 1987:Q1 1989:Q1 1991:Q1 1993:Q1 1995:Q1 1997:Q1 1999:Q1 2001:Q14
5
6
7
8
9
10
11
0
200
400
600
800
1,000
1,200
1,400
1,600
S&P 500(right scale)
Foreign Holdings of U.S. Securities(left scale)
percent
1985:Q1 1987:Q1 1989:Q1 1991:Q1 1993:Q1 1995:Q1 1997:Q1 1999:Q1 2001:Q10
2
4
6
8
10
12
60
80
100
120
140
160
180
200
U.S. Resident Holdings of Foreign Securities(left scale)
DJ World Stock Index,Excluding U.S.(right scale)
percent
Figure 16
Foreign and Domestic Holdings
indexprice
indexprice
U.S. Resident Holdings of Foreign Equity Securities Relative to Total Market Value of U.S. Equity
Source: Flow of Funds Accounts of the United States (Federal Reserve Board) / Haver Analytics; Wall Street Journal
1988 1991 1994 1997 20000
20
40
60
80
100
NYSE's and Nasdaq's share of the Total Market
(by market value)
1980:Q1 1982:Q1 1984:Q1 1986:Q1 1988:Q1 1990:Q1 1992:Q1 1994:Q1 1996:Q1 1998:Q1 2000:Q10
20
40
60
80
100
Other
Households
State & Private Pension
InsuranceTrusts
Distribution of Equity Ownership by Sector
percent
percent
Total 1 2 3 4 5 6 7 8 9 10
0
20
40
60
Equity Bond Short-Term
Households' Financial Asset Ownership by
Net Worth Decile(percent of net worth)
NYSE
NASDAQ
percent
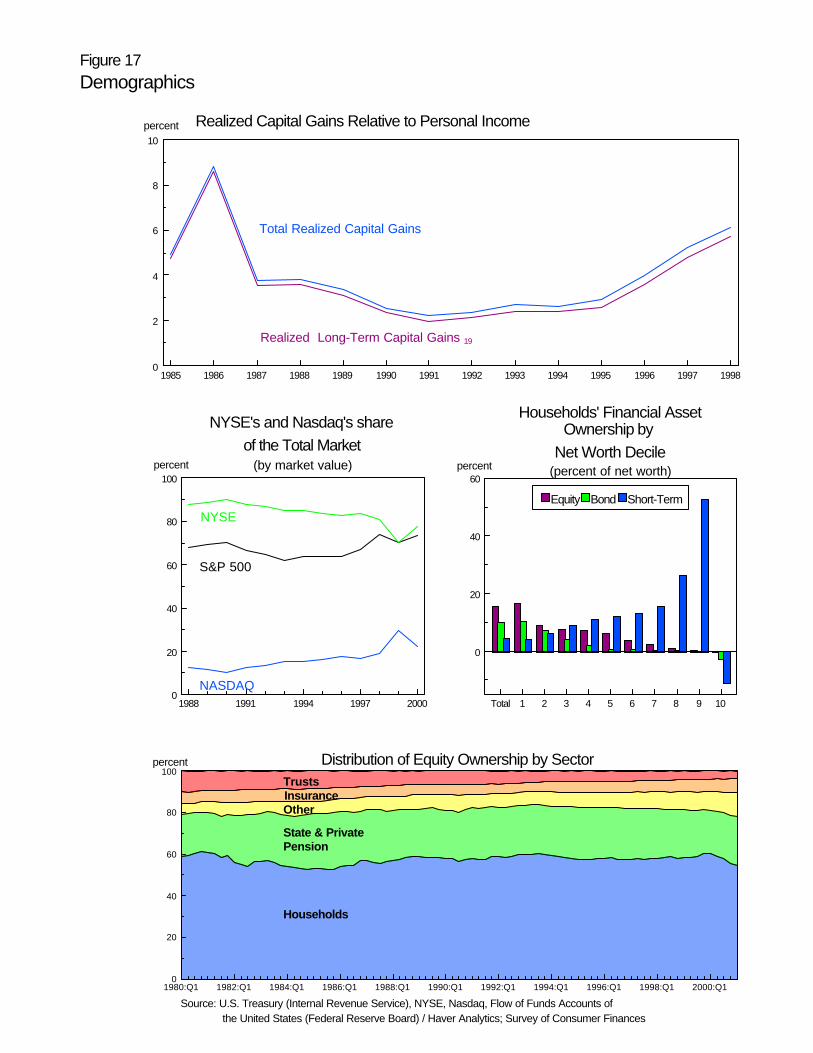
Source: U.S. Treasury (Internal Revenue Service), NYSE, Nasdaq, Flow of Funds Accounts of the United States (Federal Reserve Board) / Haver Analytics; Survey of Consumer Finances
Figure 17Demographics
Realized Capital Gains Relative to Personal Income
1985 1986 1987 1988 1989 1990 1991 1992 1993 1994 1995 1996 1997 19980
2
4
6
8
10
Total Realized Capital Gains
percent
Realized Long-Term Capital Gains 19
S&P 500
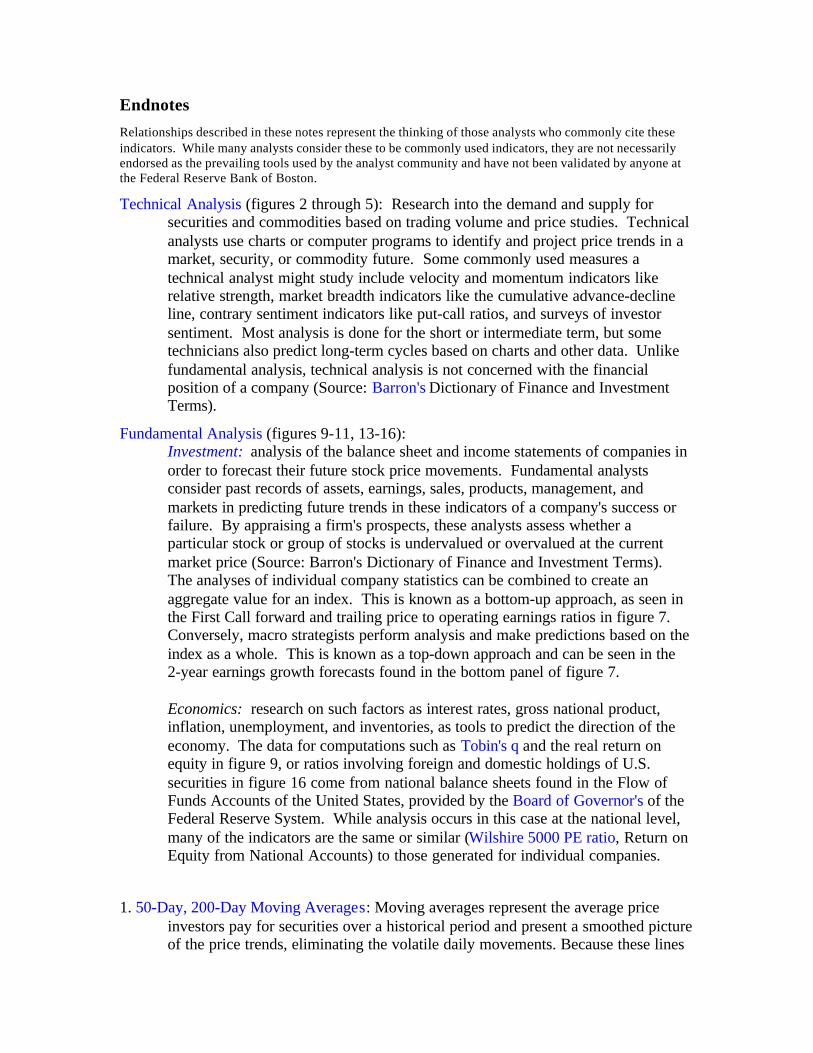
Endnotes
Relationships described in these notes represent the thinking of those analysts who commonly cite theseindicators. While many analysts consider these to be commonly used indicators, they are not necessarilyendorsed as the prevailing tools used by the analyst community and have not been validated by anyone atthe Federal Reserve Bank of Boston.
Technical Analysis (figures 2 through 5): Research into the demand and supply forsecurities and commodities based on trading volume and price studies. Technicalanalysts use charts or computer programs to identify and project price trends in amarket, security, or commodity future. Some commonly used measures atechnical analyst might study include velocity and momentum indicators likerelative strength, market breadth indicators like the cumulative advance-declineline, contrary sentiment indicators like put-call ratios, and surveys of investorsentiment. Most analysis is done for the short or intermediate term, but sometechnicians also predict long-term cycles based on charts and other data. Unlikefundamental analysis, technical analysis is not concerned with the financialposition of a company (Source: Barron's Dictionary of Finance and InvestmentTerms).
Fundamental Analysis (figures 9-11, 13-16):Investment: analysis of the balance sheet and income statements of companies inorder to forecast their future stock price movements. Fundamental analystsconsider past records of assets, earnings, sales, products, management, andmarkets in predicting future trends in these indicators of a company's success orfailure. By appraising a firm's prospects, these analysts assess whether aparticular stock or group of stocks is undervalued or overvalued at the currentmarket price (Source: Barron's Dictionary of Finance and Investment Terms).The analyses of individual company statistics can be combined to create anaggregate value for an index. This is known as a bottom-up approach, as seen inthe First Call forward and trailing price to operating earnings ratios in figure 7.Conversely, macro strategists perform analysis and make predictions based on theindex as a whole. This is known as a top-down approach and can be seen in the2-year earnings growth forecasts found in the bottom panel of figure 7.
Economics: research on such factors as interest rates, gross national product,inflation, unemployment, and inventories, as tools to predict the direction of theeconomy. The data for computations such as Tobin's q and the real return onequity in figure 9, or ratios involving foreign and domestic holdings of U.S.securities in figure 16 come from national balance sheets found in the Flow ofFunds Accounts of the United States, provided by the Board of Governor's of theFederal Reserve System. While analysis occurs in this case at the national level,many of the indicators are the same or similar (Wilshire 5000 PE ratio, Return onEquity from National Accounts) to those generated for individual companies.
1. 50-Day, 200-Day Moving Averages: Moving averages represent the average priceinvestors pay for securities over a historical period and present a smoothed pictureof the price trends, eliminating the volatile daily movements. Because these lines

offer a historical consensus entry point, chartists look to moving average trendlines of index prices to define levels of support or resistance in the market. Whena chart trend is predominantly sideways (figure 1, top chart), moving averages andthe underlying series frequently cross, but during a time of prolonged increase ordecrease (figure 1, bottom chart), the daily prices of a security typically are aboveor below the trailing average.
2. 9-Day, 18-Day Moving Averages: The 9-day and 18-day moving averages areoften used together by traders using technical analysis to provide buy and sellsignals. Buy signals are indicated by the 9-day average crossing above the 18-daywhen both are in an uptrend. The reverse, the 9-day crossing below the 18-daywhile both moving averages are declining, is a sign to sell. However, this simpletool can often be misleading because of its dependence on trending markets andits inability to capture quick market turns.
3. Relative Strength Index (RSI): This momentum oscillator measures the velocityof directional price movements. When prices move rapidly upward it mayindicate an overbought condition, generally assumed to occur above 70 percent.Oversold conditions arise when prices drop quickly, producing RSI readingsbelow 30 percent. Traders will often use values close to 80 percent and 20percent as sell and buy signals. The general formula is as follows:RSI = 100 - [100 / (1 + (AvgUp / AvgDn))], whereAvgDn = Sum of all changes for advancing periods divided by the total numberof RSI periods, andAvgUp = Sum of all changes for declining periods divided by the total number ofRSI periods.
4. New Highs, New Lows: A straightforward market breadth indicator, this is the 10-daymoving average of the number of stocks on a given index or exchange makingnew 52-week highs or lows each day. This indicator also demonstratesdivergence. If an index makes a new low, but the number of stocks in the indexmaking new lows declines, there is positive divergence. Technical analysts referto this as a lack of downside conviction, a situation where stocks generally fell ona given day but not by a significant margin that would indicate intense sellingpressure and further declines. Conversely, in rising markets, if an index makes anew high but the number of individual stocks in that index making new highsdoes not increase, analysts believe the rally may not be sustained.
5. Momentum Oscillator: Also known as the overbought/oversold oscillator, thisindicator is calculated by taking the 10-day moving average of the differencebetween the numbers of advancing and declining issues for a given index. Thegoal of the indicator is to show whether an index is gaining or losing momentum,so the size of the moves is more important than the level of the current reading.The level of the reading is affected by how the oscillator changes each day,dropping a value ten days ago and adding today's value. If the advance-declineline read minus 300 ten days ago, and reads minus 100 today, even though the

market is down again, the oscillator will rise by 200 because of the net differencebetween the exchanged days' values. This scenario suggests a trough. On theother hand, if today's reading was minus 500, it would demonstrate anacceleration of across-the-board selling.
The magnitude in moves is also useful when it is compared with thedivergence from the index price. If the Dow peaks at the same time the oscillatorpeaks in overbought territory, it suggests a top. If the index then makes a newhigh but the oscillator fails to make a higher high, divergence is negative andmomentum is declining. If the index at this point declines and the oscillatormoves into oversold territory, it may again be time to buy. If the index rises butdoes not make new highs, but the oscillator continues to rise above a previousoverbought level, upside momentum exists to continue the rally.
6. Cumulative Advance - Decline Line: Referred to as market breadth, the indicator isthe cumulative total of advancing minus declining issues each day. When the linemakes new highs, a rally is considered widespread, but when the line is lagging, arally is seen as narrow.
7. Put / Call Ratios: These ratios are used by analysts as contrary sentiment indicators.Unusually high ratio values, indicating much more put buying than call buying,occur when investors are extremely pessimistic and believe the market willcontinue to fall dramatically, at times from already low levels, and they are oftenconsidered by analysts to indicate overly pessimistic sentiment. Because so manyinvestors believe prices will continue to fall, assets can become undervalued bycontemporary valuations, and prices can move quickly back up quickly. Thisphenomenon in capital markets is exacerbated by the volatility and leverageassociated with derivative securities like options. The CBOE index ratios track put and call option trade volume for exchange-traded index options like the S&P 500 and Nasdaq 100. These ratios reflectsentiment of professional and institutional strategies because they are typicallyused as hedging tools by professional money managers. For example, a tradermay purchase Nasdaq 100 puts as protection against loss if she also chooses tosimultaneously buy the Nasdaq 100 tracking stock (AMEX: QQQ). Her belief isthat the Nasdaq 100 will rise, hence the outright purchase of shares, but she hashedged her bet by purchasing puts option contracts, which cost a fraction of thevalue of the underlying asset. Because of the institutional presence, there is moreput buying of index options than of individual equity options, and the index put-call ratios are typically above 1. Index readings above 1.25 indicate much putbuying and often occur when institutional investors are very pessimistic, and suchreadings can lead to a short-term rally in response to the extreme negativity.Conversely, index ratios below 0.75 show very optimistic sentiment. The CBOE equity ratio, however, is composed of trade volume for individualequity options. While both retail and institutional investors purchase individualequity options, this ratio is considered by technical analysts to be an indicator ofretail investor sentiment. Because there is less of the large-volume put buyingassociated with institutional hedging, many analysts believe this is a moresensitive indicator of sentiment, especially among individual investors who may

be purchasing puts when they actually believe the price of a particular stock willfall rather than as a hedge to a long position in that stock. Readings above 0.6suggest a rally may occur because too many investors are pessimistic. Tradersbelieve readings below 0.3 show complacent investor psychology and that pricesmay decline in the future.
8. Volatility: With regard to stock price and stock index levels, volatility is a measure ofchanges in price expressed in percentage terms without regard to direction. Thismeans that a rise from 200 to 202 in one index is equal in volatility terms to a risefrom 100 to 101 in another index, because both changes are 1 percent. Also, a 1percent price rise is equal in volatility terms to a 1 percent price decline. Whilevolatility simply means movement, there are four ways to describe thismovement:
1. Historical volatility is a measure of actual price changes during a specific time period in the past. Mathematically, historical volatility is the annualized standard deviation of daily returns during a specific period. CBOE provides 30-day historical volatility data for obtainable stocks in the Trader's Tools section of CBOE's Web site.2. Future volatility means the annualized standard deviation of daily returns during some future period, typically between now and an option expiration. And it is future volatility that option pricing formulas need as an input in order to calculate the theoretical value of an option. Unfortunately, future volatility is only known when it has become historical volatility. Consequently, the volatility numbers used in option pricing formulas are only estimates of future volatility. Theoretical values are only estimates, and as with any estimate, they
must be interpreted carefully.3. Expected volatility is a trader's forecast of volatility used in an option pricing
formula to estimate the theoretical value of an option. Many option traders study market conditions and historical price action to forecast volatility. Since forecasts vary, there is no specific number that everyone can agree on for expected volatility.
4. Implied volatility is the volatility percentage that explains the current market price of an option; it is the common denominator of option prices. Just as p/e ratios allow comparisons of stock prices over a range of variables such as total earnings and number of shares outstanding, implied volatility enables comparison of options on different underlying instruments and comparison of the same option at different times. The theoretical value of an option is a statistical concept, and traders should focus on relative value, not absolute value. The terms "overvalued" and "undervalued" describe a relationship between implied volatility and expected volatility. Two traders could differ in their opinion of the relative value of the same option if they have different market forecasts and trading styles (volatility explanation courtesy of CBOE).

9. CBOE Volatility Index (VIX): The VIX, introduced by CBOE in 1993, measures thevolatility of the U.S. equity market. It provides investors with up-to-the-minutemarket estimates of expected volatility by using real-time S&P 100 (OEX) indexoption bid/ask quotes. This index is calculated by taking a weighted average ofthe implied volatilities of eight OEX calls and puts. The chosen options have anaverage time to maturity of 30 calendar days. Consequently, the VIX is intendedto indicate the implied volatility of 30-day index options. Some traders use it as ageneral indication of index option implied volatility (Source: CBOE).
10. CBOE Nasdaq 100 Volatility Index (VXN): Like the VIX, the VXN measuresimplied volatility, but in this case for Nasdaq 100 (NDX, AMEX: QQQ) indexoptions, thereby representing an intraday implied volatility of a hypothetical at-the-money NDX option with 30 calendar days to expiration. Both the VXN andthe VIX are used by market observers as sentiment indicators for the Nasdaq 100and for the broader market, respectively. Higher readings and spikes generallyoccur during times of investor panic and at times coincide with market bottoms.Low readings suggest complacency and often occur around tops in index prices.
11. 2-Year Growth of Earnings: Growth of earnings over subsequent 8 quarters. Currentobservations use forecast of earnings from DRI macro projections.
12. Real Return on Equity: Is the defined as follows:[nonfinancial corporate profits with inventory valuation and capital consumption adjustments + (Liabilities of nonfarm nonfinancial corporations - Assets of nonfarm nonfinancial corporations) * consumer price index annual percent change] /[current cost of tangible assets of nofarm nonfinancial business - (Liabilities of nonfarm nonfinancial corporations - Assets of nonfarm nonfinancial corporations)]
13. Tobin's q: The ratio of the market value of equity plus net interest-bearing debt to thecurrent value of land, inventories, equipment, and structures.
14. Earnings and Dividend Price Ratios: These ratios represent an investor's yield fromearnings and dividend payments. Historically, the EP ratio often has exceeded thereal return on bonds, reflecting the greater risk to shareholders of choosing equityinvestments. In recent quarters, the EP ratio has fallen below the return on bonds.Traditionally, the EP ratio has fallen below this real bond rate when earnings areexpected to rise dramatically.
15. Real Bond Rate: Moody's composite yield of A-rated corporate bonds less theexpected rate of inflation over the next 10 years, as measured by the consumerprice index from the Survey of Professional Forecasters, published by the FederalReserve Bank of Philadelphia.
16. Moody's Ratings: For each time period, Moody's upgrades and downgrades securities

for companies issuing investment grade (above ba1) or speculative grade (belowba1) debt. These series show the total dollar amount in billions of all theoutstanding securities in a rating class that are upgraded or downgraded. The dataare collected by company and by each group of rated securities that the companyissued, then aggregated to form the data presented in the charts.
17. Default and Failure Rates: The default rate shows the frequency of failure ofcorporate junk bond issuers to meet their covenant with the respective bondholders. Breach of covenant can occur from missed interest payments or if thecorporation files Chapter 11 or 13. In this case, junk bonds are defined as thoserated below ba1 by Moody's, and the rate is calculated by summing the amount ofdefaulted debt in dollars and dividing it by the total outstanding junk-rated debt.The business failure rate refers to companies filing for one of the four bankruptcylaws, Chapters 7, 11, 12, and 13. The failure rate series is calculated by dividingall of the balance sheet assets of those corporations that file for bankruptcy by theoutstanding assets of all corporations. The series is not limited to issuers of anyparticular grade of debt securities.
18. Gross Proceeds from Security Issuance: The Federal Reserve Board collects securityissuance data for bonds and stocks. In this case, 'bonds' refers to the grossproceeds from the issuance of all U.S. corporate bonds, issued domestically and inforeign markets, including private placements. The 'Stocks' series is all primarycorporate offerings in domestic markets of common and preferred stock.
19. Realized Long-Term Capital Gains: Data include returns with positive long-termgains in excess of any short-term losses. Data for each year include some prioryear tax returns.