MONTHLY STATISTICAL REPORT MINISTRY OF COAL SEPT 2020
141
MONTHLY STATISTICAL REPORT MINISTRY OF COAL SEPT 2020 O/o Deputy Director General A-Wing, 5 th Floor, Lok Nayak Bhavan, Lok Nayak Bhavan, New Delhi-110003.
Transcript of MONTHLY STATISTICAL REPORT MINISTRY OF COAL SEPT 2020

MONTHLY STATISTICAL REPORT
MINISTRY OF COAL
SEPT 2020
O/o Deputy Director General
A-Wing, 5th Floor, Lok Nayak Bhavan,
Lok Nayak Bhavan, New Delhi-110003.


MONTHLY STATISTICAL REPORT
MINISTRY OF COAL
SEPT 2020
O/o Deputy Director General
A-Wing, 5th Floor, Lok Nayak Bhavan


Preface
The Monthly Coal Statistics for the month of Sept 2020 is placed below.
Ministry of Coal gets various reports/returns from CIL along with its
Subsidiaries, SCCL and NLCIL, Monthly DO Letters from CMDs of all
Companies to the Secretary (Coal). Also the Captive Block Owners and Lignite
Block Owners provide information on monthly basis regarding production and
despatch. Based on these sources, compilation has been made for the use of
various stakeholders.
It is to disclose that all the information provided are of provisional in nature.


Table of Contents
Chapter Name Table Page
All India Summary
Summary of Coal Production 1
Summary of Coal Despatch 1
Summary of Lignite Production 1
Summary of Lignite Despatch 2
State-wise Coal Production 2
Sector-wise Coal Despatch 2
Coal Production By "Others" 3-6
Analysis of Big Mines of CIL
Production Analysis of Big Mines of CIL 7-22
OBR Analysis of Big Mines of CIL 23-38
Exploration Drilling Performance 39
Performance of Coal PSUs
Production Status 40-43
Productivity 44-45
OBR Status 46-47
HEMM Performance 48-49
Mode-Wise Coal Despatch 50-52
Detailed Sector-Wise Coal Despatch 52-55
Vendible Stock Position 56
Performance of NLCIL
Lignite Production Status 57
Status of Power Production 57
Productivity in Lignite Mining and Power 57
OBR Status 58
HEMM Performance 58
Power and Lignite Sales 58
Financial Performance
Capital Expenditure Status 59
Manpower Position 60
Sundry Debtors Status 60
Age-wise Debtors 60
Auction Status of Coal in CIL 61-66
Status of Electricity
Generation
Status of Electricity Generation 67-76
Projects of PSUs Status Of Major Ongoing Projects of CIL 77-84 Status of Major Ongoing Projects of NLCIL 85-95 Status of Major Ongoing Projects of SCCL 96-117


All India Summary


Table 1.1 : Summary of Coal Production All Production Figures in MT
FY 21 FY 20Growth M-O-M FY 21 FY 20
Growth Y-O-Y
1 ECL 55.02 2.79 2.81 -0.50 18.03 20.84 -13.472 BCCL 37.13 2.01 1.74 15.59 10.09 11.69 -13.643 CCL 86.00 4.83 3.27 47.46 20.27 22.61 -10.354 NCL 113.25 9.26 7.67 20.81 53.54 51.00 4.985 WCL 62.00 2.51 1.75 43.67 20.01 17.45 14.676 SECL 183.00 8.50 7.24 17.45 53.69 60.72 -11.577 MCL 173.00 10.58 6.28 68.51 63.87 56.51 13.018 NEC 0.60 0.00 0.03 -100.00 0.04 0.11 -63.64
710.00 40.48 30.78 31.53 239.54 240.93 -0.589 SCCL 67.50 3.34 4.24 -21.30 18.13 30.51 -40.57
10 Others 83.00 3.92 4.50 -12.92 27.76 27.79 -0.10860.50 47.73 39.51 20.80 285.43 299.22 -4.61
Table 1.2 : Summary of Coal Despatch
FY 21 FY 20Growth M-O-M FY 21 FY 20
Growth Y-O-Y
1 ECL 55.02 2.88 2.80 3.08 19.07 22.50 -15.242 BCCL 37.13 2.44 2.03 20.34 10.41 13.90 -25.083 CCL 86.00 5.89 4.43 32.96 26.83 33.10 -18.944 NCL 113.25 9.22 7.95 16.05 49.69 51.10 -2.745 WCL 62.00 3.77 2.36 60.25 19.07 23.51 -18.916 SECL 183.00 10.40 8.39 23.96 61.69 67.73 -8.927 MCL 173.00 12.01 7.35 63.49 67.78 63.96 5.978 NEC 0.60 0.04 0.09 0.20 -54.08
710.00 46.62 35.32 31.98 254.62 276.00 -7.749 SCCL 67.50 3.68 4.36 -15.65 17.85 30.52 -41.50
10 Captives 83.00 4.34 4.68 -7.20 29.45 28.56 3.12860.50 54.64 44.36 23.17 301.93 335.08 -9.89
Table 1.3: Summary of Lignite Production
FY 21 FY 20Growth M-O-M FY 21 FY 20
Growth Y-O-Y
1 NLCIL 25.22 1.33 2.15 -38.20 8.68 10.58 -17.952 GMDCL 7.10 0.299 0.29 3.82 1.89 3.43 -45.053 GIPCL 0.00 0 0.00 1.36 1.25 8.974 RSMML 12.00 0.038 0.02 72.73 0.20 0.34 -41.865 BLMCL 7.00 0.609 0.41 50.00 2.68 2.60 2.966 GHCL 0.40 0 0.00 0.00 0.05 -100.007 VS Lignite 1.00 0.085 0.00 0.50 0.29 75.87
52.72 2.361 2.868 -17.68 15.308 18.540 -17.43Grand Total
Annual TargetProduction During Sept Progressive Despatch
All Production Figures in MT
Sl No Company Annual TargetProduction During Sept Progressive Production
CIL
Grand Total
Grand Total
Details of Coal Production from Others is in the Table 1.1 (A) in the Annex 1
Details of Coal Despatch from Others is in the Table 1.2 (A) in the Annex 1
CIL
All Despatch Figures in MT
Sl No Subs
Sl No Subs Annual TargetProduction During Sept Progressive Production
1

Table 1.4: Summary of Lignite Despatch
FY 21 FY 20Growth M-O-M FY 21 FY 20
Growth Y-O-Y
1 NLCIL 25.22 1.28 2.02 -36.73 8.44 9.72 -13.142 GMDCL 7.10 0.30 0.29 3.82 1.59 1.89 -15.853 GIPCL 0.00 0.00 0.00 1.36 1.36 0.004 RSMML 12.00 0.04 0.02 72.73 0.16 0.20 -19.005 BLMCL 7.00 0.65 0.42 54.29 2.78 3.42 -18.936 GHCL 0.40 0.00 0.01 -57.14 0.01 0.01 -25.007 VS Lignite 1.00 0.08 0.00 0.40 0.48 -17.36
52.72 2.349 2.757 -14.799 14.732 17.080 -13.75
Table 1.5: State-wise Coal Production
FY 21 FY 20Growth M-o-M FY 21 FY 20
Growth Y-o-Y
JH 8.475 7.481 13.28 109.76 50.328 118.09OR 10.784 6.358 69.61 1.14 56.885 -98.00CG 8.799 7.674 14.66 54.86 62.542 -12.29MP 10.094 8.804 14.65 62.20 57.957 7.32MH 2.291 1.608 42.48 18.42 16.316 12.90UP 1.710 1.350 26.67 8.06 9.620 -16.22WB 2.075 1.838 12.90 11.84 14.236 -16.84AS 0.000 0.030 0.04 0.110 -63.64TL 3.504 4.370 -19.82 19.11 31.220 -38.80JK 0.001 0.001 0.00 0.01 0.006 0.00Total 47.73 39.51 20.80 285.43 299.22 -4.61
Table 1.6: Coal Despatch to Different Sectors
FY 21 FY 20Growth M-o-M FY 21 FY 20
Growth Y-o-Y
43.424 36.526 18.89 238.424 266.990 -10.703.198 2.799 14.26 21.438 25.180 -14.860.671 0.948 -29.22 4.448 5.369 -17.150.511 0.472 8.26 2.683 4.288 -37.430.635 0.561 13.19 4.393 4.984 -11.866.199 3.050 103.25 30.537 28.259 8.0654.638 44.356 23.18 301.923 335.070 -9.89
Power
Company-wise Production State-wise is given in Tables 1.5 (A) and 1.5 (B) in the Annex 2
All Despatch Figures in MT
Sl No Company Annual TargetProduction During Sept Progressive Despatch
StateProduction During Sept Production Upto Sept
Grand Total
All Figures in MT
SectorsCoal Despatch During Sept Coal Despatch Upto Sept
OthersTotalCompany-wise Despatch is given in Table 1.6 (A) in the Annex 3
CPPSteelCementSponge Iron
2

Annex 1
Table 1.1 (A): Details of Coal Production By "Others"
FY 21 FY 20Growth M-o-M FY 21 FY 20
Growth Y-o-Y
0.001 0.001 0.00 0.006 0.006 0.000.005 0.025 -80.00 0.082 0.188 -56.380.013 0.007 85.71 0.047 0.166 -71.69
0 0 0.059 0.031 90.320.444 0.495 -10.30 2.943 3.085 -4.60
0 0.74 -100.00 3.516 4.371 -19.560.144 0.144 0.00 0.997 0.928 7.44
0 0 0.000 0.103 -100.000 0.059 -100.00 0.002 0.387 -99.48
0.015 0.025 -40.00 0.095 0.250 -62.000 0.022 -100.00 0.000 0.107 -100.000 0.017 0.018 0.041 -56.10
1.22 1.405 -13.17 8.975 8.730 2.811.021 0.97 5.26 5.216 5.825 -10.450.289 0.241 19.92 1.534 1.394 10.040.02 0.014 42.86 0.080 0.091 -12.09
0 0.017 -100.00 0.048 0.178 -73.030 0.043 -100.00 0.025 0.345 -92.75
0.167 0.13 28.46 0.976 0.711 37.270 0 0.000 0.104 -100.000 0.036 -100.00 0.169 0.201 -15.92
0.075 0.079 -5.06 0.758 0.372 103.760.023 0.028 -17.86 0.249 0.171 45.610.088 0.2760.062 0.182
0.29 1.4090 0.000
0.04 0.1033.92 4.50 -12.92 27.76 27.79 -0.11
All Fig in MTProduction During Sept Production Upto Sept
JKMLIISCOCJ
JSMDCLTATA NTPC/Pakri BarwadihCESC / SarshataliHIL-Gare Palma IV/5BALCO / ChotiaHIL-Gare Palma IV/4
RCCPL/ Sial GhogriTUML / Marki Mangli - IWBPDCL/Barjora TSGENCO/Tadicherla-IOCL/Ardhagram Coal Mine
WBPDCL/Gangaramchak-Talabira II & IIITotal Production by Others
Name of Coal Block/Company
IISCOR
Ambuja Cement Ltd / GP IV/8NTPC / DulangaWBPDCL/Barjora NorthOCPL/ManoharpurNTPC/Talaipalli
SIL / BelgaonHIL/KathautiaSPL / Moher & Amlohori Extn.RRVUNL / PEKB
WBPDCL/Pachwara North
JPVL / Amelia (North)
3

Annex 1
Table 1.1 (B): Details of Coal Despatch By "Others"
FY 21 FY 20Growth M-o-M FY 21 FY 20
Growth Y-o-Y
0.001 0.002 -50.00 0.006 0.014 -57.140.005 0.025 -80.00 0.082 0.188 -56.380.013 0.007 85.71 0.047 0.166 -71.690.000 0.000 0.046 0.029 58.620.445 0.493 -9.74 2.984 3.086 -3.310.000 0.736 -100.00 3.186 4.562 -30.160.176 0.150 17.33 1.055 0.989 6.670.000 0.003 -100.00 0.000 0.097 -100.000.000 0.081 -100.00 0.309 0.458 -32.530.022 0.029 -24.14 0.125 0.254 -50.790.011 0.028 -60.71 0.022 0.102 -78.430.000 0.018 -100.00 0.024 0.243 -90.121.376 1.529 -10.01 8.885 8.861 0.271.021 0.970 5.26 5.216 5.825 -10.450.256 0.271 -5.54 1.428 1.326 7.690.020 0.013 53.85 0.080 0.088 -9.090.010 0.019 -47.37 0.055 0.175 -68.570.000 0.047 -100.00 0.023 0.407 -94.350.159 0.123 29.27 0.964 0.704 36.930.000 0.000 0.000 0.104 -100.000.000 0.028 -100.00 0.125 0.176 -28.980.272 0.058 368.97 1.251 0.562 122.600.015 0.049 -69.39 0.297 0.146 103.420.096 0.7510.103 0.3330.334 1.5490.007 0.6090.000 0.0004.34 4.68 -7.20 29.45 28.56 3.12Total Despatch by Others
WBPDCL/Barjora TSGENCO/Tadicherla-IOCL/Ardhagram Coal MineAmbuja Cement Ltd / GP IV/8NTPC / DulangaWBPDCL/Barjora NorthOCPL/ManoharpurNTPC/TalaipalliWBPDCL/Pachwara NorthWBPDCL/Gangaramchak-Talabira II & III
TUML / Marki Mangli - I
NTPC/Pakri BarwadihCESC / SarshataliHIL-Gare Palma IV/5BALCO / ChotiaHIL-Gare Palma IV/4SIL / BelgaonHIL/KathautiaSPL / Moher & Amlohori Extn.RRVUNL / PEKBJPVL / Amelia (North)RCCPL/ Sial Ghogri
Production Upto Sept
JKMLIISCOCJIISCORJSMDCLTATA
Name of Coal Block/Company
All Fig in MTProduction During Sept
4

Annex 2
Table 1.5 (A): Company-wise and State-wise Coal Production During Sept 20Subs / Com JH OR CG MP MH UP WB TL AS JK Total
ECL 0.90 1.89 2.79BCCL 2.01 0.00 2.01CCL 4.83 4.83NCL 7.550 1.71 9.26WCL 0.22 2.291 2.51SECL 7.701 0.80 8.50MCL 10.581 10.58NEC 0.00SCCL 3.337 3.34Others 0.739 0.203 1.098 1.529 0.180 0.167 0.001 3.92Total 8.48 10.78 8.80 10.09 2.29 1.71 2.08 3.50 0.00 0.00 47.733
Table 1.5 (B): Company-wise and State-wise Coal Production Upto Sept 20Subs / Com JH OR CG MP MH UP WB TL AS JK Total
ECL 7.515 10.518 18.03BCCL 10.089 0.004 10.09CCL 20.266 20.27NCL 45.479 8.060 53.54WCL 1.636 18.373 20.01SECL 49.194 4.499 53.69MCL 63.866 63.87NEC 0.040 0.04SCCL 18.131 18.13Others 8.025 1.136 5.663 10.588 0.048 1.317 0.975 0.006 27.76Total 109.76 1.14 54.86 62.20 18.42 8.06 11.84 19.11 0.04 0.01 285.43
Figures in MT
Figures in MT
5

Annex 3
Table 1.6 (A) : Sector-wise Despatch of Coal By CIL
FY 21 FY 20Growth M-o-M FY 21 FY 20
Growth Y-o-Y
36.47 28.77 26.78 197.58 217.39 -9.112.97 2.59 14.59 20.48 23.45 -12.670.19 0.30 -36.61 0.95 1.09 -12.840.35 0.32 10.76 1.89 2.81 -32.740.63 0.56 13.42 4.38 4.92 -10.986.01 2.80 115.06 29.34 26.34 11.3946.62 35.32 31.99 254.62 276.00 -7.75
Table 1.6 (A): Sector-wise Despatch of Coal By SCCL
FY 21 FY 20Growth M-o-M FY 21 FY 20
Growth Y-o-Y
3.117 3.776 -17.45 15.149 25.624 -40.880.230 0.209 10.05 0.958 1.730 -44.62
0.141 0.115 22.61 0.589 1.214 -51.480.001 0.002 -50.00 0.013 0.064 -79.690.187 0.253 -26.09 1.145 1.876 -38.973.68 4.36 -15.59 17.85 30.52 -41.50
Table 1.6 (A) : Sector-wise Coal Despatch by Others
FY 21 FY 20Growth M-o-M FY 21 FY 20
Growth Y-o-Y
3.837 3.983 -3.67 25.695 23.976 7.17
0.484 0.653 -25.88 3.498 4.279 -18.250.020 0.041 -51.22 0.204 0.264 -22.73
0.001 0.002 -50.00 0.052 0.043 20.934.34 4.68 -7.22 29.45 28.56 3.10
Figures in MT
Figures in MT
Figures in MT
CPPSteel
Coal Despatch During Sept Coal Despatch Upto Sept
Coal Despatch Upto Sept
PowerCPPSteelCementSponge Iron
CementSponge IronOthers
Sponge IronOthersTotal
OthersTotal
Sectors
Power
SectorsCoal Despatch During Sept
SectorsCoal Despatch During Sept
Cement
Coal Despatch Upto Sept
PowerCPPSteel
Total
6

Analysis of Big Mines of CIL


Table 2.1: Summary of Production of Big Mines of CIL All Figures in MT
FY 21 FY 20Growth M-o-M FY 21 FY 20
Growth Y-o-Y
1.15 1.53 -24.52 9.51 10.96 -13.230.37 0.33 11.45 2.15 2.36 -8.731.52 1.86 -18.09 11.67 13.32 -12.431.27 0.95 33.16 6.36 7.52 -15.352.79 2.81 -0.71 18.03 20.84 -13.480.00 0.00 0.00 0.001.30 1.22 7.06 6.34 7.62 -16.801.30 1.22 7.06 6.34 7.62 -16.800.71 0.52 35.25 3.75 4.07 -7.842.01 1.74 15.52 10.09 11.69 -13.693.21 1.73 86.10 12.29 11.63 5.680.55 0.66 -15.83 3.05 4.71 -35.213.77 2.38 57.99 15.34 16.34 -6.101.07 0.89 20.07 4.93 6.27 -21.424.83 3.27 47.71 20.27 22.61 -10.358.90 7.35 21.04 51.44 48.95 5.090.36 0.31 14.97 2.09 2.05 2.059.26 7.67 20.80 53.54 51.00 4.970.00 0.00 0.00 0.00 -100.009.26 7.67 20.73 53.54 51.00 4.980.33 0.25 30.40 1.28 1.74 -26.590.99 0.72 37.86 8.06 7.85 2.611.32 0.97 35.94 9.34 9.60 -2.691.19 0.78 52.76 10.67 7.86 35.882.51 1.75 43.43 20.01 17.45 14.676.21 5.43 14.25 40.55 45.82 -11.501.19 0.64 84.45 6.59 7.84 -15.957.39 6.07 21.68 47.14 53.66 -12.151.11 1.17 -4.89 6.55 7.06 -7.258.50 7.24 17.40 53.69 60.72 -11.58
10.54 6.07 73.68 63.66 55.21 15.300.00 0.15 -100.00 0.21 0.89 -76.01
10.54 6.21 69.60 63.87 56.10 13.840.04 0.07 -35.82 0.00 0.41 -100.00
10.58 6.28 68.47 63.87 56.51 13.0230.33 22.35 35.70 178.73 174.32 2.53
4.77 4.03 18.28 28.50 33.33 -14.4835.10 26.38 33.04 207.23 207.64 -0.20
5.38 4.40 22.45 32.31 33.28 -2.9440.48 30.78 31.53 239.54 240.93 -0.58
1.70 1.66 1.93 5.95 8.14 -26.870.59 1.27 -53.12 3.03 7.17 -57.742.29 2.93 -21.88 8.98 15.31 -41.331.05 1.31 -20.00 9.15 15.20 -39.813.34 4.24 -21.30 18.13 30.51 -40.57
Other MinesBig Plus MinesRest of MinesTotal SCCL
BCCL
Big MinesOther MinesBig Plus MinesRest of MinesTotal BCCL
CCL
Big MinesOther MinesBig Plus MinesRest of MinesTotal CCL
Production Upto Sept
DescriptionSubsidiary
ECL
Big MinesOther MinesBig Plus MinesRest of MinesTotal ECL
Production During Sept
NCL
Big MinesOther MinesBig Plus MinesRest of MinesTotal NCL
WCL
Big MinesOther MinesBig Plus MinesRest of MinesTotal WCL
SECL
Big MinesOther MinesBig Plus MinesRest of MinesTotal SECL
MCL
Big MinesOther MinesBig Plus MinesRest of MinesTotal MCL
CIL
Big MinesOther MinesBig Plus MinesRest of MinesTotal CIL
SCCL
Big Mines
7

FY 21 FY 20Growth M-o-M FY 21 FY 20
Growth Y-o-Y
Production Upto Sept
DescriptionSubsidiary
Production During Sept
3.74 4.20 -11.08 26.60 25.42 4.660.18 0.29 -39.12 1.15 2.37 -51.253.92 4.50 -12.92 27.76 27.79 -0.11
41.13 33.52 22.70 242.82 248.37 -2.246.61 6.00 10.18 42.61 50.85 -16.21
47.73 39.51 20.80 285.43 299.22 -4.61
Details of Subsidiary/Company-wise Production Status is given in subsequent Tables
All IndiaBig MinesOther MinesAll Mines
Captive & Others
Big MinesOther MinesTotal Others
8

Table 2.1.1 (A) : Departmental Coal Production ECL All Figures in MT
FY 21 FY 20 Growth M-o-M FY 21 FY 20 Growth
Y-o-YRajmahal Big 0 0 0.005 0.000Sonepur Bazari Big 0.189 0.16 18.13 1.009 1.432 -29.54Jhajhra UG Others 0.334 0.185 80.54 1.789 1.440 24.24Chitra East Others 0.036 0.147 -75.51 0.365 0.920 -60.33
0.022 0.160 -86.25 1.014 1.432 -29.190.370 0.332 11.45 2.154 2.360 -8.730.392 0.492 -20.33 3.168 3.792 -16.460.818 0.668 22.46 4.202 4.678 -10.181.210 1.160 4.31 7.370 8.470 -12.99
Table 2.1.1 (B): Contractual Coal Production ECL
FY 21 FY 20 Growth M-o-M FY 21 FY 20 Growth
Y-o-YRajmahal Big 0.646 0.942 -31.42 6.11 6.679 -8.58Sonepur Bazari Big 0.483 0.423 14.18 2.39 2.851 -16.10Jhajhra UG Others 0 0.00 0.000Chitra East Others 0 0.00 0.000
1.129 1.365 -17.29 8.498 9.530 -10.830.000 0.000 0.000 0.0001.129 1.365 -17.29 8.498 9.530 -10.830.451 0.285 58.25 2.162 2.840 -23.871.580 1.650 -4.24 10.660 12.370 -13.82
Table 2.1.1 (C) : Total Coal Production ECL
FY 21 FY 20 Growth M-o-M FY 21 FY 20 Growth
Y-o-YRajmahal Big 0.646 0.942 -31.42 6.111 6.679 -8.50Sonepur Bazari Big 0.672 0.583 15.27 3.401 4.283 -20.59Jhajhra UG Others 0.334 0.185 80.54 1.789 1.440 24.24Chitra East Others 0.036 0.147 -75.51 0.365 0.920 -60.33
1.151 1.525 -24.52 9.512 10.962 -13.230.370 0.332 11.45 2.154 2.360 -8.731.521 1.857 -18.09 11.666 13.322 -12.431.269 0.953 33.16 6.364 7.518 -15.352.790 2.810 -0.71 18.030 20.840 -13.48
Type
Type
Total Big Plus MinesTotal Rest of MinesTotal ECL
Total Big Plus MinesTotal Rest of MinesTotal ECL
Total Big MinesTotal Others
Mine
Production During Sept Production Upto Sept
Production During Sept Production Upto Sept
Mine
Mine
Production During Sept Production Upto Sept
Total Big MinesTotal OthersTotal Big Plus MinesTotal Rest of MinesTotal ECL
Total Big MinesTotal Others
Type
9

Table 2.1.2 (A): Departmental Coal Production BCCL All Figures in MT
FY 21 FY 20 Growth M-o-M FY 21 FY 20 Growth
Y-o-YNT ST Je Others 0.022 0.007 214.29 0.075 0.216 -65.28AKWMC Others 0.062 0.051 21.57 0.431 0.406 6.16Phularitand Others 0.004 0.003 33.33 0.027 0.019 42.11S Bansjora Others 0 0 0.000 0.000NGKAC Others 0 0 0.000 0.000ROCP Others 0 0 0.000 0.220 -100.00KOCP Others 0.073 0.005 1360.00 0.315 0.055 472.73ABOCP Others 0.161 0.118 36.44 0.585 0.696 -15.95B Dahibari Others 0.051 0.058 -12.07 0.275 0.378 -27.25
0.000 0.000 0.000 0.0000.373 0.242 54.13 1.708 1.990 -14.170.373 0.242 54.13 1.708 1.990 -14.170.227 0.248 -8.47 1.232 1.850 -33.410.600 0.490 22.45 2.940 3.840 -23.44
Table 2.1.2 (B)Contractual Coal Production BCCL
FY 21 FY 20 Growth M-o-M FY 21 FY 20 Growth
Y-o-YNT ST Je Others 0.201 0.105 91.43 0.671 0.444 51.13AKWMC Others 0.204 0.229 -10.92 1.003 1.340 -25.15Phularitand Others 0.2 0.236 -15.25 1.076 1.286 -16.33S Bansjora Others 0.064 0.101 -36.63 0.480 0.553 -13.20NGKAC Others 0.045 0.081 -44.44 0.180 0.522 -65.52ROCP Others 0.088 0.114 -22.81 0.438 0.836 -47.61KOCP Others 0.05 0.11 -54.55 0.435 0.649 -32.97ABOCP Others 0.079 0 0.351 0.000B Dahibari Others 0 0 0.000 0.003 -100.00
0.000 0.000 0.000 0.0000.931 0.976 -4.61 4.634 5.633 -17.730.931 0.976 -4.61 4.634 5.633 -17.730.479 0.264 81.44 2.516 2.217 13.491.410 1.240 13.71 7.150 7.850 -8.92
Type
Total Big Plus MinesTotal Rest of MinesTotal BCCL
Mine
Production During Sept Production Upto Sept
Mine
Production During Sept Production Upto Sept
Total Big MinesTotal OthersTotal Big Plus MinesTotal Rest of MinesTotal BCCL
Total Big MinesTotal Others
Type
10

Table 2.1.2 (C)Total Coal Production BCCL
FY 21 FY 20 Growth M-o-M FY 21 FY 20 Growth
Y-o-YNT ST Je Others 0.223 0.112 99.11 0.746 0.660 13.03AKWMC Others 0.266 0.280 -5.00 1.434 1.746 -17.87Phularitand Others 0.204 0.239 -14.64 1.103 1.305 -15.48S Bansjora Others 0.064 0.101 -36.63 0.480 0.553 -13.20NGKAC Others 0.045 0.081 -44.44 0.180 0.522 -65.52ROCP Others 0.088 0.114 -22.81 0.438 1.056 -58.52KOCP Others 0.123 0.115 6.96 0.750 0.704 6.53ABOCP Others 0.240 0.118 103.39 0.936 0.696 34.48B Dahibari Others 0.051 0.058 -12.07 0.275 0.381 -27.82
0.000 0.000 0.000 0.0001.304 1.218 7.06 6.342 7.623 -16.801.304 1.218 7.06 6.342 7.623 -16.800.706 0.522 35.25 3.748 4.067 -7.842.010 1.740 15.52 10.090 11.690 -13.69
Type
Total Big Plus MinesTotal Rest of MinesTotal BCCL
Total Big MinesTotal Others
Mine
Production During Sept Production Upto Sept
11

Table 2.1.3 (A): Departmental Coal Production CCL All Figures in MT
FY 21 FY 20 Growth M-o-M FY 21 FY 20 Growth
Y-o-YAshoka Big 0.071 0.002 3450.00 0.166 0.272 -38.97Piparwar Big 0 0.07 -100.00 0.044 0.233 -81.12Amarpali Big 0 0 0.000 0.000AKK Big 0.012 0.107 -88.79 0.020 0.609 -96.72Govindpur Ph II Others 0.063 0.054 16.67 0.134 0.411 -67.40Rohini Others 0.025 0.016 56.25 0.055 0.070 -21.43Purnadih Others 0.077 0.028 175.00 0.314 0.313 0.32Magadh Big 0 0 0.000 0.000Tapin North Others 0.016 0.027 -40.74 0.157 0.237 -33.76Birsa Project Others 0 0.009 -100.00 0.008 0.125 -93.60Karo Big 0 0 0.000 0.000Topa OC Others 0.067 0.088 -23.86 0.326 0.547 -40.40
0.083 0.179 -53.63 0.230 1.114 -79.350.248 0.222 11.71 0.994 1.703 -41.630.331 0.401 -17.46 1.224 2.817 -56.550.689 0.519 32.76 3.096 3.783 -18.161.020 0.920 10.87 4.320 6.600 -34.55
Table 2.1.3 (B) Contractual Coal Production CCL
FY 21 FY 20 Growth M-o-M FY 21 FY 20 Growth
Y-o-YAshoka Big 1.028 0.447 129.98 4.362 3.943 10.63Piparwar Big 0 0.242 -100.00 0.473 1.375 -65.60Amarpali Big 1.084 0.167 549.10 3.441 1.737 98.10AKK Big 0.135 0.206 -34.47 0.964 1.294 -25.50Govindpur Ph II Others 0.071 0.049 44.90 0.606 0.364 66.48Rohini Others 0.034 0.178 -80.90 0.600 1.060 -43.40Purnadih Others 0 0.07 -100.00 0.000 0.366 -100.00Magadh Big 0.676 0.261 159.00 2.163 1.055 105.02Tapin North Others 0 0 0.000 0.000Birsa Project Others 0.2 0.138 44.93 0.851 1.216 -30.02Karo Big 0.206 0.224 -8.04 0.658 1.112 -40.83Topa OC Others 0 0 0.000 0.000
3.129 1.547 102.26 12.061 10.516 14.690.305 0.435 -29.89 2.057 3.006 -31.573.434 1.982 73.26 14.118 13.522 4.410.376 0.378 -0.53 1.832 2.488 -26.373.810 2.360 61.44 15.950 16.010 -0.37
Type
Total Big Plus MinesTotal Rest of MinesTotal CCL
Mine
Production During Sept Production Upto Sept
Mine
Production During Sept Production Upto Sept
Total Big MinesTotal OthersTotal Big Plus MinesTotal Rest of MinesTotal CCL
Total Big MinesTotal Others
Type
12

Table 2.1.3 (C) :Total Coal Production CCL
FY 21 FY 20 Growth M-o-M FY 21 FY 20 Growth
Y-o-YAshoka Big 1.099 0.449 144.77 4.528 4.215 7.43Piparwar Big 0 0.312 -100.00 0.517 1.608 -67.85Amarpali Big 1.084 0.167 549.10 3.441 1.737 98.10AKK Big 0.147 0.313 -53.04 0.984 1.903 -48.29Govindpur Ph II Others 0.134 0.103 30.10 0.740 0.775 -4.52Rohini Others 0.059 0.194 -69.59 0.655 1.13 -42.04Purnadih Others 0.077 0.098 -21.43 0.314 0.679 -53.76Magadh Big 0.676 0.261 159.00 2.163 1.055 105.02Tapin North Others 0.016 0.027 -40.74 0.157 0.237 -33.76Birsa Project Others 0.2 0.147 36.05 0.859 1.341 -35.94Karo Big 0.206 0.224 -8.04 0.658 1.112 -40.83Topa OC Others 0.067 0.088 -23.86 0.326 0.547 -40.40
3.212 1.726 86.10 12.291 11.63 5.680.553 0.657 -15.83 3.051 4.709 -35.213.765 2.383 57.99 15.342 16.339 -6.101.065 0.887 20.07 4.928 6.271 -21.424.830 3.270 47.71 20.270 22.610 -10.35
Type
Total Big Plus MinesTotal Rest of MinesTotal CCL
Total Big MinesTotal Others
Mine
Production During Sept Production Upto Sept
13

Table 2.1.4 (A): Departmental Coal Production NCL All Figures in MT
FY 21 FY 20 Growth M-o-M FY 21 FY 20 Growth
Y-o-YNigahi Big 1.68 1.39 20.86 9.937 9.364 6.12Jayant Big 1.69 1.459 15.83 10.189 9.516 7.07Dudhichua Big 1.64 1.29 27.21 9.379 8.891 5.49Amlohri Big 1.07 0.773 38.42 5.280 4.920 7.32Khadia Big 1.09 0.925 17.30 6.239 6.222 0.27Bina Big 0.67 0.49 36.33 3.973 3.596 10.48Krishnashila Big 0.58 0.56 3.75 3.566 3.656 -2.46Block B Big 0.48 0.464 4.09 2.881 2.787 3.37Jingurda Others 0.20 0.208 -3.37 1.075 1.275 -15.69Kakari Others 0.16 0.106 50.94 1.018 0.776 31.19
8.898 7.351 21.04 51.444 48.952 5.090.361 0.314 14.97 2.093 2.051 2.059.26 7.67 20.80 53.54 51.00 4.970.00 0.00 0.00 0.00 -100.009.26 7.67 20.73 53.54 51.00 4.98
Table 2.1.4 (B): Total Coal Production NCL
FY 21 FY 20 Growth M-o-M FY 21 FY 20 Growth
Y-o-YNigahi Big 1.680 1.390 20.86 9.937 9.364 6.12Jayant Big 1.690 1.459 15.83 10.189 9.516 7.07Dudhichua Big 1.641 1.290 27.21 9.379 8.891 5.49Amlohri Big 1.070 0.773 38.42 5.280 4.920 7.32Khadia Big 1.085 0.925 17.30 6.239 6.222 0.27Bina Big 0.668 0.490 36.33 3.973 3.596 10.48Krishnashila Big 0.581 0.560 3.75 3.566 3.656 -2.46Block B Big 0.483 0.464 4.09 2.881 2.787 3.37Jingurda Others 0.201 0.208 -3.37 1.075 1.275 -15.69Kakari Others 0.160 0.106 50.94 1.018 0.776 31.19
8.898 7.351 21.04 51.444 48.952 5.090.361 0.314 14.97 2.093 2.051 2.059.26 7.67 20.80 53.54 51.00 4.970.00 0.00 0.00 0.00 -100.009.26 7.67 20.73 53.54 51.00 4.98
Total Big MinesTotal OthersTotal Big Plus MinesTotal Rest of MinesTotal NCL
Mine
Production During Sept Production Upto Sept
Mine
Production During Sept Production Upto Sept
Total Big MinesTotal OthersTotal Big Plus MinesTotal Rest of MinesTotal NCL
Type
Type
14
Table 2.1.5 (A): Departmental Coal Production WCL All Figures in MT
FY 21 FY 20 Growth M-o-M FY 21 FY 20 Growth
Y-o-YDurgapur -(Sec.-V) Others 0.019 0.016 18.75 0.436 0.152 186.84Sasti Others 0.096 0.066 45.45 0.497 0.376 32.18NM-Sector-I & II (A) Others 0.019 0.03 0.202 0.485 -58.35Niljai Deep Others 0.012 0.036 -66.67 0.896 0.763 17.43Mungoli Others 0.18 0.051 252.94 1.173 0.862 36.08Penganga Big 0.097 0.03 223.33 0.179 0.165 8.48Ukni Others 0 0.032 -100.00 0.285 0.465 -38.71Gondegaon Others 0.153 0.095 61.05 0.848 0.775 9.42Umrer Others 0.034 0.052 -34.62 0.275 0.766 -64.10Makardhokra-I Others 0 0 0.000 0.000Gokul Others 0 0 0.000 0.000MKD-III Others 0 0 0.029 0.000
0.097 0.030 223.33 0.179 0.165 8.480.513 0.378 35.71 4.641 4.644 -0.060.610 0.408 49.51 4.820 4.809 0.230.820 0.662 23.87 5.040 5.871 -14.151.430 1.070 33.64 9.860 10.680 -7.68
Table 2.1.5 (B) Contractual Coal Production WCL
FY 21 FY 20 Growth M-o-M FY 21 FY 20 Growth
Y-o-YDurgapur -(Sec.-V) Others 0 0 0.000 0.000Sasti Others 0 0 0.000 0.000NM-Sector-I & II (A) Others 0 0 0.000 0.000Niljai Deep Others 0 0 0.000 0.000Mungoli Others 0 0 0.000 0.000Penganga Big 0.229 0.22 4.09 1.099 1.576 -30.27Ukni Others 0 0 0.000 0.000Gondegaon Others 0.127 0.026 388.46 0.610 0.494 23.48Umrer Others 0.089 0.135 -34.07 0.593 0.775 -23.48Makardhokra-I Others 0.144 0.052 176.92 0.750 0.324 131.48Gokul Others 0 0.084 -100.00 0.855 0.904 -5.42MKD-III Others 0.121 0.046 163.04 0.610 0.713 -14.45
0.229 0.220 4.09 1.099 1.576 -30.270.481 0.343 40.23 3.418 3.210 6.480.710 0.563 26.11 4.517 4.786 -5.620.360 0.107 236.45 5.633 1.984 183.921.070 0.670 59.70 10.150 6.770 49.93
Total Big Mines
Type
Mine
Production During Sept Production Upto Sept
Total Big MinesTotal OthersTotal Big Plus Mines
Type
Total Rest of MinesTotal WCL
Mine
Production During Sept Production Upto Sept
Total OthersTotal Big Plus MinesTotal Rest of MinesTotal WCL
15

Table 2.1.5 (C) :Total Coal Production WCL
FY 21 FY 20 Growth M-o-M FY 21 FY 20 Growth
Y-o-YDurgapur -(Sec.-V) Others 0.019 0.016 18.75 0.436 0.152 186.84Sasti Others 0.096 0.066 45.45 0.497 0.376 32.18NM-Sector-I & II (A) Others 0.019 0.03 0.202 0.485 -58.35Niljai Deep Others 0.012 0.036 -66.67 0.896 0.763 17.43Mungoli Others 0.18 0.051 252.94 1.173 0.862 36.08Penganga Big 0.326 0.25 30.40 1.278 1.741 -26.59Ukni Others 0 0.032 -100.00 0.285 0.465 -38.71Gondegaon Others 0.28 0.121 131.40 1.458 1.269 14.89Umrer Others 0.123 0.187 -34.22 0.868 1.541 -43.67Makardhokra-I Others 0.144 0.052 176.92 0.75 0.324 131.48Gokul Others 0 0.084 -100.00 0.855 0.904 -5.42MKD-III Others 0.121 0.046 163.04 0.639 0.713 -10.38
0.326 0.25 30.40 1.278 1.741 -26.590.994 0.721 37.86 8.059 7.854 2.611.32 0.971 35.94 9.337 9.595 -2.69
1.190 0.779 52.76 10.673 7.855 35.882.510 1.750 43.43 20.010 17.450 14.67Total WCL
TypeMine
Production Upto Sept
Total Big MinesTotal OthersTotal Big Plus MinesTotal Rest of Mines
Production During Sept
16

Table 2.1.6 (A): Departmental Coal Production SECL All Figures in MT
FY 21 FY 20 Growth M-o-M FY 21 FY 20 Growth
Y-o-YGevra Big 0.227 0.235 -3.40 1.410 1.913 -26.29Dipka Big 0.078 0.116 -32.76 0.679 0.457 48.58Kushmunda Big 0.171 0.104 64.42 1.510 1.300 16.15Chhal Others 0 0 0.000 0.000Manikpur Big 0.097 0.001 9600.00 0.323 0.059 447.46Baroud Others 0 0 0.000 0.000GP IV/2-3 Others 0 0 0.000 0.000Jampali Others 0 0 0.000 0.000Dhanpuri Others 0.003 0.004 -25.00 0.044 0.018 144.44Mahan II Others 0 0 0.000 0.000Amadand Others 0.003 0.002 50.00 0.036 0.120 -70.00Chirimiri Others 0.033 0.058 -43.10 0.289 0.466 -37.98Churcha UG Others 0.108 0.117 -7.69 0.763 0.753 1.33GP IV/1 Others 0 0 0.000 0.000
0.573 0.456 25.66 3.922 3.729 5.180.147 0.181 -18.78 1.132 1.357 -16.580.720 0.637 13.03 5.054 5.086 -0.631.010 1.023 -1.27 5.976 6.734 -11.261.730 1.660 4.22 11.030 11.820 -6.68
Table 2.1.6 (B): Contractual Coal Production SECL
FY 21 FY 20 Growth M-o-M FY 21 FY 20 Growth
Y-o-YGevra Big 2.31 1.607 43.75 14.289 15.617 -8.50Dipka Big 1.917 0.738 159.76 11.154 7.924 40.76Kushmunda Big 1.049 2.199 -52.30 8.941 16.032 -44.23Chhal Others 0.144 0 0.644 0.65 -0.92Manikpur Big 0.356 0.431 -17.40 2.245 2.517 -10.81Baroud Others 0.176 0.041 329.27 1.046 0.639 63.69GP IV/2-3 Others 0.2 0.115 73.91 1.272 1.25 1.76Jampali Others 0.168 0.015 1020.00 0.629 0.908 -30.73Dhanpuri Others 0.075 0.024 212.50 0.327 0.484 -32.44Mahan II Others 0.189 0.17 11.18 1.092 1.162 -6.02Amadand Others 0.086 0.097 -11.34 0.367 0.647 -43.28Chirimiri Others 0.001 0 0.079 0Churcha UG Others 0 0 0 0GP IV/1 Others 0 0 0 0.741 -100.00
5.632 4.975 13.21 36.629 42.090 -12.971.039 0.462 124.89 5.456 6.481 -15.826.671 5.437 22.70 42.085 48.571 -13.350.099 0.143 -30.77 0.575 0.329 74.776.770 5.580 21.33 42.660 48.900 -12.76
Type
Total Big Plus MinesTotal Rest of MinesTotal SECL
Mine
Production During Sept Production Upto Sept
Mine
Production During Sept Production Upto Sept
Total Big MinesTotal OthersTotal Big Plus MinesTotal Rest of MinesTotal SECL
Total Big MinesTotal Others
Type
17

Table 2.1.6 (C): Total Coal Production SECL
FY 21 FY 20 Growth M-o-M FY 21 FY 20 Growth
Y-o-YGevra Big 2.537 1.842 37.73 15.699 17.53 -10.44Dipka Big 1.995 0.854 133.61 11.833 8.381 41.19Kushmunda Big 1.22 2.303 -47.03 10.451 17.332 -39.70Chhal Others 0.144 0 0.644 0.65 -0.92Manikpur Big 0.453 0.432 4.86 2.568 2.576 -0.31Baroud Others 0.176 0.041 329.27 1.046 0.639 63.69GP IV/2-3 Others 0.2 0.115 73.91 1.272 1.25 1.76Jampali Others 0.168 0.015 1020.00 0.629 0.908 -30.73Dhanpuri Others 0.078 0.028 178.57 0.371 0.502 -26.10Mahan II Others 0.189 0.17 11.18 1.092 1.162 -6.02Amadand Others 0.089 0.099 -10.10 0.403 0.767 -47.46Chirimiri Others 0.034 0.058 -41.38 0.368 0.466 -21.03Churcha UG Others 0.108 0.117 -7.69 0.763 0.753 1.33GP IV/1 Others 0 0 0 0.741 -100.00
6.205 5.431 14.2515 40.551 45.819 -11.49741.186 0.643 84.4479 6.588 7.838 -15.94797.391 6.074 21.683 47.139 53.657 -12.1481.109 1.166 -4.889 6.551 7.063 -7.2498.500 7.240 17.40 53.690 60.720 -11.58
Type
Total Big Plus MinesTotal Rest of MinesTotal SECL
Total Big MinesTotal Others
Mine
Production During Sept Production Upto Sept
18

Table 2.1.7 (A): Departmental Coal Production MCL All Figures in MT
FY 21 FY 20 Growth M-o-M FY 21 FY 20 Growth
Y-o-YBhubaneswari Big 0 0 0.000 0.000Lakhanpur Big 0.334 0.056 496.43 1.650 1.065 54.93Bharatpur Big 0.006 0 0.018 0.000Lingaraj Big 0.612 0.236 159.32 8.734 2.810 210.82Samaleswari Big 0.1 0.136 -26.47 0.767 2.172 -64.69Kulda Big 0.139 0 0.564 0.000Kaniha Big 0 0 0.000 0.000Hingula Big 0.272 0.152 78.95 1.929 0.954 102.20Ananta Big 0.027 0.25 -89.20 0.160 1.354 -88.18Jagannath Big 0 0 0.000 0.028 -100.00Belpahar Big 0.03 0 0.293 0.104 181.73Lajkura Big 0 0 0.000 0.000Balram Big 0.52 0.211 146.45 2.269 1.972 15.06Basundhara (W) Others 0 0.146 -100.00 0.214 0.837 -74.43Garjanbahal Big 0.777 0.196 296.43 3.635 2.067 75.86
2.817 1.237 127.73 14.966 12.526 19.480.000 0.146 -100.00 0.214 0.837 -74.432.817 1.383 103.69 15.180 13.363 13.600.043 0.067 -35.82 0.000 0.417 -100.002.860 1.450 97.24 15.180 13.780 10.16
Table 2.1.7 (B): Contractual Coal Production MCL
FY 21 FY 20 Growth M-o-M FY 21 FY 20 Growth
Y-o-YBhubaneswari Big 2.275 1.564 45.46 14.784 11.469 28.90Lakhanpur Big 1.371 0.843 62.63 9.501 7.763 22.39Bharatpur Big 0.227 0.011 1963.64 1.216 2.679 -54.61Lingaraj Big 0.339 0.277 22.38 2.667 2.376 12.25Samaleswari Big 0.001 0.045 -97.78 0.050 1.097 -95.44Kulda Big 1.191 0.371 221.02 6.742 4.616 46.06Kaniha Big 0.58 0.249 132.93 3.868 2.657 45.58Hingula Big 0.103 0.023 347.83 0.458 0.801 -42.82Ananta Big 0.448 0.551 -18.69 2.844 3.356 -15.26Jagannath Big 0.293 0.124 136.29 2.082 0.875 137.94Belpahar Big 0.259 0.433 -40.18 1.923 2.880 -33.23Lajkura Big 0.392 0.338 15.98 1.470 2.009 -26.83Balram Big 0 0 0.000 0.107 -100.00Basundhara (W) Others 0 0 0.000 0.054 -100.00Garjanbahal Big 0.243 0.000 1.084 0.000
7.720 4.830 59.834 48.690 42.685 14.0680.000 0.000 0.000 0.055 -100.007.720 4.830 59.834 48.690 42.740 13.9210.000 0.000 0.000 0.0007.720 4.830 59.83 48.690 42.740 13.92
Type
Total Big Plus MinesTotal Rest of MinesTotal MCL
Mine
Production During Sept Production Upto Sept
Mine
Production During Sept Production Upto Sept
Total Big MinesTotal OthersTotal Big Plus MinesTotal Rest of MinesTotal MCL
Total Big MinesTotal Others
Type
19

Table 2.1.7 (C): Total Coal Production MCL
FY 21 FY 20 Growth M-o-M FY 21 FY 20 Growth
Y-o-YBhubaneswari Big 2.275 1.564 45.46 14.784 11.469 28.90Lakhanpur Big 1.705 0.899 89.66 11.151 8.828 26.31Bharatpur Big 0.233 0.011 2018.18 1.234 2.679 -53.94Lingaraj Big 0.951 0.513 85.38 11.401 5.186 119.84Samaleswari Big 0.101 0.181 -44.20 0.817 3.269 -75.01Kulda Big 1.330 0.371 258.49 7.306 4.616 58.28Kaniha Big 0.580 0.249 132.93 3.868 2.657 45.58Hingula Big 0.375 0.175 114.29 2.387 1.755 36.01Ananta Big 0.475 0.801 -40.70 3.004 4.710 -36.22Jagannath Big 0.293 0.124 136.29 2.082 0.903 130.56Belpahar Big 0.289 0.433 -33.26 2.216 2.984 -25.74Lajkura Big 0.392 0.338 15.98 1.470 2.009 -26.83Balram Big 0.520 0.211 146.45 2.269 2.079 9.14Basundhara (W) Others 0.000 0.146 -100.00 0.214 0.891 -75.98Garjanbahal Big 1.020 0.196 420.41 4.719 2.067 128.30
10.537 6.067 73.68 63.656 55.211 15.300.000 0.146 -100.00 0.214 0.892 -76.01
10.537 6.213 69.60 63.870 56.103 13.840.043 0.067 -35.82 0.000 0.407 -100.00
10.580 6.280 68.47 63.870 56.510 13.02
Type
Total Big Plus MinesTotal Rest of MinesTotal MCL
Total Big MinesTotal Others
Mine
Production During Sept Production Upto Sept
20

Table 2.1.8: Coal Production SCCL All Figures in MT
FY 21 FY 20 Growth M-o-M FY 21 FY 20 Growth
Y-o-YPKOC Big 0.45 0.43 4.73 1.73 2.59 -33.29RG OC III Extn. Big 0.60 0.47 28.16 2.04 2.68 -24.03JVR OCII Big 0.34 0.43 -20.29 0.92 1.39 -33.82Ramagundam OCI Exp. Ph II Big 0.30 0.34 -9.88 1.27 1.48 -14.24Gouthamkhani OC Others 0.20 0.31 -35.88 0.77 1.46 -47.14JVR OCI Exp. Others 0.00 0.17 -100.00 0.27 1.17 -76.92Koyagudem OC II Others 0.11 0.24 -51.78 0.45 1.29 -65.45Jawaharkhani 5 OC Others 0.14 0.25 -43.52 0.67 1.11 -39.53Srirampur OC II Others 0.11 0.21 -46.13 0.56 1.16 -51.24Khairagura OC Others 0.03 0.09 -68.04 0.31 0.98 -68.62
1.697 1.665 1.93 5.954 8.142 -26.870.595 1.269 -53.12 3.031 7.171 -57.742.292 2.933 -21.88 8.985 15.313 -41.331.045 1.307 -20.00 9.146 15.196 -39.813.337 4.240 -21.30 18.131 30.509 -40.57
Production During Sept Production Upto Sept
Total Big Mines
Rest of MinesTotal SCCL
Total Other MinesTotal Big Plus Mines
Mine Type
21

Table 2.1.9: Coal Production Captive & Others All Figures in MT
FY 21 FY 20 Growth M-o-M FY 21 FY 20 Growth
Y-o-YMoher & Amlohori Extn. Big 1.22 1.405 -13.17 8.975 8.730 2.81Parsa East & Kanta Basan Big 1.021 0.97 5.26 5.216 5.825 -10.45Pakri Barwadih Big 0 0.74 -100.00 3.516 4.371 -19.56Jamadoba & WB Big 0.444 0.495 -10.30 2.943 3.085 -4.60Amelia (North) Big 0.289 0.241 19.92 1.534 1.394 10.04Sarshatali Big 0.144 0.144 0.00 0.997 0.928 7.44Tadicherla-I Big 0.167 0.13 28.46 0.976 0.711 37.27 Dulanga Big 0.075 0.079 -5.06 0.758 0.372 103.76Manoharpur Big 0.088 0.276Pachwara North Big 0.29 1.409
3.738 4.204 -11.08 26.600 25.416 4.660.179 0.294 -39.12 1.155 2.369 -51.253.92 4.50 -12.92 27.76 27.79 -0.11Overall Captive & Othres
Production During Sept Production Upto SeptBlock Type
Total Big MinesRest of Mines
22

Table 2.2: Summary of OBR of Big Mines of CIL All Figures in MM3
FY 21 FY 20 Growth M-o-M FY 21 FY 20 Growth
Y-o-Y6.390 4.610 38.61 42.287 38.220 10.640.220 0.420 -47.62 1.410 2.920 -51.716.610 5.030 31.41 43.697 41.140 6.223.440 2.600 32.31 19.133 19.650 -2.63
10.050 7.630 31.72 62.830 60.790 3.360.006 0.000 0.000 0.0003.669 4.597 -20.19 24.305 26.425 -8.023.675 4.597 -20.06 24.305 26.425 -8.024.445 1.693 162.55 24.115 12.025 100.548.120 6.290 29.09 48.420 38.450 25.933.802 2.770 37.26 23.921 21.524 11.141.335 1.366 -2.27 9.567 10.728 -10.825.137 4.136 24.20 33.488 32.252 3.832.333 2.504 -6.83 15.002 16.168 -7.217.470 6.640 12.50 48.490 48.420 0.14
31.766 20.505 54.92 178.782 139.676 28.000.714 1.055 -32.32 5.471 8.634 -36.63
32.480 21.560 50.65 184.253 148.310 24.240.000 0.000 0.697 0.000
32.480 21.560 50.65 184.950 148.310 24.710.904 0.290 211.72 5.532 5.468 1.178.589 4.209 104.06 56.042 53.346 5.059.493 4.499 111.00 61.574 58.814 4.695.007 1.021 390.40 31.116 18.286 70.16
14.500 5.520 162.68 92.690 77.100 20.2210.762 5.660 90.14 59.274 49.308 20.21
3.405 1.570 116.88 18.133 14.775 22.7314.167 7.230 95.95 77.407 64.083 20.791.603 0.540 196.85 10.563 9.357 12.89
15.770 7.770 102.96 87.970 73.440 19.7813.011 3.806 241.85 75.491 43.979 71.65
0.027 0.034 -20.59 0.100 0.171 -41.5213.038 3.840 239.53 75.591 44.150 71.210.392 0.000 0.679 0.000
13.430 3.840 249.74 76.270 44.150 72.7566.641 37.641 77.04 385.287 298.175 29.2217.959 13.251 35.53 115.028 116.999 -1.6884.600 50.892 66.23 500.315 415.174 20.5117.190 8.358 105.67 101.305 75.486 34.20
101.790 59.250 71.80 601.620 490.660 22.617.850 8.738 -10.17 46.682 65.645 -28.895.419 5.498 -1.43 30.412 45.220 -32.75
13.269 14.236 -6.79 77.094 110.865 -30.467.325 6.667 9.87 54.769 45.681 19.90
20.594 20.903 -1.48 131.863 156.546 -15.77
SCCL
Big MinesOther MinesBig Plus MinesRest of MinesTotal SCCL
Subsidiary Description
OBR During Sept OBR Upto Sept
ECL
Big MinesOther MinesBig Plus MinesRest of MinesTotal ECL
BCCL
Big MinesOther MinesBig Plus MinesRest of MinesTotal BCCL
CCL
Big MinesOther MinesBig Plus MinesRest of MinesTotal CCL
NCL
Big MinesOther MinesBig Plus MinesRest of MinesTotal NCL
WCL
Big MinesOther MinesBig Plus MinesRest of MinesTotal WCL
SECL
Big MinesOther MinesBig Plus MinesRest of MinesTotal SECL
MCL
Big MinesOther MinesBig Plus MinesRest of MinesTotal MCL
CIL
Big MinesOther MinesBig Plus MinesRest of MinesTotal CIL
23

FY 21 FY 20 Growth M-o-M FY 21 FY 20 Growth
Y-o-YSubsidiary Description
OBR During Sept OBR Upto Sept
74.491 46.379 60.61 431.969 363.820 18.7323.378 18.749 24.69 27.243 33.467 -18.6097.869 65.128 50.27 459.212 397.287 15.5924.515 15.025 63.16 274.272 249.919 9.74122.38 80.15 52.69 733.48 647.21 13.33
Details of Subsidiary-wise OBR Status is given in subsequent Tables
Big MinesOther MinesBig Plus MinesAll IndiaRest of MinesTotal OBR
24

Table 2.2.1 (A) Departmental OBR ECL All Figurds in MM3
FY 21 FY 20 Growth M-o-M FY 21 FY 20 Growth
Y-o-YRajmahal Big 0.26 0.08 225.00 1.65 1.050 57.14Sonepur Bazari Big 0.73 0.64 14.06 4.79 4.730 1.27Chitra East Others 0.22 0.05 340.00 1.14 0.350 225.71
0.990 0.720 37.50 6.440 5.780 11.420.220 0.050 340.00 1.140 0.350 225.711.210 0.770 57.14 7.580 6.130 23.650.880 0.690 27.54 4.790 4.510 6.212.090 1.460 43.15 12.370 10.640 16.26
Table 2.2.1 (B) Contractual OBR ECL
FY 21 FY 20 Growth M-o-M FY 21 FY 20 Growth
Y-o-YRajmahal Big 1.06 0.91 16.48 9.461 8.960 5.59Sonepur Bazari Big 4.34 2.98 45.64 26.386 23.480 12.38Chitra East Others 0 0.37 -100.00 0.270 2.570 -89.49
5.400 3.890 38.82 35.847 32.440 10.500.000 0.370 -100.00 0.270 2.570 -89.495.400 4.260 26.76 36.117 35.010 3.162.560 1.910 34.03 14.343 15.140 -5.267.960 6.170 29.01 50.460 50.150 0.62
Table 2.2.1 (C) Total OBR ECL
FY 21 FY 20 Growth M-o-M FY 21 FY 20 Growth
Y-o-YRajmahal Big 1.320 0.990 33.33 11.111 10.010 11.00Sonepur Bazari Big 5.070 3.620 40.06 31.176 28.210 10.51Chitra East Others 0.220 0.420 -47.62 1.410 2.920 -51.71
6.390 4.610 38.61 42.287 38.220 10.640.220 0.420 -47.62 1.410 2.920 -51.716.610 5.030 31.41 43.697 41.140 6.223.440 2.600 32.31 19.133 19.650 -2.6310.05 7.630 31.72 62.83 60.79 3.36
OBR During Sept OBR Upto Sept
OBR During Sept OBR Upto SeptMine
MineOBR During Sept OBR Upto Sept
Big MinesOther MinesBig Plus MinesRest of MinesTotal ECL
Big Mines
Type
Type
Big Plus MinesRest of MinesTotal ECL
Other MinesBig Plus MinesRest of Mines
Big MinesOther Mines
Total ECL
Mine Type
25

Table 2.2.2 (A) Departmental OBR BCCL All Figurds in MM3
FY 21 FY 20 Growth M-o-M FY 21 FY 20 Growth
Y-o-YNT ST Je Others 0.099 0.114 -13.16 0.660 0.540 22.22AKWMC Others 0.25 0.168 48.81 1.630 1.345 21.19Phularitand Others 0 0 0.000 0.000S Bansjora Others 0 0 0.000 0.000NGKAC Others 0 0 0.000 0.000ROCP Others 0 0 0.000 0.529 -100.00KOCP Others 0.177 0.026 580.77 0.920 0.191 381.68ABOCP Others 0.233 0.145 60.69 1.380 1.085 27.19B Dahibari Others 0.11 0.106 3.77 0.670 0.671 -0.15
0.000 0.000 0.000 0.0000.869 0.559 55.46 5.260 4.361 20.610.869 0.559 55.46 5.260 4.361 20.610.431 0.531 -18.83 2.760 3.579 -22.881.300 1.090 19.27 8.020 7.940 1.01
Table 2.2.2 (B) Contractual OBR BCCL
FY 21 FY 20 Growth M-o-M FY 21 FY 20 Growth
Y-o-YNT ST Je Others 0.728 1.87 -61.07 4.993 4.059 23.01AKWMC Others 0.326 0.295 10.51 1.882 2.143 -12.18Phularitand Others 0 0.297 -100.00 1.273 3.090 -58.80S Bansjora Others 0.153 0.233 -34.33 1.207 2.003 -39.74NGKAC Others 0.161 0.164 -1.83 0.491 0.581 -15.49ROCP Others 0.319 0.606 -47.36 3.325 6.019 -44.76KOCP Others 0.557 0.573 -2.79 3.193 4.090 -21.93ABOCP Others 0.55 0 2.675 0.000B Dahibari Others 0.006 0 0.006 0.079 -92.41
0.006 0.000 0.000 0.0002.800 4.038 -30.659 19.045 22.064 -13.6832.806 4.038 -30.510 19.045 22.064 -13.6834.014 1.162 245.439 21.355 8.446 152.8426.820 5.200 31.15 40.400 30.510 32.42
Type
Big Plus MinesRest of MinesTotal BCCL
MineOBR During Sept OBR Upto Sept
MineOBR During Sept OBR Upto Sept
Big MinesOther MinesBig Plus MinesRest of MinesTotal BCCL
Big MinesOther Mines
Type
26

Table 2.2.2 (C) Total OBR BCCL
FY 21 FY 20 Growth M-o-M FY 21 FY 20 Growth
Y-o-YNT ST Je Others 0.827 1.984 -58.32 5.653 4.599 22.92AKWMC Others 0.576 0.463 24.41 3.512 3.488 0.69Phularitand Others 0.000 0.297 -100.00 1.273 3.090 -58.80S Bansjora Others 0.153 0.233 -34.33 1.207 2.003 -39.74NGKAC Others 0.161 0.164 -1.83 0.491 0.581 -15.49ROCP Others 0.319 0.606 -47.36 3.325 6.548 -49.22KOCP Others 0.734 0.599 22.54 4.113 4.281 -3.92ABOCP Others 0.783 0.145 440.00 4.055 1.085 273.73B Dahibari Others 0.116 0.106 9.43 0.676 0.750 -9.87
0.006 0.000 0.000 0.0003.669 4.597 -20.19 24.305 26.425 -8.023.675 4.597 -20.06 24.305 26.425 -8.024.445 1.693 162.552 24.115 12.025 100.5418.12 6.29 29.09 48.42 38.45 25.93
Type
Big Plus MinesRest of MinesTotal BCCL
Big MinesOther Mines
MineOBR During Sept OBR Upto Sept
27

Table 2.2.3 (A) Departmental OBR CCL All Figurds in MM3
FY 21 FY 20 Growth M-o-M FY 21 FY 20 Growth
Y-o-YAshoka Big 0.087 0.028 210.71 0.500 0.343 45.77Piparwar Big 0 0.066 -100.00 0.460 0.466 -1.29Amarpali Big 0 0 0.000 0.000AKK Big 0.182 0.13 40.00 1.360 0.915 48.63Govindpur Ph II Others 0.074 0.14 -47.14 0.690 0.889 -22.38Rohini Others 0.135 0.1 35.00 0.820 0.750 9.33Purnadih Others 0.159 0.192 -17.19 1.270 1.388 -8.50Magadh Big 0 0 0.000 0.000Tapin North Others 0.109 0.178 -38.76 0.970 1.026 -5.46Birsa Project Others 0.115 0.08 43.75 0.630 0.553 13.92Karo Big 0 0 0.000 0.000Topa OC Others 0 0 0.000 0.000
0.269 0.224 20.09 2.320 1.724 34.570.592 0.690 -14.20 4.380 4.606 -4.910.861 0.914 -5.80 6.700 6.330 5.851.849 1.796 2.95 12.620 11.600 8.792.710 2.710 0.00 19.320 17.930 7.75
Table 2.2.3 (B) Contractual OBR CCL
FY 21 FY 20 Growth M-o-M FY 21 FY 20 Growth
Y-o-YAshoka Big 1.238 0.867 42.79 7.392 7.019 5.31Piparwar Big 0 0.074 -100.00 0.891 1.160 -23.19Amarpali Big 1.714 0.538 218.59 8.812 5.669 55.44AKK Big 0 0.256 -100.00 0.351 2.066 -83.01Govindpur Ph II Others 0.22 0.051 331.37 1.123 0.719 56.19Rohini Others 0 0.303 -100.00 0.635 2.199 -71.12Purnadih Others 0 0 0.000 0.000Magadh Big 0.435 0.689 -36.87 3.425 3.407 0.53Tapin North Others 0 0 0.000 0.000Birsa Project Others 0.335 0.202 65.84 2.005 2.413 -16.91Karo Big 0.146 0.122 19.67 0.730 0.479 52.40Topa OC Others 0.188 0.12 56.67 1.424 0.791 80.03
3.533 2.546 38.77 21.601 19.800 9.100.743 0.676 9.91 5.187 6.122 -15.274.276 3.222 32.71 26.788 25.922 3.340.484 0.708 -31.64 2.382 4.568 -47.854.760 3.930 21.12 29.170 30.490 -4.33
Type
Big Plus MinesRest of MinesTotal CCL
MineOBR During Sept OBR Upto Sept
MineOBR During Sept OBR Upto Sept
Big MinesOther MinesBig Plus MinesRest of MinesTotal CCL
Big MinesOther Mines
Type
28

Table 2.2.3 (C) Total OBR CCL
FY 21 FY 20 Growth M-o-M FY 21 FY 20 Growth
Y-o-YAshoka Big 1.325 0.895 48.04 7.892 7.362 7.20Piparwar Big 0.000 0.140 -100.00 1.351 1.626 -16.91Amarpali Big 1.714 0.538 218.59 8.812 5.669 55.44AKK Big 0.182 0.386 -52.85 1.711 2.981 -42.60Govindpur Ph II Others 0.294 0.191 53.93 1.813 1.608 12.75Rohini Others 0.135 0.403 -66.50 1.455 2.949 -50.66Purnadih Others 0.159 0.192 -17.19 1.270 1.388 -8.50Magadh Big 0.435 0.689 -36.87 3.425 3.407 0.53Tapin North Others 0.109 0.178 -38.76 0.970 1.026 -5.46Birsa Project Others 0.450 0.282 59.57 2.635 2.966 -11.16Karo Big 0.146 0.122 19.67 0.730 0.479 52.40Topa OC Others 0.188 0.120 56.67 1.424 0.791 80.03
3.802 2.770 37.26 23.921 21.524 11.141.335 1.366 -2.27 9.567 10.728 -10.825.137 4.136 24.20 33.488 32.252 3.832.333 2.504 -6.83 15.002 16.168 -7.217.470 6.640 12.50 48.490 48.420 0.14
Type
Big Plus MinesRest of MinesTotal CCL
Big MinesOther Mines
MineOBR During Sept OBR Upto Sept
29

Table 2.2. 4 (A) Departmental OBR NCL All Figurds in MM3
FY 21 FY 20 Growth M-o-M FY 21 FY 20 Growth Y-o-
YNigahi Big 1.493 1.426 4.70 9.200 8.680 5.99Jayant Big 1.185 1.04 13.94 7.560 7.696 -1.77Dudhichua Big 1.193 1.022 16.73 6.280 6.977 -9.99Amlohri Big 1.314 0.967 35.88 7.700 6.481 18.81Khadia Big 0.795 0.7 13.57 4.120 4.269 -3.49Bina Big 0.51 0.687 -25.76 3.360 3.870 -13.18Krishnashila Big 0.009 0.04 -77.50 0.270 0.234 15.38Block B Big 0 0 0.000 0.000Jingurda Others 0.119 0.089 33.71 0.920 0.570 61.40Kakari Others 0.255 0.226 12.83 1.560 1.620 -3.70
6.499 5.882 10.49 38.490 38.207 0.740.374 0.318 17.61 2.480 2.193 13.096.873 6.200 10.85 40.970 40.400 1.410.087 0.000 0.080 0.0006.960 6.200 12.26 41.050 40.400 1.61
Table 2.2.4 (B) Contractual OBR NCL
FY 21 FY 20 Growth M-o-M FY 21 FY 20 Growth Y-o-
YNigahi Big 5.12 3.098 65.11 29.034 22.436 29.41Jayant Big 2.96 1.942 52.21 15.096 13.692 10.26Dudhichua Big 4.26 2.087 104.07 24.185 15.135 59.80Amlohri Big 3.76 2.464 52.76 20.077 18.826 6.64Khadia Big 3.44 1.307 163.35 20.443 9.096 124.74Bina Big 2.56 2.078 23.15 15.462 11.652 32.70Krishnashila Big 1.74 1.64 5.85 10.902 10.069 8.27Block B Big 1.44 0.007 20414.29 5.093 0.563 804.94Jingurda Others 0.35 0.421 -16.86 2.925 3.753 -22.07Kakari Others 0.00 0.32 -100.00 0.066 2.682 -97.54
25.267 14.623 72.79 140.292 101.469 38.260.350 0.737 -52.51 2.991 6.442 -53.57
25.617 15.360 66.78 143.283 107.910 32.78-0.107 0.000 0.617 0.00025.510 15.360 66.08 143.900 107.910 33.35
Type
Big Plus MinesRest of MinesTotal NCL
MineOBR During Sept OBR Upto Sept
MineOBR During Sept OBR Upto Sept
Big MinesOther MinesBig Plus MinesRest of MinesTotal NCL
Big MinesOther Mines
Type
30

Table 2.2.4 (C) Total OBR NCLType
FY 21 FY 20Growth M-o-M FY 21 FY 20
Growth Y-o-Y
Nigahi Big 6.608 4.524 46.07 38.234 31.117 22.87Jayant Big 4.141 2.982 38.87 22.656 21.388 5.93Dudhichua Big 5.452 3.109 75.36 30.465 22.112 37.78Amlohri Big 5.078 3.431 48.00 27.777 25.307 9.76Khadia Big 4.237 2.007 111.11 24.563 13.365 83.78Bina Big 3.069 2.765 10.99 18.822 15.522 21.26Krishnashila Big 1.745 1.680 3.87 11.172 10.303 8.43Block B Big 1.436 0.007 20414.29 5.093 0.563 804.94Jingurda Others 0.469 0.510 -8.04 3.845 4.323 -11.07Kakari Others 0.255 0.546 -53.30 1.626 4.302 -62.21
31.766 20.505 54.92 178.782 139.676 28.000.714 1.055 -32.32 5.471 8.634 -36.63
32.480 21.560 50.65 184.253 148.310 24.240.000 0.000 0.697 0.000
32.480 21.560 50.65 184.950 148.310 24.71
Big Plus MinesRest of MinesTotal NCL
Big MinesOther Mines
Mine
OBR During Sept OBR Upto Sept
31

Table 2.2.5 (A) Departmental OBR WCL All Figurds in MM3
FY 21 FY 20 Growth M-o-M FY 21 FY 20 Growth
Y-o-YDurgapur -(Sec.-V) Others 0.285 0.19 50.00 1.310 1.466 -10.64Sasti Others 0.387 0.343 12.83 1.990 1.886 5.51NM-Sector-I & II (A) Others 0 0.163 -100.00 0.590 1.022 -42.27Niljai Deep Others 0.027 0.04 -32.50 0.250 0.927 -73.03Mungoli Others 0.21 0.18 16.67 1.810 2.054 -11.88Penganga Big 0.082 0.064 28.13 1.230 0.843 45.91Ukni Others 0.227 0.108 110.19 2.080 1.108 87.73Gondegaon Others 0.339 0.234 44.87 1.920 1.989 -3.47Umrer Others 0.457 0.246 85.77 2.340 1.585 47.63Makardhokra-I Others 0 0 0.000 0.042 -100.00Gokul Others 0 0 0.000 0.000MKD-III Others 0 0 0.000 0.000
0.082 0.000 1.230 0.843 45.911.932 1.504 28.46 12.290 12.079 1.752.014 1.504 33.91 13.520 12.922 4.631.436 0.756 89.95 7.690 6.538 17.623.450 2.260 52.65 21.210 19.460 8.99
Table 2.2.5 (B) Contractual OBR WCL
FY 21 FY 20 Growth M-o-M FY 21 FY 20 Growth
Y-o-YDurgapur -(Sec.-V) Others 0.702 0.176 298.86 4.579 3.086 48.38Sasti Others 0.528 0.289 82.70 3.111 3.441 -9.59NM-Sector-I & II (A) Others 0 0.131 -100.00 0.386 3.521 -89.04Niljai Deep Others 1.894 0.832 127.64 10.040 8.115 23.72Mungoli Others 1.21 0 7.269 0.000Penganga Big 0.822 0.29 183.45 4.302 4.625 -6.98Ukni Others 0.661 0.036 1736.11 3.452 0.489 605.93Gondegaon Others 0.449 0.043 944.19 2.507 3.231 -22.41Umrer Others 0 0.185 -100.00 0.000 2.295 -100.00Makardhokra-I Others 0.766 0.385 98.96 4.116 4.760 -13.53Gokul Others 0 0.381 -100.00 3.698 5.793 -36.16MKD-III Others 0.447 0.247 80.97 4.594 6.536 -29.71
0.822 0.290 183.45 4.302 4.625 -6.986.657 2.705 146.10 43.752 41.267 6.027.479 2.995 149.72 48.054 45.892 4.713.571 0.265 1247.55 23.426 11.748 99.40
11.050 3.260 238.96 71.480 57.640 24.01
Other MinesBig Plus MinesRest of MinesTotal WCL
Big Mines
MineOBR During Sept OBR Upto Sept
Big MinesOther MinesBig Plus MinesRest of MinesTotal WCL
MineOBR During Sept OBR Upto Sept
Type
Type
32

Table 2.2.5 (C) Total OBR WCL
FY 21 FY 20 Growth M-o-M FY 21 FY 20 Growth
Y-o-YDurgapur -(Sec.-V) Others 0.987 0.366 169.67 5.889 4.552 29.37Sasti Others 0.915 0.632 44.78 5.101 5.327 -4.24NM-Sector-I & II (A) Others 0.000 0.294 -100.00 0.976 4.543 -78.52Niljai Deep Others 1.921 0.872 120.30 10.290 9.042 13.80Mungoli Others 1.420 0.180 688.89 9.079 2.054 342.02Penganga Big 0.904 0.354 155.37 5.532 5.468 1.17Ukni Others 0.888 0.144 516.67 5.532 1.597 246.40Gondegaon Others 0.788 0.277 184.48 4.427 5.220 -15.19Umrer Others 0.457 0.431 6.03 2.340 3.880 -39.69Makardhokra-I Others 0.766 0.385 98.96 4.116 4.802 -14.29Gokul Others 0.000 0.381 -100.00 3.698 5.793 -36.16MKD-III Others 0.447 0.247 80.97 4.594 6.536 -29.71
0.904 0.290 211.72 5.532 5.468 1.178.589 4.209 104.06 56.042 53.346 5.059.493 4.499 111.00 61.574 58.814 4.695.007 1.021 390.40 31.116 18.286 70.1614.50 5.52 162.68 92.69 77.10 20.22
OBR Upto Sept
Big MinesOther MinesBig Plus MinesRest of Mines
OBR During Sept
Total WCL
Mine Type
33

Table 2.2.6 (A) Departmental OBR SECL All Figurds in MM3
FY 21 FY 20 Growth M-o-M FY 21 FY 20 Growth
Y-o-YGevra Big 2.481 1.13 119.56 13.920 9.999 39.21Dipka Big 0.892 0.81 10.12 6.270 6.278 -0.13Kushmunda Big 2.021 1.36 48.60 10.580 9.394 12.63Chhal Others 0 0 0.000 0.000Manikpur Big 0 0 0.150 0.000Baroud Others 0 0.02 -100.00 0.000 0.071 -100.00GP IV/2-3 Others 0 0.03 -100.00 0.000 0.066 -100.00Jampali Others 0 0 0.000 0.000Dhanpuri Others 0.409 0.28 46.07 2.170 1.659 30.80Mahan II Others 0 0 0.000 0.000Amadand Others 0.136 0.09 51.11 0.840 0.576 45.83Chirimiri Others 0.173 0.17 1.76 1.050 1.110 -5.41GP IV/1 Others 0 0 0.000 0.000
5.394 3.300 63.45 30.920 25.671 20.450.718 0.590 21.69 4.060 3.482 16.606.112 3.890 57.12 34.980 29.153 19.990.198 0.220 -10.00 1.180 5.587 -78.886.310 4.110 53.53 36.160 34.740 4.09
Table 2.2.6 (B) Contractual OBR SECL
FY 21 FY 20 Growth M-o-M FY 21 FY 20 Growth
Y-o-YGevra Big 1.828 1.02 79.22 10.480 15.280 -31.41Dipka Big 1.35 0.61 6.553 0.770Kushmunda Big 0.87 0.23 278.26 4.599 4.861 -5.39Chhal Others 0.593 0.45 31.78 3.363 3.237 3.89Manikpur Big 1.32 0.5 164.00 6.722 2.726 146.59Baroud Others 1.012 0 4.379 0.466 839.70GP IV/2-3 Others 0.284 0.03 846.67 1.527 0.854 78.81Jampali Others 0.114 0 1.162 1.409 -17.53Dhanpuri Others 0 0 0.000 0.477 -100.00Mahan II Others 0.27 0.25 8.00 1.694 2.738 -38.13Amadand Others 0.213 0.23 -7.39 1.259 1.732 -27.31Chirimiri Others 0.201 0.02 0.689 0.020GP IV/1 Others 0 0 0.000 0.360 -100.00
5.368 2.360 127.46 28.354 23.637 19.962.687 0.980 174.18 14.073 11.293 24.628.055 3.340 141.17 42.427 34.930 21.461.405 0.320 339.06 9.383 3.770 148.899.460 3.660 158.47 51.810 38.700 33.88
Type
Big Plus MinesRest of MinesTotal SECL
MineOBR During Sept OBR Upto Sept
MineOBR During Sept OBR Upto Sept
Big MinesOther MinesBig Plus MinesRest of MinesTotal SECL
Big MinesOther Mines
Type
34

Table 2.2.6 (C) Total OBR SECL
FY 21 FY 20 Growth M-o-M FY 21 FY 20 Growth
Y-o-YGevra Big 4.309 2.150 100.42 24.400 25.279 -3.48Dipka Big 2.242 1.420 57.89 12.823 7.048 81.94Kushmunda Big 2.891 1.590 81.82 15.179 14.255 6.48Chhal Others 0.593 0.450 31.78 3.363 3.237 3.89Manikpur Big 1.320 0.500 164.00 6.872 2.726 152.09Baroud Others 1.012 0.020 4960.00 4.379 0.537 715.46GP IV/2-3 Others 0.284 0.060 373.33 1.527 0.920 65.98Jampali Others 0.114 0.000 1.162 1.409 -17.53Dhanpuri Others 0.409 0.280 46.07 2.170 2.136 1.59Mahan II Others 0.270 0.250 8.00 1.694 2.738 -38.13Amadand Others 0.349 0.320 9.06 2.099 2.308 -9.06Chirimiri Others 0.374 0.190 96.84 1.739 1.130 53.89GP IV/1 Others 0.000 0.000 0.000 0.360 -100.00
10.762 5.660 90.14 59.274 49.308 20.213.405 1.570 116.88 18.133 14.775 22.73
14.167 7.230 95.95 77.407 64.083 20.791.603 0.540 196.85 10.563 9.357 12.8915.77 7.77 102.96 87.97 73.44 19.78
Type
Big Plus MinesRest of MinesTotal SECL
Big MinesOther Mines
MineOBR During Sept OBR Upto Sept
35

Table 2.2.7 (A) Departmental OBR MCL All Figurds in MM3
FY 21 FY 20 Growth M-o-M FY 21 FY 20 Growth
Y-o-YBhubaneswari Big 0 0 0.000 0.000Lakhanpur Big 0.204 0.126 61.90 0.940 1.383 -32.03Bharatpur Big 0.295 0.058 408.62 1.570 0.710 121.13Lingaraj Big 0.122 0.152 -19.74 0.890 0.984 -9.55Samaleswari Big 0.069 0.058 18.97 0.360 0.630 -42.86Kulda Big 0.024 0 0.070 0.000Kaniha Big 0 0 0.000 0.000Hingula Big 0.028 0.006 366.67 0.350 0.222 57.66Ananta Big 0.091 0.053 71.70 0.640 0.533 20.08Jagannath Big 0.125 0.052 140.38 0.880 0.731 20.38Belpahar Big 0.026 0.017 52.94 0.300 0.411 -27.01Lajkura Big 0.083 0.036 130.56 0.480 0.312 53.85Balram Big 0.124 0.079 56.96 0.820 0.867 -5.42Basundhara (W) Others 0.027 0.035 -22.86 0.100 0.172 -41.86Garjanbahal Big 0.212 0.079 168.35 0.920 0.626 46.96
1.403 0.716 95.95 8.220 7.409 10.950.027 0.034 -20.59 0.100 0.171 -41.521.430 0.750 90.67 8.320 7.580 9.760.000 0.000 0.100 0.0001.430 0.750 90.67 8.420 7.580 11.08
Table 2.2.7 (B) Contractual OBR MCL
FY 21 FY 20 Growth M-o-M FY 21 FY 20 Growth
Y-o-YBhubaneswari Big 1.587 0.367 332.43 8.798 3.539 148.60Lakhanpur Big 3.116 0.398 682.91 17.722 7.124 148.76Bharatpur Big 0.609 0.118 416.10 1.291 2.842 -54.57Lingaraj Big 0.886 0.424 108.96 5.092 3.983 27.84Samaleswari Big 0.488 0.018 2611.11 3.853 0.957 302.61Kulda Big 1.314 0.111 1083.78 7.885 2.264 248.28Kaniha Big 0.402 0.116 246.55 2.165 1.229 76.16Hingula Big 0.612 0.066 827.27 2.511 0.986 154.67Ananta Big 0.65 0.566 14.84 4.114 5.285 -22.16Jagannath Big 0.224 0 1.283 0.000Belpahar Big 0.256 0.18 42.22 1.966 2.365 -16.87Lajkura Big 0.441 0.285 54.74 2.623 2.950 -11.08Balram Big 1.024 0.445 130.11 5.864 3.045 92.58Basundhara (W) Others 0 0 0.000 0.000Garjanbahal Big 0.389 0 2.104 0.000
11.608 3.090 275.66 67.271 36.570 83.950.000 0.000 0.000 0.000
11.608 3.090 275.66 67.271 36.570 83.950.392 0.000 0.579 0.000
12.000 3.090 288.35 67.850 36.570 85.53
Type
Big Plus MinesRest of MinesTotal MCL
MineOBR During Sept OBR Upto Sept
MineOBR During Sept OBR Upto Sept
Big MinesOther MinesBig Plus MinesRest of MinesTotal MCL
Big MinesOther Mines
Type
36

Table 2.2.7 (C) Total OBR MCL
FY 21 FY 20 Growth M-o-M FY 21 FY 20 Growth
Y-o-YBhubaneswari Big 1.587 0.367 332.43 8.798 3.539 148.60Lakhanpur Big 3.320 0.524 533.59 18.662 8.507 119.37Bharatpur Big 0.904 0.176 413.64 2.861 3.552 -19.45Lingaraj Big 1.008 0.576 75.00 5.982 4.967 20.43Samaleswari Big 0.557 0.076 632.89 4.213 1.587 165.47Kulda Big 1.338 0.111 1105.41 7.955 2.264 251.37Kaniha Big 0.402 0.116 246.55 2.165 1.229 76.16Hingula Big 0.640 0.072 788.89 2.861 1.208 136.84Ananta Big 0.741 0.619 19.71 4.754 5.818 -18.29Jagannath Big 0.349 0.052 571.15 2.163 0.731 195.90Belpahar Big 0.282 0.197 43.15 2.266 2.776 -18.37Lajkura Big 0.524 0.321 63.24 3.103 3.262 -4.87Balram Big 1.148 0.524 119.08 6.684 3.912 70.86Basundhara (W) Others 0.027 0.035 -22.86 0.100 0.172 -41.86Garjanbahal Big 0.601 0.079 660.76 3.024 0.626 383.07
13.011 3.806 241.85 75.491 43.979 71.650.027 0.034 -20.59 0.100 0.171 -41.52
13.038 3.840 239.53 75.591 44.150 71.210.392 0.000 0.679 0.000
13.430 3.840 249.74 76.270 44.150 72.75
Type
Big Plus MinesRest of MinesTotal MCL
Big MinesOther Mines
MineOBR During Sept OBR Upto Sept
37

Table 2.2.8: OBR SCCL All Figures in MM3
FY 21 FY 20 Growth M-o-M FY 21 FY 20 Growth
Y-o-YPKOC Big 2.24 2.86 -21.87 14.32 24.03 -40.41RG OC III Extn. Big 3.09 3.16 -2.29 19.24 23.07 -16.59JVR OCII Big 1.26 1.56 -19.50 6.36 12.10 -47.47Ramagundam OCI Exp. Ph II Big 1.26 1.15 9.93 6.76 6.44 4.95Gouthamkhani OC Others 0.25 0.99 -75.12 2.10 7.01 -70.06JVR OCI Exp. Others 0.00 0.84 -100.00 0.17 5.26 -96.74Koyagudem OC II Others 1.18 0.70 67.08 6.54 5.91 10.65Jawaharkhani 5 OC Others 0.76 0.77 -1.59 4.40 5.67 -22.42Srirampur OC II Others 2.34 1.28 83.11 13.13 11.57 13.42Khairagura OC Others 0.90 0.91 -1.24 4.08 9.81 -58.38
7.850 8.738 -10.17 46.682 65.645 -28.895.419 5.498 -1.43 30.412 45.220 -32.75
13.269 14.236 -6.79 77.094 110.865 -30.467.325 6.667 9.87 54.769 45.681 19.9020.59 20.90 -1.48 131.86 156.55 -15.77Total SCCL
Mine TypeOBR During Sept OBR Upto Sept
Total Big MinesTotal Other MinesTotal Big Plus MinesRest of Mines
38

Exploration


Table - 1 : PERFORMANCE REPORT
Performance of CMPDI for the month of September, 2020 and progressive upto September, 2020 (2020-21) (PROVISIONAL)
ITEM
DRILLING
1. DRILLING BY CMPDI (DEPARTMENTAL) 488000 32650 34066 104% 32400 1666 5.14% 190271 161048 85% 191380 -30332 -15.85% ( in metre )
DRILLING THROUGH OTHER AGENCIES
2. DRILLING BY STATE GOVT. 4000 400 0 - 0 0 - 1600 99 6% 357 -258 -72% ( in metre )
3. OUTSOURCING THROUGH MOU 377000 28050 34743 124% 32319 2424 8% 170160 208602 123% 194777 13825 7% (CIL/Non-CIL Blocks) ( in metre )
4. OUTSOURCING THROUGH TENDERING 114000 8250 13475 163% 12005 1470 12% 38120 54662 143% 77710 -23048 -30% (CIL Blocks) ( in metre )
5. OUTSOURCING THROUGH TENDERING 117000 6988 3718 53% 7876 -4158 -53% 31479 43009 137% 86001 -42992 -50% (Non-CIL/Captive Blocks) ( in metre )
TOTAL OUTSOURCING (in metre) 612000 43688 51937 119% 52200 -263 -0.50% 241359 306372 127% 358845 -52473 -15%
TOTAL DRILLING (in metre) 1100000 76338 86003 113% 84600 1403 2% 431630 467420 108% 550225 -82805 -15%
REPORT PREPARATION:(Fig. in nos. Prov.) MANPOWER:
MOU ACTUAL ACTUAL UNDER
TARGET SEPT.'2020 2020-21 PREPA- Manpower as on 01.04.2020 01.10.2020 01.09.2020 Reduction from 01.04.20202020-21 (Provn.) (till Sept.,20) RATION 3156 3129 3116
1. GEOLOGICAL REPORTS 26 1 5 41
2. OTHER REPORTS (incl. PR, EMP, etc.) - 5 72 112101
Total - 6 77 153
27
%age ach.Target ActualAbs %age
MOU TARGET 2020-21
(Proposed) Cumulative Achievement upto
September, 2020 (2020-21)
Cumulative Achiev. upto correspond.
period of prev. year 2019-20
Growth over correspond. period of 2019-20
Abs %age
Current Month September, 2020 Achievement in correspond.
month of prev. year 2019-20
Growth over correspond. month of 2019-20
Target Actual %age ach.
39

Performance of Coal PSUs


Summary of Performance of Coal Companies Month Sept'2020Table 4.1: Production Status (i) Underground Production All figures in MTSubs Historical Production Status Growth
Target Actual Achievement Sept'2019 Upto Sept'2019 Upto Sept'2020 M-O-M Y-O-YECL 0.83 0.80 95.90 0.62 4.31 4.68 27.97 8.58BCCL 0.09 0.04 40.91 0.09 0.50 0.23 -59.09 -54.00CCL 0.03 0.02 61.76 0.04 0.29 0.30 -52.27 3.45NCLWCL 0.31 0.27 88.85 0.29 2.02 1.74 -4.91 -13.86SECL 1.13 0.99 87.52 1.06 6.94 5.96 -6.70 -14.12MCL 0.06 0.04 70.69 0.07 0.41 0.26 -37.88 -36.59NECCIL 2.45 2.15 88.10 2.17 14.47 13.17 -0.51 -8.98SCCL 0.857 0.434 50.68 0.710 4.250 1.856 -38.79 -56.34Total 3.30 2.59 78.38 2.87 18.72 15.03 -9.96 -19.74
(iia) Open Cast Production- Departmental All figures in MTSubs Historical Production Status Growth
Target Actual Achievement Sept'2019 Upto Sept'2019 Upto Sept'2020 M-O-M Y-O-YECL 0.63 0.41 65.08 0.53 4.16 2.69 -22.64 -35.34BCCL 0.82 0.57 69.51 0.40 3.34 2.71 42.50 -18.86CCL 1.22 1.00 81.97 0.88 6.31 4.01 13.64 -36.45NCL 8.85 9.26 104.63 7.67 51.00 53.54 20.73 4.98WCL 1.76 1.16 65.91 0.79 8.66 8.12 46.84 -6.24SECL 0.74 0.60 4.88 5.07 23.33 3.89MCL 3.24 2.82 87.04 1.38 13.36 14.92 104.35 11.68NECCIL 16.52 15.96 96.61 12.25 91.71 91.06 30.29 -0.71SCCL 4.054 2.345 57.85 2.922 22.880 13.357 -19.75 -41.62Total 20.57 18.31 88.97 15.17 114.59 104.42 20.65 -8.88
Production During Sept 2020
Production During Sept 2020
40

(iib) Open Cast Production - Contractual All figures in MTSubs Historical Production Status Growth
Target Actual Achievement Sept'2019 Upto Sept'2019 Upto Sept'2020 M-O-M Y-O-YECL 2.14 1.62 75.70 1.65 12.37 10.69 -1.82 -13.58BCCL 2.14 1.41 65.89 1.25 7.85 7.15 12.80 -8.92CCL 4.30 3.81 88.60 2.36 16.01 15.95 61.44 -0.37NCLWCL 1.24 1.07 51.02 0.67 6.77 6.64 59.70 -1.92SECL 13.27 6.77 81.69 5.58 48.90 42.66 21.33 -12.76MCL 9.45 7.72 81.69 4.83 42.74 48.69 59.83 13.92NECCIL 32.54 22.39 68.81 16.34 134.63 131.78 37.03 -2.12SCCL 0.000 0.557 0.608 3.394 2.918 -8.30 -14.02Total 32.54 22.95 70.52 16.95 138.02 134.70 35.40 -2.41
(ii) Open Cast Production All figures in MTSubs Historical Production Status Growth
Target Actual Achievement Sept'2019 Upto Sept'2019 Upto Sept'2020 M-O-M Y-O-YECL 2.77 2.03 73.29 2.18 16.53 13.38 -6.88 -19.06BCCL 2.96 1.98 66.89 1.65 11.19 9.86 20.00 -11.89CCL 5.52 4.81 87.14 3.24 22.32 19.96 48.46 -10.57NCL 8.85 9.26 104.63 7.67 51.00 53.54 20.73 4.98WCL 3.00 2.23 74.33 1.46 15.43 14.76 52.74 -4.34SECL 13.27 7.51 56.59 6.18 53.78 47.73 21.52 -11.25MCL 12.69 10.54 83.06 6.21 56.10 63.61 69.73 13.39NECCIL 49.06 38.35 78.17 28.61 226.35 222.84 34.04 -1.55SCCL 4.054 2.903 71.60 3.530 26.273 16.274 -17.78 -38.06Total 53.11 41.25 77.67 32.14 252.62 239.11 28.35 -5.35
Production During Sept 2020
Production During Sept 2020
41

(iii) Total Coal Production All figures in MTSubs Historical Production Status Growth
Target Actual Achievement Sept'2019 Upto Sept'2019 Upto Sept'2020 M-O-M Y-O-YECL 3.60 2.79 77.39 2.81 20.84 18.03 -0.92 -13.48BCCL 3.05 2.01 65.81 1.74 11.69 10.09 15.42 -13.69CCL 5.55 4.83 86.98 3.27 22.61 20.27 47.56 -10.35NCL 8.85 9.26 104.63 7.67 51.00 53.54 20.73 4.98WCL 3.31 2.51 75.98 1.75 17.45 20.01 43.90 14.67SECL 14.40 8.50 59.02 7.24 60.72 53.69 17.39 -11.58MCL 12.75 10.58 83.00 6.28 56.51 63.87 68.59 13.02NEC 0.00 0.00 0.03 0.11 0.04 -100.00 -63.64CIL 51.51 40.48 78.60 30.78 240.93 239.54 31.55 -0.58SCCL 4.911 3.337 67.95 4.240 30.514 18.130 -21.30 -40.58Total 56.42 43.82 77.67 35.01 271.44 257.67 25.15 -5.07
Production During Sept 2020
42

Table 4.1 (A): Coking Coal Production In MT
FY 21 FY 20Growth M-o-M FY 21 FY 20
Growth Y-o-Y
BCCL 1.933 1.565 23.51 9.645 10.820 -10.86CCL 1.143 1.241 -7.90 5.514 8.224 -32.95SECL 0.016 0.018 -11.11 0.095 0.119 -20.17WCL 0.013 0.011 18.18 0.083 0.079 5.06ECL 0.001 0.002 -50.00 0.008 0.014 -42.86Coal India 3.106 2.837 9.48 15.345 19.256 -20.31
Table 4.1 (BA) : Washed Coking Coal Production
FY 21 FY 20Growth M-o-M FY 21 FY 20
Growth Y-o-Y
BCCL 0.028 0.045 -37.78 0.147 0.364 -59.62CCL 0.051 0.039 30.77 0.248 0.485 -48.87Coal India 0.079 0.084 -5.95 0.395 0.849 -53.47
Table 4.1 (BB) : Washed Non-Coking Coal Production In MT
FY 21 FY 20Growth M-o-M FY 21 FY 20
Growth Y-o-Y
BCCL 0.108 0.065 66.15 0.517 0.467 10.71CCL 0.587 0.321 82.87 2.489 2.939 -15.31NCL 0.308 0.272 13.24 1.545 1.525 1.31Coal India 1.003 0.658 52.43 4.551 4.931 -7.71Washed Coal 1.082 0.742 45.822 4.946 5.78 -14.4291
Table 4.1 (BC) : Production of Middlings In MT
FY 21 FY 20Growth M-o-M FY 21 FY 20
Growth Y-o-Y
BCCL 0.108 0.065 66.15 0.517 0.468 10.47CCL 0.073 0.060 21.67 0.425 0.658 -35.41Coal India 0.181 0.125 44.80 0.942 1.126 -16.34
SubsProduction During Sept Production Upto Sept
SubsProduction During Sept Production Upto Sept
SubsProduction During Sept Production Upto Sept
SubsProduction During Sept Production Upto Sept
43

Table 4.2: Productivity(OMS) in Te (i) Underground Mines
Target Actual Achievement Sept'2019 Upto Sept'2019 Upto Sept'2020 M-O-M Y-O-YECL 0.87 #DIV/0! 0.67 0.76 0.83 29.57 9.78BCCL 0.29 0.10 34.48 0.25 0.22 0.10 -60.00 -54.55CCL 0.29 0.23 79.31 0.48 0.46 0.53 -52.08 15.22NCLWCL 0.86 0.90 104.65 0.82 0.92 0.91 9.76 -1.09SECL 1.66 1.49 89.76 1.51 1.65 1.48 -1.32 -10.30MCL 0.80 0.58 72.50 0.83 0.83 0.58 -30.12 -30.12NECSCCL 1.62 0.90 55.56 1.52 1.41 0.85 -40.79 -39.72
(ii) Open Cast Mines
Target Actual Achievement Sept'2019 Upto Sept'2019 Upto Sept'2020 M-O-M Y-O-YECL 10.87 #DIV/0! 11.36 13.83 11.49 -4.36 -16.92BCCL 6.71 6.76 100.75 5.95 6.07 6.81 13.61 12.19CCL 10.37 9.47 91.32 5.90 8.31 7.55 60.51 -9.15NCL 23.14 29.39 127.01 18.27 19.05 29.27 60.86 53.65WCL 2.57 2.67 103.89 1.51 2.94 3.03 76.82 3.06SECL 33.28 25.63 77.01 13.50 24.93 26.29 89.85 5.46MCL 26.75 35.06 131.07 12.55 20.55 30.03 179.36 46.13NECSCCL 13.51 10.29 76.17 12.52 15.54 10.36 -17.81 -33.33
Subs
Subs
OMS During Sept 2020
OMS During Sept 2020 Historical OMS Status Growth
Historical OMS Status Growth
44

(iii) Overall OMS
Target Actual Achievement Sept'2019 Upto Sept'2019 Upto Sept'2020 M-O-M Y-O-YECL 3.15 2.57 81.66 2.51 3.03 2.66 2.23 -12.10BCCL 3.84 3.06 79.69 2.75 2.87 2.77 11.27 -3.48CCL 8.73 8.07 92.44 5.13 6.83 6.30 57.31 -7.76NCL 23.14 29.39 127.01 18.27 19.05 29.27 60.86 53.65WCL 2.17 2.20 101.38 1.33 2.34 2.43 65.41 3.85SECL 13.04 8.85 67.87 6.16 9.53 9.17 43.67 -3.78MCL 22.78 28.51 125.15 10.92 17.51 24.92 161.08 42.32NECSCCL 5.71 4.02 70.40 5.20 6.06 4.45 -22.69 -26.57
Subs OMS During Sept 2020 Historical OMS Status Growth
45

Table 4.3: OBR (i) Departmental OBR
Target Actual Achievement Sept'2019 Upto Sept'2019 Upto Sept'2020 M-O-M Y-O-YECL 2.20 2.09 95.00 1.46 10.64 12.37 43.15 16.26BCCL 1.86 1.30 69.89 1.09 7.94 8.02 19.27 1.01CCL 3.50 2.71 77.43 2.71 17.93 19.32 0.00 7.75NCL 6.13 6.96 113.54 6.20 40.40 41.05 12.26 1.61WCL 3.22 3.45 107.14 2.26 19.46 21.21 52.65 8.99SECL 8.06 6.31 78.29 4.11 34.74 36.16 53.53 4.09MCL 3.18 1.43 44.97 0.75 7.58 8.42 90.67 11.08NECCIL 28.15 24.25 86.15 18.58 138.70 146.55 30.52 5.66SCCL 4.605 3.701 80.37 4.260 30.024 23.358 -13.13 -22.20Total 32.76 27.95 85.33 22.84 168.72 169.91 22.38 0.70
(ii) Contractual OBR
Target Actual Achievement Sept'2019 Upto Sept'2019 Upto Sept'2020 M-O-M Y-O-YECL 9.09 7.96 87.57 6.17 50.15 50.46 29.01 0.62BCCL 8.62 6.82 79.12 5.20 30.51 40.40 31.15 32.42CCL 6.50 4.76 73.23 3.93 30.49 29.17 21.12 -4.33NCL 20.41 25.51 124.99 15.36 107.91 143.90 66.08 33.35WCL 11.51 11.05 96.00 3.26 57.64 71.48 238.96 24.01SECL 15.97 9.46 59.24 3.66 38.70 51.81 158.47 33.88MCL 11.52 12.00 104.17 3.09 36.57 67.85 288.35 85.53NECCIL 83.62 77.56 92.75 40.67 351.97 455.07 90.71 29.29SCCL 25.300 16.893 66.77 16.643 126.521 108.505 1.50 -14.24Total 108.92 94.45 86.72 57.31 478.49 563.57 64.80 17.78
All figures in MM3
Subs OBR During Sept 2020 Historical OBR Status Growth
All figures in MM3
Subs OBR During Sept 2020 Historical OBR Status Growth
46

(iii) Total OBR
Target Actual Achievement Sept'2019 Upto Sept'2019 Upto Sept'2020 M-O-M Y-O-YECL 11.29 10.05 89.02 7.63 60.79 62.83 31.72 3.36BCCL 10.48 8.12 77.48 6.29 38.45 48.42 29.09 25.93CCL 10.00 7.47 74.70 6.64 48.42 48.49 12.50 0.14NCL 26.54 32.48 122.38 21.56 148.31 184.95 50.65 24.71WCL 14.73 14.50 98.44 5.52 77.10 92.69 162.68 20.22SECL 24.03 15.77 65.63 7.77 73.44 87.97 102.96 19.78MCL 14.70 13.43 91.36 3.84 44.15 76.27 249.74 72.75NECCIL 111.77 101.79 91.07 59.25 490.66 601.62 71.80 22.61SCCL 29.905 20.594 68.87 20.903 156.546 131.863 -1.48 -15.77Total 141.68 122.38 86.38 80.15 647.21 733.48 52.69 13.33
Historical OBR Status GrowthAll figures in MM3
Subs OBR During Sept 2020
47

Table 4.4 : Subsidiary-wise HEMM Utilisation
Availability Utilisation Availability Utilisation Availability Utilisation Availability Utilisation Availability Utilisation
ECL 72.45 55.11 47.85 77.68 71.75 79.82 -77.68 8.07BCCL 2 78 58 81 23 83 22 58 13 -25 -9CCLNCL 23 81.79 73.48 81.38 72.29 78.98 69.25 79.31 71.08 0.33 1.83WCL 2 74.8 39.1 87.1 48.6 83.5 55.8 77.6 51.9 -5.9 -3.9SECL 4 75 59 91 60 80 63 66 56 -14 -7MCL 1 0 0 100 0 100 0 3 1 -97 1SCCL 1 84 48 69 64 71 54 51 36 -100 0
Availability Utilisation Availability Utilisation Availability Utilisation Availability Utilisation Availability UtilisationECL 42.76 79.85 40.73 79.82 42.78 41.19 -79.82 -1.59BCCL 99 74 39 73 36 72 38 73 42 1 4CCL 95 81 44 76 44 77 42 77 44 0 2NCL 116 71.87 42.17 77.66 40.69 74.19 40.03 73.74 41.03 -0.45 1WCL 136 79.9 33.6 84.1 24.2 80.9 33.9 78.2 35.3 -2.7 1.4SECL 85 75 42 70 32 73 37 72 40 -1 3MCL 52 79 31 70 19 69 23 76 30 7 7SCCL 70 81 49 88 51 87 55 82 49 -5 -6
Availability Utilisation Availability Utilisation Availability Utilisation Availability Utilisation Availability UtilisationECLBCCLCCLNCL 4 94.99 58.6 94.4 59.32 93.7 59.59 93.76 58.01 0.06 -1.58WCLSECLMCL 17 82 42 84 26 84 36 87 45 3 9SCCL
(i) Dragline
SubsNo of Units
Actual Status during Sept 2020 (in % )
Actual Status during Sept 2019 (in % )
Actual Status upto Sept 2019 (in % )
Actual Status upto Sept 2020 (in % ) Progressive Growth
(ii) Shovel
Subs No of Units
Actual Status during Sept 2020 (in % )
Actual Status during Sept 2019 (in % ) Progressive GrowthActual Status upto
Sept 2019 (in % )Actual Status upto Sept 2020 (in % )
(iii) Surface Miner
Subs No of Units
Actual Status during Sept 2020 (in % )
Actual Status during Sept 2019 (in % )
Actual Status upto Sept 2019 (in % )
Actual Status upto Sept 2020 (in % ) Progressive Growth
48

Availability Utilisation Availability Utilisation Availability Utilisation Availability Utilisation Availability UtilisationECL 32.50 73.41 27.14 75.33 28.56 33.26 -75.33 4.7BCCL 445 72 23 69 24 69 26 68 25 -1 -1CCL 356 78 40 73 35 72 34 73 38 1 4NCL 547 72.01 49.85 69.14 41.04 70.21 42.22 69.98 48.34 -0.23 6.12WCL 399 80.3 31.9 79.6 22.5 77.8 31 77.8 33.1 0 2.1SECL 444 84 33 80 32 81 35 84 32 3 -3MCL 245 81 21 79 12 76 17 81 22 5 5SCCL 510 83 30 88 31 86 34 85 30 -1 -4
Availability Utilisation Availability Utilisation Availability Utilisation Availability Utilisation Availability UtilisationECL 19.83 77.39 18.96 77.22 19.55 22.64 -77.22 3.09BCCL 106 68 13 61 16 60 16 67 14 7 -2CCL 165 78 18 81 19 79 19 77 18 -2 -1NCL 175 69.97 29.78 63.99 23.63 67.4 23.41 67.43 29.28 0.03 5.87WCL 157 79.1 24.1 79.8 21.9 76.3 24 78.4 24.3 2.1 0.3SECL 167 59 31 67 27 71 29 63 31 -8 2MCL 124 78 23 67 22 70 24 74 22 4 -2SCCL 112 80 26 80 26 78 25 77 26 -1 1
Availability Utilisation Availability Utilisation Availability Utilisation Availability Utilisation Availability UtilisationECL 17.57 86.37 17.53 84.33 17.28 18.10 -84.33 0.82BCCL 82 61 20 66 16 65 16 62 22 -3 6CCL 118 86 20 87 20 87 19 87 20 0 1NCL 137 84.92 18.17 82.26 16.09 84.21 17.44 85.15 18.19 0.94 0.75WCL 80 88.7 15.5 92 9.4 90.6 14 88.4 15.6 -2.2 1.6SECL 111 87 25 81 19 86 21 89 23 3 2MCL 71 88 15 82 10 79 14 83 14 4 0SCCL 61 83 21 84 23 81 25 80 22 -1 -3
Progressive GrowthActual Status upto Sept 2019 (in % )
(iv) Dumper
SubsActual Status during Sept 2020 (in % )
Actual Status during Sept 2019 (in % )
Actual Status upto Sept 2019 (in % )
Actual Status upto Sept 2020 (in % ) Progressive Growth
No of Units
(vi) Drill
Subs No of Units
Actual Status during Sept 2020 (in % )
Actual Status during Sept 2019 (in % )
Actual Status upto Sept 2019 (in % )
Actual Status upto Sept 2020 (in % ) Progressive Growth
(v) Dozer
Subs No of Units
Actual Status during Sept 2020 (in % )
Actual Status during Sept 2019 (in % )
Actual Status upto Sept 2020 (in % )
49

Table 4.5: Mode-wise Despatch Status (i) Rail
Sept'2020Actual Sept'2019 Upto Sept'2019 Upto Sept'2020 M-O-M Y-O-Y
ECL 2.05 1.84 14.76 12.74 11.81 -13.67BCCL 1.899 1.513 10.29 7.76 25.51 -24.59CCL 3.38 2.68 13.56 14.85 26.12 9.51NCL 3.47 3.04 14.37 14.56 14.14 1.32WCL 2.07 1.76 12.85 10.89 17.75 -15.22SECL 4.89 3.14 22.82 24.12 55.98 5.70MCL 7.33 4.84 33.52 35.79 51.47 6.78NECCIL 25.10 18.81 122.16 120.71 33.46 -1.19SCCL 2.59 2.95 21.55 12.07 -12.17 -43.97Total 27.69 21.75 143.71 132.78 27.27 -7.60
(ii) RoadSept'2020Actual Sept'2019 Upto Sept'2019 Upto Sept'2020 M-O-M Y-O-Y
ECL 0.24 0.13 1.33 1.09 80.30 -17.76BCCL 0.54 0.51 3.61 2.65 5.08 -26.54CCL 1.48 2.51 14.79 6.12 -41.04 -58.62NCL 1.19 1.51 7.43 4.56 -21.19 -38.63WCL 0.75 1.15 7.42 3.51 -35.22 -52.64SECL 2.76 3.29 29.02 13.44 -16.03 -53.69MCL 2.58 2.68 18.41 12.63 -3.74 -31.40NECCIL 9.53 11.78 82.01 44.01 -19.10 -46.34SCCL 0.57 0.77 4.92 2.66 -25.97 -45.96Total 10.10 12.55 86.93 46.67 -19.53 -46.32
All figures in MT
Subs Historical Despatch Status Growth
Subs Historical Despatch Status Growth
50

(iii) MGRSept'2020Actual Sept'2019 Upto Sept'2019 Upto Sept'2020 M-O-M Y-O-Y
ECL 0.59 0.83 6.42 5.24 -28.69 -18.34BCCLCCLNCL 4.34 4.28 20.06 20.05 1.40 -0.05WCL 0.05 0.03 0.17 0.26 67.74 52.94SECL 2.13 1.55 12.75 10.20 37.42 -19.97MCL 1.53 0.60 4.17 6.83 156.52 63.68NECCIL 8.65 7.29 43.57 42.58 18.67 -2.26SCCL 0.50 0.62 3.89 3.02 -19.61 -22.52Total 9.15 7.91 47.46 45.60 15.66 -3.92
(iv) Conveyor BeltSept'2020Actual Sept'2019 Upto Sept'2019 Upto Sept'2020 M-O-M Y-O-Y
ECLBCCLCCLNCL 0.19 0.26 1.29 1.31 -26.92 1.55WCL 0.10 0.04 0.72 0.62 140.00 -13.95SECL 0.50 0.42 3.15 2.69 19 -15MCL 0.09 0.08 0.51 0.54 13.75 6.13NECCIL 0.88 0.80 5.67 5.16 9.76 -8.99SCCL 0.02 0.01 0.15 0.11 42.86 -27.15Total 0.90 0.81 5.82 5.27 10.33 -9.47
Subs Historical Despatch Status Growth
Subs GrowthHistorical Despatch Status
51

(iv) Total Despatch- All ModesSept'2020Actual Sept'2019 Upto Sept'2019 Upto Sept'2020 M-O-M Y-O-Y
ECL 2.88 2.80 22.50 19.07 3.08 -15.24BCCL 2.44 2.03 13.90 10.41 20.34 -25.08CCL 5.89 4.43 33.10 26.83 32.96 -18.94NCL 9.22 7.95 51.10 49.69 16.05 -2.74WCL 3.77 2.36 23.51 19.07 60.25 -18.91SECL 10.40 8.39 67.73 61.69 23.96 -8.92MCL 12.01 7.35 63.96 67.78 63.49 5.97NEC 0.04 0.20 0.09 -100.00 -54.08CIL 46.62 35.33 276.00 254.63 31.95 -7.74SCCL 3.68 4.36 30.51 17.86 -15.50 -41.47Total 50.30 39.68 306.50 272.49 26.75 -11.10
Table 4.6: Sector-wise Offtake(i) Power Sector
Sept'2020Actual Sept'2019 Upto Sept'2019 Upto Sept'2020 M-O-M Y-O-Y
ECL 2.51 2.62 20.72 17.09 -4.17 -17.52BCCL 1.97 1.60 11.06 8.14 23.24 -26.45CCL 4.82 3.53 24.15 21.82 36.57 -9.64NCL 8.17 6.91 44.18 43.41 18.36 -1.73WCL 2.97 1.61 17.13 15.36 84.22 -10.35SECL 8.15 6.99 55.70 46.42 16.46 -16.66MCL 7.88 5.48 44.30 45.28 43.98 2.22NEC 0.03 0.15 0.06 -100.00 -61.84CIL 36.47 28.77 217.39 197.58 26.78 -9.11SCCL 3.12 3.78 25.62 15.15 -17.37 -40.87Total 39.59 32.54 243.01 212.73 21.65 -12.46
Historical Despatch Status GrowthSubs
Subs Historical Despatch Status Growth
52

(ii) CPPSept'2020Actual Sept'2019 Upto Sept'2019 Upto Sept'2020 M-O-M Y-O-Y
ECL 0.01 0.01 0.13 0.05 0.00 -66.42BCCL 0.00 0.00 0.01 0.00 #DIV/0! -100.00CCL 0.22 0.31 2.52 1.11 -30.00 -55.83NCL 0.51 0.57 3.54 3.48 -10.04 -1.72WCL 0.06 0.11 0.90 0.35 -43.36 -60.83SECL 0.78 0.61 5.91 5.66 27.12 -4.16MCL 1.39 0.98 10.43 9.83 42.37 -5.76NEC 0.00 0.01 0.00 -100.00 -69.23CIL 2.97 2.59 23.45 20.48 14.59 -12.65SCCL 0.23 0.19 1.51 0.96 18.56 -36.62Total 3.20 2.78 24.96 21.44 14.87 -14.10
(ii) Steel SectorSept'2020Actual Sept'2019 Upto Sept'2019 Upto Sept'2020 M-O-M Y-O-Y
ECL 0.04 0.026 0.16 0.127 57.69 -20.63BCCL 0.09 0.09 0.28 0.53 5.81 90.58CCL 0.05 0.13 0.60 0.28 -63.85 -53.99NCLWCLSECL 0.01 0.05 0.05 0.02 -84.91 -54.72MCLNECCIL 0.19 0.30 1.09 0.95 -36.61 -12.56SCCLTotal 0.19 0.30 1.09 0.95 -36.61 -12.56
Subs Historical Despatch Status Growth
Subs Historical Despatch Status Growth
53

(iii) Cement SectorSept'2020Actual Sept'2019 Upto Sept'2019 Upto Sept'2020 M-O-M Y-O-Y
ECL 0.00 0.00 0.05 0.03 0.00 -31.11BCCLCCL 0.017 0.005 -70.59NCL 0.03 0.03 0.20 0.15 -24.24 -24.75WCL 0.15 0.11 0.97 0.73 35.40 -25.00SECL 0.16 0.16 1.48 0.89 -4.27 -40.04MCL 0.01 0.00 0.08 0.08 450.00 -9.64NEC 0.02 0.02 -4.76CIL 0.35 0.32 2.81 1.89 10.76 -32.67SCCL 0.14 0.11 1.19 0.59 23.89 -50.30Total 0.49 0.43 4.00 2.48 14.22 -37.89
(iv) Sponge Iron SectorSept'2020Actual Sept'2019 Upto Sept'2019 Upto Sept'2020 M-O-M Y-O-Y
ECL 0.02 0.00 0.10 0.11 6.80BCCLCCL 0.01 0.05 0.35 0.26 -86.00 -26.35NCL 0.01 0.02 0.10 0.08 -42.11 -25.00WCL 0.02 0.03 0.22 0.09 -24.00 -60.00SECL 0.31 0.31 2.90 2.56 -1.59 -11.70MCL 0.27 0.15 1.24 1.29 76.16 3.46NECCIL 0.63 0.56 4.92 4.38 13.42 -10.98SCCL 0.00 0.002 0.045 0.014 -50.00 -68.89Total 0.64 0.56 4.97 4.39 13.19 -11.50
Subs Historical Despatch Status Growth
Subs Historical Despatch Status Growth
54

(iv) Total Offtake-All SectorsSept'2020Actual Sept'2019 Upto Sept'2019 Upto Sept'2020 M-O-M Y-O-Y
ECL 2.88 2.80 22.50 19.07 3.08 -15.24BCCL 2.44 2.02 13.90 10.41 20.69 -25.08CCL 5.88 4.43 33.10 26.82 32.73 -18.97NCL 9.22 7.95 51.10 49.69 16.05 -2.74WCL 3.77 2.36 23.51 19.07 60.25 -18.91SECL 10.40 8.39 67.73 61.69 23.99 -8.92MCL 12.01 7.35 63.96 67.78 63.49 5.97NEC 0.04 0.20 0.09 -100.00 -54.08 CIL 46.62 35.32 276.00 254.62 31.99 -7.74SCCL 3.68 4.36 30.51 17.86 -15.50 -41.47Total 50.30 39.68 306.50 272.48 26.77 -11.10
Subs Historical Despatch Status Growth
55

Table 4.7: Vendible Coal Stock
Oct'1 2020 Oct'1 2019 Sept' 2020 Sept'2019 Aug' 2020 Aug'2019ECL 2.24 0.50 2.79 2.81 80.17 17.81BCCL 2.03 1.10 2.01 1.74 101.05 63.29CCL 6.73 3.65 4.83 3.27 139.40 111.48NCL 7.56 3.10 9.26 7.67 81.64 40.44WCL 11.73 3.17 2.51 1.75 467.89 181.66SECL 9.87 2.16 8.50 7.24 116.12 29.85MCL 16.72 5.46 10.58 6.28 158.02 86.96NEC 0.00 0.03CIL 56.88 19.14 40.48 30.78 140.52 62.19SCCL 2.76 0.95 18.13 30.52 15.24 3.12Total 59.64 20.09 58.61 61.30 101.76 32.78
`
All Figures in MT
SubsVendible Coal Stock as on different dates
Production of Coal Upto
Coal Stock in % of Production
56

Performance of NLCIL


Summary of Performance of NLCILTable 5.1: Lignite Production (in MT)
Historical Production StatusTarget Actual Achievement Sept'2019 Upto Sept'2019 Upto Sept'2020 M-O-M Y-O-Y
Departmental 2.22 1.23 55.17 2.00 9.96 8.04 -38.77 -19.29Outsourced 0.13 0.10 81.75 0.14 0.58 0.63 -24.26 8.78Total` 2.35 1.33 56.60 2.14 10.54 8.67 -37.85 -17.74
Table 5.2: Production of Power (MU)Historical Production Status
Target Actual Achievement Sept'2019 Upto Sept'2019 Upto Sept'2020 M-O-M Y-O-YNLCIL 1559.60 945.49 60.62 1386.62 8400.59 6879.14 -31.81 -18.11NTPL 425.00 417.08 98.14 370.12 1931.54 2610.55 12.69 35.15Total 1984.60 1362.57 68.66 1756.74 10332.13 9489.69 -22.44 -8.15
Table 5.3: Power from Renewable Sources (MU)Historical Production Status
Target Actual Achievement Sept'2019 Upto Sept'2019 Upto Sept'2020 M-O-M Y-O-YWind Power 15.16 15.39 101.52 12.50 76.32 80.15 23.12 5.02Solar Power 181.44 145.88 80.40 76.64 486.75 994.59 90.34 104.33Total 196.60 161.27 82.03 89.14 563.07 1074.74 80.92 90.87
Table 5.4: ProductivityHistorical OMS Status
Target Actual Achievement Sept'2019 Upto Sept'2019 Upto Sept'2020 M-O-M Y-O-YMines (in te) 17.3 11.06 63.93 16.57 13.18 12.42 -33.25 -5.77TPP (Kwhr) 30352 17517 57.71 28759 27235 22170 -39.09 -18.60
Mode of Production
Production During Sept 2020 Growth
CompanyProduction During Sept 2020 Growth
SourcesProduction During Sept 2020 Growth
Mode of Production
OMS During Sept 2020 Growth
57

Table 5.5: OBR (in MM3)
Target Actual Achievement Sept'2019 Upto Sept'2019 Upto Sept'2020 M-O-M Y-O-YDepartmental 13.75 11.96 86.94 11.48 81.71 66.70 4.15 -18.37Outsourced 0.64 0.92 144.83 0.57 2.60 5.14 62.11 97.81Total 14.39 12.88 89.51 12.05 84.31 71.84 6.89 -14.79
Table 5.6: Mine-wise HEMM Utilisation
Availability Utilisation Availability Utilisation Availability Utilisation Availability Utilisation Availability UtilisationMine-1 61.74 94.5 43.59 94.08 53.36 91.42 60.25 95.42 6.89 4Mine 1A 53.12 99.41 44.29 97.83 61.02 94.18 49 97.02 -12.02 2.84Mine 2 49.31 99.38 53.25 99.81 54.4 99.22 40.94 98.96 -13.46 -0.26
Table 5.7: Sales Power Exports
Target Actual Sept'2019 Upto Sept'2019 Upto Sept'2020 M-O-M Y-O-YNLCIL (MU) 1353.47 774.59 1172.34 7034.42 5769.37 -33.93 -17.98NTPL (MU) 400 385.03 342.03 1784.5 2414.85 12.57 35.32Total Exp (MU) 1753.47 1159.62 1514.37 8818.92 8184.22 -23.43 -7.20Lignite SalesM/s TAQA (LT) 1.44 0.24 1.25 6.41 5.03 -80.80 -21.53Direct Sales (LT) 0.8 0.25 0.67 4.54 2.66 -62.69 -41.41Total Sales (LT) 2.24 0.49 1.92 10.95 7.69 -74.48 -29.77
Mode Production During Sept 2020 Historical OBR Status Growth
MineActual Status during Sept
2020 (in % )Actual Status during Sept
2019 (in % )Actual Status upto Sept 2019 (in
% )Actual Status upto Sept 2020 (in % ) Progressive Growth
SubsDespatch During Sept 2020 Historical Despatch Status Growth
58

Financial Performance


Table 6.1: Captial Expenditure Rs Cr
FY 21 FY 20 Growth M-o-M FY 21 FY 20 Growth
Y-o-YECL 1150 94.76 52.81 79.44 269.95 246.28 9.61BCCL 650 54.94 40.21 36.63 172.23 127.76 34.81CCL 900 362.59 59.5 509.39 863.18 213.59 304.13NCL 1250 281.65 26.64 957.24 651.09 188.54 245.33WCL 650 285.01 23.46 1114.88 350.65 184.12 90.45SECL 3200 541.38 106.1 410.25 1267.11 331.92 281.75MCL 1750 288.11 38.6 646.40 1236.38 148.85 730.62CIL Stand Alone 450 196.54 13.85 1319.06 212.67 25.72 726.87CIL 10000 2104.98 361.17 482.82 5023.26 1466.78 242.47SCCL 2300 100.85 129.03 -21.84 521.61 520.79 0.16NLCIL Stand Alone 4667 52.84 195.84 -73.02 224.8 1801.16 -87.52NLCIL JVs 2000 195.57 330.82 -40.88 956.65 1869.08 -48.82NLCIL 6667 248.41 526.66 -52.83 1181.45 3670.24 -67.81Total 18967 2454.24 1016.86 141.35 6726.32 5657.81 18.89
Table 6.2: Head-wise Captital Expenditure Rs Cr
Sept'20 Upto Sept'20Plant & Machinery 5790.78 744.89 2282.28 39.41Safety Plant & Machinery 226.59 0.09 0.68 0.30Development 1063.04 209.64 453.35 42.65Buidling (Factory) 283.72 25.57 72.8 25.66Buidling (Others) 510.4 25.58 133.41 26.14Furniture & Fixtures 3.21 0.12 0.25 7.79Lands 2473.86 241.14 1425.69 57.63Vehicles 16.46 0.41 2.5 15.19Railway Sidings 2087.73 832.37 1356.01 64.95Environemt 185.91 19.25 41.68 22.42Solar Power 2046.36 16.17 158.64 7.75TPP 185.51 0.49 11.59 6.25Others 4093.43 338.52 787.44 19.24Total 18967 2454.24 6726.32 35.46Note: Compny-wise Details are given in Tables in Annex
Subs/Com Budget Estimate
Actual Exp During Sept Actual Exp Upto Sept
Head of Expenditure Budget Estimate
Actual Exp % Exp
59

Table 6.3: Total Manpower
1st April'20 1st Sept 20 ChangeECL 57153 56166 -987BCCL 43425 42487 -938CCL 38168 37550 -618NCL 14382 14064 -318WCL 40401 38943 -1458SECL 51426 49558 -1868MCL 21991 21800 -191NEC 1213 1084 -129CMPDI 3156 3116 -40DCC 249 245 -4CIL HQ 881 867 -14Total CIL 272445 265880 -6565SCCL 46021 45215 -806NLCIL 12486 11875 -611Total Manpower 330952 322970 -7982
Table 6.4: Debtors Due as on 30th Sept'20 Rs Cr
Sept'20 1st April'20ChangeECL 4561.1336 3699.63 861.5036BCCL 3417.36 3159.62 257.74CCL 3910 3616.63 293.37NCL 4291.03 2053.99 2237.04WCL 2222.25 1672.22 550.03SECL 2472.95 2140.26 332.69MCL 2620.34 1530.97 1089.37Total CIL 23495.064 17873.32 5621.7436SCCL 3580.18 3686.28 -106.1NLCIL 9104.71 7178.12 1926.59NTPL 2126.54 1827.728 298.812Total NLCIL 11231.25 9005.848 2225.402Total Debtors Due 38306.494 30565.448 7741.0456
Table 6.5: Age-wise Debtors Dues as on Sept'20 Rs Cr
0-3 3-6 6-9 9-12 12+ TotalECL 1299.43 906.92 1459.599 181.27 713.9148 4561.134BCCL 1802.26 812.53 694.49 2.82 105.26 3417.36CCL 1212 968 420 418 892 3910NCL 2705.95 968.63 18.1 18.69 579.66 4291.03WCL 1770.89 377.19 23 0 51.17 2222.25SECL 426.74 421.94 350.87 186.31 1087.09 2472.95MCL 1474.19 590.81 431.26 47.13 76.95 2620.34Total CIL 10691.46 5046.02 3397.3188 854.22 3506.045 23495.06Percentage Share 45.51 21.48 14.46 3.64 14.92 100.00
Subsidiary/CompanyManpower As on the 1st Day of
Subsidiary/Company Due As on the last Day of
Age-wise Debtors in MonthsSubsidiary
60

AnnexTable 6.2 A : Statement of Head-wise Capital Expensiture of CIL Rs CR
Sept'20 Upto Sept'201 Plant & Machinery 3566.93 558.61 1503.7 42.162 Safety Plant & Machinery 206.51 0.003 Development 830.98 182.82 351.38 42.294 Buidling (Factory) 258.86 25.34 71.23 27.525 Buidling (Others) 218.72 0.006 Furniture & Fixtures7 Lands 1908.77 225.73 1327.51 69.558 Vehicles9 Transporation including Railway Sidings
etc.1564.4 832.37 1317.16 84.20
10 Environemt 185.91 19.25 41.68 22.4211 Solar Power 88.46 0 2.07 2.3412 TPP 013 Others 1170.46 260.86 408.53 34.90
10000 2104.98 5023.26 50.23
Table 6.2 B : Statement of Head-wise Capital Expensiture of SCCL Rs CR
Sept'20 Upto Sept'201 Plant & Machinery 551.64 55.4 186.89 33.882 Safety Plant & Machinery 20.08 0.09 0.68 3.393 Development 200.06 25.03 91.89 45.934 Buidling (Factory) 24.86 0.23 1.57 6.325 Buidling (Others) 119.02 1.6 12.54 10.546 Furniture & Fixtures 2.71 0.08 0.2 7.387 Lands 325.19 1.35 58.09 17.868 Vehicles 16.23 0.41 2.5 15.409 Railway Sidings 338.8 0 1.38 0.41
10 Environemt 011 Solar Power 460.9 16.17 154.28 33.4712 TPP 185.51 0.49 11.59 6.2513 Others 55 0 0 0.00
2300 100.85 521.61 22.68
Table 6.2 C : Statement of Head-wise Capital Expensiture of NLCIL Rs CR
July'20 Upto July'201 Plant & Machinery 1,672.21 130.88 591.69 35.382 Safety Plant & Machinery - - - 3 Development 32.00 1.79 10.08 31.504 Buidling (Factory) - - - 5 Buidling (Others) 172.66 23.98 120.87 70.006 Furniture & Fixtures 0.50 0.04 0.05 10.007 Lands 239.90 14.06 40.09 16.718 Vehicles 0.23 - - 9 Railway Sidings 184.53 37.47 20.31
10 Environemt - 11 Solar Power 1,497.00 2.29 0.1512 TPP - - - 13 Others 2,867.97 77.66 378.91 13.21
6667 248.41 1181.45 17.72
Sl No Head of Expenditure Budget Estimate
Actual Exp % Expenditure
Total
% Expenditure
Total
Sl No Head of Expenditure Budget Estimate
Actual Exp
Sl No Head of Expenditure Budget Estimate
Actual Exp
% Expenditure
Total
61

Annex
Table 6.6 A1: Coal Auction through Exclusive Scheme
Qty Booked (L Te)
Bid Value (Rs Lakh)
Unit Value (Rs/te)
Qty Booked (L Te)
Bid Value (Rs Lakh)
Unit Value (Rs/te)
ECLBCCLCCLNCLWCLSECLMCLNECTotal 0.000 0.00 0.000 0.00
Table 6.6 A2: Coal Auction through Exclusive Scheme
Qty Booked (L Te)
Bid Value (Rs Lakh)
Unit Value (Rs)
Qty Booked (L Te)
Bid Value (Rs Lakh)
Unit Value (Rs)
ECL 3.894 12733.769 3270BCCL 3.050 13017.303 4269CCL 2.680 4743.080 1770 14.647 36360.784 2482NCL 18.702 35404.789 1893WCL 0.600 1154.400 1924 0.742 1840.190 2480SECL 10.553 12082.887 1145 5.002 9321.094 1863MCL 44.960 42465.000 945 29.567 26097.356 883NECTotal 62.687 73179.14 1167 71.709 122041.52 1702
Table 665 B1: Coal Auction through Special Forward Scheme
Qty Booked (L Te)
Bid Value (Rs Lakh)
Unit Value (Rs/te)
Qty Booked (L Te)
Bid Value (Rs Lakh)
Unit Value (Rs/te)
ECLBCCLCCL 1.200 2889.60 2408 0.4 419.92 1050NCL 0.779 1070.85 1375 17.92 18648.55 1041WCLSECLMCLNECTotal 1.979 3960.45 2001 18.32 19068.47 1041
During Sept'20
Subs
Rail Mode Road Mode
Upto Sept'20
Subs
Rail Mode Road Mode
During Sept'20
Subs
Rail Mode Road Mode
62

Annex
Table 6.6 B2: Coal Auction through Special Forward Scheme
Qty Booked (L Te)
Bid Value (Rs Lakh)
Unit Value (Rs)
Qty Booked (L Te)
Bid Value (Rs Lakh)
Unit Value (Rs)
ECLBCCLCCL 1.200 2889.60 2408 0.880 883.84 1004NCL 0.779 1070.85 1375 29.360 30849.71 1051WCL 3.720 6242.16 1678 7.200 12517.12 1738SECL 9.385 8962.24 955MCL 19.280 15116.96 784 27.880 20762.88 745NECTotal 34.363 34281.81 998 65.320 65013.55 995
Table 6.6 C1: Coal Auction through Special Spot Scheme
Qty Booked (L Te)
Bid Value (Rs Lakh)
Unit Value (Rs/te)
Qty Booked (L Te)
Bid Value (Rs Lakh)
Unit Value (Rs/te)
ECLBCCLCCL 1.945 3135.90404 1612NCLWCLSECLMCLNECTotal 0.000 0.00 1.945 3135.90 1612
Table 6.6 C2: Coal Auction through Special Spot Scheme
Qty Booked (L Te)
Bid Value (Rs Lakh)
Unit Value (Rs)
Qty Booked (L Te)
Bid Value (Rs Lakh)
Unit Value (Rs)
ECLBCCLCCL 3.320 5212.52 1570 12.724 25577.11 2010NCLWCL 3.807 8420.76 2212SECLMCLNECTotal 3.320 5212.52 1570 16.530 33997.87 2057
Subs
Rail Mode Road ModeUpto Sept'20
During Sept'20
Subs
Rail Mode Road Mode
Upto Sept'20
Subs
Rail Mode Road Mode
63
Annex
Table 6.6 D1: Coal Auction through Spot Scheme
Qty Booked (L Te)
Bid Value (Rs Lakh)
Unit Value (Rs/te)
Qty Booked (L Te)
Bid Value (Rs Lakh)
Unit Value (Rs/te)
ECLBCCL 0.588 2944.90 5008CCLNCL 0.039 44.59 1145 2.342 4934.52 2107WCL 0.200 474.80 2374 3.029 7549.10 2492SECL 15.246 21893.22 1436MCLNECTotal 0.239 519.39 2174 21.205 37321.74 1760
Table 6.5 D2: Coal Auction through Spot Scheme
Qty Booked (L Te)
Bid Value (Rs Lakh)
Unit Value (Rs)
Qty Booked (L Te)
Bid Value (Rs Lakh)
Unit Value (Rs)
ECL 5.29584 20813.0394 3930 9.176 42452.720 4627BCCL 1.04 2465.36 2371 2.507 10525.943 4199CCL 0.16 183.2 1145 17.894 38079.368 2128NCL 2.37534 3102.702 1306 9.174 16223.110 1768WCL 0.52 1237.36 2380 11.608 27867.807 2401SECL 3.77718 3947.5425 1045 53.336 72480.355 1359MCL 19.28 19148.16 993 24.143 21167.621 877NEC 0.059 385.586 6580Total 32.448 50897.36 1569 127.895 229182.51 1792
Subs
Rail Mode Road Mode
During Sept'20
Subs
Rail Mode Road Mode
Upto Sept'20
64

Annex
Table 6.6 E1: Summary of Auction During the Month of Sept'20 in Rail ModeQ
ty
Boo
ked
(L
Te)
Bid
Val
ue
(Rs L
akh)
Uni
t Val
ue
(Rs/
te)
Qty
B
ooke
d (L
T
e)
Bid
Val
ue
(Rs L
akh)
Uni
t Val
ue
(Rs/
te)
Qty
B
ooke
d (L
T
e)
Bid
Val
ue
(Rs L
akh)
Uni
t Val
ue
(Rs/
te)
Qty
B
ooke
d (L
T
e)
Bid
Val
ue
(Rs L
akh)
Uni
t Val
ue
(Rs/
te)
ECLBCCLCCL 1.2 2889.60 2408NCL 0.7788 1070.85 1375 0.039 44.59 1145WCL 0.200 474.80 2374SECLMCLNECTotal 0.00 0.00 1.98 3960.45 2001 0 0.00 0.24 519.39 2174
Table 6.6 E2: Summary of Auction During the Month of Sept'20 in Road Mode
Qty
B
ooke
d (L
T
e)
Bid
Val
ue
(Rs L
akh)
Uni
t Val
ue
(Rs/
te)
Qty
B
ooke
d (L
T
e)
Bid
Val
ue
(Rs L
akh)
Uni
t Val
ue
(Rs/
te)
Qty
B
ooke
d (L
T
e)
Bid
Val
ue
(Rs L
akh)
Uni
t Val
ue
(Rs/
te)
Qty
B
ooke
d (L
T
e)
Bid
Val
ue
(Rs L
akh)
Uni
t Val
ue
(Rs/
te)
ECLBCCL #DIV/0! 0.588 2944.90 5008CCL #DIV/0! 0.4 419.92 1050 1.945 3135.90 1612NCL #DIV/0! 17.92 18648.55 1041 2.342 4934.52 2107WCL #DIV/0! 3.029 7549.10 2492SECL #DIV/0! 15.246 21893.22 1436MCL #DIV/0!NECTotal 0.00 0.00 #DIV/0! 18.32 19068.47 1041 1.945 3135.90 1612 21.20 37321.74 1760
Subs
Exclusive Scheme Special Forward Scheme Special Spot Scheme Spot Scheme
Subs
Exclusive Scheme Special Forward Scheme Special Spot Scheme Spot Scheme
65

Annex
Table 6.5 F1: Summary of Auction Upto the Month of Sept'20 in Rail ModeQ
ty
Boo
ked
(L
Te)
Bid
Val
ue
(Rs L
akh)
Uni
t Val
ue
(Rs/
te)
Qty
B
ooke
d (L
T
e)
Bid
Val
ue
(Rs L
akh)
Uni
t Val
ue
(Rs/
te)
Qty
B
ooke
d (L
T
e)
Bid
Val
ue
(Rs L
akh)
Uni
t Val
ue
(Rs/
te)
Qty
B
ooke
d (L
T
e)
Bid
Val
ue
(Rs L
akh)
Uni
t Val
ue
(Rs/
te)
ECL 3.894 12733.769 3270 5.296 20813.039 3930BCCL 1.04 2465.36 2371CCL 2.680 4743.080 1770 1.2 2889.60 2408 3.320 5212.52 1570 0.16 183.2 1145NCL 0.7788 1070.85 1375 2.375 3102.702 1306WCL 0.600 1154.400 1924 3.720 6242.16 1678 0.52 1237.36 2380SECL 10.553 12082.887 1145 9.385 8962.24 955 3.777 3947.5425 1045MCL 44.960 42465.000 945 19.280 15116.96 784 19.28 19148.16 993NECTotal 62.69 73179.14 1167 34.36 34281.81 998 3.32 5212.52 1570 32.45 50897.36 1569
Table 6.5 F2: Summary of Auction Upto the Month of Sept'20 in Road Mode
Qty
B
ooke
d (L
T
e)
Bid
Val
ue
(Rs L
akh)
Uni
t Val
ue
(Rs/
te)
Qty
B
ooke
d (L
T
e)
Bid
Val
ue
(Rs L
akh)
Uni
t Val
ue
(Rs/
te)
Qty
B
ooke
d (L
T
e)
Bid
Val
ue
(Rs L
akh)
Uni
t Val
ue
(Rs/
te)
Qty
B
ooke
d (L
T
e)
Bid
Val
ue
(Rs L
akh)
Uni
t Val
ue
(Rs/
te)
ECL 9.176 42452.720 4627BCCL 3.050 13017.303 4269 2.507 10525.943 4199CCL 14.647 36360.784 2482 0.880 883.84 1004 12.724 25577.11 2010 17.894 38079.368 2128NCL 18.702 35404.789 1893 29.360 30849.71 1051 9.174 16223.110 1768WCL 0.742 1840.190 2480 7.200 12517.12 1738 3.807 8420.76 2212 11.608 27867.807 2401SECL 5.002 9321.094 1863 53.336 72480.355 1359MCL 29.567 26097.356 883 27.880 20762.88 745 24.143 21167.621 877NEC 0.059 385.586 6580Total 71.71 122041.52 1702 65.32 65013.55 995 16.53 33997.87 2057 127.89 229182.51 1792
Subs
Exclusive Scheme Special Forward Scheme Special Spot Scheme Spot Scheme
Subs
Exclusive Scheme Special Forward Scheme Special Spot Scheme Spot Scheme
66
Status of Electricity Generation


Table 7.1: Statement of Electricity Generation from different Sources In MU
FY 21 FY 20Growth M-o-M FY 21 FY 20
Growth Y-o-Y
Thermal 85987.74 78980.25 8.87 473315.35 534854.76 -11.51Nuclear 3881.97 4220.23 -8.02 22253.57 24026.47 -7.38Hydro 18890.44 20790.73 -9.14 96926.09 95994.19 0.97Bhutam Imp 1451.8 1203.30 20.65 6809.50 4184.10 62.75Total Conventional 110211.95 105194.51 4.77 599304.51 659059.52 -9.07Wind 4852.12 5477.93 -11.42 39072.13 45617.89 -14.35Solar 4550.7 3565.14 27.64 29129.9 23046.8 26.39Biomass 251.31 202.23 24.27 1643.82 1377.93 19.30Bagasse 201.69 234.16 -13.87 2243.28 2864.58 -21.69Small Hydro 1377.01 1290.36 6.72 6013.07 5045.65 19.17Others 140.45 26.83 423.48 631.12 187.33 236.90Total Renewable 11373.28 10796.65 5.34 78733.32 78140.18 0.76Total Generation 121585.23 115991.16 4.82 678037.83 737199.7 -8.03% Share of RE 9.35 9.31 0.05 11.61 10.60 1.01
Table 7.1 A: Fuel-wise Electricity Generation in Thermal Sector In MU
FY 21 FY 20Growth M-o-M FY 21 FY 20
Growth Y-o-Y
Coal 79302.5 72093.24 9.99991 429240.64 493667.5 -13.051Lignite 2281.31 2503 -8.857 15253.32 15658.04 -2.5847Gas 4393.47 4377.15 0.37285 28755.91 25471.5 12.8945Diesel 10.4 6.86 51.6035 65.48 57.72 13.4442Total Thermal 85987.68 78980.25 8.87238 473315.35 534854.76 -11.506
Table 7.2: Coal Consumption and Electricity Generation In MU
FY 21 FY 20Growth M-o-M FY 21 FY 20
Growth Y-o-Y
Coal Consumption (MT) 51.9 47.11 10.17 278.85 320.43 -12.98Electricity From Coal (MU) 79302.5 72093.24 10.00 429240.64 493667.5 -13.05Average PLF 55.68 51.16 8.84 49.55 57.9 -14.42Specific Coal Consumption* 0.654 0.653 0.15 0.650 0.649 0.09* Kg of Coal required to produce 1 Unit of Electricity
Table 7.3 Coal Imports (Provisional) In MT
FY 21 FY 20Growth M-o-M FY 21 FY 20
Growth Y-o-Y
Non Coking * 11.81 11.97 -1.34 61.14 84.63 -27.75Coking 4.59 3.54 29.65 18.42 25.85 -28.72Anthracite 0.29 0.08 268.23 1.02 0.99 2.71Total 16.69 15.59 7.06 80.58 111.46 -27.71* Non-Coking Coal means Bituminous and Steam Coal
During Sept Upto SeptType of Coal
Statement on the Status of Electricity Generation During Sept 2020
Generation During Sept Generation Upto SeptSource
During Sept Upto SeptItems of Information
Generation During Sept Generation Upto SeptFuel
67

Note: Detailed Analysis of Imports of July'20 is given in Tables in AnnexTable 7.4: Non-Coking Coal Consumption by Cement and DRI Sectors(i) Cement Sector In MT
FY 21 FY 20Growth M-o-M FY 21 FY 20
Growth Y-o-Y
Cement Production 24.229 25.108 -3.50 112.453 163.547 -31.24Coal Consumption 4.119 4.268 -3.50 19.117 27.803 -31.24Domestic Coal Supply 0.511 0.472 8.26 2.683 4.288 -37.43Coal Import 0.940 2.837Balance of Coal -2.668 -13.597
(ii) DRI Sector In MT
FY 21 FY 20Growth M-o-M FY 21 FY 20
Growth Y-o-Y
DRI Production 2.795 2.888 -3.22 14.286 18.351 -22.151Coal Consumption 3.874 4.003 -3.22 19.800 25.434 -22.151Domestic Coal Supply 0.635 0.561 13.19 4.393 4.984 -11.858Coal Import 0.210 0.322Balance of Coal -3.029 -15.085
Table 7.5: Coking Coal Consumption by Steel Sector In MT
FY 21 FY 20Growth M-o-M FY 21 FY 20
Growth Y-o-Y
Hot Metal Production 5.894 5.667 4.01 30.178 36.602 -17.55Coal Consumption 4.715 4.534 4.01 24.1424 29.2816 -17.55Domestic Coal Supply 0.671 0.948 -29.22 4.448 5.369 -17.15Coal Import 3.880 11.552Balance of Coal -0.164 -8.142
Table 7.6: Summary of Coal Consumption in Major Sectors In MT
FY 21 FY 20Growth M-o-M FY 21 FY 20
Growth Y-o-Y
Power Utilities 51.900 47.110 10.17 278.850 320.430 -12.98Cement 4.119 4.268 -3.50 19.117 27.803 -31.24DRI 3.874 4.003 -3.22 19.800 25.434 -22.15Total Non-Coking 59.893 55.381 8.15 317.767 373.667 -14.96Steel 4.715 4.534 4.01 24.142 29.282 -17.55Total Coking 4.715 4.534 4.01 24.142 29.282 -17.55Total Coal 64.608 59.915 7.83 341.910 402.949 -15.15
ItemsDuring Sept Upto Sept
SectorsDuring Sept Upto Sept
Note: Coal Consumption is estimated on the basis of Specific Coal Consumption in different Sectors
ItemsDuring Sept Upto Sept
ItemsDuring Sept Upto Sept
68

Table 7.7: Statement of Coal Supply to Other Sectors
FY 21 FY 20Growth M-o-M FY 21 FY 20
Growth Y-o-Y
Domestic Supply 6.199 3.050 103.25 30.537 28.259 8.06Import 7.220 27.361Total 13.419 57.898
Source of SuppyDuring Sept Upto Sept
69

AnnexTable 7.3 A: Total Coal Imports Including Coke (Provisional) In MT
FY 21 FY 20Growth M-
o-M FY 21 FY 20 Growth Y-o-YNon Coking 11.97 11.81 1.32 61.14 84.63 -27.75Coking 4.59 3.54 29.65 18.42 25.85 -28.72Anthracite 0.29 0.08 268.23 1.02 0.99 2.71PCI Coal 1.19 0.82 45.94 5.31 6.51 -18.55Pet Coke 0.78 0.09 725.24 0.91 1.43 -36.10Met Coke 0.24 0.72 -66.40 5.15 5.41 -4.87Total 19.06 17.06 11.72 91.95 124.82 -26.33
Table 7.3 B: State-wise Import of Coal and Coke In L Te
Sept'20 Sept'19Growth M-
o-M Sept'20 Sept'19 Growth Y-o-YGujarat 65.77 58.05 13.31 156.71 433.37 -63.84Maharashtra 10.73 11.53 -6.93 27.30 88.38 -69.12Goa 4.33 8.40 -48.46 20.42 49.83 -59.03Karnataka 0.77 4.09 -81.20 9.43 27.25 -65.39Tamil Nadu 11.87 13.34 -11.05 26.59 93.03 -71.42Puducherry 5.30 5.62 -5.62 10.79 26.36 -59.09Andhra Pradesh 48.16 40.26 118.85 283.60 -58.09Odisha 31.60 22.04 43.34 57.89 154.42 -62.51West Bengal 11.78 7.26 62.32 21.43 67.99 -68.49Punjab 0.00 0.00 0.00 0.00 0.01 -26.11Delhi 0.00 0.00 0.00 0.00 -99.47Haryana 0.00 0.00 -100.00 0.00 0.00 -100.00Chhattisgarh 0.00 0.00 0.00 0.01 -83.33Madhya Pradesh 0.04 0.02 75.78 0.01 0.23 -95.61others - 0.00 470.06 23.69 1884.45Total 190.62 170.62 11.72 919.47 1248.16 -26.33Note: Import is for major States. Total figures may not match with total importTable 7.3 C: Sector Wise Import of Coal and Coke during July 2020 In MT
Sector Non CokingCoking Anthr PCI Met Coke Pet Coke TotalAluminium 0.000 0.000 0.000 0.000 0.000 0.000 0.000Auto 0.000 0.000 0.000 0.000 0.000 0.000 0.000Calciner 0.000 0.000 0.000 0.000 0.000 0.160 0.160Calcium Carbide 0.000 0.000 0.000 0.000 0.000 0.030 0.030Cement 0.940 0.000 0.000 0.000 0.000 0.550 1.490Chemical & Petrochem 0.730 0.030 0.020 0.000 0.050 0.000 0.830DRI 0.210 0.040 0.000 0.000 0.000 0.000 0.250Power 3.580 0.070 0.010 0.000 0.000 0.000 3.660Ferro Alloy 0.120 0.030 0.010 0.000 0.001 0.000 0.161Graphite Electrode 0.000 0.000 0.000 0.000 0.000 0.009 0.009Iron & Steel 0.620 3.880 0.180 1.130 0.190 0.000 6.000Logistics 0.004 0.040 0.000 0.000 0.000 0.000 0.044Lime Klin 0.000 0.000 0.000 0.000 0.000 0.030 0.030Paper & Plywood 0.130 0.000 0.000 0.000 0.000 0.000 0.130Pharma 0.000 0.000 0.000 0.000 0.000 0.000 0.000Sugar 0.020 0.000 0.000 0.000 0.000 0.000 0.020Textile 0.160 0.000 0.000 0.000 0.000 0.000 0.160Traders 4.330 0.490 0.050 0.060 0.000 0.000 4.930Foundry 0.000 0.000 0.000 0.000 0.000 0.000 0.000Tyres 0.000 0.000 0.000 0.000 0.000 0.000 0.000Others 1.110 0.010 0.020 0.000 0.001 0.000 1.141Total 11.97 4.590 0.290 1.190 0.242 0.780 19.046
Type of CoalDuring Sept Upto Sept
Import During the month of Progressive Import uptoState
70

AnnexTable 7.3 D: Non-Coking Coal Import during the month of Sept 2020 Grade-wise In Lakh Te
Port G1 G2 G3 G4 G5 G6 G7 G8 G9 G10 G11 G12 G14Not Known Total
Bedi 0.25 0.25Bhavnagar 1.09 1.09Dahej 4.69 4.69Dhamra 4.81 4.81Ennore 6.26 6.26Gangavaram 0.79 6.16 5.60 0.84 0.00 13.40Hazira 4.86 4.86Jafrabad 0.02 0.02Jaigad 0.15 0.25 1.63 2.02Jakhau 0.23 0.23Kakinada 0.81 0.81Kandla 0.67 3.48 0.83 1.38 1.91 0.38 0.10 0.60 0.57 1.60 0.57 1.34 0.00 13.43Karaikal 4.67 4.67Kolkata 0.59 0.33 0.85 1.77Krishnapatnam 0.81 0.37 1.51 4.43 0.72 4.66 12.49Magdalla 0.88 8.38 9.26Marmagoa 2.52 2.52Muldwarka 0.08 0.08Mumbai & Jnpt 1.61 1.61Mundra 0.78 7.08 0.76 1.62 0.00 10.24Navlakhi 6.91 6.91New Mangalore 0.13 0.25 0.00 0.38Okha 1.94 0.40 2.34Others 0.31 1.88 3.10 5.29Paradip 1.57 1.57Pipavav 0.30 0.30Porbandar 0.46 0.46Sikka 0.07 0.07Tuticorin / Voc 5.36 5.36Vizag 0.85 0.00 0.28 0.55 0.55 0.30 2.52Total 0.67 4.32 1.71 1.38 3.51 6.94 14.02 3.77 2.86 0.57 4.58 5.00 4.49 65.88 119.70
Table 7.3 D 1 : Country-wise Non-coking Coal Import durng Sept 2020 In Lakh Te
County G1 G2 G3 G4 G5 G6 G7 G8 G9 G10 G11 G12 G14Not Known Total
Australia 0.80 0.79 0.91 2.51Indonesia 1.17 0.61 0.58 0.00 7.46 2.93 1.36 0.57 4.58 5.00 4.49 44.11 72.84Mozambique 0.79 0.39 1.65 2.82Others 0.80 0.80Russia 0.61 0.61South Africa 0.88 2.725 5.76 6.19 0.84 1.51 17.60 35.50Spain 0.37 0.00 0.37United States 0.67 3.15 0.23 0.21 4.26Total 0.67 4.32 1.71 1.38 3.51 6.94 14.02 3.77 2.86 0.57 4.58 5.00 4.49 65.88 119.70
71

Annex
Table 7.3 E: Port and Country-wise Import of Non-Coking Coal during Sept 2020 (L Te)
Port
Aus
tral
ia
Indo
nesi
a
Moz
ambi
que
Rus
sia
Sout
h A
fric
a
Spai
n
Uni
ted
Stat
es
Oth
ers
Tot
al
Bedi 0.25 0.25Bhavnagar 0.55 0.5387 1.09Dahej 0.91 3.7744 4.69Dhamra 4.8108 4.81Ennore 5.66 0.61 6.26Gangavaram 0.79 0.38581 12.22 13.40Hazira 4.86 4.86Jafrabad 0.00Jaigad 0.40 1.1 0.53 0.02 2.04Jakhau 0.00Kakinada 0.20 0.605 0.23 1.03Kandla 0.80 7.51 0.7884 1.1217 3.21 13.43Karaikal 4.67 4.67Kolkata 0.00 0.33 1.2316 0.21 1.77Krishnapatnam 5.69 6.4298 0.3686 12.49Magdalla 6.64 2.6185 9.26Marmagoa 0.55 1.9661 2.52Muldwarka 0.00 0.00Mumbai & Jnpt 1.61 0.00 0.00 0.08 1.69Mundra 9.46 0.78 10.24Navlakhi 6.91 6.91New Mangalore 0.38 0.38Okha 0.00Others 7.23 0.40 7.63Paradip 1.57 1.57Pipavav 0.30 0.30Porbandar 0.22 0.24 0.46Sikka 0.00Tuticorin / Voc 5.36 0.06542 5.42Vizag 1.38 0.30 0.85 2.52Total 2.51 72.84 2.82 0.61 35.50 0.37 4.26 0.80 119.70
72

Annex
Port
Aus
tral
ia
Indo
nesi
a
Moz
ambi
que
Rus
sia
Sout
h A
fric
a
Spai
n
Uni
ted
Stat
es
Ave
rage
Pri
ce
Bedi 54.86 54.86Bhavnagar 35.99 49.20 42.59Dahej 52.50 40.77 42.07Dhamra 51.43 51.43Ennore 38.43 36.44 38.15Gangavaram 51.51 58.65 51.26 51.46Hazira 29.93 29.93Jaigad 48.12 58.20 80.57 55.08Kakinada 29.20 69.81 42.73Kandla 72.58 41.23 58.01 62.13 76.63 53.15Karaikal 49.77 49.77Kolkata 733.37 47.35 57.16 78.35 91.54Krishnapatnam 33.69 53.39 48.50 46.50Magdalla 39.25 69.71 41.60Marmagoa 65.89 59.92 60.66Mumbai & Jnpt 54.22 665.18 436.07Mundra 51.39 57.29 52.23Navlakhi 38.88 38.88New Mangalore 41.62 41.62Others 42.48 42.48Paradip 55.94 55.94Pipavav 62.05 62.05Porbandar 39.85 62.05 50.95Tuticorin / Voc 36.99 36.99Vizag 42.05 47.91 76.88 48.95Average Price 134.41 40.31 59.15 36.44 54.84 48.50 171.64 55.41
Table 7.3 F 1: Port and Country-wise Average Unit Value of Non-Coking Coal Imports during Sept 2020 (US$/te)
73

Annex
Port
Aus
tral
ia
Indo
nesi
a
Moz
ambi
que
Rus
sia
Sout
h A
fric
a
Spai
n
Uni
ted
Stat
es
Ave
rage
Pri
ce
Bedi 4065.44 4065.44Bhavnagar 2685.00 3670.00 3177.50Dahej 3984.75 3026.30 3132.80Dhamra 3821.56 3821.56Ennore 2850.67 2700.00 2829.15Gangavaram 3842.65 4375.25 3831.23 3844.94Hazira 2232.06 2232.06Jaigad 3570.48 4312.41 5970.55 4084.47Kakinada 2189.56 5207.53 3195.55Kandla 5414.47 3068.40 4327.76 4687.72 5717.76 3964.06Karaikal 3719.12 3719.12Kolkata 54709.63 3532.25 4302.75 5805.74 6844.19Krishnapatnam 2505.81 3971.61 3618.10 3458.95Magdalla 2918.16 5219.93 3095.22Marmagoa 4915.50 4493.94 4546.63Mumbai & Jnpt 4035.24 49356.58 32361.08Mundra 3829.03 4245.20 3888.48Navlakhi 2893.69 2893.69New Mangalore 3084.21 3084.21Others 3157.52 3157.52Paradip 4151.65 4151.65Pipavav 4597.91 4597.91Porbandar 2953.00 4597.91 3775.45Tuticorin / Voc 2760.09 2760.09Vizag 3122.13 3574.28 5802.53 3652.97Average Price 10034.26 2999.50 4401.41 2700.00 4093.75 3618.10 12767.32 4126.89
Table 7.3 F 2: Port and Country-wise Average Value of Non-Coking Coal Imports during Sept 2020 (Rs/te)
74

Annex
Table 7.3 G 1: Coking Coal Import during Sept 2020 In L Te
Port Aus
tral
ia
Can
ada
Indo
nesi
a
Moz
ambi
que
Rus
sia
Uni
ted
Kin
gdom
Uni
ted
Stat
es
othe
rs
Tot
al
Bedi 0.2 0.2Dhamra 6.4 0.4 0.4 0.9 0.0 8.2Ennore 0.2 0.2Gangavaram 3.1 3.1Jaigad 2.0 0.3 2.3Kakinada 0.5 0.5Kandla 1.4 0.5 1.9Karaikal 0.5 0.5Kolkata 6.0 0.6 0.5 0.2 1.0 8.3Krishnapatnam 2.8 0.1 2.9Marmagoa 0.9 0.9 1.7Others 0.0 0.6 0.6Paradip 6.9 0.8 1.1 8.8Vizag 4.9 0.4 0.5 0.7 6.5Total 35.8 1.7 1.5 1.9 2.0 0.0 2.9 0.0 45.8
Port Aus
tral
ia
Can
ada
Indo
nesi
a
Moz
ambi
que
Rus
sia
Uni
ted
Kin
gdom
Uni
ted
Stat
es
Ave
rage
Pri
ceBedi 119 119Chennai 414 414Dhamra 112 86 108 116 111Ennore 117 117Gangavaram 112 112Hazira 383 383Jaigad 112 94 108Kakinada 106 106Kandla 122 92 114Karaikal 117 117Kolkata 110 96 115 87 118 109Krishnapatnam 95 97 95Marmagoa 99 112 108Others 89 89Paradip 110 119 85 108Vizag 112 106 115 120 113Average Price 111 114 95 106 90 399 112 111
Table 7.3 G 2: Average Price of Imported Coking Coal during Sept 2020 (US$/te)
75

Annex
Port Aus
tral
ia
Can
ada
Indo
nesi
a
Moz
ambi
que
Rus
sia
Uni
ted
Kin
gdom
Uni
ted
Stat
es
Ave
rage
Pri
ce
Bedi 8873 8873Chennai 30701 30701Dhamra 8352 6402 8076 8619 8255Ennore 8889 8889Gangavaram 8290 8290Hazira 28416 28416Jaigad 8322 7104 8079Kakinada 7862 7862Kandla 9101 6848 8494Karaikal 8678 8678Kolkata 8189 7126 8531 6447 8852 8104Krishnapatnam 7099 7212 7111Marmagoa 7365 8299 7988Others 6617 6617Paradip 8248 8823 6355 8064Vizag 8374 8041 8534 9110 8419Average Price 8254 8474 7050 7856 6705 29559 8389 8297
Table 7.3 G 3: Average Price of Imported Coking Coal during Sept 2020 (Rs/te)
76

Projects of PSUs
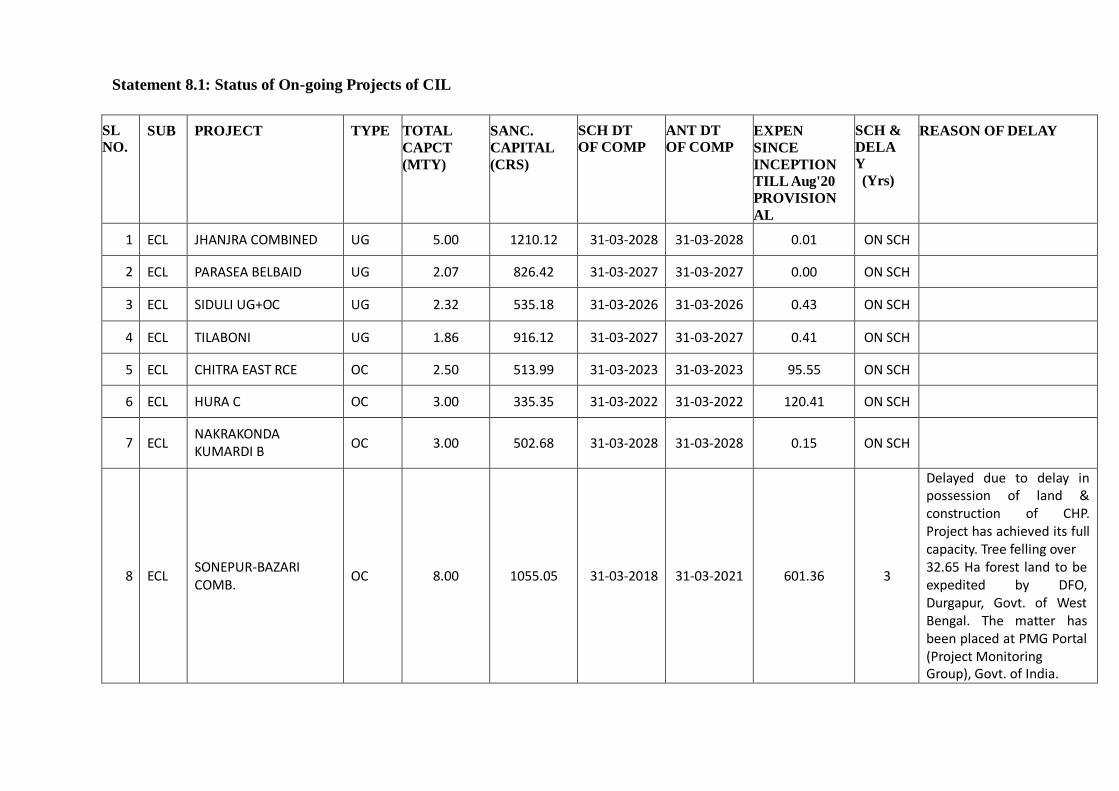
Statement 8.1: Status of On-going Projects of CIL
SL
NO. SUB PROJECT TYPE TOTAL
CAPCT
(MTY)
SANC.
CAPITAL
(CRS)
SCH DT
OF COMP ANT DT
OF COMP EXPEN
SINCE
INCEPTION
TILL Aug'20
PROVISION
AL
SCH &
DELA
Y (Yrs)
REASON OF DELAY
1 ECL JHANJRA COMBINED UG 5.00 1210.12 31-03-2028 31-03-2028 0.01 ON SCH
2 ECL PARASEA BELBAID UG 2.07 826.42 31-03-2027 31-03-2027 0.00 ON SCH
3 ECL SIDULI UG+OC UG 2.32 535.18 31-03-2026 31-03-2026 0.43 ON SCH
4 ECL TILABONI UG 1.86 916.12 31-03-2027 31-03-2027 0.41 ON SCH
5 ECL CHITRA EAST RCE OC 2.50 513.99 31-03-2023 31-03-2023 95.55 ON SCH
6 ECL HURA C OC 3.00 335.35 31-03-2022 31-03-2022 120.41 ON SCH
7
ECL NAKRAKONDA KUMARDI B
OC
3.00
502.68
31-03-2028
31-03-2028
0.15
ON SCH
8
ECL
SONEPUR-BAZARI COMB.
OC
8.00
1055.05
31-03-2018
31-03-2021
601.36
3
Delayed due to delay in possession of land & construction of CHP. Project has achieved its full capacity. Tree felling over 32.65 Ha forest land to be expedited by DFO, Durgapur, Govt. of West Bengal. The matter has been placed at PMG Portal (Project Monitoring Group), Govt. of India.
77

SL
NO. SUB PROJECT TYPE TOTAL
CAPCT
(MTY)
SANC.
CAPITAL
(CRS)
SCH DT
OF COMP ANT DT
OF COMP EXPEN
SINCE
INCEPTION
TILL Aug'20
PROVISION
AL
SCH &
DELAY (Yrs)
REASON OF DELAY
9
BCCL
MOONIDIH XV SEAM
UG
2.50
1230.27
31-03-2019
31-03-2022
435.06
3
Initially delayed due to acquisition of Tenancy Land. Fire & Gas detected during incline drivage. Hard Strata has been encountered in both the inclines which has slowed down the progress of Incline drivage. The work of the project is further delayed due to Covid-19 issue.
10
BCCL
NORTH TISRA
SOUTH TISRA EXPANSION
OC
6.00
555.52
31-03-2021
31-03-2021
5.47
ON SCH
78

11
BCCL
MADHUBAN NLW WASHERY
WSRY
5.00
289.45
31.05.2021
28.02.2021
269.78
7
• Repeated failure by HEC in adhering to timelines committed by them.
9th time extension has been granted to M/s HEC up to Feb. 2021.
Commissioning of RLS & Railway siding shall be possible only after commissioning of the washery by M/s HEC
SL NO.
SUB PROJECT TYPE TOTAL
CAPCT
(MTY)
SANC.
CAPITAL
(CRS)
SCH DT OF COMP
ANT DT OF COMP
EXPEN
SINCE
INCEPTION
TILL Aug'20
PROVISION
AL
SCH & DELA
Y (Yrs)
REASON OF DELAY
12 CCL AMRAPALI OC 25.00 4983.58 31-03-2028 31-03-2028 242.61 ON SCH
13 CCL CHANDRAGUPTA OC 15.00 973.50 31-03-2026 31-03-2026 0.00 ON SCH
14
CCL KOTRE BASANTPUR PACHMO
OC
5.00
861.06
31-03-2028
31-03-2028
0.00
ON SCH
15 CCL MAGADH EXPN. OC 51.00 6964.33 31-03-2028 31-03-2028 637.99 ON SCH
16 CCL NORTH URIMARI EXPN OC 7.50 1468.72 31-03-2024 31-03-2024 206.42 ON SCH
17
CCL
RAJRAPPA RCE
OC
3.00
510.85
31-03-2016
31-03-2022
380.50
6
Delay in possession of non- forest land as well as forest land.
79

18 CCL SANGAMITRA OC 20.00 1694.74 31-03-2025 31-03-2025 0.00 ON SCH
19 CCL JHARKHAND LAIYO OC 1.00 764.57 31-03-2031 31-03-2031 0.00 ON SCH
20 CCL PATRATU ABC UG 5.00 1712.55 31-03-2029 31-03-2029 0.00 ON SCH
21
MCL
ANANTA EXPN.PH-III
OC
15.00
207.28
31-03-2012
31-03-2022
347.03
10
Delay in FC due to delayed grant of NoC from Gramsabha, identification of CA site and Construction of SILO.
22 MCL BALARAM EXTN. OC 15.00 3504.21 31-03-2029 31-03-2029 980.40 ON SCH
23 MCL SIARMAL OC 40.00 3756.36 31-03-2026 31-03-2026 1965.41 ON SCH
24
MCL BHARATPUR REORGANISATION
OC
20.00
1928.29
31-03-2029
31-03-2029
1205.12
ON SCH
SL
NO. SUB PROJECT TYPE TOTAL
CAPCT
(MTY)
SANC.
CAPITAL
(CRS)
SCH DT
OF COMP ANT DT
OF COMP EXPEN
SINCE
INCEPTION
TILL Aug'20
PROVISION
AL
SCH &
DELAY (Yrs)
REASON OF DELAY
25
MCL
BASUNDHARA WEST EXTN.
OC
7.00
479.15
31-03-2017
31-03-2024
357.48
7
Delayed due to EC and FC for 227.61 Ha forest Land. Gram Sabha for Gopalpur and Ratansara villages have been conducted for FRA. NOC is yet to be issued by Collector.
26 MCL GARJANBAHAL OC 10.00 1375.38 31-03-2021 31-03-2021 477.21 ON SCH
80

27
MCL LAKHANPUR BELPAHAR LILARI
OC
30.00
2434.75
31-03-2027
31-03-2027
129.01
ON SCH
28
MCL
HINGULA-II EXPN.PH-III
OC
15.00
479.53
31-03-2013
31-03-2022
668.54
9
Delay in forest diversion & EMP clearance, development of R&R Site at Kochianali & delay in construction of SILO.
29
MCL JAGANNATH RO PH-III EXTENSION
OC
6.00
337.66
31-03-2019
31-03-2021
328.36
2 Delay in possession of land in Rakas Village
30
MCL
KULDA EXPN
OC
15.00
289.03
31-03-2018
31-03-2024
111.90
6 Delay in construction of SILO at Barpali Bulb.
31
MCL GOPALJI KANIHA EXPANSION
OC
30.00
8416.19
31-03-2028
31-03-2028
663.16
ON SCH
32
MCL BHUBANESWARI EXPANSION
OC
40.00
3145.45
31-03-2031
31-03-2031
569.52
ON SCH
SL
NO.
SUB PROJECT TYPE TOTAL
CAPCT
(MTY)
SANC.
CAPITAL
(CRS)
SCH DT
OF COMP ANT
DTREASON OF
COMP
EXPEN
SINCE
INCEPTION
TILL Aug'20
PROVISION
AL
SCH &
DELAY (Yrs)
REASON OF DELAY
33
MCL
IB VALLEY WASHERY
WSRY
10.00
392.76
31-03-2020
31-05-2021
138.00
1
The Project started late due to delay in handover of land, due to which the Project was likely to be completed by May-2020. But again, due to lockdown the Project is further delayed.
81

34 NCL BLOCK - B EXPN. OCP OC 8.00 998.71 31-03-2023 31-03-2023 0.00 ON SCH
35 NCL JAYANT EXPN OC 20.00 1783.09 31-03-2021 31-03-2021 390.72 ON SCH
36 NCL DUDHICHUA EXPN OC 20.00 1255.17 31-03-2022 31-03-2022 123.17 ON SCH
37
NCL BINA KAKRI AMALGAMATION
OC
14.00
836.42
31-03-2024
31-03-2024
0.00
ON SCH
38 SECL AMADAND RPR OC 4.00 869.44 31-03-2021 31-03-2021 119.20 ON SCH
39
SECL BAROUD EXPANSION RCE
OC
10.00
2103.21
31-03-2029
31-03-2029
261.64
ON SCH
40 SECL CHHAL SEAM-III OC 6.00 610.63 31-03-2022 31-03-2022 124.26 ON SCH
41 SECL JAGANNATHPUR RCE OC 3.00 459.49 31-03-2020 31-03-2022 192.64 2 Land & R& R issue
42 SECL DURGAPUR OC 6.00 916.24 31-03-2023 31-03-2023 6.47 ON SCH
SL NO
.
SUB PROJECT TYPE TOTAL
CAPCT
(MTY)
SANC.
CAPITAL
(CRS)
SCH DT OF COMP
ANT DT OF COMP
EXPEN
SINCE
INCEPTION
TILL Aug'20
PROVISION
AL
SCH & DELA
Y (Yrs)
REASON OF DELAY
82

43
SECL
MANIKPUR EXPN.
OC
3.50
321.50
31-03-2014
31-03-2021
207.89
7
Initially, project delayed on account of delay in EC and forestry clearance. As on date, project is getting delayed on account of construction of in-pit crushing conveyor system. Estimated cost is Rs.156.81 crores. Part-II opened on 31.7.20, L-1 rate 67.8% above updated cost. TCR cancellation approved on 20.8.20. Retendered on 20.8.20. Part-1 of tender to be opened on 05.10.2020.
44 SECL GEVRA EXPN OC 70.00 11816.40 31-03-2023 31-03-2023 3249.51 ON SCH
45 SECL KUSMUNDA EXPN OC 50.00 7612.33 31-03-2023 31-03-2023 2395.16 ON SCH
46 SECL MADANNAGAR OC 12.00 1875.32 31-03-2024 31-03-2024 0.00 ON SCH
47 SECL PELMA OC 15.00 1624.59 31-03-2023 31-03-2023 6.58 ON SCH
48 SECL RAMPUR BATURA OC 4.00 1248.93 31-03-2026 31-03-2026 131.90 ON SCH
49 SECL VIJAY WEST OC 3.00 976.95 31-03-2026 31-03-2026 75.96 ON SCH
50 WCL GAURI PAUNI EXPN OC 3.50 289.34 31-03-2029 31-03-2029 0.00 ON SCH
SL
NO.
SUB PROJECT TYPE TOTAL
CAPCT
(MTY)
SANC.
CAPITAL
(CRS)
SCH DT
OF COMP ANT DT
OF COMP EXPEN
SINCE
INCEPTION
TILL Aug'20
PROVISION
AL
SCH &
DELAY (Yrs)
REASON OF DELAY
83

51
WCL
GONDEGAON GHATROHAN AMAL. RPR
OC
3.50
191.78
31-03-2022
31-03-2022
100.95
ON SCH
52
WCL MUNGOLI NIRGUDA EXT DEEP
OC
3.50
461.83
31-03-2020
30-09-2020
126.01
0.5
RPR under approval.
53 WCL NILJAI EXPN DEEP OC 3.50 319.76 31-03-2021 31-03-2021 127.54 ON SCH
54 WCL PAUNI II EXPANSION OC 3.25 483.69 31-03-2021 31-03-2021 217.73 ON SCH
55
WCL YEKONA-I & II AMALGAMATED
OC
2.75
727.28
31-03-2025
31-03-2025
247.15
ON SCH
56
WCL AMAL. INDER KAMPTEE DEEP
OC
3.20
235.90
31-03-2024
31-03-2024
55.86
ON SCH
57 WCL DINESH (MKD-III) OC 8.00 822.89 31-03-2027 31-03-2027 6.53 ON SCH
58 WCL DURGAPUR EXTN DEEP OC 3.00 328.00 31-03-2021 31-03-2021 203.10 ON SCH
Total 709.45 93818.98 19307.26
84

Statement 8.2: Status of On-going Projects of NLCIL
Date of
approval
Sanctioned
Cost Rs. Crore
Scheduled date of
completion
Anticipated
Cost Rs. Crore
Anticipated
date of
completion
Cumulative
Expenditure
upto31.03.20
20Rs. Crore
Capex 2020-21 Rs.
Crore
Cumulative
(upto30.09.2020 )Rs. Crore
Cumulative Progress (%)upto30.09.2020
Remarks
Physical Financial
Target ActualProvl
(upto30.09. 2020)
Target /Schedule
Actual Target /Schedule
Actual
NEYVELI NEW THERMAL POWER PROJECT (2X500 MW): (NNTPP)
09.06.2011
5907.11
(Oct- 2010)
U-I: Oct 2017
U-II: May 2018
5907.11
(Oct-2010)
7080.41
(RCE-1) *
7980.79 (RCE-2)**
U-1- #
U-II-Oct
2020
7185.39
500.00
121.27
7306.66
100
99.51
76.29
91.55
*- RCE 1 cost Rs.7080.41 Crore. # - commercial operation from 28.12.2019. **- RCE-2cost Rs.7980.79Crore. NTA-1: Unit-2 Mill-30 Trial run completed on 13.09.2020. Unit-2 7 out of 8 Mills Protection and interlock checking completed on 19.09.2020. Unit-2 Boiler hydro test conducted in
presence of Deputy Director of Boiler on 09.08.2020 for licence renewal.Unit-2 Conveyor 40.4 & 40.5 trial run completed on 17.09.2020. NTA-3: Circulating Water pump – Battery Bank-1350 Amp-hour reconditions and re-commissioned on 27.09.2020.AHS- Vacuum Pump House-2 Conveying air
compressor erection and trial run completed on 29.09.2020. Unit-2 light-up activities are under progress. CERC has issued an interim tariff order on 29th January 2020 for the period from Commercial Operation Declaration (COD) of Unit-I and anticipated COD of Unit-II till 31st March
2021 based on the petition no. 219/GT/2019 filed by NLCIL. CERC has permitted NLCIL vide lr. dated 30th Sep 2020 to draw start-up power and inject infirm power into the grid to facilitate commissioning test including full load
test of Unit-II of NNTPP Project till 31.10.2020. NTA-4: FGD package contract awarded to China Datang Technologies and Engineering Co. Ltd. (CDTE) on 31.08.2019. Due to delay in commencement of activities and enormous
delay in submission of Advance Bank Guarantee, NLCIL issued show cause notice to M/s CDTE on 07.07.2020. M/s China Datang Termination letter sent on 07.09.2020 citing poor
progress of engineering, the inability of the contractor so far to establish site office and start site-enabling works etc.
Date of
approval
Sanctioned
Cost Rs. Crore
Scheduled
date of
completion
Anticipated
Cost Rs. Crore
Anticipated
date of
completion
Cumulative
Expenditure
upto31.03.20
20 Rs. Crore
Capex 2020-21 Rs.
Crore
Cumulative (upto
30.09.2020) Rs. Crore
Cumulative Progress (%)upto 30.09.2020
Remarks Physical Financial
Target Actual Provl
(upto 30.09.2020)
Target /Schedule
Actual Target /Schedule
Actual
EXPANSION OF MINE-I 10.50 MTPA (AREA EXPANSION) & EXPANSION OF MINE-IA (FROM 3.0 MTPA TO 7.0 MTPA) 30.04.2013
1458.17 Original
709.06 RCE
(12.09.2016)
June 2015 /
June2018
709.06
Put on Hold
468.21
0.00
7.14
475.35
69.27
67.03
67.27
67.04
-
Due to Non availability of land, it was not possible to increase over burden removal to extent of 47.50 MM3 per annum as envisaged in mine planning to get 7.0 MTPA lignite
exposure, hence it is required to keep Mine 1A Expansion to 7.0 MTPA on hold till land is acquired. In future when land is available and lignite demand increases, appropriate steps for
Mine 1A expansion will be taken. Until then it is proposed to keep Mine 1A Expansion on hold and the same was approved by NLClL’s Board in its492ndmeeting held on 26th June 2019.
85

Date of
approval
Sanctioned
Cost Rs. Crore
Scheduled
date of
completion
Anticipated
Cost Rs. Crore
Anticipated
date of
completion
Cumulative
Expenditure
upto31.03.20
20 Rs. Crore
Capex 2020-21
RsCrore
Cumulative
upto 30.09.2020 Rs. Crore
Cumulative Progress (%)upto30.09.2020
Remarks
Physical Financial
Target Actual Provl
(upto30.09.2020) Target /Sched
ule
Actual
Target Actual
(upto30.09.20 20)
RAJASTHAN MINE AND POWER PROJECTS HADLA
LIGNITE MINE (1.9 MTPA) 23.03.201
5 522.45 Sept 2019 522.45 Put on hold 9.88 0.00 0.00 9.88 99.99 0.48 28.60 1.89 *
BARSINGSAR TPS EXTENSION (1X250 MW)
23.03.201
5 2112.59 Aug 2020 2112.59 Put on hold 158.25 0.00 0.00 158.25 98.86 0.01 25.81 7.49 *
BITHNOK LIGNITE MINE (2.25 MTPA) 23.03.201
5 513.63 Dec 2019 513.63 Put on hold 175.30 0.00 0.00 175.30 99.99 31.14 17.92 34.13 *
BITHNOK THERMAL POWER PROJECT (1X250 MW)
23.03.201
5 2196.30 Aug 2020 2196.30 Put on hold 173.83 0.00 0.00 173.83 98.86 1.77 24.37 7.92 *
86

* Rajasthan Projects are now on hold since June2017. NLCIL Board had sanctioned the Projects (by virtue of powers conferred on Navratna CPSU) in the Board meeting held on 23.03.2015. The zero date of the Projects is 01.11.2016.
NLCIL through GTE had awarded EPC package on 21.11.2016 to M/s Reliance Infrastructure Limited, Mumbai (RIL). The INR equivalent of the order value is Rs. 3710.92 Cr. @1
USD=Rs. 67.81 (as on the date of price bid opening). RUVNL vide letter dated 23.05.2017 informed that Rajasthan Discoms would not be in a position to buy power from the above projects on increased project cost and Time over run
concerns. Hence the Projects were put on hold, since June 2017. The matter was referred to Cabinet Secretary for review and recommendation, pursuant to which a meeting of the Committee of Secretaries was held on 15.06.2017 to examine the
measures to bring down the tariff to around Rs.4 per unit. NLCIL vide letter dated 08.10.2019 requested M/s RIL to return the unutilised mobilisation advance. In this regard, M/s. RIL replied that NLCIL has to compensate them for an
amount of Rs. 999.11 Crores (as on 31.07.2019) M/s. RIL is repeatedly insisting for the release of CPGs stating that the Projects have been abandoned by NLCIL, for which it has been
replied that CPGs cannot be returned at present. Ensuing the “in principle” approval accorded by RUVNL, a meeting was held with Chief Secretary/GoR and Principal Secretary (Energy)/GoR, wherein the conditions put forth and
compensation sought by RIL, expenditure incurred by NLCIL, etc. were appraised and GoR was requested to advise the way forward whether to go in for retendering of the project
adopting least cost alternative technologies in Power plant and Mine or continuation of the project with existing contract. GoR (Energy department) vide Lr. Dt.31.01.2020 informed that RUVNL Board is of the view that average power purchase cost of the DISCOMS is around Rs.4.23 per unit and
that it will not be in the interest of DISCOMS to purchase more than Rs. 5.00 per unit. M/s.RIL has submitted 12 Nos. of APGs for the said Projects from 3 Banks SBI, Mumbai (for 4 APGs), IDBI, Mumbai (for 6 APGs) and Canara Bank, Mumbai (for 2 APGs). All the
12 BGs which were valid up to 21.05.2020 have been extended up to 31.12.2020 and Original BGs were received on 21.07.2020 & 27.07.2020. SFMS confirmation has also been
received for all the 12 amended BGs. M/s.RIL vide letter dt.27.05.2020 has requested NLCIL to release the CPGs furnished by them as per the guidelines provided in the OM
No.F.18/4/2020-PPD dt.13.05.2020 issued by MoF, GOI, citing the Rule 171 of General Financial Rules, 2017) to enable them to refuel their economic activities at other fronts. Secretary (Coord.), Cabinet Secretariat have taken a review meeting on 23.07.2020 and directed MoC to explore the most competitive tariff which can be offered and thereafter
engage with GoR at appropriate level. Also, directed NLCIL to explore the market scenario and review viability of the Bithnok Thermal Power Project. As per the directive of Competent Authority, an internal meeting was conducted through VC on 12.08.2020 to discuss and finalise M/s.RIL’s claims regarding BTPP & BTPSE
projects, After the assessment, it is observed that the documents submitted by M/s.RIL is incomplete. Hence, M/s.RIL was addressed on 21.08.2020 to furnish additional documents for
further assessment within an ultimatum date otherwise it is construed that the above documents are not available with RIL and NLCIL will decide the final claims based on the available documents with NLCIL.
87

Date of
approval
Sanctioned
Cost Rs. Crore
Scheduled
date of
completion
Anticipated
Cost Rs. Crore
Anticipated
date of
completion
Cumulative
Expenditure
upto31.03.20
20 Rs. Crore
Capex 2020-21
RsCrore
Cumulative
upto 30.09.2020 Rs. Crore
Cumulative Progress (%)upto30.09.2020
Remarks
Physical Financial
Target Actual Provl
(upto30.09.2020) Target /Sched
ule
Actual
Target Actual
(upto30.09.20 20)
As per the request of M/s.RIL, meeting washeld on 01st September 2020 with M/s.RIL through VC to discuss about the documents sought by NLCIL for their claims. After deliberations, M/s.RIL agreed to send their representative to Barsingsar Project to provide necessary clarification with respect to the documents furnished by M/s RIL. In an another letter dated 07th September 2020, M/s. RIL stated that they are resubmitting the Claim-II documents (for the period from 01.03.2018 to 31.07.2019) and the hard copy of
the same has been received through courier on 14th September 2020. Further vide mail dt. 23rd September 2020 they have submitted their claim-III for the period from 01.08.2019 to 31.08.2020 and the hard copy was received on 28th
September 2020.
Date of
approval
Sanctioned
Cost Rs. Crore
Scheduled date of
completion
Anticipated
Cost Rs. Crore
Anticipated
date of
completion
Cumulative
Expenditure
upto
31.03.2020 Rs.Crore
Capex 2020-21 Rs.
Crore
Cumulative
upto30.09.20
20 Rs. Crore
Cumulative Progress (%) upto 30.09.2020
Remarks
Physical Financial
Target Actual
Provl
(upto 30.09.2020)
Target /Schedule
Actual
Target /Schedule
Actual
GHATAMPUR THERMAL POWER PROJECT (3X660 MW), U.P
27.07.2016
17237.80
U-I: Nov2020
U-II: May2021
U-III: Nov 2021
17237.80
U -I: Mar 21
U -II: Aug 21
U -III: Nov21
9,199.20
2,000.0
931.84
10,131.04
68.82
60.64
63.88
58.77
PPA has been already signed with UPPCL and MoP has allocated 1599.85 MW for UPPCL. For balance power, unwillingness from all concerned received by MoP. (Latest letter from
J&K Power Corporation Ltd dated 30th December 2019). Final allocation letter for the remaining power 243.83 MW to U.P. was issued by MoP on 02nd January 2020.136.32 MW shall
remain unallocated.e-hearing regarding providing approval for procuring 1843.68 MW power from GTPP conducted by UPERC on 21.07.2020. On the second e hearing held on 27.08.2020, certain details regarding energy charges during the period of bridge linkage of coal until full coal is obtained from linked coal mine. Work awarded to ICRA Analytics Ltd,
Noida on 03rd September 2020 for Vetting/analysis of Indicative tariff consisting Energy charges using Coal from Talabira Coal block and fixed charges considering existing sanctioned cost
with/without FGD. GA1: Unit-I, II &III Boiler erection activities are in progress. Coal Silo fabrication works in progress. ESP structure erection work is in progress. GA2: Unit-II, III Main Power House foundation work & I is in progress. Unit- I, II & III TG columns casting completed and TG Deck work under progress. GA3: Construction activities in respect of switchyard, raw water reservoir, DM plant, NDCT, Fore Bay, CWPH CW channel sidewall, Coal Handling Plant, Ash Handling Plant,
ESP and Chimney is in progress. GA4: Price cover along with addendum price cover opened on 22nd August 2019. Reverse Auction conducted on 27th August 2019. Meeting was conducted with four bidders on 6th
September 2019 to explain the connectivity problem in the system of MSTC Portal. After the approval of Competent Authority Legal opinion from ASG was sought and the ASG’s legal
opinion dt. 19th September 2019 was received on 21st September 2019.Details furnished to IEM as requested by them. Tender Committee met on 18th November 2019. Observation from one
IEM member received on 22nd November 2019.TC met on 29th November 2019 and recommended to cancel the tender. Flue Gas Desulphurization: 11th PC Committee dated 11.02.2020 has approved for re-tendering with base value of Rs. 689.39 Crore during the 48th Board Meeting on 29th March
2020. PC committee held on 27th June 2020 accorded approval for change in the tender specifications. Bids opened on 25.09.2020.Bid evaluation are in progress. LOA targeted for Dec
2020. Bridge linkage: Ministry of Coal (MoC) has granted the bridge linkage of 0.5 MT for the year 2020-21 for GTPP. In line with the above CIL/BCCL had asked to sign MoU for 0.25
MT for Bridge Coal Linkage. NLCIL has requested Addl. Secretary, GoI, MoC vide letter dated 1st October 2020 that 3.0 MT of Coal Linkage for the FY 2020-21 and linkage for future
requirement may also be granted for GTPP, Ghatampur, Kanpur dist. from nearest NCL Mines. The benefit of savings in coal transport shall be passed on to the beneficiaries’/ distribution
companies. Erection activities for the project werehampered due to restrictions imposed owing to COVID-19.
88

Date of
approval
Sanctioned
Cost Rs. Crore
Scheduled
date of
completion
Anticipated
Cost Rs. Crore
Anticipated
date of
completion
Cumulative
Expenditure
upto
31.03.2020 Rs.Crore
Capex 2020-21 Rs.
Crore
Cumulative
upto 30.09.2020 Rs. Crore
Cumulative Progress (%)upto30.09.2020
Remarks Physical Financial
Target
Actual
Provl (upto 30.09.2020)
Target /Schedule
Actual
Target /Schedule
Actual
PACHWARA SOUTH COAL OCP (9.0 MTPA), JHARKHAND
04.05.2018 1,795.01 March 2020* 1,795.01 Sept 2022 29.02 0.00 1.68 30.70 @ @ 1.71
*- As per corporate plan. @ Project under MDO mode work under progress. Final Geological Report (FGR) has been submitted to MoC in Soft form for approval on 13th April 2020.Hard copies of GR has been submitted to CMPDIL, RI-1, Asansol, West
Bengal as per the instruction of Deputy Secretary, MoC on 04.06.2020 for vetting.FGR submitted to CMPDIL, RI-1, Asansol, West Bengal for perusal on 21.07.2020. After perusal the
Final GR has been concurred by the RI-1 Asansol on 24th July 2020.Copy of the Final GR along with letter of correctness provided by CMPDI was submitted to MoC for Approval on
31stJuly 2020. MoC has sent the FGR for verification to CMPDI. After modification and incorporation of the details the FGR has been submitted to CMPDI, Ranchi on 25.08.2020 for
onward transmission. After vetting the FGR has been submitted to MoC by CMPDI on 27.08.2020. Final Geological Report Approved by MoC on 07th September 2020. The Terms of Reference (ToR) has been uploaded to MoEF & CC portal on 14th August 2020.The requisite document for obtaining TOR submitted to Expert Appraisal
Committee (EAC) on 21st September 2020. EAC meeting was held on 29th September 2020 for consideration of ToR of PSCB. AAP for Pachwara South Coal Block: Proposal was taken up by the Revised Cost Committee on 03.03.2020. The second Revised Cost Estimates Committee meeting with Joint
secretary and Financial Adviser, MoC and Adviser (Costs), MoF and Adviser (Projects), MoC was held on 24th April 2020 through Video Conferencing. The estimates are modified to
3949.91 lakhs and resubmitted as per the guidelines of the committee.Revised estimate of AAP has been submitted to MoC on 20.06.2020 for approval. A reminder email has been
submitted to Adviser (Projects), MoC on 27.08.2020. Revised estimate of AAP (Rs, 3582.61 Lakhs) has been submitted to MoC on 21st Sept 2020 for approval as suggested by RCC
committee meeting held on 11th September 2020. Mining Plan & Mine Closure Plan: Mining Plan & Mine Closure Plan has been submitted to MoC on 19th June 2020 for approval.A letter was received from MoC stating that
Mining Plan & Mine Closure Plan will taken up by internal committee after approval of FGR.Modified Mining Plan & Mine Closure Plan submitted to MoC on 9th September 2020. Gazette Notification under Sec 7(1) of CBA(A&D) Act,1957-Gazette notification issued on 31.08.2020.
Preliminary project activities are hampered due to restrictions imposed owing to COVID-19.
Date of
approval
Sanctioned
Cost Rs. Crore
Scheduled
date of
completion
Anticipated
Cost Rs. Crore
Date of
completion
Cumulative
Expenditure
upto31.03.2020Rs . Crore
Capex 2020-21 Rs.
Crore
Cumulative
upto30.09.2
020 Rs.Crore
Cumulative Progress (%)upto30.09.2020
Remarks Physical Financial
Target
Actual
(upto30.09. 2020)
Target /Schedule
Actual
Target
Actual (upto30.09.2
020)
TAMILNADU SOLAR PROJECT (709 MW):
17.10.2017 (In principle
approval)
3190Cr.
22.04.2019 /23.04.2019
3,035.93
Sept
2019
2927.81
19.00
2.29
2930.10
100.0
99.82
100.0
96.51(A ccrual
basis)
-- 23.01.2018 (Investment
and
Placement of orders)
3172.98Cr
.
89

Date of
approval
Sanctioned
Cost Rs. Crore
Scheduled
date of
completion
Anticipated
Cost Rs. Crore
Date of
completion
Cumulative
Expenditure
upto31.03.2020Rs . Crore
Capex 2020-21 Rs.
Crore
Cumulative
upto30.09.2
020 Rs.Crore
Cumulative Progress (%)upto30.09.2020
Remarks Physical Financial
Target
Actual
(upto30.09. 2020)
Target /Schedule
Actual
Target
Actual (upto30.09.2
020)
The entire 709 MW Capacity of the projects was commissioned by 24th September 2019 and COD for the entire projects were declared as 24th October 2019. Balance peripheral
works like Road, Drainage, fencing and Module cleaning system are in progress and expected to be completed by October 2020.
Provisional Acceptance Certificate is issued to Premier Solar PowerTech on 21.09.2020 for 100 MW Pudur Solar Power Project.
Date of
approval
Sanctioned Cost
Rs. Crore
Scheduled
date of
completion
Anticipated
Cost Rs. Crore
Anticipated
date of
completion
Cumulative
Expenditure
upto31.03.202 0 Rs. Crore
Capex 2020-21 Rs.
Crore
Cumulative
upto30.09.20
20 Rs. Crore
Cumulative Progress (%)upto30.09.2020 Physical Financial
Target /Schedul e
Actual Target
/Schedule
Actual Target ActualProvl(u
pto30.09.2020) TALABIRA II & III COAL OC MINE (20.0 MTPA), ODISHA:
20.07.2017
2,401.07
18 months from date of LOA –
06.02.18
2,401.07
Jan 2027 * 712.91 364.00 35.77 748.68
87.00
31.18
* Coal Production commenced on 26th April 2020. Government Non Forest Land:-Jharsuguda Tehsil: Out of 196.260 Ha Jharsuguda Tehsil has handed over 155.070 Ha of Land in the name of NLCIL. Possession of balance
41.189 Ha. Land yet to be obtained as the land is recorded as Jalbhandar in the name of Irrigation and Power Department, Government of Odisha. Rengali Tehsil: Out of 227.786 Ha
Rengali Tehsil has handed over 225.233 Ha of land in the name of NLCIL. Tenancy Land: R& R Policy approved by RPDAC on 7th April 2018.Jharsuguda District: The market value of tenancy land for Malda, Patrapali, and Rampur has been determined and
communicated by the collector, Jharsuguda on 6th February 2019. The request for reviews the market value of tenancy land for Malda, Patrapali, and Rampur has been submitted to the
Collector, Jharsuguda on 18th June 2019.The Market value of tenancy land for Malda, Rampur & Patrapali has been revised & communicated by District Collector, Jharsuguda on 30th
December 2019. Addl. District Magistrate, Jharsuguda on 29th February 2020, has communicated the radial distance for Malda, Rampur & Patrapali villages of Jharsuguda district from nearest Urban/Municipality.
Public hearing under section 22 for SC/ ST land registration conducted by Sub Collector, Sambalpur on 05.06.2020, 06.06.2020, 11.06.2020 and 12.06.2020.Permission for
registration of 4 khatas of SC/ ST land has been obtained and Registration of 1 khatas of SC/ST land has been completed on 09th September 2020.
Tree felling activities commenced on 06th December 2019. Talabira Mine operation commenced on 11th December 2019. Coal Production commenced on 26th April 2020. Land compensation to PAPs started on 24th July 2019.Disbursement of compensation for Tenancy Land till 25thSeptember 2020, Payment was made for 154.74
Acres and total value of the cheques disbursed was Rs.57.39 Crore.
Project Commissioning Date PAC Date PG Date Total Generation (2020 – 21) in MU 100 MW Maranthai 05.07.2019 05.03.20 01.04.20 85.674 100 MW Kamuthi 29.04.2019 01.01.20 23.03.20 80.064
109 MW Avathadai 06.08.2019 (95 MW) 23.09.2019(14 MW) 31.07.20
Yet to Start
84.270
100 MW Pulangal 21.09.2019 31.07.20 66.626 100 MW Onamakulam 24.09.2019 31.07.20 73.796 100 MW Pudur 09.09.2019 21.09.20 78.585
100 MW Therkkupatti 07.06.2019 (63 MW) 24.09.2019 (37 MW) - 45.839
Total 514.854
90

Date of
approval
Sanctioned
Cost Rs. Crore
Scheduled
date of
completion
Anticipated Cost
Rs. Crore
Anticipated
date of
completion
Cumulative
Expenditure
upto
31.03.2020R s. Crore
Capex 2020-21 Rs.
Crore
Cumulative
upto30.09.202 0 Rs. Crore
Cumulative Progress (%)upto30.09.2020 Physical Financial
Target /Schedule
Actual
Target /Schedule
Actual
Target ActualProvl
(upto30.09.202 0)
2X10MW PROJECT AT SOUTH ANDAMAN: 28.05.2018 & 09.10.2018
(Order Value)
130.77
11.03.2020
130.77Cr
30.06.2020 119.82 0.00 0.00 119.82 100.00 99.70 100.00
91.63( Accrual
basis)
*Total Generation as on 30th Sept 2020.
Andaman & Nicobar Administration, Electricity Department issued commissioning certificate on 16thJanuary 2019 indicating date of commissioning of 2.5 MWcapacity out of 2x10
MW capacity as 31stDecember 2018. Balance 17.5 MW capacity of the plant has been commissioned on 30.06.2020 and Commissioning certificate for entire 20 MW is obtained from A&NA Electricity Department on
08.07.2020 declaring Commissioning of the plant as 30.06.2020.
7.0 PROJECTS IN PIPELINE.
Date of
approval
Anticipated
Cost Rs. Crore
Scheduled
date of
completion
Anticipated
Cost Rs. Crore
Anticipated
date of
completion
Cumulative
Expenditure
upto31.03.202
0Rs. Crore
Capex 2020-21 Rs.
Crore
Cumulative
upto30.09.20
20 Rs. Crore
Actual
Cumulative Progress (%)upto30.09.2020 Physical Financial
Target
/Schedule
Actual
Target /Schedule
Actual Target
ActualProv
l(upto30.09. 2020)
THERMAL POWER STATION II SECOND EXPANSION PROJECT (2X660 MW, Neyveli):
23.03.2015 8,733.49 Unit-I 3/2023
Unit-II- 9/2023 8,733.49 Unit-I 4/2026
Unit-II- 10/2026 55.88 620.0 1.55 57.43 -- -- -- 0.66
Railway Siding: Package-I: LoA has been issued to M/s Triveni Engicons Pvt Ltd on 13th March 2020. Package-II: LoA has been issued to M/s SMS Ltd on 5th June 2020.Govt. land of
1.77 km in Hirma & Malda Village handed over to M/s SMS Ltd. (Package II) on 10.08.2020. D.G.P.S alignment for package II track alignment conducted upto 14th August 2020. DCAC meeting was conducted on 28.08.2020 for acquisition of tenancy land of 23.47 acre in Jharsuguda District for Railway siding.
Project Commissioning Date PAC Date PG Date Total Generation
(2020-21) in MU*
2x10 MW Andaman Solar 31.12.2018 (2.5
MW)30.06.2020 (17.5 MW) - - 2.853
91

Feasibility Report: Consent Obtained from M/s. Desein for the extending the validity of contract upto 30th August 2020. The consultant furnished revised and updated cost (base level
Oct 2019) on 28th October 2019.The EOT of contract was done up to 29th August 2020. vide Lr. dated 06.08.2020, NLCIL has requested M/s Desin to extend the contract validity
extension request upto February 2021, without change in terms and conditions of contract along with the extended BG may be extended may be provided for furtherance at out our side.
vide Mail dated 19.08.2020, M/s NLCIL lodged the claim with regard to CPG submitted by M.s Desein against NLCIL’s contract. An appeal has been filed before Green Tribunal, Southern Zone by Shri. P. Sundaravadhanam against the Environmental Clearance accorded to TPS-II 2nd
Expansion Project (29th
October 2018) and the first hearing was held on 22nd May 2019. In the NGT hearing held on 08th November 2019, the application for condonation of delay was listed. The Bench after
hearing all our submissions and perusing the application and counter affidavits on record condoned the delay in filing the appeal and was inclined to proceed on the merits of the
appeal. NGT Case Hearing is posted to 15th September 2020 for completion of pleadings & completion of Hearing and given liberty to TNPCB and State Govt to file their
92

Date of
approval
Anticipate
d Cost Rs.
Crore
Scheduled date of
completion
Anticipated
Cost Rs Crore
Anticipated
date of
completion
Cumulative
Expenditure
upto
31.03.2020 Rs. Crore
Capex 2020-21 Rs.
Crore
Cumulative
upto30.09.2
020 Rs. Crore
Cumulative Progress (%)upto30.09.2020 Physical Financial
Target /Schedule
Actual Target
/Schedule
Actual Target Actual
(upto30.09.2020) 2400 MW PITHEAD COAL BASED TPP AT ODISHA (NTTPP)
25.01.2017
19422.44
Unit-I 5/2023 Unit-II 11/2023
Unit-III 05/2024
19422.44
Unit-I 4/2026 Unit-II 10/2026
Unit-III 04/2027 30.90 1575.0 0.00 30.90 -- -- -- 0.18
Ministry of Revenue, Govt. of Odisha issued Section 4 (1) Notification for acquisition of land in the Jharsuguda District on 8thMarch 2019 and in the Sambalpur District, on
30thMay 2019. Ministry of Coal was again requested, vide letter dated. 7th May 2019 to take up with MoP the issue of according approval for supply of power from NTTPP (Phase- I - 3x800
MW) by according exemption to NLCIL from tariff based competitive bidding route and also for allocation of power from this project to the beneficiaries viz., Governments of Tamil
Nadu, Kerala, Puducherry and Odisha. CEA vide Lr, dated. 6thAugust 2019 sought for certain clarifications on power allocation and NLCIL’s reply for the same was submitted on
11thOctober 2019. In the meeting of 22nd HLCA meeting, 800MW of power out of 3200MW from NTTPP is allocated to Odisha State in two Phases. Phase-I is around 400 MW and Phase – 2 is
remaining 400MW. Obtained Consent from Consultant upto 30thAugust 2020, to extend the validity of EIA/EMP study Contract. Form-2 Application along with EIA/EMP report & Annexures etc.
were submitted and uploaded in MoEF PARIVESH Online portal on 19th February 2020. NTTPP EC proposal was listed in the firstEAC meeting and EAC presentation was made to
newly formed EAC Committee on 28.07.2020.FirstEAC Minutes (Re-constituted EAC committee) w.r.t NTTPP was uploaded in PARIVESH portal by MOEF&CC on 09th August 2020. DFO/Jharsuguda informed to RO/Sambalpur that, “applied area for construction of 3X800 MW NTTPP is not falling any eco-sensitive zone, national park or wildlife sanctuary. No
archaeological/heritage site/defence establishment or any other important monument is located in the area and also it is the proposed area is more than 10 km radius from Debriagrh
wildlife sanctuary.” RO/Sambalpur forwarded the required compliance report submitted by DFO/Jhrsuguda to Addl.PCCF/CWW/Odisha.
Steam Generator & Auxiliaries Package (NTT-1) & Steam Turbine Generator &Auxiliaries Package (NTT-2): NLCIL board in its 495th meeting held on 08.11.2019 has accorded approval for deferring the multi package tenders (comprising of all the four major works viz., SG,
STG, BOP and FGD) and to go in for Single EPC method through EOI method. In its 438th meeting held on 14.02.2020 the Empowered Committee of Directors of NLCIL, deferred the proposal for revised EPC cost. Note submitted for approval of
revised EPC cost to Project Sub Committee of Directors on 19th February 2020 to recommend to NLCIL Board of Directors. Project Sub Committee of Directors of NLCIL, in its 34thmeeting, vide agenda PSC 34.05 resolution, held on 18th March 2020 desired that more details on the related
financials including the feasibility of the project consequent to the increase in the project cost may be put up to the committee for consideration along with the institutional arrangements to ensure execution of the project within the sanctioned cost and time limits.The process for floating single EPC mode is under way.
Preliminary project activities hampered due to restrictions imposed owing to COVID-19.
counter. MoEF&CC submitted the reply to NGT. On 15.09.2020, NGT case hearing was posted to 06.11.2020 for completion of Pleadings and hearings of the appeal. Consent To Establishment (CTE) order for TPS II 2nd Expansion Project was obtained from TNPCB on 07th April 2020.
Steam Generator & Auxiliaries Package (SE-1) & Steam Turbine Generator &Auxiliaries Package (SE-2): Board vide its 494th Meeting held on 13th September 2019, accorded approval for cancellation of Package-wise tender. In principle, approval was obtained for executing the project
through single package EPC direct tender in November 2019. The process for floating single EPC mode is under way. Preliminary project activities hampered due to restrictions imposed owing to COVID-19.
93

Date of
approval
Anticipated
Cost Rs. Crore
Scheduled
date of
completion
Anticipated
Cost RsCrore
Anticipated
date of
completion
Cumulative
Expenditure
upto31.03.2
020Rs. Crore
Capex 2020-21 Rs.
Crore
Cumulative
upto30.09.2
020 Rs. Crore
Cumulative Progress (%)upto30.09.2020 Physical Financial
Target /Schedule
Actual Target
/Schedule
Actual Target Actual
(upto30.09.2020) MINE-III(11.50 MTPA)
-- 2130.30 * 2130.30 * 43.05 87.00 0.00 43.05 -- -- -- -- * Project is under Formulation.
Board of Directors of NLCIL has accorded approval for the expenditure sanction of Rs.7.05 Crores for Phase-I AAP activities. As per instructions from MOEF&CC to go for
supercritical boilers (2X660MW) instead of 1000MW earlier, approval was obtained to increase Mine capacity from 9.0 to 11.50 MTPA on 09th August 2016. Mine Planning: As per MoC Guideline dated 16th December 2019, Director Geology & Mining has to give Letter of Intent to give lease. Director Geology & Mining, Chennai sent
a letter on 10.08.2020 seeking land ownership details and rule provisions. MCR 1960 & Mining plan guideline, 2020 clearly explain about legal provisions. Reply to Director Geology &
Mining, Chennai with annexure was sent on 24.08.2020.NLCIL Senior Executives met Joint Director/Geology & Mining(JD) and had discussion in Chennai on 25.09.2020 to expedite
the issue of LOI Land Acquisition: District Collector (DC) recommended the Land acquisition proposal and forwarded to the CLA (Commissioner of Land Acquisition), Chennai on 31st July
2018. CLA approved the proposal on 05th February 2020. It is forwarded to Govt. for further approval. Environmental Clearance: Public Hearing was conducted on 11th December 2018. Form-II has been uploaded by the consultant in MoEF&CC portal on 06th March 2020. Again
MoEF&CC issued EDS (Essential Details Sought) seeking Letter of Intent and mining Plan approval on 16th March 2020. MOC also sought Letter of Intent for Mining plan approval.
Letter of Intent proposal is pending with Tamilnadu Government. Further works are getting delayed due to various restrictions imposed due to COVID-19.
8.0 INDUSTRIAL RELATION: Industrial relation for the month ofSeptember 2020was smooth and cordial in all units, plants and projects of NLCIL.
9.0 ASSISTANCE REQUIRED FROM MINISTRY OF COAL Details of the assistance required from MoC are furnished as Annexure-IV.
10.0 UNREQUISITIONED SURPLUS POWER (URS): For the period April 2020 to September2020, a quantity850.846 MU of surplus power has been traded which earned revenue of Rs.253.396Crore with an average traded value of
Rs.2.52per KWHr for NLCIL.NTPL has commenced sale of URS power under trade membership of IEX and Interstate Trading licence issued by CERC from 7thNovember 2019. For the
period,uptoSeptember 2020a qty of0.981 MU traded and earned net revenue of Rs. 0.865Crore.
10.1 POWER TRADED UNDER TRADING LICENCE The quantum of Power Traded under Trading License obtained by NLCIL during September2020 is 1.613 MU.
a. URS of NTPL: 0.981 MU and b. Buying for Clients: 0.632 MU
Power was purchased for the existing clients M/s Ultimate Alloys (P) Ltd ,SRM Institute of Science and Technology & MIOT Hospital during the month. Commenced the purchase of power on behalf of new client M/s Dr.Kamakshi Memorial Hospital, Chennai from IEX from delivery date of 06thSeptember 2020.
94

11.0 OTHER HIGHLIGHTS:
NLCIL under CSR initiatives handed over 10 Nos. of Life Supporting Ambulances available for 24X7 on hire basis to District Administration, Cuddalore, Tamilnadu to support
Covid 19 Care measures on 9th September 2020. District Collector/ Cuddalore, CMD/NLCIL flagged off the ambulances in the presence of Functional Directors and Senior officials of NLCIL
during the inaugural function. NLCIL organized various programme on 17th September 2020 on 70th Birth Day of Hon’ble Prime Minister of India. Blood Donation camp was inaugurated by Director (HR)/NLCIL
and blood donated by 70 employees & volunteers. Mass Tree Plantation in Mines and Thermal Units were organized in the presence of Director (Planning & Projects)/NLCIL. Covid-19
Screening of 70 persons organized per day for 15 days at NLCIL General Hospital. As a part of Mahatma Gandhiji’s 150th Birth Anniversary Celebrations, NLCIL Organized SWACHH HI SEVA- MAHA SEVA on 17th September 2020. Director/HR NLCIL and
Senior official participated in the function. Mass Tree Plantation in the premises of Corporate office NLCIL was organized on 29th September 2020. NLCIL Investor Conference Call was held on 25th September 2020 on financial results for the Quarter 1 FY2020-21. NLCIL commences large scale hi-tech agriculture in mined out areas to enhance and showcase fertility of reclaimed lands in pursuance of transforming mine dump lands into cultivable
fertile lands. Inaugurated by CMD/NLCIL through VC on 28.09.2020 in the presence of Functional Directors and Senior Executives of NLCIL. Four Polyhouses each of size 1936 sq.m have
been constructed at a cost of Rs. 47.00 lakhs. NLCILs 64th Annual General Meeting was held on 29th September 2020 at Neyveli through Video Conferencing Mode. JV NTPL 14th Annual General Body Meeting was held on
28.09.2020 and JV NUPPL 8th Annual General Body Meeting was held on 28.09.2020 in VC mode.
******
95

SSttaatteemmeenntt 88..33:: SSttaattuuss ooff OOnn--ggooiinngg PPrroojjeeccttss ooff SSCCCCLL
TThere aarree 13 Ongoing Projects in SCCL as on 30.09.2020 costing Rs. 20.00 Cr. and
above. The Progress in construction of these Projects is furnished hereunder:
Sl. No. Name of the Project Sanctioned Capital
(Rs. Cr.)
Capacity
(MTPA)
1 Srirampur OCP - II Expn. 272.73 3.500
2 RCE of Indaram OCP 349.28 1.200
3 RCE of MNG OCP 415.70 1.500
4 RCE of Kondapuram UG (Outsourcing) 56.88 0.700
5 RCE of Ramagundam OCP - II Extn. 489.62 4.000
6 RCE of Kistaram OCP 164.04 2.000
7 RCE of JVR OCP – II 473. 22 10.00
8 Kasipet - 2 Incline 60.18 0.470
9 RCE of KK OCP 384.32 1.750
10 RCE of KTK OCP - II 442.42 1.250
11 KTK OCP - III 413.84 2.500
12 Godavarikhani Coal Mine (No.2 & 2A and No. 5) 438.98 3.000
13 Naini Coal Mine 494.30 10.00
96

8.3 (a) SRIRAMPUR OCP-II ( Expansion) :
A) Date of sanction : FR : 20.10.2004 & RFR : 06.01.2006
: RCE : 16.10.2015 & RCE : 04.11.2016
B) Financial Progress:
1) Sanctioned capital : RFR : Rs. 88.47 Cr. & RCE - I : Rs. 322.98 Cr.
: RCE - II : Rs. 272.73 Cr.
2) Total Capital Outlay : Rs. 384.33 Cr.
3) Cumulative expenditure up to Sep, 2020 : Rs. 153.75 Cr. (Provisional)
4) Now anticipated cost : Rs. 272.73 Cr.
5) Status of RCE/RFR : RCE - II approved on 04.11.2016
C) Physical Progress:
1) Ultimate Capacity : FR: 1.50 MTPA, RFR : 2.50 MT PA & RCE:
3.50 MTPA
2) Anticipated year of completion : 2020-21
3) Production in 2020-21 up to Sep, 2020 : 0.76 MT
4) Overburden removal in 2020-21 up to
Sep, 2020 : 13.13 M Cum
D) General Status in brief as on 30.09.2020
1. Forest Land (100.82 Ha): Obtained on 10.07.2009.
2. Forest Land (162.45 Ha): Online application uploaded on 27.10.2017. On 16.01.2019, CF forwarded to PCCF & PCCF
forwarded to GoT on 24.01.2019. GoT forwarded report to MoEF & CC on13.02.2019.
RO, Chennai inspected site on 12.06.2019. On 16.07.2019, PCCF requested to furnish comments
on ADGF (Central) letter regarding the violation of EC (increase in production more than
stipulated in EC) granted to various projects.
Comments submitted on 02.08.2019 & PCCF forwarded to State Govt. on 23.08.2019. On
27.12.2019, State Govt. forwarded comments to MoEF & CC.
On 20.05.2020, SCCL submitted information on 3 points to PCCF, Hyd.
On 08.06.2020, PCCF requested DFO, MNCL to submit information on Site Suitability
Certificate.
On 16.06.2020, CF & FDPT, Kawal TR, reported to PCCF that FDO, MNCL has submitted site
suitability certificate along with revised CA Scheme.
On 05.08.2020, PCCF requested State Govt. to submit information sought by MOEF & CC. On
18.08.2020, FAC conducted. MoEF & CC sought certain information. On 02.09.2020, SCCL
submitted necessary information to PCCF, which was sought by MoEF & CC.
On 08.09.2020, PCCF forwarded the information submitted by SCCL to State Govt.
3. Public Hearing & EC: ToR obtained on 23.01.2018, Public Hearing conducted on
19.09.2018. Form-II will be submitted after obtaining FL - Stage-1.
4. Diversion of Private Land (50.21 Ha): Requisition submitted during Oct, 2017. SD &
enjoyment surveys to be taken up. Peg marking by SCCL completed & survey to be taken up
by Revenue department.
5. Non-Forest Land acquisition (Thallapalli, Singapuram, Guthedarpalli & Ramaraopet
Villages):
a. Thallapalli (Ac. 60-08½gts) for dump area: PN published on 17.07.2019.
Enquiry report on the representations was submitted by the Tahsildar, Naspur.
b. Singapuram: Ac. 505-12gts (Agricultural Patta Land) for quarry area, Ac. 131-16gts
(Structured Patta Land) for dump area Ac. 312-03gts (Assigned Land) for dump area:
Completed
c. Ramaraopet & Guthedarpalli for quarry area: Ac. 49-07gts (Assigned land): Completed.
d. NF land (48.92 Ha) for expansion project: Requisition is to be submitted.
e. R&R: Thallapalli-800, Singapur-974, Guthedarpalli-136 Total PDFs =1910
97

f. R&R of Thallapalli village (800 PDF):
798/800 plots allotted. Allotment of remaining 2 plots is in active stage.
g. R&R of Singapur & Guthedharpalli villages (974 PDF in Singapur & 136 PDF in
Guthedarpalli): Singapur: 934 plots allotted.
Issue of balance 40 plots is under process. Guthedarpally: 136 - plots allotted.
h. R&R Dubbapalii (120 PDF): Action is to be initiated (required in 5th year).
6. Indoor & outdoor sub-station: Completed.
7. Bifurcation of SRP 3 & 3A U/G workings beyond 100m depth line: Development towards project boundary stopped & final extraction will be completed before
commencement of OC works.
8. Drilling of 6 Nos. large dia. (24") boreholes: Completed & two 300 HP pumps working.
9. Shifting of 33Kv line: Completed during Jan’19.
10. 2-bay maintenance shed: Completed by Jan’20.
11. CHP: All works completed & PWWLS commissioned on13.01.2020.
12. Procurement of in - Pit Crushers & others: 3 Nos. supplied. P.O released on 12.10.2018,
for Erection & commissioning of Feeder Breakers.
Erection commenced from 23.09.2019 & likely to complete by Nov’20.
13. Plough Feeders (2 Nos.):
P.O. released on 08.02.2018, supplied on 08.07.2019 & erection completed by Nov’19.
14. Rly. Line to STPP (21.175Km):
Single track line completed. 1st coal load taken on 01.08.2018
15. OBR: OBR commenced from 01.06.2013.
16. Coal Production: Production from the projects has started from 1.8.2009
1. Year 2009-10 = 1.79 MT
2. Year 2010-11 = 2.31 MT
3. Year 2011-12 = 2.94 MT
4. Year 2012-13 = 2.50 MT
5. Year 2013-14 = 1.45 MT
6. Year 2014-15 = 2.541MT
7. Year 2015-16 = 2.70 MT
8. Year 2016-17 = 2.03 MT
9. Year 2017-18 = 2.575MT
10. Year 2018-19 = 2.98 MT
11. Year 2019-20 = 2.97 MT
98
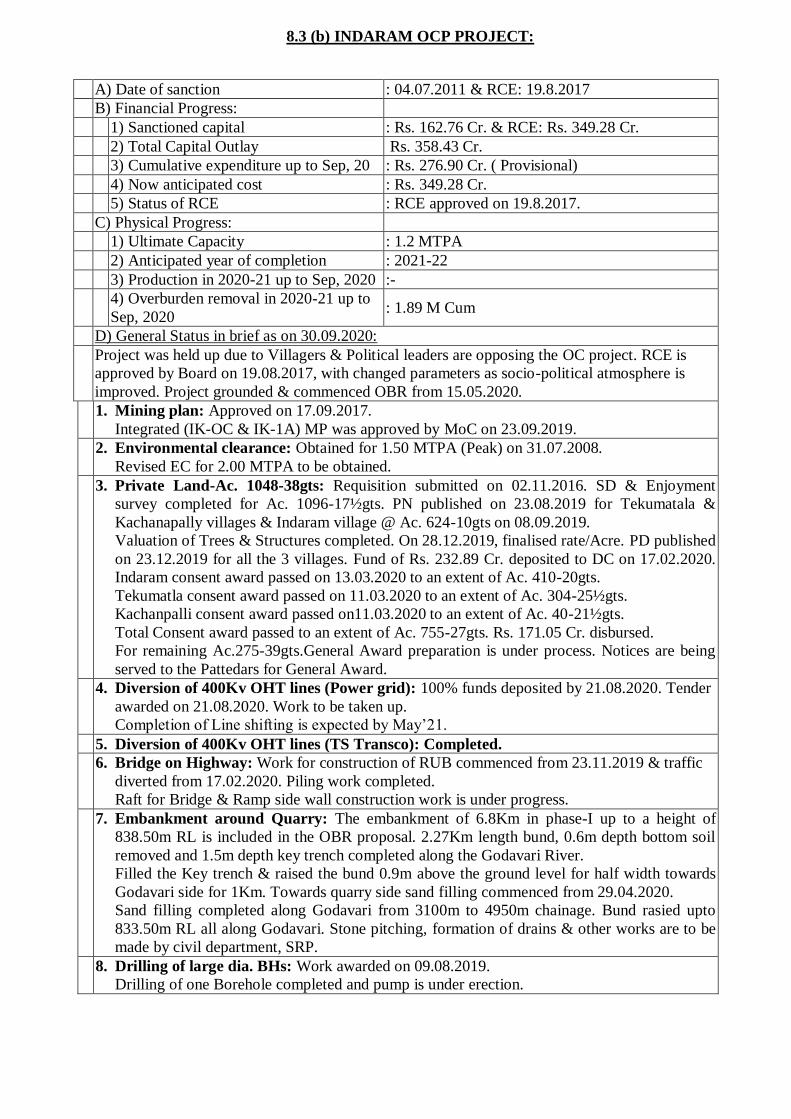
8.3 (b) INDARAM OCP PROJECT:
A) Date of sanction : 04.07.2011 & RCE: 19.8.2017
B) Financial Progress:
1) Sanctioned capital : Rs. 162.76 Cr. & RCE: Rs. 349.28 Cr.
2) Total Capital Outlay Rs. 358.43 Cr.
3) Cumulative expenditure up to Sep, 20 : Rs. 276.90 Cr. ( Provisional)
4) Now anticipated cost : Rs. 349.28 Cr.
5) Status of RCE : RCE approved on 19.8.2017.
C) Physical Progress:
1) Ultimate Capacity : 1.2 MTPA
2) Anticipated year of completion : 2021-22
3) Production in 2020-21 up to Sep, 2020 :-
4) Overburden removal in 2020-21 up to
Sep, 2020 : 1.89 M Cum
D) General Status in brief as on 30.09.2020:
Project was held up due to Villagers & Political leaders are opposing the OC project. RCE is
approved by Board on 19.08.2017, with changed parameters as socio-political atmosphere is
improved. Project grounded & commenced OBR from 15.05.2020.
1. Mining plan: Approved on 17.09.2017.
Integrated (IK-OC & IK-1A) MP was approved by MoC on 23.09.2019.
2. Environmental clearance: Obtained for 1.50 MTPA (Peak) on 31.07.2008.
Revised EC for 2.00 MTPA to be obtained.
3. Private Land-Ac. 1048-38gts: Requisition submitted on 02.11.2016. SD & Enjoyment
survey completed for Ac. 1096-17½gts. PN published on 23.08.2019 for Tekumatala &
Kachanapally villages & Indaram village @ Ac. 624-10gts on 08.09.2019.
Valuation of Trees & Structures completed. On 28.12.2019, finalised rate/Acre. PD published
on 23.12.2019 for all the 3 villages. Fund of Rs. 232.89 Cr. deposited to DC on 17.02.2020.
Indaram consent award passed on 13.03.2020 to an extent of Ac. 410-20gts.
Tekumatla consent award passed on 11.03.2020 to an extent of Ac. 304-25½gts.
Kachanpalli consent award passed on11.03.2020 to an extent of Ac. 40-21½gts.
Total Consent award passed to an extent of Ac. 755-27gts. Rs. 171.05 Cr. disbursed.
For remaining Ac.275-39gts.General Award preparation is under process. Notices are being
served to the Pattedars for General Award.
4. Diversion of 400Kv OHT lines (Power grid): 100% funds deposited by 21.08.2020. Tender
awarded on 21.08.2020. Work to be taken up.
Completion of Line shifting is expected by May’21. 5. Diversion of 400Kv OHT lines (TS Transco): Completed.
6. Bridge on Highway: Work for construction of RUB commenced from 23.11.2019 & traffic
diverted from 17.02.2020. Piling work completed.
Raft for Bridge & Ramp side wall construction work is under progress.
7. Embankment around Quarry: The embankment of 6.8Km in phase-I up to a height of
838.50m RL is included in the OBR proposal. 2.27Km length bund, 0.6m depth bottom soil
removed and 1.5m depth key trench completed along the Godavari River.
Filled the Key trench & raised the bund 0.9m above the ground level for half width towards
Godavari side for 1Km. Towards quarry side sand filling commenced from 29.04.2020.
Sand filling completed along Godavari from 3100m to 4950m chainage. Bund rasied upto
833.50m RL all along Godavari. Stone pitching, formation of drains & other works are to be
made by civil department, SRP.
8. Drilling of large dia. BHs: Work awarded on 09.08.2019.
Drilling of one Borehole completed and pump is under erection.
99

9. CHP (PWTLS): PO released on 27.08.2019. Land handed over on 05.04.2020. Firm started
mobilizing steel for fabrication and erection.
Expected to complete by Oct’21. Mean while Mobile Crusher will meet the requirement. 10. P&M: Procurement is under progress. 11. Commencement of OBR: OBR commenced from 15.05.2020. 12. Commencement of Production: Expected from Oct’20.
100

8.3 (c) RCE OF MANUGURU OPENCAST PROJECT:
A) Date of sanction : FR: 03.01.2008, RFR: 10.11.2012 & RCE:
13.05.2015
B) Financial Progress:
1) Sanctioned capital
: FR: Rs. 431.45 Cr., RCE: Rs. 415.70 Cr.
(Excluding WDV of existing facilities & actual
expenditure at the time of RCE).
2) Total Capital Outlay Rs. 380.73 Cr.
3) Cumulative expenditure up to Sep, 20 : Rs. 186.46 Cr. (Provisional)
4) Now anticipated cost(RCE) : Rs. 486.27 Cr.
5) Status of RCE : Approved by Board on 13.5.2015
C) Physical Progress:
1) Ultimate Capacity : 1.80 MTPA
2) Anticipated year of completion : 2020-21
3) Production in 2020-21 up to Sep, 2020 : 0.68 MT
4) Overburden removal in 2020-21 up to
Sep, 2020 : 11.83 M Cum
D) General Status in brief as on 30.09.2020
:
1. Forest Land (33.58 Ha): Final approval obtained on 3.5.2016.
2. Non Forest land: Completed Possession taken
3. Govt. land (AC.28- 38gts): Collector, KMM issued proceedings on 10.10.2016.
4. Additional Mining Lease (373.90 Ha.): State Govt. granted Mining Lease on 06.02.2015.
5. R&R Tribal (181 PDF): Completed.
6. R&R Non Tribal (1063 PDF) : Completed
7. Flood Protection Bund: Flood protection bund work completed by Oct’19.
8. OBR: OB removal commenced from Jan, 2017.
9. Coal Production: Production commenced from Feb, 2017
i) Year 2016-17=0.45 MT
ii) Year 2017-18=1.50 MT
iii) Year 2018-19=1.50 MT
iv) Year 2019-20=1.80 MT
Note: Project completion Report is under preparation.
101

8.3 (d) RCE OF KONDAPURAM UNDERGROUND MINE:
A) Date of sanction/ RCE : 19.12.2008/ 11.03.2016
B) Financial Progress:
1) Sanctioned capital(up to construction
period) RCE
: Rs. 293.11 Cr. (Department option)
: Rs. 56.88 Cr.( Outsourcing option)
2) Total Capital Outlay : Rs. 447.21 Cr.
3) Cumulative expenditure up to Sep, 20 : Rs. 171.65 Cr. (Provisional)
4) Now anticipated cost : Rs. 293.11 Cr. (Department option)
: Rs. 56.88 Cr. (Outsourcing option
5) Status of RCE : Approved on 11.03.2016
C) Physical Progress:
1) Ultimate Capacity : 0.70 MTPA
2) Anticipated year of completion : 2020-21
3) Production realization in 2020-21 up to
Sep, 2020 : 0.03 MT
D) General Status in brief as on 30.09.2020:
1. Mining plan: Approved on 02.11.2018.
2. Environmental clearance: Obtained on 05.03.2010.
To be obtained for 0.92 MTPA & EPH to be conducted.
3. Forest Land: 477.03 Ha (UG rights): Obtained on 18.5.2015.
4. Forest land: 10.50 Ha (Surface rights): Obtained on 06.01.2016.
5. Drivage of Punch entries: Completed.
6. Power Supply: Power line and Substation (33/3.3KV): Completed.
7. Installation of Conveyors: Gear Head (55Kw) and cross belt (22Kw): Completed.
8. P&M: LHDs (2 Nos.) received and commissioned.
Diverted to GDK 1&3 and Adriyala (one each).
9. Approach road to Mine entries: Work commenced from 16.08.2019 & completed.
10. Drivage of Inclines: Open excavation & arching: Completed.
11. Tunnels:
LOI issued on 05.11.2018 & work commenced from 09.03.2019 & likely to complete by Dec’20.
12. Commencement of Production:
Production through punch entries commenced from 11.07.2015.
13. Infrastructure: Except Agent/Manager office all other buildings completed.
Agent/Manager office, work awarded & to be taken up
14. In-door and outdoor Sub –Station: Completed.
15. CM:
LOI issued on 11.08.2018. CM operations commenced from 30.10.2019 at punch entry district.
The project was delayed due to delay in Diversion of forest land.
102

8.3 (e) RCE of RAMAGUNDAM OC-II EXTENSION PROJECT:
A) Date of sanction : FR: 30.12.2009 & RCE: 16.11.2015
B) Financial Progress:
1) Sanctioned capital
: FR: Rs. 418.97 Cr.; RCE: Rs. 489.62 (Excluding
WDV of existing facilities for Rs. 155.43 Cr. &
actual exp. of Rs. 57.98 Cr.)
2) Total Capital Outlay : FR: Rs. 896.32 Cr. & RCE: Rs. 1200.04 Cr.
3) Cumulative expenditure up to Sep, 2020 : Rs. 416.07 Cr. (Provisional)
4) Now anticipated cost : Rs. 489.62 Cr.
5) Status of RCE : RCE is approved on 16.10.2015.
C) Physical Progress:
1) Ultimate Capacity : 4.00 MTPA
2) Anticipated year of completion : 2022-23.
3) Production in 2020-21 up to Sep, 2020 : 1.03 MT
4) Overburden removal in 2020-21 up to
Sep, 2020 : 13.66 M Cum
D) General Status in brief as on 30.09.2020:
1. Forest Land (333.48Ha.): Completed.
2. Non Forest land (1525-47 Ha): Land acquired - 1102.42 Ha. Land to be acquired - 423.05 Ha.
3. R&R: Rachapalli-572, Akkepalli-780, Ladnapur-721, Vakeelpalli-202, Adivarampet-200,
Budavarampet-800: Total=3275.
Rachapalli Ladnapur & Akkepalli villages: SES was conducted for Rachapalli, Ladnapur &
Akkepalli villages and draft SES published. SES for Akkapalli is completed.
R&R center for Rachapalli PDF: Land for R&R Center for Rachapalli village is identified in
Govt. & Govt. assigned land Ac. 283-00gts at Bittupalli. Development completed in phase-I for
734 plots. Plots allotment for Rachapally PDF (209) is in process. Development in Phase-II is
to be taken up for Akkepally PDF.
4. R&R Center for Ladnapur PDF: Private Land Ac. 46-08gts and Govt. Land Ac. 8-27gts:
Instead of this site, PDF requested to provide R&R site at SCCL acquired land near CNC. The
proposal was approved by competent authority. Tenders awarded for development of site and
works are under progress.
5. Adivarampet & Budavarampet villages: SES to be conducted for Adivarampet &
Budavarampet villages. But villagers are not co-operating for enumeration and SES.
However this land is required at later stages of the project.
6. R&R Development at Bittupally: Development of 734 plots for Rachapally PDF completed
and allotment of plots (209) is in process. Development in Phase-II for Akkepally PDF:
Tenders awarded for development of site & works to be taken up.
7. Diversion of L-6 Canal (Phase-I): Diversion completed & water diverted.
8. Manthani Road Diversion: As the village is not shifted, it is not possible to take up temporary
diversion. Hence a note is approved to drop temporary diversion. Permanent diversion will be
taken up after land acquisition and shifting of Ladnapur Village.
R&B department was requested to return the deposited amount.
9. OBR: OB removal is in progress.
103

10. Coal Production: Coal production commenced from 01.01.2010.
Year 2010-11=3.25 MT
Year 2011-12=2.14 MT
Year 2012-13=1.05 MT
Year 2013-14=0.73 MT
Year 2014-15=0.70 MT
Year 2015-16=1.50 MT
Year 2016-17=1.86 MT
Year 2017-18=1.93 MT
Year 2018-19=2.16 MT
Year 2019-20=2.37 MT
In view of abnormal increase in cost of land and R&R, RCE is approved on 16.10.2015.
104

8.3 (f) RCE of KISTARAM OCP:
A) Date of sanction : FR : 01.11.2010 & RCE: 04.03.2017
B) Financial Progress:
1) Sanctioned capital : Rs. 242.29 Cr. & RCE: Rs. 164.04 Cr.
2) Total Capital Outlay : Rs. 143.90 Cr.; RCE: Rs. 360.33 Cr.
2) Cumulative expenditure up to Sep, 2020 : Rs. 130.22 Cr. (Provisional)
4) Now anticipated cost : Rs. 164.04 Cr.
5) Status of RCE : RCE approved on : 04.03.2017
C) Physical Progress:
1) Ultimate Capacity : 2.00 MTPA
2) Anticipated year of completion : 2020-21
3) Production in 2020-21 up to Sep, 2020 : 0.20 T
4) Overburden removal in 2020-21 up to
Sep, 2020 : 7.14 M Cum
D) General Status in brief as on 30.09.2020:
1. Mining plan: Obtained on 21.03.2014.
2. Mining lease:
Prior approval given by MoC on 21.03.2014. State Govt. issued GO on 05.07.2019.
3. Environment clearance:
EC obtained on 18.06.2019. CFE obtained on 20.07.2019. CFO obtained on 18.10.2019.
4. Forest Land (285.44Ha): State Govt. issued GO on 20.05.2019.
5. Non - Forest Land Requisitioned: Private land (Ac. 91-29gts): PN published on18.12.2017.
Award enquiry completed. On 10.05.2018, Rs. 11.96 Cr. deposited with Collector, KMM for
Land compensation. On 29.01.2019, RDO finalised @ Rs.16.50 Lakh/Acre. Rs. 11.00 Cr.
balance funds deposited on 08.05.2019. Compensation disbursed to land owners for Ac. 69-
15gts. Possession taken for Ac. 63-02gts on 28.12.2019.
Court cases (Land owner’s dispute) Ac. 22-14gts.
6. Govt. land (Ac. 106-35gts+ Ac. 79-30gts.): Requisition submitted on 27.03.2015. SD &
enjoyment survey completed. Collector issued demand an Amount of Rs. 24.31 Cr. for Ac.
186-25gts on 02.02.2018. Award enquiry completed. Compensation finalised @ Rs. 16.50
Lakh/Acre & Rs. 24.34 Cr. was deposited with Collector as an advance for Ac. 177-29gts.
Awards passed for Ac. 157-23¼gts. On 05.08.2019. Possession taken for Ac. 103-16¼gts on
26.11.2019. Tank/Road/Sikam Land (free from encroachment) - Ac. 20-05¾gts. Ac. 54-07gts,
Possession will be taken after shifting of PDF to R&R centre, which is under development. Ac.
18-00gts - Balance land (disputed land). SDC inspected site on 17.03.2020.
PN published on 07.07.2020. Award enquiry completed on2.09.2020.
1. R&R details (160 PDF): R&R site is identified at Cherukupalli. SES completed on
01.02.2018. Draft R & R Plan is to be prepared and to be published. PN published on
22.10.2018. Award enquiry completed. DLNC Meeting held on 16.04.2019 at O/o Collector,
KMM & compensation finalised @ Rs. 16.50 Lakh/Acre for Ac. 14.05gts. On 15.05.2019,
demand received from Collector for Rs. 2.43 Cr. & money disbursed to land owners on
11.06.2019. Possession of land taken on 04.07.2019 & tenders awarded for development works.
Site leveling work is in progress. Draft R&R plan published in the village on 01.09.2020. Site
leveling work is in progress. Gramasabha conducted on 18.09.2020. R&R plan approval is
pending with DC.
2. Power supply arrangement: Rs. 48.00 Lakh deposited to TSNPDCL & temporary power
charged on 06.01.2020. Rs. 4.50 Cr. deposited on 14.10.2019 for dedicated power supply from
Penuballi 33Kv Substation to JVR OCPs, Kistaram OCP and SCCL Quarters. Contract
awarded by TSNPDCL & Work is under progress.
3. OBR: OBR Commenced from 18.10.2019.
10. Coal Production:
Coal production commenced from 15.02.2020 & achieved 0.192 MT during 2019-20.
105

106

8.3 (g) RCE of JVR OCP II:
A) Date of sanction : FR : 04.07.2011 & RCE: 26.08.2016; RCE II:
13.03.2019
B) Financial Progress:
1) Sanctioned capital : Rs. 437.51 Cr. & Rs. 473.22 Cr. (RCE II)
2) Total Capital Outlay : Rs. 1261.65 Cr.
2) Cumulative expenditure up to Sep, 2020 : Rs. 18.60 (Provisional)
4) Now anticipated cost : Rs. 447.06 Cr.
5) Status of RCE/RFR : Approved on 26.08.2016
C) Physical Progress:
1) Ultimate Capacity : 10.00 MTPA
2) Anticipated year of completion : 2020-21
3) Production in 2020-21 up to Sep, 2020 : 1.55 MT
4) Overburden removal in 2020-21upto
Sep, 2020
: 6.36 M Cum
D) General Status in brief as on 30.09.2020
1. Mining Plan: Comprehensive MP for 10MT approved on 11.02.2019.
2. Environment Clearance: Form-I uploaded on 11.02.2019 for 10 MT. ToR received on
21.05.2019. EPH conducted on 14.02.2020. Minutes submitted to MoEF & CC. Form-II to
clear JVR OC I violation is uploaded on 24.06.2020. EAC held on 07.08.2020 in which ADS
raised & submitted on 25.08.2020. 2nd EAC held on 22.09.2020 & minutes awaited.
Final EMP of JVR OC II will be uploaded after obtaining JVR OC I EC.
3. Mining lease: Obtained on 03.11.2016.
4. Forest Land (776.20Ha): MoEF issued Stage-I on 12.09.2016 & Stage II on 30.5.2017.
State Govt. issued G.O on 07.07.2017. Completed
5. Non Forest land (686.80 Ha as per RCE): Private Land - 563.45 Ha & Govt. land –
123.35 Ha. Acquisition of Private land (Ac. 94-07gts. of Kistaram (dump yard):
Completed.
6. Acquisition of Private land (Ac. 489-04 gts. of Kommepalli):
09 land owners filed Writ Petition No. 21315/ 2017 on 20.06.2017 in Hon’ble High Court, Hyd.
challenging the Awards passed by Lok Adalat, KMM in respect of certain Survey Numbers.
Hon’ble High Court issued orders to maintain Status-quo. On 28.11.2017, Hon’ble Prl. Dist. &
Sessions Judge, KMM referred the case to Hon’ble High Court, Hyd. to pass appropriate orders
on the Award. On 30.04.2018, Hon’ble high Court directed Dist. Judge to disburse amounts by
30.06.2018. During trail hearing on 30.07.2018, Dist. Judge informed that compensation would
be disbursed for about Ac.309-00gts by 16.08.2018 on filing of individual Cheque Petitions.
On 31.07.2018, GM, Kgm & GM(Est) met Dist. Judge, KMM for disbursement of payments.
On 31.8.2018, Dist. Judge, KMM instructed the concerned to withdraw the amount for
disbursement to the land owners for an extent of Ac. 235-00 gts, who got Hon’ble High Court
Orders (99 land owners). Further, for Ac. 110-00gts, land owners have to approach the High
Court to get the similar orders for compensation (28 land owners). On 30.09.2018 individual writ
petitions’ submitted at Dist. Judge, KMM by land owners for an extent of Ac. 124-00gts. Dist.
Judge, KMM disbursed compensation during 2nd week of Jan’19 for an extent of Ac. 238-00gts of
Patta Land of Kommepalli village. Balance Ac. 63-00gts, the land owners are submitting
individual Cheque Petitions in the Dist. Court. For remaining extent of Ac. 125-10gts Patta Land,
award enquiry is under process at Dist. Judge KMM & expected to be finalized by Dec’20.
7. Kommepalli Village Site (Ac 23-07gts) R&R: Completed.
8. Govt. land (Ac 304-27gts): Ac. 260-26gts land is under possession of SCCL.
Remaining land is required in subsequent years at different stages of the Project.
107

9. R&R details (229 PDF) (Kommepalli): R&R approved for 229 PDF by Commissioner,
R&R.
On 07.08.2018. R&R amount (Rs. 17.79 Cr.) was deposited with Collector, KMM. RDO,
Kallur, disbursed the R&R entitlements to the PDF of Kommepalli on 28.08.2018 to
30.08.2018. On 02.10.2018, RDO, Kallur handed over house plots to PDF. Development of
R&R centre is under progress.
10. CHP: Construction of conventional CHP: Work commenced from 18.04.2019. One stream
is ready out of 3 streams & balance works are under progress.
Hiring of mobile crushers:
PO released on 09.07.2019. Machine commissioned on 11.11.2019.
11. Construction of CHP under EPC mode: PO released on 19.04.2019. The Firm commenced
work from 01.11.’19. Scheduled completion is 18 months from Zero date i.e. from 01.11.2019
to 30.04.2021.
12. Railway line between Bhadrachalam Road to Sattupalli (53.20Km &Rs. 704.31 Cr.):
SCCL deposited Rs. 406.38 Cr. to SCR. Possession of land was handed over in14/14 villages
(811 Acres/864 Acres handed over) to Railways. Stage II approval accorded by MoEF & CC,
Chennai on 20.11.2019 in Mandalapadu village for diversion of 4.3762 Ha (Ac. 10-32gts)
from Km. 49.10 to Km. 49.70 FL processed by Railway authorities & taken over possession
of land. Earth work of Embankment started in two stretches, i.e., between Ch. 0.00 Km to Ch.
25.00Km (Aprx. 21.50 L Cum) & Ch. 25.00Km to 53.70Km (Aprx. 23.00 L Cum) and work is
in progress. On 30.10.2018, tender awarded for 10 Nos. major bridges (5 Nos. completed, 4
Nos. are in progress and 1 No. is yet to commence). 34 other minor bridges-22 Nos.
completed & 6 Nos. are under progress. 2 ROBs across National and State Highway- Work is
in progress. 4/4 Relay, Battery, Generator rooms and Station buildings –work is in progress.
13. OBR: OB removal commenced from 1st Sept, 2017.
14. Coal Production: Production commenced from 31.10.2017.
1. Year, 2017-18 = 0.749 MT
2. Year, 2018-19 = 2.955 MT
3. Year 2019-20 = 4.83 MT
108

8.3 (h) KASIPET – 2 Incline:
A) Date of sanction : FR : 04.07.2011
B) Financial Progress:
1) Sanctioned capital : Rs. 60.18 Cr.
2) Total Capital Outlay : Rs. 57.86 Cr.
2) Cumulative expenditure up to Sep, 20 : Rs. 50.13 Cr. (Provisional)
4) Now anticipated cost : Rs. 60.18 Cr.
5) Status of RCE/RFR : Not required.
C) Physical Progress:
1) Ultimate Capacity : 0.47 MTPA
2) Anticipated year of completion : 2020-21
3) Production in 2020-21 up to Sep, 2020 : 0.02 MT
D) General Status in brief as on 30.09.2020:
1. Mining Plan: Approved on 01.01.2015.
2. Environment Clearance: Obtained on 11.05.2015.
3. NF Land required (33.08 Ha.). Completed.
4. Tunnels: Completed @ 211.30m & 226.60m. Coal production commenced from 23.01.2019.
5. Power supply – Completed
6. Surface infrastructures: Completed by Aug’19.
7. Surface Bunker: Work commenced from 11.12.2017 & completed.
8. Sinking of Air Shaft (61m): Sinking completed. Inset with 4 Nos. of openings completed.
Underground gallery connected to Air Shaft. 8.70m elevation work on Surface is under
progress.
9. Construction of Fan house & erection of Fan: Contract awarded for construction of fan
house & work to be taken up.
10. Stowing Plant: Action to be initiated at later stages.
11. Road Diversion: Completed.
12. Coal production:
Coal production commenced from 23.01.2019 & achieved 0.043 MT in 2019-20.
109

8.3 (i) RCE OF KK OCP:
A) Date of sanction FR/ RCE : FR/RCE : 24.07.2012/ 11.03.2016
B) Financial Progress:
1) Sanctioned capital FR/RCE : Rs. 417.33 Cr./ Rs. 384.32 Cr.
2) Total Capital Outlay : Rs. 493.18 Cr.
2) Cumulative expenditure up to Sep, 2020 : Rs. 122.81 Cr. (Provisional)
4) Now anticipated cost : Rs. 384.32 Cr.
5) Status of RCE/RFR : RCE approved on 11.03.2016.
C) Physical Progress:
1) Ultimate Capacity : 1.75 MTPA
2) Anticipated year of completion : 2020-21
3) Production in 2020-21 up to Sep, 2020 : 0.41 MT
4) Overburden removal in 2020-21 up to
Sep, 2020 : 5.42 M. Cum
D) General Status in brief as on 30.09.2020:
1. Mining Plan: Approved on 25.11.2014
2. Mining Lease: Covered under NGML valid for further 20 years.
3. Environment Clearance: Obtained on 19.03.2015.
4. NF Land required (799.96 Ha as per FR): Requisitioned for Ac. 1201-00gts :
On 19.04.16, Akenapalli Village Govt. Land Ac. 44.20gts (Quarry) handed over to SCCL.
On 09.6.2016, Govt. Assigned Ac. 32-34gts (MM), handed over to SCCL.
Ac.125-16gts: On 15.05.2018, land handed over to SCCL.
Ac. 173-06gts: For Ac. 50-21gts, on 05.03.2019, land handed over to SCCL.
Remaining Ac.122.25gts: PN published on 07.07.2019. Objections filed against PN and
verified by the LAO, BPA. PD published on 08.07.2020. To be awarded by the LAO, BPA.
5. Status of R&R of Dubbagudem Village (350PDF): Enjoyment & SES completed on
22.05.2019 (Structures land: Ac. 8-20gts & Agriculture land: Ac.17-13gts i.e. Total land = Ac.
25-33gts & Total houses-243). PN published on 08.02.2020 to an extent of Ac. 08-20gts of
structures land of Dubbagudem. PN published for agriculture land to an extent of Ac.17-13gts
on 24.03.2020. On 24.07.2020, RDO, BPA conducted meeting at Dubbagudem, explained the
PN and informed that houses estimates will be completed as soon as possible. Letters sent to
forest, horticulture, RWS & Excise for valuation of trees, bore wells on 28.07.2020 by the
RDO, BPA. Estimation of trees completed by Horticulture dept. from 15.09.2020 to
17.09.2020 on field. Forest, RWS & houses estimation to be taken up.
6. Development of R&R centre: PN published. RDO, BPA conducted Negotiation with land
owners on 04.07.2020. Pattedars requested to pay the compensation @16L per Acre. Letters
sent to forest, horticulture, RWS & Excise for valuation of trees, bore wells on 28.07.2020 by
the RDO, BPA. RDO, BPA fixed the compensation amount @ 12 L/Acre and Land owners
consent given. On 12.09.2020, RDO, BPA sent DLNC copies to DC for approval.
7. Diversions of 132KV OHT lines: Completed on 5.03.2017.
8. Diversion of 33Kv OHT lines:
Div.by NPDCL@ 8.30Km completed on 03.11.2019 & SCCL @ 5.40Km is in progress.
9. Diversion of Nallah: Completed with RCC lining for about 300m.
10. CHP: Completed.
11. Diversion of Road (5.48 Km) Part-A: Work awarded & work is under progress.
12. Diversion of Road (5.57Km) Part-B - R&B accepted to take up the work & land handed
over. DPR submitted along with estimation of Rs. 39.00 Cr.
Work awarded by R&B. Work to be taken up.
13. Flood protection bund (6.1Km): Will be taken up departmentally.
14. Procurement of HEMM: Required HEMM procured.
15. OBR: OB removal commenced from 21.04.2017.
110

16. Coal Production: Coal production commenced.
1. Year, 2017-18 = 1.01 MT
2. Year, 2018-19 = 0.80 MT
3. Year 2019-20 = 1.75 MT
111

8.3 (j) KTK OC-2:
A) Date of sanction : FR : 14.05.2015, RCE: 19.8.2017
B) Financial Progress:
1) Sanctioned capital : Rs. 427.46 Cr. RCE: 442.42 Cr.
2) Total Capital Outlay : Rs. 368.23 Cr.
3) Cumulative expenditure up to Sep, 20 : Rs. 105.92 Cr. (Provisional)
4) Now anticipated cost : Rs. 442.42 Cr.
5) Status of RCE/RFR : RCE approved on 19.8.2017
C) Physical Progress:
1) Ultimate Capacity : 1.25 MTPA
2) Anticipated year of completion : 2018-19
3) Production realization in 2020-21 up to
Sep, 2020 : 0.26 MT
4) Overburden removal in 2020-21 up to
Sep, 2020 : 5.47 M. Cum
D) General Status in brief as on 30.09.2020:
1. Mining plan: Approved on 26.07.2016.
2. Environment clearance: Obtained on 29.10.2016.
3. NF Land required (668.23 Ha.). 594.65 Ha is under possession.
Govt. Land (Ac. 55-03gts) –Required for R&R: Survey is to be taken up
Govt. Land (Ac. 23-25gts) - Deputy Inspector of Survey inspected on 27.09.2018. ADSLR
has to approve SDR after inspection of site.
MRO has to submit scrutinized enjoyment report to RDO.
Pvt. Land (Ac. 75 - 21gts) -: SDR submitted to RDO during May’18.
4. R & R Status (922 PDF and 125 PAF): Gaddiganipalli, Faqeergadda and Balajinagar villages
have to be rehabilitated. R&R site is identified at SCCL land at Chelpur village, Ghanpur,
Mandal. Gaddiganipalli Village boundary demarcated by fixing pillars. SD & SES Survey
completed and report submitted to RDO on 28.10.2018. Wood value measurement completed.
Consent to be obtained from Gaddiganipalli committee and a letter to be taken from RDO for
technical committee approval.
5. Power supply arrangement (33 Kv line): New H.T line commissioned and charged.
6. Diversion of Nallah: Completed.
7. Diversion of road: Completed.
8. CHP construction: Completed.
9. Procurement of HEMM: Required HEMM procured.
10. OBR: OB removal commenced by contractor from 01.09.2017.
11. Commencement of Production: Coal production commenced from 22.02.2018.
1. Year, 2017-18 = 0.340 MT
2. Year, 2018-19 = 0.652 MT
3. Year, 2019-20 = 1.27 MT
112

8.3 (k) KTK OC III:
A) Date of sanction : 04.03.2017
B) Finan B) Financial Progress:
1) Sanctioned capital : Rs. 413.84 Cr.
2) Total Capital Outlay : Rs. 530.83 Cr.
3) Cumulative expenditure up to Sep, 2020 : Rs. 163.62 Cr. (provisional).
4) Now anticipated cost : Rs. 413.84 Cr.
5) Status of RCE/RFR
C) Physical Progress:
1) Ultimate Capacity : 2.50 MTPA
2) Anticipated year of completion : 2021-22
3) Production in 2020-21 up to Sep, 2020 : -
4) Overburden removal in 2020-21 up to
Sep, 2020 : 0.54 M. Cum
D) General Status in brief as on 30.09.2020:
1. Mining plan: Approved on 19.11.2018.
2. Mining lease: On 10.07.2020, State Govt. Issued LoI/Memo
3. Environment clearance: EC obtained on 27.04.2020. CFE obtained on 03.07.2020.
4. Non forest land acquisition: Revised Requisition submitted to Revenue Authorities on
21.04.2018, for Ac.2031-01gts. SD & enjoyment surveys completed. PN published for Ac.
411-01½gts on 05.05.2019. Consent obtained @ Rs. 15 L/Acre from villagers. Demand
received on 10.12.2019. Award enquiry conducted on 19/20.03.2020 & Rs. 64.04 Cr.
deposited to DC. Award passed by DC & compensation disbursed on 10.06.2020. 21 dispute
cases to be addressed by Revenue dept.PN published for 412 acres on 03.02.2020. Award
enquiry was completed on 23.06.2020. Note approved for Rs. 71 Cr. & Rs. 35 Cr. allocated on
10.07.2020. Declaration is under process.
5. R&R: Plots allotted to all Madhavaraopalli villagers on 25.08.2018. R&R plan approved by
R&R Commissioner @181 PDF. Village vacated & dismantling of structures completed. 03
dispute cases to be addressed by Revenue dept.
6. CHP: Land of Ac. 16-10gts handed over for erection of Mobile Crusher. Construction of
permanent CHP (PWTLS) will be taken up later.
7. Diversion of transmission line: Work completed on 20.02.2020.
8. Diversion of Roads for Coal Transportation and Service road (1.80 KM): Work is under
progress.
9. OBR: OBR commenced from 15.07.2020.
10.Coal production: Coal production expected from Dec’20.
113

8.3 (l) Godavarikhani Coal Mine (No. 2 & 2A and No. 5):
A) Date of sanction : FR: 26.07.2019
B) Financial Progress:
1) Sanctioned capital : FR: Rs. 438.98 Cr.
2) Total Capital Outlay : Rs. 607.04 Cr.
3) Cumulative expenditure up to Sep, 20 : Rs. 18.25 Cr. (Provisional)
4) Now anticipated cost : Rs. 438.98 Cr.
5) Status of RCE :
C) Physical Progress:
1) Ultimate Capacity : 3.00 MTPA
2) Anticipated year of completion : 2022-23
3) Production in 2020-21 up to Sep, 2020 : -
4) Overburden removal in 2020-21 up to
Sep, 2020 : -
D) General Status in brief as on 30.09.2020:
1. Mining plan: Approved on 29.03.2019.
2. Environmental clearance: Linked to GDK 1, 2 & 5 EC violation issue. 4th EAC held on
22.09.2020 & recommended for EC. After obtaining EC for violation mines, Form-I will be
processed for GDK Coal Mine. It is also linked to Sivaram ESZ for which draft ESZ
notification has to be given by MoEF & CC. Meeting held on 05.10.2020 with State Govt. &
recommended to MoEF & CC to issue NoC from NBWL.
3. Mining Lease: Available.
4. Acquisition of Private land (Ac. 24-15gts required for Road & Nallah): PN published on
30.05.2019. On 23.09.2019 compensation fixed as Rs. 12.00 L/Acre. PD published. Rs.1.89 Cr.
paid for Ac. 15-30gts as on 22.06.2020.
5. Acquisition of Govt. Land (Ac. 40-36gts): Ac.6-15gts in Janagaon Village-PD approved on
15.08.2020.
Ac.6-21gts of Mutyala village-PD approved on 15.08.2020.
Ac.01-34 gts of Janagaon Village for diversion of Nallah is pending.
Ac.23-15gts of Sundilla village-Enjoyment survey is under dispute.
6. Acquisition of NFL (Ac. 186-19gts required for Quarry & Dump yard-Ac. 77-29gts,
Private land + Ac.108-30gts, Govt. land): SD & Enjoyment survey completed for Ac. 33-
33gts of private land. PN published (for Ac. 17-29gts+Ac. 16-04gts) on 05.12.2019. Remaining
land Ac. 44-02gts is pending due to overlapping of village boundaries. Ac.108-30gts of Govt.
land - SD & Enjoyment Survey completed for Ac. 48-31gts. PN pending due to verification of
assignment records. SD & enjoyment Survey for Ac. 79-25gts is pending due to overlapping of
village boundaries
7. Govt. Land (Ac. 294-30gts): Addl. Collector, Peddapalli, advised to take up the detailed
enjoyment survey for the said lands for finalization of the issue. Enjoyment survey was started
on 15.06.2020 and it is under dispute.
8. Diversion of Road:
8 Hume pipe Culverts & 5 Slab Culverts completed and further work is under progress.
9. Diversion of Nallah: Work awarded on 04.05.2019.Work commenced during Dec’19.
10. Relocation of Main Magazine: Location finalised near Upparlakesaram. Land
acquisition to be done. SD & Enjoyment Survey completed.
11. Shift. of existing Nursery: Completed.
12. Shift. of Gas godown: Construction of buildings is under progress.
13. Diversion of 33Kv TSNPDCL OHT Line: To be taken up
14. Diversion of BSNL Tele Communication Cables: To be taken up
15. Shifting of 33Kv outdoor Sub-station: Construction of substation is under progress.
16. Procurement of P&M: Existing MOCP equipment will be utilized for some time.
114

17. OBR: Commencement of OBR is expected from Apr’21.
18. Commencement of Production: Coal production expected from Jun’21.
115
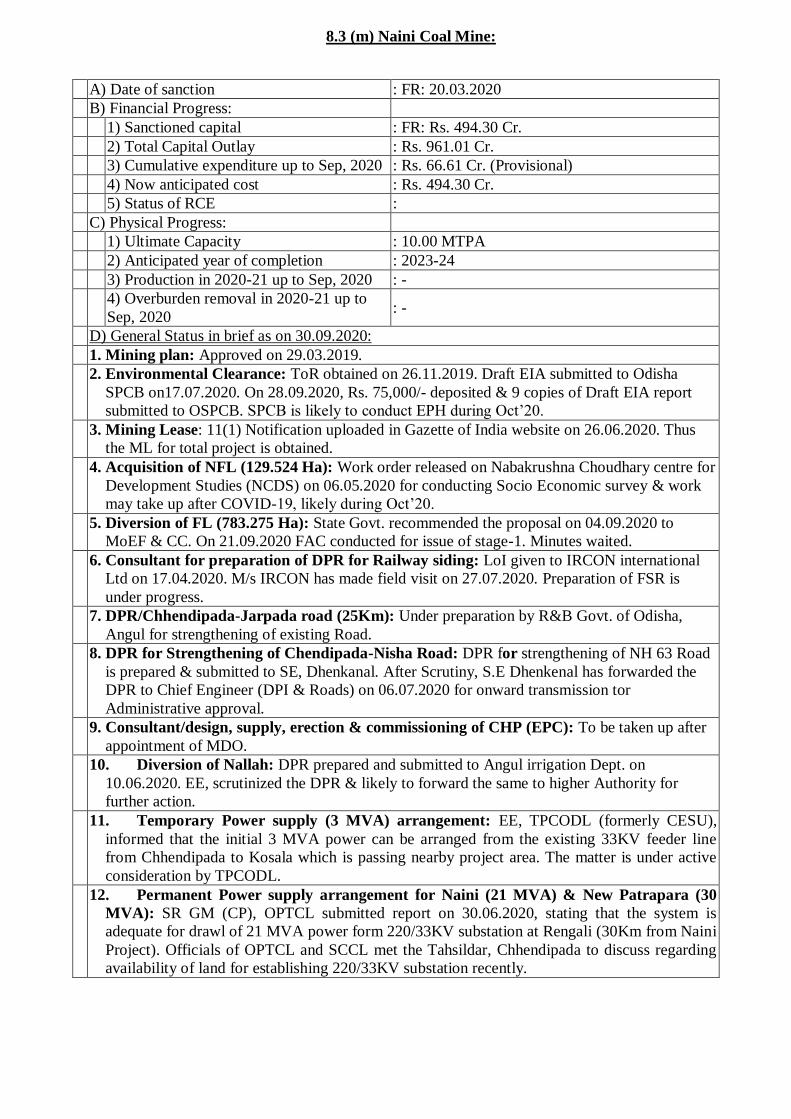
8.3 (m) Naini Coal Mine:
A) Date of sanction : FR: 20.03.2020
B) Financial Progress:
1) Sanctioned capital : FR: Rs. 494.30 Cr.
2) Total Capital Outlay : Rs. 961.01 Cr.
3) Cumulative expenditure up to Sep, 2020 : Rs. 66.61 Cr. (Provisional)
4) Now anticipated cost : Rs. 494.30 Cr.
5) Status of RCE :
C) Physical Progress:
1) Ultimate Capacity : 10.00 MTPA
2) Anticipated year of completion : 2023-24
3) Production in 2020-21 up to Sep, 2020 : -
4) Overburden removal in 2020-21 up to
Sep, 2020 : -
D) General Status in brief as on 30.09.2020:
1. Mining plan: Approved on 29.03.2019.
2. Environmental Clearance: ToR obtained on 26.11.2019. Draft EIA submitted to Odisha
SPCB on17.07.2020. On 28.09.2020, Rs. 75,000/- deposited & 9 copies of Draft EIA report
submitted to OSPCB. SPCB is likely to conduct EPH during Oct’20.
3. Mining Lease: 11(1) Notification uploaded in Gazette of India website on 26.06.2020. Thus
the ML for total project is obtained.
4. Acquisition of NFL (129.524 Ha): Work order released on Nabakrushna Choudhary centre for
Development Studies (NCDS) on 06.05.2020 for conducting Socio Economic survey & work
may take up after COVID-19, likely during Oct’20.
5. Diversion of FL (783.275 Ha): State Govt. recommended the proposal on 04.09.2020 to
MoEF & CC. On 21.09.2020 FAC conducted for issue of stage-1. Minutes waited.
6. Consultant for preparation of DPR for Railway siding: LoI given to IRCON international
Ltd on 17.04.2020. M/s IRCON has made field visit on 27.07.2020. Preparation of FSR is
under progress.
7. DPR/Chhendipada-Jarpada road (25Km): Under preparation by R&B Govt. of Odisha,
Angul for strengthening of existing Road.
8. DPR for Strengthening of Chendipada-Nisha Road: DPR for strengthening of NH 63 Road
is prepared & submitted to SE, Dhenkanal. After Scrutiny, S.E Dhenkenal has forwarded the
DPR to Chief Engineer (DPI & Roads) on 06.07.2020 for onward transmission tor
Administrative approval.
9. Consultant/design, supply, erection & commissioning of CHP (EPC): To be taken up after
appointment of MDO.
10. Diversion of Nallah: DPR prepared and submitted to Angul irrigation Dept. on
10.06.2020. EE, scrutinized the DPR & likely to forward the same to higher Authority for
further action.
11. Temporary Power supply (3 MVA) arrangement: EE, TPCODL (formerly CESU),
informed that the initial 3 MVA power can be arranged from the existing 33KV feeder line
from Chhendipada to Kosala which is passing nearby project area. The matter is under active
consideration by TPCODL.
12. Permanent Power supply arrangement for Naini (21 MVA) & New Patrapara (30
MVA): SR GM (CP), OPTCL submitted report on 30.06.2020, stating that the system is
adequate for drawl of 21 MVA power form 220/33KV substation at Rengali (30Km from Naini
Project). Officials of OPTCL and SCCL met the Tahsildar, Chhendipada to discuss regarding
availability of land for establishing 220/33KV substation recently.
116

13. Railway line (3.50Km)(Tentuloi to Naini): Mahanadi Coal Railway Ltd (MCRL), a JV
company between MCL, IRCON & IDCO is constructing 68Km common Rail Corridor
between Angul-Balaram- Putagadia-Jarapada (linking different Coal Blocks including Naini
coal block) at an approximate cost of Rs. 1700 Cr. Phase-I of the project between Angul to
Balaram (14Km) is under progress. SCCL agreed for 15% equity participation in MCRL along
with Director in MCRL Board. NA & JS, MoC convened a meeting through VC on 08.07.2020
with CIL, MCRL, IRCON, SCCL and other stakeholders like NALCO. The status of
important issues as informed by MCRL and IRCON during the meeting are:
Appt. Of CEO: The CEO has been appointed and joined on 01.09.2020
Financial closure: Negotiations with Bank of Baroda & Punjab National Bank is in progress
for full term loan.
Equity re-structuring: Expected to take some more time as this involves legal process. The
matter will be put to MCRL Board for deliberation.
Phase –II works: LAO has been appointed, development work is in progress. Requisition for
LA submitted to Tahsildar, Chhendipada. FD plan submitted to ORSAC for certification,
thereafter the FD proposal will be submitted. 68Km inner corridor is likely to be completed by
Mar, 2024.
14. Exploration -130 BH (58 BH in NFL & 72 BH in FL) & GR Preparation: Drilling
commenced in NFL from 17.06.2019. So far 27 BH/58 BH (6000m) completed. The work is
temporarily stopped due to lockdown.
Stage-II Forest clearance obtained on 06.06.2019 for drilling in forest land. Drilling will be
taken up in the forest land after completion of drilling in NFL.
15. OBR: Commencement of OBR is expected from Apr’21.
16. Commencement of Production: Coal production expected from Jun’21.
117

MINISTRY OF COAL
O/o Deputy Director General
A-Wing, 5th Floor, Lok Nayak Bhavan,
Lok Nayak Bhavan, New Delhi- 110003