Monthly Report on Oilseeds June 2018 - … · Processors Association of India (SOPA) ... the...
9
13 June, 2018 Monthly Report On Oilseeds June 2018
Transcript of Monthly Report on Oilseeds June 2018 - … · Processors Association of India (SOPA) ... the...

13June,2018
Monthly Report On
OilseedsJune 2018
Domestic Fundamentals: Soybean futures (July)Domestic Fundamentals: Soybean futures (July)
Fundamentals
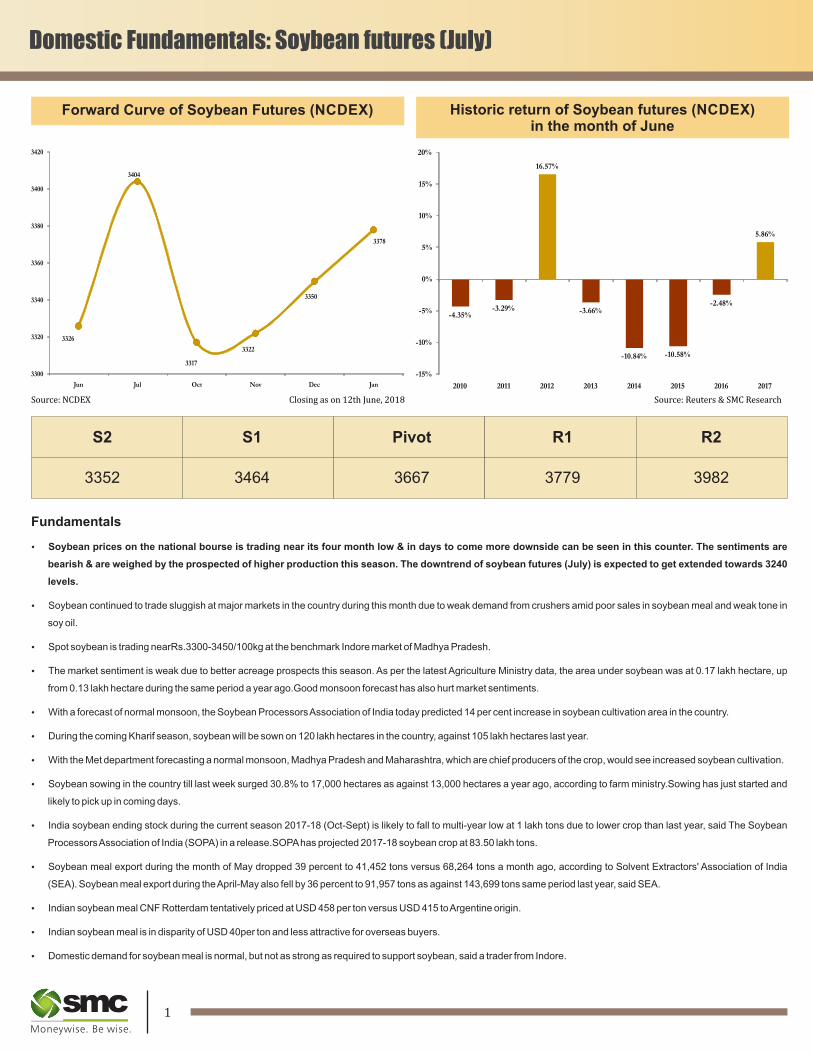
Ÿ Soybean prices on the national bourse is trading near its four month low & in days to come more downside can be seen in this counter. The sentiments are
bearish & are weighed by the prospected of higher production this season. The downtrend of soybean futures (July) is expected to get extended towards 3240
levels.
Ÿ Soybean continued to trade sluggish at major markets in the country during this month due to weak demand from crushers amid poor sales in soybean meal and weak tone in
soy oil.
Ÿ Spot soybean is trading nearRs.3300-3450/100kg at the benchmark Indore market of Madhya Pradesh.
Ÿ The market sentiment is weak due to better acreage prospects this season. As per the latest Agriculture Ministry data, the area under soybean was at 0.17 lakh hectare, up
from 0.13 lakh hectare during the same period a year ago.Good monsoon forecast has also hurt market sentiments.
Ÿ With a forecast of normal monsoon, the Soybean Processors Association of India today predicted 14 per cent increase in soybean cultivation area in the country.
Ÿ During the coming Kharif season, soybean will be sown on 120 lakh hectares in the country, against 105 lakh hectares last year.
Ÿ With the Met department forecasting a normal monsoon, Madhya Pradesh and Maharashtra, which are chief producers of the crop, would see increased soybean cultivation.
Ÿ Soybean sowing in the country till last week surged 30.8% to 17,000 hectares as against 13,000 hectares a year ago, according to farm ministry.Sowing has just started and
likely to pick up in coming days.
Ÿ India soybean ending stock during the current season 2017-18 (Oct-Sept) is likely to fall to multi-year low at 1 lakh tons due to lower crop than last year, said The Soybean
Processors Association of India (SOPA) in a release.SOPA has projected 2017-18 soybean crop at 83.50 lakh tons.
Ÿ Soybean meal export during the month of May dropped 39 percent to 41,452 tons versus 68,264 tons a month ago, according to Solvent Extractors' Association of India
(SEA). Soybean meal export during the April-May also fell by 36 percent to 91,957 tons as against 143,699 tons same period last year, said SEA.
Ÿ Indian soybean meal CNF Rotterdam tentatively priced at USD 458 per ton versus USD 415 to Argentine origin.
Ÿ Indian soybean meal is in disparity of USD 40per ton and less attractive for overseas buyers.
Ÿ Domestic demand for soybean meal is normal, but not as strong as required to support soybean, said a trader from Indore.
Source:Reuters&SMCResearchSource:NCDEX Closingason12thJune,2018
S2 S1 Pivot R1 R2
3352 3464 3667 3779 3982
Forward Curve of Soybean Futures (NCDEX) Historic return of Soybean futures (NCDEX) in the month of June Ÿ Mills across the country crushed around 500,000 tonsof soybean in May, down from 600,000 tonsin the corresponding period previous year. For Oct-May, around 6.1
milliontonsof the oilseed was crushed, marginally down from 6.2 milliontonsin the year-ago period, the Soybean Processors' Association of Indiasaid.
Ÿ As of May end, the total soymeal stocks in the country were estimated at 141,000 tn.
Ÿ In news, Bangladesh Govt removed 10% import duty on soya and instead imposed uniform 5% GST on all imports including Indian soymeal.Of 41,452 tonssoymeal exports
from India in May, Bangladesh imported 15,160 tons, according to the Solvent Extractors' Association of India data.
Ÿ The release revealed that soybean arrival in the country till May 31 stood at 71 lakh tons, up from 64.50 lakh tons during the same period a year ago and 60.50 lakh tons were
used for crushing with leftover stock with plants, traders and farmers stood at 21.16 lakh tons.
Ÿ Although soybean stock is projected to fall at multi-year low, but prices in the spot market have witnessed sharp losses amid slow demand in soybean meal sales, declining
trend in soy oil followed by expectations of rise in soybean acreage this Kharif season.
1 2
3326
3404
3317
3322
3350
3378
3300
3320
3340
3360
3380
3400
3420
Jun Jul Oct Nov Dec Jan
-4.35%-3.29%
16.57%
-3.66%
-10.84% -10.58%
-2.48%
5.86%
-15%
-10%
-5%
0%
5%
10%
15%
20%
2010 2011 2012 2013 2014 2015 2016 2017

Domestic Fundamentals: Soybean futures (July)Domestic Fundamentals: Soybean futures (July)
Fundamentals
Ÿ Soybean prices on the national bourse is trading near its four month low & in days to come more downside can be seen in this counter. The sentiments are
bearish & are weighed by the prospected of higher production this season. The downtrend of soybean futures (July) is expected to get extended towards 3240
levels.
Ÿ Soybean continued to trade sluggish at major markets in the country during this month due to weak demand from crushers amid poor sales in soybean meal and weak tone in
soy oil.
Ÿ Spot soybean is trading nearRs.3300-3450/100kg at the benchmark Indore market of Madhya Pradesh.
Ÿ The market sentiment is weak due to better acreage prospects this season. As per the latest Agriculture Ministry data, the area under soybean was at 0.17 lakh hectare, up
from 0.13 lakh hectare during the same period a year ago.Good monsoon forecast has also hurt market sentiments.
Ÿ With a forecast of normal monsoon, the Soybean Processors Association of India today predicted 14 per cent increase in soybean cultivation area in the country.
Ÿ During the coming Kharif season, soybean will be sown on 120 lakh hectares in the country, against 105 lakh hectares last year.
Ÿ With the Met department forecasting a normal monsoon, Madhya Pradesh and Maharashtra, which are chief producers of the crop, would see increased soybean cultivation.
Ÿ Soybean sowing in the country till last week surged 30.8% to 17,000 hectares as against 13,000 hectares a year ago, according to farm ministry.Sowing has just started and
likely to pick up in coming days.
Ÿ India soybean ending stock during the current season 2017-18 (Oct-Sept) is likely to fall to multi-year low at 1 lakh tons due to lower crop than last year, said The Soybean
Processors Association of India (SOPA) in a release.SOPA has projected 2017-18 soybean crop at 83.50 lakh tons.
Ÿ Soybean meal export during the month of May dropped 39 percent to 41,452 tons versus 68,264 tons a month ago, according to Solvent Extractors' Association of India
(SEA). Soybean meal export during the April-May also fell by 36 percent to 91,957 tons as against 143,699 tons same period last year, said SEA.
Ÿ Indian soybean meal CNF Rotterdam tentatively priced at USD 458 per ton versus USD 415 to Argentine origin.
Ÿ Indian soybean meal is in disparity of USD 40per ton and less attractive for overseas buyers.
Ÿ Domestic demand for soybean meal is normal, but not as strong as required to support soybean, said a trader from Indore.
Source:Reuters&SMCResearchSource:NCDEX Closingason12thJune,2018
S2 S1 Pivot R1 R2
3352 3464 3667 3779 3982
Forward Curve of Soybean Futures (NCDEX) Historic return of Soybean futures (NCDEX) in the month of June Ÿ Mills across the country crushed around 500,000 tonsof soybean in May, down from 600,000 tonsin the corresponding period previous year. For Oct-May, around 6.1
milliontonsof the oilseed was crushed, marginally down from 6.2 milliontonsin the year-ago period, the Soybean Processors' Association of Indiasaid.
Ÿ As of May end, the total soymeal stocks in the country were estimated at 141,000 tn.
Ÿ In news, Bangladesh Govt removed 10% import duty on soya and instead imposed uniform 5% GST on all imports including Indian soymeal.Of 41,452 tonssoymeal exports
from India in May, Bangladesh imported 15,160 tons, according to the Solvent Extractors' Association of India data.
Ÿ The release revealed that soybean arrival in the country till May 31 stood at 71 lakh tons, up from 64.50 lakh tons during the same period a year ago and 60.50 lakh tons were
used for crushing with leftover stock with plants, traders and farmers stood at 21.16 lakh tons.
Ÿ Although soybean stock is projected to fall at multi-year low, but prices in the spot market have witnessed sharp losses amid slow demand in soybean meal sales, declining
trend in soy oil followed by expectations of rise in soybean acreage this Kharif season.
1 2
3326
3404
3317
3322
3350
3378
3300
3320
3340
3360
3380
3400
3420
Jun Jul Oct Nov Dec Jan
-4.35%-3.29%
16.57%
-3.66%
-10.84% -10.58%
-2.48%
5.86%
-15%
-10%
-5%
0%
5%
10%
15%
20%
2010 2011 2012 2013 2014 2015 2016 2017
Mustard futures (July)
Source:Reuters&SMCResearchSource:NCDEX Closingason12thJune,2018
Fundamentals
Ÿ Mustard futures (July) is expected to trade with an upside bias in the range of 3840-4300 levels. The underlying demand for this oilseed is strong due to the steady
demand from the millers for crushing purpose.
Ÿ The carryover stocks also would be lesser by November-December as the crushing has been on the higher side this year. According to data compiled by the Mustard Oil
Producers Association of India, oil mills across the country crushed about 2.6 million tons of the mustard during the first three months of new season – March, April and May –
up by 31.6 per cent compared with the same period last year.
Ÿ Moreover, export demand will continue to support prices in the coming months. Further, the production of next year can be lower as the monsoon prediction need not favour
Rabi crops in the northern and western parts of the country.
Ÿ Mustard meal exports went up by 200 per cent in financial year 2017-18. Higher meal exports and lesser carryover stocks due to increased crushing will keep mustard seed
prices firm in the coming months.
Ÿ Shipments had gone up to key markets like South Korea, Bangladesh, Thailand and Vietnam that account for over 90 per cent of the total export volumes. Among these
markets, S Korean exports went up by
30 per cent to 220,000 tons, exports to
Bangladesh increased by 58.3 per cent
to 118,000 tons, Thailand by 480 per
cent to 117,000 tons and Vietnam by
208 per cent to 97,400 tons.
Ÿ The crushing of the mustard has been
steady in the past months and the same
pace is likely to be seen in days to come.
Mustard oil mills across the country
crushed 900,000 tonsof the oilseed in
May, unchanged from the previous
month, according to data compiled by
the Mustard Oil Producers Association
of India.
Historic return of RM Seed in the monthof June
Forward Curve of Mustard futures (NCDEX)
S2 S1 Pivot R1 R2
3641 3799 3940 4098 4239
3 4
954.00
959.40
965.20
974.40
940.00
945.00
950.00
955.00
960.00
965.00
970.00
975.00
980.00
July Aug Sept Nov
3,907
3,947
3,987
4,027
4,067
3,850
3,900
3,950
4,000
4,050
4,100
Jun Jul Aug Sep Oct
5.08%
-5.52%
0.38%
-3.70%
11.17%
0.77%
-7.34%
-10%
-5%
0%
5%
10%
15%
2011 2012 2013 2014 2015 2016 2017
1.15%
-5.07%
12.89%
3.61%
-6.21%
13.09%
8.95%
2.87%
-10%
-5%
0%
5%
10%
15%
2010 2011 2012 2013 2014 2015 2016 2017
International fundamentals: Soybean futures (July)
Source:Reuters&SMCResearchSource:CBOT Closingason12thJune,2018
Fundamentals
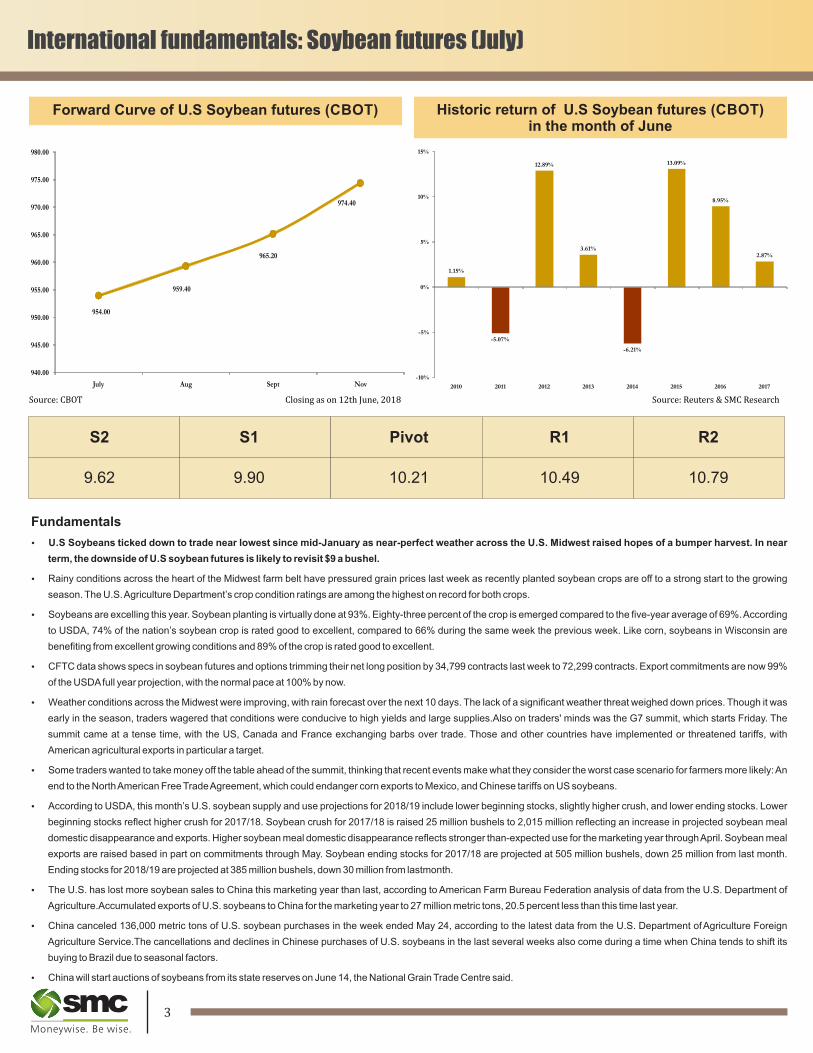
Ÿ U.S Soybeans ticked down to trade near lowest since mid-January as near-perfect weather across the U.S. Midwest raised hopes of a bumper harvest. In near
term, the downside of U.S soybean futures is likely to revisit $9 a bushel.
Ÿ Rainy conditions across the heart of the Midwest farm belt have pressured grain prices last week as recently planted soybean crops are off to a strong start to the growing
season. The U.S. Agriculture Department’s crop condition ratings are among the highest on record for both crops.
Ÿ Soybeans are excelling this year. Soybean planting is virtually done at 93%. Eighty-three percent of the crop is emerged compared to the five-year average of 69%. According
to USDA, 74% of the nation’s soybean crop is rated good to excellent, compared to 66% during the same week the previous week. Like corn, soybeans in Wisconsin are
benefiting from excellent growing conditions and 89% of the crop is rated good to excellent.
Ÿ CFTC data shows specs in soybean futures and options trimming their net long position by 34,799 contracts last week to 72,299 contracts. Export commitments are now 99%
of the USDA full year projection, with the normal pace at 100% by now.
Ÿ Weather conditions across the Midwest were improving, with rain forecast over the next 10 days. The lack of a significant weather threat weighed down prices. Though it was
early in the season, traders wagered that conditions were conducive to high yields and large supplies.Also on traders' minds was the G7 summit, which starts Friday. The
summit came at a tense time, with the US, Canada and France exchanging barbs over trade. Those and other countries have implemented or threatened tariffs, with
American agricultural exports in particular a target.
Ÿ Some traders wanted to take money off the table ahead of the summit, thinking that recent events make what they consider the worst case scenario for farmers more likely: An
end to the North American Free Trade Agreement, which could endanger corn exports to Mexico, and Chinese tariffs on US soybeans.
Ÿ According to USDA, this month’s U.S. soybean supply and use projections for 2018/19 include lower beginning stocks, slightly higher crush, and lower ending stocks. Lower
beginning stocks reflect higher crush for 2017/18. Soybean crush for 2017/18 is raised 25 million bushels to 2,015 million reflecting an increase in projected soybean meal
domestic disappearance and exports. Higher soybean meal domestic disappearance reflects stronger than-expected use for the marketing year through April. Soybean meal
exports are raised based in part on commitments through May. Soybean ending stocks for 2017/18 are projected at 505 million bushels, down 25 million from last month.
Ending stocks for 2018/19 are projected at 385 million bushels, down 30 million from lastmonth.
Ÿ The U.S. has lost more soybean sales to China this marketing year than last, according to American Farm Bureau Federation analysis of data from the U.S. Department of
Agriculture.Accumulated exports of U.S. soybeans to China for the marketing year to 27 million metric tons, 20.5 percent less than this time last year.
Ÿ China canceled 136,000 metric tons of U.S. soybean purchases in the week ended May 24, according to the latest data from the U.S. Department of Agriculture Foreign
Agriculture Service.The cancellations and declines in Chinese purchases of U.S. soybeans in the last several weeks also come during a time when China tends to shift its
buying to Brazil due to seasonal factors.
Ÿ China will start auctions of soybeans from its state reserves on June 14, the National Grain Trade Centre said.
Forward Curve of U.S Soybean futures (CBOT) Historic return of U.S Soybean futures (CBOT)in the month of June
S2 S1 Pivot R1 R2
9.62 9.90 10.21 10.49 10.79

Mustard futures (July)
Source:Reuters&SMCResearchSource:NCDEX Closingason12thJune,2018
Fundamentals
Ÿ Mustard futures (July) is expected to trade with an upside bias in the range of 3840-4300 levels. The underlying demand for this oilseed is strong due to the steady
demand from the millers for crushing purpose.
Ÿ The carryover stocks also would be lesser by November-December as the crushing has been on the higher side this year. According to data compiled by the Mustard Oil
Producers Association of India, oil mills across the country crushed about 2.6 million tons of the mustard during the first three months of new season – March, April and May –
up by 31.6 per cent compared with the same period last year.
Ÿ Moreover, export demand will continue to support prices in the coming months. Further, the production of next year can be lower as the monsoon prediction need not favour
Rabi crops in the northern and western parts of the country.
Ÿ Mustard meal exports went up by 200 per cent in financial year 2017-18. Higher meal exports and lesser carryover stocks due to increased crushing will keep mustard seed
prices firm in the coming months.
Ÿ Shipments had gone up to key markets like South Korea, Bangladesh, Thailand and Vietnam that account for over 90 per cent of the total export volumes. Among these
markets, S Korean exports went up by
30 per cent to 220,000 tons, exports to
Bangladesh increased by 58.3 per cent
to 118,000 tons, Thailand by 480 per
cent to 117,000 tons and Vietnam by
208 per cent to 97,400 tons.
Ÿ The crushing of the mustard has been
steady in the past months and the same
pace is likely to be seen in days to come.
Mustard oil mills across the country
crushed 900,000 tonsof the oilseed in
May, unchanged from the previous
month, according to data compiled by
the Mustard Oil Producers Association
of India.
Historic return of RM Seed in the monthof June
Forward Curve of Mustard futures (NCDEX)
S2 S1 Pivot R1 R2
3641 3799 3940 4098 4239
3 4
954.00
959.40
965.20
974.40
940.00
945.00
950.00
955.00
960.00
965.00
970.00
975.00
980.00
July Aug Sept Nov
3,907
3,947
3,987
4,027
4,067
3,850
3,900
3,950
4,000
4,050
4,100
Jun Jul Aug Sep Oct
5.08%
-5.52%
0.38%
-3.70%
11.17%
0.77%
-7.34%
-10%
-5%
0%
5%
10%
15%
2011 2012 2013 2014 2015 2016 2017
1.15%
-5.07%
12.89%
3.61%
-6.21%
13.09%
8.95%
2.87%
-10%
-5%
0%
5%
10%
15%
2010 2011 2012 2013 2014 2015 2016 2017
International fundamentals: Soybean futures (July)
Source:Reuters&SMCResearchSource:CBOT Closingason12thJune,2018
Fundamentals
Ÿ U.S Soybeans ticked down to trade near lowest since mid-January as near-perfect weather across the U.S. Midwest raised hopes of a bumper harvest. In near
term, the downside of U.S soybean futures is likely to revisit $9 a bushel.
Ÿ Rainy conditions across the heart of the Midwest farm belt have pressured grain prices last week as recently planted soybean crops are off to a strong start to the growing
season. The U.S. Agriculture Department’s crop condition ratings are among the highest on record for both crops.
Ÿ Soybeans are excelling this year. Soybean planting is virtually done at 93%. Eighty-three percent of the crop is emerged compared to the five-year average of 69%. According
to USDA, 74% of the nation’s soybean crop is rated good to excellent, compared to 66% during the same week the previous week. Like corn, soybeans in Wisconsin are
benefiting from excellent growing conditions and 89% of the crop is rated good to excellent.
Ÿ CFTC data shows specs in soybean futures and options trimming their net long position by 34,799 contracts last week to 72,299 contracts. Export commitments are now 99%
of the USDA full year projection, with the normal pace at 100% by now.
Ÿ Weather conditions across the Midwest were improving, with rain forecast over the next 10 days. The lack of a significant weather threat weighed down prices. Though it was
early in the season, traders wagered that conditions were conducive to high yields and large supplies.Also on traders' minds was the G7 summit, which starts Friday. The
summit came at a tense time, with the US, Canada and France exchanging barbs over trade. Those and other countries have implemented or threatened tariffs, with
American agricultural exports in particular a target.
Ÿ Some traders wanted to take money off the table ahead of the summit, thinking that recent events make what they consider the worst case scenario for farmers more likely: An
end to the North American Free Trade Agreement, which could endanger corn exports to Mexico, and Chinese tariffs on US soybeans.
Ÿ According to USDA, this month’s U.S. soybean supply and use projections for 2018/19 include lower beginning stocks, slightly higher crush, and lower ending stocks. Lower
beginning stocks reflect higher crush for 2017/18. Soybean crush for 2017/18 is raised 25 million bushels to 2,015 million reflecting an increase in projected soybean meal
domestic disappearance and exports. Higher soybean meal domestic disappearance reflects stronger than-expected use for the marketing year through April. Soybean meal
exports are raised based in part on commitments through May. Soybean ending stocks for 2017/18 are projected at 505 million bushels, down 25 million from last month.
Ending stocks for 2018/19 are projected at 385 million bushels, down 30 million from lastmonth.
Ÿ The U.S. has lost more soybean sales to China this marketing year than last, according to American Farm Bureau Federation analysis of data from the U.S. Department of
Agriculture.Accumulated exports of U.S. soybeans to China for the marketing year to 27 million metric tons, 20.5 percent less than this time last year.
Ÿ China canceled 136,000 metric tons of U.S. soybean purchases in the week ended May 24, according to the latest data from the U.S. Department of Agriculture Foreign
Agriculture Service.The cancellations and declines in Chinese purchases of U.S. soybeans in the last several weeks also come during a time when China tends to shift its
buying to Brazil due to seasonal factors.
Ÿ China will start auctions of soybeans from its state reserves on June 14, the National Grain Trade Centre said.
Forward Curve of U.S Soybean futures (CBOT) Historic return of U.S Soybean futures (CBOT)in the month of June
S2 S1 Pivot R1 R2
9.62 9.90 10.21 10.49 10.79

Fundamentals
Ÿ CPO futures (June)has broken the three month support near 632 levels & this downside may continue till 620-615 levels. The edible oils counter are taking
negative cues from the international market. Benchmark Malaysian palm-oil futures hit near-2-year lows at MYR2,300/ton as it continues to follow rival soy oil
lower. The two often trade similarly, and concerns about soft demand for palm oil and growing production have dimmed the market of late.
Ÿ A strategy of sell on rise would be recommended in refined soy oil futures(July) as itis looking bearish & can test 725-710 levels, getting weighed down by the weak trend of the
U.S soy oil prices & higher prospects of domestic soybean production this season.
Ÿ Currently, all the eyes are on the notification of duty hike in edible oils. The government is likely to raise import duty on soyoil, sunflower oil, and canola oil within a week to curb
cheaper imports and to help boost prices of domestically grown oilseeds. The Centre wants to boost prices of mustard and groundnut crops grown in the country and support
farmers. With the curb imports of edible oils, demand will shift to domestic markets.
Ÿ India's edible oil consumption typically outstrips production because of lower oilseed output. Being the largest consumer of edible oils, India imported a record 14.6 million
tons of cooking oil in the year ended October.
Ÿ According to industry, higher import of soy oil from overseas has hurt domestic industry and thus government should increase import duty in a bid to curb import to provide
better returns to farmers so they can cultivate more soybean.
Ÿ There were reports that government is considering to raise import duty on soft oils (soy, sun and canola), but no official announcement has been made by the government so
far.
Ÿ In news, FSSAI is planning to make fortification of edible oil mandatory across India. The country’s apex food regulator is actively considering this move and has held
discussions with the stakeholders in the recent past. In a couple of months, it plans to put forth the strategy for the same.The fortification of edible oil with Vitamins A and D is,
thus, an effective complementary strategy to fill the gap between a person’s daily requirements and consumption, as edible oil has a household penetration of over 99 per
cent.
Historic return of Soybean Oil futures (NCDEX)in the month of June
Forward Curve of Refined Soy oil futures (NCDEX)
Edible oil complex (Domestic Fundamentals)
Source:Reuters&SMCResearchSource:NCDEX Closingason12thJune,2018
Commodity S2 S1 Pivot R1 R2
CPO (June) 612 633 653 673 694
Ref. soy oil (July) 730 753 773 797 817
Edible oil complex (Domestic Fundamentals)
5 6
732.30
740.30
746.70
752.60
758.50
764.40
770.30
776.20
725.00
735.00
745.00
755.00
765.00
775.00
785.00
Jun Jul Aug Sep Oct Nov Dec Jan
-1.18%
-4.00%
3.51%
-5.88%
2.49%
-4.05%
-1.82%
3.27%
-8%
-6%
-4%
-2%
0%
2%
4%
2010 2011 2012 2013 2014 2015 2016 2017
SMC Global Securities Ltd. (hereinafter referred to as “SMC”) is regulated by the Securities and Exchange Board of India (“SEBI”) and is licensed to carry on the business of broking, depository services and related
activities. SMC is a registered member of National Stock Exchange of India Limited, Bombay Stock Exchange Limited, MSEI (Metropolitan Stock Exchange of India Ltd.) and M/s SMC Comtrade Ltd is a registered
member of National Commodity and Derivative Exchange Limited and Multi Commodity Exchanges of India and other commodity exchanges in India. SMC is also registered as a Depository Participant with CDSL and
NSDL. SMC’s other associates are registered as Merchant Bankers, Portfolio Managers, NBFC with SEBI and Reserve Bank of India. It also has registration with AMFI as a Mutual Fund Distributor.
SMC is a SEBI registered Research Analyst having registration number INH100001849. SMC or its associates has not been debarred/ suspended by SEBI or any other regulatory authority for accessing /dealing in
securities/commodities market.
The views expressed by the Research Analyst in this Report are based solely on information available publicly available/internal data/ other reliable sources believed to be true. SMC does not represent/ provide any
warranty expressly or impliedly to the accuracy, contents or views expressed herein and investors are advised to independently evaluate the market conditions/risks involved before making any investment decision. The
research analysts who have prepared this Report hereby certify that the views /opinions expressed in this Report are their personal independent views/opinions in respect of the subject commodity.
DISCLAMIER: This Research Report is for the personal information of the authorized recipient and doesn't construe to be any investment, legal or taxation advice to the investor. It is only for private circulation and use. The Research Report is based upon information that we consider reliable, but we do not represent that it is accurate or complete, and it should not be relied upon as such. No action is solicited on the basis of the contents of this Research Report. The Research Report should not be reproduced or redistributed to any other person(s)in any form without prior written permission of the SMC. The contents of this material are general and are neither comprehensive nor inclusive. Neither SMC nor any of its affiliates, associates, representatives, directors or employees shall be responsible for any loss or damage that may arise to any person due to any action taken on the basis of this Research Report. It does not constitute personal recommendations or take into account the particular investment objectives, financial situations or needs of an individual client or a corporate/s or any entity/s. All investments involve risk and past performance doesn't guarantee future results. The value of, and income from investments may vary because of the changes in the macro and micro factors given at a certain period of time. The person should use his/her own judgment while taking investment decisions.
Please note that SMC its affiliates, Research Analyst, officers, directors, and employees, including persons involved in the preparation or issuance if this Research Report: (a) from time to time, may have long or short positions in, and buy or sell the commodity thereof, mentioned here in or (b) be engaged in any other transaction involving such commodities and earn brokerage or other compensation or act as a market maker in the commodities discussed herein(c) may have any other potential conflict of interest with respect to any recommendation and related information and opinions. All disputes shall be subject to the exclusive jurisdiction of Delhi High court. All disputes shall be subject to the exclusive jurisdiction of Delhi High court.
Edible oil complex (International market fundamentals)Edible oil complex (International market fundamentals)
Source:Reuters&SMCResearchSource:CBOT Closingason12thJune,2018
Fundamentals
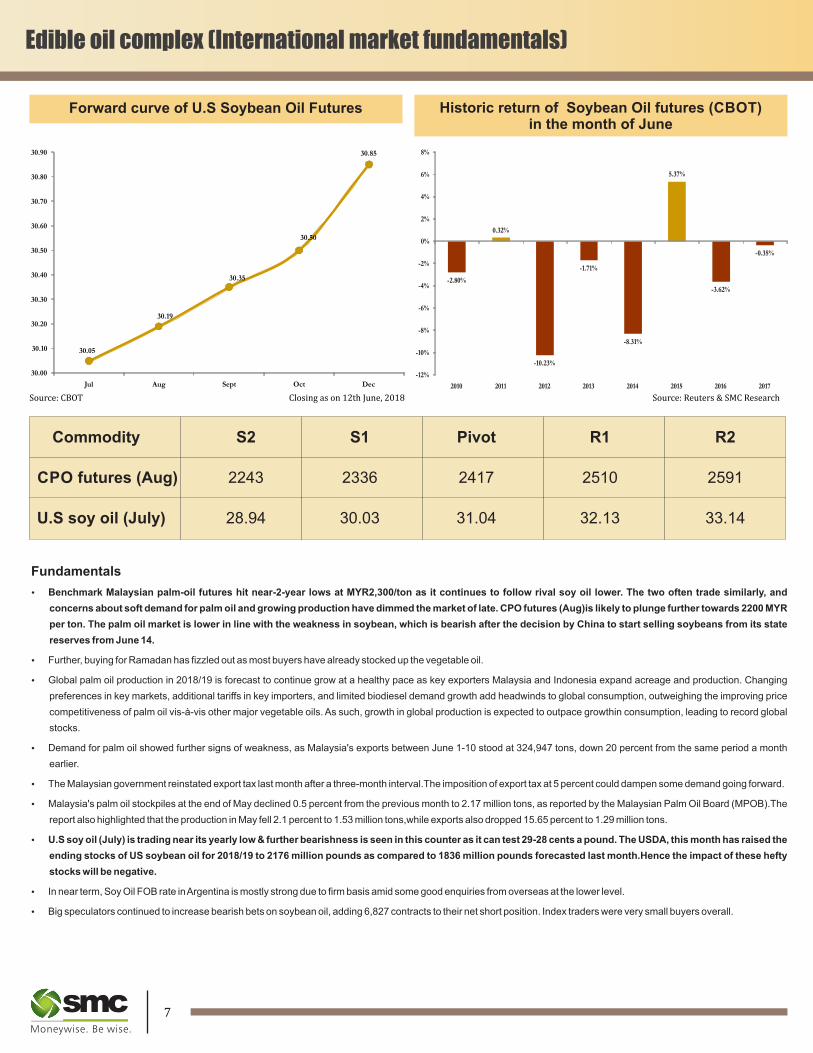
Ÿ Benchmark Malaysian palm-oil futures hit near-2-year lows at MYR2,300/ton as it continues to follow rival soy oil lower. The two often trade similarly, and
concerns about soft demand for palm oil and growing production have dimmed the market of late. CPO futures (Aug)is likely to plunge further towards 2200 MYR
per ton. The palm oil market is lower in line with the weakness in soybean, which is bearish after the decision by China to start selling soybeans from its state
reserves from June 14.
Ÿ Further, buying for Ramadan has fizzled out as most buyers have already stocked up the vegetable oil.
Ÿ Global palm oil production in 2018/19 is forecast to continue grow at a healthy pace as key exporters Malaysia and Indonesia expand acreage and production. Changing
preferences in key markets, additional tariffs in key importers, and limited biodiesel demand growth add headwinds to global consumption, outweighing the improving price
competitiveness of palm oil vis-à-vis other major vegetable oils. As such, growth in global production is expected to outpace growthin consumption, leading to record global
stocks.
Ÿ Demand for palm oil showed further signs of weakness, as Malaysia's exports between June 1-10 stood at 324,947 tons, down 20 percent from the same period a month
earlier.
Ÿ The Malaysian government reinstated export tax last month after a three-month interval.The imposition of export tax at 5 percent could dampen some demand going forward.
Ÿ Malaysia's palm oil stockpiles at the end of May declined 0.5 percent from the previous month to 2.17 million tons, as reported by the Malaysian Palm Oil Board (MPOB).The
report also highlighted that the production in May fell 2.1 percent to 1.53 million tons,while exports also dropped 15.65 percent to 1.29 million tons.
Ÿ U.S soy oil (July) is trading near its yearly low & further bearishness is seen in this counter as it can test 29-28 cents a pound. The USDA, this month has raised the
ending stocks of US soybean oil for 2018/19 to 2176 million pounds as compared to 1836 million pounds forecasted last month.Hence the impact of these hefty
stocks will be negative.
Ÿ In near term, Soy Oil FOB rate in Argentina is mostly strong due to firm basis amid some good enquiries from overseas at the lower level.
Ÿ Big speculators continued to increase bearish bets on soybean oil, adding 6,827 contracts to their net short position. Index traders were very small buyers overall.
Commodity S2 S1 Pivot R1 R2
CPO futures (Aug) 2243 2336 2417 2510 2591
U.S soy oil (July) 28.94 30.03 31.04 32.13 33.14
Historic return of Soybean Oil futures (CBOT)in the month of June
Forward curve of U.S Soybean Oil Futures
7 8
30.05
30.19
30.35
30.50
30.85
30.00
30.10
30.20
30.30
30.40
30.50
30.60
30.70
30.80
30.90
Jul Aug Sept Oct Dec
-2.80%
0.32%
-10.23%
-1.71%
-8.31%
5.37%
-3.62%
-0.35%
-12%
-10%
-8%
-6%
-4%
-2%
0%
2%
4%
6%
8%
2010 2011 2012 2013 2014 2015 2016 2017

SMC Global Securities Ltd. (hereinafter referred to as “SMC”) is regulated by the Securities and Exchange Board of India (“SEBI”) and is licensed to carry on the business of broking, depository services and related
activities. SMC is a registered member of National Stock Exchange of India Limited, Bombay Stock Exchange Limited, MSEI (Metropolitan Stock Exchange of India Ltd.) and M/s SMC Comtrade Ltd is a registered
member of National Commodity and Derivative Exchange Limited and Multi Commodity Exchanges of India and other commodity exchanges in India. SMC is also registered as a Depository Participant with CDSL and
NSDL. SMC’s other associates are registered as Merchant Bankers, Portfolio Managers, NBFC with SEBI and Reserve Bank of India. It also has registration with AMFI as a Mutual Fund Distributor.
SMC is a SEBI registered Research Analyst having registration number INH100001849. SMC or its associates has not been debarred/ suspended by SEBI or any other regulatory authority for accessing /dealing in
securities/commodities market.
The views expressed by the Research Analyst in this Report are based solely on information available publicly available/internal data/ other reliable sources believed to be true. SMC does not represent/ provide any
warranty expressly or impliedly to the accuracy, contents or views expressed herein and investors are advised to independently evaluate the market conditions/risks involved before making any investment decision. The
research analysts who have prepared this Report hereby certify that the views /opinions expressed in this Report are their personal independent views/opinions in respect of the subject commodity.
DISCLAMIER: This Research Report is for the personal information of the authorized recipient and doesn't construe to be any investment, legal or taxation advice to the investor. It is only for private circulation and use. The Research Report is based upon information that we consider reliable, but we do not represent that it is accurate or complete, and it should not be relied upon as such. No action is solicited on the basis of the contents of this Research Report. The Research Report should not be reproduced or redistributed to any other person(s)in any form without prior written permission of the SMC. The contents of this material are general and are neither comprehensive nor inclusive. Neither SMC nor any of its affiliates, associates, representatives, directors or employees shall be responsible for any loss or damage that may arise to any person due to any action taken on the basis of this Research Report. It does not constitute personal recommendations or take into account the particular investment objectives, financial situations or needs of an individual client or a corporate/s or any entity/s. All investments involve risk and past performance doesn't guarantee future results. The value of, and income from investments may vary because of the changes in the macro and micro factors given at a certain period of time. The person should use his/her own judgment while taking investment decisions.
Please note that SMC its affiliates, Research Analyst, officers, directors, and employees, including persons involved in the preparation or issuance if this Research Report: (a) from time to time, may have long or short positions in, and buy or sell the commodity thereof, mentioned here in or (b) be engaged in any other transaction involving such commodities and earn brokerage or other compensation or act as a market maker in the commodities discussed herein(c) may have any other potential conflict of interest with respect to any recommendation and related information and opinions. All disputes shall be subject to the exclusive jurisdiction of Delhi High court. All disputes shall be subject to the exclusive jurisdiction of Delhi High court.
Edible oil complex (International market fundamentals)Edible oil complex (International market fundamentals)
Source:Reuters&SMCResearchSource:CBOT Closingason12thJune,2018
Fundamentals
Ÿ Benchmark Malaysian palm-oil futures hit near-2-year lows at MYR2,300/ton as it continues to follow rival soy oil lower. The two often trade similarly, and
concerns about soft demand for palm oil and growing production have dimmed the market of late. CPO futures (Aug)is likely to plunge further towards 2200 MYR
per ton. The palm oil market is lower in line with the weakness in soybean, which is bearish after the decision by China to start selling soybeans from its state
reserves from June 14.
Ÿ Further, buying for Ramadan has fizzled out as most buyers have already stocked up the vegetable oil.
Ÿ Global palm oil production in 2018/19 is forecast to continue grow at a healthy pace as key exporters Malaysia and Indonesia expand acreage and production. Changing
preferences in key markets, additional tariffs in key importers, and limited biodiesel demand growth add headwinds to global consumption, outweighing the improving price
competitiveness of palm oil vis-à-vis other major vegetable oils. As such, growth in global production is expected to outpace growthin consumption, leading to record global
stocks.
Ÿ Demand for palm oil showed further signs of weakness, as Malaysia's exports between June 1-10 stood at 324,947 tons, down 20 percent from the same period a month
earlier.
Ÿ The Malaysian government reinstated export tax last month after a three-month interval.The imposition of export tax at 5 percent could dampen some demand going forward.
Ÿ Malaysia's palm oil stockpiles at the end of May declined 0.5 percent from the previous month to 2.17 million tons, as reported by the Malaysian Palm Oil Board (MPOB).The
report also highlighted that the production in May fell 2.1 percent to 1.53 million tons,while exports also dropped 15.65 percent to 1.29 million tons.
Ÿ U.S soy oil (July) is trading near its yearly low & further bearishness is seen in this counter as it can test 29-28 cents a pound. The USDA, this month has raised the
ending stocks of US soybean oil for 2018/19 to 2176 million pounds as compared to 1836 million pounds forecasted last month.Hence the impact of these hefty
stocks will be negative.
Ÿ In near term, Soy Oil FOB rate in Argentina is mostly strong due to firm basis amid some good enquiries from overseas at the lower level.
Ÿ Big speculators continued to increase bearish bets on soybean oil, adding 6,827 contracts to their net short position. Index traders were very small buyers overall.
Commodity S2 S1 Pivot R1 R2
CPO futures (Aug) 2243 2336 2417 2510 2591
U.S soy oil (July) 28.94 30.03 31.04 32.13 33.14
Historic return of Soybean Oil futures (CBOT)in the month of June
Forward curve of U.S Soybean Oil Futures
7 8
30.05
30.19
30.35
30.50
30.85
30.00
30.10
30.20
30.30
30.40
30.50
30.60
30.70
30.80
30.90
Jul Aug Sept Oct Dec
-2.80%
0.32%
-10.23%
-1.71%
-8.31%
5.37%
-3.62%
-0.35%
-12%
-10%
-8%
-6%
-4%
-2%
0%
2%
4%
6%
8%
2010 2011 2012 2013 2014 2015 2016 2017