Monthly report format - TransGraph...2016 OND 2016 JFM 2017 AMJ 2017P China Primary Aluminium...
22
TransGraph Research Consulting Technology Brands Agriculture Metals Energy Dairy Currency Economy
Transcript of Monthly report format - TransGraph...2016 OND 2016 JFM 2017 AMJ 2017P China Primary Aluminium...

TransGraph
Research Consulting Technology
Brands
Agriculture Metals Energy Dairy Currency Economy

Medium term outlook on Aluminium
July 2017
2

TransGraph
3 © TransGraph Consulting Pvt Ltd Slide
Market Recap
– LME Aluminium remained subdued to end marginally down as concerns of higher physical supplies amid increasing production levels weighed on prices
Major price drivers – Improvement in upstream raw material
supplies – Higher Aluminium production levels – Softness in physical premiums – Reports of capacity curtailment in China’s
Xinjiang region – Decline in LME stocks offset by rise in SHFE
& Physical stocks in China
1912 1936 1918 1894 1902 1931 1914 1887
2.11
1.28
-0.91-1.28
2.41
1.55
-0.87-1.44
Mar Apr May Jun Mar Apr May Jun
LME 3M LME CSP
LME Aluminium Price trend
Monthly Avg (USD per ton) M-o-M (%) Change
-9.05 -9.43
-10.58
-2.93
-5.45
-12
-10
-8
-6
-4
-2
0
Feb Mar Apr May Jun
LME Aluminium Cash - 3M Forward spread (usd/t)
TransGraph
4 © TransGraph Consulting Pvt Ltd Slide
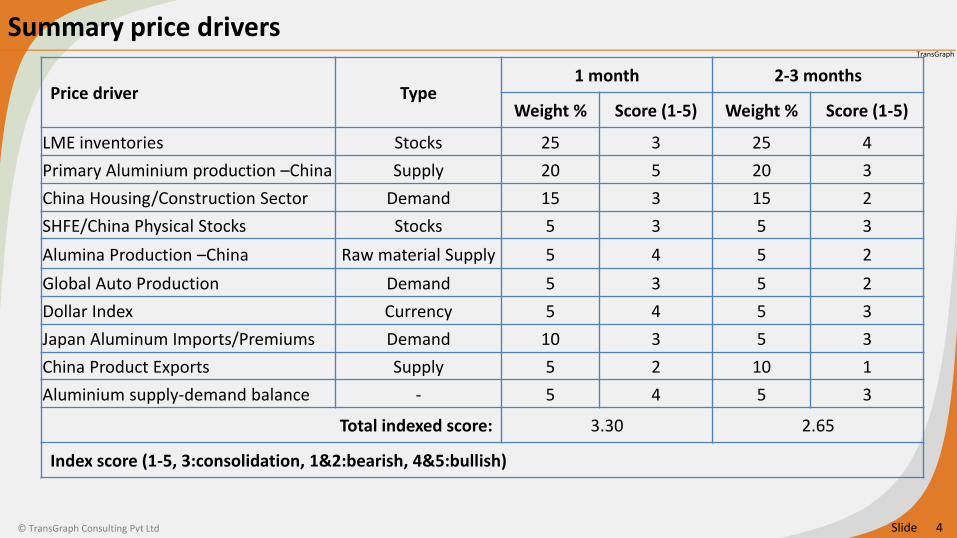
Summary price drivers
Price driver Type 1 month 2-3 months
Weight % Score (1-5) Weight % Score (1-5)
LME inventories Stocks 25 3 25 4
Primary Aluminium production –China Supply 20 5 20 3
China Housing/Construction Sector Demand 15 3 15 2
SHFE/China Physical Stocks Stocks 5 3 5 3
Alumina Production –China Raw material Supply 5 4 5 2
Global Auto Production Demand 5 3 5 2
Dollar Index Currency 5 4 5 3
Japan Aluminum Imports/Premiums Demand 10 3 5 3
China Product Exports Supply 5 2 10 1
Aluminium supply-demand balance - 5 4 5 3
Total indexed score: 3.30 2.65
Index score (1-5, 3:consolidation, 1&2:bearish, 4&5:bullish)
TransGraph
5 © TransGraph Consulting Pvt Ltd Slide
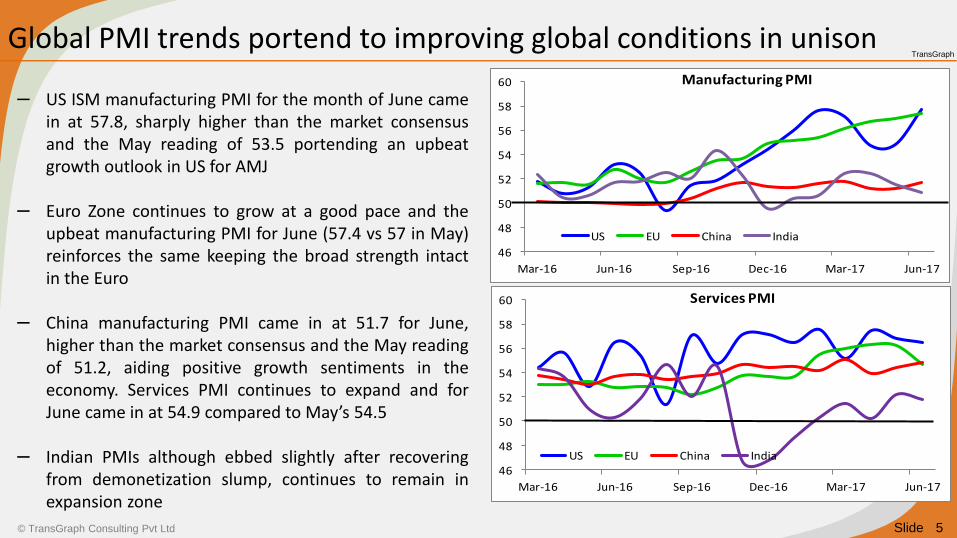
Global PMI trends portend to improving global conditions in unison
46
48
50
52
54
56
58
60
Mar-16 Jun-16 Sep-16 Dec-16 Mar-17 Jun-17
Manufacturing PMI
US EU China India
46
48
50
52
54
56
58
60
Mar-16 Jun-16 Sep-16 Dec-16 Mar-17 Jun-17
Services PMI
US EU China India
– US ISM manufacturing PMI for the month of June came in at 57.8, sharply higher than the market consensus and the May reading of 53.5 portending an upbeat growth outlook in US for AMJ
– Euro Zone continues to grow at a good pace and the upbeat manufacturing PMI for June (57.4 vs 57 in May) reinforces the same keeping the broad strength intact in the Euro
– China manufacturing PMI came in at 51.7 for June, higher than the market consensus and the May reading of 51.2, aiding positive growth sentiments in the economy. Services PMI continues to expand and for June came in at 54.9 compared to May’s 54.5
– Indian PMIs although ebbed slightly after recovering from demonetization slump, continues to remain in expansion zone

TransGraph
6 © TransGraph Consulting Pvt Ltd Slide
With personal consumption slowing retail inventories are on the rise in US
– Retail sales have declined but improvement witnessed in capacity utilization rates in the last few months led to building up of inventories which shall eventually lead to manufacturing slowdown in the coming months
– Auto sales remained subdued despite discounts from car makers underpinning the higher inventory levels at the dealer front
18.217.3
18.1 18.3 18.118.7
17.9 17.816.9 17.2 17.0 17.0
-6%
-4%
-2%
0%
2%
4%
6%
10
12
14
16
18
20 US Auto Sales
Total Sales - SAAR (Million Units) Growth YoY
1.85
1.90
1.95
2.00
2.05
2.10
2.15
2.20
2.25
2.30
1.22
1.24
1.26
1.28
1.30
1.32
1.34
Apr
-14
Jun-
14
Aug
-14
Oct
-14
Dec
-14
Feb-
15
Apr
-15
Jun-
15
Aug
-15
Oct
-15
Dec
-15
Feb-
16
Apr
-16
Jun-
16
Aug
-16
Oct
-16
Dec
-16
Feb-
17
Apr
-17
Inventory to sales ratio
Total retail Motor vehicle and parts
73.5
74.0
74.5
75.0
75.5
76.0
76.5
77.0 US capacity utilization rates (%)
Manufacturing industry Total industry

TransGraph
7 © TransGraph Consulting Pvt Ltd Slide
Housing demand remain strong but slowdown likely with increasing monetary costs and higher house prices
– Although sales declined marginally in April, broad strength in housing remained intact in the recent months amid benefits discounts from mortgage lenders
– However, with increasing monetary costs as FED continues to push ahead with its monetary tightening shall lead to credit tightness and is expected to result in slowing sales in the coming months
– In line with the same, even housing starts and build permits have been declining in the last few months underpinning the expected slowdown in US housing
0.570 0.577 0.579
0.548
0.5990.615
0.644
0.5930.610
3.0%
3.2%
3.4%
3.6%
3.8%
4.0%
4.2%
4.4%
0.40
0.45
0.50
0.55
0.60
0.65
0.70
Sep-16 Oct-16 Nov-16 Dec-16 Jan-17 Feb-17 Mar-17 Apr-17 May-17
US - Housing Market
New Homes Sold(SAAR mln units) 30 yr Mortage rate Avg(%)
1.291.26 1.27
1.30
1.221.26
1.23
1.17
1.33
1.15
1.271.24
1.29
1.191.16
1.09
Oct-16 Nov-16 Dec-16 Jan-17 Feb-17 Mar-17 Apr-17 May-17
US - Housing Market (SAAR mln units)
Building Permits Housing Starts
TransGraph
8 © TransGraph Consulting Pvt Ltd Slide
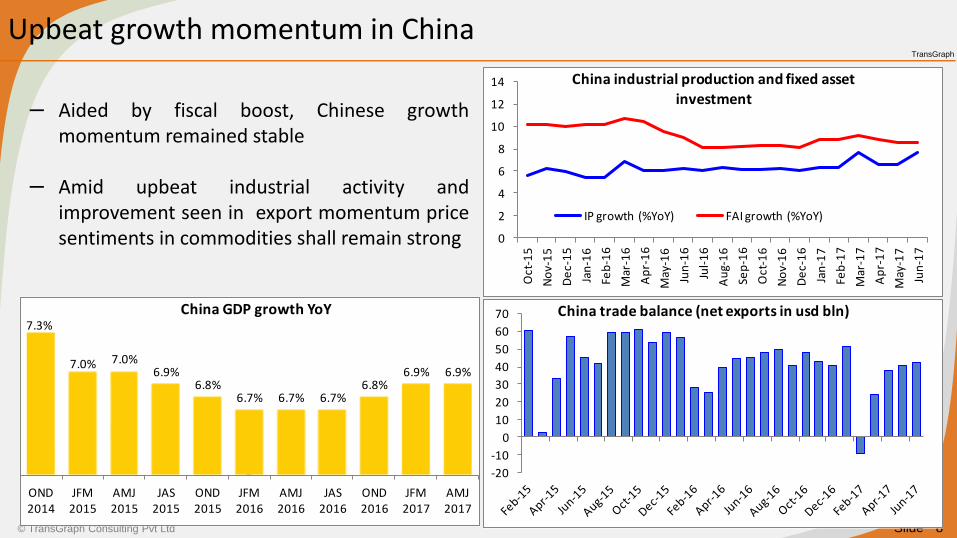
Upbeat growth momentum in China
– Aided by fiscal boost, Chinese growth momentum remained stable
– Amid upbeat industrial activity and improvement seen in export momentum price sentiments in commodities shall remain strong 0
2
4
6
8
10
12
14
Oct
-15
No
v-1
5
De
c-1
5
Jan
-16
Feb
-16
Mar
-16
Ap
r-1
6
May
-16
Jun
-16
Jul-
16
Au
g-1
6
Sep
-16
Oct
-16
No
v-1
6
De
c-1
6
Jan
-17
Feb
-17
Mar
-17
Ap
r-1
7
May
-17
Jun
-17
China industrial production and fixed asset
investment
IP growth (%YoY) FAI growth (%YoY)
-20
-10
0
10
20
30
40
50
60
70 China trade balance (net exports in usd bln)7.3%
7.0% 7.0%6.9%
6.8%6.7% 6.7% 6.7%
6.8%6.9% 6.9%
OND 2014
JFM 2015
AMJ 2015
JAS 2015
OND 2015
JFM 2016
AMJ 2016
JAS 2016
OND 2016
JFM 2017
AMJ 2017
China GDP growth YoY
TransGraph
9 © TransGraph Consulting Pvt Ltd Slide
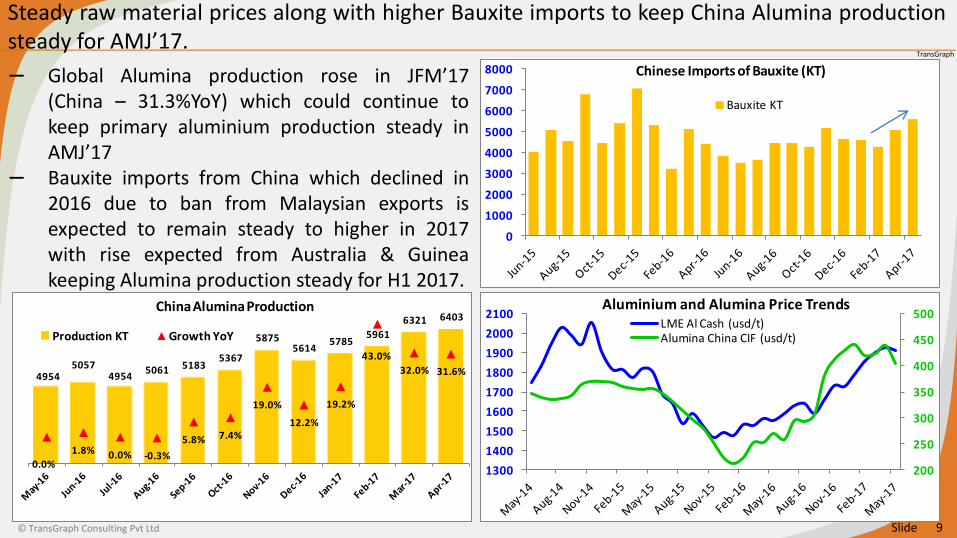
Steady raw material prices along with higher Bauxite imports to keep China Alumina production steady for AMJ’17.
– Global Alumina production rose in JFM’17 (China – 31.3%YoY) which could continue to keep primary aluminium production steady in AMJ’17
– Bauxite imports from China which declined in 2016 due to ban from Malaysian exports is expected to remain steady to higher in 2017 with rise expected from Australia & Guinea keeping Alumina production steady for H1 2017.
200
250
300
350
400
450
500
1300
1400
1500
1600
1700
1800
1900
2000
2100Aluminium and Alumina Price Trends
LME Al Cash (usd/t)Alumina China CIF (usd/t)
0
1000
2000
3000
4000
5000
6000
7000
8000 Chinese Imports of Bauxite (KT)
Bauxite KT
49545057
49545061 5183
5367
58755614
57855961
6321 6403
0.0%
1.8% 0.0% -0.3%
5.8% 7.4%
19.0%
12.2%
19.2%
43.0%
32.0% 31.6%
Production KT Growth YoY
China Alumina Production

TransGraph
10 © TransGraph Consulting Pvt Ltd Slide
Global Primary Aluminium production to slowdown but to remain in positive territory weighing on sentiments.
10
– Supply side reforms seen in China could lead to slowdown in production in upcoming quarters while it could still remain in positive territory weighing on sentiments for short term scenario.
– Stability seen in Alumina production for JFM’17 on steady prices could also keep primary Aluminium production steady weighing on sentiments.
8053 8174 7889 7170 7930 8123 8418 8191 8490
22%
18%
7%
-5%
-2% -1%
7%
14%
7%
-8%
-3%
2%
7%
12%
17%
22%
27%
6500
7000
7500
8000
8500
9000
AMJ
2015
JAS
2015
OND
2015
JFM
2016
AMJ
2016
JAS
2016
OND
2016
JFM
2017
AMJ
2017P
China Primary Aluminium Production
Production (KT) Growth Rate YoY
13360138391400114584 14754145511374214470 14778151431496115050
3.5%
6.0%
8.5%
12.0%10.4%
5.1%
-1.8%-0.8%
0.2%
4.1%
8.9%
4.0%
-4%
1%
6%
11%
16%
12000
12500
13000
13500
14000
14500
15000
15500
JAS
2014
OND
2014
JFM
2015
AMJ
2015
JAS
2015
OND
2015
JFM
2016
AMJ
2016
JAS
2016
OND
2016
JFM
2017
AMJ
2017P
Global Primary Aluminium ProductionProduction (KT) Growth Rate YoY

TransGraph
11 © TransGraph Consulting Pvt Ltd Slide
China New regulations set to potentially impact Aluminium capacities in H2 2017 leading to decline in production supporting sentiments.
– China's "Air Pollution Control" regulation was formally approved and came into effect during the first week of Mar’17.
– According to regulation, China government will force aluminium smelters in four provinces surrounding Beijing to cut output by 30 percent over the winter heating season, which runs from the middle of November through the middle of March.
– Estimated 20 - 30 percent of China's production capacity might be potentially impacted with a hit of around 1.3 - 1.5 million tonne on output which could again reduce surplus expectations from China for this year.
Aluminum Capacity in Shanxi, Hebei, Henan and Shandong (Source: SMM, Reuters, TG estimates)
Region
Capacity Built
(‘000 tons)
Idled
Capacity
(‘000 tons)
Operational
Capacity
(‘000 tons)
Shanxi 1040 45 995
Hebei 80 30 50
Henan 3840 1010 2830
Shandong 10950 270 10680

TransGraph
12 © TransGraph Consulting Pvt Ltd Slide
Stocks in China continues to remain higher to offset lower LME stocks
– With stocks in China seen surging during JFM’17 indicates traders delivering excess stocks which could also offset lower LME stocks weighing on sentiments.
0
100
200
300
400
500
8-J
ul
22
-Ju
l
5-A
ug
19
-Au
g
2-S
ep
16
-Se
p
30
-Se
p
14
-Oct
28
-Oct
11
-No
v
25
-No
v
9-D
ec
23
-De
c
6-J
an
20
-Jan
3-F
eb
17
-Fe
b
3-M
ar
17
-Mar
31
-Mar
14
-Ap
r
28
-Ap
r
12
-May
26
-May
SHFE Aluminium Stocks ('000 Tons)
Cancelled Warrant On Warrant
0
200
400
600
800
1000
1200
1400Aluminium inventory in Chinese physical markets ('000 tons)
Shanghai Wuxi Nanhai Others
Source: MySteel, Reuters
0
500
1000
1500
2000
2500
30
-Se
p
14
-Oct
28
-Oct
11
-No
v
25
-No
v
9-D
ec
23
-De
c
6-J
an
20
-Jan
3-F
eb
17
-Fe
b
3-M
ar
17
-Mar
31
-Mar
13
-Ap
r
28
-Ap
r
12
-May
26
-May
LME Aluminium Stocks ('000 tons)Asia USA Europe

TransGraph
13 © TransGraph Consulting Pvt Ltd Slide
Higher China stocks & arbitrage supporting Higher product exports
– With Arbitrage between Chanjiang & LME Spot market remaining negative since past few months along with higher production witnessed in China could lead to steady exports which could weigh on sentiments.
– Also with CNY remaining steady after depreciation seen during OND’16 could remain favourable for exports weighing on sentiments.
2711
24662476
26272680
2800
H1 H2
China Aluminium product exports (KT)
2015 2016 2017
400
300
200
100
0
100
200Aluminium Arbitrage (Changjiang - LME) USD/T
Arbritrage remaining negative since Dec'16 could continue to favour exports
6.4
6.5
6.6
6.7
6.8
6.9
7.0
11
-May
-16
30
-May
-16
18
-Ju
n-1
6
7-J
ul-
16
26
-Ju
l-1
6
14
-Au
g-1
6
2-S
ep
-16
21
-Se
p-1
6
10
-Oct
-16
29
-Oct
-16
17
-No
v-1
6
6-D
ec-
16
25
-De
c-1
6
13
-Jan
-17
1-F
eb
-17
20
-Fe
b-1
7
11
-Mar
-17
30
-Mar
-17
18
-Ap
r-1
7
7-M
ay-1
7
26
-May
-17
USD/CNY
CNY

TransGraph
14 © TransGraph Consulting Pvt Ltd Slide
Japanese Aluminium Demand remains strong
0
50
100
150
200
250
300
350
400
450
500
550
600
650
700
750
800
850 Japan AL imports vs CIF premiums
Imports KT Premiums (usd/t)
0
50
100
150
200
250
300
350
400
450
500
Sep
-15
Oct
-15
No
v-1
5
De
c-1
5
Jan
-16
Feb
-16
Mar
-16
Ap
r-1
6
May
-16
Jun
-16
Jul-
16
Au
g-1
6
Sep
-16
Oct
-16
No
v-1
6
De
c-1
6
Jan
-17
Feb
-17
Mar
-17
Ap
r-1
7
Aluminium stocks at Japanese ports (KT)
809 825
1213 1214
825 854
1196 1174
891 910
1170 1170
H1 H2 H1 H2
Transportation Others
Japan Aluminium Demand (KT)
2015 2016 2017

TransGraph
15 © TransGraph Consulting Pvt Ltd Slide
Global automobile sector prospects – Auto demand to remain lower in China on reduced tax incentive partially offset by steady demand from Europe during H2 2017
– Auto sales in China is expected to slowdown during H2 2017 after double digit growth witnessed in same period a year ago on reduced tax incentives from government.
– Decline in China auto demand could be partially offset by steady demand in Europe & U.S during H2 2017.
5%11%
18%
9%3%
19%25%
-2%
49%
10% 6%12%
32%29%
38%
20%18% 14%
-4%
32%
2%
-3%-10%
0%
10%
20%
30%
40%
50%
60%China automobile production growth (YoY %)
Commercial vehicles Passenger vehicles
6584 6284 64818382 7133 6520
2389 2105 2248
23952536
2170
1550 1644 1510
14811505
1695
3083 3156 2973
30183082
3125
0
5000
10000
15000
JFM 2016 AMJ 2016 JAS 2016 OND 2016 JFM 2017 AMJ 2017P
Automobile Production in Major Markets (000 units)
China Japan Germany US

TransGraph
16 © TransGraph Consulting Pvt Ltd Slide
Increasing government curbs to control housing prices growth indicated by declining investments to weigh on sentiments.
– China increased average interest rate for first-
time homebuyers to 4.52% in April in cities
around China, up from 4.49% from a year
earlier and was the fourth consecutive monthly
rate hike since January.
– With China witnessing declining Investment
growth in Fixed Assets into Construction sector
during JFM’17 could continue to weigh on
sentiments for Aluminium.
12.40%
-10.00%
-5.00%
0.00%
5.00%
10.00%
15.00%
Ap
r-1
1
Au
g-1
1
De
c-1
1
Ap
r-1
2
Au
g-1
2
De
c-1
2
Ap
r-1
3
Au
g-1
3
De
c-1
3
Ap
r-1
4
Au
g-1
4
De
c-1
4
Ap
r-1
5
Au
g-1
5
De
c-1
5
Ap
r-1
6
Au
g-1
6
De
c-1
6
Ap
r-1
7
Chinese house price Growth rate (YoY %)
-60%
-40%
-20%
0%
20%
40%
60%
80%
100%
120%
140%
Jul-
08
De
c-0
8
May
-09
Oct
-09
Mar
-10
Au
g-1
0
Jan
-11
Jun
-11
No
v-1
1
Ap
r-1
2
Sep
-12
Feb
-13
Jul-
13
De
c-1
3
May
-14
Oct
-14
Mar
-15
Au
g-1
5
Jan
-16
Jun
-16
No
v-1
6
Ap
r-1
7
Accumulated Growth rate in Construction Investment
Growth Rate(YoY%)

TransGraph
17 © TransGraph Consulting Pvt Ltd Slide
Aluminium – Effective Balance Sheet
Description 2015 2016 E 2017 P
Aluminium Production 57.90 58.13 60.38
Aluminium Consumption 56.03 58.49 60.96
P-C Balance 1.87 -0.36 -0.58
Ending Stocks (Producer) 2.37 2.41 2.70
Ending Stocks (Exchange) 3.19 2.65 3.25
No. of Weeks of Consumption
5.26 4.42 4.97
Source: IAI, Reuters, TG Estimates, * All figures are in Million tons unless mentioned otherwise
-0.113
1.873
-0.361 -0.580
5.695.16
4.505.08
2014 2015 2016E 2017P
Global Aluminium P-C balance
Production surplus / deficit (Mln Tons) No. of Weeks of Consumption
15.10 14.41 16.45 15.60 15.60 14.23 16.7513.80
13.11 14.3613.17 14.11 15.10
14.8215.70
15.34
0
5
10
15
20
25
30
35
Prod. Cons. Prod. Cons. Prod. Cons. Prod. Cons.
H1 2016 H2 2016 p H1 2017p H2 2017p
Global Aluminium Supply and demand
China RoW
28.21 28.78 29.62 29.71 30.70 29.0532.45
29.14
All Units in Million Tons

Technical Analysis
18

TransGraph
19 © TransGraph Consulting Pvt Ltd Slide
LME Aluminum SELECT 3 – Month Forward Elliott wave analysis
LME Aluminium 3-Month Forwards prices have culminated primary wave “Y” at USD 1430 and is trading higher as primary wave “A”. Prices after posting Intermediate Wave [Y] at USD 1981 is unfolding lower as a 3-Wave structure and has potential towards USD 1850 to 1800 ahead of turning positive again towards USD 2000 to 2050 in the coming 2 to 3 months.

TransGraph
20 © TransGraph Consulting Pvt Ltd Slide
LME Aluminum SELECT 3 – Month Forward
LME Aluminium prices are holding above trend based support line and hence likely to continue trading upward towards USD 1970 to 2020 by
staying above USD 1850 in the coming 2-3 months ahead of turning negative again.

TransGraph
21 © TransGraph Consulting Pvt Ltd Slide
Price outlook summary
21
Commodity Last Closing
(USD/ton) (as on July 14, 2017)
Price outlook summary for next 2-3 months
Range Direction
LME Aluminium 3-
month forward 1926 1800 – 2050
Aluminium 3 month forward prices are likely to move higher towards USD 2020 ahead of turning lower again towards USD 1850 or lower in the coming 2-3 months.
Note: Weekly close above USD 2020 would negate the subsequent downside potential and current gains can stretch higher towards USD 2120 for the same time period.

Talk to us on: +91-40-46619999 Schedule an interaction: Research Queries: [email protected] Sales: [email protected] TransRisk software: [email protected] More info: www.transgraph.com | www.transrisk.net
Thanking you for your attention.
LEGAL INFORMATION This document is the whole property of TransGraph Consulting Private Limited, Hyderabad, India (hereafter “TransGraph”). The following acts are strictly prohibited: Reproduction and/or forwarding for sale or any other uses Posting on any communication medium Transmittal via the Internet Terms of usage Upon receipt of this document either directly or indirectly, it is understood that the user will and must fully comply with the other terms and conditions of TransGraph. By accepting this document the user agrees to be bound by the foregoing limitations. This publication is prepared by TransGraph and protected by copyright laws. Unless otherwise noted in the Service Agreement, the entire contents of this publication are copyrighted by TransGraph, and may not be reproduced, stored in another retrieval system, posted on any communication medium, or transmitted in any form or by any means without prior written consent of TransGraph. Unauthorized reproduction or distribution of this publication, or any portion of it, may result in severe civil and criminal penalties, and will be prosecuted to the maximum extent necessary to protect the rights of TransGraph. The information and opinions contained in this report have been obtained from sources TransGraph believed to be reliable, but no representation or warranty, express or implied, is made that such information is accurate or complete and it should not be relied upon as such. This report does not constitute a prospectus or other offering document or an offer or solicitation to buy or sell any assets (commodities, currencies, etc) or other investment. Information and opinions contained in the report are published for the assistance of recipients, but are not to be relied upon as authoritative or taken in substitution for the exercise of judgment by any recipient; they are subject to change without any notice and not intended to provide the sole basis of any evaluation of the instruments discussed herein. Any views expressed reflect the current views of the analysts, which do not necessarily correspond to the opinions of TransGraph or its affiliates. Opinions expressed may differ from views set out in other documents, including research, published by TransGraph. Any reference to past performance should not be taken as an indication of future performance. No member in the public related to TransGraph accepts any liability whatsoever for any direct or consequential loss arising from any use of material contained in this report. Analyst Certification Each analyst responsible for the preparation of this report certifies that (i) all views expressed in this report accurately reflect the analyst's views about any and all of the factors and assets (commodities, currencies, etc) named in this report, and (ii) no part of the analyst's compensation is directly or indirectly, related to the execution of the specific recommendations or views expressed herein. Copyright © TransGraph Consulting Private Limited, Hyderabad, India.
TransGraph Consulting Private Limited 6C/A, Melange Towers, Sy.No.80-84, Hitech City, Hyderabad – 500081, India Locate TransGraph
Click here Click here
Click here
22