· PDF fileOPEC Monthly Oil Market Report – September 2015 1 Oil market highlights Crude...
106
Monthly Oil Market Report OPEC 14 September 2015 Feature article: Review of developments in the world economy Oil market highlights Feature article Crude oil price movements Commodity markets World economy World oil demand World oil supply Product markets and refinery operations Tanker market Oil trade Stock movements Balance of supply and demand 1 3 5 11 16 34 44 68 75 79 87 95
-
Upload
nguyenkhuong -
Category
Documents
-
view
216 -
download
2
Transcript of · PDF fileOPEC Monthly Oil Market Report – September 2015 1 Oil market highlights Crude...
Monthly Oil Market ReportO P E C
14 September 2015
Feature article:Review of developments in the world economy
Oil market highlights
Feature article
Crude oil price movements
Commodity markets
World economy
World oil demand
World oil supply
Product markets and refi nery operations
Tanker market
Oil trade
Stock movements
Balance of supply and demand
1
3
5
11
16
34
44
68
75
79
87
95

Organization of the Petroleum Exporting Countries
Helferstorferstrasse 17, A-1010 Vienna, AustriaE-mail: [email protected]: www.opec.org
OPEC Monthly Oil Market Report – September 2015 1
Oil market highlights Crude Oil Price Movements The OPEC Reference Basket fell below $50/b in August to average $45.46/b, mostly attributed to sell-offs amid enduring oversupply and Chinese economic turbulence. Crude oil futures plunged sharply again to multi-month lows, with ICE Brent ending at $48.21/b and Nymex WTI at $42.89/b. Speculators continued to be bearish in August with net-long positions in oil futures and options at record lows. The Brent-WTI spread narrowed about 52¢ to $5.32/b in August.
World Economy World economic growth has been revised down to 3.1% for 2015 and to 3.4% for 2016. While OECD growth remains unchanged at 2.0% for 2015 and 2.1% in 2016, major emerging economies are increasingly facing challenges. China’s and India’s growth forecasts have been revised down by 0.1 percentage points to now stand at 6.8% and 6.4% for China and at 7.4% and 7.6% for India in 2015 and 2016, respectively.
World Oil Demand In 2015, world oil demand growth is expected to be around 1.46 mb/d after an upward revision of around 84 tb/d, mainly to reflect better-than-expected data from OECD region. In 2016, world oil demand is anticipated to rise by 1.29 mb/d after a downward revision of around 50 tb/d.
World Oil Supply Non-OPEC oil supply is expected to grow by 0.88 mb/d in 2015, following a downward revision of around 72 tb/d, due to lower-than-expected output in the US. In 2016, non-OPEC oil supply is expected to increase slightly by 0.16 mb/d, a downward revision of 110 tb/d from the previous report. OPEC NGLs are expected to grow by 0.19 mb/d in 2015 and 0.17 mb/d in 2016. In August, OPEC crude production averaged 31.54 mb/d, according to secondary sources.
Product Markets and Refining Operations Product markets in the Atlantic Basin showed a mixed performance. Bearish sentiment, fueled by the approaching end of the driving season, caused US refinery margins to drop, while in Europe, margins remained healthy on the back of some recovery in the middle of the barrel. Asian margins showed a slight recovery in middle distillates on strong regional demand amid some run cuts, partially easing concerns over product oversupply.
Tanker Market Bearish sentiment dominated the dirty tanker market in August with freight rates for VLCCs, Suezmax and Aframax registering a drop from the previous month. Freight rates declined, mainly as a result of tonnage availability while tonnage demand remains limited. Average clean tanker freight rates were down, mainly on the back of lower freight rates and market activity in west of Suez. In August, OPEC spot fixtures rose to average 12.20 mb/d, and OPEC sailings increased to stand at 24.11 mb/d.
Stock Movements OECD commercial oil stocks rose further in July to stand at 2,925 mb. At this level, they were 202 mb higher than the latest five-year average, with crude and products indicating a surplus of around 163 mb and 39 mb, respectively. In terms of days of forward cover, OECD commercial stocks stood at 63.3 days, 4.8 days above the latest five-year average.
Balance of Supply and Demand Demand for OPEC crude is estimated at 29.3 mb/d in 2015, 0.1 mb/d higher than the previous assessment and up by 0.4 mb/d from the previous year. In 2016, required OPEC crude is projected at 30.3 mb/d, 0.2 mb/d higher than the previous month’s assessment, and around 1.0 mb/d above the estimated level of this year.

2 OPEC Monthly Oil Market Report – September 2015

OPEC Monthly Oil Market Report – September 2015 3
Review of developments in the world economy The trend of the past years’ moderate global growth is likely to continue. Recent world economic developments have caused the GDP growth forecast to be revised lower to stand at 3.1% in 2015 and it is expected to rise only modestly to 3.4% in 2016. While the group of emerging and developing economies has been the main growth engine in recent years, it has become clear that growth in this group is slowing down. OECD economies are holding up well and are forecast to grow by 2.0% in the current year and by 2.1% in 2016 (Graph 1). While upside potential remains, the many uncertainties in the global economy in the current and next year have skewed the growth risk slightly to the downside. Nevertheless, global oil-demand growth, benefitting also from low oil prices has strengthened since the initial forecast, which may continue for the remainder of the year (Graph 2). Graph 1: Real GDP growth forecast,% (2011 ppp)
Graph 2: Revisions to global oil demand 2015 since initial forecast
Within the OECD group of countries, growth in the US is forecast to remain solid, with improvements in the labour market to continue. Consequently, US GDP growth has been revised up to 2.5% from 2.4% previously. Low productivity and recently lower industry utilization rates, however, remain a drag on the economy. Moreover, the expectation of reaching the federal government’s debt ceiling towards the end of the year will, as in the past, pose some uncertainty to the economy. In the Euro-zone, growth was slightly softer than expected in the past months and while the recovery continues, the region’s ongoing sovereign debt issues and elections in some important economies raise uncertainty for the region. In addition, the slowing growth trend in China may also impact the Euro-zone’s two largest exporters, Germany and France. This is also applicable to Japan, which has close trading ties with China, and which has led to a downward revision of Japan’s 2015 GDP growth from 1.2% previously, to now stand at 0.8%. Moreover, the necessity of Japan to continue improving its debt situation may lead to repeated tax increases in the coming year, which may dampen economic growth again. Of the four major emerging economies, Brazil and Russia are in recession this year and Brazil’s GDP is forecast to contract in 2016. While China continues to grow, it is forecast to grow at a slower pace of 6.8% in 2015 and 6.4% in 2016. So far signs of China recently moving towards a floating exchange rate regime, along with the past weeks’ stock market developments, have not severely impacted the real economy. However, overcapacity, capital outflows and new financial market movements are more likely to impact China’s economy. India, on the other hand, constitutes an exception, as growth is forecast to rise in 2016 to 7.6% from 7.4% in the current year, while 2Q15 growth has been lower than expected. All in all, the importance of monetary decisions will also play a key-role in the near future. The decision of the US Fed regarding the timing and the magnitude of an interest rate hike may turn out to be an important factor for the global economy – particularly, as the ECB and the BoJ, and, recently, China’s central bank, embark on a different strategy, i.e. increasing monetary support. This, together with the uncertainties about China’s growth level has had a significant impact on currency markets, especially on emerging market currencies, which ultimately affect the oil-market. Despite moderate economic growth, recent data shows better-than-expected oil-demand in the main consuming countries. This is mainly driven by lower oil prices. At the same time, US oil production has shown signs of slowing. This could contribute to a reduction in the imbalance of oil market fundamentals, however, it remains to be seen to what extent this can be achieved in the months to come.
2.8
0.8-0.3
7.66.4
2.11.2
1.52.6
3.4
1.8
-3.0-2.0
7.46.8
2.00.8
1.32.5
3.1
-4 -2 0 2 4 6 8OPEC
RussiaBrazilIndia
China
OECDJapan
Euro-zoneUS
Globe2015*
2016*
* Forecast.Source: OPEC.
1.00
1.10
1.20
1.30
1.40
1.50
Jul 1
4
Aug
14
Sep
14
Oct
14
Nov
14
Dec
14
Jan
15
Feb
15
Mar
15
Apr
15
May
15
Jun
15
Jul 1
5
Aug
15
Sep
15
mb/d
Source: OPEC.

4 OPEC Monthly Oil Market Report – September 2015

Crude Oil Price Movements
OPEC Monthly Oil Market Report – September 2015 5
Crude Oil Price Movements For the third month in a row, the OPEC Reference Basket (ORB) fell to reach near-January lows, a trend seen during the financial crisis six year ago. The drop occurred amid numerous fundamental and non-fundamental factors, with enduring oversupply and the slowdown in the Chinese economy having the largest effect. The ORB lost over 15% m-o-m and ended below $50/b. It dropped $8.73 to stand at $45.46/b and y-t-d remained significantly lower at $53.81/b from the previous year. Crude oil futures on both sides of the Atlantic fell again to multi-month lows, taking ICE Brent below $50/b and Nymex WTI into the low $40/b’s. ICE Brent settled down $8.56 or 15.1% to stand at $48.21/b. Nymex WTI dropped by $8.04 or 15.8% to $42.89/b. Compared with a year ago, both remain significantly lower at year-to-date values of $51.71/b and $57.63/b, respectively. Speculators were extremely bearish again in August as crude prices slipped by more than 15%, and net long positions in oil futures and options stood at record lows. The Brent premium over WTI decreased slightly over the month; both suffering from oversupply, increases in crude oil inventories and slower demand as the market moved off the high-gasoline-demand driving season. The Brent-WTI spread narrowed by about 52¢ from $5.83/b in July to $5.32/b in August. OPEC Reference Basket The ORB plummeted for the third consecutive month, ending August at a level near that seen earlier in the year and during the financial crisis six years ago. It lost over a hefty 15% m-o-m and was below the $50/b mark for the first time since January. The sharp fall in the Basket value took place amid numerous fundamental and non-fundamental factors, with ongoing oversupply in the oil market and a greater-than-expected slowdown in the Chinese economy having the largest effect. The sharp rise in crude oil inventories, production increases and the start of maintenance season in major refining centers also contributed to the decline in oil prices. The oil market, along with most commodities, witnessed a significant drop following a steep retreat in global equity markets. On a monthly basis, the OPEC Reference Basket fell a hefty $8.73 or 16.1% to stand at $45.46/b, on average in August. Year-to-date, the ORB’s value continues to lag at $53.81/b versus the $104.78/b year-to-date value in 2014. Graph 1.1: Crude oil price movement, 2015
40
45
50
55
60
65
70
303540455055606570
01 A
pr
08 A
pr
15 A
pr
22 A
pr
29 A
pr
06 M
ay
13 M
ay
20 M
ay
27 M
ay
03 J
un
10 J
un
17 J
un
24 J
un
01 J
ul
08 J
ul
15 J
ul
22 J
ul
29 J
ul
05 A
ug
12 A
ug
19 A
ug
26 A
ug
02 S
ep
09 S
ep
US$/bUS$/b
OPEC Basket WTI Brent Dated

Crude Oil Price Movements
6 OPEC Monthly Oil Market Report – September 2015
Table 1.1: OPEC Reference Basket and selected crudes, US$/b
All oil benchmarks dropped in August, with the spot value of Dated Brent, Dubai and WTI down $9.82/b, $8.28/b and $8.40/b, respectively. On the other hand, the price differentials for Dated Brent-related crudes, particularly from West Africa, improved as the oversupply cleared over the month amid open arbitrage opportunities to Asia and the US and as low differentials made these grades attractive. The Middle East market also witnessed sharp improvement despite weak oil fundamentals, particularly regarding refining margins and seasonal demand. Aggressive buying by Chinese traders in the Platts price assessment window caused the Dubai market structure to flip into backwardation. The flurry of activity was thought to signify heathy prompt oil demand, but this turned out not to be the case. Brent-related West and North African light sweet Basket components, Saharan Blend, Es Sider, Girassol and Bonny Light decreased in value on average by $9.41/b or 16.7% to $46.87/b in August. Middle Eastern spot components and multi-destination grades deteriorated by $8.57 and $8.60 to stand at $47.91/b and $45.59/b, respectively. Regarding Latin American ORB components, Merey was down $9.17/b or 20.6%, while Oriente plunged $8.03/b or 16.8%. Moreover, for the first time since the beginning of the year, all Basket components were below $50/b. On 11 September, the OPEC Reference Basket dropped to stand at $44.64/b, 82¢ under the August average.
ChangeJul 15 Aug 15 Aug/Jul 2014 2015
OPEC Reference Basket 54.19 45.46 -8.73 104.78 53.81 Arab Light 54.95 46.52 -8.43 105.70 54.19 Basrah Light 53.10 44.32 -8.78 102.80 52.17 Bonny Light 56.77 47.07 -9.70 109.85 56.98 Es Sider 55.54 45.82 -9.72 107.29 55.29 Girassol 56.46 47.42 -9.04 108.11 57.13 Iran Heavy 54.86 46.25 -8.61 104.85 53.29 Kuwait Export 53.85 45.28 -8.57 103.89 52.59 Marine 55.36 46.98 -8.38 104.79 55.17 Merey 44.43 35.26 -9.17 94.65 46.02 Murban 57.58 48.83 -8.75 108.01 57.93 Oriente 47.78 39.75 -8.03 94.93 48.79 Saharan Blend 56.34 47.17 -9.17 108.50 56.53Other Crudes Brent 56.54 46.72 -9.82 107.73 56.36 Dubai 56.15 47.87 -8.28 104.95 55.53 Isthmus 55.62 46.56 -9.06 100.63 54.82 LLS 54.69 47.07 -7.62 104.55 56.16 Mars 50.16 42.52 -7.64 100.43 52.38 Minas 51.86 42.46 -9.40 108.48 54.04 Urals 55.84 46.22 -9.62 106.61 56.08 WTI 51.17 42.77 -8.40 100.59 51.68Differentials Brent/WTI 5.37 3.95 -1.42 7.14 4.67 Brent/LLS 1.85 -0.35 -2.20 3.18 0.19 Brent/Dubai 0.39 -1.15 -1.54 2.78 0.82
Year-to-date
Note: Arab Light and other Saudi Arabian crudes as well as Basrah Light preliminarily based on AmericanCrude Market (ACM) and subject to revision.
Sources: Platt's, Direct Communication and Secretariat's assessments.

Crude Oil Price Movements
OPEC Monthly Oil Market Report – September 2015 7
The oil futures market Crude oil futures plunged sharply for two months in a row to multi-month lows, taking ICE Brent to below $50/b and Nymex WTI to near $40/b. Both futures lost over 15% of their m-o-m values in August. This happened again in an aggressive sell-off of oil futures over the month amid pressure from economic turmoil in China, the second-largest oil consuming nation, persistent global crude surplus, increasing production, rising inventories and an equity market crisis. Looming typically low seasonal demand was also a factor in the record futures drop. The deal over IR Iran’s nuclear programme, which will eventually lead to an end to sanctions and a rise in Iranian crude exports, cast a bearish factor on the market as did bearish speculative and non-speculative activities. Speculators cut their bullish bets on WTI to the lowest level in five years. In August, ICE Brent settled down $8.56 or 15.1% to reach $48.21/b. Nymex WTI went down $8.04 or 15.8%, settling at $42.89/b. Year-to-date, compared with 2014, Nymex WTI and Brent were $48.75 and $50.45 lower at $51.71/b and $57.63/b, respectively. Crude oil futures prices deteriorated further in the second week of September. On 11 September, ICE Brent stood at $48.14/b and Nymex WTI at $44.63/b. Hedge funds and other money managers continued to be extremely bearish in August as crude prices slipped by more than 15% over the month. Net long positions in West Texas Intermediate remained unchanged from the previous month when they dropped by more than 50%, US Commodity Futures Trading Commission (CFTC) data showed. Long positions continued to stay at two-year lows, while short holdings climbed by 5,325 lots to 157,094 contracts. CFTC data showed the net length of money managers in Nymex WTI futures and options to be at 99,179 contracts by the end of August. Speculators were very bearish in the ICE Brent market as net long positions in ICE Brent futures and options dropped by a hefty 34,520 contracts to 141,382 lots, InterContinental Exchange (ICE) data showed. Short positions were up 25,215 lots to 122,460 contracts. On the other hand, total futures and options open interest volume in the two markets added another 171,919 contracts to reach 5.08 million contracts. Graph 1.2: Nymex WTI price vs. speculative activity, 2014-2015
Graph 1.3: ICE Brent price vs. speculative activity, 2014-2015
50
100
150
200
250
300
350
30405060708090
100110
Aug
14Se
p 14
Oct
14
Nov
14
Dec
14
Jan
15Fe
b 15
Mar
15
Apr 1
5M
ay 1
5Ju
n 15
Jul 1
5Au
g 15
US$/b
Managed money net long positions (RHS)WTI (LHS)
'000 Contracts
Source: CFTC.
050100150200250300350
30405060708090
100110
Aug
14Se
p 14
Oct
14
Nov
14
Dec
14
Jan
15Fe
b 15
Mar
15
Apr 1
5M
ay 1
5Ju
n 15
Jul 1
5Au
g 15
US$/b
Managed money net long positions (RHS)ICE Brent (LHS)
'000 Contracts
Source: IntercontinentalExchange, Inc.
Crude Oil Price Movements
8 OPEC Monthly Oil Market Report – September 2015
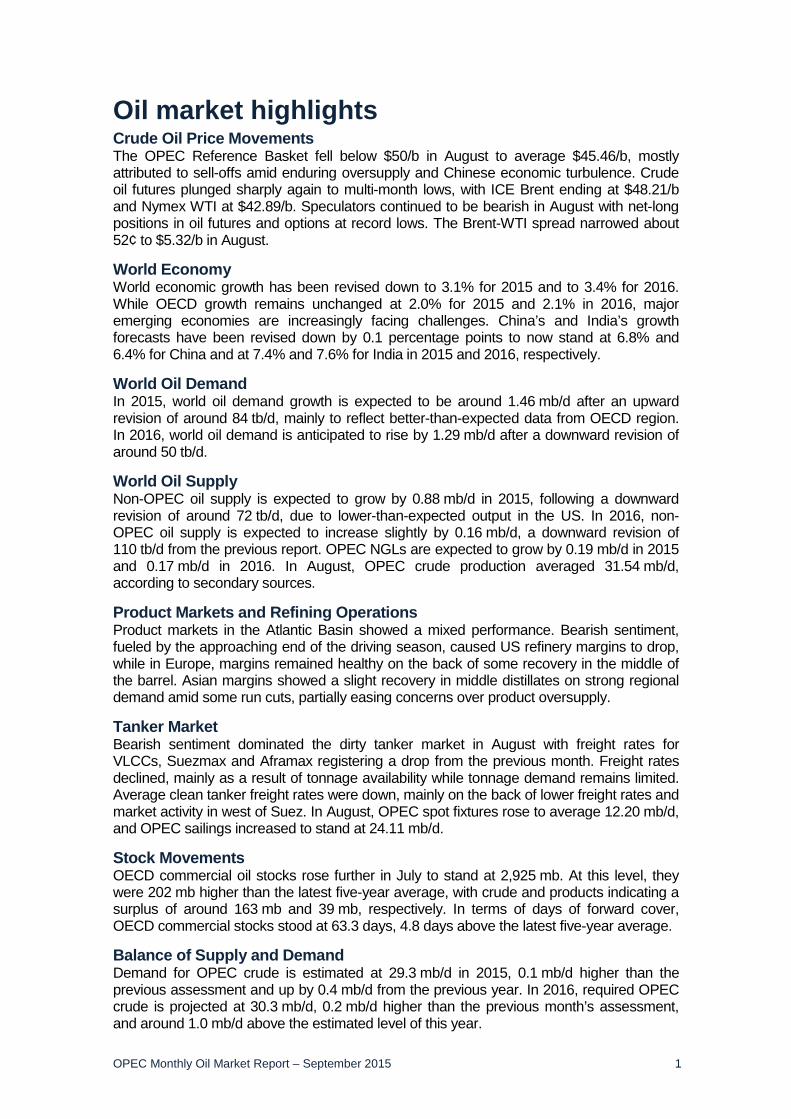
The daily average traded volume during August for Nymex WTI contracts increased by a sharp 238,568 lots or 35% to average 914,143 contracts, and ICE Brent daily traded volume rose 63,257 contracts to 765,720 lots. The daily aggregate traded volume in both crude oil futures markets increased by 301,825 lots to around 1.7 million futures contracts, equivalent to around 1.7 billion b/d. The total traded volume in Nymex WTI was up sharply to 19.20 million contracts, while ICE Brent was lower at 16.08 million lots. The futures market structure The contango structure in WTI and Brent markets deepened further in August m-o-m, while the Dubai market flipped into an artificial backwardation for a second month. In the Brent market, the contango widened by 35¢, with (M1-M3) at $1.40/b against a backdrop of ample supplies and bearish market sentiment. The prompt market has come under hefty pressure, from a lack of fixtures to Asia and from a rise in output from the Buzzard oilfield to the highest level this year. Pressure also emerged from upcoming maintenance in Europe and Asia. Graph 1.4: Nymex WTI and ICE Brent forward curves, 2015
The WTI contango widened by 55¢, where (M1-M3) increased to $1.80/b amid consecutive weeks of crude stock builds in the US, particularly at Cushing, Oklahoma, due to an unplanned outage of the largest US midcontinent refinery, BP Whitening refinery, with a capacity of 400 tb/d. Also, a surge in crude imports by almost 500 tb/d contributed to this build. Meanwhile, the Middle East crude market structure, as represented by Dubai, strengthened significantly over the month with the spread deepening its backwardation. Aggressive buying by Chinese companies in the Platts pricing assessment window was the key contributor to this trend. This has caused Dubai to be unusually above Brent by 80¢/b m-o-m. Beyond this, as in the previous month, there was no evidence of strength in market fundamentals to support the change, as lower margins curbed Asian refiners' demand for incremental barrels, while several refineries have scheduled maintenance ahead. For the month, the Dubai market structure backwardation widened, where (M1-M3) moved from 25¢/b to 37¢/b, m-o-m. Brent’s premium over WTI eased slightly over the month as both markets suffered from oversupply and/or an increase in crude oil inventories, which was aggravated by slower demand as the market moved out of the high-gasoline-demand driving season. The Brent-WTI spread narrowed by about 52¢ from $5.83/b in July to $5.32/b in August.
35
40
45
50
55
60
65
35
40
45
50
55
60
65
1FM 2FM 3FM 4FM 5FM 6FM 7FM 8FM 9FM 10FM 11FM 12FM
US$/bUS$/b
ICE Brent: 24 Jul 15 ICE Brent: 24 Aug 15Nymex WTI: 24 Jul 15 Nymex WTI: 24 Aug 15
FM = future month.
Crude Oil Price Movements
OPEC Monthly Oil Market Report – September 2015 9
Table 1.2: Nymex WTI and ICE Brent forward curves, US$/b
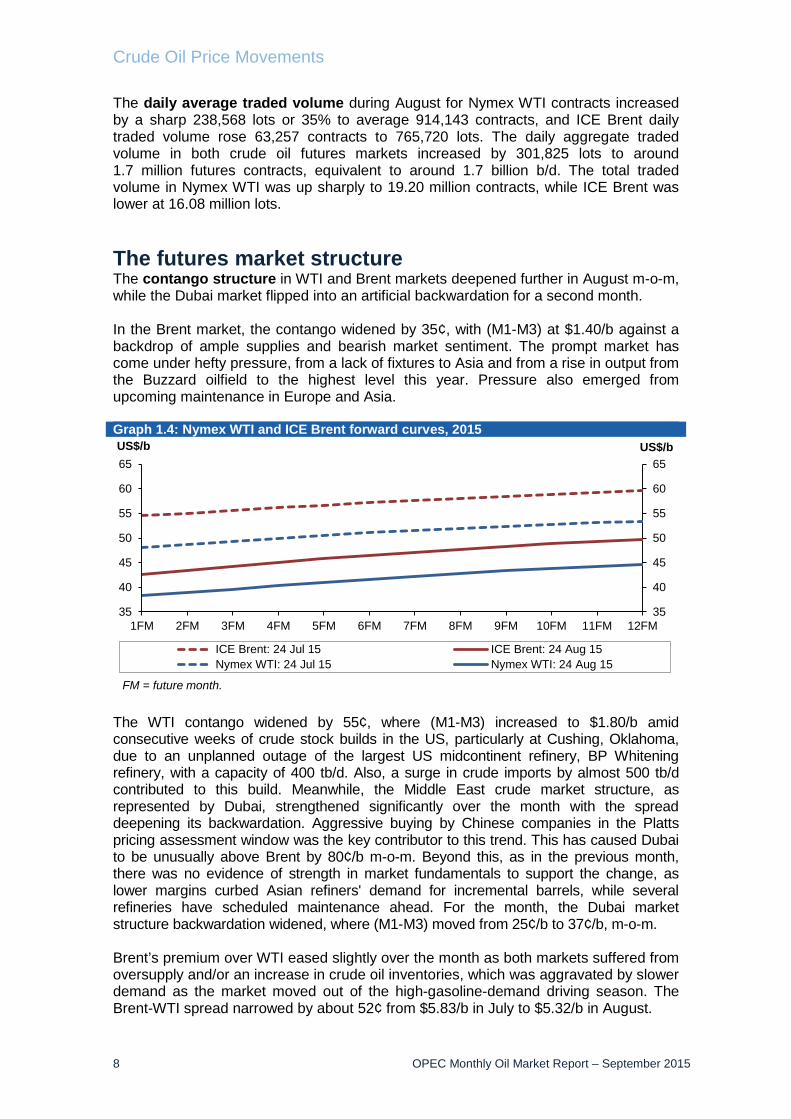
The light sweet/medium sour crude spread Sweet/sour differentials narrowed in Europe, though remaining unchanged on the US Gulf Cost (USGC). In Asia, the narrowing saga continues. In Asia, the sweet/sour spread, represented by the Tapis/Dubai spread, continued on its narrowing trend, which started earlier in the year, as the Brent/Dubai m-o-m spread sustained a negative value of more than $1/b, making a sweet grade less expensive than a sour. As in the previous month, this led to an overflow of arbitrage light sweet crudes – West African crudes – heading east, pressuring similar local grades such as Tapis. Demand also continued to weaken for Asia-Pacific light sweet grades amid falling refinery margins in the region. In contrast, Dubai stayed firm on robust Chinese buying in the Platt’s pricing assessment market-on-close (MOC) mechanism. The number of cargoes traded during the pricing process for Middle East crude exports to Asia hit an all-time high in August. Chinaoil bought a record 36 mb, or 72 cargoes, over the month. The Dubai crude discount to Tapis dropped 85¢ to 95¢/b from a spread of close to $7/b at the beginning of the year. This again made regional light sweet crudes more attractive to Asia-Pacific refiners than Dubai-related sour crudes. Graph 1.5: Brent Dated vs. Sour grades (Urals and Dubai) spread, 2015
In Europe, the Urals medium sour crude discount to Brent eased in August, with Urals being supported by short supply, as seen in the loading schedule. Grades similar to Urals exported from northern Iraq also fell by about 44,000 b/d in August to average 472,832 b/d, because of a disruption in flow through the pipeline to Turkey. Meanwhile, the Atlantic Basin sweet crude market was pressured by upcoming refinery turnarounds
-4
-2
0
2
4
6
-4
-2
0
2
4
01 A
pr
08 A
pr
15 A
pr
22 A
pr
29 A
pr
06 M
ay
13 M
ay
20 M
ay
27 M
ay
03 J
un
10 J
un
17 J
un
24 J
un
01 J
ul
08 J
ul
15 J
ul
22 J
ul
29 J
ul
05 A
ug
12 A
ug
19 A
ug
26 A
ug
02 S
ep
09 S
epUS$/bUS$/b
Dubai Urals
Nymex WTI 1st FM 2nd FM 3rd FM 6th FM 12th FM
24 Jul 15 48.14 48.61 49.25 51.07 53.4324 Aug 15 38.24 38.93 39.65 41.66 44.59
ICE Brent1st FM 2nd FM 3rd FM 6th FM 12th FM
24 Jul 15 54.62 55.02 55.57 57.15 59.6424 Aug 15 42.69 43.49 44.29 46.44 49.79
FM = future month.

Crude Oil Price Movements
10 OPEC Monthly Oil Market Report – September 2015
and higher North Sea supply. The Urals Med discount of 70¢/b in July to Dated Brent dropped to 50¢/b in August, narrowing by about 20¢. In the USGC, the Light Louisiana Sweet (LLS) premium over medium sour Mars remained unchanged at about $4.55/b in August. Meanwhile, despite the narrowing of the Brent/WTI spread, LLS and Mars values strengthened over the month relative to WTI. LLS m-o-m differentials to WTI increased nearly 80¢ to reach $4.30/b, while Mars differentials improved 80¢ to stand at minus 25¢/b, from the previous month’s minus $1/b.

Commodity Markets
OPEC Monthly Oil Market Report – September 2015 11
Commodity Markets Average commodity prices retreated in August, with falls in all major commodity groups. Energy prices were down due to a large drop in crude oil prices. In the group of non-energy commodities, both metals and agriculture prices were generally down. Precious metals were also lower during the month. Trends in selected commodity markets In August, commodity prices were under pressure due to weakening manufacturing conditions in China, the strengthening US dollar and the forecast for bumper crops in the US. The US dollar advanced during the month, mainly against emerging market currencies, following the People’s Bank of China’s devaluation of the renminbi (RMB). Further downward pressure on commodity prices was added by readings of the manufacturing activity in China pointing to a contraction in the sector, which triggered a stock market sell-off. Table 2.1: Commodity price data, 2015
Metals prices were under pressure during the month due to slowing manufacturing in China and the RMB devaluation, which sparked concerns for lower commodity imports. The Purchasing Managers’ Index (PMI) for China dropped further into contraction territory to 47.3, from 47.8 in July, while expansion in the US manufacturing sector also appears to have slowed as shown by the Institute of Supply Management’s manufacturing PMI reading of 51.1 versus 52.7 in July. Copper prices were down for the third month in a row, despite further recovery in the property market, where prices have continued to recover. New home prices advanced in June in 31 of the 70 largest
Jun 15 Jul 15 Aug 15 Jun/May Jul/Jun Aug/Jul
Energy 76.3 68.8 59.4 -1.9 -9.9 -13.6Coal, Australia $/mt 58.8 59.3 58.0 -2.6 0.9 -2.2Crude oil, average $/bbl 61.3 54.3 45.7 -1.9 -11.4 -15.9Natural gas, US $/mmbtu 2.8 2.8 2.8 -2.4 2.2 -2.4Non-energy 84.3 83.0 80.0 -1.3 -1.6 -3.6Agriculture 90.3 90.7 87.6 0.3 0.4 -3.4Food 91.0 92.0 87.9 -0.1 1.2 -4.4Soybean meal $/mt 397.0 405.0 394.0 2.1 2.0 -2.7Soybean oil $/mt 793.0 753.0 730.0 1.5 -5.0 -3.1Soybeans $/mt 397.0 405.0 382.0 2.1 2.0 -5.7Grains 88.3 91.0 83.8 -0.7 3.0 -7.9Maize $/mt 166.7 179.6 162.6 0.3 7.7 -9.5Wheat, US, HRW $/mt 209.9 197.4 179.8 -2.5 -5.9 -8.9Sugar, world $/kg 0.3 0.3 0.3 -6.6 3.0 -10.4Base Metal 76.7 72.7 68.3 -6.9 -5.2 -6.1Aluminum $/mt 1,687.7 1,639.5 1,548.1 -6.4 -2.9 -5.6Copper $/mt 5,833.0 5,456.8 5,127.3 -7.3 -6.5 -6.0Iron ore, cfr spot $/dmtu 63.0 52.0 56.0 5.0 -17.5 7.7Lead $/mt 1,829.5 1,763.0 1,703.6 -8.1 -3.6 -3.4Nickel $/mt 12,825.2 11,413.1 10,386.0 -5.1 -11.0 -9.0Tin $/mt 15,064.9 15,071.5 15,163.8 -4.7 0.0 0.6Zinc $/mt 2,082.1 2,000.7 1,807.6 -8.8 -3.9 -9.6Precious MetalsGold $/toz 1,181.5 1,128.3 1,117.9 -1.4 -4.5 -0.9Silver $/toz 16.1 15.1 14.9 -4.5 -6.4 -0.7
Source: World Bank, Commodity price data.
World Bank commodity price indices (2010 = 100)
UnitCommodity Monthly averages % Change

Commodity Markets
12 OPEC Monthly Oil Market Report – September 2015
cities versus 26 the previous month, as reported by the National Bureau of Statistics. Iron ore prices showed some recovery after the steep fall of the previous month, however demand is likely to remain constrained as China’s steel output was down by 4.6% y-o-y, according to the World Steel Association. Agricultural prices were down, mainly due to significant drops in the groups of grains and oil seeds on the prospect of bumper crops in the current year. The US Department of Agriculture upgraded its estimates of global ending stocks for maize and wheat, while soybean stocks are expected to remain at record highs, despite some minor downward forecast revisions. Moreover, prices in the soy complex were also affected by the devaluation of the RMB, as the country’s soybean imports account for more than 60% of the total global trade of that oilseed. Meanwhile, sugar prices showed the largest decline this year following a sharp depreciation of the Brazilian currency. Palm oil was among the largest decliners, due to lower fuel prices, plentiful supplies and lower prices of other oilseeds. In the group of raw materials, natural rubber prices continued to fall as a result of lower crude prices and rising inventories in China. Graph 2.1: Major commodity price indices, 2013-2015
Energy prices were down during the month, due to large declines in oil prices amid persistent oversupply and bearish market sentiment following the stock market sell-off in August. Overall, natural gas and coal showed decreases, however, in Europe, natural gas prices have remained relatively stable as inventories advanced to 73% of capacity, versus 61% at the end of July, according to Gas Infrastructure Europe. In the US, additions to inventories reported by the EIA were roughly in line with market estimations, and cooler temperatures in September could keep a ceiling on prices. Average energy prices decreased by 13.6% m-o-m, mainly due to a 15.9% drop in crude oil. Natural gas prices declined in the US by 2.4% m-o-m, while average import prices in Europe advanced slightly by 0.3%. Agricultural prices saw their largest decrease since September 2014, dropping by 3.6%, due to a 4.7% drop in food, while beverage (cocoa, coffee and tea) and raw material (timber, cotton, rubber and tobacco) prices decreased by 2.5% and 1.5%, respectively. Sugar, maize, soybean and wheat prices decreased significantly by 10.4% 9.5%, 5.7% and 8.9%, respectively, on higher estimations for the US harvest and the depreciation of the Chinese RMB. Natural rubber declined by 9.2% due to lower oil prices.
50
75
100
125
150
50
75
100
125
150
Aug
13
Sep
13
Oct
13
Nov
13
Dec
13
Jan
14
Feb
14
Mar
14
Apr 1
4
May
14
Jun
14
Jul 1
4
Aug
14
Sep
14
Oct
14
Nov
14
Dec
14
Jan
15
Feb
15
Mar
15
Apr 1
5
May
15
Jun
15
Jul 1
5
Aug
15
IndexIndex
Energy Non-energy Agriculture Food
Base metals HH natural gas Gold
Source: World Bank, Commodity price data.
Base year 2010 = 100

Commodity Markets
OPEC Monthly Oil Market Report – September 2015 13
Average base metal prices decreased sharply by 6.1%, with declines among all group components, but tin. Aluminium, copper, lead and nickel extended their declining trends for the second consecutive month, down by 5.6%, 6.0%, 9.0% and 9.6%, respectively, on slowing manufacturing in China. Meanwhile, average iron ore prices advanced by 7.7% m-o-m. Precious metals declined, with gold prices decreasing by 0.9% on average, although prices recovered from the lows observed at the beginning of the month on the prospect of a delayed interest rate hike in the US. Meanwhile, silver prices declined by 0.7% m-o-m. Graph 2.2: Inventories at the LME
In September, the Henry Hub natural gas price decreased after net injections to storage, in line with market expectations during the month. The average price was down 7¢ or 2.4% to $2.76 per million British thermal units (mbtu) after trading at an average of $2.83/mbtu the previous month. The EIA said utilities put 94 billion cubic feet (Bcf) of gas into storage during the week ending 28 August. This was above market expectations of an 86 Bcf increase. Total working gas in storage stood at 3,193 Bcf, which was 18% higher than the previous year at the same time and 4% higher than the previous five-year average. One month ago, it was 2.2% below that average. The EIA noted that temperatures during the reported week were cooler than both the previous year as well as the 30-year average.
0
1,000
2,000
3,000
4,000
5,000
6,000
0
200
400
600
800
1,000
Aug
14
Sep
14
Oct
14
Nov
14
Dec
14
Jan
15
Feb
15
Mar
15
Apr
15
May
15
Jun
15
Jul 1
5
Aug
15
'000 Tonnes'000 Tonnes
Copper Lead Nickel Tin Zinc Pr. Aluminium (RHS)
Sources: London Metal Exchange and Thomson Reuters.

Commodity Markets
14 OPEC Monthly Oil Market Report – September 2015
Investment flows into commodities Open interest volume (OIV) in selected US commodity markets increased in August for agriculture and copper, while it decreased for crude oil, livestock, natural gas and precious metals. Meanwhile, speculative net length positions decreased for all groups, with the exception of precious metals. Graph 2.3: Total open interest volume
Agriculture’s OIV declined marginally by 3.4% m-o-m to 4,779,108 lots in August. Meanwhile, money managers reduced their net long position by 59% to 169,288 contracts, mainly due to a large reduction in net length for maize and the soy complex. Graph 2.4: Speculative activity in key commodities, net length
Henry Hub’s natural gas OIV decreased by 3.4% m-o-m to 965,914 contracts in August. Money managers increased their net short positions by 17% to reach to 131,075 lots; EIA reports indicate injections to storage in line with the market.
7,000
7,500
8,000
8,500
9,000
7,000
7,500
8,000
8,500
9,000
Aug
14
Sep
14
Oct
14
Nov
14
Dec
14
Jan
15
Feb
15
Mar
15
Apr 1
5
May
15
Jun
15
Jul 1
5
Aug
15
'000 contracts
Source: US Commodity Futures Trading Commission.
'000 contracts
-400
-200
0
200
400
600
-400
-200
0
200
400
600
Aug
14
Sep
14
Oct
14
Nov
14
Dec
14
Jan
15
Feb
15
Mar
15
Apr 1
5
May
15
Jun
15
Jul 1
5
Aug
15
'000 contracts'000 contracts
Agriculture Gold WTI Natural gas Livestocks Copper
Source: US Commodity Futures Trading Commission.

Commodity Markets
OPEC Monthly Oil Market Report – September 2015 15
Graph 2.5: Speculative activity in key commodities, as % of open interest
Copper’s OIV increased by 11.6% m-o-m to 183,662 contracts in August. Money managers increased their bearish net short position to 27,995 lots from 24,567 contracts the previous month, on renewed concerns about slowing demand from China. Table 2.2: CFTC data on non-commercial positions, ‘000 contracts
Precious metals’ OIV decreased by 5.3% m-o-m to 609,795 contracts in August. Money managers switched to net long positions of 5,022 lots, from a net short position in the previous month, on concerns of a potential delay in interest rate hikes by the US Federal Reserve due to stock market volatility experienced during the month. Graph 2.6: Inflow of investment into commodities, 2013-2015
-20
-10
0
10
20
30
40
-20
-10
0
10
20
30
40A
ug 1
4
Sep
14
Oct
14
Nov
14
Dec
14
Jan
15
Feb
15
Mar
15
Apr
15
May
15
Jun
15
Jul 1
5
Aug
15
%%
Agriculture Gold WTI Livestocks Copper Natural gas
Source: US Commodity Futures Trading Commission.
0
20
40
60
80
100
120
1Q 2Q 3Q 4Q 1Q 2Q 3Q 4Q 1Q Apr May Jun Jul
2013 2014 2015
US$ bn
Agriculture Copper Gold Natural gas WTI crude oil
Source: US Commodity Futures Trading Commission.
Jul 15 Aug 15 Jul 15 % OIV Aug 15 % OIV
Crude oil 1,697 1,695 137 8 97 6Natural gas 1,000 966 -112 -11 -131 -14Agriculture 4,775 4,779 417 9 169 4Precious metals 644 610 -19 -3 5 1Copper 165 184 -25 -15 -28 -15Livestock 499 483 68 14 44 9Total 8,780 8,716 466 5 156 2Source: US Commodity Futures Trading Commission.
Open interest Net length

World Economy
16 OPEC Monthly Oil Market Report – September 2015
World Economy Considering the latest softening developments in the global economy, global economic growth has been revised down by 0.1 percentage points (pp) for both 2015 and 2016. In the current year, the global economy is forecast to expand by 3.1%, followed by growth of 3.4% in the next year. The challenges in emerging and developing economies in particular have become more accentuated in the past weeks. China’s slowdown has become more pronounced, and Brazil and Russia are now both forecast to face a considerable recession this year. Some support to global growth may come from a healthy trend in India. Also, the OECD is forecast to hold up well at 2.0% this year and 2.1% in the coming year. While some upside potential – mainly from the OECD and India – might lead to higher global growth, numerous uncertainties exist. Most importantly, the decelerating momentum in China, and the declining trend in Russia and Brazil will need close monitoring. Moreover, some fragility in the Euro-zone remains and the strength of the US growth trend remains to be seen. Japan will need to manage a balancing act involving fiscal tightening and, at the same time, stimulating its economy. Geopolitical issues and their potential spill-over into the real economy also constitute a challenge. Finally, central bank policies will be an influential factor, amid lower global inflation, most importantly the US Fed’s interest rate decision in the coming months. Table 3.1: Economic growth rate and revision, 2015-2016, %
OECD OECD Americas US The upward revision of US 2Q15 GDP was surprisingly high. Growth in the 2Q was revised upwards from 2.3% to a seasonally adjusted annualised rate (SAAR) of 3.7% q-o-q, after growth of only 0.6% q-o-q SAAR in the 1Q15. This large increase in the 2Q15, compared to the very weak 1Q15 may also have been due to special factors that kept 1Q growth on the low side and pushed some economic activity into the 2Q. Among those factors are the cold weather and the West Coast port strike. It seems that the US economy is still relatively well-supported by an improving labour market, healthy private household consumption and a generally well-recovered economic environment. However, inventories contributed significantly to GDP growth in the first half: 0.87 pp in 1Q15 and 0.22 pp in 2Q15. So less support – at least for the 3Q15 – is expected from this side. But personal consumption expenditures remain the backbone of the US economy. This has held up very well, growing by 1.8% q-o-q and
World OECD US Japan Euro-zone China India Brazil Russia
2015* 3.1 2.0 2.5 0.8 1.3 6.8 7.4 -2.0 -3.0
Change from previous month -0.1 0.0 0.1 -0.4 0.0 -0.1 -0.1 -0.7 -0.2
2016* 3.4 2.1 2.6 1.2 1.5 6.4 7.6 -0.3 0.8
Change from previous month -0.1 0.0 0.0 0.0 0.0 -0.1 -0.1 -1.0 -0.1
*Forecast.

World Economy
OPEC Monthly Oil Market Report – September 2015 17
by 3.1% q-o-q in the 1Q15 and the 2Q15, respectively. There has also been some concern in recent weeks about the impact of a slow-down in China’s economy. However, exports from the US to China account for less than 0.5% of GDP. While indirect effects may also be accounted for, the current slow-down in China does not seem to be a large issue for the US economy – at least for the time being. A major driver for the US economy is the continuously improving situation in the labour market. The unemployment rate now stands at only 5.1%, the lowest level since 2008. Also, non-farm payroll additions grew by a healthy 173,000 in August, after 245,000 job additions in July and in June. The share of long-term unemployed has remained relatively low, but rose to 27.7% in August from 26.9% in July. It remains considerably below this year’s peak level of 31.5% in January. The participation rate, however, has remained at only 62.6%. House prices, which also constitute a very important wealth factor for US households, have continued to hold up very well. Compared to last year, they rose by more than 5% in every month since the beginning of the year, data from the Federal Housing Finance Agency (FHFA) showed. The latest number from June shows a price rise of 5.6% y-o-y, the second highest rise after May, when prices increased by 5.8% y-o-y. Also, home sales continued improving. Existing home sales jumped to 5.6 million in July. This compared to a decline of 4.9 million in 2014 and a rise of 5.1 million in 2013. In addition, new home sales increase by 507,000 in July, higher than in June and above the annual growth levels of 2014 and 2013, which stood at 440,000 and 430,000, respectively. Given the solid housing market, a Fed interest rate increase may be well digested from this important sector. Given the relatively positive developments in the labour market, consumer confidence stood at solid levels. The Conference Board Consumer Confidence Index rose to 101.5 in August, the second highest level this year after the January level of 103.8. The Purchasing Manager’s Index (PMI) for the manufacturing sector, provided by the Institute of Supply Management (ISM), however, declined slightly to 51.1 from 52.7. Also, the ISM for the services sector retreated slightly to 59.0 from 60.3 but remains at a very high level. Graph 3.1: Manufacturing and non-manufacturing ISM indices
The upcoming Fed meeting will certainly be a very important event not only because of the probability of a rate hike but also because it may provide more insight into the Fed’s strategy. Considering the solid development of the US economy and the strong 2Q15,
51.1
59.0
464850525456586062
Aug
14
Sep
14
Oct
14
Nov
14
Dec
14
Jan
15
Feb
15
Mar
15
Apr
15
May
15
Jun
15
Jul 1
5
Aug
15
Index
ISM manufacturing index ISM non-manufacturing index
Sources: Institute for Supply Management and Haver Analytics.

World Economy
18 OPEC Monthly Oil Market Report – September 2015
the 2015 growth forecast has been revised up to 2.5% from 2.4% in the previous month. Given the challenges that lie ahead, the 2016 forecast remains unchanged at 2.6%, slightly higher than this year’s growth. Canada Canada is still experiencing a considerable slow-down, given significant weakness in its exports and the significant challenges for the energy sector due to low oil prices. GDP growth has now been confirmed to be negative for both the 1Q15 and the 2Q15 at -0.8% q-o-q SAAR and -0.5% q-o-q SAAR, respectively. Industrial production was clearly negative in the 2Q15 at -2.4% y-o-y, clearly less than the 1.1% growth from the 1Q15. The latest PMI for manufacturing from August indicates that this trend may continue. It stood at 49.4, clearly below the growth indicating level of 50. Given this current weakening trend, 2015 GDP growth has been revised sharply down to 0.7% from 1.5%. The 2016 growth forecast has also been lowered to 1.9% from 2.0%. OECD Asia-Pacific Japan Japan’s economy still remains in a relatively challenging situation. While 2Q15 GDP has been revised up to -1.2% q-o-q SAAR from -1.6% q-o-q SAAR, it remains clearly negative. China’s current slow-down may also affect exports. While domestic demand is holding up relatively well, it is far from growing strongly. In addition to this, inflation remains at a very low level. Starting next year, the fiscal rebalancing will also most probably require another sales tax increase or other related measures to increase government income, which may bring down the sovereign debt situation. On a positive note, 1Q15 growth was reconfirmed at a high growth rate of 4.5% q-o-q SAAR and lead indicators point at a continuation of at least a moderate growth momentum. Moreover, the government has indicated that it may – again – support the economy by fiscal stimulus measures. The low inflation, however, still constitutes a major challenge. It stood at only 0.3% y-o-y in July, lower than the June level of 0.4% y-o-y. While the deflationary pressures from energy, food and from the situation in China are obvious challenges, the headline series – that is, without energy and food prices – remains low at only 0.6% y-o-y in July. Amid low inflation, real income is declining further. Average monthly earnings fell by 0.7% y-o-y in July. This is the seventh consecutive month of decline. Japanese exports performed relatively well in July. They rose by 7.6% y-o-y, slightly lower than the 9.5% y-o-y in June. Industrial production remained sluggish. It was almost flat at 0.2% y-o-y in July, after an increase of 2.3% y-o-y in June, which was so far the highest growth rate this year. Domestic demand remained positive, but the momentum is still subdued. Retail trade increased by 1.6% y-o-y after a rise of 1.0% y-o-y in June. The quarterly view shows that it is still in a weak situation. Retail trade in the 1Q15 fell by 4.6% y-o-y, while in the 2Q it rose by 2.9% y-o-y. While the quarterly pattern is distorted by April’s sales tax increase from last year, the numbers for the first half show a 1% y-o-y decline.

World Economy
OPEC Monthly Oil Market Report – September 2015 19
Graph 3.2: Japanese retail trade Graph 3.3: Japanese PMI indices
The latest PMI numbers, as provided by Markit, show that July’s manufacturing PMI holds up well and indicates a continuation of the current slow growth momentum. The number for August was again higher at 51.7, compared to 51.2 in July. The domestically very important services sector even jumped to 53.7 from 51.3. Given the very weak 2Q15 GDP number, Japan’s GDP growth estimate for 2015 has been revised down to 0.8% from 1.2%. The 2016 growth forecast remains unchanged at 1.2%. South Korea South Korea’s 1Q15 and 2Q15 GDP growth was clearly below expectations. It is mirroring the challenges from the export business, which experienced a particularly large decline. 1Q15 GDP stood at only 2.5% y-o-y and slowed to 2.2% y-o-y in the 2Q15. On a quarterly base, exports declined by 0.1% y-o-y in the 1Q15 and by 1.0% y-o-y in the 2Q15. The latest PMI numbers for manufacturing are mirroring this weak growth trend for the usually dynamic economy. The August PMI stood at only 47.9 after a level of 47.6 in July, both clearly below the growth indicating level of 50. Given the weakness in the economy, the GDP growth forecast has been revised down to 2.3% for 2015, from 2.7% previously. The 2016 growth forecast now stands at 2.7%, compared to 2.8% in the last month.
OECD Europe Euro-zone The Euro-zone continues its recovery. Quarterly GDP growth for both the 1Q15 and the 2Q15 have been revised up, and lead indicators and output numbers point at a continuation of this trend. 1Q14 GDP growth was revised up to 0.5% q-o-q from 0.4% previously, while 2Q15 GDP growth now stands at 0.4% q-o-q, compared to an initial estimate of 0.3% q-o-q, based on information from Eurostat, the European statistical office. However, to some extent the trend could disappoint, given some lingering uncertainties, not only about the strength of the recovery in the peripheral economies but also about the elections in Greece and in Spain in the coming months. Both could again open the ground for discussions about the implemented austerity measures and ongoing support programmes. Greece will hold new elections on 20 September. This may again lead to newly revived discussions about the Euro-zone’s bail-out package. Spain will hold elections in December.
1.6%
-12-10
-8-6-4-20246
Jul 1
4A
ug 1
4S
ep 1
4O
ct 1
4N
ov 1
4D
ec 1
4Ja
n 15
Feb
15M
ar 1
5A
pr 1
5M
ay 1
5Ju
n 15
Jul 1
5Sources: Ministry of Economy, Trade and Industry and Haver Analytics.
% change y-o-y
53.7
51.7
47
48
49
50
51
52
53
54
Aug
14
Sep
14
Oct
14
Nov
14
Dec
14
Jan
15Fe
b 15
Mar
15
Apr
15
May
15
Jun
15Ju
l 15
Aug
15
Index
Sources: Markit, Japan Materials Management Association and Haver Analytics.
Services PMI
Manufacturing PMI
World Economy
20 OPEC Monthly Oil Market Report – September 2015
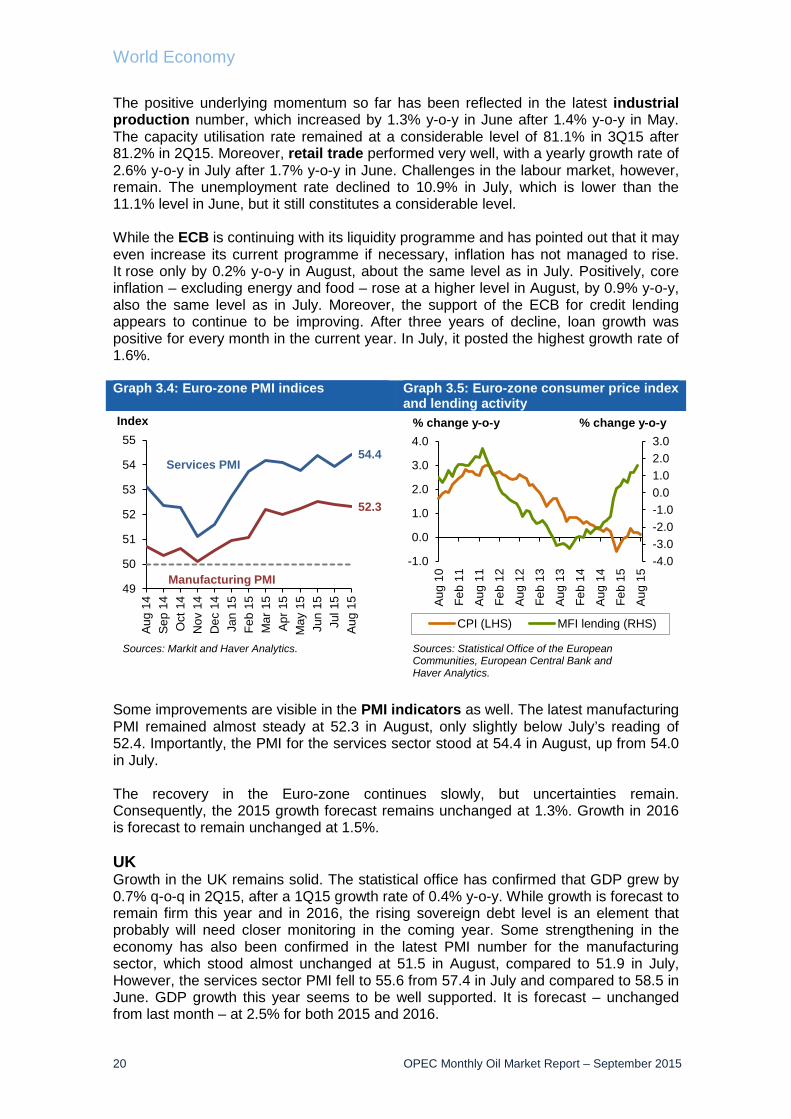
The positive underlying momentum so far has been reflected in the latest industrial production number, which increased by 1.3% y-o-y in June after 1.4% y-o-y in May. The capacity utilisation rate remained at a considerable level of 81.1% in 3Q15 after 81.2% in 2Q15. Moreover, retail trade performed very well, with a yearly growth rate of 2.6% y-o-y in July after 1.7% y-o-y in June. Challenges in the labour market, however, remain. The unemployment rate declined to 10.9% in July, which is lower than the 11.1% level in June, but it still constitutes a considerable level. While the ECB is continuing with its liquidity programme and has pointed out that it may even increase its current programme if necessary, inflation has not managed to rise. It rose only by 0.2% y-o-y in August, about the same level as in July. Positively, core inflation – excluding energy and food – rose at a higher level in August, by 0.9% y-o-y, also the same level as in July. Moreover, the support of the ECB for credit lending appears to continue to be improving. After three years of decline, loan growth was positive for every month in the current year. In July, it posted the highest growth rate of 1.6%. Graph 3.4: Euro-zone PMI indices Graph 3.5: Euro-zone consumer price index
and lending activity
Some improvements are visible in the PMI indicators as well. The latest manufacturing PMI remained almost steady at 52.3 in August, only slightly below July’s reading of 52.4. Importantly, the PMI for the services sector stood at 54.4 in August, up from 54.0 in July. The recovery in the Euro-zone continues slowly, but uncertainties remain. Consequently, the 2015 growth forecast remains unchanged at 1.3%. Growth in 2016 is forecast to remain unchanged at 1.5%. UK Growth in the UK remains solid. The statistical office has confirmed that GDP grew by 0.7% q-o-q in 2Q15, after a 1Q15 growth rate of 0.4% y-o-y. While growth is forecast to remain firm this year and in 2016, the rising sovereign debt level is an element that probably will need closer monitoring in the coming year. Some strengthening in the economy has also been confirmed in the latest PMI number for the manufacturing sector, which stood almost unchanged at 51.5 in August, compared to 51.9 in July, However, the services sector PMI fell to 55.6 from 57.4 in July and compared to 58.5 in June. GDP growth this year seems to be well supported. It is forecast – unchanged from last month – at 2.5% for both 2015 and 2016.
54.4
52.3
49
50
51
52
53
54
55
Aug
14Se
p 14
Oct
14
Nov
14
Dec
14
Jan
15Fe
b 15
Mar
15
Apr
15
May
15
Jun
15Ju
l 15
Aug
15
Index
Sources: Markit and Haver Analytics.
Services PMI
Manufacturing PMI-4.0-3.0-2.0-1.00.01.02.03.0
-1.0
0.0
1.0
2.0
3.0
4.0A
ug 1
0
Feb
11
Aug
11
Feb
12
Aug
12
Feb
13
Aug
13
Feb
14
Aug
14
Feb
15
Aug
15
CPI (LHS) MFI lending (RHS)
Sources: Statistical Office of the European Communities, European Central Bank and Haver Analytics.
% change y-o-y % change y-o-y
World Economy
OPEC Monthly Oil Market Report – September 2015 21
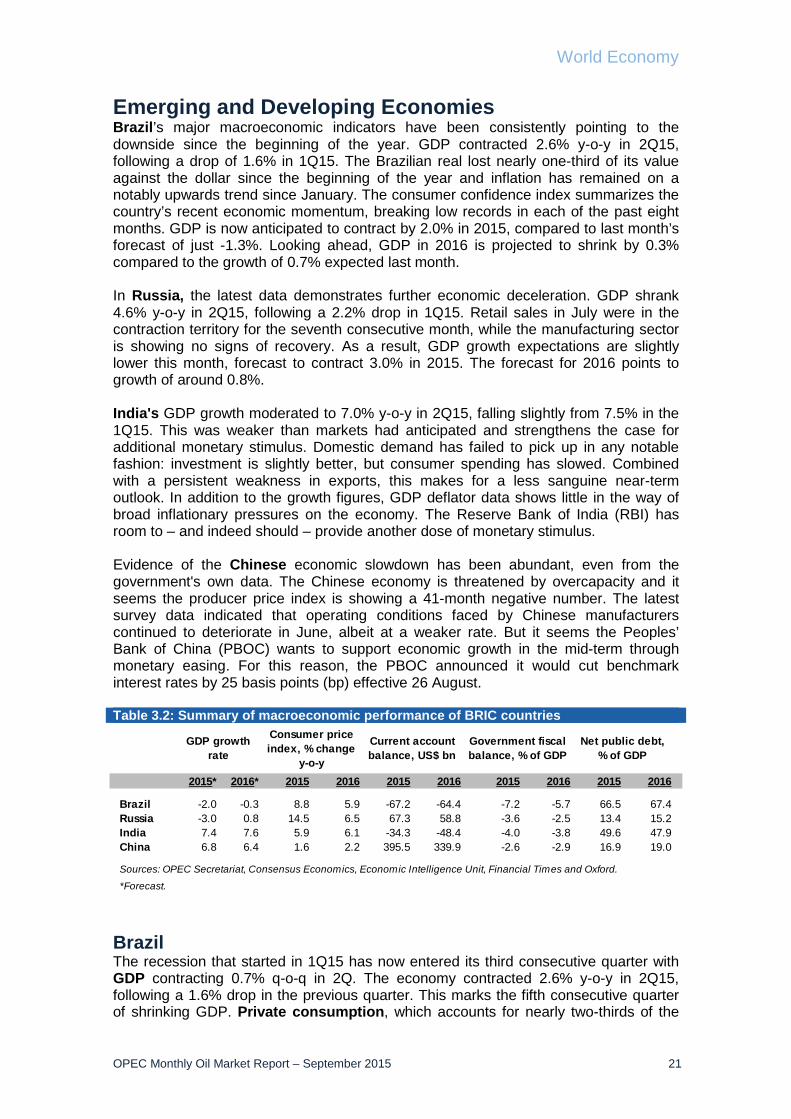
Emerging and Developing Economies Brazil’s major macroeconomic indicators have been consistently pointing to the downside since the beginning of the year. GDP contracted 2.6% y-o-y in 2Q15, following a drop of 1.6% in 1Q15. The Brazilian real lost nearly one-third of its value against the dollar since the beginning of the year and inflation has remained on a notably upwards trend since January. The consumer confidence index summarizes the country’s recent economic momentum, breaking low records in each of the past eight months. GDP is now anticipated to contract by 2.0% in 2015, compared to last month’s forecast of just -1.3%. Looking ahead, GDP in 2016 is projected to shrink by 0.3% compared to the growth of 0.7% expected last month. In Russia, the latest data demonstrates further economic deceleration. GDP shrank 4.6% y-o-y in 2Q15, following a 2.2% drop in 1Q15. Retail sales in July were in the contraction territory for the seventh consecutive month, while the manufacturing sector is showing no signs of recovery. As a result, GDP growth expectations are slightly lower this month, forecast to contract 3.0% in 2015. The forecast for 2016 points to growth of around 0.8%. India's GDP growth moderated to 7.0% y-o-y in 2Q15, falling slightly from 7.5% in the 1Q15. This was weaker than markets had anticipated and strengthens the case for additional monetary stimulus. Domestic demand has failed to pick up in any notable fashion: investment is slightly better, but consumer spending has slowed. Combined with a persistent weakness in exports, this makes for a less sanguine near-term outlook. In addition to the growth figures, GDP deflator data shows little in the way of broad inflationary pressures on the economy. The Reserve Bank of India (RBI) has room to – and indeed should – provide another dose of monetary stimulus. Evidence of the Chinese economic slowdown has been abundant, even from the government's own data. The Chinese economy is threatened by overcapacity and it seems the producer price index is showing a 41-month negative number. The latest survey data indicated that operating conditions faced by Chinese manufacturers continued to deteriorate in June, albeit at a weaker rate. But it seems the Peoples’ Bank of China (PBOC) wants to support economic growth in the mid-term through monetary easing. For this reason, the PBOC announced it would cut benchmark interest rates by 25 basis points (bp) effective 26 August. Table 3.2: Summary of macroeconomic performance of BRIC countries
Brazil The recession that started in 1Q15 has now entered its third consecutive quarter with GDP contracting 0.7% q-o-q in 2Q. The economy contracted 2.6% y-o-y in 2Q15, following a 1.6% drop in the previous quarter. This marks the fifth consecutive quarter of shrinking GDP. Private consumption, which accounts for nearly two-thirds of the
2015* 2016* 2015 2016 2015 2016 2015 2016 2015 2016
Brazil -2.0 -0.3 8.8 5.9 -67.2 -64.4 -7.2 -5.7 66.5 67.4Russia -3.0 0.8 14.5 6.5 67.3 58.8 -3.6 -2.5 13.4 15.2India 7.4 7.6 5.9 6.1 -34.3 -48.4 -4.0 -3.8 49.6 47.9China 6.8 6.4 1.6 2.2 395.5 339.9 -2.6 -2.9 16.9 19.0
*Forecast.
Sources: OPEC Secretariat, Consensus Economics, Economic Intelligence Unit, Financial Times and Oxford.
GDP growth rate
Consumer price index, % change
y-o-y
Current account balance, US$ bn
Government fiscal balance, % of GDP
Net public debt, % of GDP

World Economy
22 OPEC Monthly Oil Market Report – September 2015
economy, declined 2.7%. Government consumption also decreased 1.1% y-o-y. Gross Fixed Capital Formation (GFCF) slipped 11.9% y-o-y over the same period, marking the steepest drop since 1Q96. On the positive side, the value of exports increased 7.2% y-o-y, while imports cooled 11.4% y-o-y. Graph 3.6: Brazilian quarterly GDP growth
The real depreciated an average of 9.0% in August, bringing the accumulated depreciation since the beginning of the year to around 30%. Inflation increased 9.8% y-o-y in July, continuing its noticeable ascending trend since January. The central bank kept its benchmark interest rate unchanged at 14.25% in August. The consumer confidence index has continued breaking low records in each of the past eight months. In August, the index posted 79.1. In contrast, the rising path observed in the unemployment rate continued in July, marking the seventh consecutive increase and registering 7.5%. Graph 3.7: Brazilian consumer confidence index
Graph 3.8: Brazilian unemployment rate
In August, the manufacturing sector of Brazil witnessed the fastest rate of deceleration in new orders in about four years. The manufacturing PMI in August contracted for the seventh month in a row at 45.80. As a result, employment in the
-1.6%-2.6%
1.8%2.7%
0.2%
-4%-3%-2%-1%0%1%2%3%4%5%
1Q 1
2
2Q 1
2
3Q 1
2
4Q 1
2
1Q 1
3
2Q 1
3
3Q 1
3
4Q 1
3
1Q 1
4
2Q 1
4
3Q 1
4
4Q 1
4
1Q 1
5
2Q 1
5
% change y-o-y
Sources: Instituto Brasileiro de Geografia e Estatística and Haver Analytics.
79.170
80
90
100
110
120
130
Aug
10Ja
n 11
Jun
11N
ov 1
1A
pr 1
2Se
p 12
Feb
13Ju
l 13
Dec
13
May
14
Oct
14
Mar
15
Aug
15
Index
Sources: Fundação Getúlio Vargas and Haver Analytics.
7.5%
3.54.04.55.05.56.06.57.07.58.0
Jul 1
2O
ct 1
2Ja
n 13
Apr
13
Jul 1
3O
ct 1
3Ja
n 14
Apr
14
Jul 1
4O
ct 1
4Ja
n 15
Apr
15
Jul 1
5%
Sources: Instituto Brasileiro de Geografia e Estatística and Haver Analytics.

World Economy
OPEC Monthly Oil Market Report – September 2015 23
sector retreated at its sharpest pace in over six years. GDP is projected to contract by 2.0% and 0.3% in 2015 and 2016, respectively. Russia Data from the Federal State Statistics Service showed GDP contracted 4.6% y-o-y in 2Q15, following a 2.2% drop in 1Q15. On a q-o-q basis, however, GDP grew 4.8% in 2Q15 after shrinking 20.7% in 1Q15, which means the economy escaped falling into a recession, according to the technical definition. In 1Q15, household consumption dropped 9% y-o-y, signaling its first shrinkage since 4Q09. Government consumption, on the other hand, fell only slightly by 0.1% y-o-y. The downturn in GFCF accelerated, dropping 8.8% y-o-y from a decrease of 1.2% in the previous quarter. Graph 3.9: Russian quarterly GDP growth
The ruble depreciated 14.6% on average in August. Inflation increased 15.8% y-o-y in August, up from 15.6% in July. The central bank held its benchmark interest rate unchanged at 11.0% in August. Retail sales dropped 9.2% y-o-y in July, marking the seventh consecutive month of contraction, while the unemployment rate slightly eased to 5.3% in July from 5.4% in the previous month. Graph 3.10: Russian retail sales Graph 3.11: Russian inflation rate vs.
Interest rate
-2.2%
-4.6%
3.5%
1.3% 0.6%
-7%
-5%
-3%
-1%
1%
3%
5%
1Q 1
2
2Q 1
2
3Q 1
2
4Q 1
2
1Q 1
3
2Q 1
3
3Q 1
3
4Q 1
3
1Q 1
4
2Q 1
4
3Q 1
4
4Q 1
4
1Q 1
5
2Q 1
5
% change y-o-y
Sources: State Committee of the Russian Federation and Haver Analytics.
-9.2-12-10
-8-6-4-20246
Jul 1
4Au
g 14
Sep
14O
ct 1
4N
ov 1
4D
ec 1
4Ja
n 15
Feb
15M
ar 1
5Ap
r 15
May
15
Jun
15Ju
l 15
% change y-o-y
Sources: Federal State Statistics Service and Haver Analytics.
15.8
11.0
4
6
8
10
12
14
16
18
Aug
14
Sep
14
Oct
14
Nov
14
Dec
14
Jan
15Fe
b 15
Mar
15
Apr
15
May
15
Jun
15Ju
l 15
Aug
15
%
Sources: Federal State Statistics Service, Central Bank of Russia and Haver Analytics.
Inflation rate
Interest rate

World Economy
24 OPEC Monthly Oil Market Report – September 2015
The manufacturing sector suffered last month from depreciation in the ruble, which put price pressure on the sector. August’s manufacturing PMI stood at 47.9, down from 48.3 in July. The survey showed that new businesses and job creation both fell by their sharpest pace since May. The ruble depreciation was reported to have led to a sharp and accelerated increase in average input prices by raising the cost of imported goods. With the latest data demonstrating further economic deceleration, GDP growth anticipations have been slightly lowered this month. The GDP is forecast to contract 3.0% in 2015, while the forecast for 2016 points to growth of around 0.8%. India India's GDP grew by 7% y-o-y in the 2Q15, slowing from a 7.5% expansion during the same period in the last fiscal year. Weak expansion in output in the agricultural and mining sectors dragged down overall output. At 7.0% y-o-y, the pace of growth in the demand-side was slower than during the previous three months. The benign interpretation is that the economy is continuing to advance at a healthy rate, even though efforts to boost its performance are taking longer to bear fruit. The more alarmist interpretation is that, even as private demand remains sluggish, domestic demand itself is showing signs of deterioration. Regardless which of these two views is proven right in the coming quarters, it is fair to say that, for the time being, India's economic performance remains uninspiring. Graph 3.12: Indian exports and imports Graph 3.13: Indian rupee and US dollar
exchange rate
Hit by the global economic slowdown and weak commodity prices, Indian merchandise exports contracted for the eighth straight month in July by 10.3% y-o-y to $23.4 billion, pushing the trade deficit to $11.7 billion, up from $11.1 billion in June. However, the trade deficit was still lower than during the same month a year ago, when it stood at $13.0 billion. Real exports have contracted in y-o-y terms for the past four consecutive quarters. During January-June 2015, they shrank by 7.3% y-o-y, the fastest pace of decline since the 2009 global financial crisis. Real imports have now fallen in eight of the last ten quarters. This seems incongruous with a healthy and strong domestic economy. While substitution towards domestically produced goods may have played a role earlier on when the rupee depreciated noticeably against the dollar, this hasn't really been much of a factor over the past year. Rather, it seems to reflect a degree of unexplained softness in domestic demand which, in turn, raises questions about what the main drivers of growth for India are going to be in the short-term.
23
-35
-12
-50-40-30-20-10
010203040
Jul 1
4A
ug 1
4S
ep 1
4O
ct 1
4N
ov 1
4D
ec 1
4Ja
n 15
Feb
15M
ar 1
5A
pr 1
5M
ay 1
5Ju
n 15
Jul 1
5
US$ bn
Exports Imports Trade balance
Sources: Ministry of Commerce and Industry and Haver Analytics.
50
55
60
65
70
-0.06
-0.04
-0.02
0.00
0.02
0.04
Aug
13
Nov
13
Feb
14
May
14
Aug
14
Nov
14
Feb
15
May
15
Aug
15
INR/US$ volatility (LHS)
INR/US$ exchange rate (RHS)
Index Rate
Sources: Ministry of Commerce and Industry,Reserve Bank of India and Haver Analytics.
World Economy
OPEC Monthly Oil Market Report – September 2015 25
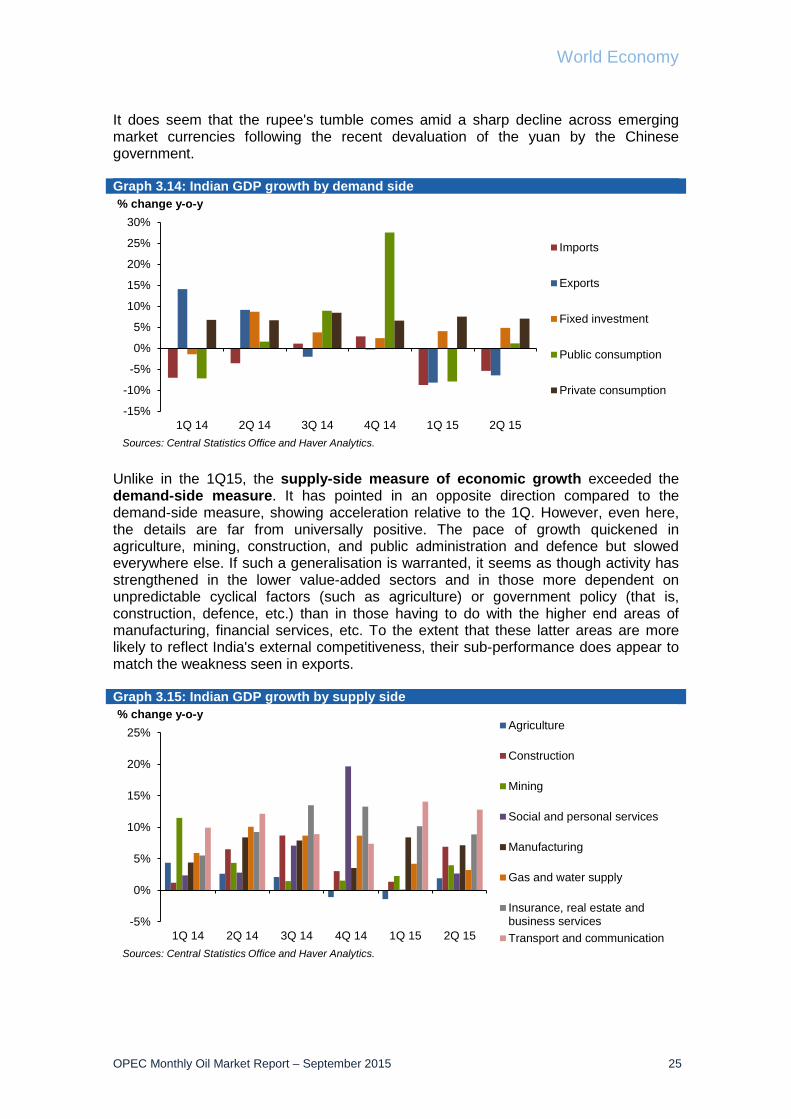
It does seem that the rupee's tumble comes amid a sharp decline across emerging market currencies following the recent devaluation of the yuan by the Chinese government. Graph 3.14: Indian GDP growth by demand side
Unlike in the 1Q15, the supply-side measure of economic growth exceeded the demand-side measure. It has pointed in an opposite direction compared to the demand-side measure, showing acceleration relative to the 1Q. However, even here, the details are far from universally positive. The pace of growth quickened in agriculture, mining, construction, and public administration and defence but slowed everywhere else. If such a generalisation is warranted, it seems as though activity has strengthened in the lower value-added sectors and in those more dependent on unpredictable cyclical factors (such as agriculture) or government policy (that is, construction, defence, etc.) than in those having to do with the higher end areas of manufacturing, financial services, etc. To the extent that these latter areas are more likely to reflect India's external competitiveness, their sub-performance does appear to match the weakness seen in exports. Graph 3.15: Indian GDP growth by supply side
-15%
-10%
-5%
0%
5%
10%
15%
20%
25%
30%
1Q 14 2Q 14 3Q 14 4Q 14 1Q 15 2Q 15
% change y-o-y
Imports
Exports
Fixed investment
Public consumption
Private consumption
Sources: Central Statistics Office and Haver Analytics.
-5%
0%
5%
10%
15%
20%
25%
1Q 14 2Q 14 3Q 14 4Q 14 1Q 15 2Q 15
% change y-o-yAgriculture
Construction
Mining
Social and personal services
Manufacturing
Gas and water supply
Insurance, real estate andbusiness servicesTransport and communication
Sources: Central Statistics Office and Haver Analytics.

World Economy
26 OPEC Monthly Oil Market Report – September 2015
A large downside food price ‘surprise’ in July pushed headline CPI inflation down to 3.6% y-o-y, far below expectations and below the RBI’s central forecast for July. But the sheer size of July’s seasonally adjusted rate of 0.7% m-o-m food price drop took everyone by surprise. It seems that while low inflation helps consumers, questions remain regarding investment performance. Meanwhile, household consumption growth eased from 7.9% y-o-y in the 1Q15 to 7.4% y-o-y in the 2Q. This remains on average above the performance of the past two years. With consumer price inflation receding, global commodity prices stable at very low levels and the exchange rate broadly stable (despite recent weakening), the real purchasing power of Indian households has improved. WPI prices sequentially declined by a seasonally adjusted rate of 1.2% m-o-m in July, the first decline in five months, translating into a decline of 4.2% y-o-y compared to the -2.4% y-o-y seen in June. Global commodity-linked non-food primary goods, as well as minerals and fuel prices, led the decline. Importantly, the softening of input prices also fed into core inflation, which declined by a seasonally adjusted rate of 0.3% m-o-m in July after remaining flat in June. As a consequence, on a y-o-y basis, core inflation was -1.4% in July compared to -0.9% the previous month. Meanwhile, industrial production surprised observers in June, growing by a seasonally adjusted rate of 0.2% m-o-m which, along with the downward revision to May’s figure, means that IP expanded by a disappointing 3.8% y-o-y in June. The main reason for this was a large negative surprise on consumer durables production which contracted by a seasonally adjusted rate of 3.6% m-o-m. The manufacturing PMI declined 0.4 points to 52.3 in August but only after a 1.4 point surge in July. Therefore, the average PMI in 3Q15 thus far (52.5) is still a step up from the 51.7 average in 2Q. Moreover, the new-order-to-inventory ratio is the highest since December 2012, which bodes well for future output, and is in line with the forecast for a sequential acceleration of activity in 3Q. Graph 3.16: Indian PMIs Graph 3.17: Indian inflation vs. repo rate
The growth forecast for year 2015 downgraded from 7.5% to 7.4% also decreased expectations from 7.7% to 7.6% in 2016.
7.5%7.0%
4.4%
6.4%7.1%
0%1%2%3%4%5%6%7%8%9%
1Q 1
22Q
12
3Q 1
24Q
12
1Q 1
32Q
13
3Q 1
34Q
13
1Q 1
42Q
14
3Q 1
44Q
14
1Q 1
52Q
15
Sources: National Informatics Centre (NIC) and Haver Analytics.
% change y-o-y
-5
0
5
10
Aug
14Se
p 14
Oct
14
Nov
14
Dec
14
Jan
15Fe
b 15
Mar
15
Apr 1
5M
ay 1
5Ju
n 15
Jul 1
5Au
g 15
%
Repo rateConsumer price index (CPI)CPI lower target bondCPI higher target bondWholesale price index (WPI)WPI confort zone
Sources: Ministry of Commerce and Industry, Reserve Bank of India and Haver Analytics.

World Economy
OPEC Monthly Oil Market Report – September 2015 27
China Evidence of the economic slowdown has been abundant, even in the government's own data. The pace of y-o-y growth in urban fixed-asset investment has decelerated from 15.7% in 2014 to 11.2% in January-July 2015. This trend has been led by slowing real estate investment, which has fallen from 13.7% y-o-y in the first seven months of last year to 4.3% in the same period of 2015. The drop-off in construction has had negative repercussions for a swathe of heavy industries, depressing y-o-y growth in industrial value-added from 9% in July 2014 to 6% in July 2015. China's stock markets resumed a steep slide on 24 August, after the government apparently abandoned efforts to prop up equity prices through coordinated intervention by state institutions. The move has sparked sharp falls in equity markets across Asia, as investors react to fears that China's economic slowdown may be sharper than expected, and that the region will be badly hit as a result. The Chinese stock market was widely recognised to be in ‘bubble’ territory when it peaked in June. However, although the amount wiped off valuations runs into several trillion US dollars, the linkages between China's stock markets and the real economy are not strong. Banks remain a much more important source of finance, and wealth effects stemming from stock market movements do not seem to have much of an impact on household consumption. In terms of China’s policy of monetary easing, on 25 August the PBOC announced it would cut benchmark interest rates by 25 bp effective 26 August, taking the one-year benchmark deposit rate to 1.75% and the one-year benchmark lending rate to 4.60%. Other benchmark deposit and lending rates would be lowered accordingly. The PBOC is also removing the 50% upper boundary on the premium banks can pay over the benchmark rate for deposits exceeding one year, keeping the 50% premium limit only for one-year and shorter maturity deposits. Meanwhile, the PBOC announced a 50 bp universal Required Reserve Ratio (RRR) cut, effective 6 September. This move will inject 670 billion yuan of liquidity into the banking system. There is an additional 50 bp RRR cut for rural county commercial banks, rural cooperative banks, and rural credit union and township banks, as well as an additional 300 bp RRR cut for financial leasing companies and auto finance companies. The PBOC’s action was the fifth policy rate cut and third universal RRR cut since last November. However, it seems the PBOC will consider one more RRR cut in 4Q. Table 3.3: China changes in benchmark rates
Before cut After cut
Demand 0.35 0.353 Months 1.60 1.356 Months 1.80 1.551 Year 2.00 1.752 Years 2.60 2.353 Years 3.25 3.00<= 1 Year 4.85 4.601-5 Years 5.25 5.00Above 5 Years 5.40 5.15
Source: PBOC (effective on 26 August 2015).
Deposits
Loans

World Economy
28 OPEC Monthly Oil Market Report – September 2015
China revised its formula for setting the yuan exchange rate on 11 August, according to a notice from the PBOC. Effective 11 August, the official daily central parity rate will be based on the closing rate of the interbank foreign exchange rate market on the previous day. Previously, the central parity rate was set using an unpublished formula based on a basket of currencies that was widely believed to be prone to official intervention. As a result of the change, the Chinese yuan central parity rate fell from 6.1162 on 10 August to 6.2298 on 11 August, the largest one-day drop recorded under the central parity regime (18%). Under the new monetary policy, the actual exchange rate can vary as much as 2% from the central parity rate each day. The central bank described the depreciation as a "one-off" adjustment that bridges the old central parity rate with the current actual market conditions. The significance of this is that growth in most sectors of China's economy, save finance, slowed during 2Q. Leading the deceleration was China's export-dependent industrial sector, which has lost share of growth in recent years but nonetheless still remains a significant contributor to both total output levels and employment. The financial sector's volatility since June has cast significant doubt on the ability of finance to further support growth in the second half. The performance of the export sector, on the other hand, has been highly erratic and generally poor in China during 2015. While the USD/CNY exchange rate was relatively stable over the past several quarters, the yuan's real effective exchange rate against all trading partners appreciated by over 10%. While the central bank described the change as a step towards greater market forces, which it may ultimately be, the timing certainly aligns with current efforts to further prop up growth in non-financial sectors. Additionally, the government is keen to highlight steps towards greater marketing and transparency in its exchange rate regime, given its interest in joining the International Monetary Fund's Special Drawing Rights basket. Graph 3.18: Chinese GDP growth rate, SAAR
Graph 3.19: Chinese yuan and US dollar exchange rate
Chinese exports and imports contracted respectively by 5.42% and 13.36% y-o-y in August. Also, the balance of trade widened to $51 billion. China’s CPI increased to 1.7% y-o-y on 15 July (from 1.5% on 15 May). Price pressures remain subdued amid weak domestic demand. Also, the producer price index (PPI) fell and indicated that widespread industrial overcapacity still exists and remains unchanged in May 2015, showing a 41-month negative.
7.0%
7.7% 7.7%
7.3%
6.0%
6.5%
7.0%
7.5%
8.0%
8.5%
1Q 1
22Q
12
3Q 1
24Q
12
1Q 1
32Q
13
3Q 1
34Q
13
1Q 1
42Q
14
3Q 1
44Q
14
1Q 1
52Q
15
Sources: China's National Bureau of Statistics and Haver Analytics.
% change y-o-y
-0.004-0.003-0.002-0.00100.0010.0020.0030.0040.0050.006
600605610615620625630635640
1Q12
3Q12
1Q13
3Q13
1Q14
3Q14
1Q15
Exchange rate (LHS)
Volatility (RHS)
CN¥/100US$
Sources: State Administration of Foreign Exchange and Haver Analytics.
Index

World Economy
OPEC Monthly Oil Market Report – September 2015 29
Graph 3.20: Chinese consumer price index (CPI) vs. producer price index (PPI)
Graph 3.21: Chinese trade balance
The PMI, a composite indicator designed to provide a single-figure snapshot of operating conditions in the manufacturing economy, registered 47.3 in August, up slightly from the earlier flash reading of 47.1 but still down from 47.8 in July. The PMI has now posted below the neutral 50.0 value for six successive months, with the latest deterioration in operating conditions the sharpest since March 2009. August data signalled a second successive monthly fall in total new work placed at Chinese goods producers, with the rate of contraction quickening to a 17-month record. Panellists generally suggested that deteriorating market conditions had weakened client demand both at home and abroad during August. Furthermore, new export business declined at its steepest rate in just over two years. Softer client demand led manufacturers to scale back their production again in August, with the latest reduction in output the quickest seen since November 2011. Lower production requirements contributed to a further decline in purchasing activity in China’s manufacturing sector in August. Moreover, the rate of reduction quickened since July to the steepest recorded since March 2009. As a result, stocks of inputs also fell over the month, albeit at a modest rate. In contrast, inventories of finished goods rose slightly in August, with a number of companies suggesting that fewer sales had led to an accumulation of post-production stocks. Chinese manufacturing companies reduced their workforce numbers for the 22nd month in a row in August. Furthermore, the rate of job shedding accelerated since July to a pace that was similar to June’s 76-month record. Meanwhile, unfinished business increased for the fourth successive month, albeit only marginally. Manufacturing firms in China signalled a further fall in total input costs in August, with a number of monitored companies linking the decline to lower raw material costs. The rate of input price deflation was solid overall, despite easing since July.
-8-6-4-202468
Aug
13
Oct
13
Dec
13
Feb
14A
pr 1
4Ju
n 14
Aug
14
Oct
14
Dec
14
Feb
15A
pr 1
5Ju
n 15
Aug
15
CPICPI lower target bondPPIOfficial interest rate
Sources: China National Bureau of Statistics and Haver Analytics.
% change y-o-y
189
-138
-51
-200-150-100
-500
50100150200250
Aug
14
Sep
14
Oct
14
Nov
14
Dec
14
Jan
15Fe
b 15
Mar
15
Apr
15
May
15
Jun
15Ju
l 15
Aug
15
US$ bn
Exports Imports Trade balance
Sources: China Customs and Haver Analytics.

World Economy
30 OPEC Monthly Oil Market Report – September 2015
Graph 3.22: Chinese PMIs Graph 3.23: Chinese industrial production
The China growth forecast for 2015 was revised down from 6.9% to 6.8% also decreased expectations from 6.5% to 6.4% in 2016 from the previous month. OPEC Member Countries The non-oil producing private sector of Saudi Arabia gathered momentum in August with the PMI posting 58.7, up from 57.7 in July. This marks the highest reading of the index in five months and clearly suggests a strong improvement in business conditions. According to the survey, output, new business and job creation all rose at sharper rates in August. The rate of expansion in new orders in August was the quickest in the past four months. The growth of purchasing activity also expanded last month by the sharpest rate in five months. As a result of greater business requirements, employment picked up solidly. Graph 3.24: Saudi Arabia and UAE: PMIs
In the United Arab Emirates, business conditions of the non-oil private sector improved in August, with the PMI at a six-month high of 57.1 in August, up from 55.8 in July. The survey revealed marked expansion in output, while new orders rose at a higher rate, despite slower growth in exports.
48.8
47.3
46
47
48
49
50
51
52
53
54Au
g 14
Sep
14O
ct 1
4N
ov 1
4D
ec 1
4Ja
n 15
Feb
15M
ar 1
5A
pr 1
5M
ay 1
5Ju
n 15
Jul 1
5Au
g 15
Index
Sources: HSBC, Markit and Haver Analytics.
Composite PMI
Manufacturing PMI6.0%
5%
6%
7%
8%
9%
10%
Jul 1
4Au
g 14
Sep
14O
ct 1
4N
ov 1
4D
ec 1
4Ja
n 15
Feb
15M
ar 1
5Ap
r 15
May
15
Jun
15Ju
l 15
% change y-o-y
Sources: China National Bureau of Statistics and Haver Analytics.
58.757.1
50
55
60
65
Aug
13
Sep
13
Oct
13
Nov
13
Dec
13
Jan
14
Feb
14
Mar
14
Apr
14
May
14
Jun
14
Jul 1
4
Aug
14
Sep
14
Oct
14
Nov
14
Dec
14
Jan
15
Feb
15
Mar
15
Apr
15
May
15
Jun
15
Jul 1
5
Aug
15
Index
Saudi Arabia UAE
Sources: SAAB, HSBC, Markit and Haver Analytics.

World Economy
OPEC Monthly Oil Market Report – September 2015 31
Other Asia In Indonesia, GDP grew short of 4.7% y-o-y in 2Q15, slightly down from a revised 4.7% expansion reported in the previous period. It is the slowest growth since 3Q09. Private consumption expanded by 5.0% y-o-y, more or less the same as the preceding quarter. Government spending rose by 2.3% in 1Q15, after registering 2.7% growth in 2Q15. GFCF grew by 3.6% y-o-y, slowing from an expansion of 4.3% in the preceding quarter. Exports fell 0.1%, following a 0.9% decline in 1Q. Imports declined by 6.9%, accelerating from a 2.3% fall in 1Q. The country’s manufacturing sector remained in slowing business conditions in August. The sector’s PMI posted 48.4 in August, slightly up from July’s 47.3. Manufacturers reported continued deceleration in production and new business, while input cost inflation hovered at an eight-month high. In Vietnam, GDP expanded 6.3% y-o-y in 2Q15, from 6.0% in the preceding quarter. The services industry grew 5.9% y-o-y, from 5.8% in 1Q15. Industry and construction increased 9.1% y-o-y in 2Q15, following the 8.4% growth in 1Q15. Meanwhile, agriculture, forestry and fishery expanded 2.4% in 2Q15, from 2.1% in the preceding quarter. The country’s manufacturing sector witnessed a weaker increase in production and new orders in August, while new export orders shrank for the third consecutive month. The manufacturing PMI registered 51.3 in August, down from 52.6 in July. Graph 3.25: Manufacturing PMIs in Vietnam and Indonesia
Africa The PMI of South Africa improved to 49.3 in August from 46.4 in July, though it remained in the contraction area for the third month in a row. Production and new orders declined further on scaled-back purchasing activities. GDP growth slowed in 2Q15 to 1.2% y-o-y, from 2.1% in the previous quarter. Electricity shortages and labour disputes negatively affected output from the key mining and manufacturing sectors. In Egypt, the non-oil private sector showed signs of improvement in its business conditions in August, with the PMI rebounding to expansionary territory at 51.2, up from 49.2 in July. The survey outcomes showed renewed growth in output and new orders, while employment fell in August for the eighth time in the previous nine months.
51.3
48.4
44
46
48
50
52
54
56
Aug
13
Sep
13
Oct
13
Nov
13
Dec
13
Jan
14
Feb
14
Mar
14
Apr
14
May
14
Jun
14
Jul 1
4
Aug
14
Sep
14
Oct
14
Nov
14
Dec
14
Jan
15
Feb
15
Mar
15
Apr
15
May
15
Jun
15
Jul 1
5
Aug
15
Index
Vietnam Indonesia
Sources: HSBC, Markit and Haver Analytics.
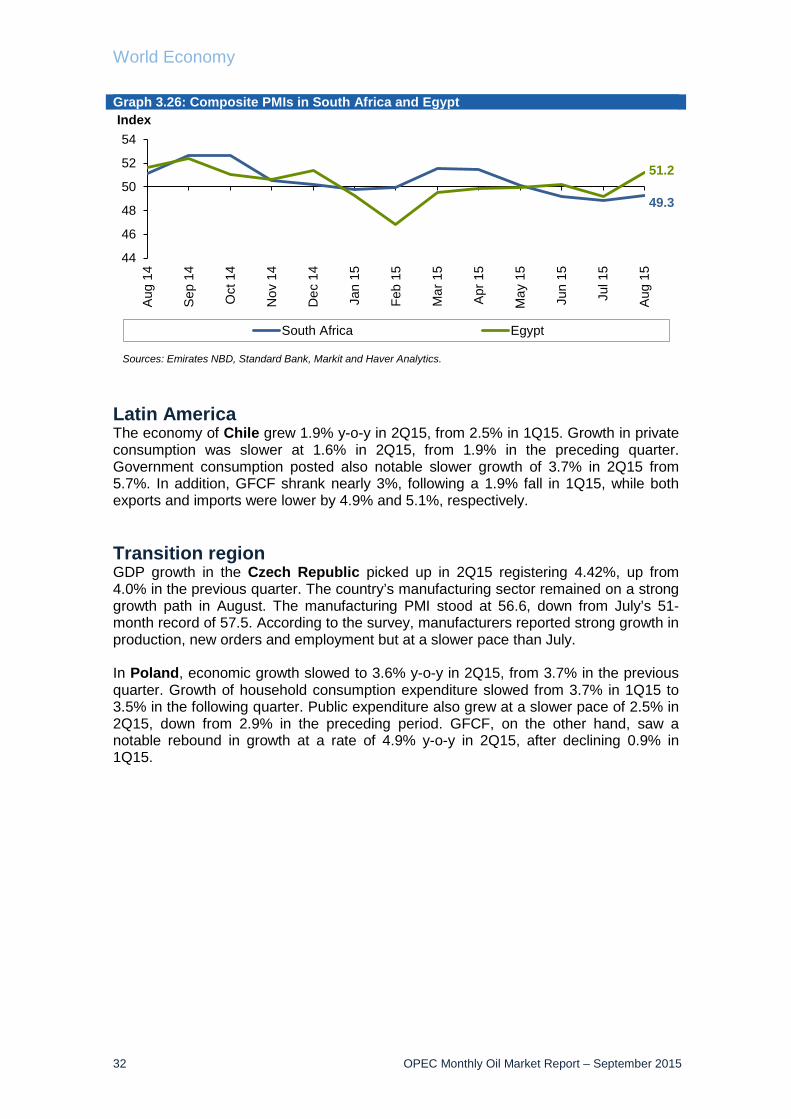
World Economy
32 OPEC Monthly Oil Market Report – September 2015
Graph 3.26: Composite PMIs in South Africa and Egypt
Latin America The economy of Chile grew 1.9% y-o-y in 2Q15, from 2.5% in 1Q15. Growth in private consumption was slower at 1.6% in 2Q15, from 1.9% in the preceding quarter. Government consumption posted also notable slower growth of 3.7% in 2Q15 from 5.7%. In addition, GFCF shrank nearly 3%, following a 1.9% fall in 1Q15, while both exports and imports were lower by 4.9% and 5.1%, respectively. Transition region GDP growth in the Czech Republic picked up in 2Q15 registering 4.42%, up from 4.0% in the previous quarter. The country’s manufacturing sector remained on a strong growth path in August. The manufacturing PMI stood at 56.6, down from July’s 51-month record of 57.5. According to the survey, manufacturers reported strong growth in production, new orders and employment but at a slower pace than July. In Poland, economic growth slowed to 3.6% y-o-y in 2Q15, from 3.7% in the previous quarter. Growth of household consumption expenditure slowed from 3.7% in 1Q15 to 3.5% in the following quarter. Public expenditure also grew at a slower pace of 2.5% in 2Q15, down from 2.9% in the preceding period. GFCF, on the other hand, saw a notable rebound in growth at a rate of 4.9% y-o-y in 2Q15, after declining 0.9% in 1Q15.
49.3
51.2
44
46
48
50
52
54A
ug 1
4
Sep
14
Oct
14
Nov
14
Dec
14
Jan
15
Feb
15
Mar
15
Apr
15
May
15
Jun
15
Jul 1
5
Aug
15
Index
South Africa Egypt
Sources: Emirates NBD, Standard Bank, Markit and Haver Analytics.
World Economy
OPEC Monthly Oil Market Report – September 2015 33
Oil prices, US dollar and inflation In August, the US dollar was relatively resilient compared to its major currency counterparts, on average. Compared to the euro, the US dollar fell by 1.3% in August and stood at a monthly average of $1.1136/€. Compared to the yen, the US dollar was flat. It fell by 0.3% versus the pound sterling and gained 1.5% compared to the Swiss franc The major development in the foreign exchange markets, however, was the surprise adjustment of the Chinese yuan. On a monthly average the yuan declined by 3.1% versus the US dollar. While this is a relatively minor adjustment, it was surprising and had therefore a ripple effect on other emerging market currencies. Amid a weakening economy, the Brazilian real fell by 9.0% m-o-m on average in August. It fell by around one-third since the beginning of the year. The Russian ruble also continued its decline in August as it fell by 14.2% m-o-m versus the US dollar. The expectation of rising interest rates in the US will provide further support to the ongoing strength of the US dollar. Only in the case of a strengthening recovery in the Euro-zone might this trend turn. However, with low inflation in both the Euro-zone and Japan, and an ongoing unprecedented stimulus programmes in both economies, as well as in China, the US dollar is forecast to remain strong in the short-term. In nominal terms, the price of the OPEC Reference Basket (ORB) fell by a monthly average of $8.73, or 16.1%, from $54.19/b in July to $45.46/b in August. In real terms, after accounting for inflation and currency fluctuations, the ORB declined by 16.7%, or $6.16, to $30.77/b from $36.93/b (base June 2001=100). Over the same period, the US dollar fell by 0.6% against the import-weighted modified Geneva I + US dollar basket* while inflation remained unchanged.
* The ‘modified Geneva I+US$ basket’ includes the euro, the Japanese yen, the US dollar, the pound sterling and the Swiss franc, weighted according to the merchandise imports of OPEC Member Countries from the countries in the basket.

World Oil Demand
34 OPEC Monthly Oil Market Report – September 2015
World Oil Demand World oil demand growth in 2015 was revised upward by around 84 tb/d as a result of better-than-expected performance from OECD America and Europe in 1H15. As a result, 2015 world oil demand growth currently stands at 1.46 mb/d, leading to total global consumption of 92.79 mb/d. In contrast, world oil demand growth in 2016 was revised downward by 50 tb/d due to the projected slower economic momentum in Latin America and China. World oil demand growth is now anticipated at 1.29 mb/d, leading to total global consumption of around 94.08 mb/d. World oil demand in 2015 Table 4.1: World oil demand in 2015, mb/d
OECD Americas The latest monthly data implies bullish US oil demand for June 2015, showing a y-o-y increase of about 0.7 mb/d or 3.8%. Approximately half of the growth in June 2015 oil requirements, around 0.35 mb/d, originates in gasoline, which was particularly supported by low fuel prices – approximately 27% lower than the same month in 2014 – and higher mileage – around 3.9% y-o-y. Growing gasoline demand is in line with an expanding US vehicle market, particularly for sport utility (SUV) and cross-over vehicles. Steep increases in oil requirements have also originated in jet/fuel and propane/propylene requirements, while the overall June 2015 oil demand growth of 0.7 mb/d has been only partly offset by declines in the requirements for distillates and residual fuel oil. Six months in 2015 show US oil demand higher by around 0.4 mb/d compared with the same period last year. The main characteristics in 1H14 were strongly growing gasoline and propane/propylene demand, while residual fuel oil and distillate requirements declined. July 2015 figures, which are based on preliminary weekly data, show an increase of around 4.4% y-o-y, with gasoline and jet fuel requirements rising, but are partly offset by disappointing distillate and residual fuel oil
2014 1Q15 2Q15 3Q15 4Q15 2015 Growth %Americas 24.17 24.24 24.13 24.66 24.98 24.51 0.33 1.38 of which US 19.36 19.59 19.41 19.74 20.09 19.71 0.35 1.81Europe 13.49 13.52 13.77 13.89 13.42 13.65 0.16 1.17Asia Pacific 8.16 8.77 7.72 7.58 8.16 8.05 -0.11 -1.31Total OECD 45.82 46.53 45.62 46.13 46.57 46.21 0.39 0.84Other Asia 11.32 11.40 11.77 11.68 11.61 11.61 0.29 2.58 of which India 3.79 4.01 3.98 3.76 3.99 3.93 0.15 3.90Latin America 6.60 6.40 6.66 7.03 6.76 6.72 0.11 1.67Middle East 8.14 8.24 8.21 8.74 8.15 8.34 0.19 2.37Africa 3.78 3.88 3.87 3.79 3.94 3.87 0.09 2.38Total DCs 29.85 29.92 30.50 31.24 30.46 30.53 0.69 2.30FSU 4.54 4.39 4.23 4.63 4.94 4.55 0.01 0.20Other Europe 0.65 0.65 0.61 0.65 0.74 0.67 0.01 2.03China 10.46 10.44 11.06 10.63 11.19 10.83 0.37 3.51Total "Other regions" 15.66 15.48 15.91 15.92 16.87 16.05 0.39 2.49
Total world 91.33 91.93 92.03 93.28 93.90 92.79 1.46 1.60Previous estimate 91.33 91.88 91.76 93.24 93.90 92.70 1.38 1.51Revision 0.00 0.05 0.27 0.04 0.00 0.09 0.08 0.09
Totals may not add up due to independent rounding.
Change 2015/14

World Oil Demand
OPEC Monthly Oil Market Report – September 2015 35
demand. August 2015 preliminary data for the main products indicates another strong month in US oil demand, with gasoline being the leading product in the main month of the holiday driving season. As a result of these factors, US oil demand is projected to remain strong throughout the remainder of 2015, with transportation fuels taking the largest share. Moreover, the US is projected to remain the main contributor to OECD oil demand during 2015 and 2016. Graph 4.1: US oil consumption, y-o-y changes
In Mexico, July 2015 was marked by strongly increasing gasoline, jet/fuel and diesel demand, which was partly offset by declining residual fuel oil requirements. Consequently, Mexican oil demand in July 2015 increased by almost 2% y-o-y. 2015 Mexican oil demand remained unchanged since last month and is expected to decline by 1.6% y-o-y; for 2016, oil demand is projected to grow again slightly as a result of positive economic expectations. Canadian oil requirements fell for another month y-o-y in June 2015, with all the main product categories, except LPG, declining. Projections for 2015 Canadian oil demand remain at the same level as in the previous month, leaving oil requirements during 2015 declining compared with 2014. Depending on the development of the overall economy, 2016 growth in Canadian oil demand is projected to slightly exceed 2015, which has remained unchanged since last month. After the latest upward revision to 2015 OECD Americas demand data, 2016 oil demand in the region is now anticipated to be almost unchanged from 2015. Oil demand growth in 2016 will be driven by a slight improvement in economic conditions. 2016 US oil demand is now projected to grow at a slower pace than in 2015. 2016 forecasts are focused on growth in the US economy and oil price levels. In addition to further expansions in the petrochemical industry, on the other hand, some downside risks would result from higher fuel substitution with natural gas and implementation of fuel efficiencies in the road transportation sector.
-600-400-200
0200400600800
1,0001,2001,400
Aug
13
Sep
13
Oct
13
Nov
13
Dec
13
Jan
14
Feb
14
Mar
14
Apr
14
May
14
Jun
14
Jul 1
4
Aug
14
Sep
14
Oct
14
Nov
14
Dec
14
Jan
15
Feb
15
Mar
15
Apr
15
May
15
Jun
15
Jul 1
5
Aug
15
tb/d
All other Distllates Gasoline Total oil

World Oil Demand
36 OPEC Monthly Oil Market Report – September 2015
Graph 4.2: Quarterly world oil demand growth
In 2015, OECD Americas oil demand is projected to grow by 0.33 mb/d compared with 2014. 2016 OECD Americas oil demand is forecast to increase by the same rate compared with 2015. OECD Europe European oil demand continued to rise in July 2015 for another month, increasing by an estimated 0.22 mb/d or more than 3% y-o-y in the Big 4 regional consumers (Germany, the UK, France and Italy). The increase was substantial and only slightly smaller in volume than in previous months this year, particularly 1Q15, which involved also the impact of cold weather and some low baseline effects. Although continuing economic concerns in some parts of the region pose some uncertainty as far as the development of oil demand in the region during 2015 and 2016, positive developments were the dominating factors during the previous month. Data for the first seven months of 2015 showed increasing European Big 4 oil demand by approximately 3.2% y-o-y, with transportation fuels, notably diesel, accounting for the bulk of the increases. This was in line with the positive momentum in auto sales, which showed solid increases of around 8% during the first seven months of 2015 y-o-y, and with solid expansions in all major auto markets. The general expectations for the region’s oil demand during 2015 have certainly improved since last month’s projections, but are still coupled with uncertainties that depend on the region’s economic developments. Moreover, high taxation polices in oil use and fuel substitutions are the main factors that could curb oil demand, despite economic growth, low baselines and low fuel price environments. For 2016, developments in the region’s economies, in view of the low oil price environment, are the main assumptions for the OECD Europe forecast for 2016. From a products point of view, transportation fuels, particularly diesel and gasoline, are projected to lead oil consumption in 2016. On the other hand, high uncertainties linked to economic turbulences and budget cuts as well as fuel substitution and efficiencies in the road transportation sectors remain negative factors for oil demand in the region next year. OECD Europe’s oil demand is projected to grow by 0.16 mb/d in 2015 for the first time since 2006, while 2016 oil demand is anticipated to remain roughly at the level of 2015.
-1,000
-500
0
500
1,000
1,500
2,000
1Q 2Q 3Q 4Q 1Q 2Q 3Q 4Q 1Q 2Q 3Q 4Q
2014 2015forecast
2016forecast
tb/d
OECD Non-OECD Total world

World Oil Demand
OPEC Monthly Oil Market Report – September 2015 37
Table 4.2: Europe Big 4* oil demand, tb/d
OECD Asia Pacific In July 2015, Japanese oil demand contracted slightly by 0.04 mb/d or around 1% y-o-y, with a mixed picture across product categories. Gasoline and naphtha experienced substantial gains of more than 5% and 12% y-o-y, respectively, while oil requirements in crude for direct burning and electricity generation fell for one more month by a massive 62 tb/d or more than 41% y-o-y, as a result of fuel substitution with natural gas and coal. A further decline in Japanese direct crude and fuel oil usage is expected in August, as a result of the restart of the first nuclear plant in the country. New auto sales in August 2015 were also less than promising, showing a 2% y-o-y decrease, the eighth consecutive monthly decrease. The outlook for 2015 Japanese oil demand has been lowered slightly from last month, with the risks being once more skewed towards the downside, as a result of weaker economic forecasts. Table 4.3: Japanese domestic sales, tb/d
In South Korea, June 2015 oil demand came up increasing by more than 82 tb/d or approximately 3.5% y-o-y. Gains in the petrochemical industry, which called for increasing naphtha requirements and gas/diesel oil, were partly offset by sharply declining requirements in fuel oil and LPG. The outlook for South Korean oil consumption during 2015 and 2016 remains healthy, unchanged as compared to last month’s projections. Oil demand projections for 2016 remain unchanged since last month and assume a higher likelihood that a number of Japanese nuclear plants will re-join operation. Additionally, slightly better economic conditions as projected for 2015 are also assumed. Petrochemical plants are expected to be the oil demand driver in 2016with a slight improvement in transportation fuels. OECD Asia Pacific oil consumption is projected to fall by 0.11 mb/d in 2015, while the drop will continue also in 2016 by 0.14 mb/d y-o-y.
Jul 15 Jul 14 Change from Jul 14 Change from Jul 14, %LPG 370 353 18 5.0Gasoline 1,140 1,139 1 0.1Jet/Kerosene 858 782 76 9.7Gas/Diesel oil 3,352 3,234 118 3.7Fuel oil 312 261 51 19.5Other products 1,096 1,137 -42 -3.7Total 7,128 6,906 222 3.2
* Germany, France, Italy and the UK.
Jul 15 Change from Jul 14 Change from Jul 14, %LPG 392 -6 -1.5Gasoline 967 50 5.4Naphtha 767 85 12.5Jet fuel 95 -13 -11.8Kerosene 89 -3 -3.3Gasoil 564 -9 -1.5Fuel oil 389 -83 -17.6Other products 62 1 1.9Direct crude burning 88 -62 -41.3
Total 3,414 -39 -1.1

World Oil Demand
38 OPEC Monthly Oil Market Report – September 2015
Other Asia In India, oil demand growth remains strong, with July 2015 growth data showing a healthy rise. Oil demand increased by around 0.2 mb/d, or 5.5% y-o-y, a very optimistic kick start to 3Q15, taking total product consumption in India to 3.82 mb/d. In terms of product performance, fuel oil was the star product in July, rising by more than 50 tb/d or more than 25% y-o-y. The manufacturing sector performance played a part in this increase as sub-sectors such as steel and petrochemicals recorded increases in fuel oil requirements. Additionally, the manufacturing Purchasing Managers’ Index (PMI) registered its second highest reading in 2015, after the month of January, of 52.7 points, well above the threshold of 50, separating expansion from contraction. For other products, the trend almost mirrors previous months, with LPG and gasoline dominating product growth with increases of more than 10% and 12% y-o-y, respectively. Growth in gasoline demand reached 53 tb/d y-o-y in July. This rise is attributed to a number of factors, including the reduction in gasoline retail prices, which have been reduced twice since June. Graph 4.3: Changes in Indian oil demand, y-o-y
Sales of passenger vehicles, specifically the two wheelers that use gasoline as a fuel, continued to increase, reaching 1.3 million units in July, which is 0.3% above the same month a year earlier. This indicates a shift of consumer preference from diesel to gasoline vehicles. LPG demand has registered increases for almost 24 consecutive months, as a result of an increase in new connections and the streamlining of sales schemes between commercial and residential customers. LPG increased by 52 tb/d compared with July 2015. Diesel consumption, on the other hand, fell slightly by 7 tb/d or down by 0.5% y-o-y to reach total consumption of 1.48 mb/d. This slight drop can be a result of heavy rains reducing agricultural requirements in addition to a decline in the movement of goods between different states due to floods hindering transportation. In Indonesia, the latest June 2015 data shows yet another increase of around 1.8% after an increase of 2.7% y-o-y in May. All products showed positive performances with the exception of the “other products” category. Cumulatively, the 1H15 performance for Indonesia has been positive, increasing by around 43 tb/d, which equates to around 3% compared with the same period a year earlier.
-300
-200
-100
0
100
200
300
400
Jul 1
3
Aug
13
Sep
13
Oct
13
Nov
13
Dec
13
Jan
14
Feb
14
Mar
14
Apr 1
4
May
14
Jun
14
Jul 1
4
Aug
14
Sep
14
Oct
14
Nov
14
Dec
14
Jan
15
Feb
15
Mar
15
Apr 1
5
May
15
Jun
15
Jul 1
5
tb/d
LPG Gasoline Kerosene Diesel oil Fuel oil Other products

World Oil Demand
OPEC Monthly Oil Market Report – September 2015 39
In Thailand, oil demand in June 2015 was also encouraging, with growth levels of around 3% y-o-y, led by transportation fuels. The picture for 2016 remains as highlighted in the previous month’s report with assumptions indicating better economic conditions than in 2015 with a continued low oil price environment. India is projected to be the major contributor to growth. On the other hand, a decreased effect of subsidies on oil demand compared with previous years is predicted. Middle distillates, followed by gasoline, are the leading products for oil demand growth in 2016. Other Asia’s oil demand is anticipated to grow by 0.29 mb/d y-o-y in 2015. As for 2016, oil demand is forecast to increase by 0.29 mb/d. Table 4.4: Indian oil demand by main products, tb/d
Latin America In July 2015, oil demand eased in Brazil compared with a year earlier, decreasing around 8 tb/d or 0.3% y-o-y as economic conditions continued to deteriorate. This marks the fourth month of declining oil consumption in the country in 2015. However, year-to-date data up to July barely remains in positive territory. In 1Q15, oil demand growth registered an increase of more than 60 tb/d, primarily as a result of severe drought conditions in parts of the country promoting additional oil requirements. In July, all products showed declines, with the exception of ethanol. Ethanol requirements picked up by a solid 0.11 tb/d or more than 52% y-o-y, with total consumption surpassing the 0.30 mb/d mark by 14 tb/d, the highest level since 2009. This increase was at the expense of gasoline, which declined sharply by around 46 tb/d or more than 6% y-o-y. This occurrence is price-related, as lower ethanol prices encouraged additional consumption of the product. Furthermore, the outlook for gasoline demand in Brazil looks bearish at this stage, compounded by several factors, such as the healthy sugar cane growing season, which is providing lower prices for ethanol, rising unemployment and weak consumer sentiment. Diesel oil demand fell by a 46 tb/d or more than 4% y-o-y, with total consumption slightly above the 1.0 mb/d as major macroeconomic indicators of the country – GDP growth, PMI and the unemployment rate – worsen. Table 4.5: Brazilian inland deliveries, tb/d
Jul 15 Jul 14 Change Change, %LPG 549 498 52 10.4Gasoline 466 413 53 12.9Kerosene 259 260 -1 -0.3Diesel oil 1,480 1,487 -7 -0.5Fuel oil 259 206 52 25.4Other products 805 754 51 6.7
Total oil demand 3,817 3,617 200 5.5
Jul 15 Jul 14 Change Change, %LPG 247 250 -3 -1.4Gasoline 695 741 -46 -6.2Jet/Kerosene 133 134 0 -0.3Diesel 1,007 1,052 -46 -4.4Fuel oil 74 95 -21 -22.0Alcohol 314 206 108 52.6
Total 2,470 2,479 -8 -0.3

World Oil Demand
40 OPEC Monthly Oil Market Report – September 2015
In Argentina, the latest available data for the month of June 2015 showed healthy growth of around 40 tb/d or more than 5% y-o-y as almost all products showed significant increases, with the exception of LPG and fuel oil. Transportation fuels have led the growth with gasoline, diesel oil and jet/kerosene increasing by more than 9%, 4% and 2% y-o-y, respectively. In 2016, projections for oil demand growth in Latin America are 20 tb/d lower than last month’s forecast, as a result of lower expectations for a boost in economic activity in Brazil. Brazil is projected to be the main contributor to growth, led by transportation fuels. Latin American oil demand is expected to grow in 2015 by 0.11 mb/d, while 2016 demand is forecast to increase to 0.13 mb/d. Middle East In Saudi Arabia, despite growing transportation fuel requirements in July 2015, overall oil demand declined slightly for the second time in 2015. Total oil demand dipped by a mere 4 tb/d to stand at 2.74 mb/d. Traditionally, oil requirements tend to increase during summer as air conditioning usage increases, however, the high base line of 2014 caused crude for direct burning to dip by around 50 tb/d, or down 6% y-o-y, dragging total consumption of the country lower. Having said that, total demand of crude for the purpose of burning remained elevated at 0.85 mb/d. Transportation fuels, namely gasoline and jet/kerosene, registered positive growth as both products tend to increase during the summer season, which also coincided with the holy month of Ramadan. Gasoline gained more than 5% over July 2014 and jet/kerosene increased by more than 10% y-o-y. On the other hand, diesel oil dipped by 34 tb/d or around 4% y-o-y, as construction activities and other outdoor works were reduced amid high temperatures and the fasting during the holy month of Ramadan. Fuel oil was firmly in the positive, increasing by more than 24 tb/d or 6% y-o-y, mainly as a result of additional requirements for power generation fuels. Graph 4.4: Oil demand growth in the Middle East, y-o-y
-100
0
100
200
300
400
500
-100
0
100
200
300
400
500
1Q12 2Q12 3Q12 4Q12 1Q13 2Q13 3Q13 4Q13 1Q14 2Q14 3Q14 4Q14 1Q15 2Q15
tb/dtb/d
Saudi Arabia Iran, I.R. Kuwait UAE Others
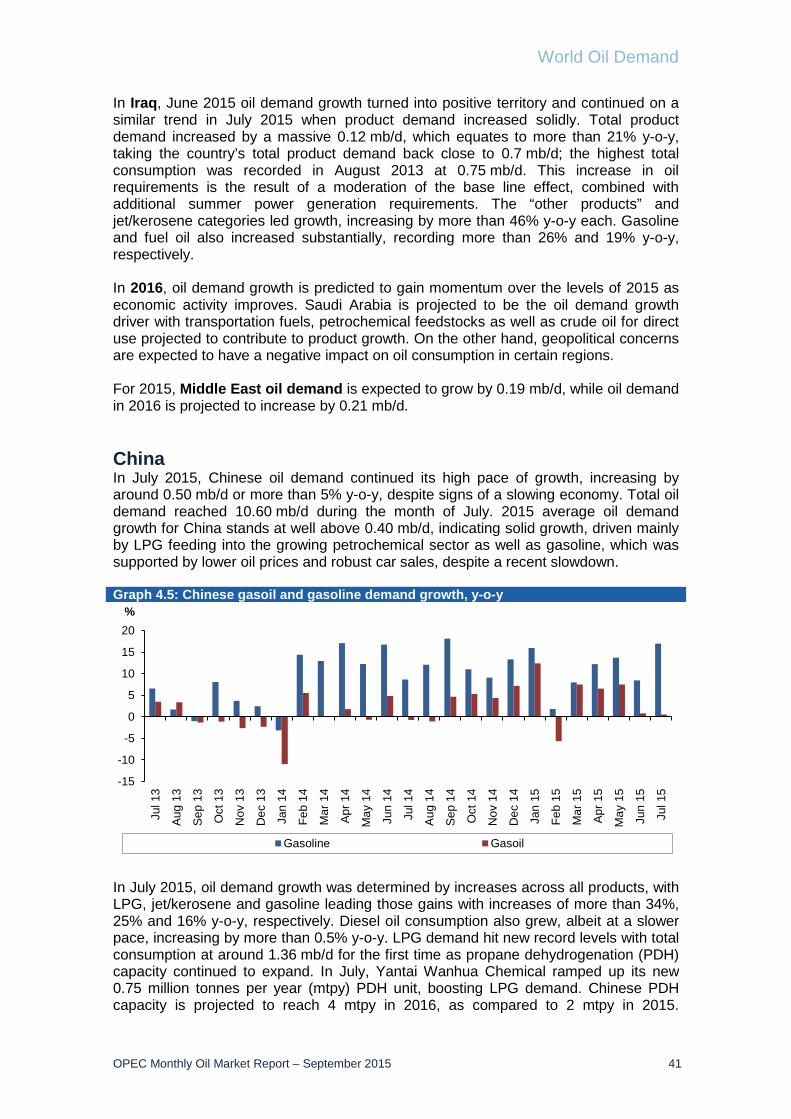
World Oil Demand
OPEC Monthly Oil Market Report – September 2015 41
In Iraq, June 2015 oil demand growth turned into positive territory and continued on a similar trend in July 2015 when product demand increased solidly. Total product demand increased by a massive 0.12 mb/d, which equates to more than 21% y-o-y, taking the country’s total product demand back close to 0.7 mb/d; the highest total consumption was recorded in August 2013 at 0.75 mb/d. This increase in oil requirements is the result of a moderation of the base line effect, combined with additional summer power generation requirements. The “other products” and jet/kerosene categories led growth, increasing by more than 46% y-o-y each. Gasoline and fuel oil also increased substantially, recording more than 26% and 19% y-o-y, respectively. In 2016, oil demand growth is predicted to gain momentum over the levels of 2015 as economic activity improves. Saudi Arabia is projected to be the oil demand growth driver with transportation fuels, petrochemical feedstocks as well as crude oil for direct use projected to contribute to product growth. On the other hand, geopolitical concerns are expected to have a negative impact on oil consumption in certain regions. For 2015, Middle East oil demand is expected to grow by 0.19 mb/d, while oil demand in 2016 is projected to increase by 0.21 mb/d. China In July 2015, Chinese oil demand continued its high pace of growth, increasing by around 0.50 mb/d or more than 5% y-o-y, despite signs of a slowing economy. Total oil demand reached 10.60 mb/d during the month of July. 2015 average oil demand growth for China stands at well above 0.40 mb/d, indicating solid growth, driven mainly by LPG feeding into the growing petrochemical sector as well as gasoline, which was supported by lower oil prices and robust car sales, despite a recent slowdown. Graph 4.5: Chinese gasoil and gasoline demand growth, y-o-y
In July 2015, oil demand growth was determined by increases across all products, with LPG, jet/kerosene and gasoline leading those gains with increases of more than 34%, 25% and 16% y-o-y, respectively. Diesel oil consumption also grew, albeit at a slower pace, increasing by more than 0.5% y-o-y. LPG demand hit new record levels with total consumption at around 1.36 mb/d for the first time as propane dehydrogenation (PDH) capacity continued to expand. In July, Yantai Wanhua Chemical ramped up its new 0.75 million tonnes per year (mtpy) PDH unit, boosting LPG demand. Chinese PDH capacity is projected to reach 4 mtpy in 2016, as compared to 2 mtpy in 2015.
-15
-10
-5
0
5
10
15
20
Jul 1
3
Aug
13
Sep
13
Oct
13
Nov
13
Dec
13
Jan
14
Feb
14
Mar
14
Apr
14
May
14
Jun
14
Jul 1
4
Aug
14
Sep
14
Oct
14
Nov
14
Dec
14
Jan
15
Feb
15
Mar
15
Apr
15
May
15
Jun
15
Jul 1
5
%
Gasoline Gasoil

World Oil Demand
42 OPEC Monthly Oil Market Report – September 2015
Jet/kerosene total consumption was at 0.68 mb/d, up by 0.16 mb/d, boosted by the summer holiday season. Gasoline demand was higher by around 0.40 mb/d y-o-y as oil prices remained low compared with last year. Additional support came from healthy SUV sales, despite the decline in overall car sales. According to statistics and analysis from the China Association of Automobile Manufacturers (CAAM) in July, sales of passenger cars witnessed a decline, dropping by 1.27 million units or more than 6% y-o-y, with the exception of SUV sales. On a cumulative basis, with data up to July, sales of passenger cars reached 11.36 million units, which is up by more than 3% from the same period in 2014. For the same period of comparison, SUVs continued with substitutional growth as sales were up by a massive 44% y-o-y. Multi-purpose vehicles (MPV) hit double-digit growth during the same period with an increase close to 13% y-o-y. Diesel oil increased by around 19 tb/d, showing signs of slower momentum than in previous months, a similar trend to China’s PMI indicator. The PMI register recorded 50 points in July, which is on the border between expansion and contraction. Total consumption of diesel stands currently at around 3.45 mb/d. For 2016, projections for oil demand development in China are slightly lower than anticipated in last month’s report amid expectations of slower economic activity than previously assumed. Projections are based on transportation and industrial fuels, which are expected to rise next year, lower GDP growth compared with 2015, a continuation of the fuel quality programmes that target reduced emissions, as well as the continuation of fuel substitution with natural gas and coal. Graph 4.6: Changes in Chinese apparent oil demand, y-o-y changes
For 2015, China’s oil demand is anticipated to grow by around 0.37 mb/d, while 2016 oil demand growth is expected to be approximately 0.30 mb/d.
-600-400-20002004006008001,000
-600-400-200
0200400600800
1,000
Jan Feb Mar Apr May Jun Jul Aug Sep Oct Nov Dec
tb/dtb/d
Historical range 2014 2015* 2016*
* Forecast.

World Oil Demand
OPEC Monthly Oil Market Report – September 2015 43
Table 4.6: World oil demand in 2016, mb/d
2015 1Q16 2Q16 3Q16 4Q16 2016 Growth %Americas 24.51 24.54 24.47 25.01 25.31 24.83 0.33 1.33 of which US 19.71 19.84 19.71 20.05 20.38 20.00 0.28 1.45Europe 13.65 13.53 13.76 13.87 13.39 13.64 -0.01 -0.08Asia Pacific 8.05 8.62 7.58 7.45 8.03 7.92 -0.13 -1.66Total OECD 46.21 46.69 45.81 46.32 46.73 46.39 0.18 0.39Other Asia 11.61 11.70 12.06 11.97 11.90 11.91 0.29 2.50 of which India 3.93 4.16 4.12 3.90 4.14 4.08 0.15 3.69Latin America 6.72 6.55 6.79 7.15 6.90 6.85 0.13 1.98Middle East 8.34 8.45 8.42 8.96 8.36 8.55 0.21 2.55Africa 3.87 3.97 3.96 3.88 4.04 3.96 0.10 2.49Total DCs 30.53 30.67 31.23 31.95 31.20 31.26 0.73 2.40FSU 4.55 4.45 4.29 4.68 4.99 4.60 0.05 1.13Other Europe 0.67 0.67 0.63 0.67 0.76 0.69 0.02 3.00China 10.83 10.77 11.35 10.93 11.48 11.13 0.30 2.79Total "Other regions" 16.05 15.89 16.27 16.28 17.24 16.42 0.37 2.33
Total world 92.79 93.24 93.32 94.56 95.18 94.08 1.29 1.39Previous estimate 92.70 93.26 93.11 94.55 95.21 94.04 1.34 1.44Revision 0.09 -0.01 0.21 0.00 -0.04 0.04 -0.05 -0.06
Change 2016/15
Totals may not add up due to independent rounding.

World Oil Supply
44 OPEC Monthly Oil Market Report – September 2015
World Oil Supply Non-OPEC oil supply is estimated to have averaged 57.43 mb/d in 2015, revised down by 33 tb/d in absolute volume from the previous Monthly Oil Market Report (MOMR), while y-o-y growth was revised down by 72 tb/d to average 0.88 mb/d. Non-OPEC supply growth was revised down, due to a downward revision in US oil production growth by 0.17 mb/d, in which 1H15 was revised down by an average of 0.07 mb/d based on a new production estimation methodology adopted by the US Energy Information Administration (EIA). Meanwhile, there have been upward revisions in certain countries. At the same time, non-OPEC historical data in 2014 was revised up by 40 tb/d to average 56.55 mb/d. OECD Americas is expected to be the main driver of growth, increasing by 0.67 mb/d in 2015. Non-OPEC oil supply is projected to grow by 0.16 mb/d in 2016, down by 0.11 mb/d from the previous assessment, to average 57.59 mb/d, mostly on the back of Brazil’s lower estimation and the US reduction carried over from 2015. OPEC NGLs and non-conventional liquids grew by 190 tb/d to average 6.01 mb/d in 2015, and they are also forecast to grow by 0.17 mb/d to average 6.18 mb/d in 2016. In August 2015, OPEC crude oil production increased by a marginal 13 tb/d to average 31.54 mb/d, according to secondary sources. As a result, preliminary data indicates that world oil supply decreased by 0.53 mb/d in August to average 94.62 mb/d.
Forecast for 2015 Non-OPEC supply Non-OPEC oil supply is estimated to average to 57.43 mb/d in 2015, indicating an increase of 0.88 mb/d over the previous year. Expected non-OPEC supply growth in 2015 is lower than the average experienced during the previous years. The main driver of output is OECD Americas, which is forecast to increase by 0.67 mb/d in 2015. Predicted growth in 2015 for non-OPEC supply saw a downward adjustment of 72 tb/d, compared with one month ago on the back of lower-than-expected US output in 1Q15 (based on a new downward revision in US production in 1H15, reflected in the EIA’s new methodology from 31 August 2015, as well as the lower-than-expected assumed output for 2H15). Moreover, some upward revisions were introduced this month outside North America, with growth in North Sea, FSU, Middle East, and Other Asia. Among non-OPEC producers, OECD supply will grow by 0.66 mb/d in 2015 over the previous year. In North America, there are signs that US production has started to respond to reduced investment and activity. Indeed, all eyes are on how quickly US production falls. Canadian production recovered in August, rising by 0.5 mb/d m-o-m to 4.4 mb/d, as maintenance and wildfire-related outages ended and oil sands output totaled 2.4 mb/d, which partially offset the decline in US production. In Latin America, a rise in Brazilian output came as a result of the connection of new wells in both the Santos and Campos basins, which helped pre-salt production rise to a record high of 0.87 mb/d in early July. However, this was offset by an equal fall in Colombian output, which registered a 2.7% y-o-y decline as the Vasconia grade was under force majeure owing to pipeline attacks. Finally, total oil output in Latin America was steady at 5.16 mb/d in April, May and June.

World Oil Supply
OPEC Monthly Oil Market Report – September 2015 45
Graph 5.1: Regional non-OPEC supply growth, y-o-y
Non-OPEC oil supply in 1H15 was revised down slightly compared to last month’s estimation to average 57.80 mb/d and 2H15 was revised down by 61 tb/d to now average 57.06 mb/d. According to this new adjustment and updated data, 3Q15 is expected to yield the lowest quarterly supply at 56.92 mb/d. On a regional basis, OECD Americas in 3Q15 saw a downward revision, while FSU, OECD Europe, China and Middle East experienced upward revisions. Unplanned supply disruptions among non-OPEC producers averaged about 0.7 mb/d in July, about 0.1 mb/d lower compared with the previous month. In Canada, outages decreased and oil sands production returned to normal, following the wildfires in western Canada. Additionally, output at Mexico’s Abkatun Pol Chuc system continued to recover following an explosion at the offshore facility. On a quarterly basis, non-OPEC supply for 2015 is estimated to average 57.96 mb/d, 57.65 mb/d, 56.92 mb/d and 57.20 mb/d, respectively.
-0.4
0.0
0.4
0.8
1.2
1.6
2.0
-0.4
0.0
0.4
0.8
1.2
1.6
2.0
OECDAmerica
OECDEurope
OECD AsiaPacific
OtherAsia
LatinAmerica
Middle East Africa FSU
mb/dmb/d
14/13 15/14 16/15
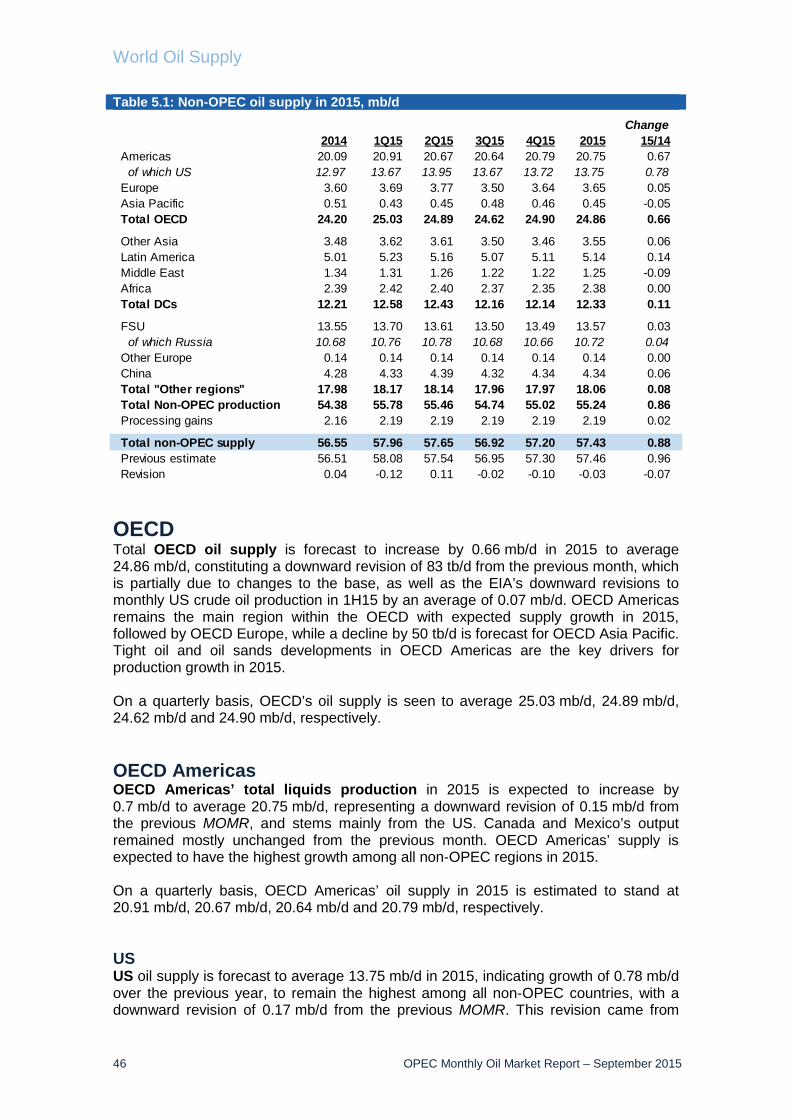
World Oil Supply
46 OPEC Monthly Oil Market Report – September 2015
Table 5.1: Non-OPEC oil supply in 2015, mb/d
OECD Total OECD oil supply is forecast to increase by 0.66 mb/d in 2015 to average 24.86 mb/d, constituting a downward revision of 83 tb/d from the previous month, which is partially due to changes to the base, as well as the EIA’s downward revisions to monthly US crude oil production in 1H15 by an average of 0.07 mb/d. OECD Americas remains the main region within the OECD with expected supply growth in 2015, followed by OECD Europe, while a decline by 50 tb/d is forecast for OECD Asia Pacific. Tight oil and oil sands developments in OECD Americas are the key drivers for production growth in 2015. On a quarterly basis, OECD’s oil supply is seen to average 25.03 mb/d, 24.89 mb/d, 24.62 mb/d and 24.90 mb/d, respectively. OECD Americas OECD Americas’ total liquids production in 2015 is expected to increase by 0.7 mb/d to average 20.75 mb/d, representing a downward revision of 0.15 mb/d from the previous MOMR, and stems mainly from the US. Canada and Mexico’s output remained mostly unchanged from the previous month. OECD Americas’ supply is expected to have the highest growth among all non-OPEC regions in 2015. On a quarterly basis, OECD Americas’ oil supply in 2015 is estimated to stand at 20.91 mb/d, 20.67 mb/d, 20.64 mb/d and 20.79 mb/d, respectively. US US oil supply is forecast to average 13.75 mb/d in 2015, indicating growth of 0.78 mb/d over the previous year, to remain the highest among all non-OPEC countries, with a downward revision of 0.17 mb/d from the previous MOMR. This revision came from
Change2014 1Q15 2Q15 3Q15 4Q15 2015 15/14
Americas 20.09 20.91 20.67 20.64 20.79 20.75 0.67 of which US 12.97 13.67 13.95 13.67 13.72 13.75 0.78Europe 3.60 3.69 3.77 3.50 3.64 3.65 0.05Asia Pacific 0.51 0.43 0.45 0.48 0.46 0.45 -0.05Total OECD 24.20 25.03 24.89 24.62 24.90 24.86 0.66
Other Asia 3.48 3.62 3.61 3.50 3.46 3.55 0.06Latin America 5.01 5.23 5.16 5.07 5.11 5.14 0.14Middle East 1.34 1.31 1.26 1.22 1.22 1.25 -0.09Africa 2.39 2.42 2.40 2.37 2.35 2.38 0.00Total DCs 12.21 12.58 12.43 12.16 12.14 12.33 0.11
FSU 13.55 13.70 13.61 13.50 13.49 13.57 0.03 of which Russia 10.68 10.76 10.78 10.68 10.66 10.72 0.04Other Europe 0.14 0.14 0.14 0.14 0.14 0.14 0.00China 4.28 4.33 4.39 4.32 4.34 4.34 0.06Total "Other regions" 17.98 18.17 18.14 17.96 17.97 18.06 0.08Total Non-OPEC production 54.38 55.78 55.46 54.74 55.02 55.24 0.86Processing gains 2.16 2.19 2.19 2.19 2.19 2.19 0.02
Total non-OPEC supply 56.55 57.96 57.65 56.92 57.20 57.43 0.88Previous estimate 56.51 58.08 57.54 56.95 57.30 57.46 0.96Revision 0.04 -0.12 0.11 -0.02 -0.10 -0.03 -0.07

World Oil Supply
OPEC Monthly Oil Market Report – September 2015 47
overall revisions for 1H15 by the EIA on 31 August 2015 based on its new date gathering methodology used for the first time in addition to data gathered from US state agencies of 0.07 mb/d. US preliminary June liquids output was lower m-o-m by 80 tb/d, totalling 13.86 mb/d. Crude output in June also fell by 0.10 mb/d m-o-m to 9.30 mb/d. This was the second month that US crude declined (first time was in May), with total crude production dropping by 0.21 mb/d. June’s figure is likely to be revised lower again as maintenance continued in the Gulf of Mexico (GOM) from May, while works commenced in Alaska in June and continued through early 3Q15. Graph 5.2: US annual liquids production and annual growth
Eagle Ford wells brought online are expected to fall to around 2,700 from 4,000 in 2014, according to analyst group Wood Mackenzie Ltd. The company’s most recent analysis cites that production growth is slow in the near term, but the full effect of lower oil prices is moderated by improved recoveries in core areas. Eagle Ford is expected to produce 2 mb/d of oil and condensate by 2020, the report said. The company divided the play into nine sub-plays, three of which account for about 75% of Eagle Ford’s remaining NPV10 reserves. The Karnes Trough, Edwards Condensate and Black Oil sub-plays are predicted to grow at an average of 10% in 2015, the company said. The study highlighted the Karnes Trough as having one of the lowest breakeven levels in the lower 48 at $42/b. Y-o-y, NPV is up $27 billion due to well performance improvements as well as de-risking of acreage. Spending cuts have impacted all shale plays in the US, however, Eagle Ford is expected to attract $20 billion in development costs in 2015. US oil production breakdown in 2015 US total oil supply is anticipated to grow by 0.78 mb/d to average 13.75 mb/d in 2015, representing a downward revision of 0.17 mb/d from the last monthly report. The expected growth for each component of production type consists of: tight crude at 450 tb/d, onshore conventional crude at -30 tb/d, GOM oil output at 140 tb/d, unconventional NGLs at 190 tb/d, other NGLs at 30 tb/d, and unconventional fuels (biofuels and other liquids) are expected to remain unchanged in 2015. The detailed table can be seen in the US section of the 2016 forecast. The US oil supply and growth distribution in 2015 and 2016 can be seen in the table below, with 1H15 figures established from actual data and other figures based on
13.75 13.97
0.78 0.220%2%4%6%8%10%12%14%16%18%
02468
10121416
2009 2010 2011 2012 2013 2014 2015(forecast)
2016(forecast)
Percentagemb/d
US annual production Y-o-y growth % change y-o-y growth (RHS)
Source: OPEC Secretariat.
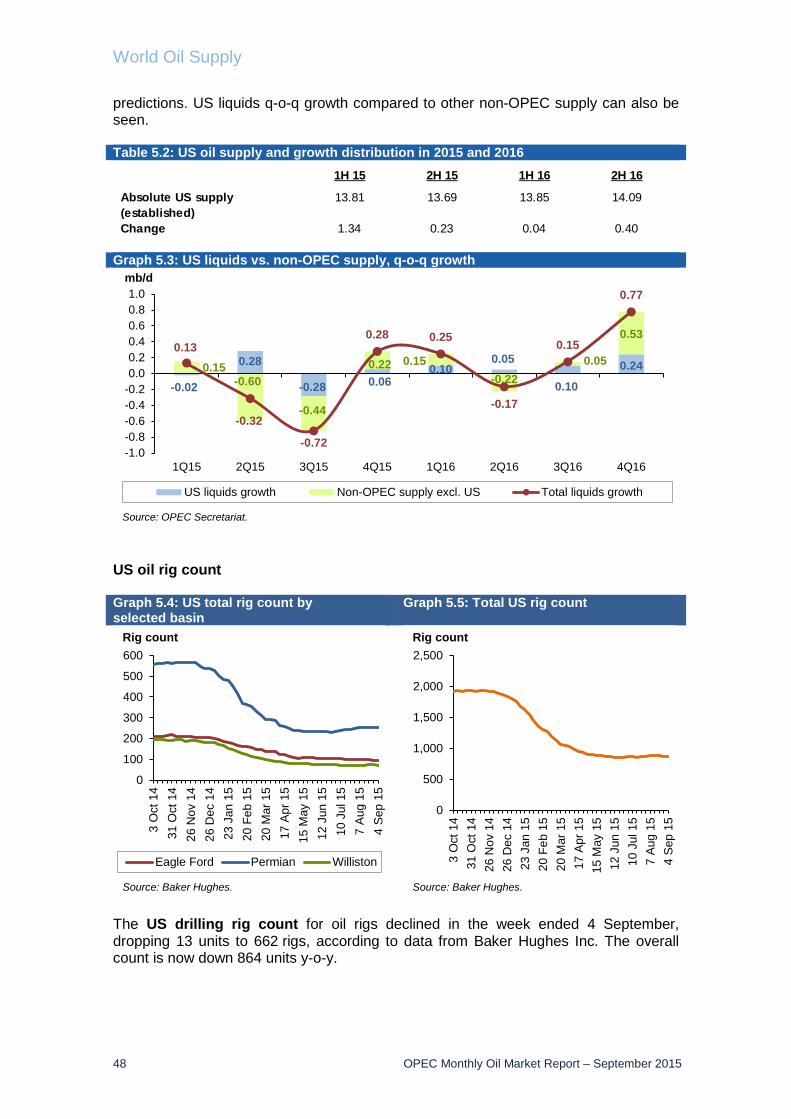
World Oil Supply
48 OPEC Monthly Oil Market Report – September 2015
predictions. US liquids q-o-q growth compared to other non-OPEC supply can also be seen. Table 5.2: US oil supply and growth distribution in 2015 and 2016
Graph 5.3: US liquids vs. non-OPEC supply, q-o-q growth
US oil rig count Graph 5.4: US total rig count by selected basin
Graph 5.5: Total US rig count
The US drilling rig count for oil rigs declined in the week ended 4 September, dropping 13 units to 662 rigs, according to data from Baker Hughes Inc. The overall count is now down 864 units y-o-y.
-0.02
0.28
-0.28 0.060.10
0.05
0.10
0.240.15-0.60
-0.44
0.22 0.15-0.22
0.05
0.530.13
-0.32
-0.72
0.28 0.25
-0.17
0.15
0.77
-1.0-0.8-0.6-0.4-0.20.00.20.40.60.81.0
1Q15 2Q15 3Q15 4Q15 1Q16 2Q16 3Q16 4Q16
mb/d
US liquids growth Non-OPEC supply excl. US Total liquids growth
Source: OPEC Secretariat.
0
100
200
300
400
500
600
3 O
ct 1
431
Oct
14
26 N
ov 1
426
Dec
14
23 J
an 1
520
Feb
15
20 M
ar 1
517
Apr
15
15 M
ay 1
512
Jun
15
10 J
ul 1
57
Aug
154
Sep
15
Eagle Ford Permian Williston
Source: Baker Hughes.
Rig count
0
500
1,000
1,500
2,000
2,500
3 O
ct 1
431
Oct
14
26 N
ov 1
426
Dec
14
23 J
an 1
520
Feb
15
20 M
ar 1
517
Apr
15
15 M
ay 1
512
Jun
15
10 J
ul 1
57
Aug
154
Sep
15
Source: Baker Hughes.
Rig count
1H 15 2H 15 1H 16 2H 16
Absolute US supply(established)
13.81 13.69 13.85 14.09
Change 1.34 0.23 0.04 0.40
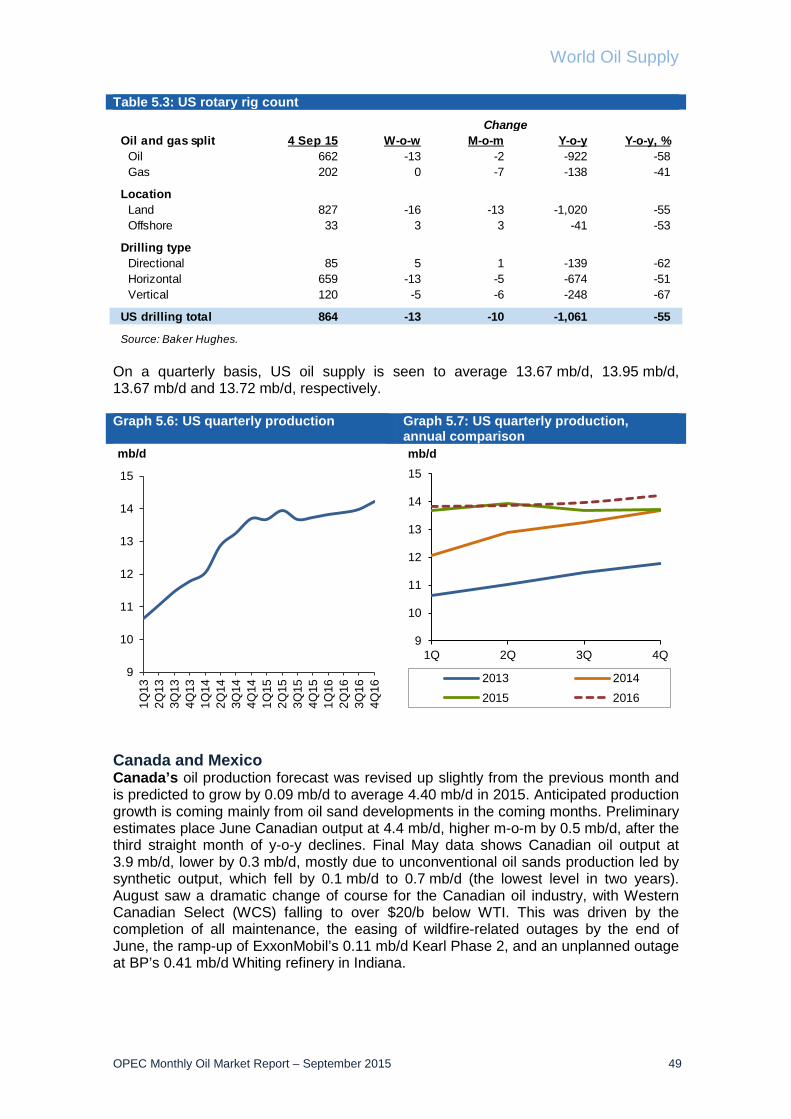
World Oil Supply
OPEC Monthly Oil Market Report – September 2015 49
Table 5.3: US rotary rig count
On a quarterly basis, US oil supply is seen to average 13.67 mb/d, 13.95 mb/d, 13.67 mb/d and 13.72 mb/d, respectively. Graph 5.6: US quarterly production Graph 5.7: US quarterly production,
annual comparison
Canada and Mexico Canada’s oil production forecast was revised up slightly from the previous month and is predicted to grow by 0.09 mb/d to average 4.40 mb/d in 2015. Anticipated production growth is coming mainly from oil sand developments in the coming months. Preliminary estimates place June Canadian output at 4.4 mb/d, higher m-o-m by 0.5 mb/d, after the third straight month of y-o-y declines. Final May data shows Canadian oil output at 3.9 mb/d, lower by 0.3 mb/d, mostly due to unconventional oil sands production led by synthetic output, which fell by 0.1 mb/d to 0.7 mb/d (the lowest level in two years). August saw a dramatic change of course for the Canadian oil industry, with Western Canadian Select (WCS) falling to over $20/b below WTI. This was driven by the completion of all maintenance, the easing of wildfire-related outages by the end of June, the ramp-up of ExxonMobil’s 0.11 mb/d Kearl Phase 2, and an unplanned outage at BP’s 0.41 mb/d Whiting refinery in Indiana.
9
10
11
12
13
14
15
1Q13
2Q13
3Q13
4Q13
1Q14
2Q14
3Q14
4Q14
1Q15
2Q15
3Q15
4Q15
1Q16
2Q16
3Q16
4Q16
mb/d
9
10
11
12
13
14
15
1Q 2Q 3Q 4Q
mb/d
2013 20142015 2016
Oil and gas split 4 Sep 15 W-o-w M-o-m Y-o-y Y-o-y, % Oil 662 -13 -2 -922 -58 Gas 202 0 -7 -138 -41
Location Land 827 -16 -13 -1,020 -55 Offshore 33 3 3 -41 -53
Drilling type Directional 85 5 1 -139 -62 Horizontal 659 -13 -5 -674 -51 Vertical 120 -5 -6 -248 -67
US drilling total 864 -13 -10 -1,061 -55
Source: Baker Hughes.
Change

World Oil Supply
50 OPEC Monthly Oil Market Report – September 2015
Although some previously announced oil sand projects have been put on hold, the vast majority continue as planned, including the Imperial Oil and Cenovus oil sand projects, which are scheduled to come online by the end of 2016.
On a quarterly basis, Canada’s oil supply is seen to average 4.58 mb/d, 4.16 mb/d, 4.35 mb/d and 4.48 mb/d, respectively. Mexico’s oil supply is projected to average 2.60 mb/d in 2015, a decline of 0.2 mb/d from one year ago, yet unchanged from the previous month’s prediction. According to actual production data in June, Mexico’s oil supply rose m-o-m by 30 tb/d to 2.61 mb/d, with crude output at 2.25 mb/d, lower y-o-y by 0.19 mb/d. The oil output average of 2.60 mb/d during 1H15 constituted a decline of 0.26 mb/d from the same period in 2014. The preliminary national as well as Pemex data show that crude oil output grew by 20 tb/d to 2.27 mb/d in July and August. Nevertheless, total liquids production in 3Q15 by an average of 2.61 mb/d was down y-o-y by 0.16 mb/d, while the highest drop occurred in 2Q15, when Mexican output declined by 0.3 mb/d, due to heavy maintenance at mature fields. Mexican oil production relies on mature fields located in shallow water for over 80% of its production. The startup of the KMZ fields (Ku, Maloob and Zaap fields) have offset declines at the Cantarell field in recent years, although declines have been recorded in the Ku, Maloob and even Chicontepec fields this year. Pemex is conducting maintenance at the 49 tb/d Samaria field in the second half of August. On a quarterly basis, Mexico’s oil supply is expected to average 2.65 mb/d, 2.55 mb/d, 2.61 mb/d and 2.58 mb/d, respectively. OECD Europe Total OECD Europe’s oil supply is forecast to grow by 50 tb/d in 2015 to average 3.65 mb/d, revised up by 24 tb/d from the previous MOMR. Oil supply from Norway and the UK are seen to increase in 2015, while oil production in Denmark and other OECD Europe are expected to decline from the previous year. North Sea July output eased m-o-m by around 84 tb/d, with Norwegian liquids output flat m-o-m at 1.95 mb/d, whereas UK output fell m-o-m as summer maintenance picked up and Buzzard had some problems with power outages. UK output has benefitted from the startup of several small fields since 2013, which continues in 2015 (59 tb/d) and 2016 (0.14 mb/d). This should help North Sea output to see lower annual declines. Norway’s oil supply is predicted to increase by 30 tb/d to average 1.92 mb/d in 2015, revised up by 10 tb/d from the previous MOMR. Preliminary production figures for July 2015 show an average production of about 1.95 mb/d of oil, NGLs and condensate. This is the same as in June 2015. The average daily liquid production in July stood at 1.56 mb of oil, 0.34 mb of NGLs and 0.04 mb of condensate, supported by new fields such as Gudrun, Svalin, Valemon and Knarr ramping up. Gulfaks South started at the end of July, while the first well was drilled at Gina Krog. Oil production is 1.4% above July of last year. Norwegian oil production is about 6.6% above the Norwegian Petroleum Directorate (NPD) prognosis for the month. Final production figures from June 2015 show an average daily production of about 1.569 mb of oil and 0.378 mb of NGLs and condensate. On a quarterly basis, Norway’s oil supply is expected to average 1.93 mb/d, 1.93 mb/d, 1.86 mb/d and 1.94 mb/d, respectively.

World Oil Supply
OPEC Monthly Oil Market Report – September 2015 51
Graph 5.8: Norway’s annual liquids production and annual growth
The UK’s oil supply is estimated to average 0.91 mb/d in 2015, indicating an increase of 50 tb/d compared with one year ago, revised up by 15 tb/d from the previous MOMR. UK liquids production declined by 20 tb/d m-o-m to average 0.92 mb/d in July, with an unplanned disruption at the Buzzard field earlier in the month, in addition to two of three trains at the Kinneil gas processing plant going offline for work later in the month, restricting flows on the Forties pipeline system (FPS). Graph 5.9: UK annual liquids production and annual growth
In the current oil price environment, the UKCs remain an unattractive area for investment given steep decline rates, high de-commissioning costs and an unfavourable fiscal regime. Already Maersk is seeking approval to shut its 4 tb/d Janice field in mid-2016. But, for now, rising output continues to pressurize light sweet crudes, with Brent coming under added downward pressure from rising North Sea output amidst record stock levels. Nevertheless, crude oil output in July was higher y-o-y by 0.15 m/d to average 0.84 mb/d. August saw works continue, likely taking output to the year’s lows (Forties loading programme falls to 0.35 mb/d before rising strongly in September to 0.47 mb/d). Condensate from the Britannia gas field that feeds into the FPS was offline until 18 August whilst the Elgin-Franklin field was shut for 10 days in early August. The FPS was also shut for a couple of days for planned works in early August. Buzzard, however, was stable in August, with its proportion in Forties rising to 58% in early August, the highest level in two years, before falling back to 48% towards
1.92 1.94
0.03 0.02
-10%
-8%
-6%
-4%
-2%
0%
2%
4%
-0.5
0.0
0.5
1.0
1.5
2.0
2.5
2009 2010 2011 2012 2013 2014 2015(forecast)
2016(forecast)
Percentagemb/d
Norway annual production Y-o-y growth % change y-o-y growth (RHS)
Source: OPEC Secretariat.
0.91 0.91
0.05 0.00
-20%
-15%
-10%
-5%
0%
5%
10%
-0.4-0.20.00.20.40.60.81.01.21.41.6
2009 2010 2011 2012 2013 2014 2015(forecast)
2016(forecast)
Percentagemb/d
UK annual production Y-o-y growth % change y-o-y growth (RHS)
Source: OPEC Secretariat.
World Oil Supply
52 OPEC Monthly Oil Market Report – September 2015
month-end. It is expected that UK oil output in 3Q15 will decrease by 0.14 mb/d to about 0.86 mb/d. On a quarterly basis, the UK’s oil production stands at 0.93 mb/d, 1.0 mb/d, 0.83 mb/d and 0.89 mb/d, respectively. OECD Asia Pacific Oil production in OECD Asia Pacific is forecast to average 0.45 mb/d in 2015, a decline of 50 tb/d compared with one year earlier, yet unchanged from the previous MOMR. On a quarterly basis, OECD Asia Pacific’s oil output is estimated to average 0.43 mb/d, 0.45 mb/d, 0.48 mb/d and 0.46 mb/d, respectively. Australia’s oil supply is expected to decrease by 50 tb/d in 2015 to average 0.37 mb/d, unchanged in total supply from the previous month’s assessment. Australian crude oil output in June recovered to 0.33 mb/d following maintenance but remained lower y-o-y by 34 tb/d, the sixth straight month of y-o-y declines. Australian liquids production in 2Q15 declined by 15% compared to 2Q14 to average 0.36 mb/d, indicating an approximate 11% decline in crude oil production to 195 tb/d and a drop in condensate output in 2Q15 by 15% to average 105 tb/d. NGLs also declined by 14 tb/d to average 28 tb/d in the same quarter. According to Energy Quest’s quarterly report, oil production from the Bonaparte, Camarvon, Canning, Cooper, Gippsland JV and South-Bowen basins declined in 2Q15 compared to 2Q14, while oil production increased at the Amadeus field and output from the Perth basin was steady in the same quarter. Oil production in 2Q15 decreased mainly at the Gippsland JV (-12 tb/d) and Pyrenees (-12 tb/d) fields. Only the Balnaves and Van Gogh/Coniston fields had significant increases in quarterly production (+14 tb/d each). On a quarterly basis, Australia’s oil supply is seen to stand at 0.35 mb/d, 0.36 mb/d, 0.40 mb/d and 0.39 mb/d, respectively. Developing countries Total oil supply in developing countries (DCs) is forecast to average 12.33 mb/d in 2015, representing an increase of 0.11 mb/d over 2014, revised up by 28 tb/d from the previous month. Latin America and Other Asia are the only two regions forecasting supply growth, while production from the Middle East is expected to see a decline, and Africa’s oil production will remain steady in 2015. Latin America is now forecast to experience the second largest increase among all non-OPEC regions, supported by Brazil. On a quarterly basis, total supply in DCs is seen to average 12.58 mb/d, 12.43 mb/d, 12.16 mb/d and 12.14 mb/d, respectively. According to preliminary and estimated data, DCs’ oil supply averaged 12.50 mb/d during 1H15, an increase of 0.42 mb/d compared with the same period one year earlier, mainly achieved in Latin America.

World Oil Supply
OPEC Monthly Oil Market Report – September 2015 53
Graph 5.10: Developing countries’ quarterly production
Graph 5.11: Developing countries’ quarterly production, annual comparison
Other Asia Other Asia’s oil supply is expected to increase by 60 tb/d in 2015 to average 3.55 mb/d, a positive growth development compared to 2014. The 2015 forecast indicates that Malaysia, Thailand, Vietnam and Asia other countries’ oil supply may grow, while oil production from India and Indonesia are seen to decline, although Indonesia’s production in the current year is growing compared to last year’s decline. Oil production from Brunei will remain steady for the remainder of the year. On a quarterly basis, total supply from Other Asia is seen to average 3.62 mb/d, 3.61 mb/d, 3.50 mb/d and 3.46 mb/d, respectively. Indonesia’s crude oil production increased by 40 tb/d m-o-m in July to 0.71 mb/d, and growth of 30 tb/d is expected in August, when output at the newly started Banyu Urip project is expected to reach 0.15 mb/d at its peak. The field produced at 85 tb/d in July. India’s oil supply is seen to average 0.86 mb/d in 2015, a decline of 20 tb/d compared with one year ago, revised down in growth by 10 tb/d from the previous MOMR. India's crude oil production has been more or less flat at 0.87 mb/d in 1H15 compared with the same period one year earlier, but output is expected to decrease by 20 tb/d in 2H15. Weak production indicates that India — the world's fourth largest energy consumer — will remain a strong oil importer. On a quarterly basis, India’s oil supply is seen to stand at 0.87 mb/d, 0.86 mb/d, 0.85 mb/d and 0.84 mb/d, respectively. Vietnam produced 0.36 mb/d of crude oil in July, up by 20% y-o-y. Vietnam recently revised up its crude output target for 2015 in an attempt to offset falling oil prices, which dropped by 20 tb/d to 0.34 mb/d. In 2014, five wells were drilled at TGT’s main field, while three were drilled in TGT’s H5 fault block. SOCO expects five or six wells to be drilled in 2015 with three of the wells targeting H5 reservoirs. First oil from the H5 fault block is expected in September or October 2015. Total production from the field is currently forecast to range from 10,500 to 12,000 boe/d without the addition of H5 to the well stream. HLJOC plans to submit a revised TGT Full Field Development Plan in 3Q15 that will incorporate the results from the ERC Equipoise resource study announced at the end of 2014.
11.8
11.9
12.0
12.1
12.2
12.3
12.4
12.5
12.6
12.71Q
132Q
133Q
134Q
131Q
142Q
143Q
144Q
141Q
152Q
153Q
154Q
151Q
162Q
163Q
164Q
16
mb/d
11.811.912.012.112.212.312.412.512.612.7
1Q 2Q 3Q 4Q
mb/d
2013 20142015 2016

World Oil Supply
54 OPEC Monthly Oil Market Report – September 2015
Malaysia’s crude and condensate output slipped by 60 tb/d in July 2015 to 0.65 mb/d. The yearly average production of Malaysia is expected to grow by 60 tb/d to 0.75 mb/d this year, unchanged from the previous month’s estimation. At Gumusut-Kakap’s main facility, planned maintenance activities to install gas handling and injection systems commenced on 9 June and were completed by the end of July. Thailand’s oil output is expected to grow by 10 tb/d to average 0.4 mb/d in 2015, revised up by 10 tb/d in absolute supply from last month’s estimation. Oil production in July increased by 20 tb/d to average 0.4 mb/d, and it is expected to remain steady in August. Oil production has started from the Wassana field at the G10/48 concession in the Gulf of Thailand, and operator KrisEnergy Ltd. expects peak production to reach 10 tb/d by year-end as additional development wells are drilled and completed by the Key Gibraltar jack-up rig. KrisEnergy became the operator of the G10/48 block in May 2014. Work is now underway to bring another five wells on stream and to optimize production in this initial wave of drilling. The field is the first in a series of KrisEnergy-operated developments in Thailand, Cambodia and Indonesia. As many as 15 development wells are planned for Wassana: 14 producer wells and one water disposal well. The Wassana development comprises the Ingenium mobile offshore production unit, a mooring buoy and the Rubicon Vantage floating storage offloading vessel. The G10/48 contract area covers 4,696 sq. km over the Southern Pattani basin in 60 m of water. Latin America Latin America’s oil production is projected to average 5.14 mb/d in 2015, an increase of 0.14 mb/d over 2014, revised up from the previous month. The revision made Latin America the second top non-OPEC producing region after North America. Brazil is expected to support this growth, while other main countries in this region are expected to decline in 2015, except Colombia. On a quarterly basis, total supply in Latin America is seen to average 5.23 mb/d, 5.16 mb/d, 5.07 mb/d and 5.11 mb/d, respectively. Argentina’s oil supply is expected to decline by 10 tb/d in 2015 to average 0.69 mb/d, steady from the previous MOMR. Argentina’s supply continued to be stable despite a lack of new production as per preliminary data. Liquids output in Argentina was flat in July m-o-m at 0.70 mb/d for the fourth consecutive month. State operator YPF stated in its 2Q15 earnings how investment from JV partners has slowed since the oil price fell, which will inevitably feed through to slower activity in the Vaca Muerta shale play. Colombia’s supply is expected to average 1.01 mb/d in 2015, representing a steady output compared to last year, revised up by 10 tb/d from the previous month. Preliminary data indicates that Colombia’s oil supply averaged 1.05 mb/d during 1H15, indicating an increase of 50 tb/d compared with the same period one year earlier, partly due to new startups of Rumba, LLA19, Santa Isabel, Block CPE6 and Loto-1x as well as higher outputs in the Rubiales and Castilla fields’ ramp-ups. The development of new fields such as Camosur, Rumi, Block CPO 17, LLA16, Guacharrios and Tambaqui as well as the redevelopment of the Capachos field will be implemented in 2016. Brazil’s liquids supply is forecast to grow by 0.18 mb/d in 2015 and average 3.03 mb/d, unchanged from the previous MOMR. Brazil’s oil supply increased by 0.31 mb/d in 1H15 compared with the same period one year ago, and has remained steady in 2H15 compared to 1H15. Out of the 3 mb/d production in Brazil, 2.4 mb/d is crude and condensate, 0.09 mb/d is NGLs and 0.53 mb/d is biofuels. On 8 July,

World Oil Supply
OPEC Monthly Oil Market Report – September 2015 55
Petrobras set a new daily oil production record in the pre-salt layer at 865 tb/d. This production does not include natural gas extraction. Monthly production was 798 tb/d, 6.9% higher than the existing record for June. The total liquids output in June dropped by 20 tb/d to average 3.02 mb/d, but preliminary data shows that July output increased by 50 tb/d to average 3.06 mb/d, supported by new wells coming online in the P-58 and P-62 platforms, both in the Campos basin, as well as the floating production, storage, and offloading (FPSO) facility Cidade de Mangaratiba in Iracema Sul in the Santos pre-salt basin. Graph 5.12: Brazil’s annual liquids production and annual growth
The end of July also saw the startup of FPSO Cidade de Itaguaí, which should support volumes in August. The facility came on stream and started production on 31 July from the Iracema North area of the Lula field on the Petroleo Brasileiro SA-operated BM-S-11 block, which is located in the Lula field in the Santos pre-salt basin, offshore Brazil. Eight production wells and nine injection wells will be connected to the FPSO, which is expected to reach peak production of 150 tb/d of oil and 8 million cubic meters (cu m) of gas per day in early 2017. Cidade de Itaguai is the second leased FPSO deployed on the Iracema development following Cidade de Mangaratiba’s startup last year and doubles the gross production capacity to 300,000 b/d of oil and 16 million cu m/d of natural gas. Cidade de Itaguai will also be able to store 1.6 mb of oil. Petrobras describes the oil from Iracema North as high-quality with medium density at 30º gravity. It will be transported by shuttle tankers. Petrobras last year reported plans to increase net production from its offshore pre-salt formation in the Campos and Santos basins to more than 2 mb/d of oil by 2020. Brazil’s relatively recent successes in bringing online a number of FPSO facilities that had been delayed are driving 2015 growth, with additional FPSOs slated to be delivered in 2016 at the Lula field. On a quarterly basis, Brazil’s oil supply is seen to stand at 3.06 mb/d, 3.02 mb/d, 3.03 mb/d and 3.04 mb/d, respectively. Middle East The Middle East’s oil supply is expected to decrease by 90 tb/d from 2014 to average 1.25 mb/d in 2015, representing an upward revision of 15 tb/d from the previous month. Within the Middle East, supplies from Oman are expected to grow in 2015, while output in Yemen and Bahrain is likely to decline and Syrian supply should remain unchanged.
3.03 3.14
0.18 0.11
-2%
0%
2%
4%
6%
8%
10%
12%
-0.50.00.51.01.52.02.53.03.5
2009 2010 2011 2012 2013 2014 2015(forecast)
2016(forecast)
Percentagemb/d
Brasil annual production Y-o-y growth % change y-o-y growth (RHS)
Source: OPEC Secretariat.

World Oil Supply
56 OPEC Monthly Oil Market Report – September 2015
Yemeni production is almost zero. The Middle East supply forecast remains associated with a high level of risk, mainly due to the unavailability of data and the political situation. On a quarterly basis, the Middle East’s oil supply is seen to stand at 1.31 mb/d, 1.26 mb/d, 1.22 mb/d and 1.22 mb/d, respectively. Oman’s oil production is forecast to average 0.97 mb/d in 2015, representing growth of 20 tb/d from the previous year, revised up by 15 tb/d from the previous MOMR. Omani oil production reached another record in July, averaging 1 mb/d, up m-o-m by 10 tb/d and y-o-y by 40 tb/d. Crude output increased by around 20 tb/d from June to average 0.89 mb/d, and the output of NGLs returned to the previous level in 1Q15 at 100 tb/d. Africa Africa’s oil production is anticipated to be steady in 2015 at 2.38 mb/d, indicating no changes in growth, but the absolute supply was revised down by a minor 10 tb/d from the previous MOMR. Oil production from Equatorial Guinea and Congo is expected to experience minor growth similar to last month’s prediction, while supply from other countries is predicted either to remain flat or decline. Oil output from South Sudan rose marginally m-o-m to around 0.17 mb/d in June. Efforts to resolve the 20-month conflict appeared to make some progress in August when the rebels signed a proposed peace deal, but it is unclear whether the government will accept it. On a quarterly basis, Africa’s oil supply is seen to stand at 2.42 mb/d, 2.40 mb/d, 2.37 mb/d and 2.35 mb/d, respectively. FSU, other regions Total FSU oil supply is estimated to increase by 30 tb/d in 2015 to average 13.57 mb/d, representing an upward revision of 24 b/d from the previous month. This revision came from Russia, while the supply forecast for others in this region remained steady from the previous MOMR. On a quarterly basis, FSU’s oil supply is expected to stand at 13.70 mb/d, 13.61 mb/d, 13.50 mb/d and 13.49 mb/d, respectively. Russia Russia’s oil production is forecast to increase by 40 tb/d to average 10.72 mb/d in 2015, indicating an upward revision of 26 tb/d from the previous MOMR. Russian output fell seasonally to 10.76 mb/d in July due to maintenance at Gazprom’s Surgut gas condensate plant. Overall, works were lower this year, keeping output higher y-o-y by 0.25 mb/d.

World Oil Supply
OPEC Monthly Oil Market Report – September 2015 57
Graph 5.13: Russia’s annual liquids production and annual growth
Preliminary data for August indicates that output returned to 10.80 mb/d, therefore the 3Q15 results are higher than expected before, and this could be the reason for the higher-than-expected growth of 60 tb/d for Russia in 2015. Graph 5.14: Russia’s quarterly production Graph 5.15: Russia’s quarterly production,
annual comparison
Caspian Kazakhstan’s oil production is projected to decrease by 10 tb/d in 2015 to average 1.62 mb/d, unchanged from the previous MOMR. Kazakhstan’s output rose m-o-m by 40 tb/d to 1.60 mb/d in July following the completion of maintenance at Tengiz. However, output was lower y-o-y by 40 tb/d (2.4%). This could be the maximum Annual Decline Rate (ADR) in Kazakhstan, although it was 1.2% in 2014 compared to a year ago. On a quarterly basis, Kazakhstan’s oil production is estimated to stand at 1.66 mb/d, 1.60 mb/d, 1.59 mb/d and 1.62 mb/d, respectively. Azerbaijan’s oil production is forecast to decline in 2015, averaging 0.86 mb/d, revised down by 10 tb/d from the previous month’s predictions. Crude oil production was at 0.76 mb/d, stagnant in May, June and July, and this average is less than the average
10.72 10.61
0.04
-0.11 -1.5%-1.0%-0.5%0.0%0.5%1.0%1.5%2.0%2.5%3.0%
-2
0
2
4
6
8
10
12
2009 2010 2011 2012 2013 2014 2015(forecast)
2016(forecast)
Percentagemb/d
Russia annual production Y-o-y growth % change y-o-y growth (RHS)
Source: OPEC Secretariat.
10.4
10.5
10.6
10.7
10.8
10.9
1Q13
2Q13
3Q13
4Q13
1Q14
2Q14
3Q14
4Q14
1Q15
2Q15
3Q15
4Q15
1Q16
2Q16
3Q16
4Q16
mb/d
10.4
10.5
10.6
10.7
10.8
1Q 2Q 3Q 4Q
mb/d
2013 20142015 2016
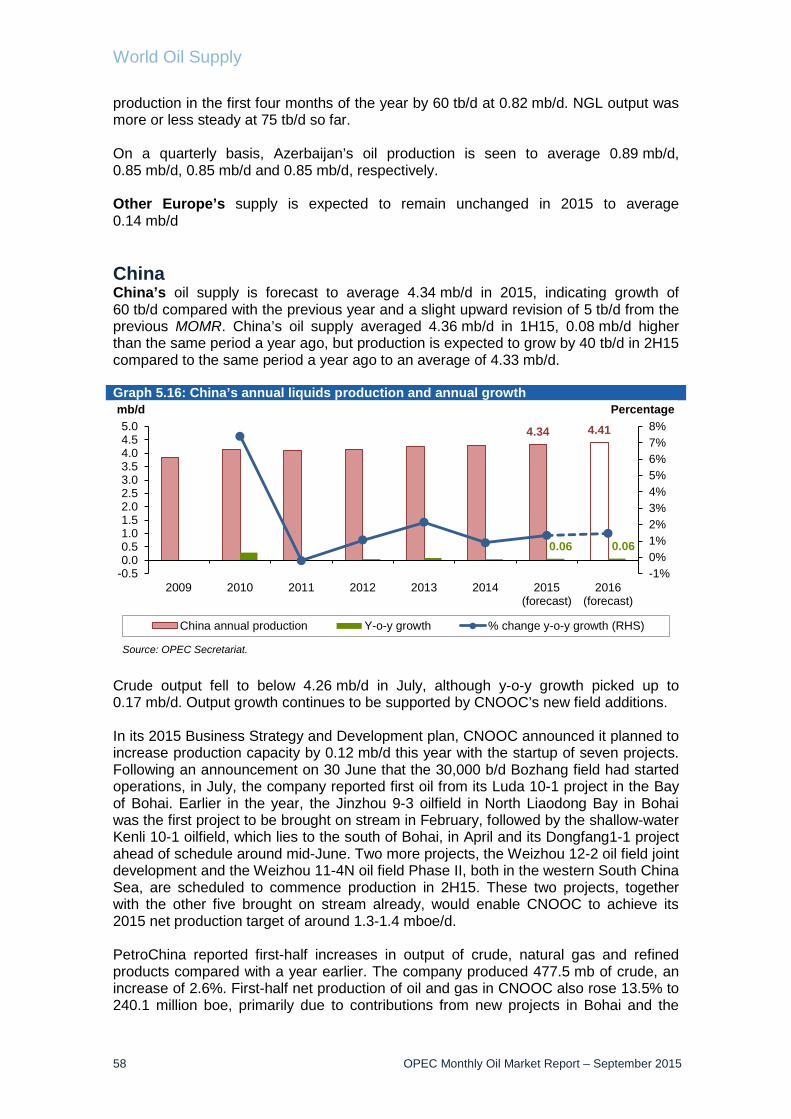
World Oil Supply
58 OPEC Monthly Oil Market Report – September 2015
production in the first four months of the year by 60 tb/d at 0.82 mb/d. NGL output was more or less steady at 75 tb/d so far. On a quarterly basis, Azerbaijan’s oil production is seen to average 0.89 mb/d, 0.85 mb/d, 0.85 mb/d and 0.85 mb/d, respectively. Other Europe’s supply is expected to remain unchanged in 2015 to average 0.14 mb/d China China’s oil supply is forecast to average 4.34 mb/d in 2015, indicating growth of 60 tb/d compared with the previous year and a slight upward revision of 5 tb/d from the previous MOMR. China’s oil supply averaged 4.36 mb/d in 1H15, 0.08 mb/d higher than the same period a year ago, but production is expected to grow by 40 tb/d in 2H15 compared to the same period a year ago to an average of 4.33 mb/d. Graph 5.16: China’s annual liquids production and annual growth
Crude output fell to below 4.26 mb/d in July, although y-o-y growth picked up to 0.17 mb/d. Output growth continues to be supported by CNOOC’s new field additions. In its 2015 Business Strategy and Development plan, CNOOC announced it planned to increase production capacity by 0.12 mb/d this year with the startup of seven projects. Following an announcement on 30 June that the 30,000 b/d Bozhang field had started operations, in July, the company reported first oil from its Luda 10-1 project in the Bay of Bohai. Earlier in the year, the Jinzhou 9-3 oilfield in North Liaodong Bay in Bohai was the first project to be brought on stream in February, followed by the shallow-water Kenli 10-1 oilfield, which lies to the south of Bohai, in April and its Dongfang1-1 project ahead of schedule around mid-June. Two more projects, the Weizhou 12-2 oil field joint development and the Weizhou 11-4N oil field Phase II, both in the western South China Sea, are scheduled to commence production in 2H15. These two projects, together with the other five brought on stream already, would enable CNOOC to achieve its 2015 net production target of around 1.3-1.4 mboe/d. PetroChina reported first-half increases in output of crude, natural gas and refined products compared with a year earlier. The company produced 477.5 mb of crude, an increase of 2.6%. First-half net production of oil and gas in CNOOC also rose 13.5% to 240.1 million boe, primarily due to contributions from new projects in Bohai and the
4.34 4.41
0.06 0.06
-1%0%1%2%3%4%5%6%7%8%
-0.50.00.51.01.52.02.53.03.54.04.55.0
2009 2010 2011 2012 2013 2014 2015(forecast)
2016(forecast)
Percentagemb/d
China annual production Y-o-y growth % change y-o-y growth (RHS)
Source: OPEC Secretariat.

World Oil Supply
OPEC Monthly Oil Market Report – September 2015 59
eastern South China Sea. Production from offshore fields in China increased by 19.1% to 156.3 million boe by this company while production in other countries was up 4.4% to 83.9 million boe. Table 5.4: New projects in offshore China by CNOOC in 2015
Note: 7 projects are scheduled to come on stream in 2015, including JZ9-3 adjustment, which already commenced production. On a quarterly basis, China’s oil output is seen to stand at 4.33 mb/d, 4.39 mb/d, 4.32 mb/d and 4.34 mb/d, respectively.
Forecast for 2016 Non-OPEC supply Non-OPEC oil supply in 2016 is expected to grow by 0.16 mb/d to average 57.59 mb/d, a downward revision of 0.11 mb/d, as historical revisions to 2014 and 2015 have been carried over to the 2016 supply forecast (changing the base). Moreover, the number of anticipated projects in 2016 in Brazil, for example, were deferred to the next years or put on the hold for final investment decision (FID). US tight oil production in 2016 was revised down by around 100 tb/d due to the carry-over of the lower historical production in 1H15, which was recently revised down by EIA through their new production estimation methodology adopted from 31 August 2015. On a regional basis, OECD Americas is expected to have the highest growth in 2016 by 0.30 mb/d, followed by China at 0.06 mb/d, Other Asia at 0.05 mb/d, Latin America at 0.04 mb/d and OECD Asia Pacific at 0.02 mb/d. Oil production is expected to decline in FSU by 0.22 mb/d, Africa at 0.05 mb/d, the Middle East at 0.03 mb/d and finally, OECD Europe at 0.02 mb/d, in 2016. On a quarterly basis, non-OPEC supply in 2016 is expected to average 57.45 mb/d, 57.28 mb/d, 57.42 mb/d and 58.20 mb/d, respectively. Revisions to the 2016 forecast Oil supply growth forecasts in OECD were revised down by 36 tb/d to 0.30 mb/d in 2016 compared to a month ago. The US was revised down by 103 tb/d due to EIA revisions in 1H15 and lower growth, while Canada was revised up by 32 tb/d based on
Project Location Expected startup
Peak production (boe/d)
Working interests
Jinzhou -3 oil field adjustment
Bohai Commenced production
12,000 100%
Bozhong 28/34 oil fields adjustment
Bohai First half 30,000 100%
Kenli 10-1 oil field Bohai First half 36,000 100%
Dongfang 1-1 gas field Phase I adjustment
Western South China Sea
Second half 9,000 100%
Weizhou 12-2 oil field joint development
Western South China Sea
Second half 16,000 100%
Weizhou 11-4N oil field Phase II
Western South China Sea
Second half 8,000 100%
Luda 10-1 oil field adjustment
Bohai Second half 6,000 100%
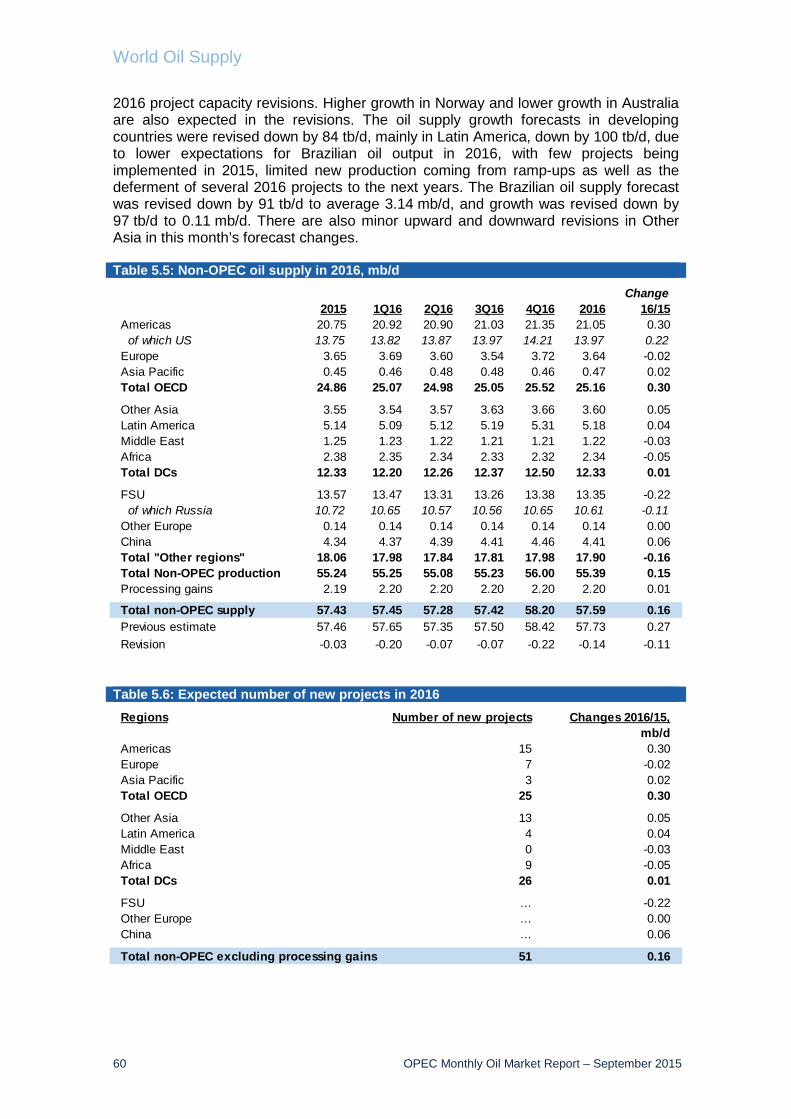
World Oil Supply
60 OPEC Monthly Oil Market Report – September 2015
2016 project capacity revisions. Higher growth in Norway and lower growth in Australia are also expected in the revisions. The oil supply growth forecasts in developing countries were revised down by 84 tb/d, mainly in Latin America, down by 100 tb/d, due to lower expectations for Brazilian oil output in 2016, with few projects being implemented in 2015, limited new production coming from ramp-ups as well as the deferment of several 2016 projects to the next years. The Brazilian oil supply forecast was revised down by 91 tb/d to average 3.14 mb/d, and growth was revised down by 97 tb/d to 0.11 mb/d. There are also minor upward and downward revisions in Other Asia in this month’s forecast changes. Table 5.5: Non-OPEC oil supply in 2016, mb/d
Table 5.6: Expected number of new projects in 2016
Regions Number of new projects Changes 2016/15,mb/d
Americas 15 0.30Europe 7 -0.02Asia Pacific 3 0.02Total OECD 25 0.30
Other Asia 13 0.05Latin America 4 0.04Middle East 0 -0.03Africa 9 -0.05Total DCs 26 0.01
FSU … -0.22Other Europe … 0.00China … 0.06
Total non-OPEC excluding processing gains 51 0.16
Change2015 1Q16 2Q16 3Q16 4Q16 2016 16/15
Americas 20.75 20.92 20.90 21.03 21.35 21.05 0.30 of which US 13.75 13.82 13.87 13.97 14.21 13.97 0.22Europe 3.65 3.69 3.60 3.54 3.72 3.64 -0.02Asia Pacific 0.45 0.46 0.48 0.48 0.46 0.47 0.02Total OECD 24.86 25.07 24.98 25.05 25.52 25.16 0.30
Other Asia 3.55 3.54 3.57 3.63 3.66 3.60 0.05Latin America 5.14 5.09 5.12 5.19 5.31 5.18 0.04Middle East 1.25 1.23 1.22 1.21 1.21 1.22 -0.03Africa 2.38 2.35 2.34 2.33 2.32 2.34 -0.05Total DCs 12.33 12.20 12.26 12.37 12.50 12.33 0.01
FSU 13.57 13.47 13.31 13.26 13.38 13.35 -0.22 of which Russia 10.72 10.65 10.57 10.56 10.65 10.61 -0.11Other Europe 0.14 0.14 0.14 0.14 0.14 0.14 0.00China 4.34 4.37 4.39 4.41 4.46 4.41 0.06Total "Other regions" 18.06 17.98 17.84 17.81 17.98 17.90 -0.16Total Non-OPEC production 55.24 55.25 55.08 55.23 56.00 55.39 0.15Processing gains 2.19 2.20 2.20 2.20 2.20 2.20 0.01
Total non-OPEC supply 57.43 57.45 57.28 57.42 58.20 57.59 0.16Previous estimate 57.46 57.65 57.35 57.50 58.42 57.73 0.27Revision -0.03 -0.20 -0.07 -0.07 -0.22 -0.14 -0.11

World Oil Supply
OPEC Monthly Oil Market Report – September 2015 61
OECD Total OECD oil supply in 2016 is expected to grow by 0.30 mb/d to average 25.16 mb/d, revised down in absolute supply by 0.12 mb/d as well as in growth by 36 tb/d from the last MOMR. Y-o-y growth in OECD in 2016 is expected to come from OECD Americas by 0.30 mb/d and OECD Asia Pacific by 0.02 mb/d, while OECD Europe is expected to decline by 0.02 mb/d compared with last year. On a quarterly basis, total OECD supply is estimated to average 25.07 mb/d, 24.98 mb/d, 25.05 mb/d and 25.52 mb/d, respectively. OECD Americas OECD Americas’ oil supply is estimated to average 21.05 mb/d, showing growth of 0.30 mb/d y-o-y, representing a downward revision of 71 tb/d from the last monthly report. The US and Canada’s supplies are both expected to grow by 0.22 mb/d and 0.17 mb/d, respectively, in 2016, while Mexican supply will decline by 0.10 mb/d. On a quarterly basis, OECD Americas’ oil supply in 2016 is expected to average 20.92 mb/d, 20.90 mb/d, 21.03 mb/d and 21.35 mb/d, respectively. US US total oil supply is anticipated to grow by 0.22 mb/d to average 13.97 mb/d in 2016, representing a downward revision of 0.10 mb/d from the last monthly report. US liquids production for 2016 based on 2015 assumptions is shown in the following table and graph as well. Table 5.7: US liquids production breakdown in 2015 and 2016, mb/d
The breakdown indicates that the main component of US oil output, tight oil, will decline from 450 tb/d estimated growth in 2015 to only 50 tb/d in 2016 under current price circumstances. Oil production from six new projects with a total capacity of 0.14 mb/d is expected to come on stream in 2015 in the Gulf of Mexico, i.e. Gunflint (120 tb/d), Heidelberg (80 tb/d), Stones (50 tb/d), Julia (34 tb/d), Dantzler (32 tb/d) and the delayed Big Foot with a peak capacity of 75 tb/d. The new expected capacity to be installed in 2016 is estimated at 0.13 mb/d. On a quarterly basis, total US supply is estimated to average 13.82 mb/d, 13.87 mb/d, 13.97 mb/d and 14.21 mb/d, respectively.
Change*** Change***Production type 2014 2015* 2015/14 2016** 2015/16
Tight crude 3.81 4.26 450 4.31 50Gulf of Mexico crude 1.40 1.54 140 1.67 130Other crude 3.52 3.49 -30 3.44 -50Unconventional NGL 1.89 2.08 190 2.13 50Other NGL 1.12 1.15 30 1.20 50Biofuels + Other liquids 1.24 1.24 0 1.23 -10
US total supply(excluding processing gains) 12.97 13.75 780 13.97 220
Note: * = Estimate, ** = Forecast, *** = mb/d.Source: US Department of Energy.

World Oil Supply
62 OPEC Monthly Oil Market Report – September 2015
Graph 5.17: Trend of US oil production’s components in 2005-2016
Canada and Mexico Oil supply in Canada is expected to grow by 0.17 mb/d to average 4.57 mb/d y-o-y, revised up by 38 tb/d from the previous month. The projects that are planned for startup or ramp-up in Canada for 2016 are listed as following: West Ells Virgo (redevelopment) Surmont, phase 2 (ramp up) Algar lake Cold lake, Nabiye (ramp up) Ellerslie Foster Creek, phase 1G Horizon, phase 2B Lloydminster area Christina lake, phase 1F
On a quarterly basis, total Canadian supply is estimated to average 4.54 mb/d, 4.53 mb/d, 4.55 mb/d and 4.66 mb/d, respectively. OECD Europe Total OECD Europe oil supply is expected to decline by 20 tb/d to average 3.64 mb/d in 2016. The predicted decline of 60 tb/d in last month’s report has been revised up by 41 tb/d mainly due to the upward revision in Norway’s future output. OECD Europe is estimated to see a quarterly supply of 3.69 mb/d, 3.60 mb/d, 3.54 mb/d and 3.72 mb/d, respectively. Norway’s oil supply is expected to grow by 20 tb/d from the previous year to average 1.94 mb/d in 2016, revised up by 56 tb/d from the previous MOMR. On a quarterly basis, total Norwegian supply is estimated to average 1.96 mb/d, 1.93 mb/d, 1.90 mb/d and 1.96 mb/d, respectively. The UK’s oil production in 2016 is expected to remain flat to average 0.91 mb/d, with growth revised down by 15 tb/d from the previous MOMR. The Ythan field in the UK’s northern North Sea was brought on stream in August 2015 by EnQuest. The field is being developed in phases, with the first well tied into the Don SW field infrastructure.
0
2,500
5,000
7,500
10,000
12,500
15,000
2005 2006 2007 2008 2009 2010 2011 2012 2013 2014 2015* 2016**
tb/d
Tight crude Gulf of Mexico crude Other crudesUnconventional NGL Other NGL Biofuels + Other liquids
Note: * = Estimate and ** = Forecast.Source: US Department of Energy and OPEC analysis.

World Oil Supply
OPEC Monthly Oil Market Report – September 2015 63
Ithaca expects operations at the Cook field in the UK’s central North Sea to be shut in for two months this summer due to life extension works on the host Anasuria FPSO. Elsewhere in the sector, most of the subsea facilities have been installed for Ithaca’s Greater Stella Area development programme. All that remains this year is installation and tie-in of the 3-km oil export pipeline from the FPF-1 riser base to the single anchor loading structures. Work continues on modifications to the production semisubmersible FPF-1, now set for sail-away to the field late in 1Q16. Much of the pipework and electrical and instrumentation cables are in place. The focus at present is on completing pipework pressure testing, electrical and instrumentation cable landing as well as termination and instrumentation device installation. On a quarterly basis, total UK supply is estimated to average 0.92 mb/d, 0.87 mb/d, 0.86 mb/d and 0.99 mb/d, respectively. OECD Asia Pacific OECD Asia Pacific’s oil supply is expected to grow in 2016 to average 0.47 mb/d, revised down slightly by 7 tb/d from the previous month, due to the higher base change of 2015. Australia’s oil supply will grow by 40 tb/d to averge 0.41 mb/d. On a quarterly basis, total OECD Asia Pacific supply in 2016 is estimated to average 0.46 mb/d, 0.48 mb/d, 0.48 mb/d and 0.46 mb/d, respectively. Developing countries Total developing countries’ (DCs’) oil output will average 12.33 mb/d in 2016, almost unchanged from 2015, indicating a downward revision of 84 tb/d, mainly due to the downward revision in Brazilian production in 2016. On a quarterly basis, total oil supply in DCs is estimated to average 12.20 mb/d, 12.26 mb/d, 12.37 mb/d and 12.50 mb/d, respectively. Other Asia Other Asia’s oil production is predicted to increase by 50 tb/d in 2016 to average 3.60 mb/d, with growth revised up by 10 tb/d from the previous MOMR. Oil output in Malaysia, Indonesia, Thailand and Asia others is expected to increase, while production in Vietnam and Brunei will decline, and oil production in India will be stagnant in 2016. On a quarterly basis, Other Asia’s supply in 2016 is expected to stand at 3.54 mb/d, 3.57 mb/d, 3.63 mb/d and 3.66 mb/d, respectively. Latin America Latin America’s oil supply is estimated to grow by 40 tb/d to average 5.18 mb/d in 2016, with growth revised down by 0.10 mb/d from the last MOMR. Latin America was the second-highest driver of growth in recent years among all the non-OPEC regions, but due to few Brazilian projects coming online in 2016, remarkable growth is not foreseen. Despite this, Brazil is still the main driver of growth in 2016, while oil production in other Latin American countries is expected to decline.

World Oil Supply
64 OPEC Monthly Oil Market Report – September 2015
To operate in pre-salt and post-salt areas, several platforms have come into operation in recent years. For 2016, FPSO Cidade de Maricá at Lula Alto and FPSO Cidade de Saquarema at Lula Central, each with a capacity of up to 150,000 b/d, and FPSO Cidade de Caraguatatuba at Lapa are expected to go onstream. Contribution from the pre-salt areas will be decisive in order for Petrobras to achieve the goals laid out in its 2014-2018 Business and Management Plan. If today, the pre-salt areas account for approximately 22% of the total production of 2.1 mb/d of oil in 2018, it will account for 52% of the total produced, which is expected to reach 3.2 mb/d. Nineteen new production units will be installed in the Santos Basin pre-salt area by the end of 2018. Between January 2013 and March 2014 alone, Petrobras made 49 new discoveries, including 15 in pre-salt. Petrobras’ strong results in pre-salt exploration are due to its in-depth knowledge and technological excellence in ultra-deep water exploration. Biofuel production is expected to grow by only 20 tb/d in 2016, although the average production in 2015 will reach 0.58 mb/d, indicating 40 tb/d growth. On a quarterly basis, Latin America’s supply in 2016 is expected to stand at 5.09 mb/d, 5.12 mb/d, 5.19 mb/d and 5.31 mb/d, respectively. Middle East Middle East oil supply is estimated to decrease by 0.03 mb/d in 2016 from the previous year to average 1.22 mb/d, with growth revised up slightly by 5 tb/d from the previous MOMR. There is no expectation for growth or decline in oil supply in Bahrain, Oman and Syria, while oil output in Yemen is expected to decline in 2016. Moreover, the Middle East supply forecast is associated with a very high level of risk, mainly due to political factors, which could dramatically change the outlook in either direction. On a quarterly basis, Middle East supply in 2016 is seen to average 1.23 mb/d, 1.22 mb/d, 1.21 mb/d and 1.21 mb/d, respectively. Africa Africa’s oil supply is projected to decline by 50 tb/d to average 2.34 mb/d in 2016 y-o-y, unchanged from the previous MOMR. In 2016, oil production from Congo and Africa other is expected to grow, while others are forecast to decline, with the exception of South Africa, which should remain steady. Two big projects — Moho North in Congo with a peak capacity of 100 tb/d as well as the Tweneboa project, Enyenra & Ntomme in Ghana with a 45 tb/d capacity — will start up in 2016. On a quarterly basis, Africa’s oil supply in 2016 will average 2.35 mb/d, 2.34 mb/d, 2.33 mb/d and 2.32 mb/d, respectively. FSU and other regions Total FSU oil supply is expected to decline heavily by 0.22 mb/d in 2016 to average 13.35 mb/d, almost unchanged from the previous month’s estimation. Oil production in Russia, Kazakhstan, Azerbaijan and FSU others will decrease in 2016. On a quarterly basis, total supply from FSU in 2016 is seen to average 13.47 mb/d, 13.31 mb/d, 13.26 mb/d and 13.38 mb/d, respectively. Russian oil supply is expected to decrease by 0.11 mb/d to average 10.61 mb/d in 2016, with growth unchanged from the previous MOMR.

World Oil Supply
OPEC Monthly Oil Market Report – September 2015 65
On a quarterly basis, total supply from Russia in 2016 is seen to average 10.65 mb/d, 10.57 mb/d, 10.56 mb/d and 10.65 mb/d, respectively. Other Europe’s oil supply is estimated to remain flat from 2012 to average 0.14 mb/d and continue at this level in 2016. China China’s supply is expected to grow by 60 tb/d over the previous year to average 4.41 mb/d in 2016. The absolute supply was revised up by 10 tb/d from the previous month, but the growth is unchanged. On a quarterly basis, total supply from China in 2016 is seen to average 4.37 mb/d, 4.39 mb/d, 4.41 mb/d and 4.46 mb/d, respectively. OPEC NGLs and non-conventional oils OPEC natural gas liquids (NGLs) and non-conventional liquids were estimated to average 6.01 mb/d in 2015, representing growth of 0.19 mb/d over the previous year. In 2016, OPEC NGLs and non-conventional liquids are projected to average 6.18 mb/d, an increase of 0.17 mb/d over the previous year. There are no changes in the 2015 estimation and 2016 predictions for OPEC NGLs and non-conventionals compared with the last MOMR. Table 5.8: OPEC NGLs + non-conventional oils, 2013-2016
Change Change Change2013 2014 14/13 1Q15 2Q15 3Q15 4Q15 2015 15/14 2016 16/15
Total OPEC 5.65 5.83 0.18 5.86 5.94 6.13 6.13 6.01 0.19 6.18 0.17

World Oil Supply
66 OPEC Monthly Oil Market Report – September 2015
OPEC crude oil production According to secondary sources, total OPEC crude oil production averaged 31.54 mb/d in August. Crude oil output increased mostly from Nigeria, Saudi Arabia and Kuwait, while production in Iraq and Angola showed the largest drop. According to secondary sources, OPEC crude oil production, not including Iraq, stood at 27.48 mb/d in August, up by 99 tb/d over the previous month. Table 5.9: OPEC crude oil production based on secondary sources, tb/d
Table 5.10: OPEC crude oil production based on direct communication, tb/d
2013 2014 4Q14 1Q15 2Q15 Jun 15 Jul 15 Aug 15 Aug/JulAlgeria 1,159 1,151 1,152 1,112 1,107 1,104 1,100 1,109 8.8Angola 1,738 1,660 1,688 1,746 1,716 1,743 1,770 1,735 -35.0Ecuador 516 542 546 551 546 542 548 549 1.4Iran, I.R. 2,673 2,766 2,763 2,779 2,831 2,823 2,853 2,857 4.0Iraq 3,037 3,265 3,423 3,454 3,868 4,109 4,148 4,062 -86.0Kuwait 2,822 2,774 2,719 2,748 2,726 2,703 2,702 2,724 22.0Libya 928 473 679 382 450 421 394 385 -9.2Nigeria 1,912 1,911 1,904 1,886 1,816 1,836 1,787 1,857 70.4Qatar 732 716 682 679 667 669 651 658 7.0Saudi Arabia 9,586 9,683 9,608 9,809 10,252 10,399 10,332 10,362 30.0UAE 2,741 2,761 2,757 2,817 2,838 2,841 2,880 2,885 4.4Venezuela 2,389 2,373 2,364 2,367 2,375 2,369 2,366 2,362 -4.6
Total OPEC 30,231 30,075 30,286 30,330 31,192 31,559 31,531 31,544 13.2OPEC excl. Iraq 27,194 26,809 26,862 26,877 27,323 27,450 27,383 27,482 99.2
Totals may not add up due to independent rounding.
2013 2014 4Q14 1Q15 2Q15 Jun 15 Jul 15 Aug 15 Aug/JulAlgeria 1,203 1,193 1,179 1,141 1,147 1,150 1,160 1,153 -7.0Angola 1,701 1,654 1,727 1,766 1,784 1,785 1,797 1,729 -68.0Ecuador 526 557 560 550 544 541 538 537 -0.7Iran, I.R. 3,576 3,117 3,005 3,017 3,103 3,110 3,130 3,180 50.0Iraq 2,980 3,110 3,141 3,064 3,351 3,591 3,718 3,760 42.0Kuwait 2,922 2,867 2,807 2,850 2,838 2,825 2,820 2,890 70.0Libya 993 480 735 411 .. .. .. .. ..Nigeria 1,754 1,807 1,816 1,762 1,622 1,567 1,776 1,754 -22.6Qatar 724 709 682 687 647 664 613 643 30.7Saudi Arabia 9,637 9,713 9,644 9,878 10,401 10,564 10,361 10,265 -96.5UAE 2,797 2,794 2,790 2,948 2,973 2,974 3,061 3,027 -33.9Venezuela 2,786 2,683 2,701 2,722 2,683 2,670 2,659 2,647 -12.3
Total OPEC 31,599 30,682 30,786 30,793 .. .. .. .. ..OPEC excl. Iraq 28,619 27,572 27,646 27,729 .. .. .. .. ..
Totals may not add up due to independent rounding... Not availab le.

World Oil Supply
OPEC Monthly Oil Market Report – September 2015 67
World oil supply Preliminary data indicates that global oil supply decreased by 0.53 mb/d to average 94.62 mb/d in August 2015 compared with the previous month. This decline was due to the drop in non-OPEC supply. The share of OPEC crude oil at 33.34% of total global production increased in August, compared to a month earlier. Estimates are based on preliminary data for non-OPEC supply and OPEC NGLS, while OPEC crude production is reported according to secondary sources. Graph 5.18: OPEC and world oil supply
89
90
91
92
93
94
95
96
25
26
27
28
29
30
31
32
Sep
13
Oct
13
Nov
13
Dec
13
Jan
14
Feb
14
Mar
14
Apr
14
May
14
Jun
14
Jul 1
4
Aug
14
Sep
14
Oct
14
Nov
14
Dec
14
Jan
15
Feb
15
Mar
15
Apr
15
May
15
Jun
15
Jul 1
5
Aug
15
mb/dmb/d
OPEC crude production (LHS) World supply (RHS)
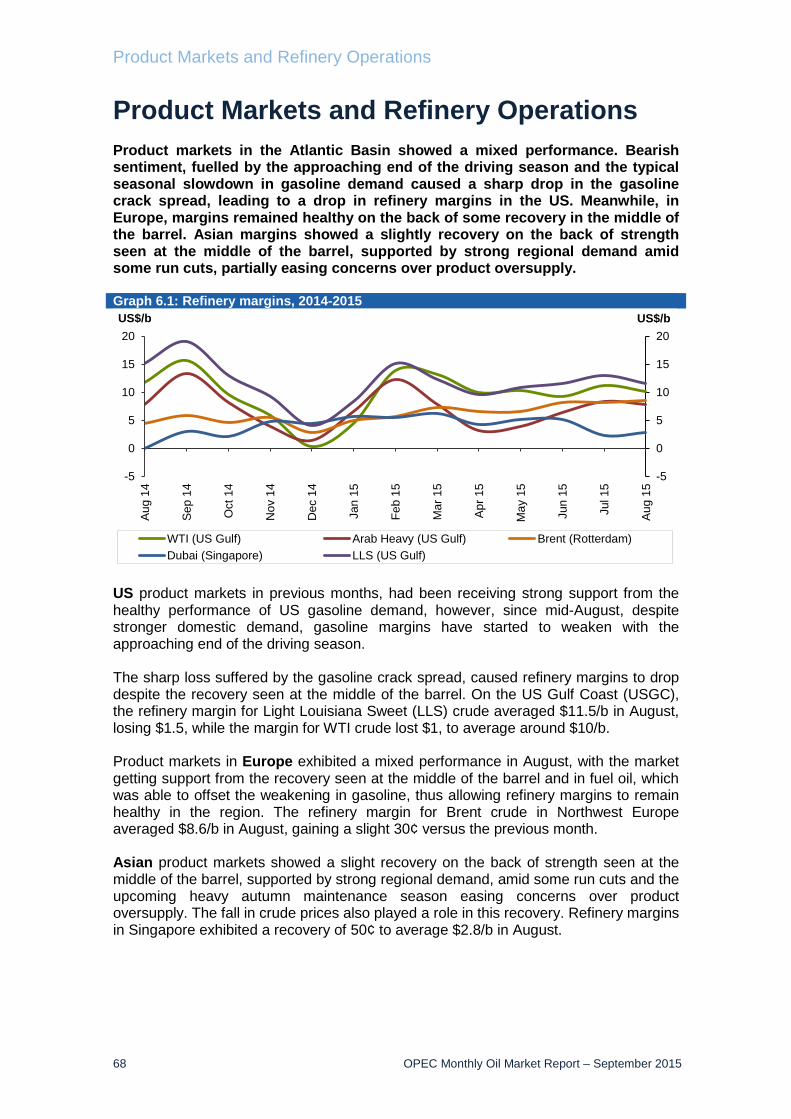
Product Markets and Refinery Operations
68 OPEC Monthly Oil Market Report – September 2015
Product Markets and Refinery Operations Product markets in the Atlantic Basin showed a mixed performance. Bearish sentiment, fuelled by the approaching end of the driving season and the typical seasonal slowdown in gasoline demand caused a sharp drop in the gasoline crack spread, leading to a drop in refinery margins in the US. Meanwhile, in Europe, margins remained healthy on the back of some recovery in the middle of the barrel. Asian margins showed a slightly recovery on the back of strength seen at the middle of the barrel, supported by strong regional demand amid some run cuts, partially easing concerns over product oversupply. Graph 6.1: Refinery margins, 2014-2015
US product markets in previous months, had been receiving strong support from the healthy performance of US gasoline demand, however, since mid-August, despite stronger domestic demand, gasoline margins have started to weaken with the approaching end of the driving season. The sharp loss suffered by the gasoline crack spread, caused refinery margins to drop despite the recovery seen at the middle of the barrel. On the US Gulf Coast (USGC), the refinery margin for Light Louisiana Sweet (LLS) crude averaged $11.5/b in August, losing $1.5, while the margin for WTI crude lost $1, to average around $10/b. Product markets in Europe exhibited a mixed performance in August, with the market getting support from the recovery seen at the middle of the barrel and in fuel oil, which was able to offset the weakening in gasoline, thus allowing refinery margins to remain healthy in the region. The refinery margin for Brent crude in Northwest Europe averaged $8.6/b in August, gaining a slight 30¢ versus the previous month. Asian product markets showed a slight recovery on the back of strength seen at the middle of the barrel, supported by strong regional demand, amid some run cuts and the upcoming heavy autumn maintenance season easing concerns over product oversupply. The fall in crude prices also played a role in this recovery. Refinery margins in Singapore exhibited a recovery of 50¢ to average $2.8/b in August.
-5
0
5
10
15
20
-5
0
5
10
15
20
Aug
14
Sep
14
Oct
14
Nov
14
Dec
14
Jan
15
Feb
15
Mar
15
Apr 1
5
May
15
Jun
15
Jul 1
5
Aug
15
US$/bUS$/b
WTI (US Gulf) Arab Heavy (US Gulf) Brent (Rotterdam)Dubai (Singapore) LLS (US Gulf)

Product Markets and Refinery Operations
OPEC Monthly Oil Market Report – September 2015 69
Refinery operations Refinery utilization rates in the US continued at high level in August, encouraged by the driving season’s strong gasoline demand amid lower crude prices .Refinery utilization averaged around 94% in August, corresponding to 16,7 mb/d, a level 110 tb/d lower than a month earlier, as outages impacted some refineries. The increase in refinery runs has led to the continuing accumulation of middle distillate inventories in the Atlantic Basin. Graph 6.2: Refinery utilisation rates, 2014-2015
European refinery runs averaged around 90% of refining capacity in August, corresponding to a throughput of 10.4 mb/d, down by 100 tb/d from the previous month, and at a similar level to the same month a year ago. European refineries have been increasing throughputs in recent months, encouraged by healthy margins and stronger export opportunities, mainly gasoline to the USEC during the peak driving season. However, sustained higher runs in previous months have contributed to keeping product inventories at record high levels. Asian refinery utilization rose during the second quarter to meet increasing demand in the region, with Chinese and Indian refineries increasing their throughputs, resulting in both countries hitting record-high refinery levels during June. However, during the last months, some run cuts have been seen in refineries in Asia, mainly in South Korea and China, due to higher product inventories impacting refinery margins. Nevertheless, the upcoming autumn maintenance in the region is expected to help balance the market. Chinese refinery throughputs averaged around 10.3 mb/d during August, a similar level to the previous month and 200 tb/d lower than in June. Refinery runs in Singapore for July averaged around 94%, around 3 pp higher than in the previous month amid some capacity coming back online. Meanwhile, Japanese throughputs continued recovering to reach 89% of capacity in August, around 10 pp higher than in the previous month. US market US gasoline demand stood at around 9.5 mb/d in August, a similar level from the previous month and 200 tb/d higher than in the same month a year earlier. During the previous months, the summer driving season lent strong support to the gasoline crack spreads on the back of strong gasoline demand. The healthy
60
70
80
90
100
60
70
80
90
100
Aug
14
Sep
14
Oct
14
Nov
14
Dec
14
Jan
15
Feb
15
Mar
15
Apr
15
May
15
Jun
15
Jul 1
5
Aug
15
%%
US EU-16 Japan Singapore

Product Markets and Refinery Operations
70 OPEC Monthly Oil Market Report – September 2015
performance of US gasoline demand encouraged high refinery runs and maximizing gasoline production. Despite the higher production, gasoline inventories have remained around the latest five-year average due to some FCC unit outages, along with the strong domestic demand. Since mid-August, some pressure has come from the demand side with the approaching end of the driving season and the typical slowdown in gasoline demand. In addition, there were sell-offs in blending components in anticipation of the switch to cheaper winter grade gasoline in early September. The gasoline crack spread suffered a sharp loss of almost $10 to average $38/b in August, after reaching the highest level in more than two years in July. Graph 6.3: US Gulf crack spread vs. WTI, 2014-2015
Middle distillate demand stood at around 3.7 mb/d in August, around 30 tb/d lower than in the previous month and 170 tb/d lower than in the same month a year earlier. The middle distillate market continued to be pressured from the supply side by higher output, due to high refinery runs amid seasonally weaker domestic demand. Middle distillate inventories have continued their rising trend, building by more than 5.0 mb during August to remain above the five-year average, thus fueling bearish sentiment in the market. Inventories continued on the rise, mainly in the USGC due to the narrower arbitrage to New York. Another supportive factor has been the stronger Latin American Diesel imports, mainly from Brazil This could be partially offset with the expected strong demand for diesel for the upcoming harvesting season. Despite the bearish sentiment, fueled by rising inventories, the gasoil crack spread continued its recovery trend during August on the back of some support gained from higher export volumes, mainly to Latin America. The USGC gasoil crack gained more than $1 versus the previous month to average around $15/b. At the bottom of the barrel, the fuel oil market continued to weaken in August, due to lower domestic demand.
-10
0
10
20
30
40
50
60
-10
0
10
20
30
40
50
60
Aug
14
Sep
14
Oct
14
Nov
14
Dec
14
Jan
15
Feb
15
Mar
15
Apr 1
5
May
15
Jun
15
Jul 1
5
Aug
15
Sep
15
US$/bUS$/b
Prem.Gasoline Unl.93 Jet/Kero Gasoil/Diesel (0.05%S) Fuel oil (180c)

Product Markets and Refinery Operations
OPEC Monthly Oil Market Report – September 2015 71
Pressure came from fuel oil stocks continuing on the rise amid several low-sulphur VGO cargoes arriving to the USGC in an already well-supplied market amid some FCC unit outages limiting demand within the region. Those bearish factors caused the fuel oil crack on the USGC to lose around $1 in August. European market Product markets in Europe exhibited a mixed performance in August, being supported by the recovery seen at the middle of the barrel and in fuel oil, which were able to offset the weakening in gasoline, thus allowing refinery margins to remain healthy in the region. The gasoline market lost the ground gained in the previous month due to pressure coming from the supply side as refineries have been running at high throughputs in the last months, which has left gasoline inventories at very high levels in the region. Another bearish factor was the expected seasonally weakening demand in the Atlantic Basin, as gasoline imports to the US Atlantic Coast have been declining since mid-August after peaking a month earlier, and they are expected to continue falling with the summer travel season approaching an end. Additional pressure came from lower volumes being exported to West Africa, as West African import volumes have been decreasing. The gasoline crack spread against Brent lost more than $3 to average around $31/b in August. The light distillate naphtha crack recovered some ground last month, on the back of stronger petrochemical demand, amid arbitrage to Asia reopening with freight rates declining. This allowed the naphtha cracks to recover by almost $3/b during August. Graph 6.4: Rotterdam crack spreads vs. Brent, 2014-2015
The gasoil market continued to be pressured by the supply side with gasoil inventories in Europe remaining above the latest five-year average. However, the gasoil crack spread managed to reverse the downward trend seen in the last months on the back of some support coming from strong diesel demand reported from Germany and Turkey, along with the higher requirements from Egypt and Libya.
-20
-10
0
10
20
30
40
-20
-10
0
10
20
30
40
Aug
14
Sep
14
Oct
14
Nov
14
Dec
14
Jan
15
Feb
15
Mar
15
Apr 1
5
May
15
Jun
15
Jul 1
5
Aug
15
Sep
15US$/bUS$/b
Prem.Gasoline Unl.98 ppm Jet/Kero Gasoil 10 ppm Fuel oil (1.0%S)

Product Markets and Refinery Operations
72 OPEC Monthly Oil Market Report – September 2015
Additional support came from expectations of lower inflows to the region. During this year, capacity additions have kept Russian ULSD output on the rise, hitting a record level output during the second quarter. However, with the scheduled maintenance in Russia, ULSD exports to Europe are expected to be limited over the coming months, thus balancing the gasoil market in the region and lending some support to the weak middle distillates markets. The gasoil crack spread against Brent crude at Rotterdam showed a recovery of around $2 versus the previous month, to average around $14/b in August. At the bottom of the barrel, the fuel oil market continued weak due to oversupply and limited arbitrage opportunities to Asia. Inventories in the ARA hub rose more than 30% during this month, exerting pressure on the market. However, the fuel oil crack spreads gained some ground during August. The Northwest European fuel oil crack gained 50¢ versus the previous month’s level to average around minus $11.5/b in August. Developments in the Brent price played the main role in the fuel oil crack spread gains. Asian market The Asian market showed a slightly recovery during August on the back of strength seen at the middle of the barrel, supported by strong regional demand amid some run cuts easing the concern about product oversupply. The fall in crude prices also played a role in this recovery. The Singapore gasoline crack continued losing ground during August, despite higher requirements from India and Pakistan ahead of refinery maintenance. However, this was outweighed by the slowing demand reported from Japan, South Korea and China, thus fuelling bearish sentiment to the gasoline market. Higher regional supplies continue exerting pressure on the market. This oversupply environment is expected to eased during the upcoming autumn maintenance season, along with some run cuts. The gasoline crack spread against Dubai crude in Singapore lost more than $2 versus the previous month to average $14/b in August. The Singapore naphtha crack recovered some ground in August, with support coming from expectations of increasing demand with the end of cracker maintenance in Japan and South Korea. The naphtha crack spread recovered by around $1/b. The uptick was limited by higher inflows from the Middle East.

Product Markets and Refinery Operations
OPEC Monthly Oil Market Report – September 2015 73
Graph 6.5: Singapore crack spread vs. Dubai, 2014-2015
At the middle of the barrel, the gasoil market continued pressured by the oversupply environment in the region, however the crack spreads reversed the downward trend to recover some ground on the back of support from higher gasoil requirements reported from several countries like Indonesia, Sri Lanka, Australia and Egypt. In addition, a more balanced market is expected in coming months, with run cuts and upcoming heavy autumn maintenance in the region. The gasoil crack spread in Singapore against Dubai recovered 70¢ versus the previous month to average around $12.2/b in August. The fuel oil market continued to weaken during August, despite some indications of slightly increasing bunker demand, due to continued pressure from plentiful supplies amid higher inflows from the Middle East continuing to fuel bearish sentiment to the market. Furthermore, expectations on the demand side were weak, as some Chinese refineries were awarded licenses to import more crude oil as feedstock for refineries, lowering the consumption of fuel oil as an alternative feedstock. The fuel oil crack spread in Singapore against Dubai lost more than $1 to average around minus $10/b in August.
-20
-10
0
10
20
30
-20
-10
0
10
20
30Au
g 14
Sep
14
Oct
14
Nov
14
Dec
14
Jan
15
Feb
15
Mar
15
Apr 1
5
May
15
Jun
15
Jul 1
5
Aug
15
Sep
15
US$/bUS$/b
Prem.Gasoline Unl.92 Jet/Kero Gasoil 50 ppm Fuel oil 180 CST

Product Markets and Refinery Operations
74 OPEC Monthly Oil Market Report – September 2015
Table 6.1: Refined product prices, US$/b
Table 6.2: Refinery operations in selected OECD countries
ChangeJul 15 Aug 15 Aug/Jul 2014 2015
Naphtha* 57.74 50.54 -7.20 111.04 63.61Premium gasoline (unleaded 93) 99.10 80.68 -18.42 128.10 86.01Regular gasoline (unleaded 87) 83.35 68.70 -14.64 118.11 74.63Jet/Kerosene 65.62 59.06 -6.57 121.64 69.39Gasoil (0.2% S) 64.76 57.98 -6.78 119.67 68.89Fuel oil (1.0% S) 45.00 35.68 -9.32 98.91 48.77Fuel oil (3.0% S) 44.64 35.18 -9.46 90.01 45.71
Naphtha 52.04 44.38 -7.67 101.83 53.60Premium gasoline (unleaded 98) 90.50 77.52 -12.98 123.88 80.75Jet/Kerosene 68.18 60.18 -8.00 123.01 71.47Gasoil/Diesel (10 ppm) 68.59 60.66 -7.93 120.86 71.06Fuel oil (1.0% S) 44.59 35.24 -9.35 95.94 45.15Fuel oil (3.5% S) 45.30 35.80 -9.49 90.98 45.83
Naphtha 48.48 42.33 -6.15 99.51 50.52Premium gasoline** 83.94 70.26 -13.68 119.27 75.64Jet/Kerosene 64.72 58.01 -6.71 120.22 70.00Gasoil/Diesel** 70.34 62.21 -8.14 121.56 74.22Fuel oil (1.0% S) 45.57 36.31 -9.26 96.86 46.87Fuel oil (3.5% S) 44.77 35.76 -9.01 90.76 45.62
Naphtha 53.15 45.76 -7.38 103.72 55.21Premium gasoline (unleaded 95) 75.95 66.00 -9.94 119.62 73.46Regular gasoline (unleaded 92) 72.52 61.95 -10.57 116.63 70.32Jet/Kerosene 65.81 57.08 -8.73 120.11 69.27Gasoil/Diesel (50 ppm) 67.66 60.04 -7.62 122.07 70.77Fuel oil (180 cst 2.0% S) 48.71 39.04 -9.67 95.23 51.40Fuel oil (380 cst 3.5% S) 47.49 37.36 -10.12 93.43 49.47
Sources: Platts and Argus Media.
Year-to-date
* Barges.** Cost, insurance and freight (CIF).
US Gulf (Cargoes FOB):
Rotterdam (Barges FoB):
Mediterranean (Cargoes FOB):
Singapore (Cargoes FOB):
Change ChangeJun 15 Jul 15 Aug 15 Aug/Jul Jun 15 Jul 15 Aug 15 Aug/Jul
US 16.48 16.83 16.71 -0.11 92.25 94.18 93.55 -0.63France 0.99 1.10 - - 65.37 72.59 - -Germany 1.95 1.84 - - 86.64 81.74 - -Italy 1.34 1.37 - - 65.40 66.76 - -UK 1.10 1.11 - - 83.06 83.97 - -Euro-16 10.35 10.47 10.40 -0.07 88.40 89.45 89.00 -0.45Japan 2.67 3.10 3.50 0.39 67.60 78.59 88.57 9.98
Sources: OPEC statistics, Argus, Euroilstock inventory report, IEA, EIA/DoE, METI and PAJ.
Refinery throughput, mb/d Refinery utilization, %

Tanker Market
OPEC Monthly Oil Market Report – September 2015 75
Tanker Market Bearish sentiment dominated the crude oil tanker market in August, with VLCCs registering the highest rate drop in the dirty segment, down by 40% from the previous month. Freight rates remained largely under pressure mainly due to high tonnage availability and limited demand, as is usual during the summer season. Suezmax and Aframax freight rates were also lower in August due to a lack of tonnage demand. Generally, ship owners preferred to fix short-haul voyages in anticipation that the downward trend will be corrected ahead of winter season demand. Clean tanker rates were mostly under pressure as a result of lower freight rates seen in the West of Suez. An inactive market and low product trade affected clean tankers in several classes. In August, bunker prices reached their lowest level in multiple years, which – despite weak sentiment that affected both crude oil and product tanker markets – helped to balance voyage costs and maintained ship owners’ earnings. Spot fixtures According to preliminary data, OPEC spot fixtures rose in August over the previous month. Middle East-to-East fixtures increased by 0.24 mb/d to stand at 5.74 mb/d, while Middle East-to-West fixtures declined by 0.15 mb/d to stand at 2.77 mb/d. As a result, global fixtures slightly increased by 0.02 mb/d or 0.1% compared with a month earlier to stand at 16.72 mb/d. Compared with a year ago, global fixtures were lower by 1.6% while OPEC fixtures were 1.7% higher. Table 7.1: Tanker chartering, sailings and arrivals, mb/d
Sailings and arrivals Preliminary data also showed that OPEC sailings increased in August by 0.21 mb/d to average 24.11 mb/d, 3.2% higher than a year ago. Arrivals in North American and West Asian ports showed a decline from the previous month of 1.4% and 4% to average 9.97 mb/d and 4.64 mb/d, respectively. European and Far Eastern arrivals increased by 1% and 5.3%, respectively, from the previous month.
ChangeJun 15 Jul 15 Aug 15 Aug 15/Jul 15
Spot CharteringAll areas 17.27 16.71 16.72 0.02OPEC 12.55 11.93 12.20 0.27Middle East/East 5.69 5.49 5.74 0.24Middle East/West 3.34 2.92 2.77 -0.15Outside Middle East 3.53 3.52 3.69 0.18
SailingsOPEC 23.83 23.90 24.11 0.21Middle East 17.80 17.49 17.51 0.02
ArrivalsNorth America 10.23 10.11 9.97 -0.14Europe 12.26 12.30 12.42 0.13Far East 8.14 8.22 8.65 0.43West Asia 4.79 4.84 4.64 -0.20
Sources: Oil Movements and Lloyd's Marine Intelligence Unit.

Tanker Market
76 OPEC Monthly Oil Market Report – September 2015
Spot freight rates VLCC The month of August started with a very quiet VLCC market, with a noticeable lack of requirements from both the Middle East and West Africa; total fixtures for the month were lower than average. The chartering market was particularly inactive for VLCC loadings in August and the slow pace continued with the arrival of September requirements. The bearish trend continued as rates came under pressure on all selected routes, with the highest decline seen in the Middle East, as an ample tonnage list supported a drop in VLCC freight rates in August, giving charterers the upper hand in a market with an abundant supply of vessels at all times. Freight rates dropped on all major trading routes in August as a declining trend dominated the dirty tanker market on the whole. Middle East-to-East and Middle East-to-West spot freight rates decreased by 47% and 38%, respectively, from the previous month, while spot freight rates on the West Africa-to-East route declined by 33%. In an annual comparison, VLCC freight rates on reported routes were lower by 21%, 15% and 9%, respectively. Graph 7.1: Monthly averages of crude oil spot freight rates
Suezmax Similar to the VLCC market, Suezmax freight rates came under pressure in August. The Suezmax class had a slow start in all areas. Low August requirements led to tonnage buildups and rates started to drop gradually. Suezmax inquiries and fixtures were softer in the Middle East, the Caribbean and many other key trading routes. The market got relatively busier by the middle of the month, in particular for West African loadings, as a flow of cargoes entered the market, mainly for the first decade of September. However, average freight rates remained subdued, partially as a result of increased numbers of ballasting ships from the East, which created a surplus in tanker supply and prevented freight rates from achieving any gains. The occasional increase in activities seen in the Mediterranean market was not sufficient to support freight rates or even prevent them from dropping further. Tanker supply in the Mediterranean and Black Sea remained more than sufficient, even for prompt requirements, and freight rates were often reported softer. In the East,
20406080100120140160180
20406080
100120140160180
Aug
14
Sep
14
Oct
14
Nov
14
Dec
14
Jan
15
Feb
15
Mar
15
Apr
15
May
15
Jun
15
Jul 1
5
Aug
15
WorldscaleWorldscale
Mediterranean/Northwest Europe (Aframax) West Africa/USGC (Suezmax)Middle East/Far East (VLCC)

Tanker Market
OPEC Monthly Oil Market Report – September 2015 77
freight rates for tankers operating on the West Africa-to-US Gulf Coast (USGC) route dropped by 17% from the previous month to average WS 66 points, while in the West, freight rates on the Northwest Europe (NWE)-to-USGC route declined by 20% to average WS 50 points. Table 7.2: Spot tanker crude freight rates, Worldscale
Aframax Aframax freight rates dropped on all reported routes in August, with no exception. On average, Aframax freight rates were 15% lower than a month earlier. Aframax activities remained limited in the North Sea and the Baltics, while freight rates fluctuated, experiencing occasional gains when vessel supply tightened relatively, as a result of scheduled dry docking before being corrected down as tanker supply came into balance. In the Mediterranean, the Aframax market witnessed a lack of cargoes and a decline in activity, and freight rates dropped slightly despite delays and ullage problems in the ports of Trieste and Augusta. Constant tonnage availability dampened the chance of any premiums that may have resulted from delays, but offset market losses. As a result, freight rates for tankers trading on both the Mediterranean-to-Mediterranean and Mediterranean-to-NWE routes declined by a slight WS 1 point in August compared with the previous month, to stand at WS 94 and WS 89 points, respectively. The Aframax market in the Caribbean was inactive, lacking cargoes, as was seen with other routes. Aframax freight rates dropped in August despite some reported delays in Caribbean ports and some prompt requirements for lighterage ships, which only offset the general drop. Average monthly freight rates for tankers operating on the Caribbean-to-US East Coast (USEC) route dropped by 26% over the previous month to average WS 90 points. Similarly, average freight rates for tankers trading on the Indonesia-to-East route dropped by 25% to average WS 97 points. Clean spot freight rates Clean tanker market sentiment was mostly under pressure in August, as rates in the West of Suez were weak. The clean tanker market was quiet and general sentiment weak, thus rates remained flat, at best. Medium range (MR) tanker trade was found to be thin.
Size Change1,000 DWT Jun 15 Jul 15 Aug 15 Aug 15/Jul 15
CrudeMiddle East/East 230-280 67 73 39 -34Middle East/West 270-285 39 41 26 -16West Africa/East 260 66 70 47 -23West Africa/US Gulf Coast 130-135 91 79 66 -13Northwest Europe/US Gulf Coast 130-135 78 63 50 -13Indonesia/East 80-85 167 129 97 -32Caribbean/US East Coast 80-85 154 121 90 -31Mediterranean/Mediterranean 80-85 134 95 94 -1Mediterranean/Northwest Europe 80-85 127 90 89 0
Sources: Galbraith’s tanker market report and Platts.
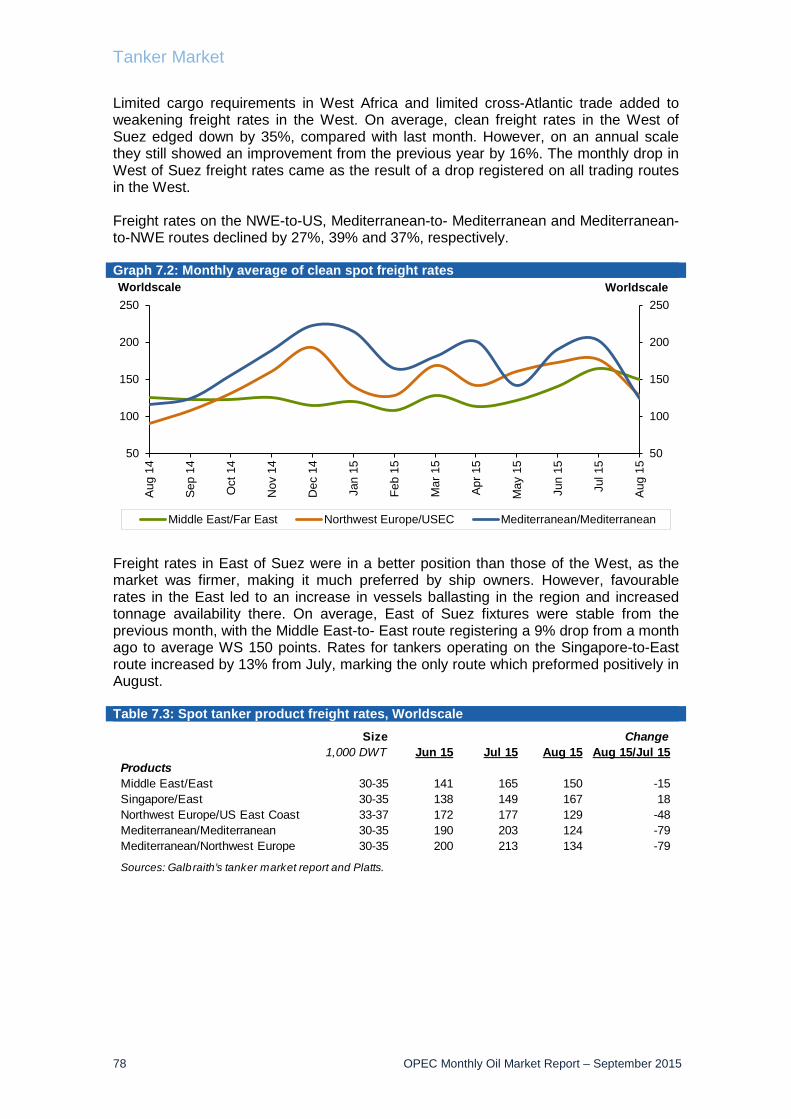
Tanker Market
78 OPEC Monthly Oil Market Report – September 2015
Limited cargo requirements in West Africa and limited cross-Atlantic trade added to weakening freight rates in the West. On average, clean freight rates in the West of Suez edged down by 35%, compared with last month. However, on an annual scale they still showed an improvement from the previous year by 16%. The monthly drop in West of Suez freight rates came as the result of a drop registered on all trading routes in the West. Freight rates on the NWE-to-US, Mediterranean-to- Mediterranean and Mediterranean-to-NWE routes declined by 27%, 39% and 37%, respectively. Graph 7.2: Monthly average of clean spot freight rates
Freight rates in East of Suez were in a better position than those of the West, as the market was firmer, making it much preferred by ship owners. However, favourable rates in the East led to an increase in vessels ballasting in the region and increased tonnage availability there. On average, East of Suez fixtures were stable from the previous month, with the Middle East-to- East route registering a 9% drop from a month ago to average WS 150 points. Rates for tankers operating on the Singapore-to-East route increased by 13% from July, marking the only route which preformed positively in August. Table 7.3: Spot tanker product freight rates, Worldscale
50
100
150
200
250
50
100
150
200
250
Aug
14
Sep
14
Oct
14
Nov
14
Dec
14
Jan
15
Feb
15
Mar
15
Apr
15
May
15
Jun
15
Jul 1
5
Aug
15
WorldscaleWorldscale
Middle East/Far East Northwest Europe/USEC Mediterranean/Mediterranean
Size Change1,000 DWT Jun 15 Jul 15 Aug 15 Aug 15/Jul 15
ProductsMiddle East/East 30-35 141 165 150 -15Singapore/East 30-35 138 149 167 18Northwest Europe/US East Coast 33-37 172 177 129 -48Mediterranean/Mediterranean 30-35 190 203 124 -79Mediterranean/Northwest Europe 30-35 200 213 134 -79
Sources: Galbraith’s tanker market report and Platts.
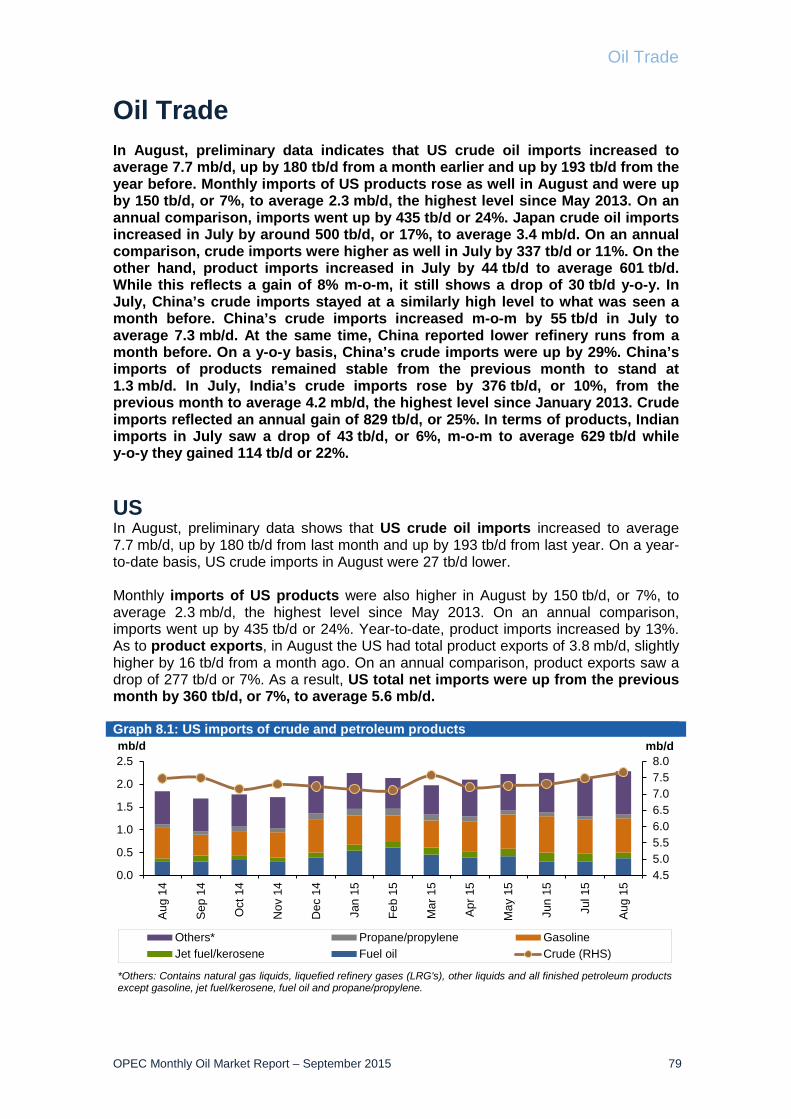
Oil Trade
OPEC Monthly Oil Market Report – September 2015 79
Oil Trade In August, preliminary data indicates that US crude oil imports increased to average 7.7 mb/d, up by 180 tb/d from a month earlier and up by 193 tb/d from the year before. Monthly imports of US products rose as well in August and were up by 150 tb/d, or 7%, to average 2.3 mb/d, the highest level since May 2013. On an annual comparison, imports went up by 435 tb/d or 24%. Japan crude oil imports increased in July by around 500 tb/d, or 17%, to average 3.4 mb/d. On an annual comparison, crude imports were higher as well in July by 337 tb/d or 11%. On the other hand, product imports increased in July by 44 tb/d to average 601 tb/d. While this reflects a gain of 8% m-o-m, it still shows a drop of 30 tb/d y-o-y. In July, China’s crude imports stayed at a similarly high level to what was seen a month before. China’s crude imports increased m-o-m by 55 tb/d in July to average 7.3 mb/d. At the same time, China reported lower refinery runs from a month before. On a y-o-y basis, China’s crude imports were up by 29%. China’s imports of products remained stable from the previous month to stand at 1.3 mb/d. In July, India’s crude imports rose by 376 tb/d, or 10%, from the previous month to average 4.2 mb/d, the highest level since January 2013. Crude imports reflected an annual gain of 829 tb/d, or 25%. In terms of products, Indian imports in July saw a drop of 43 tb/d, or 6%, m-o-m to average 629 tb/d while y-o-y they gained 114 tb/d or 22%. US In August, preliminary data shows that US crude oil imports increased to average 7.7 mb/d, up by 180 tb/d from last month and up by 193 tb/d from last year. On a year-to-date basis, US crude imports in August were 27 tb/d lower. Monthly imports of US products were also higher in August by 150 tb/d, or 7%, to average 2.3 mb/d, the highest level since May 2013. On an annual comparison, imports went up by 435 tb/d or 24%. Year-to-date, product imports increased by 13%. As to product exports, in August the US had total product exports of 3.8 mb/d, slightly higher by 16 tb/d from a month ago. On an annual comparison, product exports saw a drop of 277 tb/d or 7%. As a result, US total net imports were up from the previous month by 360 tb/d, or 7%, to average 5.6 mb/d. Graph 8.1: US imports of crude and petroleum products
4.55.05.56.06.57.07.58.0
0.0
0.5
1.0
1.5
2.0
2.5
Aug
14
Sep
14
Oct
14
Nov
14
Dec
14
Jan
15
Feb
15
Mar
15
Apr
15
May
15
Jun
15
Jul 1
5
Aug
15
mb/dmb/d
Others* Propane/propylene GasolineJet fuel/kerosene Fuel oil Crude (RHS)
*Others: Contains natural gas liquids, liquefied refinery gases (LRG's), other liquids and all finished petroleum productsexcept gasoline, jet fuel/kerosene, fuel oil and propane/propylene.
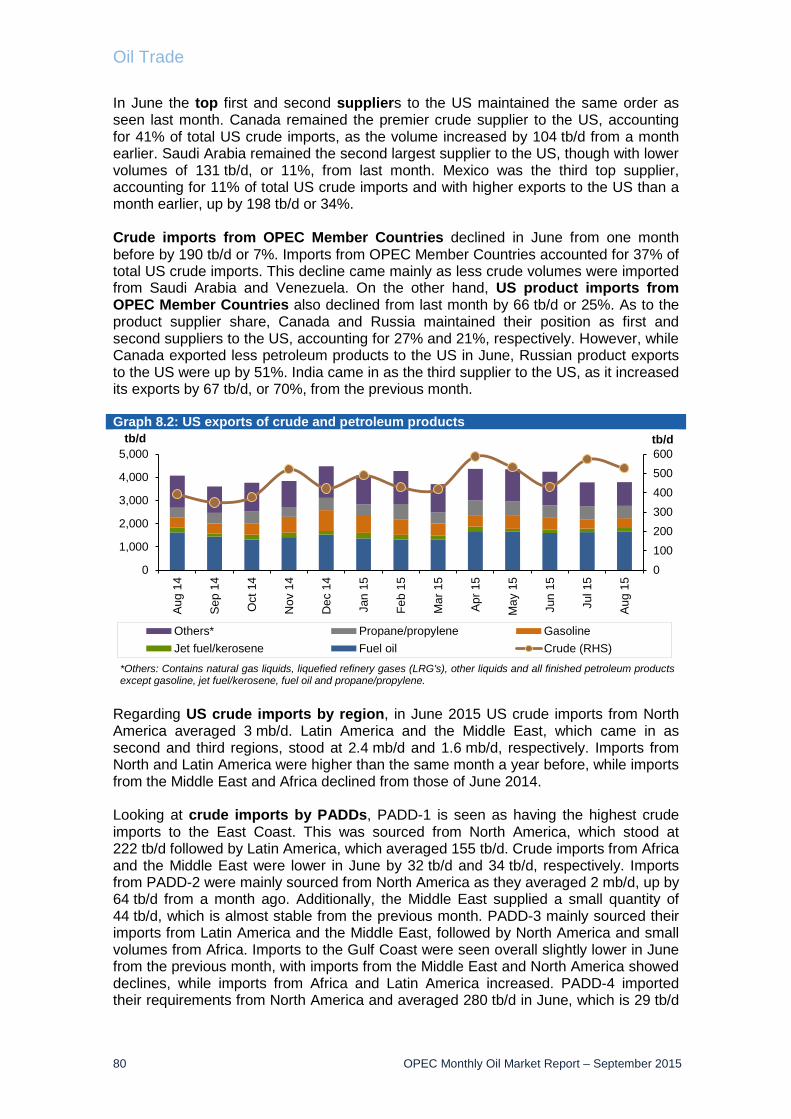
Oil Trade
80 OPEC Monthly Oil Market Report – September 2015
In June the top first and second suppliers to the US maintained the same order as seen last month. Canada remained the premier crude supplier to the US, accounting for 41% of total US crude imports, as the volume increased by 104 tb/d from a month earlier. Saudi Arabia remained the second largest supplier to the US, though with lower volumes of 131 tb/d, or 11%, from last month. Mexico was the third top supplier, accounting for 11% of total US crude imports and with higher exports to the US than a month earlier, up by 198 tb/d or 34%. Crude imports from OPEC Member Countries declined in June from one month before by 190 tb/d or 7%. Imports from OPEC Member Countries accounted for 37% of total US crude imports. This decline came mainly as less crude volumes were imported from Saudi Arabia and Venezuela. On the other hand, US product imports from OPEC Member Countries also declined from last month by 66 tb/d or 25%. As to the product supplier share, Canada and Russia maintained their position as first and second suppliers to the US, accounting for 27% and 21%, respectively. However, while Canada exported less petroleum products to the US in June, Russian product exports to the US were up by 51%. India came in as the third supplier to the US, as it increased its exports by 67 tb/d, or 70%, from the previous month. Graph 8.2: US exports of crude and petroleum products
Regarding US crude imports by region, in June 2015 US crude imports from North America averaged 3 mb/d. Latin America and the Middle East, which came in as second and third regions, stood at 2.4 mb/d and 1.6 mb/d, respectively. Imports from North and Latin America were higher than the same month a year before, while imports from the Middle East and Africa declined from those of June 2014. Looking at crude imports by PADDs, PADD-1 is seen as having the highest crude imports to the East Coast. This was sourced from North America, which stood at 222 tb/d followed by Latin America, which averaged 155 tb/d. Crude imports from Africa and the Middle East were lower in June by 32 tb/d and 34 tb/d, respectively. Imports from PADD-2 were mainly sourced from North America as they averaged 2 mb/d, up by 64 tb/d from a month ago. Additionally, the Middle East supplied a small quantity of 44 tb/d, which is almost stable from the previous month. PADD-3 mainly sourced their imports from Latin America and the Middle East, followed by North America and small volumes from Africa. Imports to the Gulf Coast were seen overall slightly lower in June from the previous month, with imports from the Middle East and North America showed declines, while imports from Africa and Latin America increased. PADD-4 imported their requirements from North America and averaged 280 tb/d in June, which is 29 tb/d
0100200300400500600
0
1,000
2,000
3,000
4,000
5,000
Aug
14
Sep
14
Oct
14
Nov
14
Dec
14
Jan
15
Feb
15
Mar
15
Apr
15
May
15
Jun
15
Jul 1
5
Aug
15
tb/dtb/d
Others* Propane/propylene GasolineJet fuel/kerosene Fuel oil Crude (RHS)
*Others: Contains natural gas liquids, liquefied refinery gases (LRG's), other liquids and all finished petroleum productsexcept gasoline, jet fuel/kerosene, fuel oil and propane/propylene.

Oil Trade
OPEC Monthly Oil Market Report – September 2015 81
higher from the previous month. In PADD-5, imports to the West Coast from the FSU and Asia were less, showing a drop of 23 tb/d and 21 tb/d, respectively. Imports from the Middle East were up by 74 tb/d to average 470 tb/d, and imports from Latin America increased by 45 tb/d to average 404 tb/d. Table 8.1: US crude and product net imports, tb/d
Japan Japan’s crude oil imports increased in July by around 500 tb/d, or 17%, to average 3.4 mb/d. On a y-o-y comparison, crude imports were higher as well in July by 337 tb/d or 11%. Graph 8.3: Japan’s imports of crude and petroleum products
As to the suppliers’ share, Saudi Arabia, UAE and Russia were the top suppliers to Japan in July. As in previous months, Saudi Arabia came in as first crude supplier to Japan representing 33% of total crude exports to Japan. The UAE came in as the second largest supplier with a share of 31% of total crude exports, while Russia held the third position with a share of 7%. Saudi Arabia and the UAE each increased their exported crude to Japan in July by 31% and 11%, respectively, while imports from Russia were down from the previous month by 32 tb/d or 11%. On the other hand, product imports increased in July by 44 tb/d to average 601 tb/d. This reflected a gain of 8% m-o-m, though it still shows a drop of 30 tb/d y-o-y.
0
1
2
3
4
5
0
200
400
600
800
1,000
1,200
Jul 1
4
Aug
14
Sep
14
Oct
14
Nov
14
Dec
14
Jan
15
Feb
15
Mar
15
Apr
15
May
15
Jun
15
Jul 1
5
mb/dtb/d
Others* LPG Naphtha Fuel oil Crude oil
*Others: Contains gasoline, jet fuel, kerosene, gasoil, asphalt and paraffin wax.
ChangeJun 15 Jul 15 Aug 15 Aug 15/Jul 15
Crude oil 6,873 6,915 7,140 225Total products -1,990 -1,642 -1,509 133Total crude and products 4,883 5,273 5,631 358
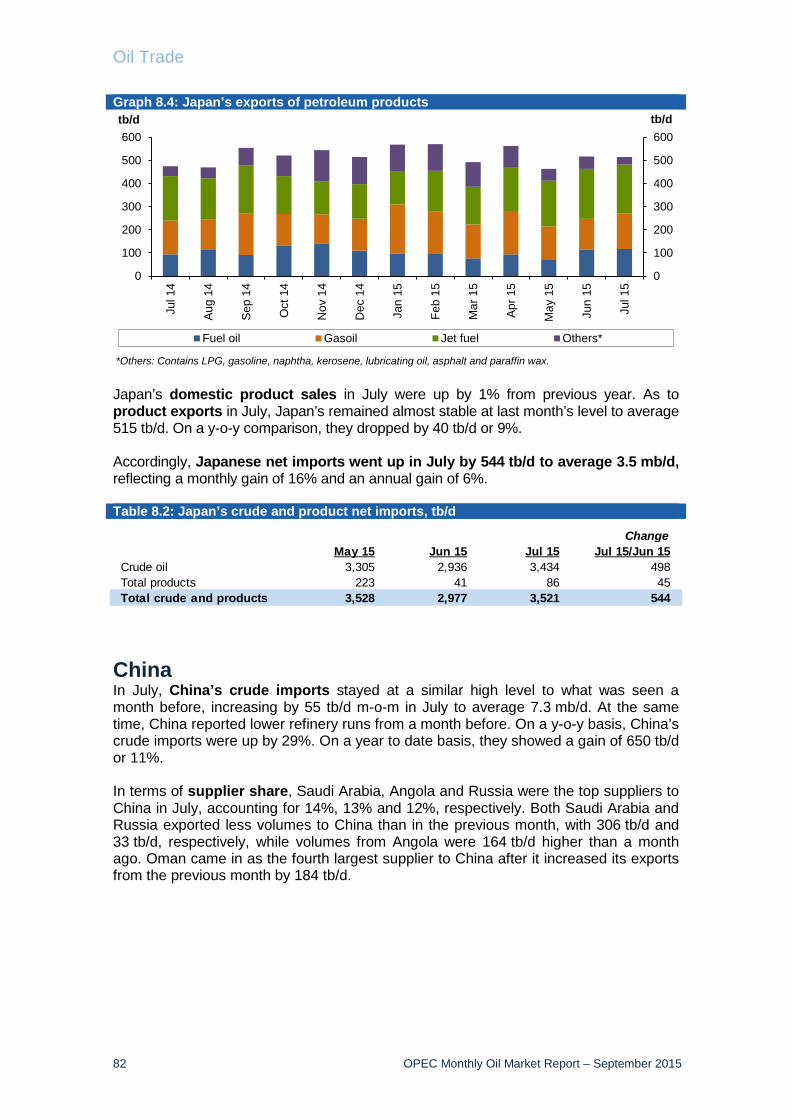
Oil Trade
82 OPEC Monthly Oil Market Report – September 2015
Graph 8.4: Japan’s exports of petroleum products
Japan’s domestic product sales in July were up by 1% from previous year. As to product exports in July, Japan’s remained almost stable at last month’s level to average 515 tb/d. On a y-o-y comparison, they dropped by 40 tb/d or 9%. Accordingly, Japanese net imports went up in July by 544 tb/d to average 3.5 mb/d, reflecting a monthly gain of 16% and an annual gain of 6%. Table 8.2: Japan’s crude and product net imports, tb/d
China In July, China’s crude imports stayed at a similar high level to what was seen a month before, increasing by 55 tb/d m-o-m in July to average 7.3 mb/d. At the same time, China reported lower refinery runs from a month before. On a y-o-y basis, China’s crude imports were up by 29%. On a year to date basis, they showed a gain of 650 tb/d or 11%. In terms of supplier share, Saudi Arabia, Angola and Russia were the top suppliers to China in July, accounting for 14%, 13% and 12%, respectively. Both Saudi Arabia and Russia exported less volumes to China than in the previous month, with 306 tb/d and 33 tb/d, respectively, while volumes from Angola were 164 tb/d higher than a month ago. Oman came in as the fourth largest supplier to China after it increased its exports from the previous month by 184 tb/d.
0
100
200
300
400
500
600
0
100
200
300
400
500
600
Jul 1
4
Aug
14
Sep
14
Oct
14
Nov
14
Dec
14
Jan
15
Feb
15
Mar
15
Apr 1
5
May
15
Jun
15
Jul 1
5
tb/dtb/d
Fuel oil Gasoil Jet fuel Others*
*Others: Contains LPG, gasoline, naphtha, kerosene, lubricating oil, asphalt and paraffin wax.
ChangeMay 15 Jun 15 Jul 15 Jul 15/Jun 15
Crude oil 3,305 2,936 3,434 498Total products 223 41 86 45Total crude and products 3,528 2,977 3,521 544
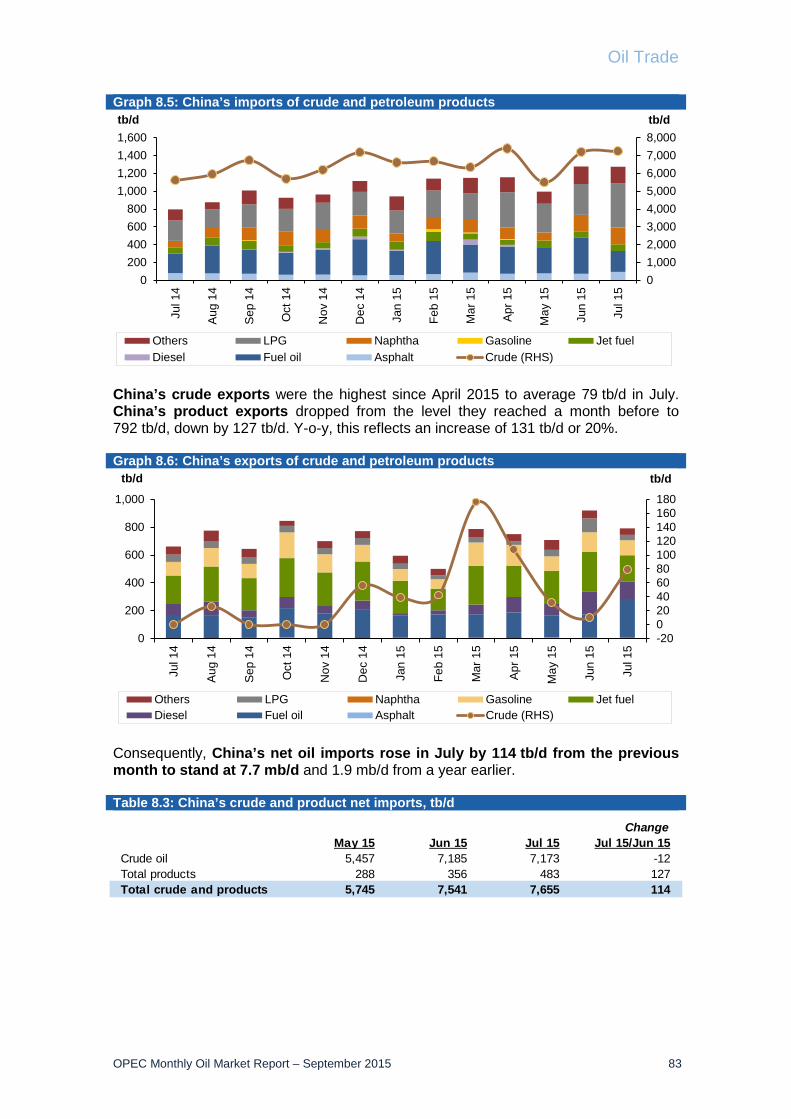
Oil Trade
OPEC Monthly Oil Market Report – September 2015 83
Graph 8.5: China’s imports of crude and petroleum products
China’s crude exports were the highest since April 2015 to average 79 tb/d in July. China’s product exports dropped from the level they reached a month before to 792 tb/d, down by 127 tb/d. Y-o-y, this reflects an increase of 131 tb/d or 20%. Graph 8.6: China’s exports of crude and petroleum products
Consequently, China’s net oil imports rose in July by 114 tb/d from the previous month to stand at 7.7 mb/d and 1.9 mb/d from a year earlier. Table 8.3: China’s crude and product net imports, tb/d
01,0002,0003,0004,0005,0006,0007,0008,000
0200400600800
1,0001,2001,4001,600
Jul 1
4
Aug
14
Sep
14
Oct
14
Nov
14
Dec
14
Jan
15
Feb
15
Mar
15
Apr 1
5
May
15
Jun
15
Jul 1
5
tb/dtb/d
Others LPG Naphtha Gasoline Jet fuelDiesel Fuel oil Asphalt Crude (RHS)
-20020406080100120140160180
0
200
400
600
800
1,000
Jul 1
4
Aug
14
Sep
14
Oct
14
Nov
14
Dec
14
Jan
15
Feb
15
Mar
15
Apr
15
May
15
Jun
15
Jul 1
5
tb/dtb/d
Others LPG Naphtha Gasoline Jet fuelDiesel Fuel oil Asphalt Crude (RHS)
ChangeMay 15 Jun 15 Jul 15 Jul 15/Jun 15
Crude oil 5,457 7,185 7,173 -12Total products 288 356 483 127Total crude and products 5,745 7,541 7,655 114

Oil Trade
84 OPEC Monthly Oil Market Report – September 2015
India In July, India’s crude imports rose by 376 tb/d, or 10%, from the previous month to average 4.2 mb/d, the highest level since January 2013. Overall crude imports showed an annual gain of 829 tb/d or 25%. Graph 8.7: India’s imports of crude and petroleum products
On the products side, India’s products imports in July saw a drop of 43 tb/d, or 6%, m-o-m to average 629 tb/d, while y-o-y they gained 114 tb/d or 22%. At the same time, Indian domestic product sales were down by 3% from last month. The drop in monthly product imports came mainly as a result of lower imported volumes of gasoline and fuel oil. Graph 8.8: India’s exports of petroleum products
India’s product exports increased in July by 134 tb/d, or 11%, to average 1.3 mb/d. On a y-o-y basis, product exports were up from a year before by 205 tb/d or 19%. The gain in product exports came on the back of higher exported volumes of diesel, which were 17% higher from a month ago and 61% higher from a year earlier. As a result, India’s net imports increased by 198 tb/d m-o-m to average 3.5 mb/d, up by 737 tb/d y-o-y.
0
1,000
2,000
3,000
4,000
5,000
0100200300400500600700800
Jul 1
4
Aug
14
Sep
14
Oct
14
Nov
14
Dec
14
Jan
15
Feb
15
Mar
15
Apr
15
May
15
Jun
15
Jul 1
5
tb/dtb/d
Others LPG Naphtha GasolineKerosene Gasoil Fuel oil Crude (RHS)
0
500
1,000
1,500
2,000
0
500
1,000
1,500
2,000
Jul 1
4
Aug
14
Sep
14
Oct
14
Nov
14
Dec
14
Jan
15
Feb
15
Mar
15
Apr 1
5
May
15
Jun
15
Jul 1
5tb/dtb/d
Fuel oil Gasoil Jet fuel Gasoline Naphtha Others

Oil Trade
OPEC Monthly Oil Market Report – September 2015 85
Table 8.4: India’s crude and product net imports, tb/d
FSU In July, total crude oil exports from the Former Soviet Union dropped by 12 tb/d to average 6.2 mb/d. Crude exports through Russian pipelines dropped as well by 47 tb/d, or 1%, to average 3.9 mb/d. In the Transneft system, total shipments from the Black Sea rose by 78 tb/d, or 15%, to average 605 tb/d, as shipments from Novorossiysk port terminal dropped from the previous month. Total Baltic Sea exports dropped by 209 tb/d in July, mainly as shipments from Primorsk port terminal dropped by 193 tb/d, in addition to lower shipments seen from Ust Luga terminal, which declined by 16 tb/d from a month before. Total shipments from the Druzhba pipeline increased by 32 tb/d in July to average 1 mb/d. Kozmino shipments increased by 30 tb/d, or 5%, to average 625 tb/d. Exports through the Lukoil system dropped in July from last month. In the Barents Sea, the Varandey offshore platform showed a decline of 21 tb/d, while in the Baltic Sea total shipments averaged 12 tb/d, which was stable from the month before. On average, Russian Far East total exports were lower slightly by 9 tb/d, or 3%, from the previous month due to a decline in exports from De Kastri port terminal, which declined by 31 tb/d from last month. Total exports from Central Asia through the Kenkiyak-Alashankou pipeline averaged 196 tb/d, dropping by a slight 7 tb/d from levels seen in June. Total exports from the Baltic Sea increased by a slight 3 tb/d, mainly on the back of increased volumes through Novorossiyk port terminal, while shipments through Batumi port terminal and Supsa port terminal both declined by 3 tb/d and 14 tb/d, respectively, from a month ago. In the Mediterranean Sea, BTC supplies went up by 74 tb/d, or 12%, from a month ago to average 718 tb/d. Looking into product exports, total FSU product exports dropped by 187 tb/d, or 6%, from last month to average 3.2 mb/d. The drop in product exports came as exports of gasoil, gasoline and fuel oil all dropped from June by 133 tb/d, 26 tb/d and 108 tb/d, respectively.
ChangeMay 15 Jun 15 Jul 15 Jul 15/Jun 15
Crude oil 4,121 3,811 4,187 376Total products -391 -507 -685 -178Total crude and products 3,730 3,304 3,502 198
Note: India data tab le does not include information for crude import and product export by Reliance Industries.

Oil Trade
86 OPEC Monthly Oil Market Report – September 2015
Table 8.5: Recent FSU exports of crude and petroleum products by source, tb/d
Transneft system 2013 1Q 15 2Q 15 Jun 15 Jul 15
Europe Black Sea total 739 702 561 527 605 Novorossiysk port terminal - total 739 702 561 527 605 of which: Russian oil 535 505 421 404 439 Others 204 198 139 123 166
Baltic Sea total 1,546 1,444 1,427 1,449 1,240 Primorsk port terminal - total 1,083 879 917 966 772 of which: Russian oil 1,007 879 724 966 772 Others 76 0 193 0 0 Ust-Luga port terminal - total 463 564 510 484 468 of which: Russian oil 342 356 367 387 304 Others 121 208 143 97 164
Druzhba pipeline total 1,032 1,071 1,078 1,006 1,039 of which: Russian oil 1,000 1,039 1,045 974 1,008 Others 32 32 32 33 31
Asia Pacific ocean total 434 605 637 595 625 Kozmino port terminal - total 434 605 637 595 625
China (via ESPO Pipeline) total 321 309 315 323 345 China Amur 321 309 315 323 345
4,071 4,131 4,018 3,901 3,854
Lukoil system 2013 1Q 15 2Q 15 Jun 15 Jul 15
Barents Sea Total 111 134 138 140 118 Varandey offshore platform 111 134 138 140 118
Europe Baltic Sea Total 19 18 14 12 12 Kalinigrad port terminal 19 18 14 12 12
Other routes 2013 1Q 15 2Q 15 Jun 15 Jul 15
Asia Russian Far East total 259 309 324 314 305 Aniva bay port terminal 114 109 111 97 119 De Kastri port terminal 145 200 213 217 186
Central Asia total 239 252 232 202 196 Kenkiyak-Alashankou 239 252 232 202 196
Europe Baltic sea total 853 1,118 993 989 992 Novorossiysk port terminal (CPC) 704 986 903 884 904 Supsa port terminal 76 91 69 84 81 Batumi port terminal 53 41 20 21 7 Kulevi port terminal 20 0 0 0 0
Mediterranean sea total 641 638 606 644 718 BTC 641 638 606 644 718
Russian rail 2013 1Q 15 2Q 15 Jun 15 Jul 15Russian rail 198 18 16 19 14 of which: Russian oil 9 8 7 8 9 Others 189 9 8 10 4
6,392 6,618 6,342 6,221 6,209
Products 2013 1Q 15 2Q 15 Jun 15 Jul 15Gasoline 122 162 200 191 165Naphtha 390 567 476 428 441Jet 11 28 37 37 47Gasoil 857 1,229 1,061 1,080 947Fuel oil 1,415 1,507 1,475 1,398 1,290VGO 263 231 250 271 328
3,058 3,724 3,499 3,405 3,218
Total FSU oil exports 9,450 10,342 9,841 9,626 9,427
Sources: Argus Nefte Transport and Argus Global Markets.
Total Russian crude exports
Europe and North America
Total FSU crude exports
Total FSU product exports

Stock Movements
OPEC Monthly Oil Market Report – September 2015 87
Stock Movements OECD commercial oil stocks rose by 8.5 mb in July to stand at 2,925 mb, around 234 mb higher than same time one year ago, and about 202 mb above the latest five-year average. Crude oil and products showed a surplus of around 163 mb and 39 mb above the seasonal norm, respectively. In terms of days of forward cover, OECD commercial stocks stood at 63.3 days, 4.8 days higher than the latest five-year average. Preliminary data for August shows that total commercial oil stocks in the US rose by 15.4 mb, to stand at 1,289 mb. At this level, they were 158.2 mb or 14% above the same period a year ago and 169.5 mb or 15.1% higher than the latest five-year average. Within the components, product stocks went up by 14.9 mb, while crude saw a slight build of 0.2 mb. The latest information for China showed an increase in total commercial oil inventories of 8.9 mb in July, to stand at 420.9 mb, which is around 13.6 mb above the previous year at the same time. Within the components, commercial crude and product stocks both rose, by 3.7 mb and 5.2 mb, respectively. OECD The latest information for July shows that total OECD commercial oil stocks rose by 8.5 mb for the previous five consecutive months to stand at 2,925 mb. With this build, stocks are 234.1 mb higher than at the same time one year ago and 201.9 mb above the latest five-year average. Within the components, crude fell by 3.9 mb, while products rose by 12.4 mb. Graph 9.1: OECD’s commercial oil stocks
OECD commercial crude stocks fell to end July at 1,473 mb, standing 147.3 mb above the same time one year earlier and 162.6 mb higher than the latest five-year average. OECD Americas saw a stock draw, while OECD Europe and Asia Pacific experienced builds. Strong refinery throughputs in the US were behind the decline in crude oil inventories in July. In contrast, OECD product inventories rose in July by 12.4 mb, ending the month at 1,452 mb. At this level, product inventories stood 86.8 mb higher than a year ago at the same time, and were 39.3 mb above the seasonal norm.
2,5002,5502,6002,6502,7002,7502,8002,8502,9002,950
2,5002,5502,6002,6502,7002,7502,8002,8502,9002,950
Jan Feb Mar Apr May Jun Jul Aug Sep Oct Nov Dec
mbmb
2014 2015 Average 2010-2014
Max/Min2010-2014

Stock Movements
88 OPEC Monthly Oil Market Report – September 2015
In terms of days of forward cover, OECD commercial stocks fell slightly by 0.1 days in July from the previous month to stand at 63.3 days, or 4.9 days above the previous year in the same period and 4.8 days higher than the latest five-year average. Within the regions, OECD Americas’ days of forward cover was 5.4 days higher than the historical average to stand at 62.1 days in July. OECD Asia Pacific stood 4.0 days above the seasonal average to finish the month at 57.0 days. At the same time, OECD Europe indicated a surplus of 4.0 days above the seasonal norm, averaging 68.8 days in July. Commercial stocks in OECD Americas fell by 9.7 mb in July, reversing the build of the last four months. At 1,535 mb, stocks represented a surplus of 157.0 mb above the seasonal norm and around 139.6 mb above the same time one year ago. Within components, crude stocks fell by 14.3 mb, while product inventories rose by 4.6 mb. At the end of July, crude commercial oil stocks in OECD Americas fell for the third consecutive month to stand at 785 mb. At this level, they were 114.7 mb above the latest five-year average and 93.3 mb higher than the same time one year ago. Higher crude oil refinery input in the US was the main driver behind the fall in crude oil stocks. Refinery runs reached 16.4 mb/d in July, which corresponds to around 94% of operable capacity. In contrast, product stocks in OECD Americas rose by 4.6 mb, ending July at 750 mb. At this level, they indicated a surplus of 46.4 mb above the same time one year ago, and were 42.4 mb higher than the seasonal norm. The build in product stocks came mainly from higher refinery output. OECD Europe’s commercial stocks rose by 9.2 mb in July, reversing the drop of the previous month to stand at 953 mb. This was 70.0 mb higher than the same time a year ago and represented a surplus of 27.2 mb above the latest five-year average. Crude and product stocks rose by 4.8 mb and 4.4 mb, respectively. OECD Europe’s commercial crude stocks rose in July to stand at 419 mb, which was 32.5 mb above the same period a year earlier and 27 mb higher than the latest five-year average. Higher crude supply was the main reason behind the build in crude oil inventories, as increases in crude runs limited further build. OECD Europe’s commercial product stocks also rose by 4.4 mb in July, ending the month at 534 mb, 37.5 mb higher than a year ago at the same time, and at around the seasonal norm. Higher refinery output contributed to the drop in Europe’s commercial product stocks. OECD Asia Pacific commercial oil stocks rose by 9.0 mb in July, reversing June’s fall to stand at 437 mb. At this level, OECD Asia Pacific commercial oil inventories were 24.4 mb higher than a year ago and 17.7 mb above the five-year average. Within the components, crude and product stocks rose by 5.6 mb and 3.4 mb, respectively. Crude inventories ended the month of July at 268 mb. They stood 21.5 mb higher than a year ago and 20.9 mb above the seasonal norm. OECD Asia Pacific’s total product inventories ended June at 169 mb, indicating a surplus of 2.9 mb with a year ago, but 3.2 mb lower than the seasonal norm.

Stock Movements
OPEC Monthly Oil Market Report – September 2015 89
Table 9.1: OECD’s commercial stocks, mb
EU plus Norway Preliminary data for July shows that total European stocks rose by 4.4 mb for the second consecutive month to stand at 1,114.6 mb, which was 53.8 mb or 5.1% above the same time a year ago and 31.9 mb or 2.9% higher than the latest five-year average. Crude stocks rose by 4.8 mb, while product inventories fell by 0.4 mb from the previous month. European crude inventories rose in July for the fifth consecutive month to stand at 501.8 mb, which was 29.5 mb or 6.2% above the same period a year ago and 37.0 mb or 8.0% higher than the seasonal norm. The increase came despite higher crude runs in July, which reached 10.5 mb/d, around 120,000 b/d more than June’s level, with high supply the main reason behind the build. In contrast, European product stocks fell by 0.4 mb in July to stand at 612.8 mb, which was 24.4 mb or 4.1% above a year ago at the same time, but remained 5.1 mb or 0.8% below the seasonal norm. Within products the picture was mixed, with gasoline and residual fuel oil stocks going down, while middle distillates witnessed stock builds. Graph 9.2: EU-15 plus Norway’s total oil stocks
Gasoline stocks fell by 1.5 mb in July to stand at 113.7 mb, which was 8.9 mb or 8.5% above a year earlier and 6.0 mb or 5.6% higher than the seasonal norm. The decline in gasoline stocks was driven mainly by higher demand in the region, as increasing refinery output limited a further drop. Residual fuel oil stocks also fell by 0.8 mb in July to stand at 74.4 mb, which was 2.2 mb, or 3.1%, above the same month a year ago, but remained 15.8 mb or 17.5% lower than the latest five-year average. In contrast, distillate stocks rose by 1.9 mb, reversing the decline of the previous month and ending July at 399.2 mb. At this level, distillate stocks were 11.6 mb or 3.0%
1,040
1,060
1,080
1,100
1,120
1,140
1,160
1,180
1,040
1,060
1,080
1,100
1,120
1,140
1,160
1,180
Jan Feb Mar Apr May Jun Jul Aug Sep Oct Nov Dec
mbmb
2014 2015 Average 2010-2014
Max/Min2010-2014
ChangeMay 15 Jun 15 Jul 15 Jul 15/Jun 15 Jul 14
Crude oil 1,481 1,477 1,473 -3.9 1,326Products 1,426 1,440 1,452 12.4 1,365Total 2,907 2,916 2,925 8.5 2,691
Days of forward cover 63.2 63.3 63.3 -0.1 58.4

Stock Movements
90 OPEC Monthly Oil Market Report – September 2015
higher than the previous year at the same time and 9.2 mb, or 2.4%, above the latest five-year average. Higher distillate imports, combined with higher output, were behind the build in distillate inventories. Naphtha stocks remained almost unchanged in July from the previous month to stand at 25.5 mb. At this level, they were 1.6 mb or 6.6% above the same time a year ago, but 4.5 mb or 15.1% lower than the seasonal average. Table 9.2: EU-15 plus Norway’s total oil stocks, mb
US Preliminary data for August shows that total commercial oil stocks in the US rose by 15.1 mb, reversing the decline of the previous month to stand at 1,288.9 mb. At this level, they were 158.2 mb or 14% above the same period a year ago and 169.5 mb or 15.1% higher than the latest five-year average. Within the components, product stocks went up by 14.9 mb, while crude saw a slight build of 0.2 mb. US commercial crude stocks rose slightly in August, reversing the fall of the last three months to stand at 455.4 mb. Crude commercial stocks finished the month at 94.8 mb or 26.3% above the same time last year and 96.7 mb or 27.0% above the latest five-year average. Lower crude oil refinery input contributed to the stock-build. Indeed, refinery runs fell by around 110,000 b/d to average 16.7 mb/d. Refineries were running at around 93.6% of operable capacity in August, 0.6 pp lower than in the previous month, but 1.6% higher than last year at the same time. An increase in crude oil imports also contributed to the build in crude oil inventories. Crude at Cushing, Oklahoma, saw also a stock-build of 0.2 mb in August versus the previous month, to end the month at 57.3 mb. Graph 9.3: US weekly commercial crude oil stocks
300320340360380400420440460480500
300320340360380400420440460480500
1 4 7 10 13 16 19 22 25 28 31 34 37 40 43 46 49 52
mbmb
2014 2015 Average 2010-2014
Max/Min2010-2014
ChangeMay 15 Jun 15 Jul 15 Jul 15/Jun 15 Jul 14
Crude oil 491.9 497.0 501.8 4.8 472.3Gasoline 115.4 115.2 113.7 -1.5 104.8Naphtha 25.5 25.5 25.5 0.0 23.9Middle distillates 399.7 397.3 399.2 1.9 387.5Fuel oils 74.7 75.3 74.4 -0.8 72.2Total products 615.2 613.3 612.8 -0.4 588.5Total 1,107.1 1,110.2 1,114.6 4.4 1,060.8
Sources: Argus and Euroilstock.

Stock Movements
OPEC Monthly Oil Market Report – September 2015 91
Total product stocks rose by 14.9 mb in August for the sixth consecutive month. At 833.5 mb, US product stocks were at around 63.5 mb or 8.2% above the level seen at the same time a year ago, showing a surplus of 72.8 mb or 9.6% above the seasonal norm. Within products, the picture was mixed. Distillates and residual fuel oil saw a build, while gasoline and jet fuel experienced drops. Distillate stocks rose by 5.1 mb in August, ending the month at 150.0 mb. At this level, they indicated a surplus of 21.8 mb or 17.0% from the same period a year ago, and stood 7.6 mb or 5.3% above the latest five-year average. The build in middle distillate stocks was driven by lower demand, which decreased by around 20,000 b/d, averaging 3.7 mb/d. Residual fuel oil inventories also rose by 0.7 mb to 40.2 mb, which was 2.7 mb or 7.1% higher than last year over the same period and 3.3 mb or 8.9% above the seasonal norm. Graph 9.4: US weekly gasoline stocks
In contrast, gasoline stocks fell by 2.6 mb in August for the sixth consecutive month to stand at 214.2 mb. At this level, gasoline stocks were 2.3 mb or 1.1% lower than the same period a year ago and 1.5 mb or 0.7% above the latest five-year average. The drop came mainly from ongoing higher demand reaching more than 9.5 mb/d. Higher gasoline production, which reached nearly 10.0 mb/d, limited a further drop in gasoline inventories. Jet fuel stocks also fell by 0.8 mb, ending August at 42.5 mb. At this level, jet fuel stocks stood 6.9 mb or 19.4% higher than in the same month a year ago, and were 0.8 mb or 1.9% above the latest five-year average. Table 9.3: US onland commercial petroleum stocks, mb
195200205210215220225230235240245
195200205210215220225230235240245
1 4 7 10 13 16 19 22 25 28 31 34 37 40 43 46 49 52
mbmb
2014 2015 Average 2010-2014
Max/Min2010-2014
ChangeJun 15 Jul 15 Aug 15 Aug 15/Jul 15 Aug 14
Crude oil 469.5 455.3 455.4 0.2 362.5Gasoline 221.0 216.7 214.2 -2.6 212.1Distillate fuel 139.4 144.8 150.0 5.1 128.3Residual fuel oil 41.8 39.5 40.2 0.7 37.5Jet fuel 43.7 43.4 42.5 -0.8 35.8Total 1,277.4 1,273.8 1,288.9 15.1 1,136.1SPR 693.9 695.1 695.1 0.0 691.0
Source: US Energy Information Administration.

Stock Movements
92 OPEC Monthly Oil Market Report – September 2015
Japan In Japan, total commercial oil stocks rose by 8.9 mb in July, reversing June’s stock draw. At 167.4 mb, Japanese commercial oil inventories stood 4.9 mb or 3.0% higher than a year ago, but remained 4.9 mb or 2.9% below the five-year average. Within the components, crude and product inventories rose by 5.6 mb and 3.4 mb, respectively. Japanese commercial crude oil stocks rose in July for the third consecutive month to stand at 103.0 mb. With the build, stocks were 3.6 mb above a year ago at the same time and 1.1 mb above the seasonal norm. The stock build in crude oil was driven by higher crude imports, which rose by around 500,000 b/d or 17.0% to average 3.4 mb/d. Higher crude runs limited a further build in crude oil stocks. Indeed, refinery runs rose by about 430 tb/d to stand at 3.1 mb/d, corresponding to a utilization rate of 78.6%, 11.0 pp above the previous month and 2.1 pp above a year ago at the same time. Japan’s total product inventories also rose by 3.4 mb in July, reversing the drop of the previous month. At 64.1 mb, product stocks stood 1.3 mb or 2.1% above the same time a year ago, but showed a deficit of 6.0 mb or 8.6% with the five-year average. The build was driven mainly by higher refinery output, which rose by around 335 tb/d, or 12.9%, to stand at 2.9 mb/d, but was 2.8% higher than a year ago at the same time. Increases in oil product sales limited a further build in inventories. Oil product sales rose by around 100,000 b/d, averaging 2.9 mb/d, 1.0% higher than a year ago at the same time. Within products, the picture was mixed; distillate and residual fuel oil stocks rose, while gasoline and naphtha experienced stock draws. Graph 9.5: Japan’s commercial oil stocks
Distillate stocks rose by 3.5 mb in July to stand at 28.9 mb. At this level, distillate stocks were 2.6 mb or 10.0% above the same period a year ago, but 1.4 mb or 4.8% below the seasonal average. Within distillate components, gasoil and kerosene stocks rose by 12.9% and 11.6%, respectively, while jet fuel stocks rose by 20.0%. The build in distillate components was driven by higher output combined with lower domestic sales. Total residual fuel oil stocks rose by 1.2 mb in July to stand at 13.6 mb, which was 2.5 mb or 15.7% below a year ago and 2.4 mb or 15.2% lower than the latest five-year average. Within the fuel oil components, fuel oil A and fuel oil B.C stocks rose by 0.7% and 16.1%, respectively. The build was driven by lower domestic sales, combined with higher production.
140
150
160
170
180
190
140
150
160
170
180
190
Jan Feb Mar Apr May Jun Jul Aug Sep Oct Nov Dec
mbmb
2014 2015 Average 2010-2014
Max/Min2010-2014
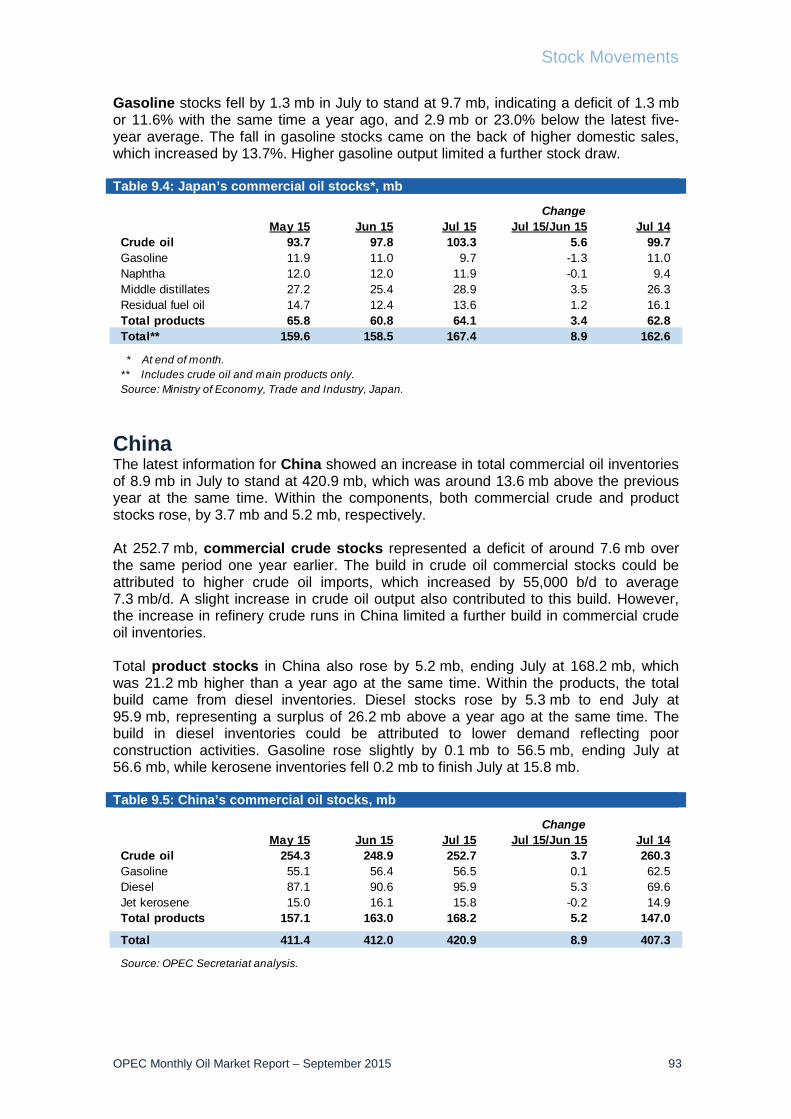
Stock Movements
OPEC Monthly Oil Market Report – September 2015 93
Gasoline stocks fell by 1.3 mb in July to stand at 9.7 mb, indicating a deficit of 1.3 mb or 11.6% with the same time a year ago, and 2.9 mb or 23.0% below the latest five-year average. The fall in gasoline stocks came on the back of higher domestic sales, which increased by 13.7%. Higher gasoline output limited a further stock draw. Table 9.4: Japan’s commercial oil stocks*, mb
China The latest information for China showed an increase in total commercial oil inventories of 8.9 mb in July to stand at 420.9 mb, which was around 13.6 mb above the previous year at the same time. Within the components, both commercial crude and product stocks rose, by 3.7 mb and 5.2 mb, respectively. At 252.7 mb, commercial crude stocks represented a deficit of around 7.6 mb over the same period one year earlier. The build in crude oil commercial stocks could be attributed to higher crude oil imports, which increased by 55,000 b/d to average 7.3 mb/d. A slight increase in crude oil output also contributed to this build. However, the increase in refinery crude runs in China limited a further build in commercial crude oil inventories. Total product stocks in China also rose by 5.2 mb, ending July at 168.2 mb, which was 21.2 mb higher than a year ago at the same time. Within the products, the total build came from diesel inventories. Diesel stocks rose by 5.3 mb to end July at 95.9 mb, representing a surplus of 26.2 mb above a year ago at the same time. The build in diesel inventories could be attributed to lower demand reflecting poor construction activities. Gasoline rose slightly by 0.1 mb to 56.5 mb, ending July at 56.6 mb, while kerosene inventories fell 0.2 mb to finish July at 15.8 mb. Table 9.5: China’s commercial oil stocks, mb
ChangeMay 15 Jun 15 Jul 15 Jul 15/Jun 15 Jul 14
Crude oil 93.7 97.8 103.3 5.6 99.7Gasoline 11.9 11.0 9.7 -1.3 11.0Naphtha 12.0 12.0 11.9 -0.1 9.4Middle distillates 27.2 25.4 28.9 3.5 26.3Residual fuel oil 14.7 12.4 13.6 1.2 16.1Total products 65.8 60.8 64.1 3.4 62.8Total** 159.6 158.5 167.4 8.9 162.6
* At end of month.** Includes crude oil and main products only.Source: Ministry of Economy, Trade and Industry, Japan.
ChangeMay 15 Jun 15 Jul 15 Jul 15/Jun 15 Jul 14
Crude oil 254.3 248.9 252.7 3.7 260.3Gasoline 55.1 56.4 56.5 0.1 62.5Diesel 87.1 90.6 95.9 5.3 69.6Jet kerosene 15.0 16.1 15.8 -0.2 14.9Total products 157.1 163.0 168.2 5.2 147.0
Total 411.4 412.0 420.9 8.9 407.3
Source: OPEC Secretariat analysis.

Stock Movements
94 OPEC Monthly Oil Market Report – September 2015
Singapore and Amsterdam-Rotterdam-Antwerp (ARA) At the end of July, product stocks in Singapore rose by 4.3 mb, reversing the decline of the previous month to stand at 51.7 mb, which was 11.5 mb or 28.6% above the same period a year ago. Within products, middle distillates and fuel oil stocks experienced a build, while light distillates saw a drop. Middle distillate stocks rose by 2.7 mb in July, finishing the month at 12.7 mb, which was 1.0 mb or 8.5% above the same time a year ago. Residual fuel oil stocks also rose by 1.8 mb in July, ending the month at 27.1 mb, which was 8.2 mb or 43.6% higher than at the same time a year ago. The build was driven mainly by lower demand in the region. In contrast, light distillate stocks went down by 0.3 mb, ending July at 11.9 mb, which was 2.3 mb or 23.4% above the previous year at the same time. Product stocks in Amsterdam-Rotterdam-Antwerp (ARA) rose by 1.6 mb in July, up for the third consecutive month, to stand at 46.7 mb. At this level, stocks are 10.9 mb or 30.5% higher than at the same time a year ago. Within products, the picture was mixed. Gasoline and jet fuel experienced builds, while naphtha, gasoil and fuel oil witnessed draws. Gasoline stocks rose by 2.0 mb in July, ending the month at 9.5 mb, which is 3.1 mb or 49.2% higher than the same period a year ago. The build was mainly driven by higher output. Jet fuel oil rose by 1.1 mb, ending July at 6.0 mb, which was 2.6 mb or almost 80% higher than the previous year at the same time. In contrast, fuel oil stocks fell by 0.6 mb, ending July at 5.8 mb, which was 1.4 mb or 31% above a year ago in the same period.

Balance of Supply and Demand
OPEC Monthly Oil Market Report – September 2015 95
Balance of Supply and Demand Demand for OPEC crude in 2015 was revised up by 0.1 mb/d from the previous report to stand at 29.3 mb/d, which is 0.4 mb/d higher than the 2014 level. In 2016, the demand for OPEC crude is projected to be 30.3 mb/d, or 0.2 mb/d above the previous report and around 1.0 mb/d higher than this year. Forecast for 2015 Demand for OPEC crude in 2015 was revised up by 0.1 mb/d from the previous month to 29.3 mb/d, representing an increase of 0.4 mb/d over the 2014 level. The first two quarters were revised up by 0.2 mb/d each, while the third and fourth quarters were revised up by 0.1 mb/d each. This upward revision reflects an upswing in demand combined with a downward adjustment to non-OPEC production. The first quarter fell by 0.6 mb/d, while the second quarter grew by 0.2 mb/d. The third and the fourth quarters are expected to see growth of 0.5 mb/ and 1.5 mb/d, respectively, versus the same quarter a year ago. Table 10.1: Summarized supply/demand balance for 2015, mb/d
Forecast for 2016 Demand for OPEC crude in 2016 saw an upward revision of 0.2 mb/d from the previous month. The first and the second quarters were revised up by 0.2 mb/d and 0.3 mb/d, respectively, while the third and the fourth quarters were revised up by 0.1 mb/d and 0.2 mb/d, respectively. Demand for OPEC crude for next year is projected to increase by 1.0 mb/d to average 30.3 mb/d. The first and second quarters are expected to increase by 1.6 mb/d and 1.4 mb/d, respectively, while the third and the fourth quarters are projected to increase by 0.7 mb/d and 0.2 mb/d, respectively. Table 10.2: Summarized supply/demand balance for 2016, mb/d
2014 1Q15 2Q15 3Q15 4Q15 2015(a) World oil demand 91.33 91.93 92.03 93.28 93.90 92.79 Non-OPEC supply 56.55 57.96 57.65 56.92 57.20 57.43 OPEC NGLs and non-conventionals 5.83 5.86 5.94 6.13 6.13 6.01(b) Total supply excluding OPEC crude 62.38 63.82 63.59 63.05 63.33 63.44
Difference (a-b) 28.95 28.11 28.44 30.23 30.57 29.35OPEC crude oil production 30.07 30.33 31.19Balance 1.12 2.22 2.76
Totals may not add up due to independent rounding.
2015 1Q16 2Q16 3Q16 4Q16 2016(a) World oil demand 92.79 93.24 93.32 94.56 95.18 94.08 Non-OPEC supply 57.43 57.45 57.28 57.42 58.20 57.59 OPEC NGLs and non-conventionals 6.01 6.14 6.18 6.21 6.22 6.18(b) Total supply excluding OPEC crude 63.44 63.58 63.45 63.63 64.41 63.77
Difference (a-b) 29.35 29.66 29.87 30.93 30.76 30.31
Totals may not add up due to independent rounding.
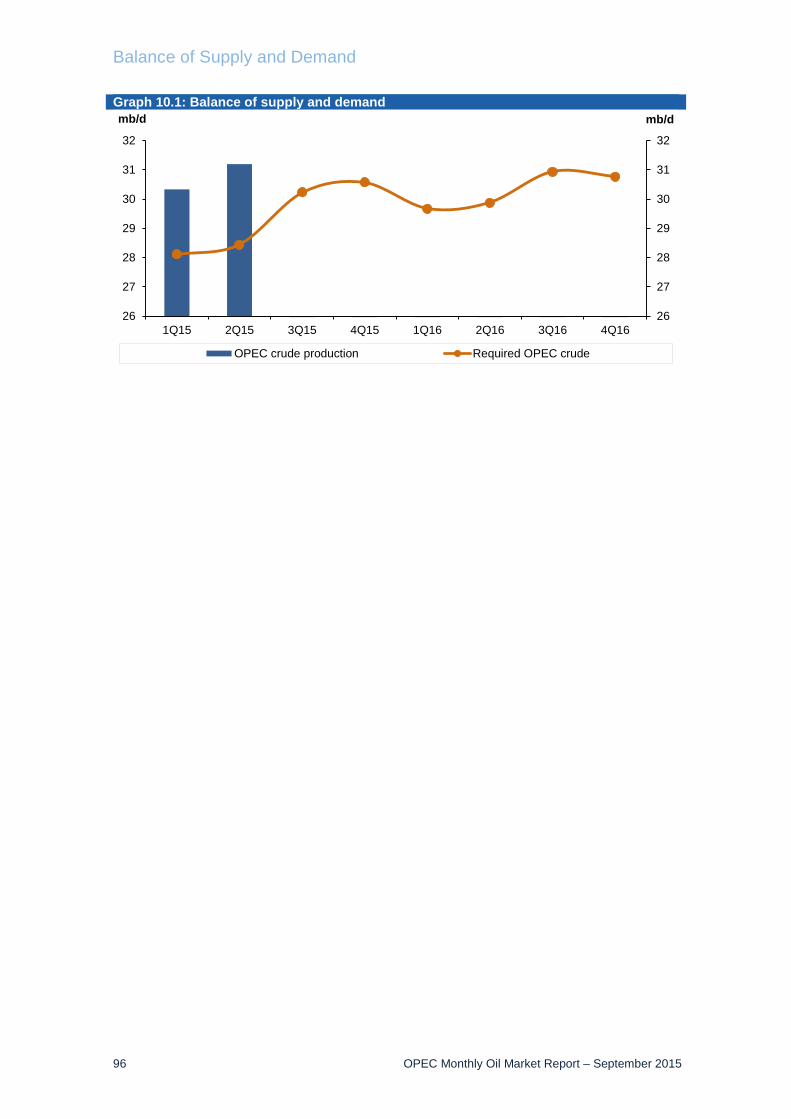
Balance of Supply and Demand
96 OPEC Monthly Oil Market Report – September 2015
Graph 10.1: Balance of supply and demand
26
27
28
29
30
31
32
26
27
28
29
30
31
32
1Q15 2Q15 3Q15 4Q15 1Q16 2Q16 3Q16 4Q16
mb/dmb/d
OPEC crude production Required OPEC crude
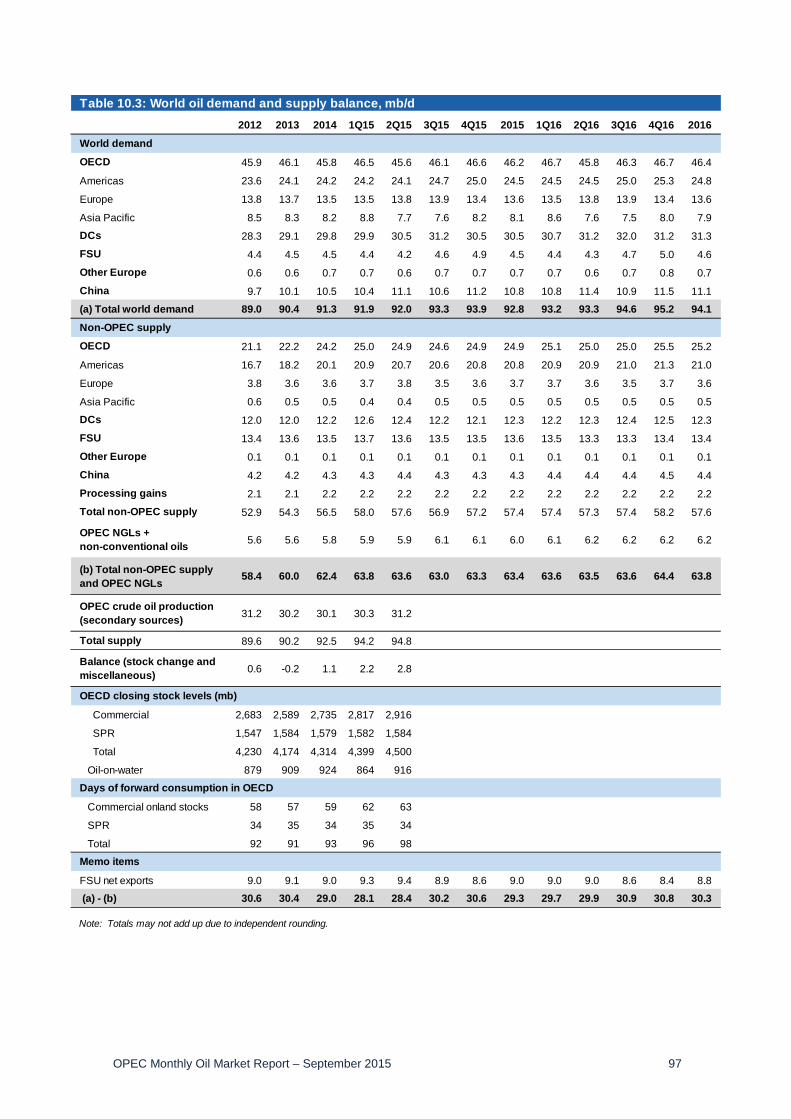
OPEC Monthly Oil Market Report – September 2015 97
Table 10.3: World oil demand and supply balance, mb/d2012 2013 2014 1Q15 2Q15 3Q15 4Q15 2015 1Q16 2Q16 3Q16 4Q16 2016
World demand
OECD 45.9 46.1 45.8 46.5 45.6 46.1 46.6 46.2 46.7 45.8 46.3 46.7 46.4
Americas 23.6 24.1 24.2 24.2 24.1 24.7 25.0 24.5 24.5 24.5 25.0 25.3 24.8
Europe 13.8 13.7 13.5 13.5 13.8 13.9 13.4 13.6 13.5 13.8 13.9 13.4 13.6
Asia Pacific 8.5 8.3 8.2 8.8 7.7 7.6 8.2 8.1 8.6 7.6 7.5 8.0 7.9
DCs 28.3 29.1 29.8 29.9 30.5 31.2 30.5 30.5 30.7 31.2 32.0 31.2 31.3
FSU 4.4 4.5 4.5 4.4 4.2 4.6 4.9 4.5 4.4 4.3 4.7 5.0 4.6
Other Europe 0.6 0.6 0.7 0.7 0.6 0.7 0.7 0.7 0.7 0.6 0.7 0.8 0.7
China 9.7 10.1 10.5 10.4 11.1 10.6 11.2 10.8 10.8 11.4 10.9 11.5 11.1
(a) Total world demand 89.0 90.4 91.3 91.9 92.0 93.3 93.9 92.8 93.2 93.3 94.6 95.2 94.1
Non-OPEC supply
OECD 21.1 22.2 24.2 25.0 24.9 24.6 24.9 24.9 25.1 25.0 25.0 25.5 25.2
Americas 16.7 18.2 20.1 20.9 20.7 20.6 20.8 20.8 20.9 20.9 21.0 21.3 21.0
Europe 3.8 3.6 3.6 3.7 3.8 3.5 3.6 3.7 3.7 3.6 3.5 3.7 3.6
Asia Pacific 0.6 0.5 0.5 0.4 0.4 0.5 0.5 0.5 0.5 0.5 0.5 0.5 0.5
DCs 12.0 12.0 12.2 12.6 12.4 12.2 12.1 12.3 12.2 12.3 12.4 12.5 12.3
FSU 13.4 13.6 13.5 13.7 13.6 13.5 13.5 13.6 13.5 13.3 13.3 13.4 13.4
Other Europe 0.1 0.1 0.1 0.1 0.1 0.1 0.1 0.1 0.1 0.1 0.1 0.1 0.1
China 4.2 4.2 4.3 4.3 4.4 4.3 4.3 4.3 4.4 4.4 4.4 4.5 4.4
Processing gains 2.1 2.1 2.2 2.2 2.2 2.2 2.2 2.2 2.2 2.2 2.2 2.2 2.2
Total non-OPEC supply 52.9 54.3 56.5 58.0 57.6 56.9 57.2 57.4 57.4 57.3 57.4 58.2 57.6
OPEC NGLs + non-conventional oils 5.6 5.6 5.8 5.9 5.9 6.1 6.1 6.0 6.1 6.2 6.2 6.2 6.2
(b) Total non-OPEC supply and OPEC NGLs 58.4 60.0 62.4 63.8 63.6 63.0 63.3 63.4 63.6 63.5 63.6 64.4 63.8
OPEC crude oil production (secondary sources) 31.2 30.2 30.1 30.3 31.2
Total supply 89.6 90.2 92.5 94.2 94.8
Balance (stock change and miscellaneous) 0.6 -0.2 1.1 2.2 2.8
OECD closing stock levels (mb)
Commercial 2,683 2,589 2,735 2,817 2,916
SPR 1,547 1,584 1,579 1,582 1,584
Total 4,230 4,174 4,314 4,399 4,500
Oil-on-water 879 909 924 864 916
Days of forward consumption in OECD
Commercial onland stocks 58 57 59 62 63
SPR 34 35 34 35 34
Total 92 91 93 96 98
Memo items
FSU net exports 9.0 9.1 9.0 9.3 9.4 8.9 8.6 9.0 9.0 9.0 8.6 8.4 8.8
(a) - (b) 30.6 30.4 29.0 28.1 28.4 30.2 30.6 29.3 29.7 29.9 30.9 30.8 30.3
Note: Totals may not add up due to independent rounding.
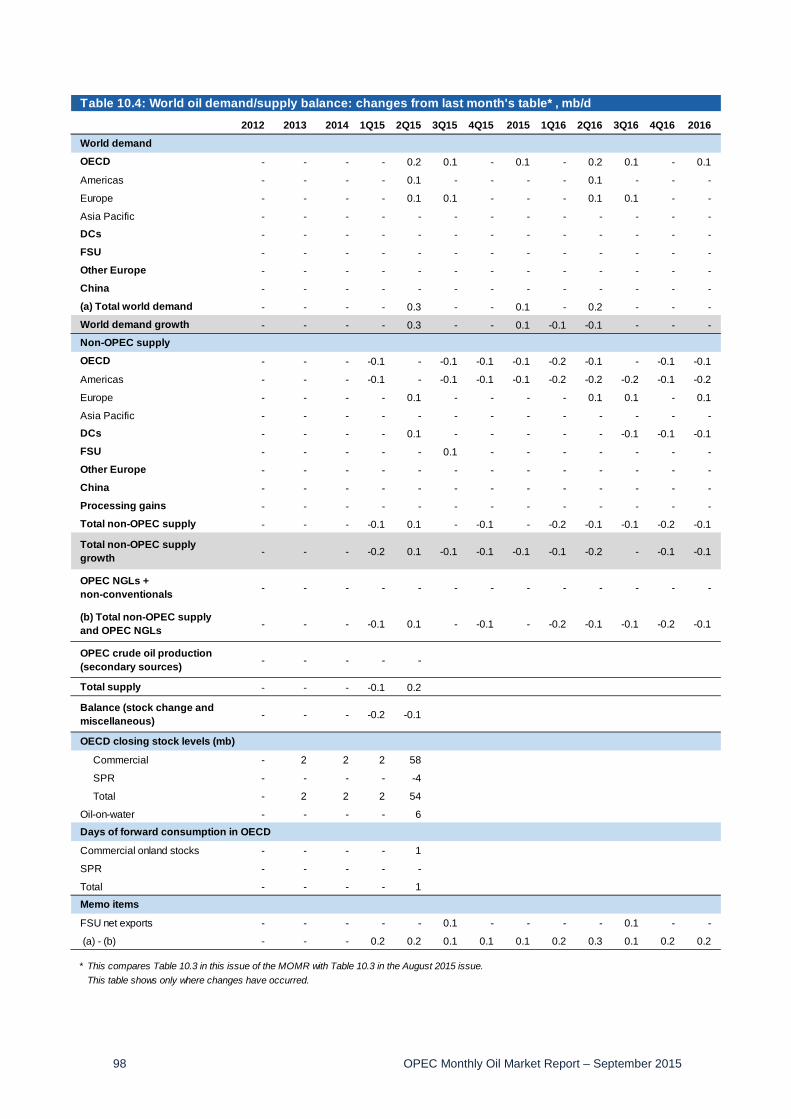
98 OPEC Monthly Oil Market Report – September 2015
Table 10.4: World oil demand/supply balance: changes from last month's table* , mb/d2012 2013 2014 1Q15 2Q15 3Q15 4Q15 2015 1Q16 2Q16 3Q16 4Q16 2016
World demand
OECD - - - - 0.2 0.1 - 0.1 - 0.2 0.1 - 0.1
Americas - - - - 0.1 - - - - 0.1 - - -
Europe - - - - 0.1 0.1 - - - 0.1 0.1 - -
Asia Pacific - - - - - - - - - - - - -
DCs - - - - - - - - - - - - -
FSU - - - - - - - - - - - - -
Other Europe - - - - - - - - - - - - -
China - - - - - - - - - - - - -
(a) Total world demand - - - - 0.3 - - 0.1 - 0.2 - - -
World demand growth - - - - 0.3 - - 0.1 -0.1 -0.1 - - -
Non-OPEC supply
OECD - - - -0.1 - -0.1 -0.1 -0.1 -0.2 -0.1 - -0.1 -0.1
Americas - - - -0.1 - -0.1 -0.1 -0.1 -0.2 -0.2 -0.2 -0.1 -0.2
Europe - - - - 0.1 - - - - 0.1 0.1 - 0.1
Asia Pacific - - - - - - - - - - - - -
DCs - - - - 0.1 - - - - - -0.1 -0.1 -0.1
FSU - - - - - 0.1 - - - - - - -
Other Europe - - - - - - - - - - - - -
China - - - - - - - - - - - - -
Processing gains - - - - - - - - - - - - -
Total non-OPEC supply - - - -0.1 0.1 - -0.1 - -0.2 -0.1 -0.1 -0.2 -0.1
Total non-OPEC supply growth - - - -0.2 0.1 -0.1 -0.1 -0.1 -0.1 -0.2 - -0.1 -0.1
OPEC NGLs + non-conventionals - - - - - - - - - - - - -
(b) Total non-OPEC supply and OPEC NGLs - - - -0.1 0.1 - -0.1 - -0.2 -0.1 -0.1 -0.2 -0.1
OPEC crude oil production (secondary sources) - - - - -
Total supply - - - -0.1 0.2
Balance (stock change and miscellaneous) - - - -0.2 -0.1
OECD closing stock levels (mb)
Commercial - 2 2 2 58
SPR - - - - -4
Total - 2 2 2 54
Oil-on-water - - - - 6
Days of forward consumption in OECD
Commercial onland stocks - - - - 1
SPR - - - - -
Total - - - - 1
Memo items
FSU net exports - - - - - 0.1 - - - - 0.1 - -
(a) - (b) - - - 0.2 0.2 0.1 0.1 0.1 0.2 0.3 0.1 0.2 0.2
* This compares Table 10.3 in this issue of the MOMR with Table 10.3 in the August 2015 issue. This table shows only where changes have occurred.
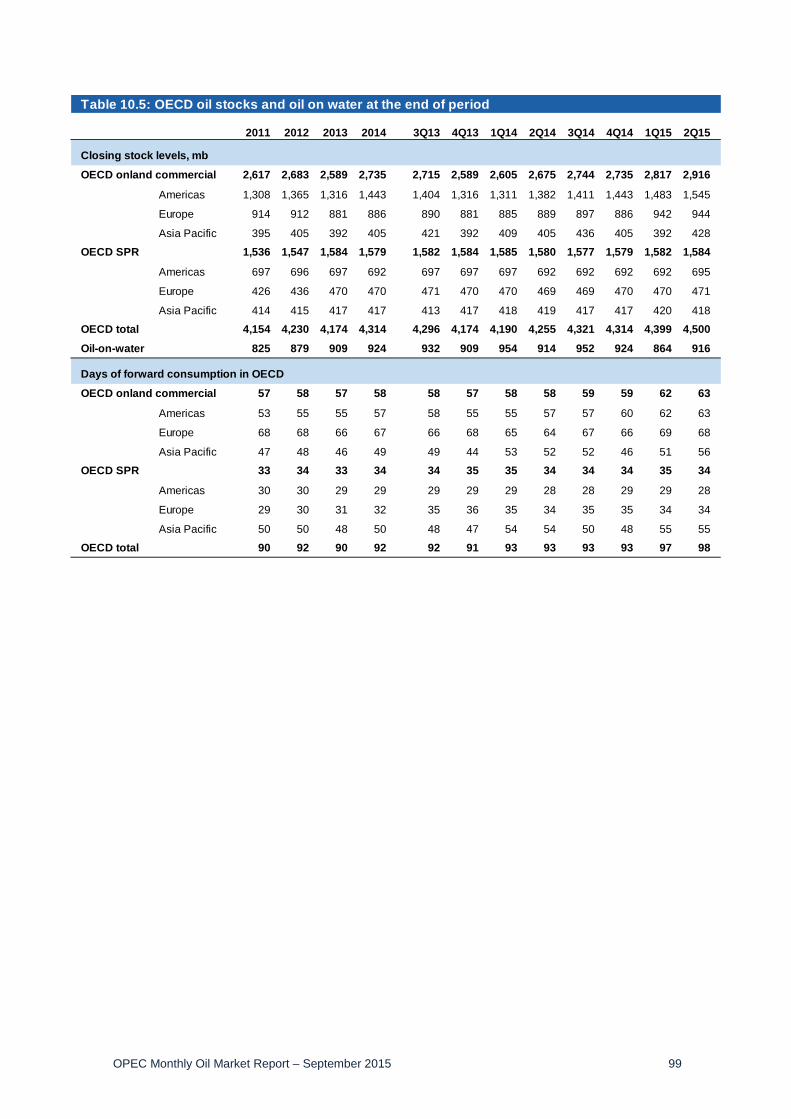
OPEC Monthly Oil Market Report – September 2015 99
Table 10.5: OECD oil stocks and oil on water at the end of period
2011 2012 2013 2014 3Q13 4Q13 1Q14 2Q14 3Q14 4Q14 1Q15 2Q15
Closing stock levels, mb
OECD onland commercial 2,617 2,683 2,589 2,735 2,715 2,589 2,605 2,675 2,744 2,735 2,817 2,916
Americas 1,308 1,365 1,316 1,443 1,404 1,316 1,311 1,382 1,411 1,443 1,483 1,545
Europe 914 912 881 886 890 881 885 889 897 886 942 944
Asia Pacific 395 405 392 405 421 392 409 405 436 405 392 428
OECD SPR 1,536 1,547 1,584 1,579 1,582 1,584 1,585 1,580 1,577 1,579 1,582 1,584
Americas 697 696 697 692 697 697 697 692 692 692 692 695
Europe 426 436 470 470 471 470 470 469 469 470 470 471
Asia Pacific 414 415 417 417 413 417 418 419 417 417 420 418
OECD total 4,154 4,230 4,174 4,314 4,296 4,174 4,190 4,255 4,321 4,314 4,399 4,500
Oil-on-water 825 879 909 924 932 909 954 914 952 924 864 916
Days of forward consumption in OECD
OECD onland commercial 57 58 57 58 58 57 58 58 59 59 62 63
Americas 53 55 55 57 58 55 55 57 57 60 62 63
Europe 68 68 66 67 66 68 65 64 67 66 69 68
Asia Pacific 47 48 46 49 49 44 53 52 52 46 51 56
OECD SPR 33 34 33 34 34 35 35 34 34 34 35 34
Americas 30 30 29 29 29 29 29 28 28 29 29 28
Europe 29 30 31 32 35 36 35 34 35 35 34 34
Asia Pacific 50 50 48 50 48 47 54 54 50 48 55 55
OECD total 90 92 90 92 92 91 93 93 93 93 97 98
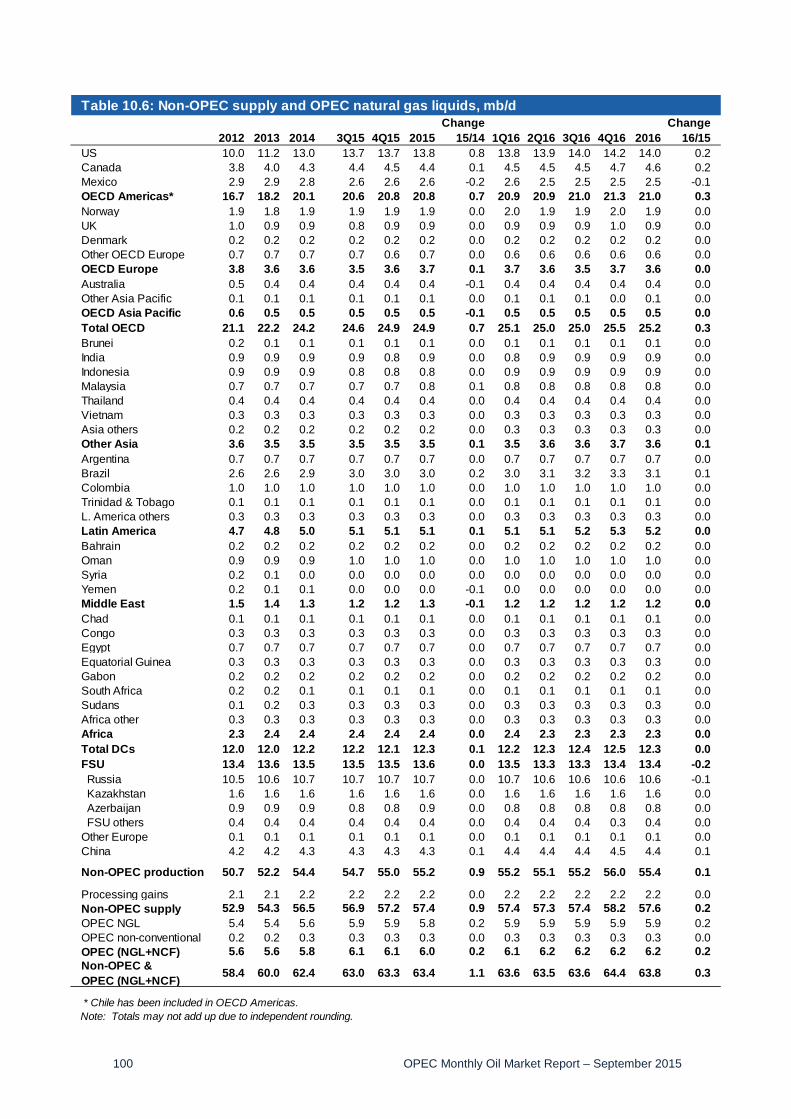
100 OPEC Monthly Oil Market Report – September 2015
Table 10.6: Non-OPEC supply and OPEC natural gas liquids, mb/dChange Change
2012 2013 2014 3Q15 4Q15 2015 15/14 1Q16 2Q16 3Q16 4Q16 2016 16/15US 10.0 11.2 13.0 13.7 13.7 13.8 0.8 13.8 13.9 14.0 14.2 14.0 0.2Canada 3.8 4.0 4.3 4.4 4.5 4.4 0.1 4.5 4.5 4.5 4.7 4.6 0.2Mexico 2.9 2.9 2.8 2.6 2.6 2.6 -0.2 2.6 2.5 2.5 2.5 2.5 -0.1OECD Americas* 16.7 18.2 20.1 20.6 20.8 20.8 0.7 20.9 20.9 21.0 21.3 21.0 0.3Norway 1.9 1.8 1.9 1.9 1.9 1.9 0.0 2.0 1.9 1.9 2.0 1.9 0.0UK 1.0 0.9 0.9 0.8 0.9 0.9 0.0 0.9 0.9 0.9 1.0 0.9 0.0Denmark 0.2 0.2 0.2 0.2 0.2 0.2 0.0 0.2 0.2 0.2 0.2 0.2 0.0Other OECD Europe 0.7 0.7 0.7 0.7 0.6 0.7 0.0 0.6 0.6 0.6 0.6 0.6 0.0OECD Europe 3.8 3.6 3.6 3.5 3.6 3.7 0.1 3.7 3.6 3.5 3.7 3.6 0.0Australia 0.5 0.4 0.4 0.4 0.4 0.4 -0.1 0.4 0.4 0.4 0.4 0.4 0.0Other Asia Pacific 0.1 0.1 0.1 0.1 0.1 0.1 0.0 0.1 0.1 0.1 0.0 0.1 0.0OECD Asia Pacific 0.6 0.5 0.5 0.5 0.5 0.5 -0.1 0.5 0.5 0.5 0.5 0.5 0.0Total OECD 21.1 22.2 24.2 24.6 24.9 24.9 0.7 25.1 25.0 25.0 25.5 25.2 0.3Brunei 0.2 0.1 0.1 0.1 0.1 0.1 0.0 0.1 0.1 0.1 0.1 0.1 0.0India 0.9 0.9 0.9 0.9 0.8 0.9 0.0 0.8 0.9 0.9 0.9 0.9 0.0Indonesia 0.9 0.9 0.9 0.8 0.8 0.8 0.0 0.9 0.9 0.9 0.9 0.9 0.0Malaysia 0.7 0.7 0.7 0.7 0.7 0.8 0.1 0.8 0.8 0.8 0.8 0.8 0.0Thailand 0.4 0.4 0.4 0.4 0.4 0.4 0.0 0.4 0.4 0.4 0.4 0.4 0.0Vietnam 0.3 0.3 0.3 0.3 0.3 0.3 0.0 0.3 0.3 0.3 0.3 0.3 0.0Asia others 0.2 0.2 0.2 0.2 0.2 0.2 0.0 0.3 0.3 0.3 0.3 0.3 0.0Other Asia 3.6 3.5 3.5 3.5 3.5 3.5 0.1 3.5 3.6 3.6 3.7 3.6 0.1Argentina 0.7 0.7 0.7 0.7 0.7 0.7 0.0 0.7 0.7 0.7 0.7 0.7 0.0Brazil 2.6 2.6 2.9 3.0 3.0 3.0 0.2 3.0 3.1 3.2 3.3 3.1 0.1Colombia 1.0 1.0 1.0 1.0 1.0 1.0 0.0 1.0 1.0 1.0 1.0 1.0 0.0Trinidad & Tobago 0.1 0.1 0.1 0.1 0.1 0.1 0.0 0.1 0.1 0.1 0.1 0.1 0.0L. America others 0.3 0.3 0.3 0.3 0.3 0.3 0.0 0.3 0.3 0.3 0.3 0.3 0.0Latin America 4.7 4.8 5.0 5.1 5.1 5.1 0.1 5.1 5.1 5.2 5.3 5.2 0.0Bahrain 0.2 0.2 0.2 0.2 0.2 0.2 0.0 0.2 0.2 0.2 0.2 0.2 0.0Oman 0.9 0.9 0.9 1.0 1.0 1.0 0.0 1.0 1.0 1.0 1.0 1.0 0.0Syria 0.2 0.1 0.0 0.0 0.0 0.0 0.0 0.0 0.0 0.0 0.0 0.0 0.0Yemen 0.2 0.1 0.1 0.0 0.0 0.0 -0.1 0.0 0.0 0.0 0.0 0.0 0.0Middle East 1.5 1.4 1.3 1.2 1.2 1.3 -0.1 1.2 1.2 1.2 1.2 1.2 0.0Chad 0.1 0.1 0.1 0.1 0.1 0.1 0.0 0.1 0.1 0.1 0.1 0.1 0.0Congo 0.3 0.3 0.3 0.3 0.3 0.3 0.0 0.3 0.3 0.3 0.3 0.3 0.0Egypt 0.7 0.7 0.7 0.7 0.7 0.7 0.0 0.7 0.7 0.7 0.7 0.7 0.0Equatorial Guinea 0.3 0.3 0.3 0.3 0.3 0.3 0.0 0.3 0.3 0.3 0.3 0.3 0.0Gabon 0.2 0.2 0.2 0.2 0.2 0.2 0.0 0.2 0.2 0.2 0.2 0.2 0.0South Africa 0.2 0.2 0.1 0.1 0.1 0.1 0.0 0.1 0.1 0.1 0.1 0.1 0.0Sudans 0.1 0.2 0.3 0.3 0.3 0.3 0.0 0.3 0.3 0.3 0.3 0.3 0.0Africa other 0.3 0.3 0.3 0.3 0.3 0.3 0.0 0.3 0.3 0.3 0.3 0.3 0.0Africa 2.3 2.4 2.4 2.4 2.4 2.4 0.0 2.4 2.3 2.3 2.3 2.3 0.0Total DCs 12.0 12.0 12.2 12.2 12.1 12.3 0.1 12.2 12.3 12.4 12.5 12.3 0.0FSU 13.4 13.6 13.5 13.5 13.5 13.6 0.0 13.5 13.3 13.3 13.4 13.4 -0.2 Russia 10.5 10.6 10.7 10.7 10.7 10.7 0.0 10.7 10.6 10.6 10.6 10.6 -0.1 Kazakhstan 1.6 1.6 1.6 1.6 1.6 1.6 0.0 1.6 1.6 1.6 1.6 1.6 0.0 Azerbaijan 0.9 0.9 0.9 0.8 0.8 0.9 0.0 0.8 0.8 0.8 0.8 0.8 0.0 FSU others 0.4 0.4 0.4 0.4 0.4 0.4 0.0 0.4 0.4 0.4 0.3 0.4 0.0Other Europe 0.1 0.1 0.1 0.1 0.1 0.1 0.0 0.1 0.1 0.1 0.1 0.1 0.0China 4.2 4.2 4.3 4.3 4.3 4.3 0.1 4.4 4.4 4.4 4.5 4.4 0.1
Non-OPEC production 50.7 52.2 54.4 54.7 55.0 55.2 0.9 55.2 55.1 55.2 56.0 55.4 0.1
Processing gains 2.1 2.1 2.2 2.2 2.2 2.2 0.0 2.2 2.2 2.2 2.2 2.2 0.0Non-OPEC supply 52.9 54.3 56.5 56.9 57.2 57.4 0.9 57.4 57.3 57.4 58.2 57.6 0.2OPEC NGL 5.4 5.4 5.6 5.9 5.9 5.8 0.2 5.9 5.9 5.9 5.9 5.9 0.2OPEC non-conventional 0.2 0.2 0.3 0.3 0.3 0.3 0.0 0.3 0.3 0.3 0.3 0.3 0.0OPEC (NGL+NCF) 5.6 5.6 5.8 6.1 6.1 6.0 0.2 6.1 6.2 6.2 6.2 6.2 0.2Non-OPEC & OPEC (NGL+NCF) 58.4 60.0 62.4 63.0 63.3 63.4 1.1 63.6 63.5 63.6 64.4 63.8 0.3
* Chile has been included in OECD Americas.Note: Totals may not add up due to independent rounding.

OPEC Monthly Oil Market Report – September 2015 101
Table 10.7: World Rig CountChange Change
2011 2012 2013 2014 14/13 4Q14 2014 1Q15 2Q15 Jul 15 Aug 15 Aug/JulUS 1,880 1,919 1,761 1,862 101 1,912 1,862 1,380 909 866 883 17Canada 423 364 354 380 26 406 380 309 99 183 206 23Mexico 94 106 106 86 -20 78 86 67 59 45 41 -4Americas 2,398 2,390 2,221 2,327 106 2,396 2,327 1,755 1,067 1,094 1,130 36Norway 17 17 20 17 -3 16 17 17 18 20 16 -4UK 16 18 17 16 -1 17 16 18 14 12 12 0Europe 118 119 135 145 10 148 145 132 116 108 109 1Asia Pacific 17 24 27 26 -1 25 26 21 17 16 15 -1Total OECD 2,532 2,533 2,383 2,499 116 2,569 2,499 1,908 1,200 1,218 1,254 36Other Asia 239 217 219 228 9 229 228 214 203 196 205 9Latin America 195 180 166 172 6 174 172 161 143 144 150 6Middle East 129 136 102 108 6 105 108 103 98 102 99 -3Africa 2 7 16 28 12 29 28 22 12 8 7 -1Total DCs 565 539 503 536 33 537 536 499 456 450 461 11Non-OPEC rig count 3,097 3,071 2,886 3,034 149 3,106 3,034 2,408 1,656 1,668 1,715 47
Algeria 31 36 47 48 1 48 48 52 52 50 52 2Angola 7 9 11 15 4 14 15 15 12 8 8 0Ecuador 13 20 26 24 -2 21 24 17 15 12 14 2Iran** 54 54 54 54 0 54 54 54 54 54 54 0Iraq** 36 58 83 79 -4 59 79 57 53 44 48 4Kuwait** 32 31 32 38 6 43 38 51 49 44 46 2Libya** 3 9 15 10 -4 8 10 6 3 1 1 0Nigeria 36 36 37 34 -3 36 34 35 29 27 28 1Qatar 8 8 9 10 2 10 10 9 8 7 9 2Saudi Arabia 100 112 114 134 20 143 134 154 155 154 151 -3UAE 21 24 28 34 6 38 34 38 39 40 40 0Venezuela 122 117 121 116 -5 106 116 108 105 112 114 2OPEC rig count 461 513 576 596 20 579 596 595 575 553 565 12
Worldwide rig count* 3,559 3,584 3,462 3,631 169 3,685 3,631 3,002 2,231 2,221 2,280 59of which: Oil 2,195 2,594 2,611 2,795 184 2,820 2,795 2,214 1,616 1,592 1,635 43 Gas 1,257 886 746 743 -3 776 743 690 516 532 542 10 Others 103 106 109 95 -14 91 95 100 98 97 103 6
Note: Totals may not add up due to independent rounding. * Excludes China and FSU.na: Not available. ** Estimated figure when Baker Hughes Incorporated did Sources: Baker Hughes Incorporated & Secretariat's estimates. not reported the data.

102 OPEC Monthly Oil Market Report – September 2015
Contributors to the OPEC Monthly Oil Market Report Editor-in-Chief Omar S. Abdul-Hamid, Director, Research Division email: [email protected] Editor Hojatollah Ghanimi Fard, Head, Petroleum Studies Department email: [email protected] Analysts Crude Oil Price Movements Eissa Alzerma
email: [email protected]
Commodity Markets Hector Hurtado email: [email protected]
World Economy Afshin Javan email: [email protected] Imad Al-Khayyat email: [email protected] Joerg Spitzy email: [email protected]
World Oil Demand Hassan Balfakeih email: [email protected]
World Oil Supply Mohammad Ali Danesh email: [email protected]
Product Markets and Refinery Operations Elio Rodriguez email: [email protected]
Tanker Market and Oil Trade Anisah Almadhayyan email: [email protected]
Stock Movements Aziz Yahyai email: [email protected]
Technical and editorial team Aziz Yahyai email: [email protected] Douglas Linton email: [email protected]
Data services Adedapo Odulaja, Head, Data Services Department ([email protected]), Hossein Hassani, Statistical Systems Coordinator ([email protected]), Pantelis Christodoulides (World Oil Demand and Stock Movements), Klaus Stoeger (World Oil Supply), Harvir Kalirai (World Economy), Mouhamad Moudassir (Product Markets and Refinery Operations), Mohammad Sattar (Crude Oil Price Movements), Anna Gredinger (Tanker Market and Oil Trade) Editing, production, design and circulation Alvino-Mario Fantini, Maureen MacNeill, Scott Laury, Viveca Hameder, Hataichanok Leimlehner, Evelyn Oduro-Kwateng, Andrea Birnbach
OPEC Monthly Oil Market Report – September 2015 103
Disclaimer
The data, analysis and any other information contained in the Monthly Oil Market Report (the “MOMR”) is for informational purposes only and is not intended as a substitute for advice from your business, finance, investment consultant or other professional. The views expressed in the MOMR are those of the OPEC Secretariat and do not necessarily reflect the views of its Governing Bodies and/or individual OPEC Member Countries.
Whilst reasonable efforts have been made to ensure the accuracy of the MOMR’s content, the OPEC Secretariat makes no warranties or representations as to its accuracy, currency reference or comprehensiveness, and assumes no liability or responsibility for any inaccuracy, error or omission, or for any loss or damage arising in connection with or attributable to any action or decision taken as a result of using or relying on the information in the MOMR.
The MOMR may contain references to material(s) from third parties whose copyright must be acknowledged by obtaining necessary authorization from the copyright owner(s). The OPEC Secretariat shall not be liable or responsible for any unauthorized use of third party material(s). All rights of the Publication shall be reserved to the OPEC Secretariat, including every exclusive economic right, in full or per excerpts, with special reference but without limitation, to the right to publish it by press and/or by any communications medium whatsoever, including Internet; translate, include in a data base, make changes, transform and process for any kind of use, including radio, television or cinema adaptations, as well as sound-video recording, audio-visual screenplays and electronic processing of any kind and nature whatsoever.
Full reproduction, copying or transmission of the MOMR is not permitted in any form or by any means by third parties without the OPEC Secretariat’s written permission, however the information contained therein may be used and/or reproduced for educational and other non-commercial purposes without the OPEC Secretariat’s prior written permission, provided that OPEC is fully acknowledged as the copyright holder.
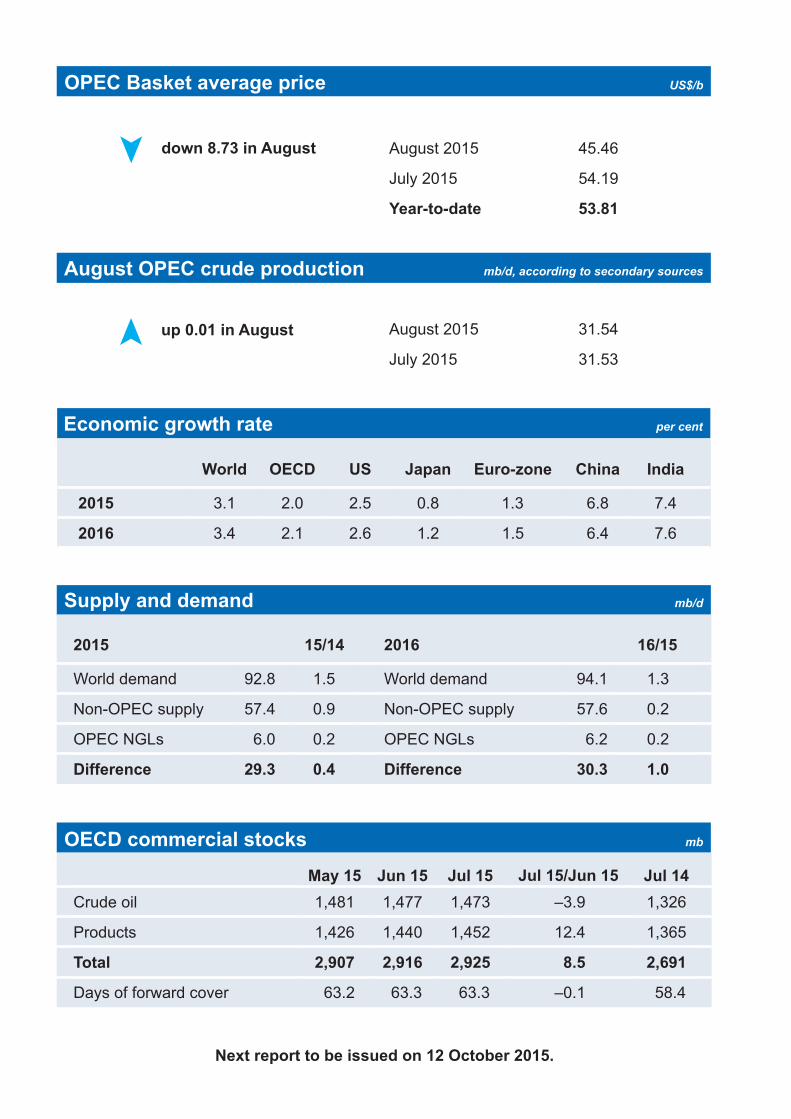
Next report to be issued on 12 October 2015.
OPEC Basket average price US$/b
August OPEC crude production mb/d, according to secondary sources
Economic growth rate per cent
down 8.73 in August
up 0.01 in August
August 2015 45.46
July 2015 54.19
Year-to-date 53.81
August 2015 31.54
July 2015 31.53
World OECD US Japan Euro-zone China India
2015 3.1 2.0 2.5 0.8 1.3 6.8 7.4
2016 3.4 2.1 2.6 1.2 1.5 6.4 7.6
Supply and demand mb/d
OECD commercial stocks mb
2015 15/14 2016 16/15
World demand 92.8 1.5 World demand 94.1 1.3
Non-OPEC supply 57.4 0.9 Non-OPEC supply 57.6 0.2
OPEC NGLs 6.0 0.2 OPEC NGLs 6.2 0.2
Difference 29.3 0.4 Difference 30.3 1.0
May 15 Jun 15 Jul 15 Jul 15/Jun 15 Jul 14Crude oil 1,481 1,477 1,473 –3.9 1,326
Products 1,426 1,440 1,452 12.4 1,365
Total 2,907 2,916 2,925 8.5 2,691
Days of forward cover 63.2 63.3 63.3 –0.1 58.4