
Monthly Management Report August 2011/12 - … Management Report August 2011/12 1. Contents ... The...
78
Monthly Management Report August 2011/12 1
Transcript of Monthly Management Report August 2011/12 - … Management Report August 2011/12 1. Contents ... The...

Monthly Management Report August
2011/12
1

Contents
On track to achieve our outcomes
Slightly behind and requires improvement
Not on track but taking corrective action
Improving
No change
Declining
Missing actual data
Missing target
Missing target and actual data
Key
Foreword 03 Summary Dashboard 04 Overall Summary: Performance Areas for Management Attention Areas of Good Performance
05 06 08
Overall Summary: Projects & Programmes 09 Overall Summary: Risk 13 Overall Summary: Finance 16 1. Community Leadership and Empowerment 18 2. Young People's Achievement and Involvement 19 3. Clean Green and Liveable 25 4. Safety, Security and Visible Presence 34 5. Strengthening the Local Economy 36 6. Decent Homes for All 40 7. Protection of Children 47 8. Caring for Adults and Older People 53 9. Active, Healthy Citizens 58 10. Inspiring Efficiency, Effectiveness and Equity Appendix A: Methodology - performance Appendix B: Methodology - projects, risk, finance
67 77 78
2

ForewordThe purpose of the Management Report is to place on record each month, in a consistent format, our performance against priorities. Each month we attempt to give a full account of what is being done, what has been achieved and which areas require additional management attention to secure future achievements. The report gives some coverage to the effectiveness of our partnership working. Reporting on performance is always double edged. We have high ambitions and targets which are set to stretch management and staff effort. So, there are areas where the need for greater management attention is highlighted. The report focuses on the Council's performance in line with our corporate priorities, drawing data from performance indicators (PIs), project monitoring information, risk register assessments and financial reports. A dashboard summary on Page 4, presents an overall picture on one page using a Red, Amber, Green rating. The overall dashboard rating for this month shows there are 13 Green ratings, 11 Amber ratings and 10 Red ratings. This, August, management report reports on July performance data. Over the Summer the annual review of the Management Report was completed. This report is the first containing the revised basket of performance indicators, and so overall performance comparisons between this report and the last report in June 2011 should be approached with caution. Performance: There are 22 performance indicators (51 per cent) reported as Green or Amber against target, and twelve performance indicators (28 per cent) which are showing an upward direction of travel. There are 21 performance indicators (49 per cent) reported as Red against target, and 29 indicators (67 per cent) which have a Red direction of travel. As this is the start of a new reporting period, many targets have yet to be set, and so in July there are 18 indicators that have missing data. Projects: This month the only change to the projects summary dashboard is that Priority 8, Caring for Adults and Older People no longer has any projects following the completion of the Adult Social Care and Health personalisation project. There are four red projects this month - Kender Phase 3, and the addition of Building Schools for the Future, Tidemill School and the Deptford Lounge. Two new projects have been added - The Early Intervention Programme in Priority 2, Young People's Achievement and Involvement and Asset Rationalisation in Priority 10, Inspiring Efficiency, Effectiveness and Equity. Risks: The dashboard for risk remains unchanged this month. There are six red corporate risks this month - Failure of central ICT infrastructure; Non compliance with Health and Safety legislation; Litigation risks; Avoidable death or serious injury to client or employee; Employee relations and Inadequate/inappropriate preparedness for the Olympic and Paralympic Games 2012. These lead to red dashboard ratings for risk for Priority 2, Young People's Achievement and Involvement, Priority 7, Protection of Children, Priority 8, Caring for Adults and Older People and Priority 10, Inspiring Efficiency, Effectiveness and Equity. Finance: There have been two changes to the Finance dashboard this month. Priority 2, Young People's Achievement and Involvement has changed from Green to Amber and Priority 5, Strengthening the Local Economy has changed from Red to Green. The latest revenue monitoring is forecasting a General Fund year-end overspend of £1.657m against a net budget of £278.793m. Five of the ten priorities are projecting an underspend this month. There are red finance ratings for two priorities where there are overspends: Priority 3, Clean, Green and Liveable, and Priority 6, Decent Homes for All. Barry Quirk, Chief Executive 13 September 2011
3

01. Community Leadership & Empowerment
Performance
02. Young People's Achievement & Involvement
Performance
03. Clean, Green and Liveable
Performance
04. Safety, Security & Visible Presence
Performance
05. Strengthening the Local Economy
Performance
Projectsn/a
Projects Projects Projectsn/a
Projects
Risk Risk Risk Risk Risk
Finance Finance Finance Finance Finance
06. Decent Homes for All
Performance
07. Protection of Children
Performance
08. Caring for Adults and Older People
Performance
09. Active, Healthy Citizens
Performance
10. Inspiring Efficiency, Effectiveness, and Equity
Performance
Projects Projectsn/a
Projectsn/a
Projects Projects
Risk Risk Risk Risk Risk
Finance Finance Finance Finance Finance
On track to achieve our outcomes Slightly behind and requires improvement Not on Track but taking corrective action
Dashboard Summary
4
Overall Performance
Current Period
Overall Performance
Total
21 8 14 7 6 5 61
Same period last year
Overall Performance
Total
22 8 18 7 3 3 61
10/11 outturn
Overall Performance
Total
21 12 16 6 3 3 61
Direction of Travel
Current Period vs 10/11
Direction of Travel
Total 29 2 12 18 61
Previous Period vs 10/11
Direction of Travel
Total 28 5 10 18 61
Same period last year vs 09/10
Direction of Travel
Total 26 1 19 15 61
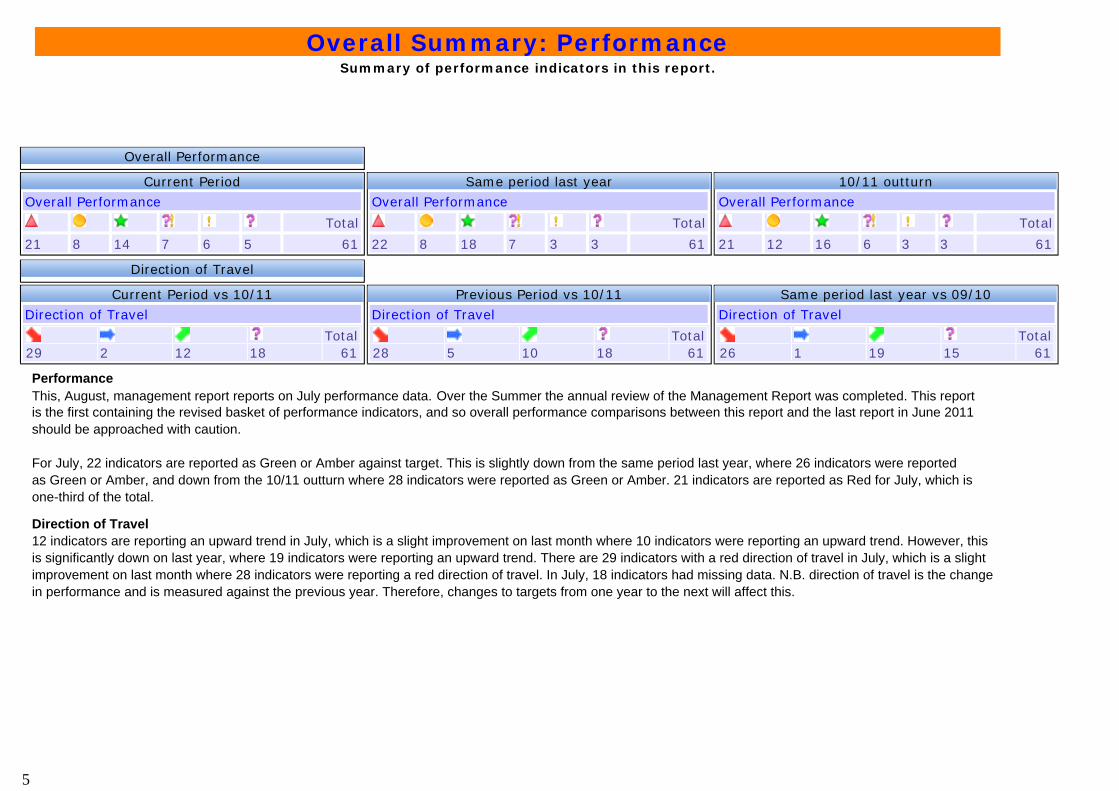
Overall Summary: Performance
Summary of performance indicators in this report.
Direction of Travel 12 indicators are reporting an upward trend in July, which is a slight improvement on last month where 10 indicators were reporting an upward trend. However, this is significantly down on last year, where 19 indicators were reporting an upward trend. There are 29 indicators with a red direction of travel in July, which is a slight improvement on last month where 28 indicators were reporting a red direction of travel. In July, 18 indicators had missing data. N.B. direction of travel is the change in performance and is measured against the previous year. Therefore, changes to targets from one year to the next will affect this.
Performance This, August, management report reports on July performance data. Over the Summer the annual review of the Management Report was completed. This report is the first containing the revised basket of performance indicators, and so overall performance comparisons between this report and the last report in June 2011 should be approached with caution. For July, 22 indicators are reported as Green or Amber against target. This is slightly down from the same period last year, where 26 indicators were reported as Green or Amber, and down from the 10/11 outturn where 28 indicators were reported as Green or Amber. 21 indicators are reported as Red for July, which is one-third of the total.
5

Areas requiring management attention this month
Performance Indicators - Monthly indicators
Against Target Jul 11
DoT Jul 11 v Mar 11
DoT Jul 11 v Jun 11
Consecutive periods Red (last 12 periods)
Priority No.
Page No.
NI103a Special Educational Needs - statements issued within 26 weeks excluding exceptions 2 2 p20 LPI720 Percentage of noise nuisance complaints receiving a visit within 45 minutes, if
necessary3 3 p26
NI157b % Minor planning apps within 8 weeks 4 5 p37 LPI069 Number of cases where homelessness was prevented through the use of rent incentive
scheme3 6 p41
NI156 Number of households living in Temporary Accommodation 5 6 p42 NI060 Percentage core assessments for children's social care carried out < 35 working days - 7 p48 NI062 Stability of placements of looked after children: number of moves - 7 p49 NI068 Percentage of referrals to children's social care going on to initial assessment 12 7 p50 CF/C19 Health of LAC 4 9 p59 LPI202 Library visits per 1000 pop 8 9 p60 NI052 Take up of school lunches 4 9 p61 BV008 Invoices paid within 30 days 7 10 p69 LPI519 Number of FOI requests completed 3 10 p70
Performance Indicators - Monthly Indicators
Against Target Jun 11
DoT Jun 11 v Mar 11
DoT Jun 11 v May 11
Consecutive periods Red (last 12 periods)
Priority No.
Page No.
NI191 Residual household waste per household (KG) - 3 p27 NI192 Percentage of household waste sent for reuse, recycling and composting 2 3 p28 NI193 Percentage of municipal waste land filled 3 3 p30
Areas for Management Attention
Together, we will make Lewisham the best place in London to live, work and learn
6

Areas requiring management attention this month
Performance Indicators - Quarterly indicators
Against Target Jun 11
DoT Jun 11 v Mar 11
DoT Jun 11 v Mar 11
Consecutive periods Red (last 12 periods)
Priority No.
Page No.
AO/D40 % Adult Social Care clients receiving a review 3 8 p55 LPI324 MMR1 Immunisation rates 2nd birthday - 9 p62
Areas for Management Attention
Together, we will make Lewisham the best place in London to live, work and learn
7

Areas of Good Performance
Performance Indicators - Monthly indicatorsAgainst Target Jul 11
DoT Jul 11 v Mar 11
DoT Jul 11 v Jun 11
Priority No.
LPI079 Percentage of fly tip removal jobs completed within 1 day 3 LPI080 Percentage of recycling bins collected on time 3 LPI705 Percentage urgent repairs completed within timescales 6 NI064 Child protection plans lasting 2 years or more 7 NI066 Looked after children cases which were reviewed within required timescales 7 NI067 Percentage of child protection cases which were reviewed within required timescales 7 NI131 Delayed transfers of care 8 BV012 Days / shifts lost to sickness (Including Schools) 10 LPI031 NNDR collected 10
Performance Indicators - Monthly IndicatorsAgainst Target Jun 11
DoT Jun 11 v Mar 10
DoT Jun 11 v May 11
Priority No.
Areas of Good Performance
Together, we will make Lewisham the best place in London to live, work and learn
8

Overall Summary: Projects and Programmes Together, we will make Lewisham the best place in London to live, work and learn
Projects Forward PlanProjects are reviewed monthly and portfolio Directorate Forward Plan Reports set out the progress made to date.
Major Projects Forward Plan - Events September 2011
Senior Responsible Officer Comment INVESTMENT PROJECTS
FOREST HILL POOL Community Services Topping out
DEPTFORD PROGRAMME, DEPTFORD LOUNGE , NEW TIDEMILL SCHOOL AND HOUSING Regeneration New Tidemill Primary School and Deptford Lounge open
WAVELENGTHS - ADDITIONAL WORKS Community Services Works start on site
LOAMPIT VALE DEVELOPMENT AND POOL Regeneration Block B (38 affordable rented units) handovers at 5 units per week commences
LADYWELL ELECTRICAL SUB-STATION Community Services Consultation period
OTHER
ENERGY CONTRACTS Resources New prices on Windpower contract come into effect
LEISURE REVIEW Community Services New contract starts
9

Corporate ProgrammesCurrent Status
PMSPROG Building Schools for the Future PMSPROG The Future of Deptford Town Centre Programme PMSPROG Information Management & Technology programme PMSPROG Primary Places Programme
Overall Summary: Projects and Programmes
Together, we will make Lewisham the best place in London to live, work and learn
Corporate Programmes
The status of the Council's Corporate Programmes in August are set out below. The Council's Corporate Programmes are made up of a number of individual projects.
10

Overall Summary: Projects and Programmes
Together, we will make Lewisham the best place in London to live, work and learnMajor Projects & ProgrammesProjects are reviewed monthly by Directorate Project Review Groups and quarterly by the Corporate Project Board. A summary of all the Programmes and Projects, with a value of£500k and over that have a red RAG rating, are detailed in the table at the bottom of this page.
Project Performance - August 2011
10/11 % June 11 % August 11 % 31 70 23 67 22 65 12 27 11 31 8 23 1 2 1 3 4 12
Total 44 100 35 100 34 100
Red Projects - August 2011
Red Projects Project Summary Page
No. Corporate Priority No.
Building Schools for the Future
Overall the six projects in construction are progressing satisfactorily - some (eg Deptford Green) very well and some (Prendergast Hilly Fields) not very well. The rationale for moving from Amber to Red for this report is associated with the criticality of returning the phased works at Prendergast Hilly Fields and Addey and Stanhope - where possession of the 'live' areas of the site has been given over to the contractors - back to the school in a clean, safe and functional condition.
24 2
Kender New-Build Phase 3 South (NDC Centre)
The New Cross Gate Board considered the current position and have noted the withdrawal of the developer due to viability concerns. A short soft market testing exercise has been undertaken that indicates why the existing scheme is undeliverable. Officers are discussing with the Board how the development of the site can proceed in a way that meets expectations and is commercially deliverable.
45 6
Deptford Town Centre Programme
The contractor is running significantly behind programme and the site is unlikely to be handed over before the end of September. This issue affects both the Deptford Lounge project and the Tidemill School project.
24 & 66
2 & 9
11

Overall Summary: Projects and Programmes
Together, we will make Lewisham the best place in London to live, work and learn
Major Projects & Programmes
MOVEMENTS IN STATUS SINCE THE JUNE MANAGEMENT REPORT UPDATE Upgraded from Green to Red:
Tidemill School - Deptford Town Centre Programme "Deptford Lounge" - Deptford Town Centre Programme
Upgraded from Amber to Red:
Building Schools for the Future
Removals:
Adult Social Care & Health Personalisation Payroll & HR Information System - This project has been progressed to the stage at which it is being handed over by the Council's Programme Management function for final implementation. However, as it is no longer overseen by the Programme Management function, it is no longer included in this register of live projects.
Additions:
Early Intervention Programme Asset Rationalisation
12

Overall Performance: Risk
Together, we will make Lewisham the best place in London to live, work and learn
Corporate Risk Performance The Risk Management Strategy sets out the Council’s approach to the management of risk. It reflects current priorities and good practice and seeks to strengthen the links with other business processes, such as service planning, performance management and business continuity to ensure risk management is at the heart of the Council’s corporate governance arrangements and actively informs and supports management’s decision making.
Risk is reported to the Internal Control Board quarterly with monthly updates where there are material changes
Current Status
Community Services
% Customer Services
% CYP % Resources % Regeneration %
7 37 7 41 8 38 3 20 10 59
11 58 7 41 11 52 8 53 7 41 1 5 3 18 2 10 4 27 0 0
Total 19 100 17 100 21 100 15 100 17 100
Directorate Risk Performance August 2011
Status June 11 % August 11 % 3 20 3 19
5 33 7 44 7 47 6 37
Total 15 100 16 100
Risk registers are produced and monitored at service, directorate and corporate levels. The service and directorate risk registers are scrutinised at Directorate Management Teams. Directorate risk registers and the corporate risk register are scrutinised by the Executive Management Team, the Risk Management Working Party (RMWP) and the independently chaired Internal Control Board (ICB). In addition to the risk registers, RMWP and ICB continue to receive regular updates on key risks, emerging risks and matters relating to internal control and compliance on a regular basis. Thus a dedicated risk review body operates at the most senior level within the organisation.
13
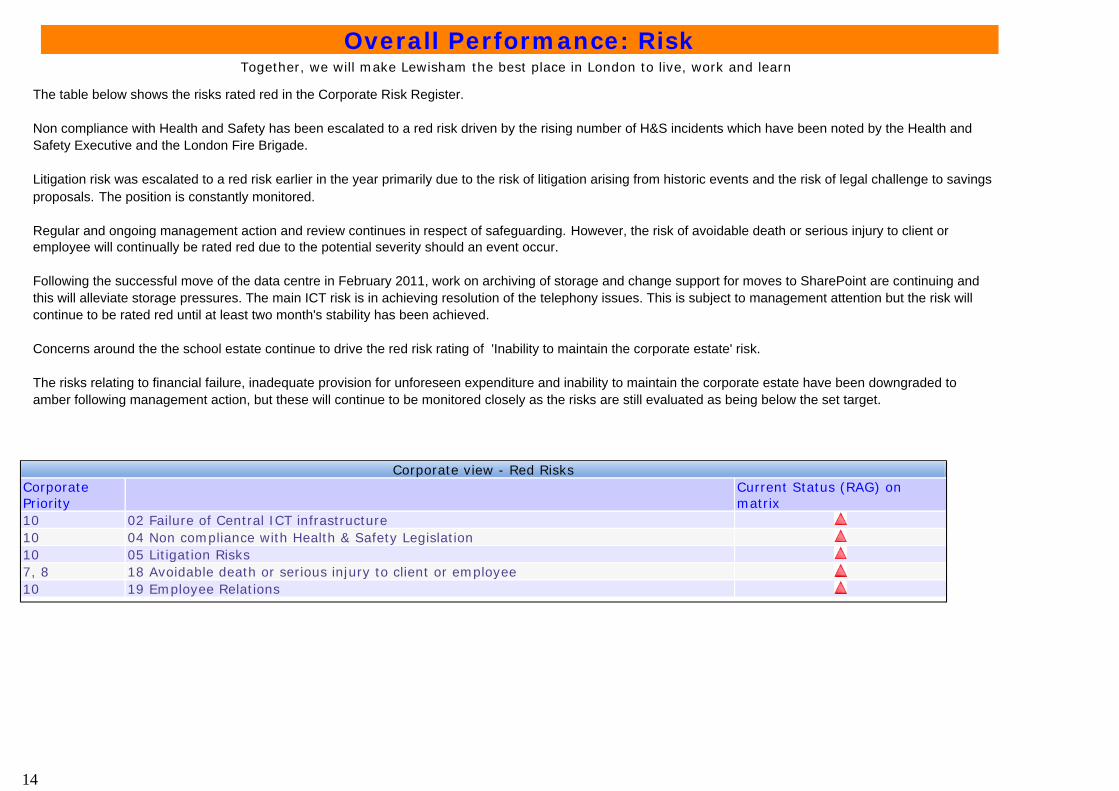
Corporate view - Red Risks Corporate Priority
Current Status (RAG) on matrix
10 02 Failure of Central ICT infrastructure10 04 Non compliance with Health & Safety Legislation10 05 Litigation Risks7, 8 18 Avoidable death or serious injury to client or employee10 19 Employee Relations
Overall Performance: Risk
Together, we will make Lewisham the best place in London to live, work and learn The table below shows the risks rated red in the Corporate Risk Register. Non compliance with Health and Safety has been escalated to a red risk driven by the rising number of H&S incidents which have been noted by the Health and Safety Executive and the London Fire Brigade. Litigation risk was escalated to a red risk earlier in the year primarily due to the risk of litigation arising from historic events and the risk of legal challenge to savings proposals. The position is constantly monitored. Regular and ongoing management action and review continues in respect of safeguarding. However, the risk of avoidable death or serious injury to client or employee will continually be rated red due to the potential severity should an event occur. Following the successful move of the data centre in February 2011, work on archiving of storage and change support for moves to SharePoint are continuing and this will alleviate storage pressures. The main ICT risk is in achieving resolution of the telephony issues. This is subject to management attention but the risk will continue to be rated red until at least two month's stability has been achieved. Concerns around the the school estate continue to drive the red risk rating of 'Inability to maintain the corporate estate' risk. The risks relating to financial failure, inadequate provision for unforeseen expenditure and inability to maintain the corporate estate have been downgraded to amber following management action, but these will continue to be monitored closely as the risks are still evaluated as being below the set target.
14
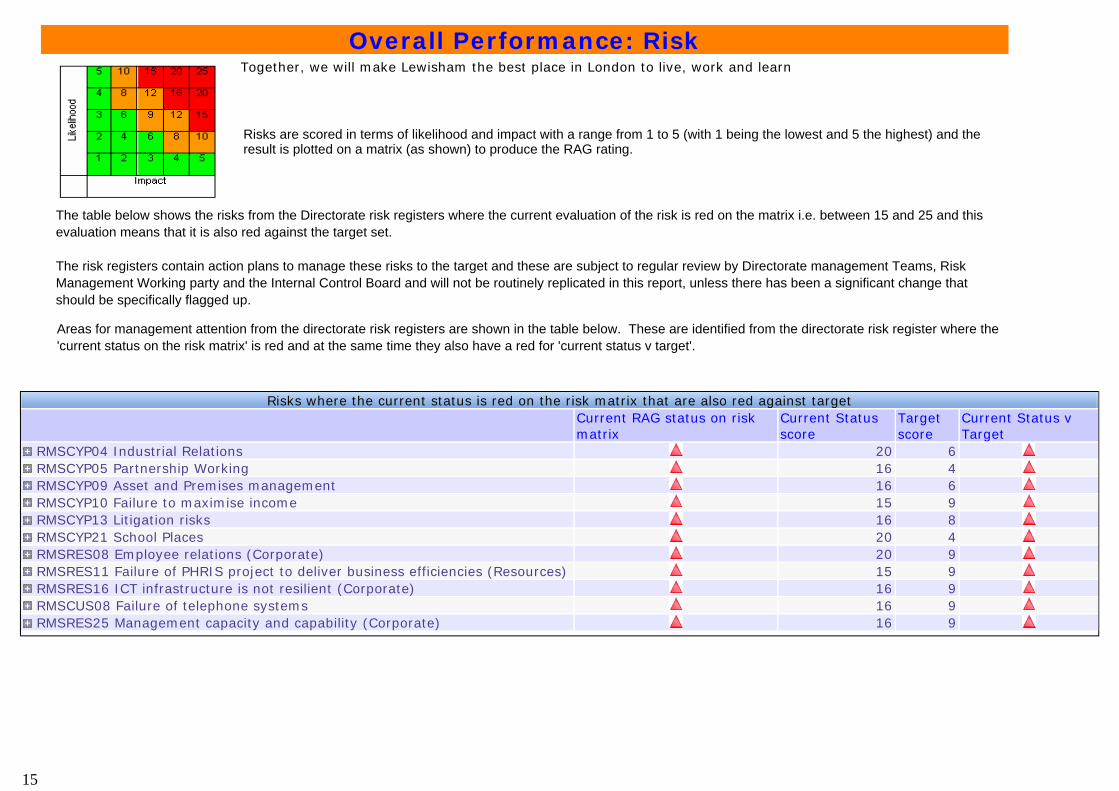
Risks where the current status is red on the risk matrix that are also red against targetCurrent RAG status on risk matrix
Current Status score
Target score
Current Status v Target
RMSCYP04 Industrial Relations 20 6 RMSCYP05 Partnership Working 16 4 RMSCYP09 Asset and Premises management 16 6 RMSCYP10 Failure to maximise income 15 9 RMSCYP13 Litigation risks 16 8 RMSCYP21 School Places 20 4 RMSRES08 Employee relations (Corporate) 20 9 RMSRES11 Failure of PHRIS project to deliver business efficiencies (Resources) 15 9 RMSRES16 ICT infrastructure is not resilient (Corporate) 16 9 RMSCUS08 Failure of telephone systems 16 9 RMSRES25 Management capacity and capability (Corporate) 16 9
Overall Performance: Risk
Together, we will make Lewisham the best place in London to live, work and learn
Risks are scored in terms of likelihood and impact with a range from 1 to 5 (with 1 being the lowest and 5 the highest) and the result is plotted on a matrix (as shown) to produce the RAG rating.
The table below shows the risks from the Directorate risk registers where the current evaluation of the risk is red on the matrix i.e. between 15 and 25 and this evaluation means that it is also red against the target set. The risk registers contain action plans to manage these risks to the target and these are subject to regular review by Directorate management Teams, Risk Management Working party and the Internal Control Board and will not be routinely replicated in this report, unless there has been a significant change that should be specifically flagged up.
Areas for management attention from the directorate risk registers are shown in the table below. These are identified from the directorate risk register where the 'current status on the risk matrix' is red and at the same time they also have a red for 'current status v target'.
15

Finance by Priorities (£000s)
2011/12 Budget Latest projected year end variance as at Jul 11
% variance
01. NI Community Leadership and Empowerment 8,087 -138.00 -1.71 02. NI Young People's Achievement and Involvement 10,064 211.00 2.10 03. NI Clean, Green and Liveable 20,962 1,062.00 5.07 04. NI Safety, Security and Visible Presence 21,192 -145.00 -0.68 05. NI Strengthening the Local Economy 2,204 -22.00 -1.00 06. NI Decent Homes for All 3,361 345.00 10.26 07. NI Protection of Children 39,584 250.00 0.63 08. NI Caring for Adults and Older People 82,940 316.00 0.38 09. NI Active, Healthy Ctizens 9,150 -11.00 -0.12 10. NI Inspiring Efficiency, Effectiveness, and Equity 81,249 -211.00 -0.26 CEX NI Corporate Priorities 278,793 1,657.00 0.59
Overall Performance: Finance
Together, we will make Lewisham the best place in London to live, work and learn
Performance
The latest revenue monitoring is forecasting a General Fund year-end overspend of £1.657m against a net revenue budget of £278,793m. The final outturn on the HRA is a surplus of £0.1m.
June 11 % August 11 %
5 50 5 50 2 20 3 30 3 30 2 20
Total 10 100 10 100
16

Overall Performance: Finance
Together, we will make Lewisham the best place in London to live, work and learn
The final revenue outturn is a General Fund year-end overspend of £1.657m against a net revenue budget of £278,793m. The final outturn on the HRA is a surplus of £0.1m.
17
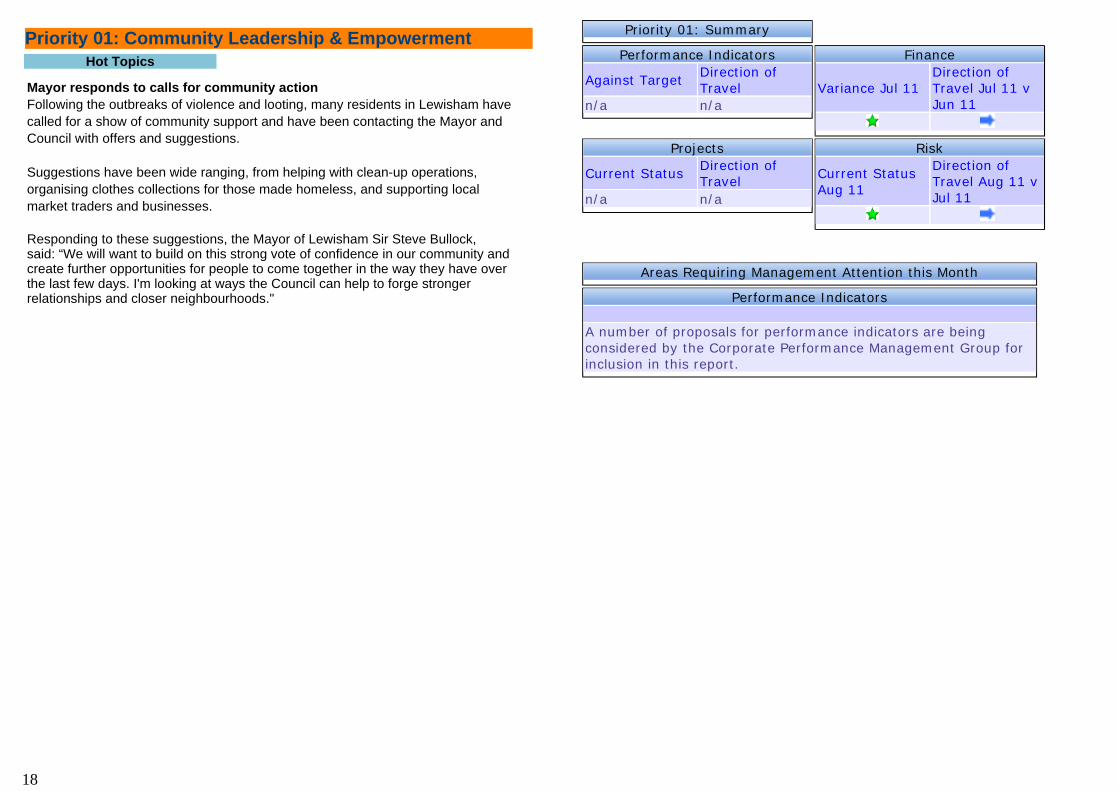
Priority 01: Summary
Performance Indicators
Against Target Direction of Travel
n/a n/a
Finance
Variance Jul 11Direction of Travel Jul 11 v Jun 11
Projects
Current Status Direction of Travel
n/a n/a
Risk
Current Status Aug 11
Direction of Travel Aug 11 v Jul 11
Areas Requiring Management Attention this Month
Performance Indicators
A number of proposals for performance indicators are being considered by the Corporate Performance Management Group for inclusion in this report.
Hot Topics
Priority 01: Community Leadership & Empowerment
Mayor responds to calls for community action Following the outbreaks of violence and looting, many residents in Lewisham have called for a show of community support and have been contacting the Mayor and Council with offers and suggestions. Suggestions have been wide ranging, from helping with clean-up operations, organising clothes collections for those made homeless, and supporting local market traders and businesses. Responding to these suggestions, the Mayor of Lewisham Sir Steve Bullock, said: “We will want to build on this strong vote of confidence in our community and create further opportunities for people to come together in the way they have over the last few days. I'm looking at ways the Council can help to forge stronger relationships and closer neighbourhoods."
18

Priority 02: Summary
Performance Indicators
Against Target Jul 11
Direction of Travel Jul 11 v Jun 11
Finance
Variance Jul 11Direction of Travel Jul 11 v Jun 11
Projects
Current Status Aug 11
Direction of Travel Aug 11 v Jul 11
Risk
Current Status Aug 11
Direction of Travel Aug 11 v Jul 11
Areas Requiring Management Attention this Month
Performance Indicators - Monthly
Against Target
Direction of Travel Jul 11 v Mar 11
Direction of Travel Jul 11 v Jun 11
NI103a Special Educational Needs - statements issued within 26 weeks excluding exceptions
Performance Indicators - Half termly
Against Target
Direction of Travel Jun 11 v Mar 11
Direction of Travel Jun 11 v Mar 11
Red ProjectsDirec... Current Status
PMSCYP Building Schools for the Future CYP PMSCYP Tidemill School Deptf. TC Prog. CYP
Hot Topics
Priority 02: Young People's Achievement and involvement
Lewisham teenagers outstrip others and make the A-level grade Hundreds of Lewisham teenagers have scored an excellent set of A-level results, which sees the borough beating the national average for a record ninth consecutive year. In Lewisham, more than 98 per cent of A-levels were passed compared to the national average of 97.8 per cent. Record year for Lewisham's GCSE results Teenagers across Lewisham are celebrating top GCSE results, with most schools reporting their best ever performance. Provisional figures released on the 25th August 2011, show 56 per cent of Lewisham’s students gained at least 5 A*-C grades including English and maths – a jump of 8 per cent from last year. Over half of Lewisham’s thirteen secondary schools improved by more than 10 percentage points. Bulge reception classes Lewisham has opened up 564 additional places in bulge reception classes across 21 schools. This is the equivalent of 18.8 Forms of Entry. There are currently 72 vacancies across the borough. There are 14 schools which needed building works to accommodate these children. All works have now been completed and there will be a formal handover in early September.
19

NI103a - Special Educational Needs - statements issued within 26 weeks excluding exceptions
NI103a Special Educational Needs - statements issued within 26 weeks excluding exceptions
Percentage Actual (YTD) Target (YTD) Performance (YTD)
Jul 2010 91.90 100.00 Aug 2010 92.50 100.00 Sep 2010 94.30 100.00 Oct 2010 95.50 100.00 Nov 2010 96.00 100.00 Dec 2010 96.40 100.00 Jan 2011 96.60 100.00 Feb 2011 97.00 100.00 Mar 2011 95.60 100.00 Apr 2011 100.00 100.00 May 2011 96.20 100.00 Jun 2011 92.30 100.00 Jul 2011 94.60 100.00
NI103a - comment
Responsible Officer
Performance Comments Action Plan Comments
Head of Access and Support Services
Performance Performance in July was 100% (on target). Overall performance (cumulative from April 2011) is similar to that of our statistical neighbours and national average (95%) but should continue to rise as we achieve our monthly target (100%).
Performance Action Plan In order to maintain the high level of performance: · Management are looking at information systems in place which increase monitoring and ensure that all deadlines are met; · Moving towards attempting to exceed targets (in that statements are finalised within 20 weeks) through process redesign; · Noted plan from SEN Green Paper to reduce statutory timescale, encouraging LAs to look at joint up working and thinking between parents and increasing parental engagement and understanding of processes.
20

Priority 2 - Monthly Indicators
UnitYTD Jul 11
Target Jul 11
Against Target Jul 11
DoT Last year
DoT Last month
Against Target Jun 11
Against Target May 11
10/11
NI103a Special Educational Needs - statements issued within 26 weeks excluding exceptions
Percentage 94.60 100.00
NI103b Special Educational Needs - statements issued within 26 weeks
Percentage 95.40 100.00
Priority 2 - Quarterly Indicators
UnitYTD Mar 11
Target Mar 11
Against Target Mar 11
DoT Last year
DoT Last quarter
Against Target Dec 10
Against Target Sep 10
10/11
LPI240 First time entrantsNumber per 100,000
? ?
LPI241 Reoffending Percentage ? ?
LPI242 Use of custodyNumber per 1,000
? ?
NI117 16 to 18 year olds who are not in education, employment or training (NEET)
Percentage 4.60 5.70
2. Young People's Achievement and Involvement Raising educational attainment and improving facilities for young people through partnership working
2.1 Performance
21

Priority 2 - Indicators reported half-termly
UnitYTD Apr 11
Target Apr 11
Against Target Apr 11
DoT Last Year
DoT Apr 11 vs Dec 10
Against Target Dec 10
Against Target Dec 10
SchY 08/09
BV045.12 % Half days missed - Secondary Percentage 7.00 6.50 BV046.12 % Half days missed - Primary Percentage 4.89 4.90
2. Young People's Achievement and Involvement Raising educational attainment and improving facilities for young people through partnership working
2.1 Performance
22

Priority 02 projects
Directorate BudgetEst. completion date
Current Status
PMSCYP Building Schools for the Future CYP £223m Dec 2013 PMSCYP Tidemill School Deptf. TC Prog. CYP £11m Sep 2011 PMSCYP Strengthening SEN Provision CYP TBC 2015 PMSCYP My Place Syd.Wells Pk (In Dev.) CYP £3.717m Sept 2012 PMSCYP Primary Places Programme CYP £26m Aug 2012 PMSCYP Reinstatement works at Stillness School CYP £2.067m June 2012 PMSCYP Schools Minor Works Prog Phase 2 CYP £950K Aug 2012 PMSCYP Early Intervention Programme CYP £14.4m YR1 Mar 2013
2. Young People's Achievement and Involvement
Raising educational attainment and improving facilities for young people through partnership working 2.2 Projects
23

Red Projects
Senior Responsible Officer Project AimCurrent status
PMSCYP Building Schools for the Future Executive Director for RegenerationProject Aim Rebuilding and refurbishment of secondary school estate and commissioning of New School.
Overall the six projects in construction are progressing satisfactorily - some (eg Deptford Green) very well and some (Prendergast Hilly Fields) not very well. The rationale for moving from Amber to Red for this report is associated with the criticality of returning the phased works at Prendergast Hilly Fields and Addey and Stanhope - where possession of the 'live' areas of the site has been given over to the contractors - back to the school in a clean, safe and functional condition. At Hilly Fields in particular the contractor has failed to understand the magnitude and level of difficulty of the work to be done over this summer period and will fail to deliver all that they have set out to do. Intervention measures have needed to be taken by the Authority to ensure that, despite significant programme slippage, the school is capable of being re-occupied on time. This and other late handovers (the works at Ennersdale road for example) will mean that the contractor will doubtless seek to recover its position under the provisions of the contract. Our view is that their scope for a successful attempt to recover their commercial position are very limited. Nonetheless we are cautious and this coupled with programme slippage leads to an overall programme status of red.
PMSCYP Tidemill School Deptf. TC Prog.Director of Property and Programme Management
Project Aim A new build 2FE Primary school as part of the wider Giffin StreetRegeneration Programme
The contractor is running significantly behind programme and the site is unlikely to be handed over before the end of September. In addition, the contractorhas indicated that they will submit a contractual claim in respect of the delay for additional loss and expense. The Council has already indicated that it doesn't accept the validity of any such claim. As the contractor is in delay liquidated and ascertained damages may be levied but should the claims prove to be valid, these could exceed the damages and unused contingency.
2. Young People's Achievement and Involvement
Raising educational attainment and improving facilities for young people through partnership working 2.2 Projects
24

Priority 03: Summary
Performance Indicators
Against Target Jul 11
Direction of Travel Jul 11 v Jun 11
Finance
Variance Jul 11Direction of Travel Jul 11 v Jun 11
Projects
Current Status Aug 11
Direction of Travel Aug 11 v Jul 11
Risk
Current Status Aug 11
Direction of Travel Aug 11 v Jul 11
Areas Requiring Management Attention this Month
Performance Indicators - Monthly
Against Target
Direction of Travel Jul 11 v Mar 11
Direction of Travel Jul 11 v Jun 11
LPI720 Percentage of noise nuisance complaints receiving a visit within 45 minutes, if necessary
Performance Indicators - Monthly
Against Target
Direction of Travel Jun 11 v Mar 11
Direction of Travel Jun 11 v May 11
NI191 Residual household waste per household (KG) NI192 Percentage of household
waste sent for reuse, recycling and composting NI193 Percentage of municipal
waste land filled
Finance% variance variance
03. NI Clean, Green and Liveable 5.07 1,062.00
Hot Topics
Priority 03: Clean, Green and Liveable
There are no 'Hot Topics' for Priority 3 this month.
25

LPI720 Percentage of noise nuisance complaints receiving a visit within 45 minutes, if necessary
LPI720 Percentage of noise nuisance complaints receiving a visit within 45 minutes, if necessary
Percentage Actual (YTD) Target (YTD) Performance (YTD)
Jul 2010 96.90 98.75 Aug 2010 96.99 98.75 Sep 2010 97.07 98.75 Oct 2010 97.07 98.75 Nov 2010 96.97 98.75 Dec 2010 97.05 98.75 Jan 2011 97.13 98.75 Feb 2011 97.12 98.75 Mar 2011 97.03 98.75 Apr 2011 94.57 98.75 May 2011 93.55 98.75 Jun 2011 93.44 98.75 Jul 2011 93.38 98.75
LPI720 - commentResponsible Officer
Performance Comments Action Plan Comments
Head of Environment
Performance This indicator measures the percentage of customer/complainants receiving a visit within 45 minutes (if necessary) from original report. The service fell below target during July, achieving 93.25%. The service achieved 93.38% YTD.
Performance Action Plan The service fell below target this month due to staff shortages. Two new membersof staff have now been interviewed and should be in place shortly.
26

NI191 - Residual household waste per householdNI191 Residual household waste per household (KG)
Kg/Household Actual Target Performance
Jun 10 69.82 60.00 Jul 10 64.64 60.00 Aug 10 65.08 60.00 Sep 10 67.68 60.00 Oct 10 62.62 60.00 Nov 10 65.60 60.00 Dec 10 57.22 60.00 Jan 11 61.15 60.00 Feb 11 56.88 60.00 Mar 11 67.66 60.00 Apr 11 65.54 60.00 May 11 67.00 60.00 Jun 11 69.38 60.00
NI191 - commentResponsible Officer
Performance Comments
Action Plan Comments
Head of Environment
Performance This indicator measures the kg of residual household waste per household. The service achieved 69.63kg per household during June against the monthly target of 60kg.
Performance Action Plan The service is striving to achieve the annual target through many initiatives: In June / July the following initiatives were undertaken to raise awareness and engage people in behaviour change which, it is hoped, will lead to a reduction in residual waste, whilst more waste is diverted for composting and recycling: 57 Real Nappy Vouchers issued from April to July; 7 of Nappy Natters undertaken from April - July; Numerous compost bins distributed; 10 Compost workshops undertaken in June; 1 Love Food Hate Waste workshops in June; Promotion of activities on the blog and twitter site; Clean & Green Schools Awards Ceremony, which raises awareness of waste prevention and recycling; 257,420kg of garden waste collected at the four satellite garden waste sites from March 2011 to July 2011; 9 Events attended including People's Day distributing information on waste prevention including 'No Junk Mail' stickers; 3 Presentations undertaken from April to July; Bulky Reuse Service promoted through the Call Centre, but take up is low, especially if people have to wait in for a collection(easier to use the bulky waste service) or to phone for a free collection with one of the Reuse Organisations; Extended the kerbside textile collections which can now be made borough-wide, however, more publicity.
27

NI192 - Percentage of household waste sent for reuse, recycling and composting
NI192 Percentage of household waste sent for reuse, recycling and composting
Percentage Actual (YTD) Target (YTD) Performance (YTD)
Jun 10 17.24 22.00 Jul 10 17.39 22.00 Aug 10 17.27 22.00 Sep 10 17.56 22.00 Oct 10 17.61 22.00 Nov 10 17.75 22.00 Dec 10 18.00 22.00 Jan 11 18.09 22.00 Feb 11 18.04 22.00 Mar 11 17.98 22.00 Apr 11 16.69 20.00 May 11 16.02 20.00 Jun 11 16.05 20.00
NI192 - comment
Responsible Officer
Performance Comments
Head of Environment
Performance This indicator measures the percentage of household waste that is sent for recycling, composting or for re-use. The service achieved 16.12% during June against the annual target of 20%. This figure is taken as a percentage of household waste collected. So, for example in June more overall household waste was collected, thereby negatively affecting the recycling rate. Further, according to the current contractor Lewisham's quality of recyclate is poor. Despite the amount of communications, education and awareness raising that is undertaken with residents data for the first three months in terms of what is collected for recycling, but is then rejected is details below: * April - 20.03% rejected; * May - 24.06% rejected; * June - 17.74% rejected. If none of the above was rejected then the recycling / composting rate would be approx 19.2%. As it currently stands the recycling / composting rate is 16.06%. In addition improvements in packaging technologies can have a negative impact on recycling rates, including lighter weight glass bottles and cans being replaced by tetra-paks, which currently aren't collected at the doorstep and the reduction in free newspapers means less recyclable material available.
28
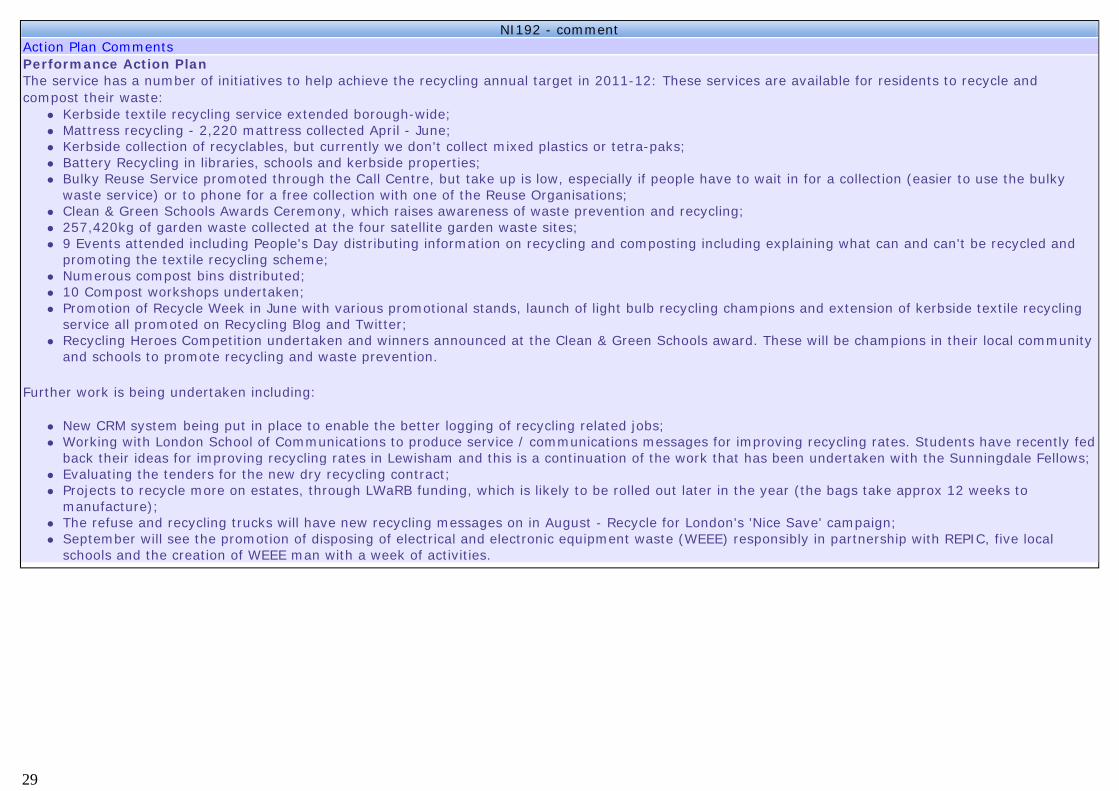
NI192 - commentAction Plan CommentsPerformance Action Plan The service has a number of initiatives to help achieve the recycling annual target in 2011-12: These services are available for residents to recycle and compost their waste:
Kerbside textile recycling service extended borough-wide; Mattress recycling - 2,220 mattress collected April - June; Kerbside collection of recyclables, but currently we don't collect mixed plastics or tetra-paks; Battery Recycling in libraries, schools and kerbside properties; Bulky Reuse Service promoted through the Call Centre, but take up is low, especially if people have to wait in for a collection (easier to use the bulky waste service) or to phone for a free collection with one of the Reuse Organisations; Clean & Green Schools Awards Ceremony, which raises awareness of waste prevention and recycling; 257,420kg of garden waste collected at the four satellite garden waste sites; 9 Events attended including People's Day distributing information on recycling and composting including explaining what can and can't be recycled and promoting the textile recycling scheme; Numerous compost bins distributed; 10 Compost workshops undertaken; Promotion of Recycle Week in June with various promotional stands, launch of light bulb recycling champions and extension of kerbside textile recycling service all promoted on Recycling Blog and Twitter; Recycling Heroes Competition undertaken and winners announced at the Clean & Green Schools award. These will be champions in their local community and schools to promote recycling and waste prevention.
Further work is being undertaken including:
New CRM system being put in place to enable the better logging of recycling related jobs; Working with London School of Communications to produce service / communications messages for improving recycling rates. Students have recently fedback their ideas for improving recycling rates in Lewisham and this is a continuation of the work that has been undertaken with the Sunningdale Fellows; Evaluating the tenders for the new dry recycling contract; Projects to recycle more on estates, through LWaRB funding, which is likely to be rolled out later in the year (the bags take approx 12 weeks to manufacture); The refuse and recycling trucks will have new recycling messages on in August - Recycle for London's 'Nice Save' campaign; September will see the promotion of disposing of electrical and electronic equipment waste (WEEE) responsibly in partnership with REPIC, five local schools and the creation of WEEE man with a week of activities.
29

NI193 - Percentage of municipal waste landfilledNI193 Percentage of municipal waste land filled
Percentage Actual (YTD) Target (YTD) Performance (YTD)
Jun 10 9.80 9.00 Jul 10 9.90 9.00 Aug 10 10.16 9.00 Sep 10 10.01 9.00 Oct 10 10.00 9.00 Nov 10 9.88 9.00 Dec 10 9.71 9.00 Jan 11 9.69 9.00 Feb 11 9.71 9.00 Mar 11 9.74 9.00 Apr 11 9.26 7.00 May 11 9.49 7.00 Jun 11 9.43 7.00
NI193 - commentResponsible Officer
Performance Comments Action Plan Comments
Head of Environment
Performance This indicator measures the percentage of municipal waste which is sent to landfill. The service achieved 9.32% during June against the annual target of 7%. The service achieved 9.42% YTD.
Performance Action Plan The following actions have or are being implemented which should help reduce the tonnage of waste being produced and going to landfill: - Bulky Reuse Service promoted through the Call Centre, but take up is low, especially if people have to wait in for a collection (easier to use the bulky waste service) or to phone for a free collection with one of the Reuse Organisations; - Discussions with contractors to look at options around waste management; - 2,220 mattresses collected (April - June); - Meeting set up with Phoenix to discuss reducing fly tipping on the Greens in Downham and Bellingham.
30

Priority 3 - Monthly Indicators
UnitYTD Jul 11
Target Jul 11
Against Target Jul 11
DoT Last year
DoT Last month
Against Target Jun 11
Against Target May 11
10/11
LPI079 Percentage of fly tip removal jobs completed within 1 day
Percentage 72.46 60.00
LPI080 Percentage of recycling bins collected on time
Percentage 100.00 100.00
LPI720 Percentage of noise nuisance complaints receiving a visit within 45 minutes, if necessary
Percentage 93.38 98.75
LPI752 Percentage of graffiti removal jobs completed in 1 day
Percentage 99.23 99.50
Priority 3 - Monthly Indicators - latest data available
UnitYTD Jun 11
Target Jun 11
Against Target Jun 11
DoT Last year
DoT Last month
Against Target May 11
Against Target Apr 11
10/11
NI191 Residual household waste per household (KG) Kg/Household 69.38 60.00 NI192 Percentage of household waste sent for
reuse, recycling and compostingPercentage 16.05 20.00
NI193 Percentage of municipal waste land filled Percentage 9.43 7.00
3. Clean, Green & Liveable Improving environmental management, the cleanliness and care of roads and pavements, and promoting a sustainable environment
3.1 Performance
31
Priority 03 projects
Directorate Budget Est. completion dateCurrent Status
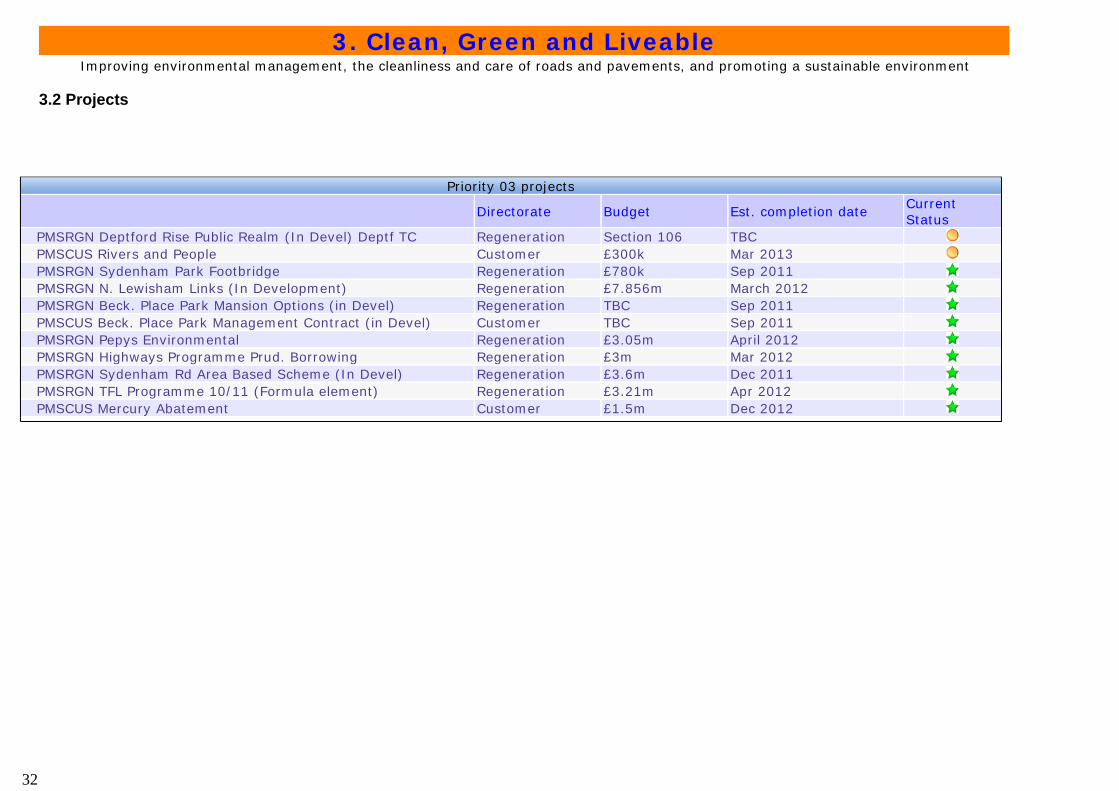
PMSRGN Deptford Rise Public Realm (In Devel) Deptf TC Regeneration Section 106 TBC PMSCUS Rivers and People Customer £300k Mar 2013 PMSRGN Sydenham Park Footbridge Regeneration £780k Sep 2011 PMSRGN N. Lewisham Links (In Development) Regeneration £7.856m March 2012 PMSRGN Beck. Place Park Mansion Options (in Devel) Regeneration TBC Sep 2011 PMSCUS Beck. Place Park Management Contract (in Devel) Customer TBC Sep 2011 PMSRGN Pepys Environmental Regeneration £3.05m April 2012 PMSRGN Highways Programme Prud. Borrowing Regeneration £3m Mar 2012 PMSRGN Sydenham Rd Area Based Scheme (In Devel) Regeneration £3.6m Dec 2011 PMSRGN TFL Programme 10/11 (Formula element) Regeneration £3.21m Apr 2012 PMSCUS Mercury Abatement Customer £1.5m Dec 2012
3. Clean, Green and Liveable
Improving environmental management, the cleanliness and care of roads and pavements, and promoting a sustainable environment
3.2 Projects
32

Net Expenditure Priority 03 (£000s)2011/12 Budget
Projected year-end variance as at Jul 11
Variance% variance
Comments
03. NI Clean, Green and Liveable
20,962 1,062 5.07
Finance Overspend The total overspend of £1,062k represents: Shortfall against income budgets within environment division of £0.45m; Plans to sell spare capacity in the council's waste disposal contracts with SELCHP have not been fully realised resulting in an overspend of £0.2m and overspend on street cleaning budgets of £0.1m. A total of £0.319m relates to shortfall in Parking income.
3. Clean, Green and Liveable
Improving environmental management, the cleanliness and care of roads and pavements, and promoting a sustainable environment
3.4 Finance
33

Priority 04: Summary
Performance Indicators
Against Target Jul 11
Direction of Travel Jul 11 v Jun 11
Finance
Variance Jul 11Direction of Travel Jul 11 v Jun 11
Projects
Current Status Direction of Travel
n/a n/a
Risk
Current Status Aug 11
Direction of Travel Aug 11 v Jul 11
Areas Requiring Management Attention this Month
Performance Indicators - Monthly
Against Target
Direction of Travel Jul 11 v Mar 11
Direction of Travel Jul 11 v Jun 11
Hot Topics
Priority 04: Safety, Security and Visible Presence
Lewisham Mayor announces support fund for businesses The Mayor of Lewisham Sir Steve Bullock has set up a one-off fund of £125,000 to support local businesses affected by the violence and looting in August. The fund will be made available to support independent businesses with priority given to independent small businesses whose premises have been damaged as a result of the recent disturbances. The Mayor of Lewisham has also offered help with cash flow by adjusting Business Rates instalment plans and the support of the Lewisham Business Advisory Service with making insurance claims and other claims for riot damage.
34

Priority 4 - Monthly Indicators
UnitYTD Jul 11
Target Jul 11
Against Target Jul 11
DoT Last year
DoT Last month
Against Target Jun 11
Against Target May 11
10/11
LPI230 Violence Portfolio crime rate Number per 1000 22.11 ? LPI231 Property Portfolio crime rate Number per 1000 63.88 ?
4. Safety, Security and Visible Presence Improving Partnership working with the police and others and using the Council's powers to combat anti-social behaviour
4.1 Performance Please note that targets for these indicators have yet to be set by the Metropolitan Police.
35

Priority 05: Summary
Performance Indicators
Against Target Jul 11
Direction of Travel Jul 11 v Jun 11
Finance
Variance Jul 11Direction of travel Jul 11 v Jun 11
Projects
Current Status Aug 11
Direction of travel Aug 11 v Jul 11
Risk
Current Status Aug 11
Direction of travel Aug 11 v Jul 11
Areas Requiring Management Attention this Month
Performance Indicators - Monthly
Against Target
Direction of Travel Jul 11 v Mar 11
Direction of Travel Jul 11 v Jun 11
NI157b % Minor planning apps within 8 weeks
Performance Indicators - Quarterly
Against Target
Direction of Travel Jun 11 v Jul 11
Direction of Travel Jun 11 v Mar 11
Hot Topics
Priority 05: Strengthening the Local Economy
The Work Programme The Work Programme (WP) has recently been introduced in Lewisham and it is anticipated that it will have a positive impact over time, as benefit claimants become eligible for this intensive programme of support. Discussions with the Department of Work and Pension's prime contractors are focussed on the specifics of working within Lewisham, addressing the needs of local people, plus employer engagement and partnership with local specialist service provision. Catford Broadway The Council has successfully obtained £125,000 from the Mayor of London’s Outer London Fund for the purpose of developing designs and carrying out feasibility surveys to explore how Catford Broadway could provide a better environment for businesses, residents and shoppers. The Council hopes to make substantial changes to the town centre as a whole, and if that were to happen, then Catford Broadway would have even greater significant as a place to shop, meet and socialise.
36

NI157b - % minor planning applications within 8 weeksNI157b % Minor planning apps within 8 weeks
Actual (YTD) Target (YTD) Performance (YTD) Jul 2010 87.31 70.00 Aug 2010 85.61 70.00 Sep 2010 85.94 70.00 Oct 2010 85.61 70.00 Nov 2010 84.81 70.00 Dec 2010 83.97 70.00 Jan 2011 81.88 70.00 Feb 2011 81.09 70.00 Mar 2011 80.19 70.00 Apr 2011 66.67 75.00 May 2011 59.81 75.00 Jun 2011 58.54 75.00 Jul 2011 55.19 75.00
NI157b - commentResponsible Officer
Performance Comments Action Plan Comments
Head of Planning
Performance The reorganisation of the Planning Service and related significant level of staff turnover is currently impacting on the speed of registration and determination of planning applications. Minor applications are particularly sensitive to delays in validation times as they tend to be the most controversial and once past the statutory date they are negotiated so that permission can be granted.
Performance Action Plan Actions that are being taken to address performance issues are associated with the implementation of the restructure and introduction of new ways of working. This should affect performance in the short term but should show improvements in terms of customer care and overall performance in the medium term.
37
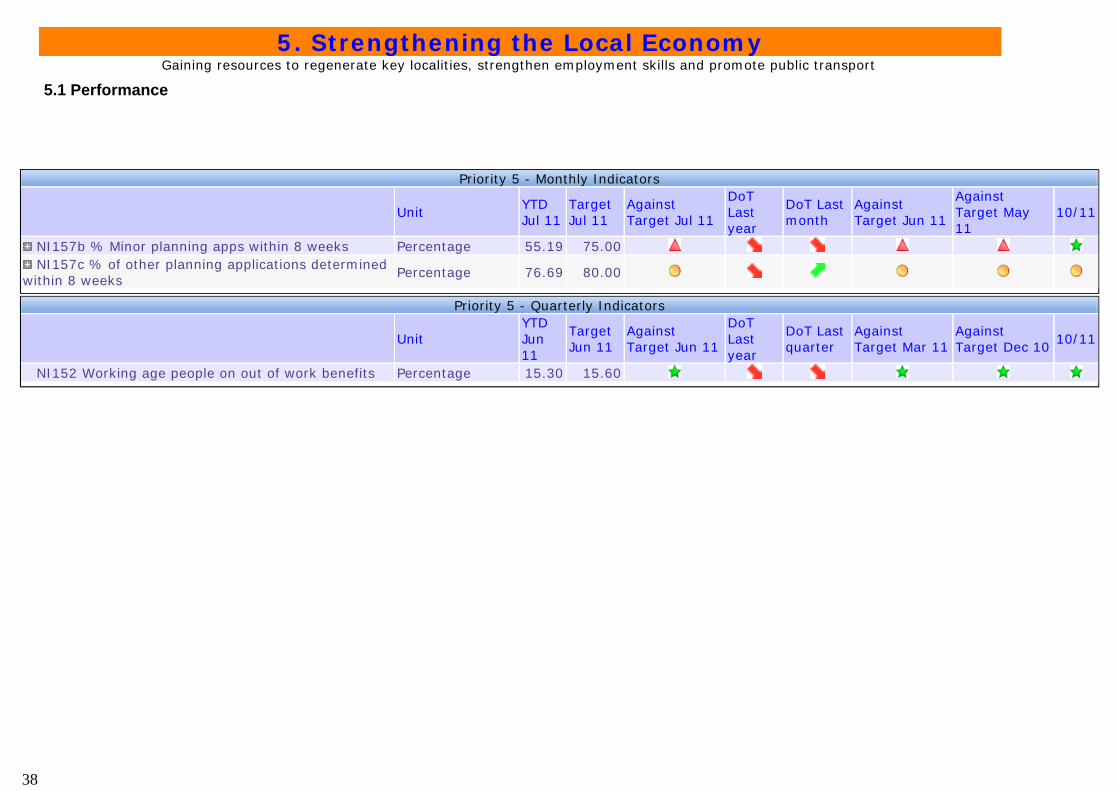
Priority 5 - Monthly Indicators
UnitYTD Jul 11
Target Jul 11
Against Target Jul 11
DoT Last year
DoT Last month
Against Target Jun 11
Against Target May 11
10/11
NI157b % Minor planning apps within 8 weeks Percentage 55.19 75.00 NI157c % of other planning applications determined
within 8 weeksPercentage 76.69 80.00
Priority 5 - Quarterly Indicators
UnitYTD Jun 11
Target Jun 11
Against Target Jun 11
DoT Last year
DoT Last quarter
Against Target Mar 11
Against Target Dec 10
10/11
NI152 Working age people on out of work benefits Percentage 15.30 15.60
5. Strengthening the Local Economy Gaining resources to regenerate key localities, strengthen employment skills and promote public transport
5.1 Performance
38

Priority 05 projects
Directorate Budget Est. completion dateCurrent Status
PMSRGN Deptford Station Deptf TC Prog Regeneration £10.9m May 12 PMSRGN Catford Town Centre (In Devel) Regeneration TBC TBC
5. Strengthening the Local Economy
Gaining resources to regenerate key localities, strengthen employment skills and promote public transport
5.2 Projects
39

Priority 06: Summary
Performance Indicators
Against Target Jul 11
Direction of Travel Jul 11 v Jun 11
Finance
Variance Jul 11Direction of Travel Jul 11 v Jun 11
Projects
Current Status Aug 11
Direction of Travel Aug 11 v Jul 11
Risk
Current Status Aug 11
Direction of Travel Aug 11 v Jul 11
Areas Requiring Management Attention this Month
Performance Indicators - Monthly
Against Target
Direction of Travel Jul 11 v Mar 11
Direction of Travel Jul 11 v Jun 11
LPI069 Number of cases where homelessness was prevented through the use of rent incentive scheme NI156 Number of households living in Temporary
Accommodation
Performance Indicators - Quarterly
Against Target
Direction of Travel Jun 11 v Mar 11
Direction of Travel Jun 11 v Mar 11
Projects - RedDirectorate Current Status
PMSCUS Kender New Build grant phase 3 South Customer
Finance% variance variance
06. NI Decent Homes for All 10.26 345.00
Hot Topics
Priority 06: Decent Homes for All
Lewisham Landlords’ Day will help ‘shape the future’ Lewisham Council is holding a Landlords Day on 9 September 2011 in the Civic Suite. The wide-ranging programme for the day has been specifically designed to help both new and established landlords and letting agents to help them successfully manage their individual tenancies or their lettings businesses. The event includes workshops, presentations by industry experts from the private rented sector and a comprehensive exhibition area where many leading suppliers will be exhibiting their products and services. Council officers will also be on hand to answer questions about the various rental schemes and advice services that the Council can offer.
40

LPI069 - Number of cases where homelessness prevented through the use of the rent incentive scheme
LPI069 Number of cases where homelessness was prevented through the use of rent incentive scheme
Number Actual (YTD) Target (YTD) Performance (YTD)
Jul 2010 123.00 100.00 Aug 2010 145.00 125.00 Sep 2010 165.00 150.00 Oct 2010 182.00 175.00 Nov 2010 201.00 200.00 Dec 2010 212.00 225.00 Jan 2011 225.00 250.00 Feb 2011 239.00 275.00 Mar 2011 252.00 300.00 Apr 2011 25.00 May 2011 5.00 50.00 Jun 2011 24.00 75.00 Jul 2011 38.00 100.00
LPI069 - comment
Responsible Officer
Performance Comments Action Plan Comments
Head of Strategic Housing
Performance In July, there were 14 cases of homelessness prevented through the rent incentive scheme.
Performance Action Plan Despite being off target, an increasing number of cases were prevented in July through the rent incentivescheme. Work will continue in promoting the scheme in order to prevent homelessness.
41
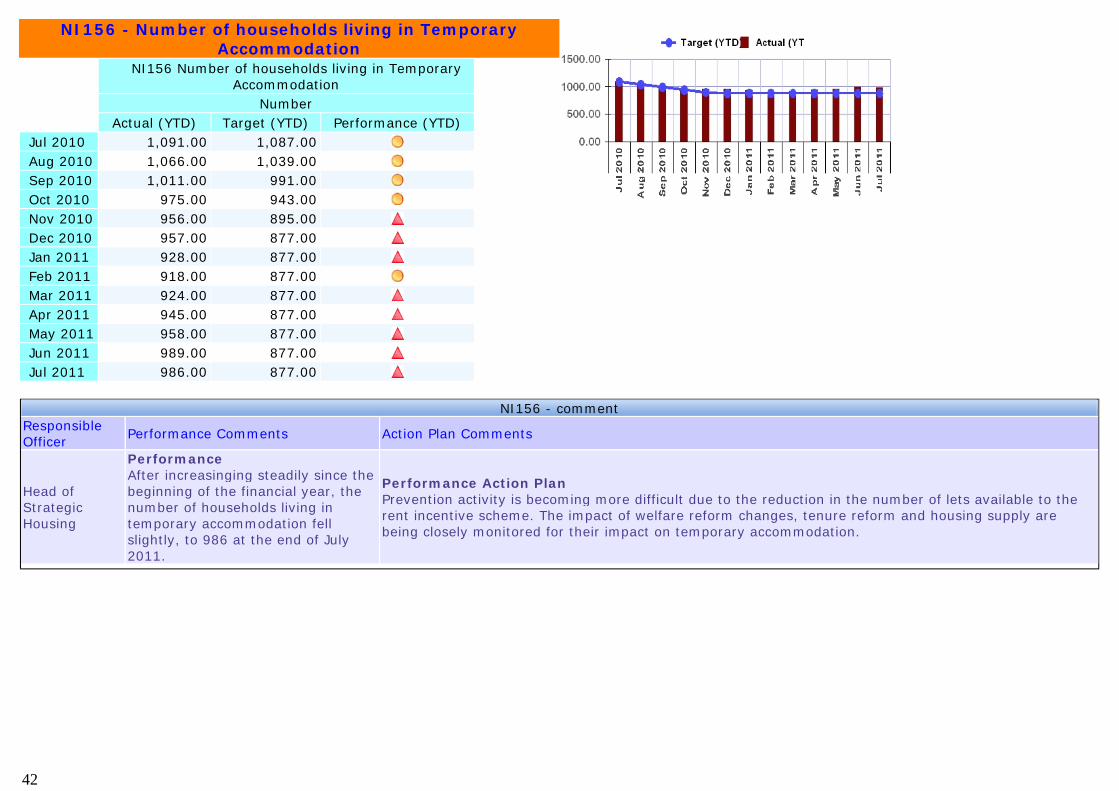
NI156 - Number of households living in Temporary Accommodation
NI156 Number of households living in Temporary Accommodation
Number Actual (YTD) Target (YTD) Performance (YTD)
Jul 2010 1,091.00 1,087.00 Aug 2010 1,066.00 1,039.00 Sep 2010 1,011.00 991.00 Oct 2010 975.00 943.00 Nov 2010 956.00 895.00 Dec 2010 957.00 877.00 Jan 2011 928.00 877.00 Feb 2011 918.00 877.00 Mar 2011 924.00 877.00 Apr 2011 945.00 877.00 May 2011 958.00 877.00 Jun 2011 989.00 877.00 Jul 2011 986.00 877.00
NI156 - comment
Responsible Officer
Performance Comments Action Plan Comments
Head of Strategic Housing
Performance After increasinging steadily since the beginning of the financial year, the number of households living in temporary accommodation fell slightly, to 986 at the end of July 2011.
Performance Action Plan Prevention activity is becoming more difficult due to the reduction in the number of lets available to therent incentive scheme. The impact of welfare reform changes, tenure reform and housing supply are being closely monitored for their impact on temporary accommodation.
42

Priority 6 - Monthly Indicators
UnitYTD Jul 11
Target Jul 11
Against Target Jul 11
DoT Last year
DoT Last month
Against Target Jun 11
Against Target May 11
10/11
LPI029 Percentage of rent collected, excluding rent due on void properties
Percent 97.78 100.40
LPI037 Average Time to Re-let Number 24.59 24.00 LPI069 Number of cases where homelessness was
prevented through the use of rent incentive schemeNumber 38.00 100.00
LPI705 Percentage urgent repairs completed within timescales
Percentage 100.00 99.00
LPZ706 Percentage of properties let to those in temporary accommodation
Percentage ? ?
NI156 Number of households living in Temporary Accommodation
Number 986.00 877.00
Priority 6 - Quarterly Indicators
UnitYTD Jun 11
Target Jun 11
Against Target Jun 11
DoT Last year
DoT Last quarter
Against Target Mar 11
Against Target Dec 10
10/11
LPZ705 Percentage of homes made decent Percentage ? ?
6. Decent Homes for All Investment in social and affordable housing to achieve the Decent Homes standard, tackle homelessness and supply key worker housing
6.1 Performance
43

Priority 06 projects
Directorate BudgetEst. completion date
Current Status
PMSCUS Kender New Build grant phase 3 South Customer £1.49m TBC PMSCUS Kender New Build grant phase 4 Customer £1.54m 2011 PMSCUS Excalibur Regeneration Customer £1.521m 2018 PMSCUS Lewisham Homes Capital Programme Customer £27.446m 2011/12 Mar 2012 PMSCUS Heathside & Lethbridge Redevelopment Customer £1.9m (Ph3) Autumn 2012 PMSRGN Resol. Studios - Deptf TC prog Regeneration £6.2m RSL Sep 2011 PMSRGN Southern Site Housing -Deptf TC Prog Regeneration TBC TBC
6. Decent Homes for All
Investment in social and affordable housing to achieve the Decent Homes standard, tackle homelessness and supply key worker housing
6.2 Projects
44

Red ProjectsSenior Responsible Officer Project Aim Current status
PMSCUS Kender New Build grant phase 3 South Customer Services. EDProject Aim Kender New-Build Phase 3 South
The New Cross Gate Board considered the current position and have noted the withdrawal of the developer due to viability concerns. A short soft market testing exercise has been undertaken that indicates why the existing scheme is undeliverable. Officers are discussing with the Board how the development of the site can proceed in a way that meet their and the Councils expectations and is commercially deliverable.
6. Decent Homes for All
Investment in social and affordable housing to achieve the Decent Homes standard, tackle homelessness and supply key worker housing
6.2 Projects
45

Net Expenditure Priority 06 (£000s)2011/12 Budget
Projected year-end variance as at Jul 11
Variance% variance
Comments
06. NI Decent Homes for All
3,361 345 10.26
Finance Overspend Overspend relates to decreased rental income due to increase in projected voids coupled with higher repairs & maintenance costs. Management action is underway with the establishment of a dedicated project team undertaking intensive action over the next period to procure more properties, reduce void turn around and costs reduction on repairs and maintenance.
6. Decent Homes for All
Investment in social and affordable housing to achieve the Decent Homes standard, tackle homelessness and supply key worker housing
6.4 Finance
46

Priority 07: Summary
Performance Indicators
Against Target Jul 11
Direction of Travel Jul 11 v Jun 11
Finance
Variance Jul 11Direction of Travel Jul 11 v Jun 11
Projects
Against Target Direction of Travel
n/a n/a
Risk
Current Status Aug 11
Direction of Travel Aug 11 v Jul 11
Areas Requiring Management Attention this Month
Performance Indicators - Monthly
Against Target
Direction of Travel Jul 11 v Mar 11
Direction of Travel Jul 11 v Jun 11
NI060 Percentage core assessments for children's social care carried out < 35 working days NI062 Stability of placements of looked after
children: number of moves NI068 Percentage of referrals to children's social
care going on to initial assessment
Red Risks - Corporate Risk Register
Responsible OfficerCurr...Status
RMSCYP01 Avoidable death or serious injury
Director Children's Social Care, HOSE, Head of Access & Support Services
Hot Topics
Priority 07: Protection of Children
There are no 'Hot Topics' for Priority 7 this month.
47

NI060 - Percentage core assessments for children's social care carried out <35 working daysNI060 Percentage core assessments for children's social
care carried out < 35 working days Percentage
Actual (YTD) Target (YTD) Statistical (YTD) Performance (YTD)
Jul 2010 79.00 90.50 75.10 Aug 2010 78.70 90.50 75.10 Sep 2010 78.00 90.50 73.00 Oct 2010 78.70 90.50 73.00 Nov 2010 79.30 90.50 73.00 Dec 2010 80.00 90.50 Jan 2011 81.00 90.50 Feb 2011 82.20 90.50 Mar 2011 83.40 90.50 79.20 Apr 2011 83.90 91.00 79.20 May 2011 83.50 91.00 79.20 Jun 2011 83.90 91.00 79.20 Jul 2011 83.40 91.00 79.20
NI060 - comment
Responsible Officer
Performance Comments Action Plan Comments
Director of Children's Social Care
Performance Current performance 83.4% is below target but above statistical neighbours 79.2% (London boroughs similar to Lewisham)
Performance Action Plan Lewisham has had a significant increase in contacts and cases leading to Core Assessments. We are currently providing a weekly report on all Core Assessments that are overdue, and working to ensure that social workers understand the need to complete this work in a timely manner.
48

NI062 - Stability of placements of looked after children: number of moves (3+ placements within last 12 months)
NI062 Stability of placements of looked after children: number ofmoves
Percentage Actual (YTD) Target (YTD) Statistical (YTD) Performance (YTD)
Jul 2010 11.30 9.00 11.80 Aug 2010 12.20 9.00 11.80 Sep 2010 10.80 9.00 7.20 Oct 2010 10.70 9.00 7.20 Nov 2010 10.30 9.00 7.20 Dec 2010 9.90 9.00 Jan 2011 9.00 9.00 Feb 2011 8.20 9.00 Mar 2011 8.90 9.00 11.70 Apr 2011 9.30 9.00 11.70 May 2011 10.70 9.00 11.70 Jun 2011 8.90 9.00 11.70 Jul 2011 9.60 9.00 11.70
NI062 - comments
Responsible Officer
Performance Comments Action Plan Comments
Director of Children's Social Care
Performance Current performance 9.6% is worse than target (lower is better) but better than our statistical neighbours 11.7% (London boroughs similar to Lewisham) Factors impacting on performance have been the age and behavioural difficulties of the child / young person; school attendance; carers and schools' capacity to manage difficult behaviour; effective matching of children to the carers; capacity of social workers and other agencies to respond to issues that arise during placements.
Performance Action Plan Placement support meetings are arranged with carers to develop placement stability. This focuses on the early identification and tracking of fragile placements, and the provision of multi-agency & multi-disciplinary support to carers to prevent breakdown. This support includes the diversion from exclusion from school by additional assistance in class and direct CAMHS consultation with carers. Challenging behaviour of older children continues to be a focus of attention with carers being helped with strategies to reduce the impact of negative behaviour.
49
NI068 - Percentage of referrals to children's social care going on to initial assessment
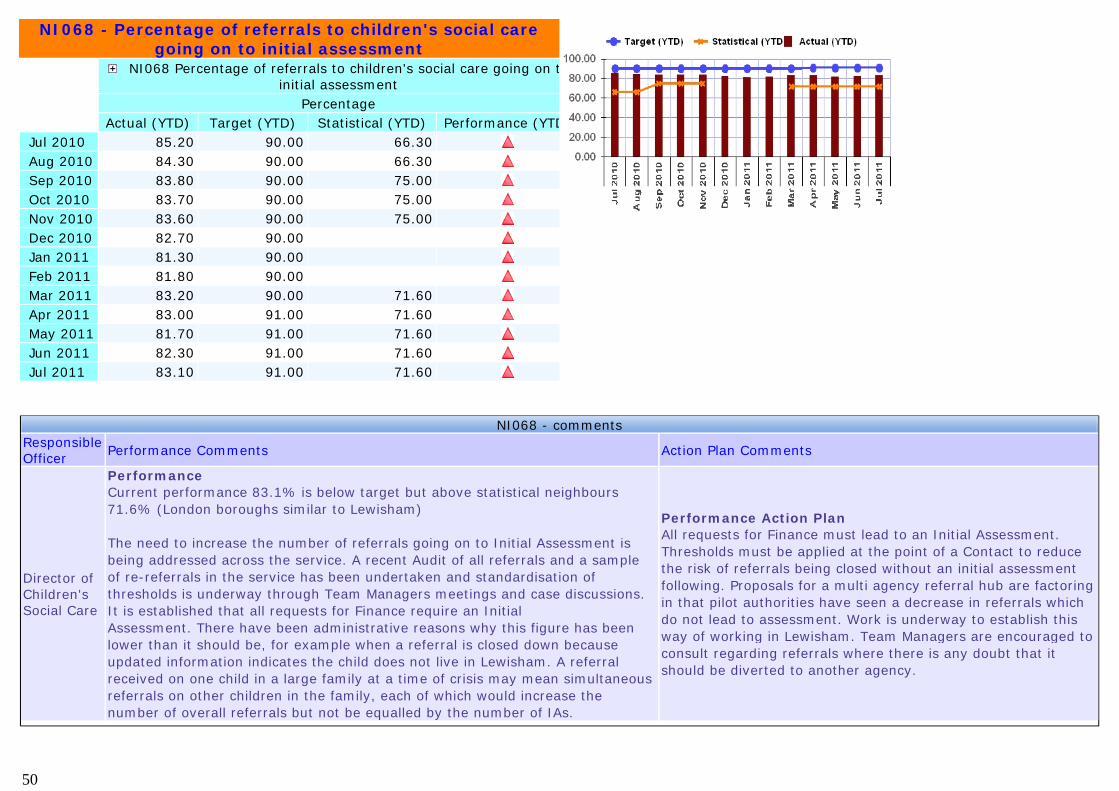
NI068 Percentage of referrals to children's social care going on tinitial assessment
Percentage Actual (YTD) Target (YTD) Statistical (YTD) Performance (YTD
Jul 2010 85.20 90.00 66.30 Aug 2010 84.30 90.00 66.30 Sep 2010 83.80 90.00 75.00 Oct 2010 83.70 90.00 75.00 Nov 2010 83.60 90.00 75.00 Dec 2010 82.70 90.00 Jan 2011 81.30 90.00 Feb 2011 81.80 90.00 Mar 2011 83.20 90.00 71.60 Apr 2011 83.00 91.00 71.60 May 2011 81.70 91.00 71.60 Jun 2011 82.30 91.00 71.60 Jul 2011 83.10 91.00 71.60
NI068 - commentsResponsible Officer
Performance Comments Action Plan Comments
Director of Children's Social Care
Performance Current performance 83.1% is below target but above statistical neighbours 71.6% (London boroughs similar to Lewisham) The need to increase the number of referrals going on to Initial Assessment is being addressed across the service. A recent Audit of all referrals and a sample of re-referrals in the service has been undertaken and standardisation of thresholds is underway through Team Managers meetings and case discussions. It is established that all requests for Finance require an Initial Assessment. There have been administrative reasons why this figure has been lower than it should be, for example when a referral is closed down because updated information indicates the child does not live in Lewisham. A referral received on one child in a large family at a time of crisis may mean simultaneous referrals on other children in the family, each of which would increase the number of overall referrals but not be equalled by the number of IAs.
Performance Action Plan All requests for Finance must lead to an Initial Assessment. Thresholds must be applied at the point of a Contact to reduce the risk of referrals being closed without an initial assessment following. Proposals for a multi agency referral hub are factoring in that pilot authorities have seen a decrease in referrals which do not lead to assessment. Work is underway to establish this way of working in Lewisham. Team Managers are encouraged to consult regarding referrals where there is any doubt that it should be diverted to another agency.
50

Priority 7 - Monthly Indicators
UnitYTD Jul 11
Target Jul 11
Against Target Jul 11
DoT Last year
DoT Last month
Against Target Jun 11
Against Target May 11
10/11
NI060 Percentage core assessments for children's social care carried out < 35 working days
Percentage 83.40 91.00
NI062 Stability of placements of looked after children: number of moves
Percentage 9.60 9.00
NI063 Stability of placements of looked after children: length of placement
Percentage 67.80 77.00
NI064 Child protection plans lasting 2 years or more Percentage 7.40 8.00 NI065 Children becoming the subject of a Child Protection Plan
for a second or subsequent timePercentage 6.90 10.00
NI066 Looked after children cases which were reviewed within required timescales
Percentage 99.10 99.00
NI067 Percentage of child protection cases which were reviewed within required timescales
Percentage 100.00 100.00
NI068 Percentage of referrals to children's social care going on to initial assessment
Percentage 83.10 91.00
NI200 Percentage of Initial Assessments for CSC carried out < 10 working days
Percentage 84.40 ?
7. Protection of Children Better safe-guarding and joined-up services for children at risk
7.1 Performance
51

Priority 7 - Corporate Risk Register - Red RisksCurrent status
RMSCYP01 Avoidable death or serious injury
Priority 7 - Corporate Risk Register - Red Risks
Consequences
DoT Current Quarter v Previous Quarter
Responsible Officer
Comments
RMSCYP01 Avoidable death or serious injury
Risk - What are the worst consequences of the risk? Public outrage, damaged reputation, cost of response, reduced staff morale, loss of staff, decreased performance, poor performance assessments/Ofted.
Director Children's Social Care, HOSE, Head of Access & Support Services
Risk - What have we done to control the risk? Quality control, relationships with providers. Strength of partnerships. Child protection systems. Strong PR. Ensure safeguarding plans fully implemented. Regular supervision of staff procedures. Regular timely communication and meetings. Education Psychologists now trained in trauma support, ensure strong safeguarding mechanisms for all staff across contract bids from other organisations. Safeguarding Board monitors action plans from Serious Case Reviews Adherence to CYP Lone Working Policy, violence to staff meetings and review of lessons learnt.
7. Protection for Children
Better safe-guarding and joined-up services for children at risk
7.3 Risk
52
Priority 08: Summary
Performance Indicators
Against Target Jul 11
Direction of Travel Jul 11 v Jun 11
Finance
Variance Jul 11Direction of Travel Jul 11 v Jun 11
Projects
Current Status Jul 11
Direction of Travel Jul 11 v Jul 11
n/a n/a
Risk
Current Status Aug 11
Direction of Travel Aug 11 v Jul 11
Hot Topics
Priority 08: Caring for Adults and Older People
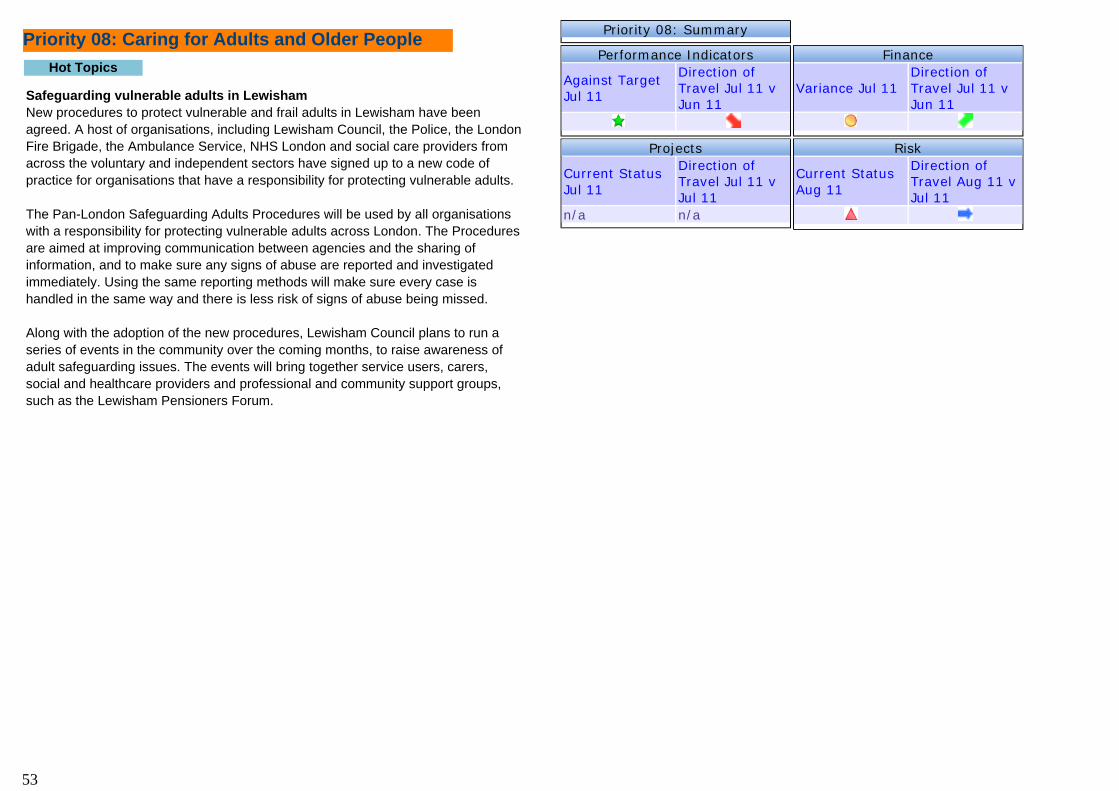
Safeguarding vulnerable adults in Lewisham New procedures to protect vulnerable and frail adults in Lewisham have been agreed. A host of organisations, including Lewisham Council, the Police, the London Fire Brigade, the Ambulance Service, NHS London and social care providers from across the voluntary and independent sectors have signed up to a new code of practice for organisations that have a responsibility for protecting vulnerable adults. The Pan-London Safeguarding Adults Procedures will be used by all organisations with a responsibility for protecting vulnerable adults across London. The Procedures are aimed at improving communication between agencies and the sharing of information, and to make sure any signs of abuse are reported and investigated immediately. Using the same reporting methods will make sure every case is handled in the same way and there is less risk of signs of abuse being missed. Along with the adoption of the new procedures, Lewisham Council plans to run a series of events in the community over the coming months, to raise awareness of adult safeguarding issues. The events will bring together service users, carers, social and healthcare providers and professional and community support groups, such as the Lewisham Pensioners Forum.
53

Areas Requiring Management Attention this Month
Performance Indicators - Monthly
Against Target
Direction of Travel Jul 11 v Mar 11
Direction of Travel Jul 11 v Jun 11
Performance Indicators - Quarterly
Against Target
Direction of Travel Jun 11 v Mar 11
Direction of Travel Jun 11 v Mar 11
AO/D40 % Adult Social Care clients receiving a review
Red Risks
Responsible OfficerCurr...Status
RMSCOM04 Avoidable death or serious injury of Client or Staff MemberHead of Adult Assessment and Care Management, Head of Communities andNeighbourhood Development; Head of Cultural Services; Head of Crime Reduction.
8. Caring for Adults and Older people
Working with Health Services to support older people and adults in need of care
54

AO/D40 - % Adult Social Care clients receiving a review
AO/D40 % Adult Social Care clients receiving a review
Percentage Actual (YTD) Target (YTD) Performance (YTD)
Jul 2010 37.86 % 25.00 % Aug 2010 43.07 % 31.25 % Sep 2010 46.53 % 37.50 % Oct 2010 55.04 % 43.75 % Nov 2010 50.90 % 50.00 % Dec 2010 49.87 % 56.25 % Jan 2011 49.87 % 62.50 % Feb 2011 44.03 % 68.75 % Mar 2011 62.00 % 75.00 % Apr 2011 7.46 % 6.00 % May 2011 8.83 % 13.00 % Jun 2011 13.82 % 19.00 % Jul 2011 15.20 % 25.00 %
AO/D40 - commentResponsible Officer
Performance Comments Action Plan Comments
Programme Director for Adults Social Care and Health Modernisation
Performance This local indicator measures the percentage of service users who have had their needs and package of care formally reviewed in the year. Performance is currently below target.
Performance Action Plan Performance is monitored every month at meetings with the Senior and Operational Managers from the adult teams. Analysis at client level is being undertaken to ensure that every service user who is due a review has receivedone and that further reviews are prioritised accordingly.
55

Priority 8 - Monthly Indicators
UnitYTD Jul 11
Target Jul 11
Against Target Jul 11
DoT Last year
DoT Last month
Against Target Jun 11
Against Target May 11
10/11
NI130 Social Care clients receiving Self Directed Support (Direct Payments and Individual Budgets)
Rate per 100,000
45.49 40.00
NI131 Delayed transfers of careRate per 100,000
1.28 2.50
NI132 Timeliness of social care assessment (all adults)
Percentage ? ?
NI146 Adults with learning disabilities in employment
Percentage 7.05 9.00
Priority 8 - Quarterly Indicators
UnitYTD Jun 11
Target Jun 11
Against Target Jun 11
DoT Last year
DoT Last quarter
Against Target Mar 11
Against Target Dec 10
10/11
AO/D40 % Adult Social Care clients receiving a review
Percentage 13.82 19.00
8. Caring for Adults and Older People Working with Health Services to support older people and adults in need of care
8.1 Performance
56

Priority 8 - Corporate Risk Register - Red RisksCurrent status
RMSCOM04 Avoidable death or serious injury of Client or Staff Member
Priority 8 - Corporate Risk Register - Red Risks
Consequences
DoT Current Quarter v Previous Quarter
Responsible Officer Comments
RMSCOM04 Avoidable death or serious injury of Client or Staff Member
Avoidable serious injury or death of client or staff member. Service delivery impact; Financial/ compensation and reputation impact.
Head of Adult Assessment and Care Management, Head of Communities and Neighbourhood Development; Head of Cultural Services; Head of Crime Reduction.
Risk - What are we planning to do? Service level risk assessment; monitoring by DMT; Directorate H & S Committee to review policy/guidance. Ensure safeguarding plans fully implemented. Regular supervision of staff procedures. To ensure that providers follow appropriate safeguarding procedures. London wide safeguarding procedures are to be implemented immediately. Risk - What have we done to control the risk? Adherence to rigorous H & S practice; current risk assessment; monitoring and audit, all services to comply with HSE requirement. Processes checked against the BS18001 for compliance. Working with Care Homes to improve safeguarding as evidenced by the CQC regulator report. Risk - When is it going to be completed? ASC safeguarding processes has been reviewed - safeguarding procedures are monitored as part of performance management of care providers. Review of all safeguarding activity is underway in preparation for ASC returns. Service plans have been updated for 2010/11 that include updated service level risk registers that reflect actions to address client safeguarding. Recruitment to safeguarding post progressing. One appointment has being made. Pan London Safeguarding survey reports in June. Findings will be actioned where appropriate.
8. Caring for Adults and Older people Developing opportunities for the active participation and engagement of people in the life of the community
8.3 Risk
57

Priority 09: Summary
Performance Indicators
Against Target Jul 11
Direction of Travel Jul 11 v Jun 11
Finance
Variance Jul 11Direction of Travel Jul 11 v Jun 11
Projects
Current Status Aug 11
Direction of Travel Aug 11 v Jul 11
Risk
Current Status Aug 11
Direction of Travel Aug 11 v Jul 11
Areas Requiring Management Attention this Month
Performance Indicators - Monthly
Against Target
Direction of Travel Jul 11 v Mar 11
Direction of Travel Jul 11 v Jun 11
CF/C19 Health of LAC LPI202 Library visits per 1000 pop NI052 Take up of school lunches
Performance Indicators - Quarterly
Against Target
Direction of Travel Jun 11 v Mar 11
Direction of Travel Jun 11 v Mar 11
LPI324 MMR1 Immunisation rates 2nd birthday
Projects - Red
DirectorateCurrent Status
PMSCOM 'Deptford Lounge' - Giffin Street programme
Community
Hot Topics
Priority 09: Active, Healthy Citizens
Sports bursaries awarded Lewisham Council in partnership with Downham Lifestyles Limited and Leisure Connection has awarded sports bursaries to five groups and two young sporting talents in the borough. The grants and bursaries are funded by Lewisham Council, Downham Lifestyles Limited and Leisure Connection. All awards went to groups that are users of Downham Health & Leisure Centre:
Saxon Crown Swimming Club: £500 awarded to this established local swimming club which has trained a number of swimmers who have represented the UK and hold British records. Seals Disabled Swimming Club: £500 awarded to the Seals’ swimming ability groups that enable children and adults to receive tuition relevant to their abilities. The MS Society: £500 awarded to the Lewisham branch of the MS Society to fund days out for members. Lai Chi Nomad Taekwondo: £500 awarded to allow students of all ages to experience martial arts in a safe, friendly and family-oriented environment. Local Nursing home: £500 awarded to run a seated exercise programme, part of Leisure Connection’s outreach programme to cater for those unable to come into the Centre.
Free swimming at Lewisham pools for the next 15 years Lewisham residents aged 16 and under, 60 and over and those who are disabled and receive benefits will continue to swim for free at all Lewisham Council run swimming pools for the next 15 years. Funding for the national free swim scheme was stopped in July 2010 but the Mayor of Lewisham decided that the Council would continue to run the programme until summer 2011. Now, following the signing of contracts with the Council’s leisure centre contractors, Fusion and Leisure Connection, it has been agreed that the free swim programme will continue for the next 15 years. On your bike Lewisham Council and British Cycling are working together to organise a series of bike rides under the banner, Sky Ride Local. The programme started on Sunday 7 August and all rides are led by a British Cycling trained ride leader. Rides organised in Lewisham include Forster Memorial Family Park Ride, Greenwich and Blackheath.
58

CF/C19 Health of LACCF/C19 Health of LAC
Percentage Actual (YTD) Target (YTD) Performance (YTD)
Jul 2010 84.90 90.00 Aug 2010 87.10 90.00 Sep 2010 87.00 90.00 Oct 2010 85.90 90.00 Nov 2010 86.10 90.00 Dec 2010 86.70 90.00 Jan 2011 85.70 90.00 Feb 2011 83.90 90.00 Mar 2011 85.60 90.00 Apr 2011 83.80 91.00 May 2011 84.70 91.00 Jun 2011 84.30 91.00 Jul 2011 81.40 91.00
CF/C19 - CommentResponsible Officer
Performance Comments Action Plan Comments
Head of Access and Support Services
Performance 81.4% of Looked after Children (LAC) received their health and dental assessments in July 2011. This is just below the performance of our statistical neighbours and national average (82.9%).
Performance Action Plan Barriers have been identified with Health partners and streamlining of information exchange has taken place to improve the timeliness of LAC receiving their health assessments. Challenges remain ensuring that children placed outside of the borough receive their health assessments on time, as this requires negotiations with individualhealth providers.
59

LPI202 - Library visits per 1,000 populationLPI202 Library visits per 1000 pop
Number per 1000 Actual (YTD) Target (YTD) Performance (YTD)
Jul 2010 7,662.75 7,707.00 Aug 2010 7,619.31 7,707.00 Sep 2010 7,534.54 7,707.00 Oct 2010 7,415.78 7,707.00 Nov 2010 7,375.27 7,707.00 Dec 2010 7,293.85 7,707.00 Jan 2011 7,269.71 7,707.00 Feb 2011 7,220.96 7,707.00 Mar 2011 7,121.94 7,707.00 Apr 2011 6,953.69 7,795.42 May 2011 6,824.08 7,795.42 Jun 2011 6,662.60 7,795.42 Jul 2011 6,534.72 7,795.42
LPI202 - commentResponsible Officer
Performance Comments Action Plan Comments
Head of Culture
Performance This indicator measures the number of physical visits to libraries as a proportion of the local population. Performance is below target and has shown a decrease of just over 1000 visits per 1000 pop since last year.
Performance Action Plan Although performance may have been adversly affected by the profound changes that took place within the library service (including restructuring, decommissioning and recommissioning of libraries), this year's figures do not yet include data from all Lewisham's libraries including the recently recommissioned community libraries for which data has not yet been inputted. This data will be included in next month's report when more complete figures are likely to show a significant improvement. In addition, the service continues its stock promotion and audience engagement.
60

NI052 - Take up of school lunchesNI052 Take up of school lunches
Percentage Actual (YTD) Target (YTD) Performance (YTD)
Jul 2010 52.70 54.00 Aug 2010 52.70 54.00 Sep 2010 51.50 54.00 Oct 2010 51.00 54.00 Nov 2010 50.60 54.00 Dec 2010 50.70 54.00 Jan 2011 51.00 54.00 Feb 2011 51.50 54.00 Mar 2011 51.70 54.00 Apr 2011 48.70 54.00 May 2011 48.70 54.00 Jun 2011 48.70 54.00 Jul 2011 47.40 54.00
NI052 - commentResponsible Officer
Performance Comments Action Plan Comments
Head of Resources CYP
Performance At 47.4% the overall school meal take-up is below that of our statistical neighbours for this area and this total is affected badly by the low levels in Secondary schools.
Performance Action Plan LBL and Chartwells continue to develop new and exciting menus to encourage secondary school pupils to eat a meal at lunchtime.
61
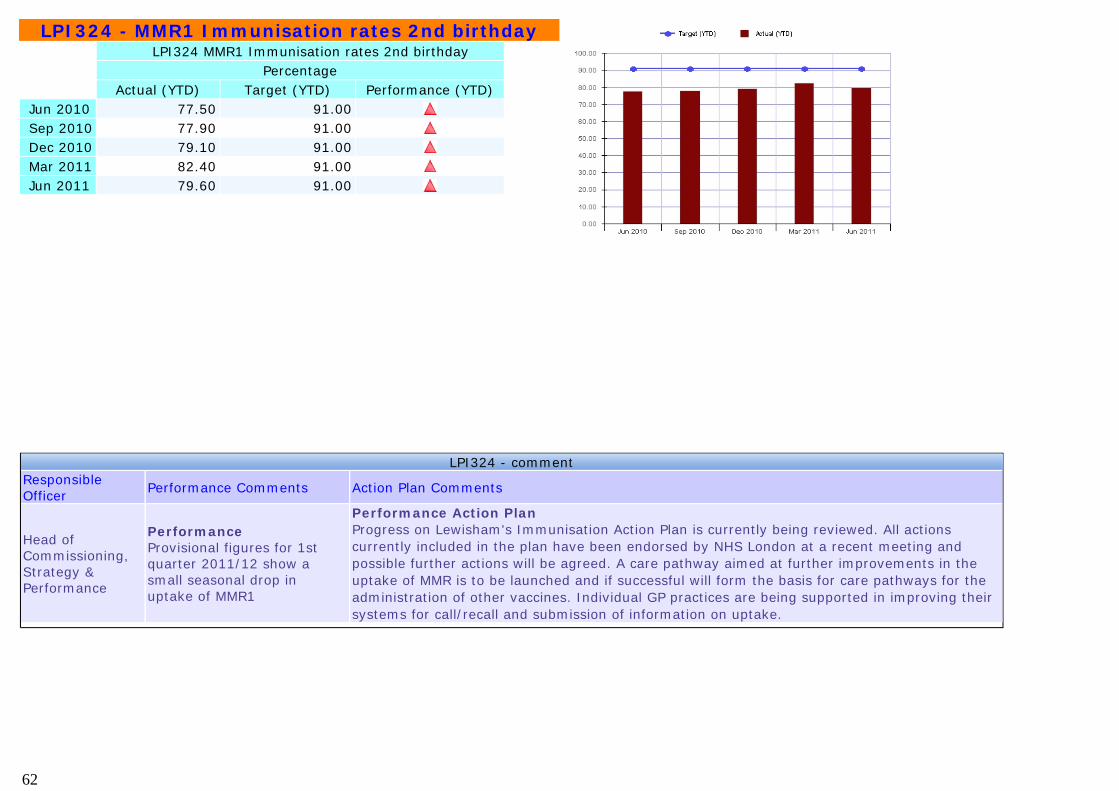
LPI324 - MMR1 Immunisation rates 2nd birthdayLPI324 MMR1 Immunisation rates 2nd birthday
Percentage Actual (YTD) Target (YTD) Performance (YTD)
Jun 2010 77.50 91.00 Sep 2010 77.90 91.00 Dec 2010 79.10 91.00 Mar 2011 82.40 91.00 Jun 2011 79.60 91.00
LPI324 - commentResponsible Officer
Performance Comments Action Plan Comments
Head of Commissioning, Strategy & Performance
Performance Provisional figures for 1st quarter 2011/12 show a small seasonal drop in uptake of MMR1
Performance Action Plan Progress on Lewisham's Immunisation Action Plan is currently being reviewed. All actions currently included in the plan have been endorsed by NHS London at a recent meeting and possible further actions will be agreed. A care pathway aimed at further improvements in the uptake of MMR is to be launched and if successful will form the basis for care pathways for the administration of other vaccines. Individual GP practices are being supported in improving their systems for call/recall and submission of information on uptake.
62

Priority 9 - Monthly Indicators
UnitYTD Jul 11
Target Jul 11
Against Target Jul 11
DoT Last year
DoT Last month
Against Target Jun 11
Against Target May 11
10/11
CF/C19 Health of LAC Percentage 81.40 91.00 LPI202 Library visits per 1000 pop Number per 1000 6,534.72 7,795.42 NI052 Take up of school lunches Percentage 47.40 54.00
Priority 9 - Quarterly Indicators
UnitYTD Sep 10
Target Sep 10
Against Target Sep 10
DoT Last year
DoT Last Quarter
Against Target Mar 10
Against Target Jun 10
09/10
NI053 Prevalence of breastfeeding at 6 - 8 weeks from birth
Percentage 75.90 70.70
Priority 9 - Quarterly Indicators
UnitYTD Dec 10
Target Dec 10
Against Target Dec 10
DoT Last year
DoT Last quarter
Against Target Jun 10
Against Target Sep 10
09/10
NI123 Stopping smoking Rate per 100,000 615.38 590.22
9. Active, Healthy Citizens Leisure, sporting, learning and creative activities for everyone
9.1 Performance
63

Priority 9 - Monthly Contextual IndicatorsUnit YTD Jul 11 YTD Jun 11 YTD May 11 YTD Apr 11 10/11
LPI211a Children free swims Number 14,290.00 9,979.00 7,946.00 4,655.00 54,082.00 LPI211b 60+ free swims Number 3,192.00 1,927.00 1,252.00 510.00 19,659.00
Priority 9 - Quarterly Indicators
UnitYTD Jun 11
Target Jun 11
Against Target Jun 11
DoT Last year
DoT Last quarter
Against Target Mar 11
Against Target Dec 10
10/11
LPI324 MMR1 Immunisation rates 2nd birthday Percentage 79.60 91.00
9. Active, Healthy Citizens Leisure, sporting, learning and creative activities for everyone
9.1 Performance
64

Priority 09 projects
Directorate BudgetEst. completion date
Current Status
PMSCOM 'Deptford Lounge' - Giffin Street programme Community £8.2m Sep 2011 PMSCOM Loampit Vale & Pool Community £2.59m Apr 2013 PMSCOM Leisure 2020 Community £295k Jun 2011 PMSCOM Forest Hill Pools Community £12.53m Sep 2012
9. Active, Healthy Citizens
Leisure, sporting, learning and creative activities for everyone
9.2 Projects
65

Red ProjectsSenior Responsible Officer
Project AimCurrent status
PMSCOM 'Deptford Lounge' - Giffin Street programme
Director of Property and Programme Management
Project Aim The programme will transform the area around Deptford High Street, including a new public library, a range of council services a modern café and a rebuilt Tidemill School.
The contractor is running significantly behind programme and the site is unlikely to be handed over before the end of September. In addition, the contractorhas indicated that they will submit a contractual claim in respect of the delay for additional loss and expense. The Council has already indicated that it doesn't accept the validity of any such claim. As the contractor is in delay liquidated and ascertained damages may be levied but should the claims prove to be valid, these could exceed the damages and unused contingency.
9. Active, Healthy Citizens
Leisure, sporting, learning and creative activities for everyone
9.2 Projects
66

Priority 10: Summary
Performance Indicators
Against Target Jul 11
Direction of Travel Jul 11 v Jun 11
Finance
Variance Jul 11Direction of Travel Jul 11 v Jun 11
Projects
Current Status Aug 11
Direction of Travel Aug 11 v Jul 11
Risk
Current Status Aug 11
Direction of Travel Aug 11 v Jul 11
Hot Topics
Priority 10: Inspiring Efficiency, Effectiveness & Equity
There are no 'Hot Topics' for Priority 10 this month.
67

Areas Requiring Management Attention this Month
Performance Indicators - Monthly
Against Target
Direction of Travel Jul 11 v Mar 11
Direction of Travel Jul 11 v Jun 11
BV008 Invoices paid within 30 days LPI519 Number of FOI requests completed
Red Risks - Corporate Risk Register
Responsible OfficerCurr...Status
RMSCOR02 Resilience of Central ICT infrastructure Executive Director of Resources RMSCOR04 Non compliance with Health & Safety Legislation Chief Executive RMSCOR05 Litigation Risks Head of Law RMSCOR19 Employee Relations Chief Executive
10. Inspiring Efficiency, Effectiveness and Equity
Ensuring efficiency, effectiveness and equity in the delivery of excellent services to meet the needs of the community
68

BV008 % of invoices paid within 30 daysBV008 Invoices paid within 30 days
Percentage Actual (YTD) Target (YTD) Performance (YTD)
Jul 2010 88.82 92.00 Aug 2010 88.61 92.00 Sep 2010 88.15 92.00 Oct 2010 88.30 92.00 Nov 2010 88.40 92.00 Dec 2010 88.31 92.00 Jan 2011 87.20 92.00 Feb 2011 86.78 92.00 Mar 2011 86.42 92.00 Apr 2011 91.16 100.00 May 2011 87.42 100.00 Jun 2011 87.95 100.00 Jul 2011 87.59 100.00
BV008 - commentResponsible Officer
Performance Comments Action Plan Comments
Finance Shared Services Manager
Performance 86.6% of Lewisham's undisputed commercial invoices were paid within 30 days during July which is lower than target and lower than June's performance. The service achieved 87.59% YTD.
Performance Action Plan Detailed analysis continues to be undertaken to identify the budget holders who are late in submitting invoices for payment. Information will be circulated to the departmental managementteams for appropriate action.
69
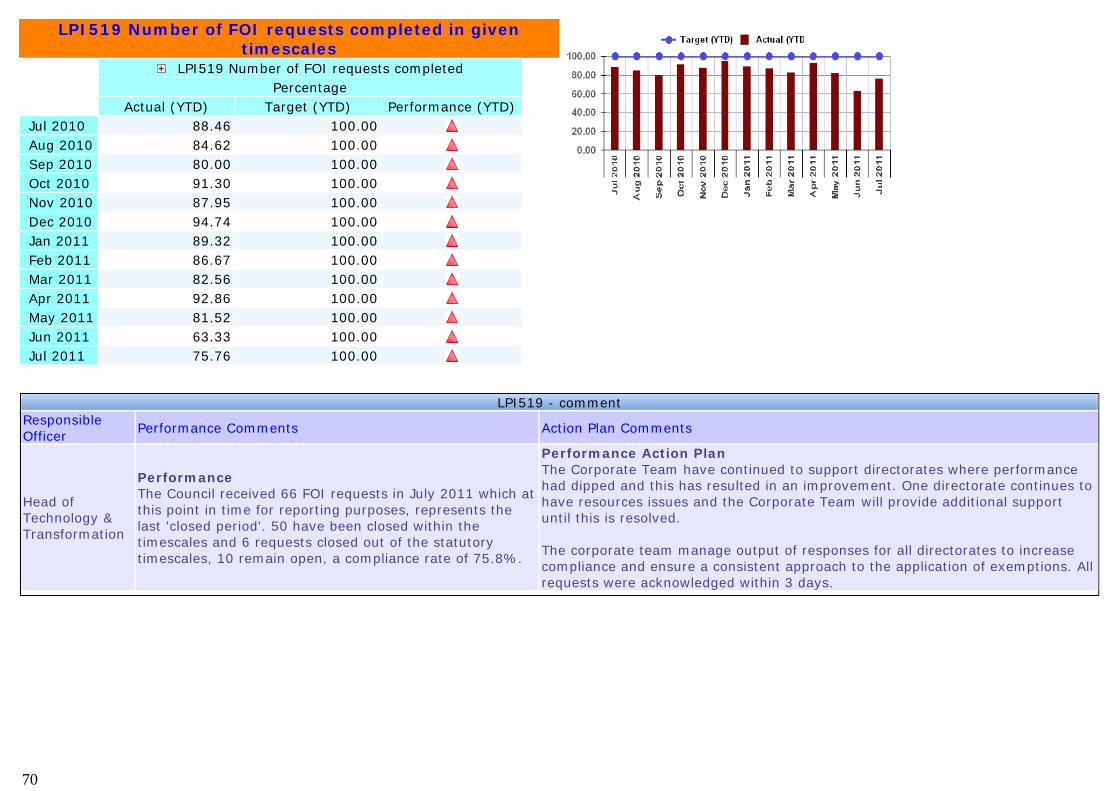
LPI519 Number of FOI requests completed in given timescales
LPI519 Number of FOI requests completed Percentage
Actual (YTD) Target (YTD) Performance (YTD) Jul 2010 88.46 100.00 Aug 2010 84.62 100.00 Sep 2010 80.00 100.00 Oct 2010 91.30 100.00 Nov 2010 87.95 100.00 Dec 2010 94.74 100.00 Jan 2011 89.32 100.00 Feb 2011 86.67 100.00 Mar 2011 82.56 100.00 Apr 2011 92.86 100.00 May 2011 81.52 100.00 Jun 2011 63.33 100.00 Jul 2011 75.76 100.00
LPI519 - commentResponsible Officer
Performance Comments Action Plan Comments
Head of Technology & Transformation
Performance The Council received 66 FOI requests in July 2011 which at this point in time for reporting purposes, represents the last 'closed period'. 50 have been closed within the timescales and 6 requests closed out of the statutory timescales, 10 remain open, a compliance rate of 75.8%.
Performance Action Plan The Corporate Team have continued to support directorates where performance had dipped and this has resulted in an improvement. One directorate continues to have resources issues and the Corporate Team will provide additional support until this is resolved. The corporate team manage output of responses for all directorates to increase compliance and ensure a consistent approach to the application of exemptions. Allrequests were acknowledged within 3 days.
70

Priority 10 - Monthly Indicators
UnitYTD Jul 11
Target Jul 11
Against Target Jul 11
DoT Last year
DoT Last month
Against Target Jun 11
Against Target May 11
10/11
BV008 Invoices paid within 30 days Percentage 87.59 100.00 BV012 Days / shifts lost to sickness (Including
Schools)Number 7.57 8.00
BV016a Disabled employees Percentage ? 5.00 BV017a % Ethnic minorities employees Percentage 32.68 34.00 LPI031 NNDR collected Percentage 123.04 99.40 LPI032 Council Tax collected Percentage 94.04 94.50 LPI500 % staff from ethnic minorities recruited at
PO6 and abovePercentage ? 25.00
LPI519 Number of FOI requests completed Percentage 75.76 100.00 LPI537 Council jobs gained by young people under 25
as a % of junior level appointments (Sc1-Sc5)Percentage ? 27.00
LPI726 Percentage of calls answered by the call centre within 15 seconds
Percentage 87.79 91.00
LPI755 Percentage of customers with appointments arriving on time seen within their appointed time
Percentage 90.01 95.00
NI181 Time taken to process Housing Benefit/Council Tax Benefit new claims and change events
Days 6.02 8.00
10. Inspiring Efficiency, Effectiveness and Equity Ensuring efficiency, effectiveness and equity in the delivery of excellent services to meet the needs of the community
10.1 Performance
71
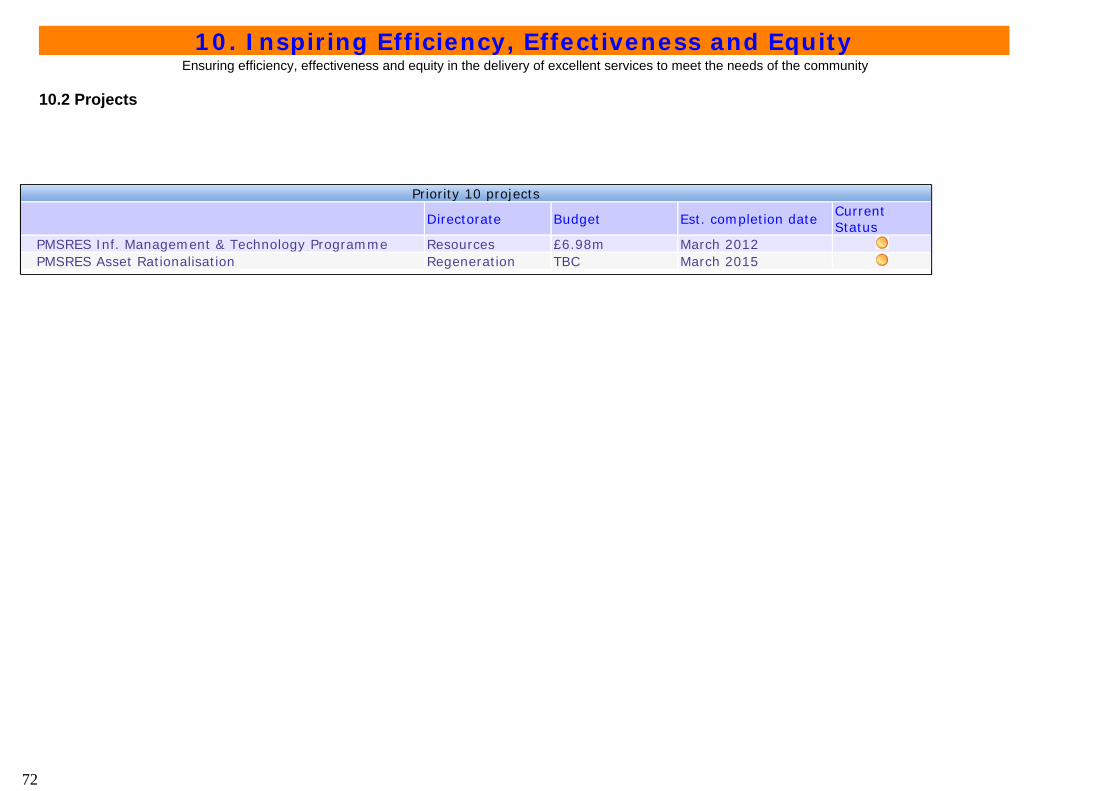
Priority 10 projects
Directorate Budget Est. completion dateCurrent Status
PMSRES Inf. Management & Technology Programme Resources £6.98m March 2012 PMSRES Asset Rationalisation Regeneration TBC March 2015
10. Inspiring Efficiency, Effectiveness and Equity Ensuring efficiency, effectiveness and equity in the delivery of excellent services to meet the needs of the community
10.2 Projects
72

Priority 10 - Corporate Risk Register - Red RisksCurrent status
RMSCOR02 Resilience of Central ICT infrastructure
Priority 10 - Corporate Risk Register - Red Risks
Consequences
DoT Current Quarter v Previous Quarter
Responsible Officer
Comments
RMSCOR02 Resilience of Central ICT infrastructure
Risk - What are the worst consequences of the risk? Breakdown in service/ performance/ quality delivery. Additional costs. Contractual liability. Litigation. Loss of reputation. Decreased productivity.
Executive Director of Resources
Risk - What are we planning to do? Introduce external device encryption to 1000 priority users. Deploy MSMDM for mobile device management. Recent problems with telephone resolved and apparent stability achieved, but need to monitor closely to assure that this is sustainable. Extensive programme of archiving and behavioural control progressing. Data Centre move February 2011 was completed satisfactorily. Risk - What have we done to control the risk? Consistent & Regular Monitoring of storage headroom and monitoring and maintenance of network resources. Proactive security approach. Disaster recovery plan/emergency plan in place to provide shadows of all main departmental and corporate systems from alernative site. Back-up facilities in place. Anti-Virus systems updated. Housekeeping maintained. Project completed to ensure no further risk of catastrophic power loss. Risk Notes Consistent & Regular Monitoring of storage headroom and monitoring and maintenance of network resources. Proactive security approach. Disaster recovery plan/emergency plan in place to provide shadows of all main departmental and corporate systems from alternative site. Back-up facilities in place. Anti-Virus systems updated. Housekeeping maintained. Project completed to ensure no further risk of catastrophic power loss. Risk focused on resolving telephony issues now the main data centre move is complete. Enhanced SLA and additional staffing injections from suppliers.
10. Inspiring Efficiency, Effectiveness and Equity
Ensuring efficiency, effectiveness and equity in the delivery of excellent services to meet the needs of the community
10.3 Risk
73

Priority 10 - Corporate Risk Register - Red RisksCurrent status
RMSCOR04 Non compliance with Health & Safety Legislation
Priority 10 - Corporate Risk Register - Red Risks
ConsequencesDoT Current Quarter v Previous Quarter
Responsible Officer
Comments
RMSCOR04 Non compliance with Health & Safety Legislation
Risk - What are the worst consequences of the risk? Death or injury to staff or public. Criminal prosecution. Civil litigation. Reputation damage. Costs. Service stopped/closed. Lost time.
Chief Executive
Risk - When is it going to be completed? Significant progress is being made with Resources, Customer Services and Regeneration Directorates having documentation in place considered to be compliant with BSOHSAS18001 and Community Services expected to achieve the same level very soon. CYP Directorate have made significant progress but further work is needed to meet the standard. Risk Notes The Policy is complete and presentation, communication and training of managers has been implemented. Recommendations arising from the external review are being implemented
10. Inspiring Efficiency, Effectiveness and Equity
Ensuring efficiency, effectiveness and equity in the delivery of excellent services to meet the needs of the community
10.3 Risk
74

Priority 10 - Corporate Risk Register - Red RisksCurrent status
RMSCOR05 Litigation Risks
Priority 10 - Corporate Risk Register - Red Risks
Consequences
DoT Current Quarter v Previous Quarter
Responsible Officer
Comments
RMSCOR05 Litigation Risks
Risk - What are the worst consequences of the risk? Litigation. Major Projects Delayed. Negative publicity. Costs. Budget implications. Reputation damage. Higher insurance costs. Lost staff time.
Head of Law
Risk - What are we planning to do? Robust Systems for ensuring professional legal service and legal advice in decision making. Compulsory process for checking decision reports have adequate and timely advice. New legal developments reported to EMT regularly. Risk - When is it going to be completed? Continue with agenda planning & reports to EMT and deliver training programme throughout 10/11. Review Potential Liabilities Risk Notes Several Significant Cases Pending.
10. Inspiring Efficiency, Effectiveness and Equity
Ensuring efficiency, effectiveness and equity in the delivery of excellent services to meet the needs of the community
10.3 Risk
75

Priority 10 - Corporate Risk register - Red RisksCurrent status
RMSCOR19 Employee Relations
Priority 10 - Corporate Risk register - Red Risks
Consequences
DoT Current Quarter v Previous Quarter
Responsible Officer
Comments
RMSCOR19 Employee Relations
Risk - What are the worst consequences of the risk? Potential increase in disputes and grievances. Increased staff turnover. Recruitment difficulties. Diversion of management attention.
Chief Executive
Risk - What are we planning to do? Continue engagement with Trade Unions and staff consultation programme. Clear communications/consultation with staff on budget proposals and staffing implications. Risk - When is it going to be completed? Regular and ongoing review. Risk Notes Impending savings process will need to be sensitively managed. Risk around consultations for change, in particular for pensions and terms and conditions proposals.
10. Inspiring Efficiency, Effectiveness and Equity
Ensuring efficiency, effectiveness and equity in the delivery of excellent services to meet the needs of the community
10.3 Risk
76

Appendix A - Performance Scoring Methodology
Together we will make Lewisham the best place in London to live, work and learn
Performance Performance can be measured using two methods. Firstly, current performance is appraised against past performance to assess “direction of travel” – is it improving or worsening? Secondly, performance can be measured against a norm, standard or target. Areas for management attention are determined by considering performance against the following 2 elements - Against target and Direction of Travel (DoT) against the previous years outturn (in this case March 2011). If both of these elements are red we consider that the indicator should be flagged as an area for management attention. The Council has aims and objectives as an organisation responsible for securing local public services. But it also has wider aims to work in partnership with other organisations (in the public, private and community sectors) to improve Lewisham as a place to live. It is therefore essential that our PIs not only measure our organisational and service performance against the Council’s corporate priorities but also evaluate our efforts to achieve improvements through partnership working. These wider aims are described in Lewisham’s Sustainable Community Strategy. A summary on performance can be found in the ‘Overall Performance summary’ at front of the Executive Summary report. Data Quality Policy The Council has a Data Quality Policy which is adhered to and sets out the corporate data quality objectives. Directorates also have a statement of data quality and a data quality action plan. In addition to this, a corporate data quality risk register is maintained and reported monthly to the Strategic Performance Improvement Group (SPIG).
77
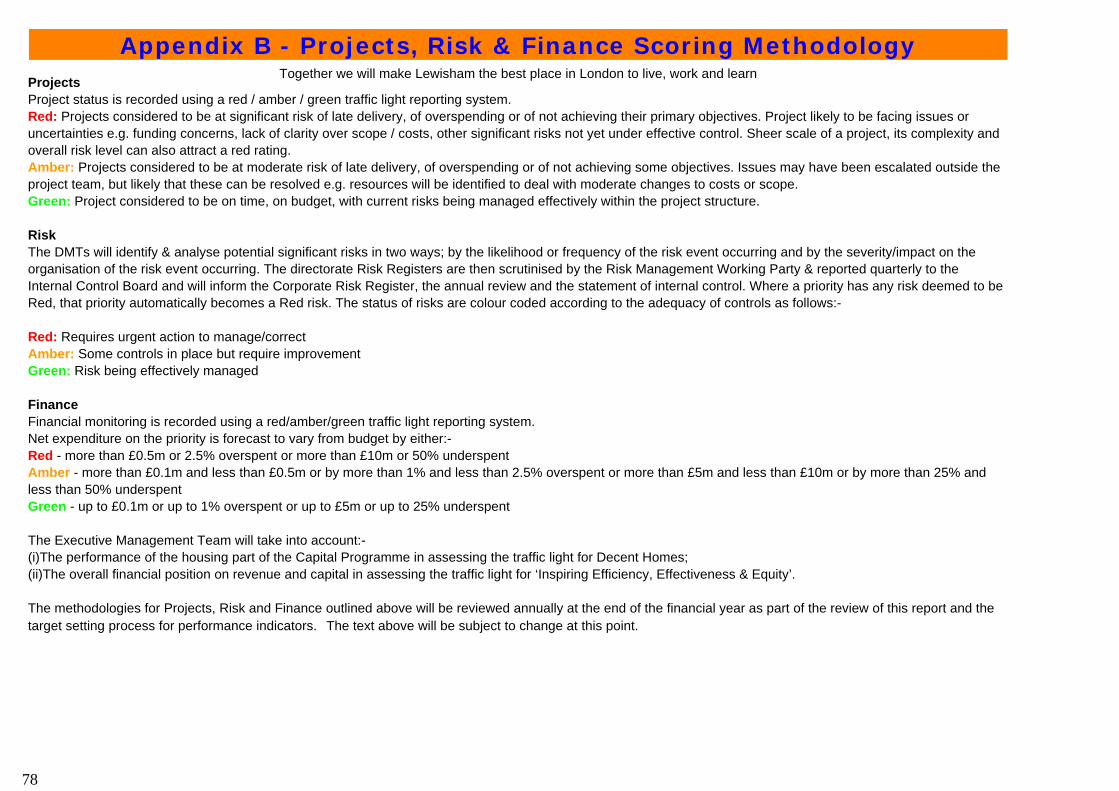
Appendix B - Projects, Risk & Finance Scoring Methodology
Together we will make Lewisham the best place in London to live, work and learn Projects Project status is recorded using a red / amber / green traffic light reporting system. Red: Projects considered to be at significant risk of late delivery, of overspending or of not achieving their primary objectives. Project likely to be facing issues or uncertainties e.g. funding concerns, lack of clarity over scope / costs, other significant risks not yet under effective control. Sheer scale of a project, its complexity and overall risk level can also attract a red rating. Amber: Projects considered to be at moderate risk of late delivery, of overspending or of not achieving some objectives. Issues may have been escalated outside the project team, but likely that these can be resolved e.g. resources will be identified to deal with moderate changes to costs or scope. Green: Project considered to be on time, on budget, with current risks being managed effectively within the project structure. Risk The DMTs will identify & analyse potential significant risks in two ways; by the likelihood or frequency of the risk event occurring and by the severity/impact on the organisation of the risk event occurring. The directorate Risk Registers are then scrutinised by the Risk Management Working Party & reported quarterly to the Internal Control Board and will inform the Corporate Risk Register, the annual review and the statement of internal control. Where a priority has any risk deemed to be Red, that priority automatically becomes a Red risk. The status of risks are colour coded according to the adequacy of controls as follows:- Red: Requires urgent action to manage/correct Amber: Some controls in place but require improvement Green: Risk being effectively managed Finance Financial monitoring is recorded using a red/amber/green traffic light reporting system. Net expenditure on the priority is forecast to vary from budget by either:- Red - more than £0.5m or 2.5% overspent or more than £10m or 50% underspent Amber - more than £0.1m and less than £0.5m or by more than 1% and less than 2.5% overspent or more than £5m and less than £10m or by more than 25% and less than 50% underspent Green - up to £0.1m or up to 1% overspent or up to £5m or up to 25% underspent The Executive Management Team will take into account:- (i)The performance of the housing part of the Capital Programme in assessing the traffic light for Decent Homes; (ii)The overall financial position on revenue and capital in assessing the traffic light for ‘Inspiring Efficiency, Effectiveness & Equity’. The methodologies for Projects, Risk and Finance outlined above will be reviewed annually at the end of the financial year as part of the review of this report and the target setting process for performance indicators. The text above will be subject to change at this point.
78


