Monthly KPIs Tracker A New Store Excellence...
19
Monthly KPIs Tracker Research Partner A New Store Excellence Scorecard
-
Upload
truongdien -
Category
Documents
-
view
215 -
download
0
Transcript of Monthly KPIs Tracker A New Store Excellence...

Monthly KPIs Tracker
Research Partner
A New Store Excellence Scorecard

Introduction
Today, with thousands of stores and a highly competitive omnichannel environment, retail is tougher than ever. Margins can be razor thin, customers have digital access to pricing and other information and rapidly shifting demographics constantly impact product mix and priorities. And almost anybody with a letter of credit can source cheap goods in tariff-free countries with low wage or few environmental standards. This has created operational challenges at every juncture.
For retailers to stay ahead, every detail of customer behaviour and operations must be regularly monitored in real time. To do this, retailers must continually augment and re-tool existing technologies. But priorities can be lopsided. Investments into store systems reporting operational insights consistently rank lower in order of importance when compared to those that measure merchandising, marketing, supply chain, consumer and financial insights1.
Despite many technological advances, most (if not all) of in-store decision making relies on legacy systems and store transaction-based key performance indicators (KPIs). These systems do not operate in real time and use only comp sales and gross margins to measure overall performance. But comp sales and gross margins are the end results. They do not indicate what is currently taking place in the stores. By constantly monitoring customer path-to-purchase, operational and merchandising issues, through real-time actionable data insights retailers can make immediate changes and have a better chance of staying in the black.
Brick and mortar remains the perennial mother ship, accounting for the bulk of total retail. While retailers say they are striving to improve store performance, are they evaluating themselves according to the right set of parameters?
This report will help retailers discover some new and upcoming KPIs and performance management strategies. Such KPIs and strategies can help address traffic volatility, increase inventory visibility, improve customer engagement, understand the path-to-purchase, reduce shrink, and better the employee engagement, assortment localization and overall operational performance.
1 EKN Retail Analytics Surveys, 2013, 2014 and 2015

The rise of omnichannel retailing has meant that inventory optimization2, replenishment and store-based
online order fulfilment have become major operational challenges at the store level. Customers expect to
be able to find products and information much faster than before. According to our data, the issue that
frustrates the “omnishopper” the most is inventory3, not pricing.
For years, many retailers operated “cookie cutter” business models in which every store in the chain was the same,
particularly when it came to layout and product mix. They paid little attention to individual store performance
management.
Today, many retailers localize inventory and other store execution tasks by location. This has led to a need for
more information about shoppers, inventory availability, and shrink performance of individual locations. But
upgrading of technological infrastructure has been slow, as has adoption of automation standards around store
performance processes. The end results include chronically low customer satisfaction, out-of-stocks, high shrink
and inconsistent execution of merchandising, pricing and promotions strategies.
To be successful at localization, retailers need to automate and update operational insights and store performance
standards. The resulting information must be provided in a uniform way.
Let us examine four key issues that necessitate the need for a new and improved KPI and performance culture:
2 Use of inventory data and insights for enhanced inventory visibility, accuracy and availability3 2015 MasterCard Omnishopper Report
The Need for New KPIs
1

4 2015 IHL Retailers & The Ghost Economy report5 EKN 2nd Annual Future of Stores Survey, 20146 EKN Private Label Sourcing Survey, 20167 EKN 2016 Order Fulfillment Survey8 EKN Customer Context Power Survey, 2015
The need for increased customer traffic, retention and acquisition is a critical issue that can prompt
retailers to adopt new KPIs to measure success. Many retailers are experiencing challenges related to
shopper traffic. Specifically, nearly 50% are unable to predict their customer traffic8, thereby impeding
proper planning and forecasting of operational tasks and the balance between tasks and customer service.
This impacts their bottom line.
For 60% of retailers, inventory is an area that is adding cost to the store’s P&L due to the increase in
merchandise unit cost6.
Fifty percent of retailers’ fulfill more than 1000 online customer orders from stores every
week7. The retailer’s increased focus on online consumer order management and fulfillment at store
level has made this a location’s biggest expense. This has created an immediate need to address
inventory-related inefficiencies.
Just 40% of retailers consistently manage inventory performance and turnover metrics at store level5
Globally, out-of-stocks cost retailers a staggering
$630 billion in annual lost sales4
2

Employee engagement plays a critical role in generating effective store sales, service and operations.
Workforce is an integral part of efficiently running the store’s back-end (inventory, returns, order management,
loss prevention etc.) and front-end customer service operations. The integration of physical and digital assets
is creating added stress for associates who are already performing multiple tasks.
In 2016, 50% of retailers reported increase in online order
fulfillment, or ship-from-store activity9. This means more human
resources are being allocated to deal with back-office functions
like inventory handling, store-to-store transfers and pick, pack
and ship. These responsibilities are being added to employees’
traditional day-to-day functions, including inventory management,
pricing changes, planogram moves and other operational tasks.
With associates being stretched in so many directions, retailers
worry that customer service could be affected.
50%
of retailers reported increase in online order fulfillment, or ship-from-store activity9
It is well known that digital and physical channels are having greater influence on each other. Almost
50% of in-store sales are influenced by digital channels10. Customers use digital resources to find additional
information regarding inventory availability, product details, promotions and pricing. These are the leading
reasons for the cross-over influence from digital to stores. But it is becoming increasingly difficult to accurately
measure store sales independent of digital sales. With the two so melded together, some retailers, including
Macy’s, have stopped reporting individual channel sales in their annual reports.
3
4
9 EKN’s 3rd Annual Future of Stores Benchmark, 201510 Deloitte Navigating the New Digital Divide Report

3 Pillars to Measure Store Performance
The need to measure new KPIs is clear. But retailers need to decide which KPIs they need to measure and
report back to their stores for performance management. EKN has defined three pillars of retail operations
under which new and improved KPIs can be measured:
Enabling store execution
effectiveness through empowered
associates. The
result is increased
productivity
and customer
engagement leading
to increased sales
and margins.
Ensuring inventory availability,
visibility and accuracy for
uniform product
availability across
all selling channels.
Understanding customer path-to-purchase to
drive engagement,
conversions and
brand message
penetration.
01 02 03
Understanding Customer Path-to-Purchase
In the era of digital devices and big data, retailers are trying to better understand online and offline customer
behaviors. The ultimate goal of any customer path-to-purchase insights strategy is to improve customer shopping
experiences by delivering personalized tailored messages, product suggestions and promotional offers via any
channel accessible to customers. Implementing the means to capture critical data and developing metrics and
KPIs for varied stages in the customer path-to-purchase facilitates the process. As a result, retailers can ensure
that store messaging, product placement, inventory availability and customer service does not break down, thus
guaranteeing a seamless customer buying journey.
Outlined below are the three elements needed to create that seamless, more personalized journey:
Refers to a store experience in which multiple, customer-owned mobile devices can operate simultaneously.
Devices may be used for inventory look-up, product information, loyalty information, order look-up, product
availability and price comparisons.
Some new KPIs that help retailers manage the in-store, device-connected experience include:
• Number of in-store mobile check-in: This KPI is used to measure how many people checked in via
mobile devices upon entering a store or while shopping. This allows retailers to track the engagement
of their mobile app/website/social sites in real time.
Device connected experience

• Check-in to conversion ratio: Getting customers into the store is only half the battle. The other half
is persuading them to buy something. This ratio keeps track of how many customers entered the store
and checked-in via mobile but did not buy a product compared to the number of customers that did
buy an item.
• Digital-physical loyalty redemption: Retailers strategize to create the best in-store loyalty programs.
But they often fail to evaluate the redemption levels of loyalty points/deals across the digital and physical
store experience. If a customer is not redeeming loyalty points, it means he/she is not engaged with the
brand overall.
• Digital/physical coupon redemption rates: Coupon redemption measures the number of coupons
(serialized or otherwise) issued digitally and/or at physical locations versus the number redeemed by
customers. For many shoppers, coupons end up in “spam folders,” which could lead to failure of the
promotional campaign.
Sensory data
Refers to various types of data: embedded machine data (e.g. Kiosk, POS, cameras, web log, servers etc.);
integrated machine-to-machine data (mobile POS, mobile geo positioning etc.) and multi-sensory data (e.g.
EAS, Bluetooth, RFID, Wi-Fi, Beacons etc.).
In an “anytime, anywhere” retail environment, such sensory and device data can be used to generate two-
way product, price, brand, place (store navigation) or offer-related messaging and other activities between
retailers and customers’ digital devices. This can be done before or at the time of a purchase. This data can
also direct store teams to fill empty shelves and fixtures when radio frequency identification (RFID) tagged

• Average linger time: the amount of time a customer spends in front of store shelf, fixture or product
display. If a customer is spending more than the average time, it should be a trigger for the retailer to
send a store associate to assist the customer.
• Dwell time: the measure of customer engagement owing to factors such as store presentation,
inventory effectiveness and associate engagement. It accounts for total time spent by a customer in a
particular area of the store.
• Average engagement time: the time a store associate is spending with the customer. It is a crucial
metric to measure. Spending too little time might not help customers. But spending too much time with
a single customer can lead to less engagement with other customers and lost sales opportunities.
• Predictive shopper traffic: the number of shoppers who are likely to enter a store or walk by the front
of a store. A deeper analysis could help determine the peak and non-peak hours of customer traffic and
map the number of employees or inventory related tasks to match the traffic. For example, if maximum
foot traffic in front of the store is expected on Friday, it might be a good day to put out new inventory
or staff-up accordingly.
items are moved or sold.
A few examples of KPIs that use embedded machine and sensory data in the store include:
• Customer recency/ frequency: the regularity of customer store visits. Repeat customers are a good
source of recurring revenue. They are easy to lure back in the store and tend to spend more there
than first time customers. This increases the probability of increased sales transaction amounts.
Measuring customer frequency can help retailers determine what percentage of consumers are repeat
customers. Any drop in this metric is a call for action for retailers to review their customer relationship
and engagement programs.
• Loyalty point redemption: the number of points/offers rolled out or communicated to a customer via
a personalized campaign versus the number of points/offers redeemed by customers. Although this
is similar to coupon redemption metrics, it is more significant than generic coupon redemption due to
higher expected sales transaction amounts.
• Visit to buy ratio: the number of visits against the number of consumers who bought merchandise. It
differs from check-in to conversion ratio since it measures the number of times shoppers visited after
a retailer sent them personal content.
Personalization and CRM
Refers to personalization data collected from various store systems and sensors (consumer mobile, loyalty
cards, POS, EAS, Wi-Fi, Video, Bluetooth, RFID, others). This data helps identify a customer and/or a location
and tailor messaging, promotions or products to that customer. It can also target a group of shoppers who
have similar preferences.
Below are examples of KPIs that have been developed using personalization and CRM data:

To get a deeper understanding of the consumer buying journey, please review first e-book in the series,
Deciphering the Customer’s Buying Journey.
• Cross-sell/upsell: increase in sales transaction amounts due to suggested selling practices. Gaining
insights such as customer buying history, wish list, items in cart etc. can help retailers make relevant
suggestions for supplementary or complementary products. This can increase cross-sell/upsell
opportunities.
• Engagement to conversion: the number of shoppers greeted and converted into buyers. Customer
engagement is not enough, what is important is the customer conversion rate. In order to have maximum
conversions, retailers need to convert consumer insights into meaningful conversations, information,
assisted offers and promotions.

Inventory Availability, Visibility & Accuracy
Inventory is the lifeblood of any retailer that operates physical and/or digital channels. 57% of retailers plan
to have a single view perspective of their inventory in 2016 and 201711. Measuring inventory accuracy and
maintaining inventory visibility and availability are key factors in providing a great experience for both in-store
and omnichannel shoppers.
Here are some examples of some innovative KPIs or metrics that can support inventory visibility, availability and
accuracy in the store:
• Allocation effectiveness: refers to location-based inventory as it
relates to selling efficiencies in the store. It is the sell through rate based
upon the amount of items sold in terms of the amount of items originally
on-hand in the individual store. This can be evaluated as items sold at
full price and the number of items sold at the markdown price.
• Fulfillment cost/unit: calculates the average cost accrued by the retailer to fulfill an order. Fulfillment cost
is important to calculate since understated fulfillment cost can lead to inaccurately reported higher profit per
order.
• Inventory buffer: refers to the amount of safety stock inventory kept to meet online order fulfillment demand
within the store. Such inventory is allocated to the store in addition to the strategic stock level for key selling
items. This buffer inventory can also protect a retailer in case a supplier fails to deliver merchandise at the
scheduled time.
online orders are fulfilled fromstore each week.
More than
700
11 EKN 2016 Executing Omnichannel Profitability Survey
In today’s high-paced, omnichannel world, such cycle counts are needed on a frequent basis for higher volume
categories and controllable shrink strategies. Technologies such as (but not limited to) RFID, smart shelves and
video intelligence can simplify cycle counts for stores. Cycle counts help improve inventory accuracy for store
sales, online order fulfillment or buy online pick-up in store (BOPIS) transactions.
• Identification of pickup or store delivery: refers to scanned inventory information retrieved by the retailer
when a buy online pick-up in-store (BOPIS) or click and collect order is placed.
• Available to promise: depicts the inventory amount which is shown on the system versus actual inventory
on-hand. Retailers can improve this by adopting real-time inventory updates to bring available inventory
amounts further aligned with actual counts.
• Total units per cycle count: identifies the on-hand inventory units available as a result of an inventory
auditing procedure. A small subset of inventory, in a specific location or merchandise category, is counted on
a regular frequency to maintain accurate inventory counts.
• In-stock, inventory turn, order cycle time, lead time: while in-stock is a fundamental KPI which is being
used by retailers to measure inventory performance, inventory turn measures the number of times inventory
is sold in a given time period. Order cycle time calculates the period between placing of one set of orders and
the next. Lead time refers to time it takes for the supplier to deliver the stock once the order is placed.
To get more insights on inventory optimization, please review our second eBook in the series, Inventory
Optimization: A Key Ingredient for Increasing Customer Satisfaction .
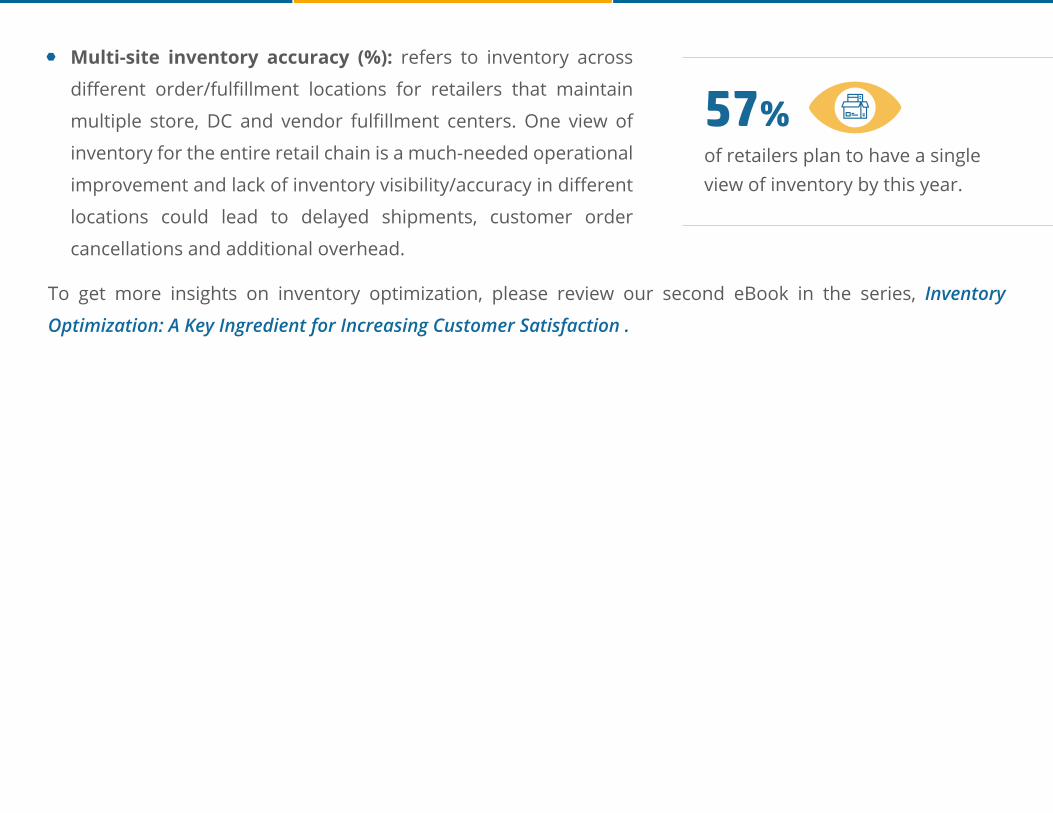
• Multi-site inventory accuracy (%): refers to inventory across
different order/fulfillment locations for retailers that maintain
multiple store, DC and vendor fulfillment centers. One view of
inventory for the entire retail chain is a much-needed operational
improvement and lack of inventory visibility/accuracy in different
locations could lead to delayed shipments, customer order
cancellations and additional overhead.
of retailers plan to have a singleview of inventory by this year.
57%

Associates Drive Effectiveness
Employee engagement and optimum labor hour utilization are effective
tools for driving consistent execution, associate productivity levels, sales
uplift and customer satisfaction. Aligning schedules with skills, tasks
and shopper traffic is the most crucial area when it comes to improving
employee12 and customer engagement. Retailers spend 70% of their labor
hours dealing with inventory and related operational functions and 30% on
customer service. Every minute of every hour saved or re-directed towards
customer service can add millions to a retailer’s annual revenue. According
to EKN data, customer conversion rates are 25 times higher when associates personally assist in-store shoppers
compared to shopper conversion driven through personalized email promotions13.
Below are some KPIs that are proving effective in addressing various operational and customer service issues:
• Engagement rate: measures the level of engagement that a consumer is receiving from a store associate at
any given point in time after the shopper enters the store.
• Schedule effectiveness: refers to managing labor shifts in the optimum way in order to maintain a balance
between staffing requirements during peak hours versus off-peak hours.
• Customer satisfaction: indicates how well products/services supplied by a retailer meet or surpass the
customers’ expectations. Customer satisfaction is important because it provides retailers with a metric that
can be used to manage and improve revenues through satisfied consumers.
12 EKN 2015 Employee Engagement and Empowerment Survey13 EKN 2015 Personalization Framework Survey
‘Aligning schedules with skills and customer needs’ is one of the top focus areas to improve employee engagement.
• Labor effectiveness: measures the utilization, performance, and quality of the workforce and its impact on
revenues.
• Labor cost to sales: calculates the percentage of labor cost compared to a retailer’s total sales. This is an
ideal ratio to use in order to stay abreast of escalating labor costs.
• Labor turnover ratio: refers to how many employees in an organization leave their position in a designated
time period, usually over a 12 month time frame. A labor turnover metric is used to evaluate the stability of
a retailer’s workforce.
• Employee satisfaction: measures whether employees are content
and feel fulfilled. High employee satisfaction can improve employee
retention and customer engagement.
• Conversation to conversion ratio: calculates actual sales
conversion based on the number of customers greeted and
engaged by associates. This metric is designed to help retailers
convert more passive browsers to active buyers.
times more effective customer
conversion in case of in-store
associate recommendations with
assisted-selling strategies as compared
to personalized email promotions.
25x

Conclusion
Retailers need to re-think store performance management and excellence. The blending of much-needed
real-time operational data and customer science allows them to better manage this dynamic and somewhat
unpredictable business. But most store performance management paradigms are legacy in nature and ill-
equipped to handle new customer and operations related technology transformation projects.
As store processes and technologies evolve, all retailers can address the gaps within store metrics, KPIs and
related performance improvement processes that touch store employees and shoppers every day. The three
key pillars of such a strategy include (1) understanding store customer path-to-purchase, (2) ensuring inventory
availability, visibility and accuracy and, (3) enabling store execution effectiveness through empowered and
engaged associates. Retailers can apply all three pillars to create a holistic performance management strategy
and a better balance between sales and operational effectiveness.
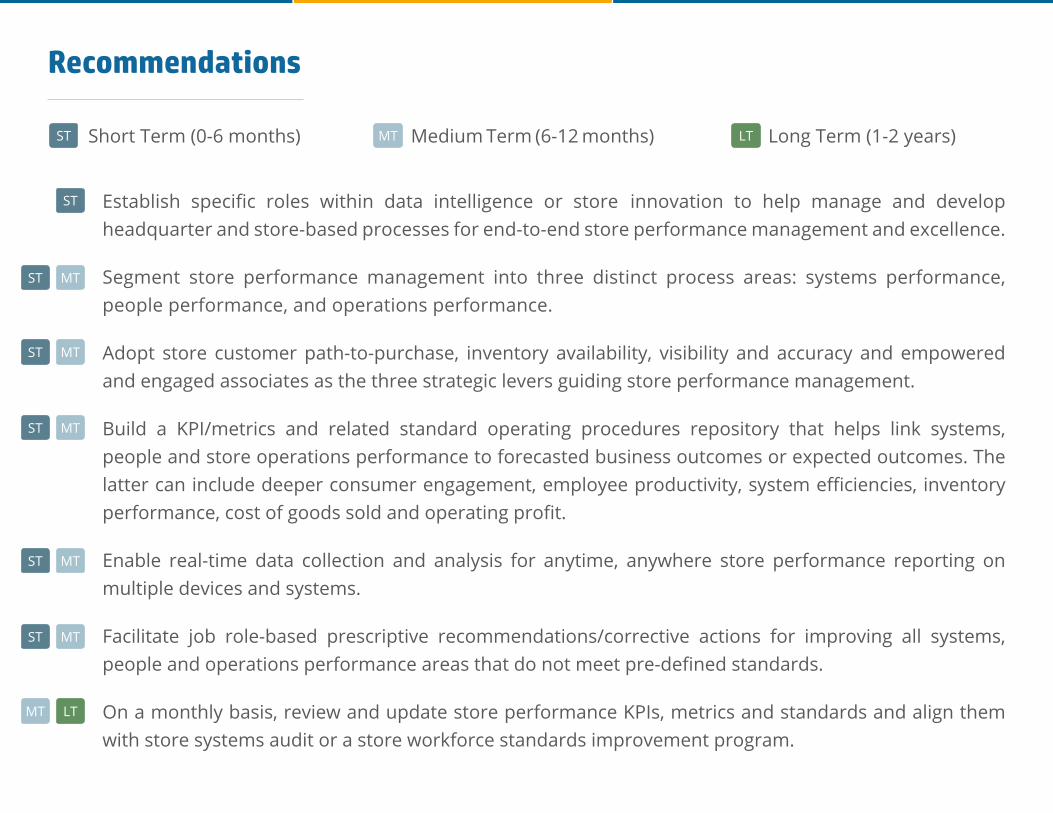
Establish specific roles within data intelligence or store innovation to help manage and develop headquarter and store-based processes for end-to-end store performance management and excellence.
Segment store performance management into three distinct process areas: systems performance, people performance, and operations performance.
Adopt store customer path-to-purchase, inventory availability, visibility and accuracy and empowered and engaged associates as the three strategic levers guiding store performance management.
Build a KPI/metrics and related standard operating procedures repository that helps link systems, people and store operations performance to forecasted business outcomes or expected outcomes. The latter can include deeper consumer engagement, employee productivity, system efficiencies, inventory performance, cost of goods sold and operating profit.
Enable real-time data collection and analysis for anytime, anywhere store performance reporting on multiple devices and systems.
Facilitate job role-based prescriptive recommendations/corrective actions for improving all systems, people and operations performance areas that do not meet pre-defined standards.
On a monthly basis, review and update store performance KPIs, metrics and standards and align them with store systems audit or a store workforce standards improvement program.
ST
ST
ST
ST
ST
ST
MT
MT
MT
MT
MT
MT
Short Term (0-6 months) Medium Term (6-12 months) Long Term (1-2 years)ST MT LT
Recommendations
LT

Our research agenda is developed using inputs from the end user community and the end user community ex-tensively reviews the research before it is published. This ensures that we inject a healthy dose of pragmatism into the research and recommendations. This includes input of what research topics to pursue, incorporating heavy practitioner input – via interviews etc., and ensuring that the blend of research takeaways are oriented towards a real-world, practical application of insights with community sign-off. For more information, visit www.eknresearch.com. Email us at [email protected]
Tyco Retail Solutions is a leading provider of integrated retail performance and security solutions, deployed today at more than 80 percent of the world’s top 200 retailers. Customers range from single-store boutiques to global retail enterprises. Operating in more than 70 countries worldwide, Tyco Retail Solutions provides re-tailers with real-time visibility to their inventory and assets to improve operations, optimize profitability, and create memorable shopper experiences.
The Tyco Retail Solutions portfolio for retailers is sold direct through Tyco businesses and authorized business partners around the world. For more information, please visit TycoRetailSolutions.com or follow us on Linke-dIn, Twitter, and our YouTube channel.
Disclaimer:
EKN does not make any warranties, express or implied, including, without limitation, those of merchantability and fitness for a particular purpose. The information and opinions in research reports constitute judgments as at the date indicated and are subject to change without notice. The information provided is not intended as financial or investment advice and should not be relied upon as such. The information is not a substitute for independent professional advice before making any investment decisions.
Copyright © 2016 EKNRegistered Office: 4 Middlebury Blvd. Randolph, NJ 07869
Ph: (973) 607 1300