Monthly Financial Report - Arizona State University · PDF fileMonthly Financial Report ......
24
City of Phoenix, Arizona Monthly Financial Report August 2011
Transcript of Monthly Financial Report - Arizona State University · PDF fileMonthly Financial Report ......

City of Phoenix, Arizona
Monthly Financial Report
August 2011


-1-
Monthly Financial Report – August 2011 Executive Summary
Budget
• The budget amounts in this report represent the official adopted budget, as approved by the City Council, for fiscal year 2011-12.
Revenues
• Local sales taxes and the City’s portion of state sales tax comprise the major portion, approximately 55 percent, of estimated General Fund revenues. As of August 2011, local sales taxes were up $3.3 million compared to the prior year-to-date General Fund revenues. However, state shared sales taxes were down $496 thousand compared to the prior year-to-date. In addition, state shared income taxes were also down compared to the prior year-to-date by approximately $3.6 million. (see pages 12-13)
Expenditures
• Citywide year-to-date expenditures for the month of August 2011 are $12.7 million less than year to date expenditures for August 2010. This reduction is primarily due to reduced capital spending. (see page 5)
• General Fund expenditures for the first two months of the fiscal year are on
target representing 16.9 percent of the total budget. (see page 3)

General FundsSummary

Summary General Funds
As of August 31(dollars in thousands)
BudgetEstimate2011-12 2011-12 2010-11
Revenues
Local TaxesSales Taxes $ 417,006 $ 68,114 $ 64,831 16.3 % 16.5 %Privilege License Fees 2,465 113 96 4.6 3.9
State Shared TaxesState Sales Tax 110,696 17,535 18,031 15.8 16.1 State Income Tax 122,065 20,331 23,941 16.7 16.7 Vehicle License Tax 48,045 8,180 9,358 17.0 19.4
Primary Property Tax 126,763 (632) (645) (0.5) (0.5) Licenses and Permits 3,270 513 457 15.7 14.8 Cable Communications 9,567 (154) 133 (1.6) 1.4 Municipal Court
Fines and Forfeitures 20,759 3,453 3,568 16.6 16.7 Court Default Fee 1,100 142 152 12.9 13.2
Police 12,598 1,378 2,418 10.9 15.0 Library 1,256 201 215 16.0 17.3 Parks and Recreation 7,102 1,281 1,428 18.0 19.1 Planning & Development 993 140 196 14.1 17.4 Street Transportation 5,124 739 853 14.4 16.2 Fire
Emergency Transportation Service 36,750 6,104 5,725 16.6 15.5 Other 12,462 2,177 724 17.5 5.9
Interest 300 140 55 46.7 16.4 Other Fees and Service Charges 14,890 1,968 1,665 13.2 9.6
Total Revenues $ 953,211 $ 131,723 $ 133,201 13.8 % 13.8 %
2011-12 2010-11
Actual % of Year-to-DateYear-to-Date Estimate Actual
- 2 -
Summary General Funds
As of August 31(dollars in thousands)
BudgetEstimate2011-12 2011-12 2010-11
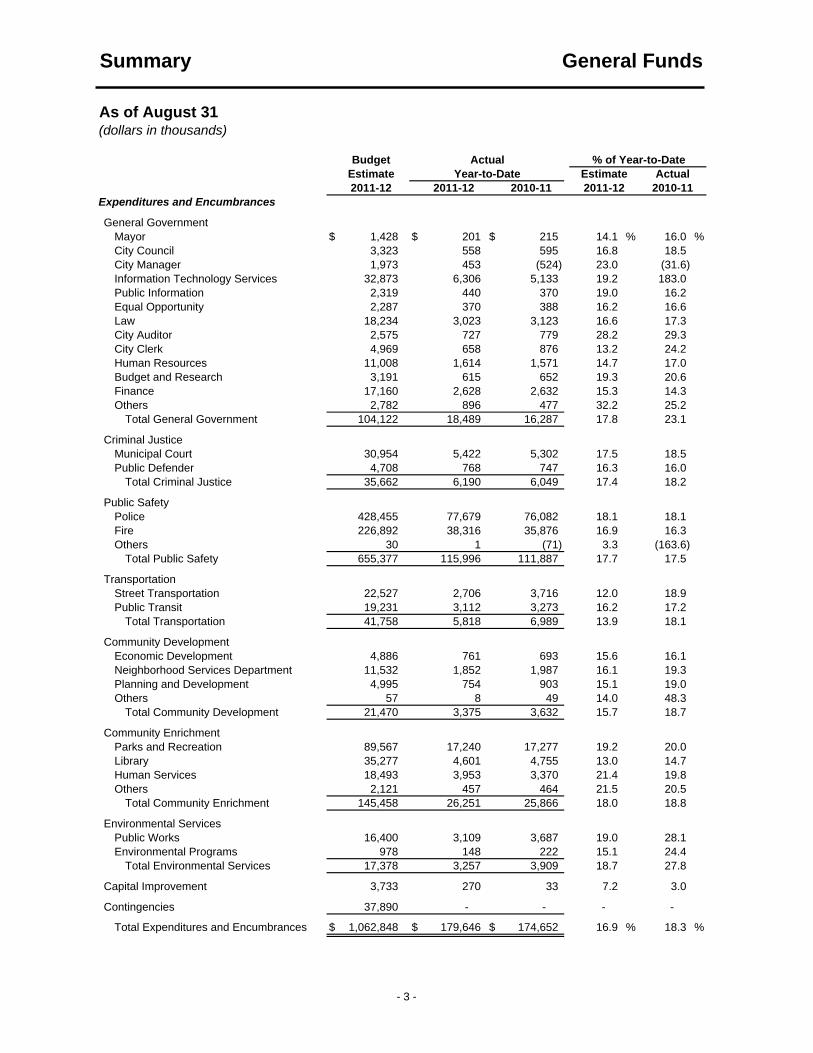
Expenditures and Encumbrances
General GovernmentMayor $ 1,428 $ 201 $ 215 14.1 % 16.0 %City Council 3,323 558 595 16.8 18.5 City Manager 1,973 453 (524) 23.0 (31.6) Information Technology Services 32,873 6,306 5,133 19.2 183.0 Public Information 2,319 440 370 19.0 16.2 Equal Opportunity 2,287 370 388 16.2 16.6 Law 18,234 3,023 3,123 16.6 17.3 City Auditor 2,575 727 779 28.2 29.3 City Clerk 4,969 658 876 13.2 24.2 Human Resources 11,008 1,614 1,571 14.7 17.0 Budget and Research 3,191 615 652 19.3 20.6 Finance 17,160 2,628 2,632 15.3 14.3 Others 2,782 896 477 32.2 25.2
Total General Government 104,122 18,489 16,287 17.8 23.1
Criminal JusticeMunicipal Court 30,954 5,422 5,302 17.5 18.5 Public Defender 4,708 768 747 16.3 16.0
Total Criminal Justice 35,662 6,190 6,049 17.4 18.2
Public SafetyPolice 428,455 77,679 76,082 18.1 18.1 Fire 226,892 38,316 35,876 16.9 16.3 Others 30 1 (71) 3.3 (163.6)
Total Public Safety 655,377 115,996 111,887 17.7 17.5
TransportationStreet Transportation 22,527 2,706 3,716 12.0 18.9 Public Transit 19,231 3,112 3,273 16.2 17.2
Total Transportation 41,758 5,818 6,989 13.9 18.1
Community DevelopmentEconomic Development 4,886 761 693 15.6 16.1 Neighborhood Services Department 11,532 1,852 1,987 16.1 19.3 Planning and Development 4,995 754 903 15.1 19.0 Others 57 8 49 14.0 48.3
Total Community Development 21,470 3,375 3,632 15.7 18.7
Community EnrichmentParks and Recreation 89,567 17,240 17,277 19.2 20.0 Library 35,277 4,601 4,755 13.0 14.7 Human Services 18,493 3,953 3,370 21.4 19.8 Others 2,121 457 464 21.5 20.5
Total Community Enrichment 145,458 26,251 25,866 18.0 18.8
Environmental ServicesPublic Works 16,400 3,109 3,687 19.0 28.1 Environmental Programs 978 148 222 15.1 24.4
Total Environmental Services 17,378 3,257 3,909 18.7 27.8
Capital Improvement 3,733 270 33 7.2 3.0
Contingencies 37,890 - - - -
Total Expenditures and Encumbrances $ 1,062,848 $ 179,646 $ 174,652 16.9 % 18.3 %
2011-12 2010-11
Actual % of Year-to-DateYear-to-Date Estimate Actual
- 3 -

CitywideSummary

Comparison to Prior Year Revenues
Revenues
YEAR-TO-DATE REVENUESAs of August 31, 2011
Year-to-date revenues as of August 31 increased by $30,173,425 to $440,479,273 from the $410,305,848 collected during the same period last year, an increase of 7.4%.
For the current year, 14.6% of the total estimated revenue has been collected. Of the total revenues received last year, 13.6% had been collected as of August 31.
0
500
1,000
1,500
2,000
2,500
3,000
3,500
July Aug Sept Oct Nov Dec Jan Feb Mar April May June
(mill
ions
of d
olla
rs)
Current YTD Revenues Prior YTD Revenues
- 4 -

Comparison to Prior Year Operating Expenditures
Operating Expenditures
YEAR-TO-DATE OPERATING EXPENDITURESAs of August 31, 2011
For the current year, 17.5% of the total appropriations has been spent. Of the total actual expenditures for last year, 20.6% had been spent as of August 31.
For the entire City, including enterprise funds such as Water Services and Aviation, year-to-date operating expenditures as of August 31 decreased $12,662,609 to $609,244,302 from the $621,906,911 spent during the same period last year, a decrease of 2.0%.
0100200300400500600700800900
1,0001,1001,2001,3001,4001,5001,6001,7001,8001,9002,0002,1002,2002,3002,4002,5002,6002,7002,8002,9003,0003,1003,200
July Aug Sept Oct Nov Dec Jan Feb Mar April May June
(mill
ions
of d
olla
rs)
Current YTD Expenditures Prior YTD Expenditures
- 5 -
Comparison to Prior Year Capital Expenditures
Capital Expenditures
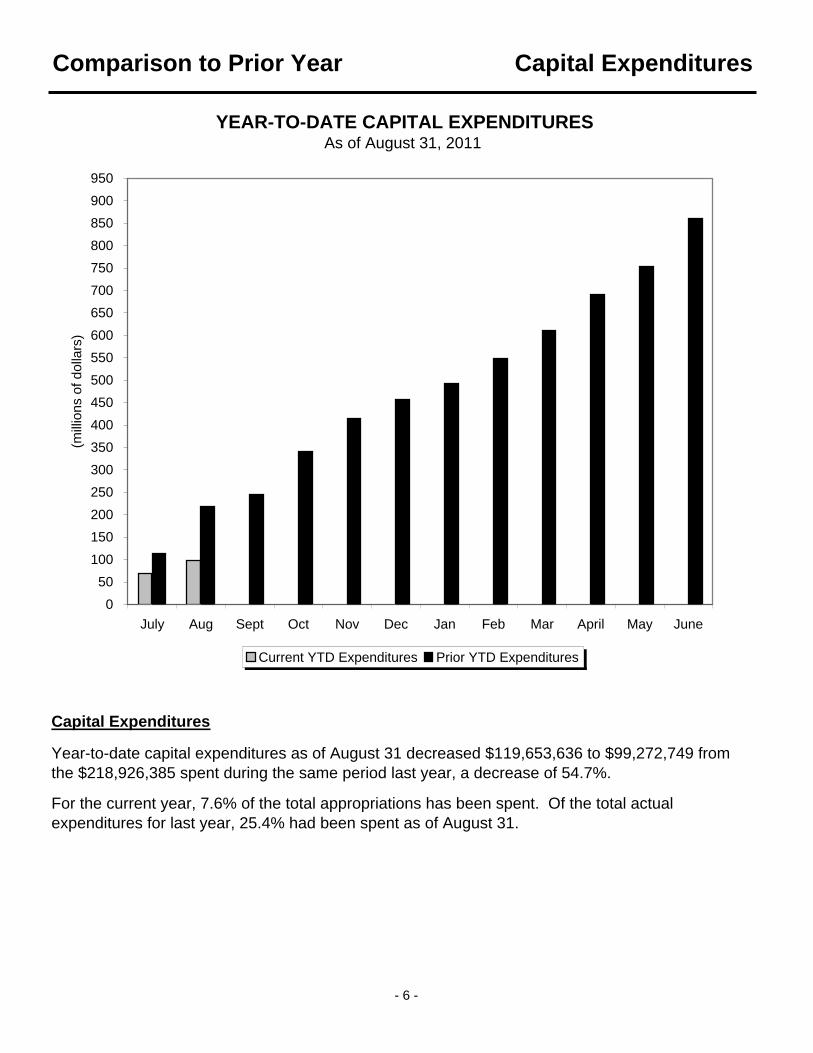
YEAR-TO-DATE CAPITAL EXPENDITURESAs of August 31, 2011
Year-to-date capital expenditures as of August 31 decreased $119,653,636 to $99,272,749 from the $218,926,385 spent during the same period last year, a decrease of 54.7%.
For the current year, 7.6% of the total appropriations has been spent. Of the total actual expenditures for last year, 25.4% had been spent as of August 31.
050
100150200250300350400450500550600650700750800850900950
July Aug Sept Oct Nov Dec Jan Feb Mar April May June
(mill
ions
of d
olla
rs)
Current YTD Expenditures Prior YTD Expenditures
- 6 -

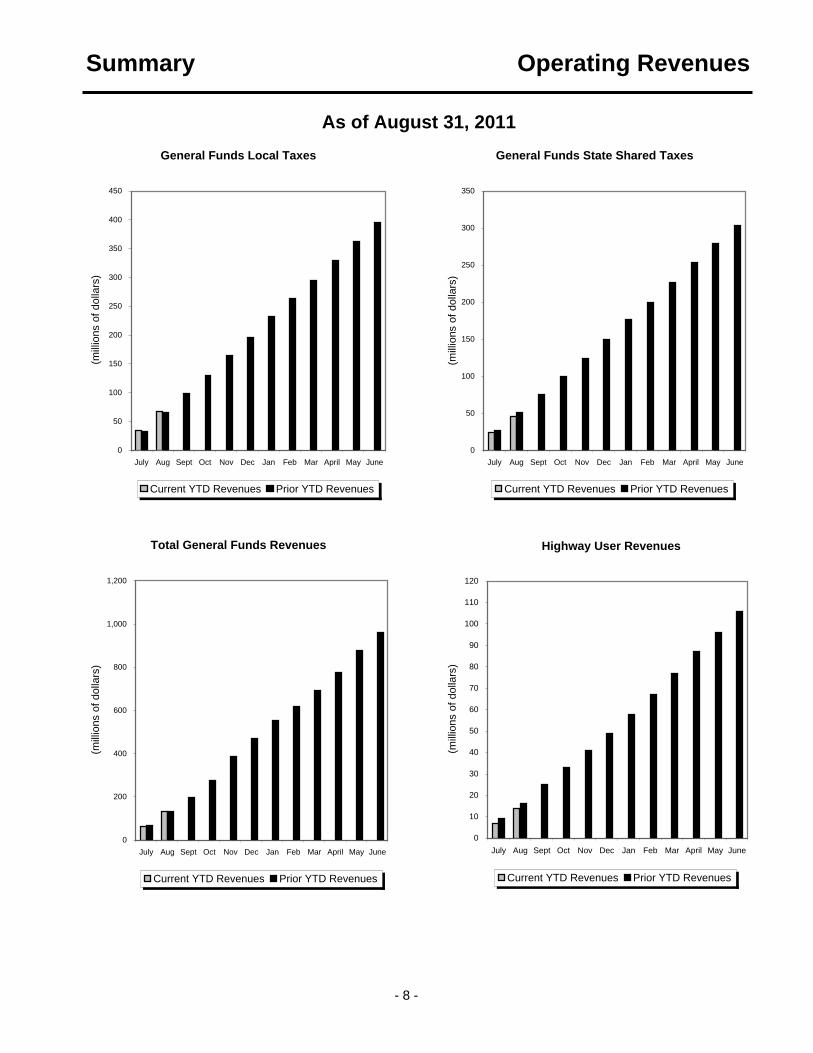
Summary Operating Revenues
As of August 31(dollars in thousands)
BudgetEstimate2011-12 2011-12 2010-11
General FundsLocal Taxes:
Sales Taxes $ 417,006 $ 68,114 $ 64,831 16.3 % 16.5 %Privilege License Fees 2,465 113 96 4.6 3.9
State Shared Taxes:State Sales Tax 110,696 17,535 18,031 15.8 16.1 State Income Tax 122,065 20,331 23,941 16.7 16.7 Vehicle License Tax 48,045 8,180 9,358 17.0 19.4
Primary Property Tax 126,763 (632) (645) (0.5) (0.5) Licenses and Permits 3,270 513 457 15.7 14.8 Cable Communications 9,567 (154) 133 (1.6) 1.4 Municipal Court 21,859 3,595 3,720 16.4 16.5 Police 12,598 1,378 2,418 10.9 15.0 Library Fees 1,256 201 215 16.0 17.3 Parks and Recreation 7,102 1,281 1,428 18.0 19.1 Planning & Development 993 140 196 14.1 17.4 Street Transportation 5,124 739 853 14.4 16.2 Fire 49,212 8,281 6,449 16.8 13.1 Interest 300 140 55 46.7 16.4 Other Fees and Service Charges 14,890 1,968 1,665 13.2 9.6
Total General Funds 953,211 131,723 133,201 13.8 13.8
Special Revenue Funds and Debt ServiceNeighborhood Protection 26,956 4,350 3,915 16.1 15.4 Public Safety Enhancement & Expansion 78,517 13,142 12,645 16.7 17.0 Parks and Preserves 27,510 4,376 4,079 15.9 15.7 Transit 2000 159,966 24,993 22,177 15.6 14.5 Court Awards 11,425 302 891 2.6 30.2 Planning and Development 33,100 5,530 5,774 16.7 18.2 Capital Construction 17,502 2,886 2,862 16.5 18.3 Sports Facilities 14,781 1,931 1,777 13.1 12.1 Highway User Revenue 91,126 13,507 16,399 14.8 15.5 Regional Transit Revenues 28,863 1,924 3,323 6.7 7.9 Community Reinvestment 3,854 301 1,935 7.8 21.8 Other Restricted Fees 25,634 3,436 2,849 13.4 11.7 Grants 306,082 16,457 (11,751) 5.4 (4.8) G.O. Bond Debt Service 99,757 (909) (1,283) (0.9) (0.8)
Total Special Revenue Funds andDebt Service 925,073 92,226 65,592 10.0 7.1
Enterprise FundsAviation 329,036 52,031 52,969 15.8 15.9 Convention Center 57,391 8,201 7,519 14.3 12.2 Water System 366,646 93,200 88,465 25.4 24.9 Wastewater 230,882 38,093 38,697 16.5 17.0 Solid Waste 142,567 24,473 23,428 17.2 16.4 Golf Courses 6,130 532 435 8.7 7.6
Total Enterprise Funds 1,132,652 216,530 211,513 19.1 18.8
Total Operating Revenues $ 3,010,936 $ 440,479 $ 410,306 14.6 % 13.6 %
SourceYear-to-Date
Actual % of Year-to-Date
2011-12Estimate
2010-11Actual
- 7 -
Summary Operating Revenues
As of August 31, 2011General Funds Local Taxes
0
50
100
150
200
250
300
350
400
450
July Aug Sept Oct Nov Dec Jan Feb Mar April May June
(mill
ions
of d
olla
rs)
Current YTD Revenues Prior YTD Revenues
General Funds State Shared Taxes
0
50
100
150
200
250
300
350
July Aug Sept Oct Nov Dec Jan Feb Mar April May June(m
illio
ns o
f dol
lars
)
Current YTD Revenues Prior YTD Revenues
Total General Funds Revenues
0
200
400
600
800
1,000
1,200
July Aug Sept Oct Nov Dec Jan Feb Mar April May June
(mill
ions
of d
olla
rs)
Current YTD Revenues Prior YTD Revenues
Highway User Revenues
0
10
20
30
40
50
60
70
80
90
100
110
120
July Aug Sept Oct Nov Dec Jan Feb Mar April May June
(mill
ions
of d
olla
rs)
Current YTD Revenues Prior YTD Revenues
- 8 -

Summary Operating Expenditures and Encumbrances
As of August 31(dollars in thousands)
Source 2011-12 2010-11
General Government General Funds $ 104,122 $ 18,489 $ 16,287 17.8 % 23.1 % Other Funds 15,186 487 1,325 3.2 17.9 Total General Government 119,308 18,976 17,612 15.9 22.6
Criminal Justice General Funds 35,662 6,190 6,049 17.4 18.2 Other Funds 9,893 612 1,106 6.2 30.4 Total Criminal Justice 45,555 6,802 7,155 14.9 19.4
Public Safety General Funds 655,377 115,996 111,887 17.7 17.5 Other Funds 161,111 26,309 26,172 16.3 17.2 Total Public Safety 816,488 142,305 138,059 17.4 17.4
Transportation General Funds 41,758 5,818 6,989 13.9 18.1 Other Funds 566,577 204,185 192,595 36.0 36.4 Total Transportation 608,335 210,003 199,584 34.5 35.1
Community Development General Funds 21,470 3,375 3,632 15.7 18.7 Other Funds 235,474 25,594 31,602 10.9 20.2 Total Community Development 256,944 28,969 35,234 11.3 20.0
Community Enrichment General Funds 145,458 26,251 25,866 18.0 18.8 Other Funds 136,167 26,720 27,902 19.6 20.4 Total Community Enrichment 281,625 52,971 53,768 18.8 19.6
Environmental Services General Funds 17,378 3,257 3,909 18.7 27.8 Other Funds 619,300 89,429 96,161 14.4 17.2 Total Environmental Services 636,678 92,686 100,070 14.6 17.5
Debt Service General Funds - - - - - Other Funds 138,719 28,154 32,061 20.3 16.3 Total Debt Service 138,719 28,154 32,061 20.3 16.3
Capital Improvement General Funds 3,733 270 33 7.2 3.0 Other Funds 482,588 28,108 38,332 5.8 11.6 Total Capital Improvement 486,321 28,378 38,365 5.8 11.6
Contingencies General Funds 37,890 - - - - Other Funds 46,550 - - - - Total Contingencies 84,440 - - - -
Total Operating General Funds 1,062,848 179,646 174,652 16.9 18.3 Other Funds 2,411,565 429,598 447,256 17.8 21.6 Total Operating Budget $ 3,474,413 $ 609,244 $ 621,908 17.5 % 20.6 %
Actual % of Year-to-DateYear-to-Date Estimate Actual
2011-12 2010-112011-12Budget
- 9 -

Summary Operating Expenditures and Encumbrances
As of August 31, 2011Total General Government
0
10
20
30
40
50
60
70
80
90
July Aug Sept Oct Nov Dec Jan Feb Mar April May June
(milli
ons
of d
olla
rs)
Current YTD Expenditures Prior YTD Expenditures
Total Criminal Justice
0
10
20
30
40
July Aug Sept Oct Nov Dec Jan Feb Mar April May June(m
illion
s of
dol
lars
)
Current YTD Expenditures Prior YTD Expenditures
Total Public Safety
0255075
100125150175200225250275300325350375400425450475500525550575600625650675700725750775800825850
July Aug Sept Oct Nov Dec Jan Feb Mar April May June
(milli
ons
of d
olla
rs)
Current YTD Expenditures Prior YTD Expenditures
Total Transportation
0255075
100125150175200225250275300325350375400425450475500525550575600
July Aug Sept Oct Nov Dec Jan Feb Mar April May June
(milli
ons
of d
olla
rs)
Current YTD Expenditures Prior YTD Expenditures
- 10 -

Summary Operating Expenditures and Encumbrances
As of August 31, 2011Total Community Development
0
10
20
30
40
50
60
70
80
90
100
110
120
130
140
150
160
170
180
190
July Aug Sept Oct Nov Dec Jan Feb Mar April May June
(mill
ions
of d
olla
rs)
Current YTD Expenditures Prior YTD Expenditures
Total Community Enrichment
0
20
40
60
80
100
120
140
160
180
200
220
240
260
280
300
July Aug Sept Oct Nov Dec Jan Feb Mar April May June
(mill
ions
of d
olla
rs)
Current YTD Expenditures Prior YTD Expenditures
Total Environmental Services
020406080
100120140160180200220240260280300320340360380400420440460480500520540560580600620
July Aug Sept Oct Nov Dec Jan Feb Mar April May June
(mill
ions
of d
olla
rs)
Current YTD Expenditures Prior YTD Expenditures
Total Debt Service
0102030405060708090
100110120130140150160170180190200210
July Aug Sept Oct Nov Dec Jan Feb Mar April May June
(mill
ions
of d
olla
rs)
Current YTD Expenditures Prior YTD Expenditures
- 11 -

Revenues
Estimate Actual2011-12 2010-11
General Funds
Local Taxes:$ 34,239,095 $ 32,288,346 Sales Taxes $ 417,006,000 $ 68,114,211 $ 64,831,080 16.3 % 16.5 %
69,095 54,884 Privilege License Fees 2,464,500 113,319 96,222 4.6 3.9
34,308,190 32,343,230 Total Local Taxes 419,470,500 68,227,530 64,927,302 16.3 16.4
State Shared Taxes:8,682,923 8,261,882 State Sales Tax 110,696,000 17,534,923 18,030,882 15.8 16.1
10,163,078 11,970,581 State Income Tax 122,065,000 20,331,199 23,941,193 16.7 16.7 3,698,080 4,141,301 Vehicle License Tax 48,045,000 8,180,080 9,358,301 17.0 19.4
22,544,081 24,373,764 Total State Shared Taxes 280,806,000 46,046,202 51,330,376 16.4 16.9
513,540 460,857 Primary Property Tax 126,763,000 (631,737) (644,826) (0.5) (0.5)
361,295 284,763 Licenses and Permits 3,270,000 513,345 456,982 15.7 14.8
(14,114) 132,808 Cable Communications 9,567,056 (153,636) 132,808 (1.6) 1.4
Municipal Court:1,640,167 1,836,623 Fines and Forfeitures 20,759,025 3,453,066 3,567,694 16.6 16.7
73,092 77,098 Court Default Fee 1,100,000 141,835 152,678 12.9 13.2
1,713,259 1,913,721 Total Municipal Court 21,859,025 3,594,901 3,720,372 16.4 16.5
682,874 1,698,562 Police 12,597,587 1,377,845 2,417,659 10.9 15.0
101,319 108,003 Library Fees 1,256,140 201,154 214,560 16.0 17.3
929,997 1,064,575 Parks and Recreation 7,102,531 1,280,576 1,427,977 18.0 19.1
87,524 180,071 Planning and Development 993,300 139,433 195,867 14.0 17.4
145,988 343,261 Street Transportation 5,124,098 739,130 852,850 14.4 16.2
Fire:3,081,456 2,876,215 Emergency Transportation Service 36,750,000 6,104,035 5,724,420 16.6 15.5
65,425 38,967 Hazardous Materials Inspection Fee 1,300,000 116,961 87,182 9.0 6.8 674,059 512,832 Other 11,161,613 2,060,046 636,977 18.5 5.8
3,820,940 3,428,014 Total Fire 49,211,613 8,281,042 6,448,579 16.8 13.1
58,361 3,831 Interest 300,000 140,094 54,930 46.7 16.4
1,123,053 1,347,668 Other Fees and Service Charges 14,889,664 1,967,413 1,665,272 13.2 9.6
66,376,307 67,683,128 Total General Funds 953,210,514 131,723,292 133,200,708 13.8 13.8
Percent of Year-to-DateBudget
2011-12 2010-11Actual Year-to-Date
2010August 31
For the Month Ended
2011-12Estimate
Source2011
- 12 -

Revenues
Estimate Actual2011-12 2010-11
Percent of Year-to-DateBudget
2011-12 2010-11Actual Year-to-Date
2010August 31
For the Month Ended
2011-12Estimate
Source2011
Special Revenue Funds and Debt Service
Neighborhood Protection:$ 1,487,138 $ 1,336,085 Police Neighborhood Protection $ 18,837,000 $ 3,000,249 $ 2,761,139 15.9 % 15.6 %
106,224 95,435 Police Blockwatch 1,345,000 214,304 197,224 15.9 15.5 531,121 477,174 Fire Neighborhood Protection 6,726,000 1,071,518 986,122 15.9 15.5 63,865 (11,434) Interest/Other 48,000 64,264 (29,239) 133.9 69.3
2,188,348 1,897,260 Total Neighborhood Protection 26,956,000 4,350,335 3,915,246 16.1 15.4
Public Safety Enhancement & Expansion:4,967,656 4,663,868 Police 58,269,000 9,693,014 9,244,104 16.6 16.7 1,811,479 1,752,238 Fire 20,108,000 3,452,801 3,378,966 17.2 17.6
(2,688) 10,124 Interest/Other 140,000 (4,350) 21,778 (3.1) 45.5
6,776,447 6,426,230 Total Public Safety Enhancement & Expansion 78,517,000 13,141,465 12,644,848 16.7 17.0
2,166,847 1,977,948 Parks and Preserves 27,510,000 4,375,977 4,079,545 15.9 15.7
Transit 2000:8,497,932 7,634,777 Sales Taxes 107,640,000 17,144,280 15,777,945 15.9 15.6 4,777,163 3,457,120 Interest/Other 52,325,926 7,849,139 6,399,452 15.0 12.3
13,275,095 11,091,897 Total Transit 2000 159,965,926 24,993,419 22,177,397 15.6 14.5
301,546 279,196 Court Awards 11,425,309 301,546 890,766 2.6 30.2
2,562,859 4,832,140 Planning and Development 33,100,000 5,529,975 5,773,846 16.7 18.2
1,435,366 1,394,402 Capital Construction 17,502,000 2,885,501 2,861,857 16.5 18.3
Sports Facilities:882,310 791,316 Sales Taxes 14,386,000 1,844,597 1,689,232 12.8 12.0 32,122 44,373 Interest/Other 395,000 86,825 87,733 22.0 14.5
914,432 835,689 Total Sports Facilities 14,781,000 1,931,422 1,776,965 13.1 12.1
Highway User Revenue:6,698,651 7,795,419 Highway User Revenue 90,226,000 13,362,651 16,325,419 14.8 15.6
32,648 41,699 Interest 600,000 66,835 73,485 11.1 13.5 73,802 - Other 300,000 77,531 - 25.8 -
6,805,101 7,837,118 Total Highway User Revenue 91,126,000 13,507,017 16,398,904 14.8 15.5
1,931,372 2,066,530 Regional Transit Revenues 28,863,623 1,924,198 3,323,002 6.7 7.9
268,398 734,683 Community Reinvestment 3,853,899 301,012 1,934,642 7.8 21.8
468,476 2,347,515 Other Restricted Fees 25,633,671 3,435,989 2,849,570 13.4 11.7
- 13 -
Revenues
Estimate Actual2011-12 2010-11
Percent of Year-to-DateBudget
2011-12 2010-11Actual Year-to-Date
2010August 31
For the Month Ended
2011-12Estimate
Source2011
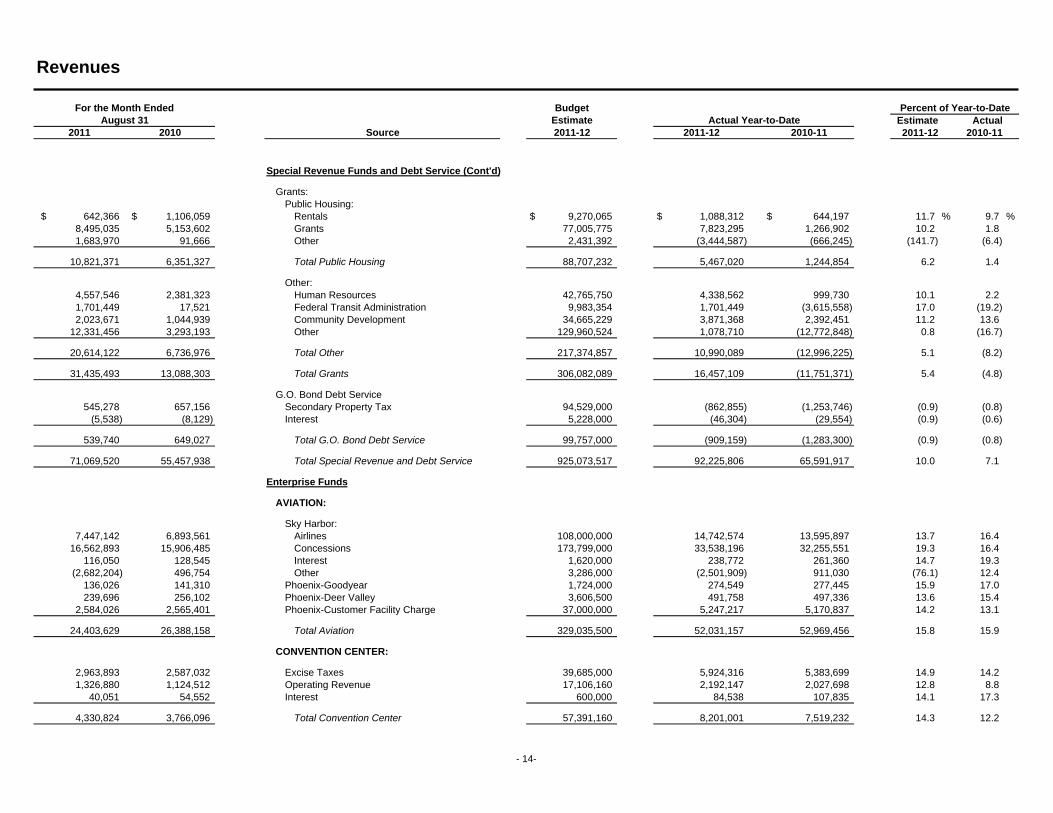
Special Revenue Funds and Debt Service (Cont'd)
Grants:Public Housing:
$ 642,366 $ 1,106,059 Rentals $ 9,270,065 $ 1,088,312 $ 644,197 11.7 % 9.7 %8,495,035 5,153,602 Grants 77,005,775 7,823,295 1,266,902 10.2 1.8 1,683,970 91,666 Other 2,431,392 (3,444,587) (666,245) (141.7) (6.4)
10,821,371 6,351,327 Total Public Housing 88,707,232 5,467,020 1,244,854 6.2 1.4
Other:4,557,546 2,381,323 Human Resources 42,765,750 4,338,562 999,730 10.1 2.2 1,701,449 17,521 Federal Transit Administration 9,983,354 1,701,449 (3,615,558) 17.0 (19.2) 2,023,671 1,044,939 Community Development 34,665,229 3,871,368 2,392,451 11.2 13.6
12,331,456 3,293,193 Other 129,960,524 1,078,710 (12,772,848) 0.8 (16.7)
20,614,122 6,736,976 Total Other 217,374,857 10,990,089 (12,996,225) 5.1 (8.2)
31,435,493 13,088,303 Total Grants 306,082,089 16,457,109 (11,751,371) 5.4 (4.8)
G.O. Bond Debt Service545,278 657,156 Secondary Property Tax 94,529,000 (862,855) (1,253,746) (0.9) (0.8)
(5,538) (8,129) Interest 5,228,000 (46,304) (29,554) (0.9) (0.6)
539,740 649,027 Total G.O. Bond Debt Service 99,757,000 (909,159) (1,283,300) (0.9) (0.8)
71,069,520 55,457,938 Total Special Revenue and Debt Service 925,073,517 92,225,806 65,591,917 10.0 7.1
Enterprise Funds
AVIATION:
Sky Harbor:7,447,142 6,893,561 Airlines 108,000,000 14,742,574 13,595,897 13.7 16.4
16,562,893 15,906,485 Concessions 173,799,000 33,538,196 32,255,551 19.3 16.4 116,050 128,545 Interest 1,620,000 238,772 261,360 14.7 19.3
(2,682,204) 496,754 Other 3,286,000 (2,501,909) 911,030 (76.1) 12.4 136,026 141,310 Phoenix-Goodyear 1,724,000 274,549 277,445 15.9 17.0 239,696 256,102 Phoenix-Deer Valley 3,606,500 491,758 497,336 13.6 15.4
2,584,026 2,565,401 Phoenix-Customer Facility Charge 37,000,000 5,247,217 5,170,837 14.2 13.1
24,403,629 26,388,158 Total Aviation 329,035,500 52,031,157 52,969,456 15.8 15.9
CONVENTION CENTER:
2,963,893 2,587,032 Excise Taxes 39,685,000 5,924,316 5,383,699 14.9 14.2 1,326,880 1,124,512 Operating Revenue 17,106,160 2,192,147 2,027,698 12.8 8.8
40,051 54,552 Interest 600,000 84,538 107,835 14.1 17.3
4,330,824 3,766,096 Total Convention Center 57,391,160 8,201,001 7,519,232 14.3 12.2
- 14-

Revenues
Estimate Actual2011-12 2010-11
Percent of Year-to-DateBudget
2011-12 2010-11Actual Year-to-Date
2010August 31
For the Month Ended
2011-12Estimate
Source2011
Enterprise Funds (Cont'd)
WATER SYSTEM:
$ 41,950,442 $ 38,641,046 Water Sales $ 343,293,000 $ 88,662,233 $ 84,991,328 25.8 % 25.6 %567,665 535,161 Water Service Fees 6,000,000 1,011,710 1,030,685 16.9 17.1 293,511 445,831 Distribution 3,180,000 874,916 742,038 27.5 27.5 318,804 339,078 Intergovernmental 9,395,000 1,887,494 1,724,864 20.1 22.0 110,100 210,420 Development Fees 1,500,000 321,060 232,800 21.4 19.1 202,287 315,396 Interest 1,298,000 415,530 606,103 32.0 17.5
1,173,499 286,907 Other 1,980,000 27,529 (863,059) 1.4 (51.7)
44,616,308 40,773,839 Total Water System 366,646,000 93,200,472 88,464,759 25.4 24.9
WASTEWATER:
16,299,752 16,860,831 Sewer Service Charges 196,104,000 32,357,349 33,180,326 16.5 16.8 1,552,216 1,463,846 Multi-City 14,486,000 3,113,216 3,077,846 21.5 16.2
92,400 184,500 Development Fees 1,400,000 298,800 201,480 21.3 19.0 204,444 271,649 Interest 1,962,000 430,948 535,979 22.0 17.4
1,190,155 1,049,748 Other 16,930,000 1,892,528 1,701,666 11.2 25.1
19,338,967 19,830,574 Total Wastewater 230,882,000 38,092,841 38,697,297 16.5 17.0
SOLID WASTE:
10,341,242 10,303,963 Collection Fees 123,625,000 20,668,036 20,621,502 16.7 16.7 810,596 722,903 Landfill Fees 7,440,000 1,460,967 1,215,938 19.6 14.5 45,658 68,392 Interest 750,000 94,678 133,567 12.6 19.4
1,261,641 1,105,575 Other 10,752,500 2,249,039 1,456,723 20.9 13.8
12,459,137 12,200,833 Total Solid Waste 142,567,500 24,472,720 23,427,730 17.2 16.4
GOLF COURSES:
123,838 129,811 Fees 4,100,500 304,762 256,164 7.4 6.8 6,249 5,041 Coffee Shops 78,400 15,542 9,305 19.8 12.7
100,383 101,690 Concessions 2,008,000 225,734 190,450 11.2 10.3 (10,741) (13,314) Interest (185,282) (22,542) (25,754) 12.2 18.0 (2,717) (1,636) Other 128,000 8,488 4,584 6.6 2.7
217,012 221,592 Total Golf Courses 6,129,618 531,984 434,749 8.7 7.6
105,365,877 103,181,092 Total Enterprise Funds 1,132,651,778 216,530,175 211,513,223 19.1 18.8
$ 242,811,704 $ 226,322,158 Total Operating Revenues $ 3,010,935,809 $ 440,479,273 $ 410,305,848 14.6 % 13.6 %
- 15-

Operating Expenditures and Encumbrances
General Government
$ 108,644 $ 107,484 Mayor $ 1,438,508 $ 200,793 $ 214,641 $ 200,793 $ - 281,928 271,946 City Council 3,323,173 557,817 595,321 557,817 - 249,584 (871,233) City Manager 2,289,692 536,578 (536,243) 536,578 -
4,620,064 2,388,463 Information Technology Services 33,838,035 6,399,901 5,365,464 6,366,088 33,813 99,156 131,707 Government Relations 1,321,292 384,434 461,077 384,434 -
252,071 215,084 Public Information 2,624,699 487,495 465,068 487,495 - 230,996 223,859 Equal Opportunity 2,691,191 446,493 453,780 446,493 -
1,619,897 1,596,734 Law 20,041,149 3,294,640 3,403,814 3,294,640 - 132,896 605,625 City Auditor 2,574,942 727,398 778,997 727,398 - 372,011 479,440 City Clerk 4,993,080 660,973 903,187 658,260 2,713 149,258 30,561 Elections 1,298,797 515,428 59,876 515,428 - 883,904 785,703 Human Resources 11,729,936 1,685,213 1,789,560 1,670,108 15,105 30,559 10,629 Retirement Systems - (5,720) (40,158) (5,720) - 9,580 15,600 Phoenix Employment Relations Board 162,059 20,698 (4,299) 20,698 -
274,994 273,304 Budget and Research 3,191,087 615,033 652,454 615,033 - 1,507,743 1,321,065 Finance 24,160,975 3,123,283 3,049,612 3,099,335 23,948
367,153 - Regional Wireless Cooperative 3,629,630 (674,599) - (674,599) -
11,190,438 7,585,971 Total General Government 119,308,245 18,975,858 17,612,151 18,900,279 75,579
Criminal Justice
2,579,420 2,812,736 Municipal Court 40,846,452 6,033,096 6,408,053 5,950,685 82,411 404,522 377,520 Public Defender 4,708,450 768,585 747,020 768,585 -
2,983,942 3,190,256 Total Criminal Justice 45,554,902 6,801,681 7,155,073 6,719,270 82,411
Public Safety
47,338,218 44,875,401 Police 547,390,725 97,296,779 95,315,841 96,841,108 455,671 22,311,360 19,957,706 Fire 268,616,005 44,931,457 42,714,093 44,754,940 176,517
31,801 (55,902) Other 480,992 78,085 28,650 78,085 -
69,681,379 64,777,205 Total Public Safety 816,487,722 142,306,321 138,058,584 141,674,133 632,188
Budget
2011 2010August 31
For the Month Ended
2011-12 2010-11Actual Year-to-Date
Program 2011-12Estimate
2011-12 Year-to-Date
Operations and DebtCapital
Operating Expenditures & Encumbrances
- 16 -

Operating Expenditures and Encumbrances
Budget
2011 2010August 31
For the Month Ended
2011-12 2010-11Actual Year-to-Date
Program 2011-12Estimate
2011-12 Year-to-Date
Operations and DebtCapital
Operating Expenditures & Encumbrances
Transportation
$ 4,385,964 $ 4,585,900 Street Transportation $ 58,632,945 $ 9,033,155 $ 9,279,136 $ 9,013,062 $ 20,093 628,828 935,475 Street Lighting 11,685,358 1,527,754 1,798,442 1,527,754 -
20,415,318 20,101,851 Aviation 290,441,289 37,920,620 38,997,320 28,003,529 9,917,091 12,059,804 6,887,268 Public Transit 247,575,530 161,521,863 149,508,700 151,865,316 9,656,547
37,489,914 32,510,494 Total Transportation 608,335,122 210,003,392 199,583,598 190,409,661 19,593,731
Community Development
2,780,689 2,434,102 Planning and Development 33,601,910 5,494,673 5,207,796 5,494,673 - 6,235,703 6,418,818 Housing 75,137,220 12,300,992 13,229,838 12,288,490 12,502 2,045,333 4,864,878 Economic Development 37,775,681 4,331,128 7,449,159 3,949,981 381,147 3,611,318 3,632,703 Neighborhood Services Department 110,429,214 6,841,910 9,347,360 6,841,910 -
14,673,043 17,350,501 Total Community Development 256,944,025 28,968,703 35,234,153 28,575,054 393,649
Community Enrichment
9,379,342 8,869,996 Parks and Recreation 96,385,575 18,395,342 18,602,113 18,365,239 30,103 2,589,621 2,375,284 Library 36,069,133 4,722,230 4,814,042 4,722,230 -
796,238 654,070 Golf 8,341,758 1,414,036 1,268,093 1,413,286 750 4,968,145 4,390,028 Convention Center 62,545,832 15,598,580 15,790,950 12,227,926 3,370,654
664,570 1,020,296 Sports and Cultural Facilities 10,968,395 1,328,203 2,039,654 - 1,328,203 4,954,741 4,740,319 Human Services 62,339,505 10,675,923 10,439,323 10,665,854 10,069
333,319 302,750 Public Parking Facilities 4,133,240 568,496 433,696 568,496 - 195,459 211,401 Other 841,581 268,126 380,320 268,126 -
23,881,435 22,564,144 Total Community Enrichment 281,625,019 52,970,936 53,768,191 48,231,157 4,739,779
- 17 -

Operating Expenditures and Encumbrances
Budget
2011 2010August 31
For the Month Ended
2011-12 2010-11Actual Year-to-Date
Program 2011-12Estimate
2011-12 Year-to-Date
Operations and DebtCapital
Operating Expenditures & Encumbrances
Environmental Services
$ 24,626,093 $ 21,818,171 Water System $ 390,781,777 $ 48,086,868 $ 45,862,560 $ 30,213,811 $ 17,873,057 12,704,331 12,262,294 Wastewater 84,743,876 24,293,731 24,397,922 11,819,570 12,474,161 9,120,787 16,513,151 Solid Waste Management 126,438,686 16,692,441 24,614,183 14,543,484 2,148,957 1,874,722 2,204,926 Public Works 33,305,241 3,333,188 4,843,060 3,185,940 147,248
130,084 202,610 Environmental Programs 1,407,983 279,436 352,015 279,436 -
48,456,017 53,001,152 Total Environmental Services 636,677,563 92,685,664 100,069,740 60,042,241 32,643,423
General Obligation Debt Service
109,588 109,504 Aviation 1,315,055 219,176 219,009 - 219,176 1,023,152 795,132 Cultural Facilities 13,124,099 2,046,304 1,590,263 - 2,046,304 1,645,182 1,674,234 Downtown Development 19,974,955 3,290,364 3,348,469 - 3,290,364
- - Early Redemption - - - - - 17,613 22,061 Economic Development 211,365 35,227 44,121 - 35,227
342,066 404,628 Fire Protection 4,727,555 684,131 809,256 - 684,131 55,981 55,597 Freeway Mitigation 671,765 111,961 111,194 - 111,961
343,288 405,315 Historic/Neighborhood Preservation 4,165,274 686,576 810,630 - 686,576 56,453 70,210 Human Services 677,444 112,907 140,421 - 112,907
772,733 607,199 Information Systems 9,357,132 1,545,466 1,214,399 - 1,545,466 590,384 466,439 Libraries 7,370,435 1,180,769 932,879 - 1,180,769 77,460 76,627 Maintenance Service Centers 929,524 154,920 153,254 - 154,920
2,091,376 1,561,487 Mountain Preserves/Parks 26,140,222 4,182,753 3,122,974 - 4,182,753 4,184 4,184 Municipal Administration Buildings 50,200 8,367 8,367 - 8,367
669,476 980,394 Police Protection 8,957,446 1,338,952 1,960,787 - 1,338,952 129,961 212,919 Public Housing Renovation 2,022,132 259,922 425,837 - 259,922 431,276 1,591,340 Sanitary Sewers 6,361,800 862,553 3,182,679 - 862,553
1,620 1,620 Secondary Property Tax (37,080,505) 1,620 1,620 - 1,620 153,823 628,657 Solid Waste Enterprise Bonds 1,846,375 307,646 1,257,313 - 307,646
2,636,619 2,122,706 Storm Sewer Improvements 31,958,772 5,273,238 4,245,411 - 5,273,238 2,317,091 3,055,355 Street Improvements 28,193,672 4,634,182 6,110,711 - 4,634,182
25,535 13,901 Street Light Refinancing 306,413 51,069 27,802 - 51,069 582,467 1,170,908 Water System 7,437,854 1,165,665 2,343,457 - 1,165,665
14,077,328 16,030,417 Total Debt Service 138,718,984 28,153,768 32,060,853 - 28,153,768
10,249,671 29,425,209 Capital Improvement 486,321,254 28,377,979 38,364,568 - 28,377,979
- - Contingencies 84,440,000 - - - -
$ 232,683,167 $ 246,435,349 Total Operating Budget $ 3,474,412,836 $ 609,244,302 $ 621,906,911 $ 494,551,795 $ 114,692,507
- 18 -

Capital Expenditures and Encumbrances
$ 430,968 $ 20,395 Arts and Cultural Facilities $ 14,804,107 $ 6,532,513 $ 119,949 $ 1,195,000 $ - $ 13,609,107 $ 6,532,513 $ 8,271,594 8,456,024 21,632,828 Aviation 435,812,669 40,954,029 27,945,020 53,590,375 3,782,428 382,222,294 37,171,601 394,858,640
107,247 10,104,382 Economic Development 10,253,514 642,579 11,217,698 6,544,985 433,959 3,708,529 208,620 9,610,935 325,078 67,480 Energy Conservation 17,746,981 978,214 93,109 17,746,981 978,214 - - 16,768,767
1,800,002 1,069,657 Facilities Management 19,197,800 2,301,717 1,196,881 1,752,000 27,973 17,445,800 2,273,744 16,896,083
118,963 624,960 Fire Protection 21,140,399 7,652,949 785,951 - - 21,140,399 7,652,949 13,487,450 - - Freeway Mitigation - - - - - - - -
22,379 817,646 Historic Preservation 2,759,359 166,649 960,674 86,883 - 2,672,476 166,649 2,592,710 4,834,383 1,293,513 Housing 60,044,234 8,307,653 7,223,001 44,068,331 4,841,161 15,975,903 3,466,492 51,736,581
(694,140) 4,020,011 Human Services 2,857,262 (684,760) 4,026,300 - - 2,857,262 (684,760) 3,542,022 264,350 150,904 Information Technology 14,253,403 876,464 273,026 10,256,533 845,391 3,996,870 31,073 13,376,939
1,066,087 164,109 Libraries 7,697,854 1,382,635 776,609 1,454,500 940,464 6,243,354 442,171 6,315,219 93,558 587,310 Neighborhood Services 11,785,676 191,974 659,682 3,966,861 119,621 7,818,815 72,353 11,593,702
2,161,352 1,535,201 Parks and Mountain Preserves 99,758,025 3,351,427 3,187,355 46,820,118 668,018 52,937,907 2,683,409 96,406,598 1,086 3,097,870 Phoenix Convention Center 2,212,303 3,409 3,128,680 2,212,303 3,371 - 38 2,208,894
237,843 159,308 Police Protection 25,509,600 530,995 302,963 - - 25,509,600 530,995 24,978,605 434,743 4,870,566 Public Transit 77,991,552 1,408,068 7,764,395 26,179,381 834,571 51,812,171 573,497 76,583,484
106,162 11,828,430 Solid Waste Disposal 29,244,218 124,851 11,830,712 14,365,000 10,366 14,879,218 114,485 29,119,367 1,425,417 21,258,888 Street Transportation & Drainage 155,264,473 9,931,907 28,161,828 70,784,504 7,644,446 84,479,969 2,287,461 145,332,566 1,969,550 11,192,497 Wastewater 107,162,416 2,895,227 13,930,618 72,777,540 2,358,275 34,384,876 536,952 104,267,189 7,343,203 11,001,016 Water System 197,600,987 11,724,249 95,341,934 112,519,959 4,889,721 85,081,028 6,834,528 185,876,738
$ 30,504,255 $ 105,496,971 Total Capital Improvement Program $ 1,313,096,832 $ 99,272,749 $ 218,926,385 $ 486,321,254 $ 28,377,979 $ 826,775,578 $ 70,894,770 $ 1,213,824,083
2011-12
to-DateActual Year-
Program Budget to-DateActual Year-
2010-11
2011 2010August 31
For the Month EndedUnencumbered
Budget
2011-12 Year-to-Date Capital AmountsFrom Capital Funds
Budget ActualBudget ActualFrom Operating Funds
- 19 -

Bonds Authorized and Sold
As of August 31(dollars in thousands)
1988 AuthorizationsGeneral Obligation Bonds
Freeway Mitigation, Neighborhood Stabilization,and Slum and Blight Elimination $ 29,285 $ 28,285 $ 1,000
Bonds Fully Issued 884,175 884,175 - Total General Obligation Bonds 913,460 912,460 1,000
Revenue BondsBonds Fully Issued 143,890 143,890 -
Total 1988 Authorizations 1,057,350 1,056,350 1,000
2001 AuthorizationGeneral Obligation Bonds
Education, Youth and Family Cultural Facilities 66,300 64,325 1,975 Computer Technology 125,300 123,085 2,215 Environmental Cleanup 24,800 24,170 630 Fire Protection 61,500 60,600 900 Historic Preservation 12,000 11,075 925 Library Facilities 33,000 32,100 900 Street Improvements 91,500 89,275 2,225 Neighborhood Protection and Senior Centers 74,000 71,645 2,355 Parks, Open Space, and Recreational Facilities 77,000 72,575 4,425 Police Protection 78,800 75,640 3,160 Storm Sewer and Flood Protection 66,000 64,230 1,770 Bonds Fully Issued 43,700 43,700 -
Total 2001 Authorizations 753,900 732,420 21,480
2006 AuthorizationGeneral Obligation Bonds
Affordable Housing and Neighborhood Revitalization 81,000 57,645 23,355 Computer Technology 11,100 8,400 2,700 Education and Health Science Facilities 198,700 186,950 11,750 Environmental Cleanup 12,800 7,075 5,725 Family, Senior, and Youth Cultural Facilities 104,622 63,290 41,332 Fire Protection 74,705 43,900 30,805 Library Facilities and Improvements 29,178 19,675 9,503 Parks, Open Space, and Recreational Facilities 115,500 72,325 43,175 Police Protection 107,295 62,900 44,395 Street Improvements 78,200 55,915 22,285 Storm Sewer and Flood Protection 65,400 50,550 14,850
Total 2006 Authorizations 878,500 628,625 249,875
Total Bond Program $ 2,689,750 $ 2,417,395 $ 272,355
Authorized Sold Available
- 20 -