Monthly Complaint Report - Amazon S3...2 MONTHLY COMPLAINT REPORT: APRIL 2017 1. Complaint volume...
28
April 2017 Monthly Complaint Report Vol. 22
Transcript of Monthly Complaint Report - Amazon S3...2 MONTHLY COMPLAINT REPORT: APRIL 2017 1. Complaint volume...
April 2017
Monthly Complaint Report Vol. 22

1 MONTHLY COMPLAINT REPORT: APRIL 2017
Table of contents Table of contents ....................................................................................................... 1
1. Complaint volume .............................................................................................. 2
1.1 Complaint volume by product .................................................................. 3
1.2 Complaint volume by state ....................................................................... 7
1.3 Complaint volume by company ................................................................ 9
2. Product spotlight: Student loan .................................................................... 11
2.1 Student loan complaints by type ............................................................. 11
2.2 Student loan complaints by state ........................................................... 14
2.3 Student loan complaints by company .................................................... 16
3. Geographic spotlight: Nevada ...................................................................... 18
3.1 Nevada complaints by product ............................................................... 19
3.2 Nevada complaints over time ................................................................. 20
3.3 Nevada complaints by company ............................................................. 21
Appendix A:.............................................................................................................. 22

2 MONTHLY COMPLAINT REPORT: APRIL 2017
1. Complaint volume The Consumer Financial Protection Bureau (CFPB) is the first federal agency solely focused on
consumer financial protection,1 and consumer complaints2 are an integral part of that work. The
CFPB helps connect consumers with financial companies to make their voices heard. When
consumers submit a complaint, we work with companies to get the consumer a response,
generally within 15 days. We also publish basic information about complaints in our public
Consumer Complaint Database to empower consumers, inform consumer advocates and
companies, and improve the functioning of the marketplace. This Monthly Complaint Report
provides a high-level snapshot of trends in consumer complaints. The Monthly Complaint
Report uses a three-month rolling average, comparing the current average to the same period in
the prior year where appropriate, to account for monthly and seasonal fluctuations. In some
cases, we use month-to-month comparisons to highlight more immediate trends. For company-
level complaint data, we use a three-month rolling average of complaints sent to companies for
response. This company-level complaint data lags other complaint data in this report by two
months to reflect the 60 days companies have to respond to complaints, confirming a
commercial relationship with the consumer. This is consistent with complaints found in the
public Consumer Complaint Database.3
1 The Dodd-Frank Wall Street Reform and Consumer Protection Act of 2010, Pub. L. No. 111-203 (“Dodd-Frank Act”) created the CFPB to protect consumers of financial products or services and to encourage the fair and competitive operation of consumer financial markets.
2 Consumer complaints are submissions that express dissatisfaction with, or communicate suspicion of wrongful conduct by, an identifiable entity related to a consumer’s personal experience with a financial product or service.
3 This report is based on dynamic data and may slightly differ from other public reports. Company-level information should be considered in context of company size and/or market share. Complaints referred to other regulators, such as complaints about depository institutions with less than $10 billion in assets, are not published in the Consumer Complaint Database.

3 MONTHLY COMPLAINT REPORT: APRIL 2017
Visit consumerfinance.gov/complaint to learn about how we handle complaints or to submit a
complaint. Visit our Consumer Complaint Database at consumerfinance.gov/complaintdatabase
to search, sort, filter, and export complaints.
1.1 Complaint volume by product As of April 1, 2017, the CFPB has handled approximately 1,163,200 complaints, including
approximately 28,000 complaints in March 2017. Table 1 shows the percentage change in
complaint volume by product, comparing January - March 2016 with January - March 2017.4
Part of this year-to-year increase can be attributed to the CFPB updating its student loan
complaint form to accept complaints about Federal student loan servicing, starting in late
February 2016. The Bureau also initiated an enforcement action against a large student loan
servicer during the time period covered by this report.
TABLE 1: CHANGE IN COMPLAINT VOLUME
4 Complaint totals include all complaints with product breakdowns focusing on the most-complained-about consumer financial products and services.
% change 3 month average:Jan - Mar 2016
3 month average:Jan - Mar 2017
Student loan
Bank account or service
Consumer loan
Credit reporting
Credit card
Debt collection
Prepaid
Other financial service
Money transfer
Mortgage
Payday loan
Total
325%
-12%
-14%
-29%
25%
25%
23%
18%
19%
-3%
-9%
9%
23,146
417
4,531
202
187
225
7,320
2,017
3,978
1,258
1,993
773
27,590
298
3,902
178
170
219
7,989
2,372
4,911
1,568
2,488
3,284

4 MONTHLY COMPLAINT REPORT: APRIL 2017
Student loan complaints showed the greatest percentage increase from January - March
2016 (773 complaints) to January - March 2017 (3,284 complaints), representing about a
325 percent increase. Part of this year-to-year increase can be attributed to the CFPB
updating its student loan complaint form to accept complaints about Federal student
loan servicing in late February 2016. The CFPB also initiated an enforcement action
against a student loan servicer during this time period.
Payday loan complaints showed the greatest percentage decrease from January - March
2016 (417 complaints) to January - March 2017 (298 complaints), representing about a
29 percent decline.
Table 2 shows the complaint volume this month by product. The graphic at the end of each row
under the heading “Monthly complaints” shows the volume trend from when the CFPB began
accepting complaints about that product (green bullet) to the current month (blue bullet). The
monthly average reflects complaints handled per month since we began accepting those
complaints.5
5 The CFPB has used a phased-in approach to expand its complaint handling over time to include multiple products and services under its authority. Complaint-handling capacity was expanded as follows: credit card complaints on July 21, 2011, mortgage complaints on December 1, 2011, bank accounts and services, private student loans, and consumer loans on March 1, 2012, credit reporting on October 22, 2012, money transfers on April 4, 2013, debt collection on July 10, 2013, payday loans on November 6, 2013, prepaid cards, credit repair, debt settlement, and pawn and title loans on July 19, 2014, virtual currency on August 11, 2014, and Federal student loan servicing on February 26, 2016. See Table 2.

5 MONTHLY COMPLAINT REPORT: APRIL 2017
TABLE 2: MONTHLY PRODUCT TRENDS6
6 Gray bars show +/- 1 standard deviation for monthly complaints since we began accepting those complaints. Total complaints column includes 8,700 complaints where no specific consumer financial product was selected by consumers.

6 MONTHLY COMPLAINT REPORT: APRIL 2017
Debt collection complaints represented about 31 percent of complaints submitted in
March 2017.
Money transfer complaints showed the greatest month-over-month percentage increase
(34 percent).
Student loan complaints showed the greatest month-over-month percentage decrease (-
20 percent).
Debt collection, credit reporting and mortgage were the top three most-complained-
about consumer financial products and services, collectively representing about 65
percent of complaints submitted in March 2017.

7 MONTHLY COMPLAINT REPORT: APRIL 2017
1.2 Complaint volume by state TABLE 3: CHANGE IN COMPLAINT VOLUME BY STATE

8 MONTHLY COMPLAINT REPORT: APRIL 2017
Part of this year-to-year increase reflected in Table 3 can be attributed to the CFPB
updating its student loan complaint form to accept complaints about Federal student
loan servicing, starting in late February 2016. The Bureau also initiated an enforcement
action against a large student loan servicer during the time period covered by this report.
Montana (54 percent), Georgia (46 percent), and Wyoming (45 percent) experienced the
greatest complaint volume percentage increase from January - March 2016 to January -
March 2017.
New Mexico (-20 percent), Iowa (-5 percent), and Kansas (-0.7 percent) experienced the
greatest complaint volume percentage decrease from January - March 2016 to January -
March 2017.7
Of the five most populated states, Texas (35 percent) experienced the greatest complaint
volume percentage increase and Florida (8 percent) experienced the least complaint
volume percentage increase from January - March 2016 to January - March 2017.
7 Complaints per 100k population are defined as cumulative complaints divided by Census estimated 2015 population.
Census population data source: http://www.census.gov/popest/data/state/totals/2015/index.html

9 MONTHLY COMPLAINT REPORT: APRIL 2017
1.3 Complaint volume by company Complaint data in this section lags other complaint data by two months to reflect the 60 days
companies have to respond to complaints, confirming a commercial relationship with the
consumer. Figure 1 and Table 4 show the top 10 most-complained-about companies for
November 2016 - January 2017. Figure 1 also shows which products consumers complained
about for each company. The “Other” category includes consumer loans, money transfers,
payday loans, prepaid cards, and other financial service complaints. Company-level information
should be considered in context of company size and/or market share. In addition, during the
time period covered by this report the CFPB updated its student loan complaint form to accept
complaints about Federal student loan servicing, starting in late February 2016.
FIGURE 1: TOP 10 MOST-COMPLAINED-ABOUT COMPANIES
% changevs. 3
monthperiod
last year
16%32%27%9%7%30%30%25%17%813%
NavientSolutions,
LLC
Equifax Experian TransUnion WellsFargo
Bank ofAmerica
JPMorganChase
Citibank CapitalOne
SynchronyFinancial
0
200
400
600
800
1,000
1,200
1,400
Nov
embe
r 20
16 -
Jan
uary
201
7 av
erag
e m
onth
ly c
ompl
aint
s
1,439
1,181
1,0631,003
970
802
719
638
395
285
ProductsBank acct/serviceCredit cardCredit reporting
Debt collectionMortgageOther
Student Loan

10 MONTHLY COMPLAINT REPORT: APRIL 2017
TABLE 4: TOP 10 MOST-COMPLAINED-ABOUT COMPANIES
Company
3 month average:
November 2016 -
January 2017
% change vs. 3
month period last
year
Monthly
average8
Total
complaints
Navient Solutions,
LLC 1,439 813% 246 14,510
Equifax 1,181 17% 857 44,572
Experian 1,063 25% 809 42,085
TransUnion 1,003 30% 699 36,344
Wells Fargo 970 30% 830 51,441
Bank of America 802 7% 1,030 63,842
JPMorgan Chase 719 9% 659 40,857
Citibank 638 27% 532 32,993
Capital One 395 32% 309 19,167
Synchrony
Financial 285 16% 195 12,117
By average monthly complaint volume, Navient Solutions, LLC. (1,439), Equifax (1,181),
and Experian (1,063) were the most-complained-about companies for November 2016 -
January 2017.
Navient Solutions, LLC experienced the greatest percentage increase in average monthly
complaint volume (813 percent) from November 2015 - January 2016 to November 2016
- January 2017. The CFPB announced an enforcement action against Navient during this
time period. Part of this year-to-year increase can also be attributed to the CFPB
updating its student loan complaint form to accept complaints about Federal student
loan servicing in late February 2016.
Bank of America experienced the least percentage increase in average monthly complaint
volume (7 percent) from November 2015 - January 2016 to November 2016 - January
2017.
8 Monthly average calculated from the month the CFPB first handled complaints for the company. Total complaints
represent cumulative complaints sent to companies through January 2017.
11 MONTHLY COMPLAINT REPORT: APRIL 2017
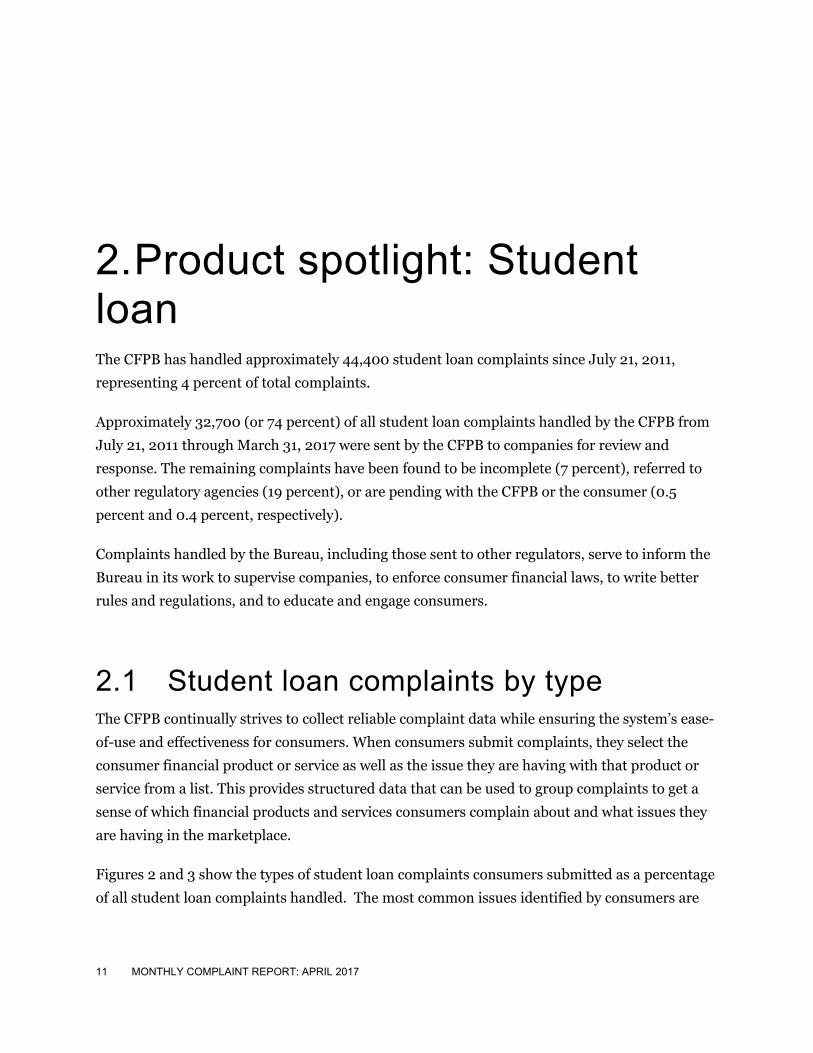
2. Product spotlight: Student loan The CFPB has handled approximately 44,400 student loan complaints since July 21, 2011,
representing 4 percent of total complaints.
Approximately 32,700 (or 74 percent) of all student loan complaints handled by the CFPB from
July 21, 2011 through March 31, 2017 were sent by the CFPB to companies for review and
response. The remaining complaints have been found to be incomplete (7 percent), referred to
other regulatory agencies (19 percent), or are pending with the CFPB or the consumer (0.5
percent and 0.4 percent, respectively).
Complaints handled by the Bureau, including those sent to other regulators, serve to inform the
Bureau in its work to supervise companies, to enforce consumer financial laws, to write better
rules and regulations, and to educate and engage consumers.
2.1 Student loan complaints by type The CFPB continually strives to collect reliable complaint data while ensuring the system’s ease-
of-use and effectiveness for consumers. When consumers submit complaints, they select the
consumer financial product or service as well as the issue they are having with that product or
service from a list. This provides structured data that can be used to group complaints to get a
sense of which financial products and services consumers complain about and what issues they
are having in the marketplace.
Figures 2 and 3 show the types of student loan complaints consumers submitted as a percentage
of all student loan complaints handled. The most common issues identified by consumers are

12 MONTHLY COMPLAINT REPORT: APRIL 2017
problems dealing with their lenders or servicers (64 percent) and being unable to repay their
loans (33 percent).
FIGURE 2: TYPES OF STUDENT LOAN COMPLAINTS REPORTED BY CONSUMERS
FIGURE 3: TYPES OF STUDENT LOAN PRODUCTS CONSUMER COMPLAIN ABOUT9
We also collect unstructured data from consumers and companies during the complaint process.
The consumer’s narrative description of what happened, consumer-provided documents, the
company’s response, and company-provided documents are examples of unstructured data. The
Bureau uses a variety of approaches to analyze consumer complaints including, for example,
cohort and text analytics to identify trends and possible consumer harm. Our review and
analysis of unstructured data offers deeper insights into consumers’ complaints and helps the
Bureau understand problems consumers are experiencing with student loans.
Federal student loan borrowers reported that when contacting their loan servicers
regarding financial distress, servicers provided them with information on hardship
forbearance or deferment, instead of potentially more beneficial repayment options like
income-driven repayment plans.
Federal student loan borrowers complained of difficulty enrolling in income-driven
repayment plans. Borrowers reported lost documentation, extended application
9 The CFPB updated its student loan complaint form to accept complaints about Federal student loan servicing in late February 2016.

13 MONTHLY COMPLAINT REPORT: APRIL 2017
processing times, and unclear guidance when seeking to switch from one income-driven
repayment plan to another.
Federal student loan borrowers described their experiences when trying to obtain
guidance in completing annual income recertification for their income-driven repayment
plan. Borrowers reported receiving insufficient information from their servicers to meet
recertification deadlines and lengthy processing times.
Some federal student loan borrowers stated their payments were misapplied. Borrowers
reported overpayments were not applied to specified accounts but rather applied to all
accounts managed by the servicer. Additionally, some borrowers’ overpayments—
intended to reduce principal balance—were credited to the account as an early payment,
resulting in their account reflecting a paid ahead status.
Concerns about Public Student Loan Forgiveness (PSLF) and other forgiveness programs
were expressed by borrowers. Some borrowers stated that after years of making
payments, they are not enrolled in a qualifying payment program. Some indicated that
their servicer’s reason for the declination was because their loan had been previously
consolidated. Many consumers expressed concern that their payments are not being
counted toward their PSLF 120 payments requirement because of delays in Income
Driven Repayment (IDR) plan enrollment and recertification. Borrowers who are eligible
for other forgiveness programs (e.g., teachers) reported problems with their servicers as
they were declined for loan forgiveness based on inaccurate employment data.
Borrowers who submitted complaints for non-Federal student loans selected the sub-
issue of trouble with how payments are handled more frequently than other issues.
These borrowers complained of misapplied payments and inaccurate accounting of
payments.
Non-Federal and Federal student loan borrowers reported issues of incorrect reporting
of their loans to the credit reporting companies. Borrowers stated their loan accounts
were paid in full or not in a delinquent status but were being reported negatively. Some
borrowers reported being contacted by collection companies for accounts that had been
paid in full or for debts that were not owed.

14 MONTHLY COMPLAINT REPORT: APRIL 2017
2.2 Student loan complaints by state Table 5 shows the student loan complaint volume percentage change by state.10 Some state-level
increases can be attributed to the CFPB updating its student loan complaint form to accept
complaints about Federal student loan servicing, starting in late February 2016. The Bureau also
initiated an enforcement action against a large student loan servicer during the time period
covered by this report. Some of the highlights include:
Louisiana (846 percent), Washington (732 percent), and Kansas (691 percent)
experienced the greatest percentage increase in student loan complaints from January -
March 2016 to January - March 2017.
Wyoming (0 percent), Utah (57 percent), and Delaware (100 percent) experienced the
least percentage increase in student loan complaints from January - March 2016 to
January - March 2017.
Of the five most populated states, Texas (601 percent) experienced the greatest
percentage increase and California (228 percent) experienced the least percentage
increase in student loan complaints from January - March 2016 to January - March
2017.
10 Three-month averages are rounded, and percentage changes are based on non-rounded averages.

15 MONTHLY COMPLAINT REPORT: APRIL 2017
TABLE 5: STUDENT LOAN COMPLAINT VOLUME PERCENT CHANGE BY STATE

16 MONTHLY COMPLAINT REPORT: APRIL 2017
2.3 Student loan complaints by company Each month, this section highlights the most-complained-about companies to which we sent
complaints.
Companies are expected to respond to complaints sent to them within 15 days. If a complaint
cannot be closed within 15 days, the company may indicate that its work on the complaint is “In
progress” and provide a final response within 60 days. Company responses provided outside of
those windows are considered untimely.
Companies can alert the Bureau if they determine that a complaint is a duplicate or was
submitted by an unauthorized third party, or when they are otherwise unable to confirm a
current or prior commercial relationship with the consumer. Such complaints are not published
in the Consumer Complaint Database or included in company-specific complaint volume
presented in this report.
The most-complained-about companies highlighted in Table 6 received about 90 percent of all
student loan complaints sent to companies for response in November 2016 - January 2017. This
section highlights those complaints. Company-level information should be considered in context
of company size and/or market share. In addition, during the time period covered by this report
the CFPB updated its student loan complaint form to accept complaints about Federal student
loan servicing, starting in late February 2016.

17 MONTHLY COMPLAINT REPORT: APRIL 2017
TABLE 6: MOST-COMPLAINED-ABOUT COMPANIES FOR STUDENT LOAN11
Company
3 month
average: Nov
2016 - Jan 2017
% change vs. 3
month period
last year
3 month
average %
untimely:
Nov 2016 -
Jan 2017
Total Student
loan complaints
Navient Solutions,
LLC. 1,400.0 1,073% 0% 12,734
AES/PHEAA 148.7 269% 0% 3,105
Nelnet 73.0 7,200% 0% 756
Sallie Mae 46.7 133% 0% 1,090
Great Lakes 40.3 3,933% 0.8% 420
Wells Fargo 32.7 69% 17% 1,258
ACS Education
Services 22.3 347% 4% 706
Transworld
Systems Inc. 19.3 9% 0% 391
Of these companies, Nelnet saw the greatest percentage increase in student loan
complaints (7,200 percent) from November 2015 - January 2016 to November 2016 -
January 2017.
Of these companies, Transworld Systems, Inc. saw the least percentage increase in
student loan complaints (9 percent) during the same period.
Wells Fargo had the greatest rate of untimely responses (17 percent) during the three
month period of November 2016 - January 2017.
11 Three-month averages are rounded, and percentage changes are based on non-rounded averages.
18 MONTHLY COMPLAINT REPORT: APRIL 2017
3. Geographic spotlight: Nevada Each month we spotlight the complaints from one part of the country. This month we are
highlighting complaint trends in Nevada and the Las Vegas metro area. As of April 1, 2017,
about 14,600 complaints were from Nevada consumers, and about 10,800 were from Las
Vegas.12
12 The Las Vegas metro area is defined as zip codes from the Las Vegas-Paradise, NV Core-Based Statistical Areas (CBSA). http://www.census.gov/population/metro/files/zip07_cbsa06.zip. Complaint counts are based on consumer-provided ZIP code and unless otherwise noted the geographic spotlight section reflects cumulative complaint data since July 21, 2011.

19 MONTHLY COMPLAINT REPORT: APRIL 2017
3.1 Nevada complaints by product Figure 4 shows the distribution of complaints by product for Las Vegas, Nevada, and the United
States as a whole.
FIGURE 4: LAS VEGAS VS. NEVADA AND NATIONAL SHARE OF COMPLAINTS BY PRODUCT
Consumers in both Las Vegas and Nevada submitted debt collection complaints at a rate
of 29 percent. These rates are similar to the 27 percent national average.
Consumers in Las Vegas and Nevada complained about mortgages at a rate of 22 percent
and 23 percent respectively, similar to the 23 percent national average.

20 MONTHLY COMPLAINT REPORT: APRIL 2017
Consumers in Las Vegas and Nevada complained about credit reporting at a rate of 19
percent and 18 percent respectively, similar to the 17 percent national average.
3.2 Nevada complaints over time Average monthly complaints increased 17 percent from January 2016 through March 2016 (292
complaints per month) to January 2017 through March 2017 (343 complaints per month),
similar to the national rate of 19 percent.
FIGURE 5: NEVADA MONTHLY COMPLAINT VOLUME TREND

21 MONTHLY COMPLAINT REPORT: APRIL 2017
3.3 Nevada complaints by company
FIGURE 6: MOST-COMPLAINED-ABOUT COMPANIES BY NEVADA CONSUMERS
Company-level information should be considered in context of company size and/or market
share in a given geographic area.
In the February 2016 - January 2017 period, Wells Fargo, Experian, and Equifax led the
list of most-complained-about companies by Nevada consumers.
Wells Fargo Experian Equifax TransUnion Bank ofAmerica
JPMorganChase
Citibank U.S.Bancorp
Ocwen USAASavings
0
20
40
60
80
100
120
140
160
180
200
220
Feb
ruar
y 20
16 -
Jan
uary
201
7 N
evad
a co
mpl
aint
s
206
194
172
160
148
91
7772
64 62
ProductsBank acct/serviceCredit cardCredit reporting
Debt collectionMortgageOther
Student Loan

22 MONTHLY COMPLAINT REPORT: APRIL 2017
APPENDIX A:
TABLE 7: TOTAL COMPLAINTS BY MONTH AND PRODUCT
Ban
k ac
cou
nt
or
serv
ices
Co
ns
um
er
loan
Cre
dit
car
d
Cre
dit
re
po
rtin
g
Deb
t co
llect
ion
Mo
ney
tr
ansf
er
Mo
rtg
ag
e
Oth
er
fin
anci
al
serv
ices
Pay
day
lo
an
Pre
pai
d
Stu
de
nt
loan
s
To
tal
11-Jul 13 3 517 2 4 0 14 4 0 2 2 564
11-Aug 140 27 1,817 12 6 1 127 9 0 5 5 2,166
11-Sep 191 45 1,718 18 17 2 179 28 4 7 3 2,233
11-Oct 159 26 1,748 11 8 3 178 24 0 7 4 2,188
11-Nov 199 39 1,752 5 9 1 275 17 1 0 5 2,324
11-Dec 206 29 1,604 8 6 2 1,696 0 0 14 4 3,584
12-Jan 191 30 1,453 4 5 0 2,525 1 3 6 11 4,252
12-Feb 216 37 1,433 10 12 2 2,694 0 0 6 8 4,437
12-Mar 1,463 220 1,615 12 31 7 3,441 6 7 17 666 7,526
12-Apr 1,504 250 1,352 13 31 3 3,395 2 8 13 315 6,902
12-May 1,963 366 1,661 19 36 5 4,685 3 8 12 242 9,069
12-Jun 1,692 340 1,976 12 34 2 4,642 7 6 10 757 9,533
12-Jul 1,619 329 1,794 32 33 3 4,171 6 4 5 315 8,353
12-Aug 1,596 359 1,586 33 24 0 4,610 8 3 6 298 8,556
12-Sep 1,367 304 1,256 21 17 0 3,653 11 4 12 260 6,927
12-Oct 1,567 388 1,699 551 18 2 4,013 6 6 7 398 8,686
12-Nov 1,252 328 1,401 1,252 24 1 3,525 4 1 4 332 8,156
12-Dec 1,248 343 1,312 1,370 62 1 3,737 4 15 8 272 8,420
13-Jan 1,651 391 1,454 1,561 94 3 7,225 6 8 4 384 12,877
13-Feb 1,459 352 1,442 1,710 113 11 5,681 11 16 9 331 11,230
13-Mar 1,685 439 1,607 1,728 153 6 5,633 3 15 18 373 11,815
13-Apr 1,422 457 1,508 1,903 179 79 5,623 3 16 16 371 11,704
13-May 1,415 442 1,364 1,875 111 58 5,250 2 26 16 302 10,956
13-Jun 1,490 426 1,312 2,042 108 93 5,246 4 22 5 287 11,089
13-Jul 1,657 446 1,278 2,236 2,433 100 5,237 2 17 11 341 13,786
13-Aug 1,683 520 1,352 2,273 4,224 91 4,961 2 40 8 350 15,538
13-Sep 1,666 608 1,357 2,326 6,298 121 4,341 3 36 5 371 17,166
13-Oct 1,800 540 1,369 2,267 4,865 155 3,864 4 35 5 422 15,372
13-Nov 1,565 472 1,246 2,340 6,653 168 3,475 1 396 3 344 16,708
13-Dec 1,535 508 1,322 1,943 5,972 137 3,386 3 385 4 409 15,633

23 MONTHLY COMPLAINT REPORT: APRIL 2017
Ban
k ac
cou
nt
or
serv
ices
Co
ns
um
er
loan
Cre
dit
car
d
Cre
dit
re
po
rtin
g
Deb
t co
llect
ion
Mo
ney
tr
ansf
er
Mo
rtg
ag
e
Oth
er
fin
anci
al
serv
ices
Pay
day
lo
an
Pre
pai
d
Stu
de
nt
loan
s
To
tal
14-Jan 1,829 580 1,549 3,221 8,137 162 4,240 0 441 8 491 20,694
14-Feb 1,808 581 1,615 3,509 7,795 144 4,545 2 374 3 494 20,889
14-Mar 2,047 663 1,668 3,556 8,422 171 4,898 3 413 6 584 22,459
14-Apr 1,987 688 1,665 3,850 8,313 171 4,757 8 402 1 541 22,411
14-May 1,950 591 1,497 3,394 7,374 175 4,099 2 324 5 537 19,983
14-Jun 1,943 696 1,497 3,463 7,753 184 4,134 4 347 5 584 20,626
14-Jul 2,026 872 1,571 3,816 7,993 157 4,411 62 587 94 582 22,276
14-Aug 1,564 1,002 1,689 4,647 7,223 148 4,340 104 645 138 626 22,320
14-Sep 1,593 979 1,548 4,379 6,381 164 4,114 110 587 151 594 20,806
14-Oct 1,625 1,026 1,437 3,561 6,685 132 4,474 124 532 139 654 20,583
14-Nov 1,391 910 1,357 3,569 6,131 123 3,506 102 478 129 546 18,396
14-Dec 1,463 982 1,459 3,698 6,070 160 3,587 92 468 144 548 18,862
15-Jan 1,617 998 1,515 4,149 6,547 144 3,513 107 458 165 575 19,941
15-Feb 1,457 990 1,788 4,032 6,874 141 3,601 112 472 183 603 20,403
15-Mar 1,725 1,092 1,896 4,815 8,000 195 4,287 158 538 199 719 23,797
15-Apr 1,748 941 1,757 4,733 7,179 190 4,238 146 484 192 686 22,488
15-May 1,704 1,029 1,825 4,493 7,149 208 4,266 156 414 177 645 22,266
15-Jun 1,968 1,095 1,890 4,297 7,471 211 4,664 166 460 195 626 23,250
15-Jul 1,997 1,344 1,961 6,547 8,184 235 4,464 203 478 187 645 26,424
15-Aug 2,042 1,340 1,931 5,591 7,545 218 4,949 197 445 179 656 25,299
15-Sep 1,907 1,253 1,947 4,679 6,666 198 4,566 148 450 179 612 22,817
15-Oct 2,247 1,292 1,964 4,432 6,810 229 4,435 160 508 892 568 23,795
15-Nov 1,984 1,092 1,819 3,731 6,291 192 3,951 191 421 260 457 20,612
15-Dec 1,974 1,041 1,883 3,419 6,342 190 3,794 162 382 223 467 20,137
16-Jan 2,110 1,174 2,001 3,367 6,681 222 4,192 183 422 227 567 21,366
16-Feb 1,834 1,251 1,997 3,705 7,248 198 4,455 171 394 206 618 22,333
16-Mar 2,036 1,349 2,052 4,861 8,030 187 4,947 207 436 241 1,134 25,740
16-Apr 1,880 1,263 1,995 4,507 7,234 195 4,315 188 383 177 1,190 23,553
16-May 2,192 1,286 1,983 4,807 6,845 198 4,273 126 395 226 963 23,607
16-Jun 2,541 1,274 1,979 4,907 6,943 197 4,289 199 370 221 1,001 24,187
16-Jul 2,379 1,310 2,147 5,207 6,471 164 3,907 137 335 208 1,167 23,653
16-Aug 2,652 1,491 2,598 4,987 9,642 228 4,288 261 422 244 1,246 28,356
16-Sep 3,086 1,528 2,690 4,591 7,298 208 4,463 173 329 187 1,322 26,121
16-Oct 2,834 1,597 2,637 5,222 7,703 189 4,318 176 336 180 1,237 26,711
16-Nov 2,424 1,375 2,221 4,043 6,688 181 3,953 161 336 181 1,040 22,901
16-Dec 2,414 1,466 2,283 3,719 7,144 174 3,732 145 258 202 844 22,575

24 MONTHLY COMPLAINT REPORT: APRIL 2017
Ban
k ac
cou
nt
or
serv
ices
Co
ns
um
er
loan
Cre
dit
car
d
Cre
dit
re
po
rtin
g
Deb
t co
llect
ion
Mo
ney
tr
ansf
er
Mo
rtg
ag
e
Oth
er
fin
anci
al
serv
ices
Pay
day
lo
an
Pre
pai
d
Stu
de
nt
loan
s
To
tal
17-Jan 2,601 1,612 2,321 4,542 7,650 164 4,119 169 308 228 5,289 29,234
17-Feb 2,386 1,458 2,243 4,693 7,607 158 3,622 158 291 223 2,530 25,555
17-Mar 2,476 1,633 2,552 5,498 8,711 212 3,965 183 294 206 2,033 27,980
Total13 115,055 53,208 118,732 195,826 316,810 8,174 272,153 5,340 17,499 7,256 44,403 1,163,156
13 Total column includes approximately 8,700 complaints where no specific consumer financial product was selected by consumers.

25 MONTHLY COMPLAINT REPORT: APRIL 2017
TABLE 8: TOTAL COMPLAINTS BY LOCALITY AND PRODUCT
Ban
k ac
cou
nt
or
serv
ices
Co
ns
um
er
loan
Cre
dit
car
d
Cre
dit
re
po
rtin
g
Deb
t co
llect
ion
Mo
ney
tr
ansf
er
Mo
rtg
ag
e
Oth
er
fin
anci
al
serv
ices
Pay
day
lo
an
Pre
pai
d
Stu
de
nt
loan
s
To
tal
Alabama 1,145 884 969 2,470 4,236 71 2,128 75 354 98 522 13,070
Alaska 136 62 190 227 504 13 253 9 34 8 65 1,508
American Samoa 11 2 5 6 15 1 7 0 0 0 3 51
Arizona 2,438 1,330 2,631 3,852 7,502 154 6,232 85 262 150 850 25,696
Arkansas 507 305 504 1,073 1,638 40 944 31 76 33 250 5,440
California 15,411 6,396 15,742 24,826 40,038 1,136 46,412 636 1,845 1,032 4,739 159,158
Colorado 1,801 851 2,185 3,201 5,414 124 4,667 80 241 122 758 19,574
Connecticut 1,533 575 1,707 1,857 2,884 88 3,168 67 185 95 641 12,903
Delaware 694 331 722 861 1,627 27 1,268 34 105 27 159 5,889
District of Columbia 922 254 790 944 1,588 68 1,393 55 128 55 412 6,690
Federated States of Micronesia 6 2 14 10 16 1 15 1 2 0 1 68
Florida 10,189 4,354 10,251 22,574 28,457 631 29,346 388 1,236 458 2,918 111,559
Georgia 4,638 2,713 3,951 9,853 12,833 286 13,446 170 417 331 1,793 50,751
Guam 15 14 14 30 48 3 29 1 3 1 8 166
Hawaii 306 155 473 662 1,052 22 1,159 16 43 15 116 4,042
Idaho 290 181 444 714 1,493 28 804 8 70 12 172 4,241
Illinois 4,633 1,668 4,287 7,298 10,866 266 9,274 141 628 305 1,643 41,273
Indiana 1,233 736 1,271 2,158 4,348 93 2,484 77 356 89 861 13,794
Iowa 405 247 634 941 1,827 44 816 43 135 47 292 5,466
Kansas 610 315 699 917 2,198 43 1,008 26 116 46 274 6,309
Kentucky 744 472 785 1,577 3,185 65 1,589 43 216 58 438 9,229
Louisiana 1,003 726 901 2,495 4,434 86 2,316 63 350 89 443 12,982
Maine 354 172 578 425 959 16 931 25 60 36 205 3,782
Marshall Islands 5 8 8 4 14 0 11 1 0 0 2 53
Maryland 3,576 1,638 3,409 5,132 8,316 235 10,010 168 627 196 1,300 34,905
Massachusetts 2,887 780 2,953 2,675 4,317 202 5,416 112 305 151 1,177 21,101
Michigan 2,682 1,216 2,627 4,281 7,790 187 7,804 133 550 204 1,438 29,210
Minnesota 1,408 470 1,586 1,763 3,361 119 3,263 71 258 88 715 13,211
Mississippi 539 448 437 1,142 2,114 39 1,047 27 174 49 247 6,297
Missouri 1,352 932 1,407 2,459 5,033 105 3,405 80 312 117 841 16,133
Montana 134 85 242 308 791 11 351 10 39 12 96 2,093
Nebraska 392 176 457 465 1,412 24 661 21 94 29 220 3,974

26 MONTHLY COMPLAINT REPORT: APRIL 2017
Ban
k ac
cou
nt
or
serv
ices
Co
ns
um
er
loan
Cre
dit
car
d
Cre
dit
re
po
rtin
g
Deb
t co
llect
ion
Mo
ney
tr
ansf
er
Mo
rtg
ag
e
Oth
er
fin
anci
al
serv
ices
Pay
day
lo
an
Pre
pai
d
Stu
de
nt
loan
s
To
tal
Nevada 1,389 726 1,296 2,585 4,159 93 3,413 54 260 101 348 14,559
New Hampshire 430 189 520 580 1,178 23 1,644 22 68 31 257 4,983
New Jersey 4,923 1,823 4,957 6,350 9,705 288 12,257 244 680 258 1,650 43,462
New Mexico 544 330 534 1,161 1,925 57 1,105 30 127 29 205 6,095
New York 9,414 2,610 10,445 12,586 16,083 626 17,207 419 483 476 3,235 74,072
North Carolina 3,085 1,829 3,237 5,630 8,322 194 7,803 158 489 183 1,145 32,335
North Dakota 89 55 118 240 442 9 148 8 16 8 45 1,184
Northern Mariana Islands 7 1 3 7 10 1 7 0 0 0 5 41
Ohio 3,420 1,869 3,982 4,904 10,611 207 7,282 151 707 261 1,874 35,511
Oklahoma 615 583 729 1,415 3,102 66 1,401 35 270 56 332 8,676
Oregon 1,367 499 1,459 1,776 3,844 70 3,274 70 185 96 611 13,368
Palau 1 1 2 3 1 0 6 0 0 0 0 14
Pennsylvania 4,870 1,849 4,514 6,306 10,851 272 8,897 224 663 257 2,307 41,264
Puerto Rico 364 158 386 733 546 15 503 19 6 9 70 2,855
Rhode Island 477 166 449 433 970 28 802 24 100 23 142 3,633
South Carolina 1,212 1,047 1,217 2,947 4,910 101 3,155 59 286 94 647 15,765
South Dakota 151 113 231 232 638 17 239 10 37 9 85 1,773
Tennessee 1,691 1,164 1,624 2,964 6,624 105 3,500 105 468 122 786 19,266
Texas 7,371 4,909 7,534 22,203 31,674 571 13,443 335 1,610 517 2,715 93,472
Utah 484 322 683 1,002 2,218 38 1,494 23 128 35 235 6,709
Vermont 220 92 275 249 387 11 428 9 23 17 117 1,837
Virgin Islands 37 10 39 78 55 5 53 2 4 1 6 293
Virginia 3,358 1,791 3,846 6,332 9,462 272 8,299 191 544 250 1,351 35,954
Washington 2,105 846 2,326 3,491 6,564 161 6,288 97 277 166 1,220 23,697
West Virginia 308 147 341 659 926 32 505 37 31 27 208 3,267
Wisconsin 1,246 606 1,709 1,597 4,006 93 2,833 57 292 126 615 13,285
Wyoming 73 67 124 202 435 7 218 10 34 3 57 1,245
U.S. Armed Forces – Americas 10 1 6 1 24 1 9 2 1 2 2 61
U.S. Armed Forces – Europe 47 26 39 73 105 6 98 4 0 2 34 435
U.S. Armed Forces – Pacific 21 21 43 50 93 3 57 0 2 0 15 305
Unspecified 3,727 860 3,191 1,837 6,630 574 4,128 244 487 144 485 23,122
Total 115,055 53,208 118,732 195,826 316,810 8,174 272,153 5,340 17,499 7,256 44,403 1,163,156
27 MONTHLY COMPLAINT REPORT: APRIL 2017
Visit our Consumer Complaint Database at consumerfinance.gov/complaintdatabase to search,
sort, filter, and export complaints.
Visit consumerfinance.gov/complaint to learn about how we handle complaints or to submit a
complaint.