Introduction to Agribusiness IAFNR Agribusiness ModuleIAFNR Agribusiness Module.
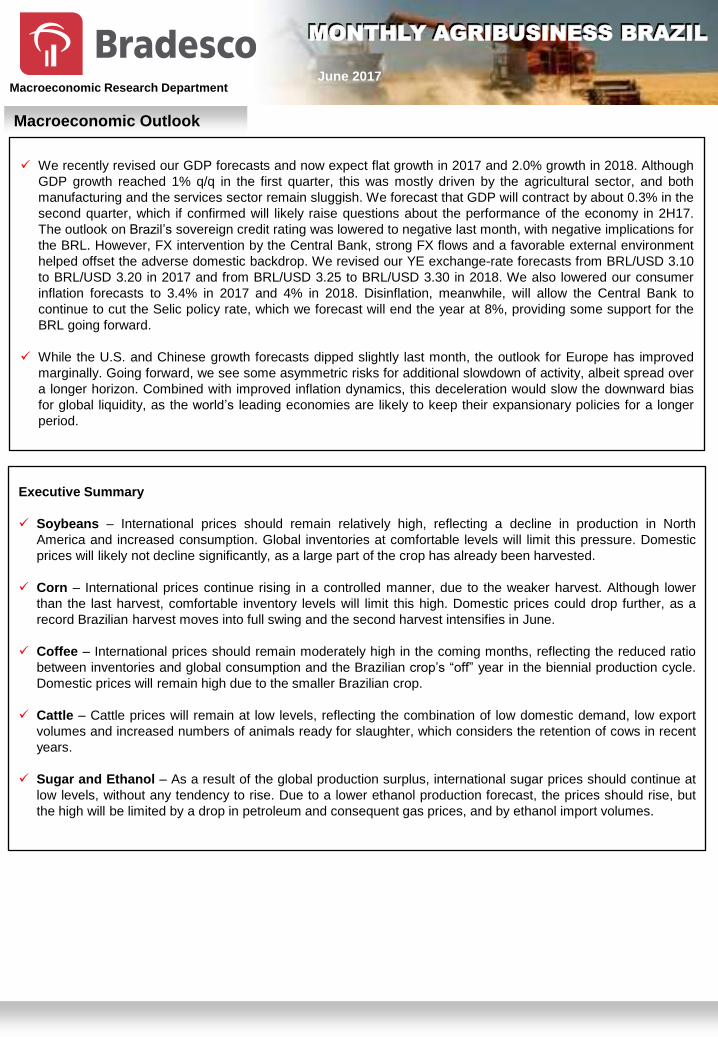
We recently revised our GDP forecasts and now expect flat growth in 2017 and 2.0% growth in 2018. Although
GDP growth reached 1% q/q in the first quarter, this was mostly driven by the agricultural sector, and both
manufacturing and the services sector remain sluggish. We forecast that GDP will contract by about 0.3% in the
second quarter, which if confirmed will likely raise questions about the performance of the economy in 2H17.
The outlook on Brazil’s sovereign credit rating was lowered to negative last month, with negative implications for
the BRL. However, FX intervention by the Central Bank, strong FX flows and a favorable external environment
helped offset the adverse domestic backdrop. We revised our YE exchange-rate forecasts from BRL/USD 3.10
to BRL/USD 3.20 in 2017 and from BRL/USD 3.25 to BRL/USD 3.30 in 2018. We also lowered our consumer
inflation forecasts to 3.4% in 2017 and 4% in 2018. Disinflation, meanwhile, will allow the Central Bank to
continue to cut the Selic policy rate, which we forecast will end the year at 8%, providing some support for the
BRL going forward.
While the U.S. and Chinese growth forecasts dipped slightly last month, the outlook for Europe has improved
marginally. Going forward, we see some asymmetric risks for additional slowdown of activity, albeit spread over
a longer horizon. Combined with improved inflation dynamics, this deceleration would slow the downward bias
for global liquidity, as the world’s leading economies are likely to keep their expansionary policies for a longer
period.
June 2017 Macroeconomic Research Department
Macroeconomic Outlook
MONTHLY AGRIBUSINESS BRAZIL MONTHLY AGRIBUSINESS BRAZIL
Executive Summary
Soybeans – International prices should remain relatively high, reflecting a decline in production in North
America and increased consumption. Global inventories at comfortable levels will limit this pressure. Domestic
prices will likely not decline significantly, as a large part of the crop has already been harvested.
Corn – International prices continue rising in a controlled manner, due to the weaker harvest. Although lower
than the last harvest, comfortable inventory levels will limit this high. Domestic prices could drop further, as a
record Brazilian harvest moves into full swing and the second harvest intensifies in June.
Coffee – International prices should remain moderately high in the coming months, reflecting the reduced ratio
between inventories and global consumption and the Brazilian crop’s “off” year in the biennial production cycle.
Domestic prices will remain high due to the smaller Brazilian crop.
Cattle – Cattle prices will remain at low levels, reflecting the combination of low domestic demand, low export
volumes and increased numbers of animals ready for slaughter, which considers the retention of cows in recent
years.
Sugar and Ethanol – As a result of the global production surplus, international sugar prices should continue at
low levels, without any tendency to rise. Due to a lower ethanol production forecast, the prices should rise, but
the high will be limited by a drop in petroleum and consequent gas prices, and by ethanol import volumes.
Macroeconomic Research Department
15.39419.419
25.934 26.16031.370 32.345
41.917
52.018 49.98955.027
60.01857.162
68.688
75.324
66.383
81.49986.121
95.435
113.923
8.000
28.000
48.000
68.000
88.000
108.000
90
/91
91
/92
92
/93
93
/94
94
/95
95
/96
96
/97
97
/98
98
/99
99
/00
00
/01
01
/02
02
/03
03
/04
04
/05
05
/06
06
/07
07
/08
08
/09
09
/10
10
/11
11
/12
12
/13
13
/14
14
/15
15
/16
16
/17
*
em mil toneladasFonte e Projeção: CONAB
Elaboração: BradescoProdução Nacional de Soja 1990 - 2012
2
SO
YB
EA
NS
Soybean – International prices should remain relatively high, reflecting a
decline in production in North America and increased consumption. Global
inventories at comfortable levels will limit this pressure. Domestic prices will
likely not decline significantly, as a large part of the crop has already been
harvested
Fundamentals
The USDA released the 2nd report for the 2017/18 grain harvest, which was already planted in the U.S.
and will start being planted in Brazil and in Argentina in September. U.S. sugar cane production is
estimated at 115.8 million tons, or 1% lower than the previous harvest (117.2 million tons). Planted
acreage is expected to be up 7.1%, but North American productivity is forecast to drop 7.9%. Global
consumption is expected to grow 3.9%. Therefore, the global stock-to-consumption ratio is estimated at
26.8%, down from 28.1% in the last harvest. Despite the decline in production, global stocks remain at
comfortable levels because of the last four strong harvests. Argentine production next year is projected at
57 million tons, unchanged relative to the current harvest. For Brazil, the USDA forecasts production of
107 million tons, or 6.1% lower than the current harvest (114.0 million tons).
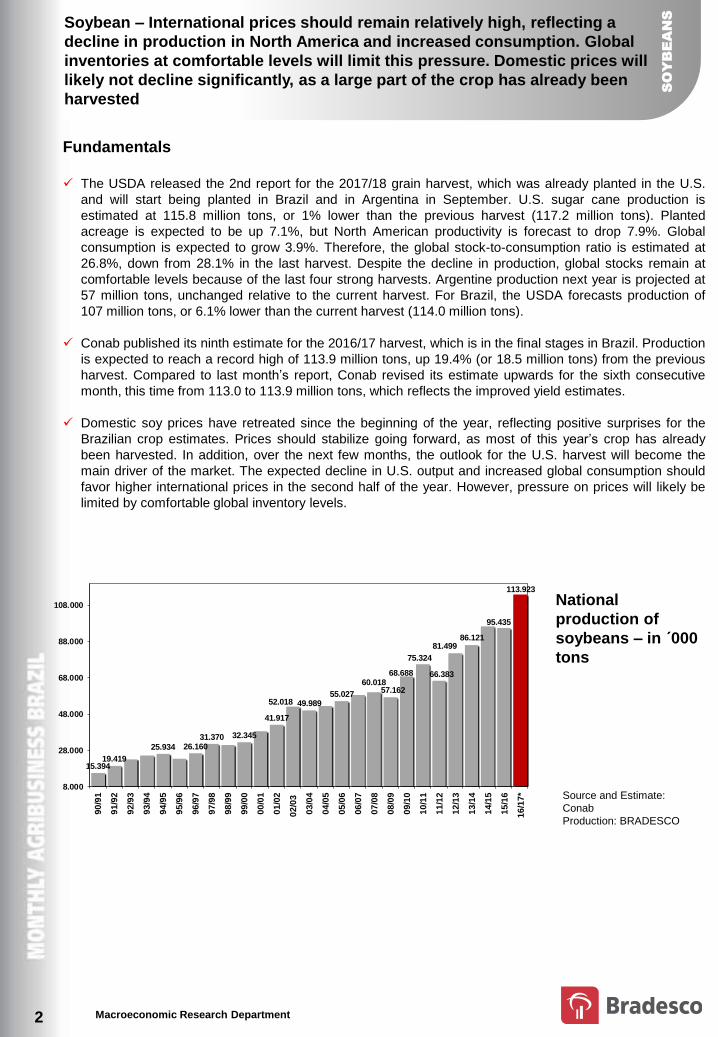
Conab published its ninth estimate for the 2016/17 harvest, which is in the final stages in Brazil. Production
is expected to reach a record high of 113.9 million tons, up 19.4% (or 18.5 million tons) from the previous
harvest. Compared to last month’s report, Conab revised its estimate upwards for the sixth consecutive
month, this time from 113.0 to 113.9 million tons, which reflects the improved yield estimates.
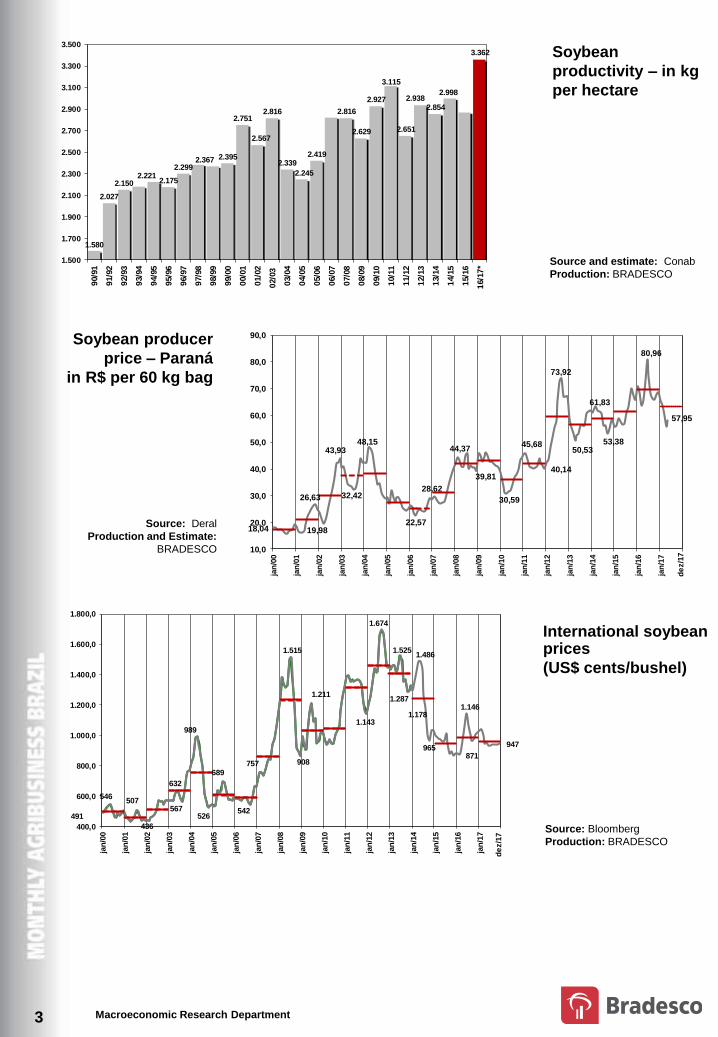
Domestic soy prices have retreated since the beginning of the year, reflecting positive surprises for the
Brazilian crop estimates. Prices should stabilize going forward, as most of this year’s crop has already
been harvested. In addition, over the next few months, the outlook for the U.S. harvest will become the
main driver of the market. The expected decline in U.S. output and increased global consumption should
favor higher international prices in the second half of the year. However, pressure on prices will likely be
limited by comfortable global inventory levels.
Source and Estimate:
Conab
Production: BRADESCO
National
production of
soybeans – in ´000
tons
Macroeconomic Research Department
18,04
26,63
19,98
43,93
32,42
48,15
22,57
28,62
44,37
39,81
30,59
45,68
40,14
73,92
50,53
61,83
53,38
80,96
57,95
10,0
20,0
30,0
40,0
50,0
60,0
70,0
80,0
90,0
jan
/00
jan
/01
jan
/02
jan
/03
jan
/04
jan
/05
jan
/06
jan
/07
jan
/08
jan
/09
jan
/10
jan
/11
jan
/12
jan
/13
jan
/14
jan
/15
jan
/16
jan
/17
SOJA EM GRÃO PREÇO AO PRODUTOR - PRAÇA PR
em R$ por saca de 60 kg Fonte: Deral PR Elaboração e Projeção: Bradesco
de
z/1
7
3
Source: Deral
Production and Estimate:
BRADESCO
Soybean producer
price – Paraná
in R$ per 60 kg bag
Source: Bloomberg
Production: BRADESCO
International soybean prices
(US$ cents/bushel)
491
546507
436
632
567
989
526
689
542
757
1.515
908
1.211
1.143
1.674
1.525
1.287
1.486
1.178
965871
1.146
947
400,0
600,0
800,0
1.000,0
1.200,0
1.400,0
1.600,0
1.800,0
jan
/00
jan
/01
jan
/02
jan
/03
jan
/04
jan
/05
jan
/06
jan
/07
jan
/08
jan
/09
jan
/10
jan
/11
jan
/12
jan
/13
jan
/14
jan
/15
jan
/16
jan
/17
PREÇOS INTERNACIONAIS DE SOJA - BOLSA DE CHICAGO - CBOT PREÇO FUTURO 1º VENCTO 2000 - 2010
em US$ cents por bushel
em US$ cents por bushel
Fonte: Bloomberg Elaboração: Bradesco•Projeção de preço: média dos preços futuros
de
z/1
7
Soybean
productivity – in kg
per hectare
Source and estimate: Conab
Production: BRADESCO
1.580
2.027
2.1502.221
2.175
2.2992.367 2.395
2.751
2.567
2.816
2.339
2.245
2.419
2.816
2.629
2.927
3.115
2.651
2.9382.854
2.998
3.362
1.500
1.700
1.900
2.100
2.300
2.500
2.700
2.900
3.100
3.300
3.500
90/9
1
91/9
2
92/9
3
93/9
4
94/9
5
95/9
6
96/9
7
97/9
8
98/9
9
99/0
0
00/0
1
01/0
2
02/0
3
03/0
4
04/0
5
05/0
6
06/0
7
07/0
8
08/0
9
09/1
0
10/1
1
11/1
2
12/1
3
13/1
4
14/1
5
15/1
6
16/1
7*
em kg por ha Fonte e Projeção: Conab Elaboração: Bradesco Produtividade da lavoura de soja - 1990 - 2012
Macroeconomic Research Department
Fundamentals
The USDA released the 2nd report for the 2017/18 grain harvest, which was already planted in the U.S.
and will start being planted in Brazil and in Argentina in September. U.S. production is estimated at 357.3
million tons, or 7.1% lower than the previous harvest. Planted acreage, most of which is reserved for soy
production, will be 4.3% smaller. Expected yield are 2.2% lower. Global consumption is set to grow 0.7%.
The stock-to-use ratio is estimated at 18.3%, below the 21.3% recorded in the previous harvest. Despite
the decline in U.S. production, global inventories are at a comfortable level because of the strong harvests
in the last four years. Argentina is expected to produce 40 million tons, same volume of the crop currently
being harvested in the country. For Brazil, the USDA forecasts a harvest of 95 million tons, or 2.1% lower
than the current harvest (97 million tons).
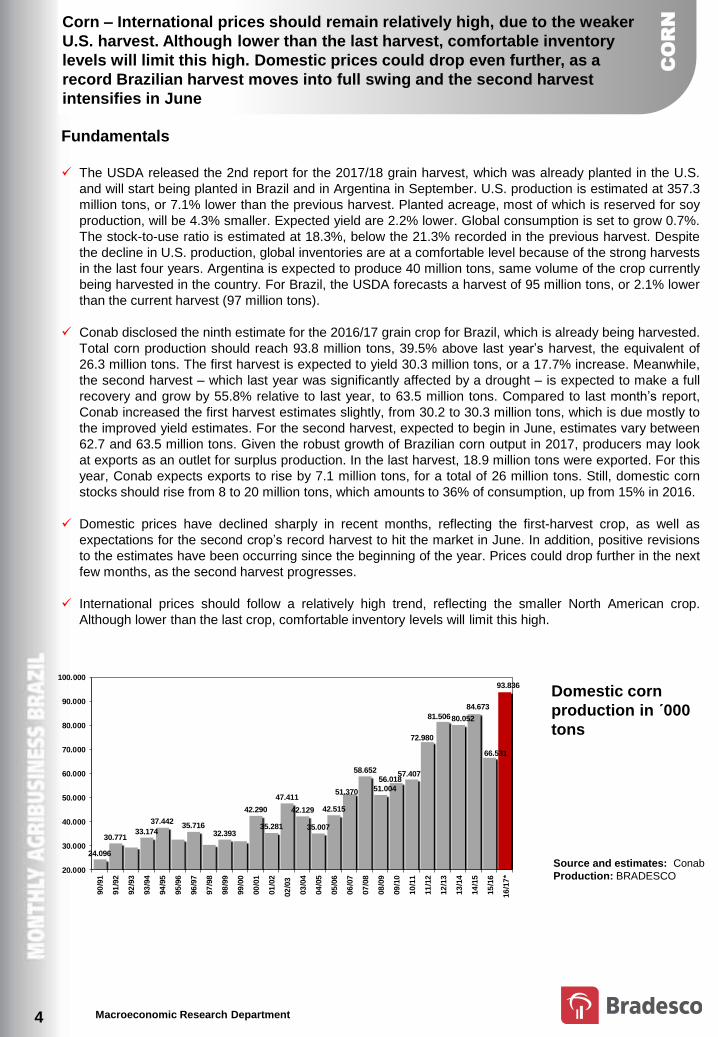
Conab disclosed the ninth estimate for the 2016/17 grain crop for Brazil, which is already being harvested.
Total corn production should reach 93.8 million tons, 39.5% above last year’s harvest, the equivalent of
26.3 million tons. The first harvest is expected to yield 30.3 million tons, or a 17.7% increase. Meanwhile,
the second harvest – which last year was significantly affected by a drought – is expected to make a full
recovery and grow by 55.8% relative to last year, to 63.5 million tons. Compared to last month’s report,
Conab increased the first harvest estimates slightly, from 30.2 to 30.3 million tons, which is due mostly to
the improved yield estimates. For the second harvest, expected to begin in June, estimates vary between
62.7 and 63.5 million tons. Given the robust growth of Brazilian corn output in 2017, producers may look
at exports as an outlet for surplus production. In the last harvest, 18.9 million tons were exported. For this
year, Conab expects exports to rise by 7.1 million tons, for a total of 26 million tons. Still, domestic corn
stocks should rise from 8 to 20 million tons, which amounts to 36% of consumption, up from 15% in 2016.
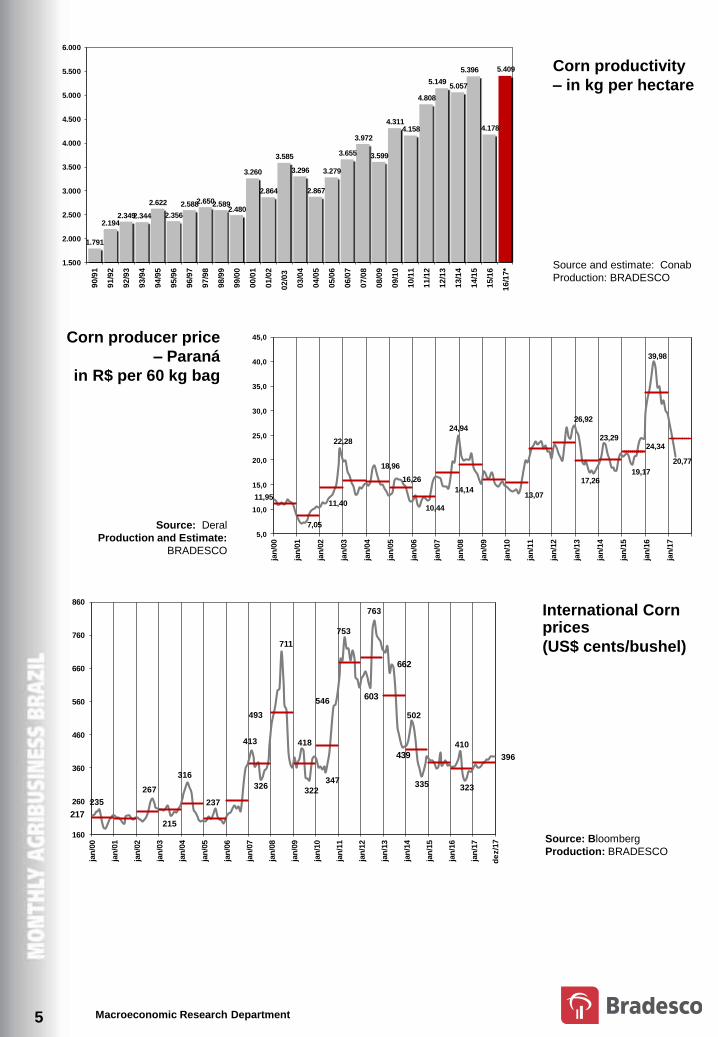
Domestic prices have declined sharply in recent months, reflecting the first-harvest crop, as well as
expectations for the second crop’s record harvest to hit the market in June. In addition, positive revisions
to the estimates have been occurring since the beginning of the year. Prices could drop further in the next
few months, as the second harvest progresses.
International prices should follow a relatively high trend, reflecting the smaller North American crop.
Although lower than the last crop, comfortable inventory levels will limit this high.
24.096
30.77133.174
37.44235.716
32.393
42.290
35.281
47.411
42.129
35.007
42.515
51.370
58.652
51.004
56.01857.407
72.980
81.50680.052
84.673
66.531
93.836
20.000
30.000
40.000
50.000
60.000
70.000
80.000
90.000
100.000
90
/91
91
/92
92
/93
93
/94
94
/95
95
/96
96
/97
97
/98
98
/99
99
/00
00
/01
01
/02
02
/03
03
/04
04
/05
05
/06
06
/07
07
/08
08
/09
09
/10
10
/11
11
/12
12
/13
13
/14
14
/15
15
/16
16
/17
*
em mil toneladas Fonte e Projeção: ConabProdução Nacional de Milho - 1991 - 2012
4
CO
RN
Corn – International prices should remain relatively high, due to the weaker
U.S. harvest. Although lower than the last harvest, comfortable inventory
levels will limit this high. Domestic prices could drop even further, as a
record Brazilian harvest moves into full swing and the second harvest
intensifies in June
Source and estimates: Conab
Production: BRADESCO
Domestic corn
production in ´000
tons
Macroeconomic Research Department 5
Corn productivity
– in kg per hectare
Source and estimate: Conab
Production: BRADESCO
Source: Deral
Production and Estimate:
BRADESCO
Corn producer price
– Paraná
in R$ per 60 kg bag
Source: Bloomberg
Production: BRADESCO
International Corn prices
(US$ cents/bushel)
217
235
267
215
316
237
413
326
493
711
418
322
347
546
753
603
763
662
439
502
335
410
323
396
160
260
360
460
560
660
760
860
jan
/00
jan
/01
jan
/02
jan
/03
jan
/04
jan
/05
jan
/06
jan
/07
jan
/08
jan
/09
jan
/10
jan
/11
jan
/12
jan
/13
jan
/14
jan
/15
jan
/16
jan
/17
Milho - Bolsa de Chicago - CBOTPreço futuro 1º vencimento
Em US$ cents por bushelFonte: Bloomberg Elaboração e Projeção: Bradesco
de
z/1
711,95
7,05
11,40
22,28
18,96
16,26
10,44
14,14
24,94
13,07
26,92
17,26
23,29
19,17
24,34
39,98
20,77
5,0
10,0
15,0
20,0
25,0
30,0
35,0
40,0
45,0
jan
/00
jan
/01
jan
/02
jan
/03
jan
/04
jan
/05
jan
/06
jan
/07
jan
/08
jan
/09
jan
/10
jan
/11
jan
/12
jan
/13
jan
/14
jan
/15
jan
/16
jan
/17
Preço pago ao produtor de milho - Paraná Fonte: DeralElaboração e Projeção:
Em R$ por saca de 60 kg Fonte: DeralElaboração e Projeção: Bradesco
Em R$ por saca de 60 kg
1.791
2.1942.3492.344
2.622
2.356
2.5882.6502.5892.480
3.260
2.864
3.585
3.296
2.867
3.279
3.655
3.972
3.599
4.3114.158
4.808
5.1495.057
5.396
4.178
5.409
1.500
2.000
2.500
3.000
3.500
4.000
4.500
5.000
5.500
6.000
90
/91
91
/92
92
/93
93
/94
94
/95
95
/96
96
/97
97
/98
98
/99
99
/00
00
/01
01
/02
02
/03
03
/04
04
/05
05
/06
06
/07
07
/08
08
/09
09
/10
10
/11
11
/12
12
/13
13
/14
14
/15
15
/16
16
/17
*
em kg por ha Produtividade - Milho - 1991 - 2012
Macroeconomic Research Department
Fundamentals
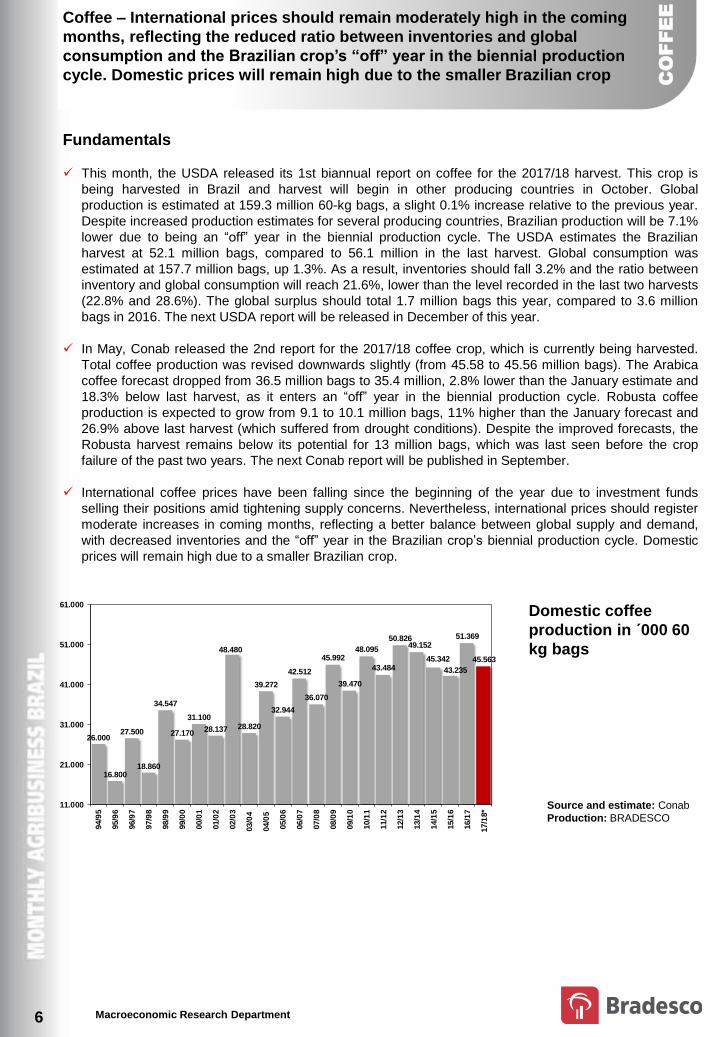
This month, the USDA released its 1st biannual report on coffee for the 2017/18 harvest. This crop is
being harvested in Brazil and harvest will begin in other producing countries in October. Global
production is estimated at 159.3 million 60-kg bags, a slight 0.1% increase relative to the previous year.
Despite increased production estimates for several producing countries, Brazilian production will be 7.1%
lower due to being an “off” year in the biennial production cycle. The USDA estimates the Brazilian
harvest at 52.1 million bags, compared to 56.1 million in the last harvest. Global consumption was
estimated at 157.7 million bags, up 1.3%. As a result, inventories should fall 3.2% and the ratio between
inventory and global consumption will reach 21.6%, lower than the level recorded in the last two harvests
(22.8% and 28.6%). The global surplus should total 1.7 million bags this year, compared to 3.6 million
bags in 2016. The next USDA report will be released in December of this year.
In May, Conab released the 2nd report for the 2017/18 coffee crop, which is currently being harvested.
Total coffee production was revised downwards slightly (from 45.58 to 45.56 million bags). The Arabica
coffee forecast dropped from 36.5 million bags to 35.4 million, 2.8% lower than the January estimate and
18.3% below last harvest, as it enters an “off” year in the biennial production cycle. Robusta coffee
production is expected to grow from 9.1 to 10.1 million bags, 11% higher than the January forecast and
26.9% above last harvest (which suffered from drought conditions). Despite the improved forecasts, the
Robusta harvest remains below its potential for 13 million bags, which was last seen before the crop
failure of the past two years. The next Conab report will be published in September.
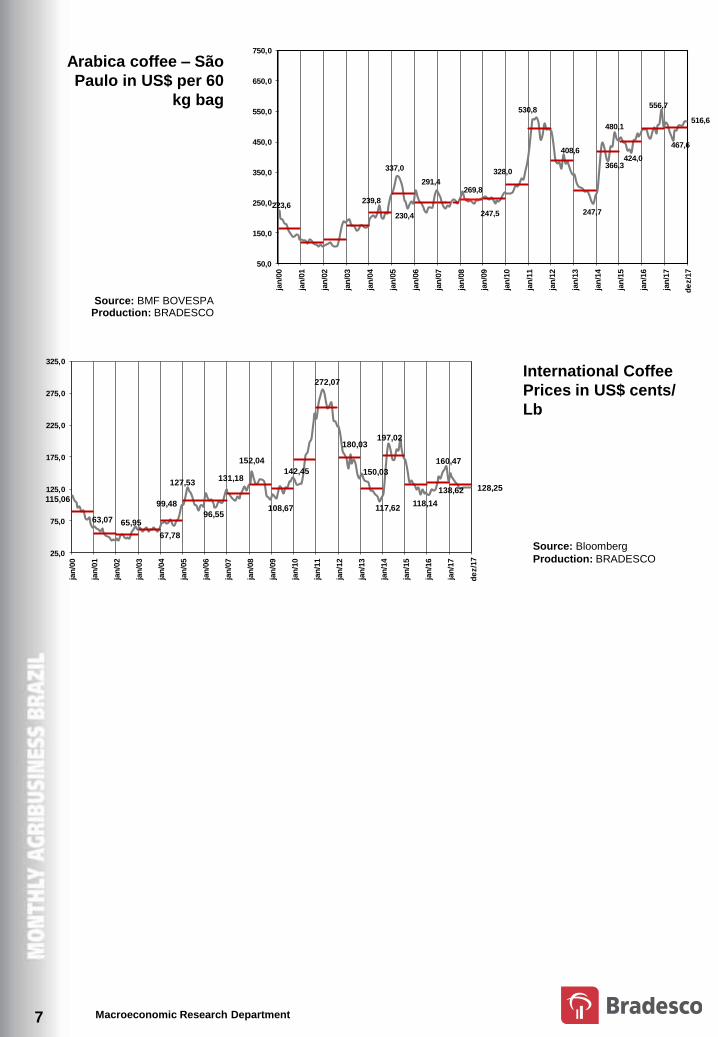
International coffee prices have been falling since the beginning of the year due to investment funds
selling their positions amid tightening supply concerns. Nevertheless, international prices should register
moderate increases in coming months, reflecting a better balance between global supply and demand,
with decreased inventories and the “off” year in the Brazilian crop’s biennial production cycle. Domestic
prices will remain high due to a smaller Brazilian crop.
6
CO
FF
EE
Domestic coffee
production in ´000 60
kg bags
Source and estimate: Conab
Production: BRADESCO
26.000
16.800
27.500
18.860
34.547
27.170
31.100
28.137
48.480
28.820
39.272
32.944
42.512
36.070
45.992
39.470
48.095
43.484
50.82649.152
45.342
43.235
51.369
45.563
11.000
21.000
31.000
41.000
51.000
61.000
94/9
5
95/9
6
96/9
7
97/9
8
98/9
9
99/0
0
00/0
1
01/0
2
02/0
3
03/0
4
04/0
5
05/0
6
06/0
7
07/0
8
08/0
9
09/1
0
10/1
1
11/1
2
12/1
3
13/1
4
14/1
5
15/1
6
16/1
7
17/1
8*
Fonte e projeção (*): Conab Elaboração: BradescoProdução Nacional de Café - 1994 - 2012mil sacas de 60 kg
Coffee – International prices should remain moderately high in the coming
months, reflecting the reduced ratio between inventories and global
consumption and the Brazilian crop’s “off” year in the biennial production
cycle. Domestic prices will remain high due to the smaller Brazilian crop
Macroeconomic Research Department 7
Source: Bloomberg
Production: BRADESCO
International Coffee
Prices in US$ cents/
Lb
Source: BMF BOVESPA Production: BRADESCO
Arabica coffee – São
Paulo in US$ per 60
kg bag
115,06
63,07 65,95
67,78
99,48
127,53
96,55
131,18
152,04
108,67
142,45
272,07
180,03
150,03
117,62
197,02
118,14
160,47
138,62 128,25
25,0
75,0
125,0
175,0
225,0
275,0
325,0
jan
/00
jan
/01
jan
/02
jan
/03
jan
/04
jan
/05
jan
/06
jan
/07
jan
/08
jan
/09
jan
/10
jan
/11
jan
/12
jan
/13
jan
/14
jan
/15
jan
/16
jan
/17
Projeção de preço: média dos preços futuros Café em grão - Bolsa de Nova York - NYBOT2000 - 2010Em US$ cents por libra peso
Fonte: Bloomberg Elaboração:
de
z/1
7
223,6239,8
337,0
230,4
291,4269,8
247,5
328,0
530,8
408,6
247,7
366,3
480,1
424,0
556,7
467,6
516,6
50,0
150,0
250,0
350,0
450,0
550,0
650,0
750,0
jan
/00
jan
/01
jan
/02
jan
/03
jan
/04
jan
/05
jan
/06
jan
/07
jan
/08
jan
/09
jan
/10
jan
/11
jan
/12
jan
/13
jan
/14
jan
/15
jan
/16
jan
/17
Café Arábica - Preço ao Produtor - Praça São Paulo 2000 - 2012Em R$ por saca 60 kg Fonte: Cepea EsalqElaboração e Projeção: Bradesco
de
z/1
7
Macroeconomic Research Department 8
BE
EF
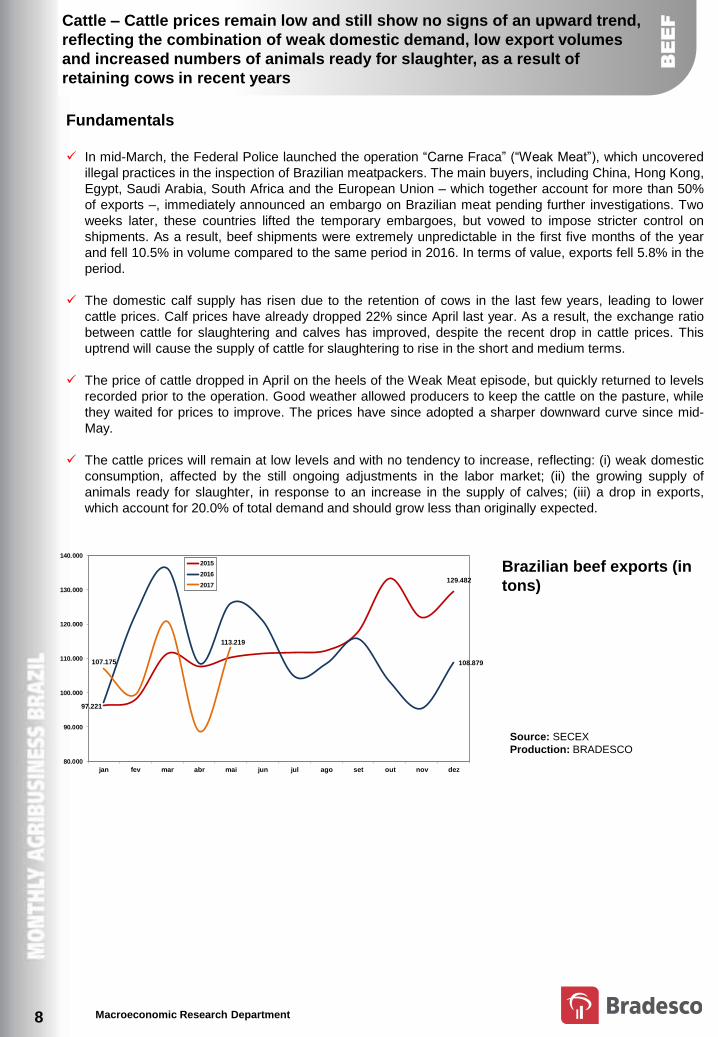
Brazilian beef exports (in
tons)
Source: SECEX
Production: BRADESCO
129.482
97.221
108.879107.175
113.219
80.000
90.000
100.000
110.000
120.000
130.000
140.000
jan fev mar abr mai jun jul ago set out nov dez
Exportações Brasileiras de carne bovina - 2010 - 2012 - Em toneladas Fonte: Secex Elaboração: Bradesco
2015
2016
2017
Cattle – Cattle prices remain low and still show no signs of an upward trend,
reflecting the combination of weak domestic demand, low export volumes
and increased numbers of animals ready for slaughter, as a result of
retaining cows in recent years
Fundamentals
In mid-March, the Federal Police launched the operation “Carne Fraca” (“Weak Meat”), which uncovered
illegal practices in the inspection of Brazilian meatpackers. The main buyers, including China, Hong Kong,
Egypt, Saudi Arabia, South Africa and the European Union – which together account for more than 50%
of exports –, immediately announced an embargo on Brazilian meat pending further investigations. Two
weeks later, these countries lifted the temporary embargoes, but vowed to impose stricter control on
shipments. As a result, beef shipments were extremely unpredictable in the first five months of the year
and fell 10.5% in volume compared to the same period in 2016. In terms of value, exports fell 5.8% in the
period.
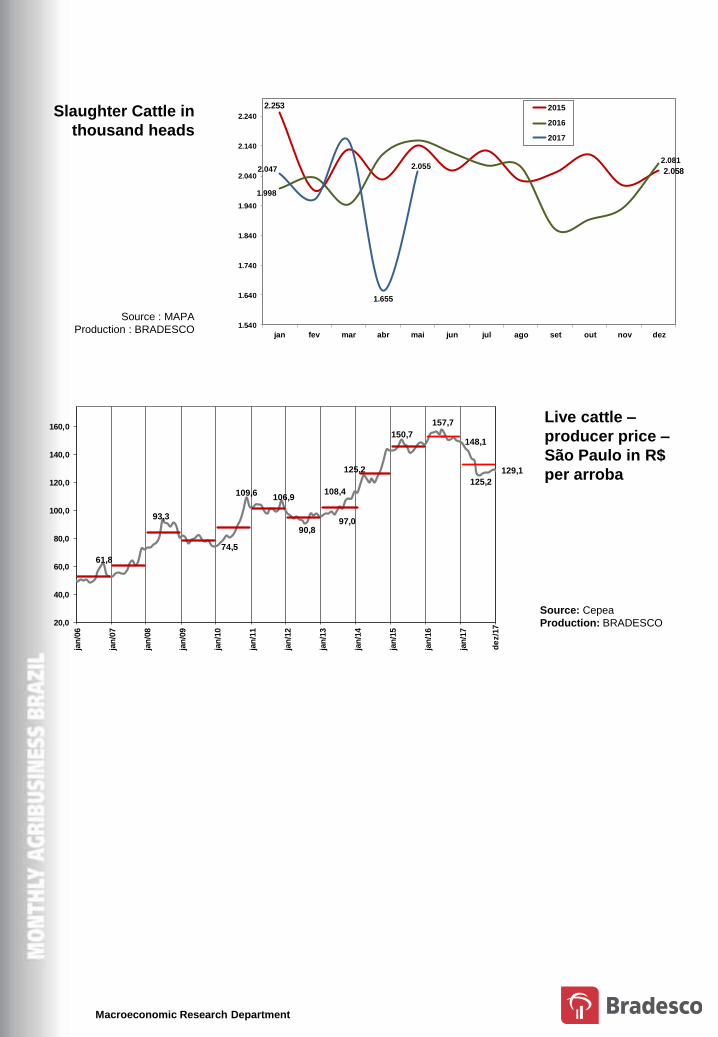
The domestic calf supply has risen due to the retention of cows in the last few years, leading to lower
cattle prices. Calf prices have already dropped 22% since April last year. As a result, the exchange ratio
between cattle for slaughtering and calves has improved, despite the recent drop in cattle prices. This
uptrend will cause the supply of cattle for slaughtering to rise in the short and medium terms.
The price of cattle dropped in April on the heels of the Weak Meat episode, but quickly returned to levels
recorded prior to the operation. Good weather allowed producers to keep the cattle on the pasture, while
they waited for prices to improve. The prices have since adopted a sharper downward curve since mid-
May.
The cattle prices will remain at low levels and with no tendency to increase, reflecting: (i) weak domestic
consumption, affected by the still ongoing adjustments in the labor market; (ii) the growing supply of
animals ready for slaughter, in response to an increase in the supply of calves; (iii) a drop in exports,
which account for 20.0% of total demand and should grow less than originally expected.
Macroeconomic Research Department
Live cattle –
producer price –
São Paulo in R$
per arroba
Source: Cepea
Production: BRADESCO
Slaughter Cattle in
thousand heads
Source : MAPA
Production : BRADESCO
2.253
2.058
1.998
2.0812.047
1.655
2.055
1.540
1.640
1.740
1.840
1.940
2.040
2.140
2.240
jan fev mar abr mai jun jul ago set out nov dez
Abates mensais de boi - 2010 - 2012 - Em toneladas Fonte: Secex Elaboração: Bradesco
2015
2016
2017
61,8
93,3
74,5
109,6106,9
90,897,0
108,4
125,2
150,7
157,7
148,1
125,2
129,1
20,0
40,0
60,0
80,0
100,0
120,0
140,0
160,0
jan
/06
jan
/07
jan
/08
jan
/09
jan
/10
jan
/11
jan
/12
jan
/13
jan
/14
jan
/15
jan
/16
jan
/17
BOI GORDO PREÇO AO PRODUTOR - PRAÇA SP
Em R$ por arroba (15 kg)Fonte: Cepea EsalqElaboração e Projeção: Bradesco
de
z/1
7
Macroeconomic Research Department
222.429240.944
287.810
314.969
257.592
320.650
359.316
431.413
474.800
559.432
604.514623.905
560.364
588.916
658.822
634.767657.184
647.626
150.000
250.000
350.000
450.000
550.000
650.000
90
/91
91
/92
92
/93
93
/94
94
/95
95
/96
96
/97
97
/98
98
/99
99
/00
00
/01
01
/02
02
/03
03
/04
04
/05
05
/06
06
/07
07
/08
08
/09
09
/10
10
/11
11
/12
12
/13
13
/14
14
/15
15
/16
16
/17
17
/18
*
mil toneladasProdução Nacional de Cana-de-Açúcar - 1990 - 2013
Fonte e projeção : Conab Elaboração. Bradesco
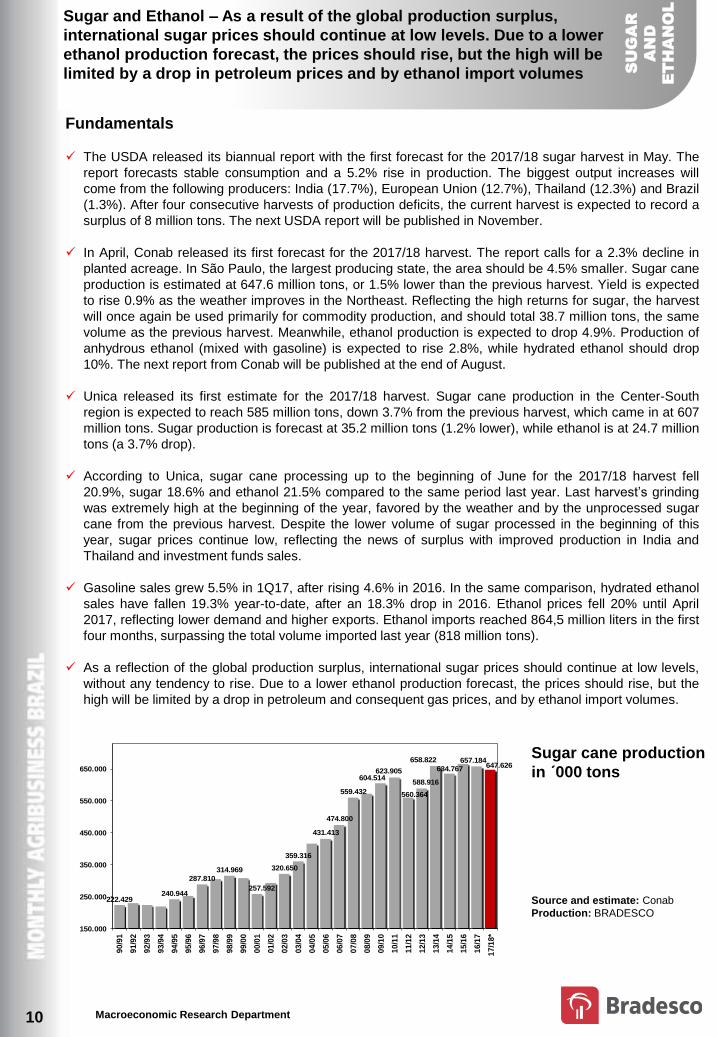
Sugar cane production
in ´000 tons
Source and estimate: Conab
Production: BRADESCO
10
SU
GA
R
AN
D
ET
HA
NO
L
Sugar and Ethanol – As a result of the global production surplus,
international sugar prices should continue at low levels. Due to a lower
ethanol production forecast, the prices should rise, but the high will be
limited by a drop in petroleum prices and by ethanol import volumes
Fundamentals
The USDA released its biannual report with the first forecast for the 2017/18 sugar harvest in May. The
report forecasts stable consumption and a 5.2% rise in production. The biggest output increases will
come from the following producers: India (17.7%), European Union (12.7%), Thailand (12.3%) and Brazil
(1.3%). After four consecutive harvests of production deficits, the current harvest is expected to record a
surplus of 8 million tons. The next USDA report will be published in November.
In April, Conab released its first forecast for the 2017/18 harvest. The report calls for a 2.3% decline in
planted acreage. In São Paulo, the largest producing state, the area should be 4.5% smaller. Sugar cane
production is estimated at 647.6 million tons, or 1.5% lower than the previous harvest. Yield is expected
to rise 0.9% as the weather improves in the Northeast. Reflecting the high returns for sugar, the harvest
will once again be used primarily for commodity production, and should total 38.7 million tons, the same
volume as the previous harvest. Meanwhile, ethanol production is expected to drop 4.9%. Production of
anhydrous ethanol (mixed with gasoline) is expected to rise 2.8%, while hydrated ethanol should drop
10%. The next report from Conab will be published at the end of August.
Unica released its first estimate for the 2017/18 harvest. Sugar cane production in the Center-South
region is expected to reach 585 million tons, down 3.7% from the previous harvest, which came in at 607
million tons. Sugar production is forecast at 35.2 million tons (1.2% lower), while ethanol is at 24.7 million
tons (a 3.7% drop).
According to Unica, sugar cane processing up to the beginning of June for the 2017/18 harvest fell
20.9%, sugar 18.6% and ethanol 21.5% compared to the same period last year. Last harvest’s grinding
was extremely high at the beginning of the year, favored by the weather and by the unprocessed sugar
cane from the previous harvest. Despite the lower volume of sugar processed in the beginning of this
year, sugar prices continue low, reflecting the news of surplus with improved production in India and
Thailand and investment funds sales.
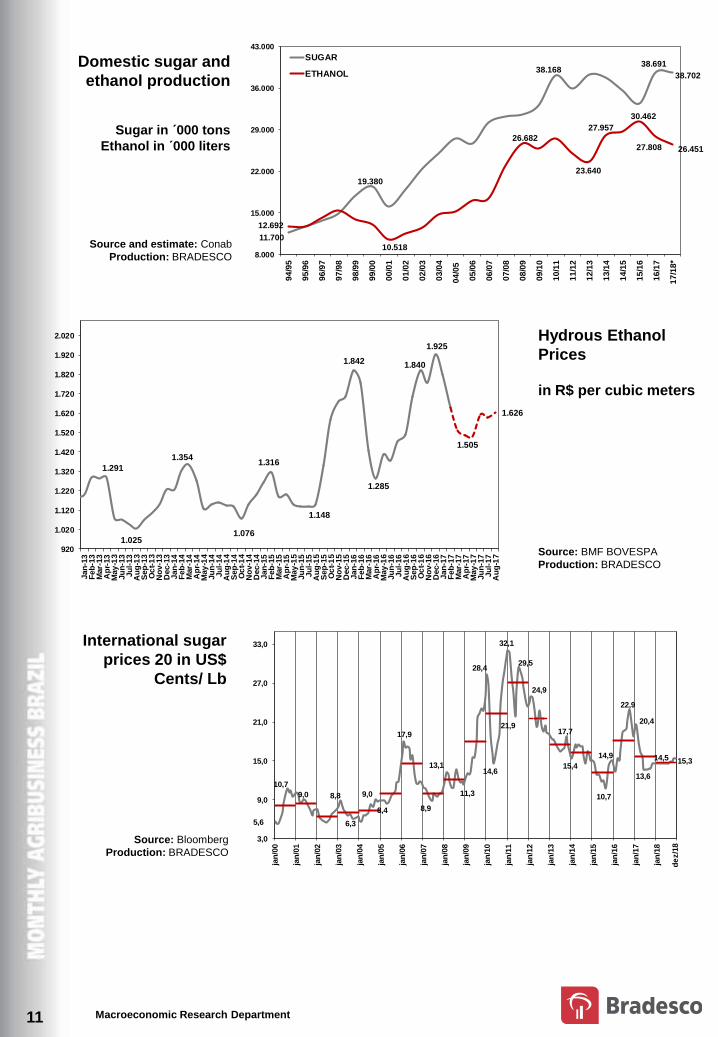
Gasoline sales grew 5.5% in 1Q17, after rising 4.6% in 2016. In the same comparison, hydrated ethanol
sales have fallen 19.3% year-to-date, after an 18.3% drop in 2016. Ethanol prices fell 20% until April
2017, reflecting lower demand and higher exports. Ethanol imports reached 864,5 million liters in the first
four months, surpassing the total volume imported last year (818 million tons).
As a reflection of the global production surplus, international sugar prices should continue at low levels,
without any tendency to rise. Due to a lower ethanol production forecast, the prices should rise, but the
high will be limited by a drop in petroleum and consequent gas prices, and by ethanol import volumes.
Macroeconomic Research Department
1.291
1.025
1.354
1.076
1.316
1.148
1.842
1.285
1.840
1.925
1.505
1.626
920
1.020
1.120
1.220
1.320
1.420
1.520
1.620
1.720
1.820
1.920
2.020
Jan
-13
Feb
-13
Mar-
13
Ap
r-13
May
-13
Ju
n-1
3Ju
l-13
Au
g-1
3S
ep
-13
Oc
t-1
3N
ov-1
3D
ec-1
3Jan
-14
Feb
-14
Mar-
14
Ap
r-14
May
-14
Ju
n-1
4Ju
l-14
Au
g-1
4S
ep
-14
Oc
t-1
4N
ov-1
4D
ec-1
4Jan
-15
Feb
-15
Mar-
15
Ap
r-15
May
-15
Ju
n-1
5Ju
l-15
Au
g-1
5S
ep
-15
Oc
t-1
5N
ov-1
5D
ec-1
5Jan
-16
Feb
-16
Mar-
16
Ap
r-16
May
-16
Ju
n-1
6Ju
l-16
Au
g-1
6S
ep
-16
Oc
t-1
6N
ov-1
6D
ec-1
6Jan
-17
Feb
-17
Mar-
17
Ap
r-17
May
-17
Ju
n-1
7Ju
l-17
Au
g-1
7
em R$ por metro cúbico
11
Source: BMF BOVESPA
Production: BRADESCO
International sugar
prices 20 in US$
Cents/ Lb
Source: Bloomberg
Production: BRADESCO
Hydrous Ethanol
Prices
in R$ per cubic meters
5,6
10,7
9,0 8,8
6,3
9,0
8,4
17,9
8,9
13,1
11,3
28,4
14,6
32,1
21,9
29,5
24,9
17,7
15,4
10,7
14,9
22,9
20,4
13,6
14,5 15,3
3,0
9,0
15,0
21,0
27,0
33,0
jan
/00
jan
/01
jan
/02
jan
/03
jan
/04
jan
/05
jan
/06
jan
/07
jan
/08
jan
/09
jan
/10
jan
/11
jan
/12
jan
/13
jan
/14
jan
/15
jan
/16
jan
/17
jan
/18
Preços internacionais de açúcar – NYBOT – Preço futuro 1º Vencto 2000 – 2013Fonte: Bloomberg Elaboração: Bradesco
Em US$ cents por libra peso
de
z/1
8
Domestic sugar and
ethanol production
Sugar in ´000 tons
Ethanol in ´000 liters
Source and estimate: Conab
Production: BRADESCO
11.700
19.380
38.16838.691
38.702
12.692
10.518
26.682
23.640
27.957
30.462
27.808 26.451
8.000
15.000
22.000
29.000
36.000
43.000
94
/95
95
/96
96
/97
97
/98
98
/99
99
/00
00
/01
01
/02
02
/03
03
/04
04
/05
05
/06
06
/07
07
/08
08
/09
09
/10
10
/11
11
/12
12
/13
13
/14
14
/15
15
/16
16
/17
17
/18
*
Açúcar em mil toneladasEtanol em mil litros
Fonte e (*) Projeção: Conab Elaboração: Bradesco
Produção nacional de açúcar e de etanol 1993 – 2013
SUGAR
ETHANOL
Macroeconomic Research Department 12
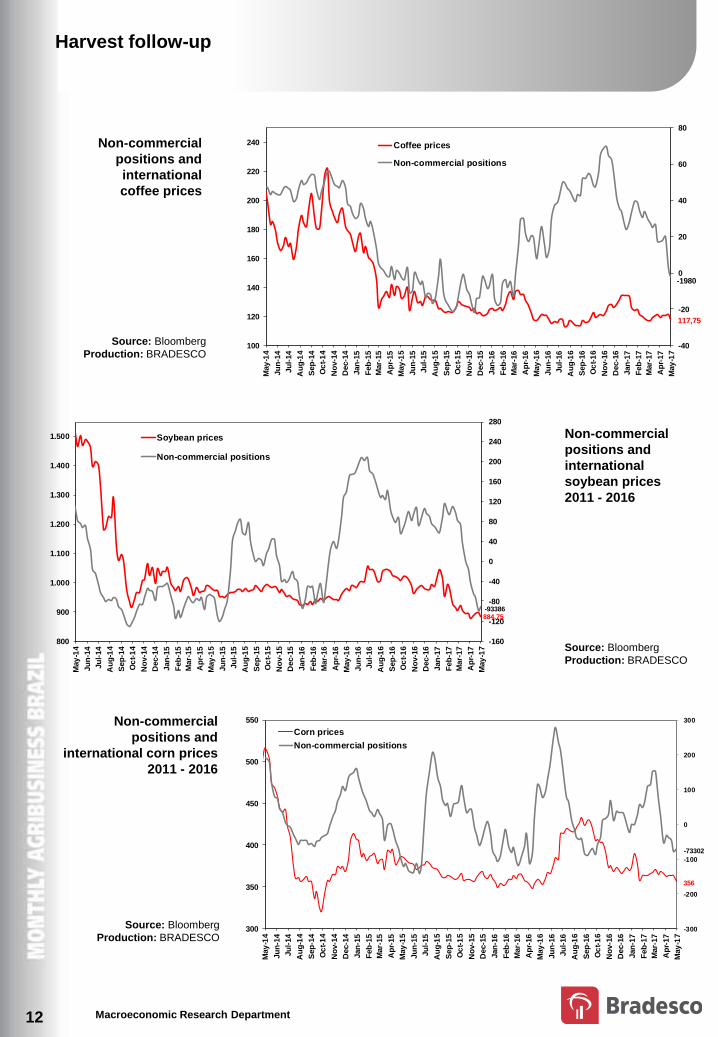
Harvest follow-up
Non-commercial
positions and
international
soybean prices
2011 - 2016
Non-commercial
positions and
international corn prices
2011 - 2016
Non-commercial
positions and
international
coffee prices
Source: Bloomberg
Production: BRADESCO
Source: Bloomberg
Production: BRADESCO
Source: Bloomberg
Production: BRADESCO
884,75-93386
-160
-120
-80
-40
0
40
80
120
160
200
240
280
800
900
1.000
1.100
1.200
1.300
1.400
1.500
May
-14
Ju
n-1
4
Ju
l-14
Au
g-1
4
Sep
-14
Oc
t-1
4
No
v-1
4
Dec-1
4
Jan
-15
Feb
-15
Mar-
15
Ap
r-15
May
-15
Ju
n-1
5
Ju
l-15
Au
g-1
5
Sep
-15
Oc
t-1
5
No
v-1
5
Dec-1
5
Jan
-16
Feb
-16
Mar-
16
Ap
r-16
May
-16
Ju
n-1
6
Ju
l-16
Au
g-1
6
Sep
-16
Oc
t-1
6
No
v-1
6
Dec-1
6
Jan
-17
Feb
-17
Mar-
17
Ap
r-17
May
-17
Soybean prices
Non-commercial positions
16-j
un
-
356
-73302
-300
-200
-100
0
100
200
300
300
350
400
450
500
550
May
-14
Ju
n-1
4
Ju
l-14
Au
g-1
4
Sep
-14
Oc
t-1
4
No
v-1
4
Dec-1
4
Jan
-15
Feb
-15
Mar-
15
Ap
r-15
May
-15
Ju
n-1
5
Ju
l-15
Au
g-1
5
Sep
-15
Oc
t-1
5
No
v-1
5
Dec-1
5
Jan
-16
Feb
-16
Mar-
16
Ap
r-16
May
-16
Ju
n-1
6
Ju
l-16
Au
g-1
6
Sep
-16
Oc
t-1
6
No
v-1
6
Dec-1
6
Jan
-17
Feb
-17
Mar-
17
Ap
r-17
May
-17
Corn prices
Non-commercial positions
117,75
-1980
-40
-20
0
20
40
60
80
100
120
140
160
180
200
220
240
May
-14
Ju
n-1
4
Ju
l-14
Au
g-1
4
Sep
-14
Oc
t-1
4
No
v-1
4
Dec-1
4
Jan
-15
Feb
-15
Mar-
15
Ap
r-15
May
-15
Ju
n-1
5
Ju
l-15
Au
g-1
5
Sep
-15
Oc
t-1
5
No
v-1
5
Dec-1
5
Jan
-16
Feb
-16
Mar-
16
Ap
r-16
May
-16
Ju
n-1
6
Ju
l-16
Au
g-1
6
Sep
-16
Oc
t-1
6
No
v-1
6
Dec-1
6
Jan
-17
Feb
-17
Mar-
17
Ap
r-17
May
-17
Posições Não Comerciais e Preços Internacionais de café - 2007 - 2014 - Fonte: Bloomberg Elaboração: Bradesco
Coffee prices
Non-commercial positions
Macroeconomic Research Department
SO
YB
EA
NS
Soybean Complex
Of soybean grain produced in Brazil, 43% is exported and 57% is destined to milling. The milling process
results in 72% bran and 18% oil. The remaining 10% are seeds and losses. Of bran produced, 50% is
exported and 20% of oil is exported.
Soybean is an exports culture, since the level of production exceeds consumption by around 40%. This
means that any growth of domestic production results in exportable surplus.
In the domestic market, soybean is used in the manufacturing of food, such as salami and sausages and
nearly 80% is employed to produce animal’s food. Soybean accounts for 25% to 30% of poultry and hog
food.
Countries of destination
Grain: 75% China, 25% Europe, 10% other Asian countries.
Bran: 70% Europe, 20% Asian countries.
Oil: 50% China, 20% India.
Seasonality
Summer crop: planting occurs between October and December and harvest is concentrated between
February and May.
Regionalization
Mid-west: 49%, south 33%, 8% northeast, 6% southeast
Ranking
Brazil is the world’s second largest player of production with 30.8%, behind the USA with 31.5%, but it is
the largest exporter with 40.7%, followed by USA with 39.3%.
Source: Usda
Production: BRADESCO
World ranking of
the soybean
complex 2011 –
2012 harvest
Snapshot of the market
13
Ranking Production Export Production Export Production Export
US 35,5% 44,2% 20,2% 14,0% 20,6% 12,9%
Brazil 26,4% 32,0% 15,1% 22,9% 15,8% 16,2%
Argentina 19,8% 12,8% 17,2% 49,3% 17,7% 54,6%
China 5,6% 0,0% 25,8% 0,0% 24,6% 0,0%
Grains Meal Oil
Macroeconomic Research Department
Corn is the basis of animal’s food for main types of breeding. In the animal’s food composition, corn accounts
for:
64% in poultry raising
65% in hog raising
23% in dairy cattle
Countries of destination
Corn exports account for 28% of volume produced. Main markets of destination are 14% Japan, 13%
South Korea, 8.5% Taiwan.
Seasonal factors
Corn has two crops:
Summer crop: planting occurs between October and December and harvest is concentrated between
February and May. It represents 40% of total harvest. It has the following regional distribution: 45% south,
26% southeast, 10% mid-west, 15% northeast.
Winter crop: planting occurs between February and June and harvest is concentrated between July and
November. It accounts for 60% of total crop. It has the following regional distribution: 64.3% mid-west,
23% south (only in Paraná), 6% northeast (only in Bahia), 5% southeast.
Ranking
Brazil is the world’s third largest corn producer, with 7% market share and the second largest exporter,
with 18% market share.
CO
RN
Snapshot of the market
14
Macroeconomic Research Department
Brazil exports 67% of coffee produced, 90% green coffee and 10% instant coffee.
Coffee cultivation has high workforce costs, which account for nearly 52% of total costs, since most part
of harvest is manual.
Countries of destination
Green coffee: 19.3% USA, 18.8% Germany, 10% Japan.
Instant coffee: 16.3% USA, 13.5% Russia, 6.4% Ukraine.
Regionalization
Regional distribution of coffea arabica:
71.5% state of Minas Gerais
10.5% state of São Paulo
9.1% state of Espírito Santo
4.3% state of Paraná
2.8% state of Bahia
Regional distribution of Robusta coffee production:
75.6% state of Espírito Santo
12.5% state of Rondônia
6.7% state of Bahia
2.6% state of Minas Gerais
Seasonality
Coffee flowerage occurs between September and November in Brazil. Harvest starts in May and extends
until September.
Ranking
Brazil is the world’s largest coffee player with 37% market share in production and 27% in exports. Other
players, such as Vietnam and Colombia have low domestic consumption, opposite to Brazil, which
accounts for 15% of global consumption.
Distribuição regional da produção de café robusta:
71,2% Espírito Santo
14,3% Rondônia
6,4% Bahia
2,4% Minas Gerais
CO
FF
EE
Snapshot of the market
15
Macroeconomic Research Department
Brazilian cattle is estimated in approximately 200 million heads. The commercial livestock for
slaughtering is estimated at 40 million heads, i.e., this is the volume of cattle at age and weight ideal for
slaughter. The remaining cattle is divided among dairy cows, male calf and unfinished cattle.
Exports accounts for 20% of beef national production.
Countries of destination
Russia is the main market of destination of Brazilian beef exports, accounting for 22%. Hong Kong
accounts for 18%.
Regionalization
Cattle slaughter has the following regional distribution: 36.4% mid-west, 20.4% southeast, 20.1% north,
12.3% south and 10.8% northeast.
Ranking
Brazil is the world’s second largest beef producer with 16.9% market share, preceded by the USA, which
holds 19.1%.
Brazil is the world’s largest exporter with 21% market share.
Seasonality
Cattle raising cycle is long – 2.5 years since when male calf is born until slaughter with approximately 15
arrobas.
Cattle breeding system in Brazil is the extensive cattle raising, i.e., bull is raised released in the pasture
and eats grass.
The confinement system, where bull is raised with animal’s food in small areas, accounts for only 5% of
total slaughter.
Cattle crop occurs in the first half of the year, during rainfall period, when pasture is plentiful. With a
greater cattle supply for slaughter, finished cattle prices during such period are lower.
The cattle intercrop occurs in the second half of the year, during drought period, when cold and white
frost dry pasture. Bull lose weight, with lower cattle supply for slaughter. However, cattle prices increase
during such period, as supply is higher for confined cattle, whose production cost is higher. During
intercrop peak (October) there is greater number of confined male cattle slaughter.
Confinements have two shifts:
1st shift: unfinished cattle is stored between May-June and delivered in August-September.
2nd shift: unfinished cattle is stored between August-September and delivered in November-December.
BE
EF
Snapshot of the market
16
Macroeconomic Research Department
Sugarcane Complex
Of sugarcane produced in Brazil, 46% is destined to produce sugar and 54% to produce ethanol.
Sugar has the following destination: 70% exports and 30% domestic market. Ethanol has the following
destination: 10% exports and 90% domestic market.
Out of total ethanol produced, 55% is hydrated (used as fuel in flex fuel vehicles) and 45% is used as
anhydrous (mixed to gasoline between 20% and 26%).
Sugar is an exports culture, since level of production exceeds consumption by approximately 70%. This
means any growth of national production generates exportable surplus.
Countries of destination
Raw sugar (73% of production) : 15% China, 8% Bangladesh;
Refined sugar (27% of production): Arabian and African countries;
Ethanol: 60% USA, South Korea 13%.
Seasonality
Cane is a continual culture, since period between cane planting and harvest is 18 months, and from
same plant, it is possible to make until six cuts, on average.
Cane harvest period occurs between April and November. During such period, mills operate 24 hours.
Between January and March, plants are disassembled for maintenance.
Brazil is the single large global player with crop in the first half of the year. Other countries are: USA,
Europe, India, Thailand and Australia start their crop from the second half of the year.
Regionalization
65% southeast, 16.8% mid-west, 10.3% northeast, 7.3% south.
Ranking
Brazil is the world’s largest sugar producer, with 22.2% market share. Other players are: India 15%,
European Union 9.2%, China 8.5%, Thailand 6.2%.
Brazil is the largest exporter, with 46% market share in the global market. Other exporters are: Thailand
15%, Australia 5.4%.
World’s largest ethanol producers are: 57% USA and 27% Brazil.
SU
GA
R
AN
D
ET
HA
NO
L
Snapshot of the Market
17
Complexo Sucroalcooleiro
Da cana-de-açúcar produzida no Brasil, 46% se destina à produção de cana e 54% à produção de
etanol (safra 2011/12).
O açúcar tem a seguinte destinação: 68% exportação e 32% mercado doméstico. O etanol tem a
seguinte destinação: 7% exportação e 63% mercado interno.
Do total de etanol produzido, 68% é hidratado (usado como combustível nos carros flex fuel) e 32% é
usado como anidro (misturado à gasolina na proporção de 20% a 26%).
O açúcar é uma cultura de exportação, visto que o nível de produção excede o consumo em torno de
70%. Isso significa dizer que qualquer crescimento da produção nacional gera excedente exportável.
Países de destino
Açúcar Bruto (73% da produção) : 16% Rússia, 10% China;
Açúcar Refinado (27% da produção): Países árabes e africanos;
Etanol: 34% EUA, Coreia do Sul 15%, Japão 14%.
Sazonalidade
A cana é uma cultura perene, pois o tempo entre o plantio e a colheita da cana é de 18 meses, e da
mesma planta é possível fazer até 6 cortes, em média.
O período de colheita da cana ocorre entre abril e novembro. Nesse período as usinas operam 24
horas. Entre os meses de janeiro e março as plantas são desmontadas para manutenção.
O Brasil é o único grande player mundial com safra no 1º semestre do ano. Os demais: EUA, Europa,
Índia, Tailândia e Austrália têm início de safra a partir do 2º semestre do ano.
Regionalização
65% Sudeste, 16,8% Centro-Oeste, 10,3% Nordeste, 7,3% Sul.
Ranking
O Brasil é o maior produtor mundial de açúcar com participação de 21,2%. Os demais players são: Índia
16,8%, União Europeia 9,9%, China 7%, Tailândia 6%.
O Brasil é o maior exportador, com participação de 42% no mercado global. Os demais exportadores
são: Tailândia 15,3%, Austrália 5,2%.
Os maiores produtores mundiais de etanol são: 45% EUA e 33,5% Brasil.
Macroeconomic Research Department
Source: IBGE, CEPEA
Production: BRADESCO
Seasonality of
slaugther of steers
and cows and live
cattle prices
1997 – 2010
in R$ per arroba
Fernando Honorato Barbosa
DEPEC - BRADESCO does not accept responsibility for any actions/decisions that may be taken based on the information provided in its publications and projections. All the data and opinions contained in these information bulletins is carefully checked and drawn up by fully qualified professionals, but it should not be used, under any hypothesis, as the basis, support, guidance or norm for any document, valuations, judgments or decision taking, whether of a formal or informal nature. Therefore, we emphasize that all the consequences and responsibility for using any data or analysis contained in this publication is assumed exclusively by the user, exempting BRADESCO from all responsibility for any actions resulting from the usage of this material. We all point out that access to this information implies acceptance in full of this term of responsibility and usage. The reproduction of the content in this report (partially or in full) is strictly forbidden except if authorized by BRADESCO or if the sources (the name of the authors, publication and BRADESCO) are strictly mentioned.
Team
Economists: Ana Maria Bonomi Barufi / Andréa Bastos Damico / Constantin Jancso / Daniela Cunha de Lima /
Ellen Regina Steter / Estevão Augusto Oller Scripilliti / Fabiana D’Atri / Igor Velecico / Leandro
Câmara Negrão / Marcio Aldred Gregory / Myriã Tatiany Neves Bast / Priscila Pacheco Trigo / Regina
Helena Couto Silva / Thomas Henrique Schreurs Pires
Internships: Alexandre Stiubiener Himmestein/ Christian Frederico M. Moraes / Felipe Alves Fêo Emery de
Carvalho / Felipe Yamamoto Ricardo da Silva / Gabriela Soares de Faria / Mariana Silva de Freitas /
Rafael Martins Murrer