Monterey Corridor Market - CITY OF MORGAN HILL
74
CITY OF MORGAN HILL MONTEREY CORRIDOR MARKET ANALYSIS Lisa Wise Consulting, Inc. December 2017
Transcript of Monterey Corridor Market - CITY OF MORGAN HILL

CITY OF MORGAN HILL MONTEREY CORRIDOR MARKET ANALYSIS Lisa Wise Consulting, Inc.
December 2017

TABLE OF CONTENTS 1 Overview ....................................................................................................................................... 1
1.1 Introduction .......................................................................................................................... 1 1.1.1 Purpose ........................................................................................................................................... 1 1.1.2 Terms .............................................................................................................................................. 1 1.1.3 Next Steps ...................................................................................................................................... 2
1.2 Background ........................................................................................................................... 2
2 Key Findings .................................................................................................................................. 3
3 Demographic & Socio-Economic Data ........................................................................................ 4 3.1 Populations & Households ................................................................................................... 4 3.2 Household Income Growth .................................................................................................. 5 3.3 Age, Race, & Education ......................................................................................................... 6
3.3.1 Age ................................................................................................................................................... 6 3.3.2 Race ................................................................................................................................................. 7 3.3.3 Educational Attainment ................................................................................................................ 7
3.4 Employment .......................................................................................................................... 7 3.4.1 Employment Projection ................................................................................................................ 8 3.4.2 Employment Inflow/Outflow ........................................................................................................ 8 3.4.3 Unemployment .............................................................................................................................. 9 3.4.4 Employment by Industry and Occupation ................................................................................. 9 3.4.5 Wages ............................................................................................................................................ 12
3.5 Industry & Occupational Trends ....................................................................................... 12 3.6 Major Employers ................................................................................................................. 14 3.7 Consumer Expenditures ..................................................................................................... 14
4 Commercial Market Analysis .................................................................................................... 15 4.1 Retail .................................................................................................................................... 15
4.1.1 Retail Data .................................................................................................................................... 15 4.1.2 Sales Tax ....................................................................................................................................... 17 4.1.3 Retail Leakage .............................................................................................................................. 18 4.1.4 Retail Trends ................................................................................................................................ 19
4.2 Office .................................................................................................................................... 20 4.2.1 Office Data .................................................................................................................................... 20 4.2.2 Office Trends ................................................................................................................................ 22
4.3 Residential ........................................................................................................................... 22 4.3.1 Residential Data ........................................................................................................................... 22 4.3.2 Residential Trends ....................................................................................................................... 24
5 Commercial Capacity Assessment ............................................................................................ 25 5.1 Commercial Capacity Based on Existing Land Use Inventory ........................................ 25

5.2 Commercial Square Footage per Capita ........................................................................... 26 5.3 Commercial Square Footage per Job ................................................................................. 26 5.4 Projected Residential Growth in Study Area ................................................................... 26 5.5 Retail Leakage ..................................................................................................................... 27 5.6 Summary of Results ............................................................................................................ 27
6 Conclusion ................................................................................................................................... 29
7 Cited Literature .......................................................................................................................... 30

CITY OF MORGAN HILL DRAFT MARKET ANALYSIS | DECEMBER 2017 | 1
1 OVERVIEW
1.1 INTRODUCTION The following Market Analysis Report (Report) provides a summary of demographic and socio-economic conditions in the City of Morgan Hill as they relate to economic performance, as well as a high-level analysis of the commercial market, and a Commercial Capacity Assessment for the Monterey Road Corridor Study Area.
This Report relies on data from national, regional, and local sources such as the U.S. Census, Bureau of Labor Statistics, Association of Bay Area Governments, Santa Clara County Assessor, the City of Morgan Hill, and commercial real estate analytics providers (e.g., CoStar, REIS, Colliers International, etc.). Appendix A, B, and C include detailed and comprehensive data, maps, and calculations that support the findings in the Report.
1.1.1 PURPOSE This Report identifies and provides a high-level assessment of economic and market conditions that will be used to inform the development of options for zoning along the Monterey Corridor. Options for zoning will focus on the Mixed Use Flex General Plan Land Use Designation and integrate General Plan direction with the market conditions and capacity assessment findings from this Report. A complete package that includes this Report and the zoning implementation options will be compiled and presented to the Morgan Hill Planning Commission and City Council for discussion.
1.1.2 TERMS In this Report, the following terms are used according to the definitions below:
Retail – A building or space that is primarily used to promote, distribute, or sell products and services to the general public (e.g., clothing store, restaurant, salon, tailor, etc.). Commercial uses that are not considered as “office” (defined below) are classified as retail for the purposes of this Report.
Office – A building or space that is principally used to house employees of companies that produce a product or service primarily for support services such as administration, accounting, marketing, information, consulting, financial and insurance services, educational and medical services, and other professional services.
Commercial – Refers to both retail and office as defined above.

CITY OF MORGAN HILL DRAFT MARKET ANALYSIS | DECEMBER 2017 | 2
1.1.3 NEXT STEPS After Planning Commission and City Council provide direction on this Report and zoning implementation options, the commercial capacity assessment should be refined through a criteria-driven analysis based on characteristics demanded by retail or office tenants currently and considering future trends. Those characteristics may include access/circulation (freeway proximity, left turn only access, etc.), visibility, foot traffic, clustering of like businesses, retail leakage/market saturation, lot dimensions, utility and infrastructure capacity and condition, existing uses and utilization, and other physical or operational constraints. The results will guide amendments to the Zoning Map and Zoning Code to ensure development standards enable and facilitate targeted commercial uses and desired urban form outcomes within market realities and consistent with the General Plan’s vision to transform Monterey Road into a revitalized mixed-use corridor.
1.2 BACKGROUND Located in the southern portion of Santa Clara County, Morgan Hill is approximately 30 miles south of downtown San Jose and 10 miles north of Gilroy. Highway 101 bisects the city, and the community is served by the Morgan Hill Transit Center, which includes Caltrain services, limited regional bus service provided by the Valley Transit Authority, and houses many private corporate busses. Morgan Hill encompasses 13 square miles and has approximately 44,000 residents.
Monterey Road parallels Highway 101, typically at a distance of one mile apart. The Monterey Road Corridor Study Area is roughly 187 acres (0.3 square miles) and stretches along approximately 4.4 miles of Monterey Road. While the Downtown is located on Monterey Road, it is not included in the Study Area as it is subject to the Downtown Specific Plan. An inventory of the Study Area, identifying existing land uses and underutilized parcels is included as Appendix B.

CITY OF MORGAN HILL DRAFT MARKET ANALYSIS | DECEMBER 2017 | 3
2 KEY FINDINGS The following key findings summarize the most important takeaways from this Report:
• Morgan Hill’s population is forecast to grow 1.9% per year until 2035 as a reflection of the City’s voter-approved Residential Development Control System (RDCS), which established a maximum population ceiling of 58,200 residents by 2035. The number of jobs is projected with a slightly higher grow rate of 2%, suggesting that a larger proportion of Morgan Hill residents may work in Morgan Hill in the future.
• The retail market appears relatively stable, reflecting existing retail space and environments, regional competition, changing retail preferences, and e-commerce growth that has challenged the overall viability of traditional brick-and-mortar stores.
• Morgan Hill experiences sales tax leakage in all economic categories except Transportation (vehicle sales, service stations, and auto parts and repair). Grocery stores are also capturing an above-average proportion of sales. The economic segments with the highest leakage are restaurants and apparel stores.
• Office conditions demonstrate a low activity Morgan Hill office market. Substantial office construction is occurring in Silicon Valley, which may sustain near term demand; although some secondary markets with transit hubs may see interest because of limited land and cost associated with urban office development.
• Residential is expected to be the most highly favored market sector in Morgan Hill, where it continues to be an option for Bay Area homebuyers seeking more affordable prices, primarily for single-family homes.
• Based on the assumptions and methodology in this Report, even with a stable or modest floor area ratio (FAR) buildout assumption for the Monterey Corridor, there is more capacity available than theoretical commercial market demand (215,000 square feet), leaving at minimum 385,000 square feet for non-commercial uses (e.g., residential, etc.). This could accommodate roughly 150 to 260 units assuming 1,500 to 2,500 gross square feet per unit; however, buildout at this modest FAR is unlikely to result in the revitalized corridor environment envisioned in the General Plan.
• Under a high FAR buildout scenario for the Monterey Corridor, more than one million square feet could be available for non-commercial uses. This could accommodate roughly 530 to 890 units assuming 1,500 to 2,500 gross square feet per unit.

CITY OF MORGAN HILL DRAFT MARKET ANALYSIS | DECEMBER 2017 | 4
3 DEMOGRAPHIC & SOCIO-ECONOMIC DATA This Section assesses Morgan Hill’s demographic and socio-economic characteristics relative to larger regions (i.e., Santa Clara County and California). The comparative context allows an understanding of Morgan Hill’s unique attributes and potential opportunities or competitive advantages that may affect the City’s economic performance over time. It may also provide insight as to whether existing trends in Morgan Hill may continue or adjust to larger geographic trends.
3.1 POPULATIONS & HOUSEHOLDS Trends in population and household growth can convey important information about demand for various land use types, potential consumer spending, and the need for services. Morgan Hill has, and is expected to continue to, experience stable population and household growth. On average, Morgan Hill’s population grew 1.7% per year between 2000 and 2015 (26.2%) and is forecast to grow 1.9% on average per year from 2015 to 2035 (37.5%).
TABLE 3-1 POPULATION
Population (2000-2035)
Area 2000 2010 2015 Growth Rate 2000-2015
2035 Growth Rate 2015-2035
Morgan Hill 33,556 37,882 42,331 26.2% 58,200 37.5%
Santa Clara County
1,682,585 1,781,642 1,903,209 13.1% 2,337,470 22.8%
California 33,871,648 37,253,956 38,915,880 14.9% 45,521,334 17.0%
Source: U.S. Decennial Census, Summary File 1, Table DP-1; California Department of Finance, February 2017; City of Morgan Hill, Residential Development Control System
The total number of households forecast for Morgan Hill in 2035 is 18,082, which is an average 1.8% increase per year from 2015 or 238 additional households each year. This represents a slight increase from past household growth of 1.5% annually between 2000 and 2015, and is higher than the County’s projected growth rate from 2015 to 2035. These growth projections reflect the constraints of the City’s Residential Development Control System (RDCS), which limits the number of residential allotments available in each year’s RDCS competition to 215.

CITY OF MORGAN HILL DRAFT MARKET ANALYSIS | DECEMBER 2017 | 5
TABLE 3-2 HOUSEHOLDS
Households (2000-2035)
Morgan Hill 2000 2010 2015 Growth Rate 2000-2015
2035 Growth Rate 2015-2035
Number of Households 10,855 12,323 13,324 22.8% 18,082 35.7% Persons Per Household 3.05 3.04 3.15 3.3% 3.09 -1.9%
Santa Clara County 2000 2010 2015 Growth Rate 2000-2010
2035 Growth Rate 2015-2035
Number of Households 565,863 604,145 623,120 10.1% 776,461 24.6% Persons Per Household 2.92 2.90 3.00 2.7% 2.89 -3.7% Source: ABAG Projections, 2013; California Department of Finance
Notes: (1) 2035 number of households calculated by dividing population (Table 3-1) by persons per household (ABAG Projections) and reducing by a 4% vacancy rate.
The Quantified Housing Objectives outlined in the City’s General Plan Housing Element, identifies that 13.5% of new housing units available between 2015 and 2023 should be affordable to households with moderate-income levels or below (i.e., households that earn less than 120% of the County’s median household income). Median household income for a 4-person household in Santa Clara County is $113,3001. Figure F-1 in the Housing Element identifies vacant available residential sites throughout the city that could accommodate these housing needs, including some properties along the Monterey Road Corridor.
3.2 HOUSEHOLD INCOME GROWTH Household income provides insight into the level of demand for and feasibility of the type of retail, services, and other businesses within the community as well as an indicator to the community’s standard of living. Household income is often used by underwriters to assess lending risk in a community. Median household income in Morgan Hill has increased at a slower rate than was seen in both Santa Clara County and the State from 2000 to 2015, with an average annual increase of 1.1%. However, Morgan Hill and Santa Clara County’s median income levels were still more than $30,000 above the State’s median household income in 2015.
1 Department of Housing and Community Development, Memorandum – State Income Limits for 2017, June 9, 2017.
The Theory of Household Production views families as both consumers and producers of goods. The theory states that families efficiently allocate time, income, and the collection of goods and service to maximize utility (Becker, 1965). Subsequent researchers have found that as a local economy grows, production shifts out of households and into the market (Locay, 1990).

CITY OF MORGAN HILL DRAFT MARKET ANALYSIS | DECEMBER 2017 | 6
TABLE 3-3 MEDIAN HOUSEHOLD INCOME
Median Household Income (2000-2015) Area 2000 2010 2015 % Change 2000-2015
Morgan Hill $81,958 $92,771 $96,051 17.2% Santa Clara County $74,335 $86,850 $96,310 29.6%
California $47,493 $60,883 $61,818 30.2% Source: U.S. Decennial Census, Summary File 3, Table DP-3; American Community Survey 5-year Estimate, Table DP03
Over 48% of Morgan Hill households earn $100,000 or more, and 18% earn $200,000 or more. Average household income is $126,9862.
3.3 AGE, RACE, & EDUCATION
3.3.1 AGE The age composition of a community informs expected spending behavior of residents, provides insight into demand for service types, and a profile of the labor pool. Morgan Hill is aging. The single largest gain in population between 2000 and 2015 was among 60 to 64 year olds. In absolute terms, this group experienced an increase of 1,705 people, growing from just over 3% of the total population in 2000 to just under 7% in 2015. Between 2000 and 2015, 25 to 44 year olds lost share of population while every age group over 45 years gained. In 2015, just over 30% of the population was between 35 and 54 years old.
FIGURE 3-A AGE COMPOSITION OF MORGAN HILL, 2015
2 U.S. Census, 2011-2015 American Community Survey 5-year Estimate.
7%
7%
8%
8%
6%
11%
15%
16%
6%
7%
7%3%
2%
Under 5 years (7%)
5 to 9 years (7%)
10 to 14 years (8%)
15 to 19 years (8%)
20 to 24 years (6%)
25 to 34 years (11%)
35 to 44 years (15%)
45 to 54 years (16%)
55 to 59 years (6%)
60 to 64 years (7%)
65 to 74 years (7%)
75 to 84 years (3%)
85 years and over (2%)

CITY OF MORGAN HILL DRAFT MARKET ANALYSIS | DECEMBER 2017 | 7
In 2015, Morgan Hill’s median age was roughly one year higher than that of Santa Clara County and two years higher than that of the State.
TABLE 3-4 REGIONAL AND STATE COMPARISON OF MEDIAN AGE
Regional and State Comparison of Median Age (2015) Morgan Hill Santa Clara County California
Median Age 37.9 36.8 35.8 Source: U.S. Census American Community Survey 5-year Estimate, Table S0101
3.3.2 RACE While the nuances of race and their impacts on the market can be difficult to measure, research has found that place attachment - an important contributing factor to urban revitalization - is higher in non-white ethnic populations and homeowners (Brown et al., 2003). Understanding demographic forces, including race distribution, can help communities better prepare for future opportunities and challenges. Morgan Hill is less diverse than the County and State. The population is predominantly White at 67.8%, almost 6% higher than the State and almost 20% higher than the County. The share of Morgan Hill’s population reported as Asian (9.5%) was also lower than the State (13.7%) and the County (33.8%).
3.3.3 EDUCATIONAL ATTAINMENT Education levels are used to assess business investment attractiveness and provide insight on consumer behavior. Retailers and employers consider education levels in conjunction with incomes as principal factors in location decisions.
In Morgan Hill, the number of high school graduates or those with some college, associates degrees, bachelor’s degrees, and graduate or professional degrees all grew in absolute terms between 2010 and 2015. In 2015, almost 39% of the population had a bachelor’s degree or higher, roughly the same as 2010 levels, which is approximately 10% lower than the County.
3.4 EMPLOYMENT Employment data provides insight into workforce preparedness, as well as trends and opportunities in business and industry clusters. Morgan Hill’s key industries and trends in employment reflects its proximity to and relationship with Silicon Valley. In 2016, Silicon Valley’s employment grew by 45,621 new jobs (3% from the previous year), most of which were concentrated in the fastest growing tech sectors of biotech, internet, and computer design3. Morgan Hill’s existing commute patterns of employee inflow and outflow, and large number of residents employed in the management, business, science, and arts occupation category, indicates employment growth largely commensurate with Silicon Valley.
3 Joint Venture Silicon Valley, Institute for Regional Studies. 2017 Silicon Valley Index (2017).

CITY OF MORGAN HILL DRAFT MARKET ANALYSIS | DECEMBER 2017 | 8
3.4.1 EMPLOYMENT PROJECTION Employment in Morgan Hill is projected to grow at an average rate of 2% annually, with the number of jobs rising to 21,549 in 2035. This 64% increase between 2010 and 2035 represents 8,404 jobs, suggesting that a larger proportion of Morgan Hill residents may work in Morgan Hill in the future.
TABLE 3-5 EMPLOYMENT PROJECTIONS
Employment Projection (2010-2035)
Area 2010 2035 Annualized
Growth Rate Growth Rate 2010-2035
Morgan Hill 13,135 21,549 2% 64.0% Santa Clara County 852,855 1,115,594 1% 31.8%
Source: U.S. Census American Community Survey 5-year Estimate, Table S2301; 2010 Census OnTheMap Area Profile Analysis for all Jobs, City of Morgan Hill & Santa Clara County Notes: (1) Morgan Hill projections calculated using historic annualized job growth rate of 2%, as 2040 ABAG/MTC projection shows employment gains unrealistically low at 300 jobs from 2010 to 2040. (2) Santa Clara County projections calculated using annualized growth rate of 1%, which represents the County’s historic job growth from 2003 to 2014.
3.4.2 EMPLOYMENT INFLOW/OUTFLOW Employment inflow and outflow data tracks commute patterns of area residents as they travel from their home to their place of employment and identifies change in daytime/nighttime populations.
The majority of Morgan Hill’s residents, approximately 72%, works outside of the City limits, which is the same percentage as data collected between 2006 and 20084, 5. Morgan Hill residents have an average commute time of nearly 32 minutes and are overwhelmingly commuting to jobs within Santa Clara County. Of the jobs reported in Morgan Hill in 2014, almost 82% were filled by people not living in Morgan Hill. This inflow/outflow pattern results in a lower daytime population than nighttime population.
The jobs housing ratio measures the relationship between where people work and where they live. A balanced jobs housing ratio can yield numerous benefits that lead to increased economic and social vibrancy, including reduced traffic, improved workplace efficiency, lower air pollution emissions, and a higher quality of life6. Morgan Hill has a jobs to housing ratio of 1.427, showing that
4 City of Morgan Hill, Morgan Hill 2035, Existing Conditions White Paper, Economics (May 16, 2013), pp. I-12. 5 However, 2014 Census On The Map data shows approximately 87% of Morgan Hill’s residents working outside of City limits. 6 SCAG, The New Economy and Jobs-Housing Balance in Southern California (April 2001), pp. 19-20. Dr. John Sullivan, TLNT. 7 Plan Bay Area Jobs Housing Connection Strategy, May 2012, Appendix A. Number of jobs in 2010 = 17,520; number of households in 2010 = 12,330 (17,520/12,330 = 1.42)

CITY OF MORGAN HILL DRAFT MARKET ANALYSIS | DECEMBER 2017 | 9
there is a disconnect between the match of job types and housing available in the community demonstrated by employment inflow and outflow.
3.4.3 UNEMPLOYMENT Despite a reduction in unemployment levels in Santa Clara County between 2010 and 2015, unemployment in Morgan Hill increased from 7.2% to 8.6% during the same five-year period. Unemployment at the state level also increased, but by less than 1%. In 2016, Morgan Hill’s unemployment rates dropped to around 4%, which was higher than the County’s unemployment level, but lower than the State8, 9.
3.4.4 EMPLOYMENT BY INDUSTRY AND OCCUPATION Employment data reflects Morgan Hill’s distribution of population into key industry and occupation categories. The largest industry for Morgan Hill residents is education and health care (17.6%), followed by manufacturing (15.1%) and professional, scientific, and business services (14%). The industries that comprise a higher percent share relative to the County are other services, public administration, and construction. Other services include automobile and equipment repair, dry cleaners, beauty salons, religious organizations, and other similar types of services. Almost 12% of Morgan Hill residents are employed in retail trade, which is a slightly concentrated cluster compared to the County.
8 Joint Venture Silicon Valley, Institute for Regional Studies. 2017 Silicon Valley Index (2017); Bureau of Labor Statistics, Unemployment rate – Not Seasonally Adjusted (2016). 9 Retirees, students, and those unable to work (e.g., disabled) are not considered part of the labor force or factored into unemployment rate calculations.

CITY OF MORGAN HILL DRAFT MARKET ANALYSIS | DECEMBER 2017 | 10
FIGURE 3-B MORGAN HILL TOP EMPLOYMENT BY INDUSTRY, 2015
Jobs within Morgan Hill, when compared to the County, are more focused towards manufacturing, retail, and arts, entertainment, and recreation with relatively fewer jobs in education and healthcare, and professional and scientific services10. Manufacturing represents the fastest growing industry sectors in Morgan Hill.
10 City of Morgan Hill, Economic Blueprint (April 7, 2017).
17.6%
15.1%
14.0%
11.9%
7.4%
7.1%
7.0%
6.3%
3.6%
3.5%
3.0%2.7%
0.7%
Educational & health care (17.6%)
Manufacturing (15.1%)
Professional, scientific management,administrative & waste management(14.0%)Retail trade (11.9%)
Construction (7.4%)
Arts, entertainment, recreation,accommodation, & food services (7.1%)
Other services, except publicadministration (7.0%)
Finance, insurance, & real estate (6.3%)

CITY OF MORGAN HILL DRAFT MARKET ANALYSIS | DECEMBER 2017 | 11
TABLE 3-6 EMPLOYMENT BY LAND USE AND INDUSTRY CLUSTER
Employment by Land Use & Industry Cluster (2010-2015)
2010 2015 % Change
(2010- 2015) Office/R&D/Industrial
Miscellaneous Manufacturing 671 1,271 89% Building/Construction/Real Estate 662 961 45% Semiconductors 597 915 53% Transportation/Distribution 1,174 878 -25% Business Services 924 836 -10% Innovation Services 663 693 5% Industrial Supplies and Services 429 596 39% Bioscience 458 555 21% Corporate Offices 545 542 -1% Electronic Component Manufacturing 421 482 14% Financial Services 374 340 -9% Software 143 106 -26% Computer and Communications Hardware Manufacturing 10 64 540%
Retail Retail/Consumer Services 3,705 4,578 24%
Visitor Visitor (Tourism) 203 163 -20%
Other Civic (Government and Education) 2,212 1,977 -11% Healthcare 589 649 10% Other 479 117 -76%
Total Jobs 14,260 15,723 10% Source: City of Morgan Hill Economic Blueprint, Figure 6 (CAA EDD, Quarterly Census of Employment Wages; City of Morgan Hill; Joint Venture Silicon Valley Industry Cluster Definitions)
The largest occupation category for Morgan Hill residents is management, business, science, and arts11 (43%), followed by sales and office12 (24.9%). Sales and office occupations also comprise a higher percent share in Morgan Hill relative to the County. More than 75% of retail trade occupations are in the sales and office category.
11 Examples of management, business, science, and arts occupations include chief executives, computer and information system managers, accountants, software developers, biomedical engineers, civil engineers, lawyers, teachers, physicians, and artists. 12 Examples of sales and office occupations include cashiers, sales representatives, administrative assistants, and postal service clerks,

CITY OF MORGAN HILL DRAFT MARKET ANALYSIS | DECEMBER 2017 | 12
TABLE 3-7 EMPLOYMENT BY OCCUPATION
Employment by Occupation (2015)
Occupation Morgan Hill Santa Clara County
Share of County
LQ (County) Total
Jobs % of Total
Total Jobs
% of Total
Civilian employed population 16 years and over 19,512 N/A 915,619 N/A 2.1% N/A Management, business, science, and arts 8,380 43.0% 462,714 50.5% 1.8% 0.85
Sales and office 4,854 24.9% 179,238 19.6% 2.7% 1.27 Service 3,099 15.9% 139,416 15.2% 2.2% 1.04
Natural resources, construction, and maintenance 1,636 8.4% 59,477 6.5% 2.8% 1.29 Production, transportation, and material moving 1,543 7.9% 74,774 8.2% 2.1% 0.97
Source: U.S. Census American Community Survey 5-year Estimate, Table DP-03 Note: Location Quotient (LQ) is a metric used to quantify how concentrated a particular industry, cluster, or occupation is in an area as compared to a larger region. The industries listed with LQ values above 1.0 present a greater concentration of jobs relative to Santa Clara County.
3.4.5 WAGES More than two-thirds of Morgan Hill’s residents are in management, business, science, and arts or sales and office occupations. The median income for management, business, science, and arts occupations (43% of residents) is $80,180, which is 11.5% lower than the same occupation category in the County. Sales and office occupations (24.9% of residents) have a median income of $37,267, which is 6.4% higher than the County.
Median employee salary in Morgan Hill is $51,444, which is $6,229 below the Santa Clara County’s median employee salary $57,67313.
3.5 INDUSTRY & OCCUPATIONAL TRENDS Industry trends illustrate a city or a region’s ability to address where opportunities for expansion and change in the business or employment “mix” exist, considering other demographic and socio-economic data such as household growth, median income, and education levels.
On a percentage basis, the fastest growing industry for Morgan Hill residents was transportation, warehousing, and utilities, at 87.5% between 2010 and 2015, although this industry represented only 3.6% of Morgan Hill’s employed population. Retail trade grew at the second highest rate of 84.6%, and in absolute terms, no industry added more jobs than the 1,061 retail trade jobs between 2010 and 2015. Unlike Morgan Hill, retail trade grew only 7.5% in the County during the same five-year
13 EconSolutions by HdL, Employment Profile for the City of Morgan Hill, February 28, 2017.

CITY OF MORGAN HILL DRAFT MARKET ANALYSIS | DECEMBER 2017 | 13
period. The County experienced the highest growth in the leisure and hospitality industry14, at 22% between 2010 and 2015, while Morgan Hill saw only 6.2% growth.
TABLE 3-8 INDUSTRY TRENDS
Industry Trends (2010-2015) Industry City of Morgan Hill Santa Clara County
2010 2015 % Change 2010-2015
2010 2015 % Change 2010-2015
Civilian employed population 16 years and over
17,506 19,512 11.5% 843,854 915,619 8.5%
Transportation and warehousing, and utilities
375 703 87.5% 22,914 25,364 10.7%
Retail trade 1,254 2,315 84.6% 80,847 86,926 7.5% Other services, except public administration
1,061 1,372 29.3% 35,725 38,809 8.6%
Professional, scientific, and management, and administrative and waste management services
2,231 2,724 22.1% 149,441 173,964 16.4%
Finance and insurance, and real estate and retail and leasing
1,058 1,232 16.5% 45,318 43,837 -3.3%
Information 450 524 16.4% 34,058 39,872 17.1% Construction 1,286 1,442 12.1% 48,391 47,111 -2.7% Arts, entertainment, and recreation, and accommodations, and food services
1,313 1,394 6.2% 59,604 72,686 22.0%
Wholesale trade 587 592 0.9% 21,396 20,172 -5.7% Manufacturing 3,071 2,952 -3.9% 166,851 169,787 1.8% Educational services, and health care and social assistance
3,592 3,439 -4.3% 152,679 169,496 11.0%
Public administration 902 689 -23.6% 22,150 22,220 0.3%
Agriculture, forestry, fishing and hunting, and mining
326 134 -58.9% 4,480 5,375 20.0%
Source: U.S. Census American Community Survey 5-year Estimate, Table S2403 Note: Census data for industry trends unavailable for the year 2000. Earliest information available is for 2007.
14 The “leisure and hospitality” industry describes arts, entertainment, and recreation, and accommodations, and food services. Examples include performing arts, spectator sports, museums, art galleries, amusement centers, restaurants, and bars.

CITY OF MORGAN HILL DRAFT MARKET ANALYSIS | DECEMBER 2017 | 14
Service occupations grew the fastest for Morgan Hill residents, at a rate of 72.3% from 2000 to 2015, and comprise approximately 9% of total employed population. These service occupations are concentrated primarily in the leisure and hospitality industry (approximately 908 people).
3.6 MAJOR EMPLOYERS An assessment of major employers illustrates the type of businesses that have chosen to locate in Morgan Hill and where opportunities for expansion or diversification might exist. While the largest employer in Morgan Hill is the Morgan Hill Unified School District (730 jobs), the manufacturing industry employs the most workers through companies such as Anritsu Company, Specialized Bicycles Components, and Paramit Corporation. The largest retail employers are Safeway Inc. and Wal-Mart Supercenter.
3.7 CONSUMER EXPENDITURES Consumer expenditures illustrate changing preferences and spending habits. These trends are critical when assessing future market potential for businesses or industries. The Bureau of Labor Statistics tracks consumer expenditure data nationally, and at the metropolitan area level as the smallest or most focused geography. For the San Francisco Metropolitan Statistical Area, the change in household spending between 1999 to 2015 for few key categories are listed below:
• Healthcare – 130.8% • Education – 86.8% • Food away from home – 45.8% • Entertainment – 44.9% • Apparel and services – (24.6%)
A discussion of consumer spending in Morgan Hill relative to the region is included in Subsection 4.1.3 (Retail Leakage). Businesses and industries, as always, must adapt to changing consumer preferences and spending patterns.
“Consumers are spending more on eating out, holidays and, to their chagrin, health care. They are spending less on clothes, typically the main offering of department stores and malls. When shoppers do buy a dress or jacket, they want a bargain, an attitude spawned in the recession and ingrained in the years since. (The Economist, 2017).

CITY OF MORGAN HILL DRAFT MARKET ANALYSIS | DECEMBER 2017 | 15
4 COMMERCIAL MARKET ANALYSIS Data for Morgan Hill’s retail, office, and residential markets is identified and analyzed in the context of regional conditions and larger market trends. Existing market conditions and trends are useful to forecast potential outlooks for these various market segments, which can inform land use policy and economic development strategies.
4.1 RETAIL Outside of Downtown, the retail environment in Morgan Hill is primarily auto-oriented and located along Highway 101 and other major thoroughfares (e.g., Cochrane Road, Dunne Avenue, Tennant Avenue, and Monterey Road); however, retail destinations are somewhat scattered throughout the western portion of Morgan Hill. Eight shopping centers within Morgan Hill comprise approximately 1.3 million square feet of retail space, and major retailers include Target, Home Depot, Wal-Mart, TJ-Maxx, Ross Dress-for-Less, and others15. Numerous smaller strip centers are situated throughout the city and comprise much of the retail space along the Monterey Road Corridor. Regional shopping is available outside of Morgan Hill in Gilroy (Premium Outlets) and South San Jose (Westfield Oakridge Mall), where there are greater densities to support regional retail opportunities.
4.1.1 RETAIL DATA The amount of vacant retail square footage in Morgan Hill has been on the decline since 2013 and is now below the vacant square footage levels of 2008. Despite decreasing vacancies, retail rents citywide have only increased moderately since 2008, from $1.70 per square foot per month ($20.40 per square foot per year) in 2008 to $1.90 square foot per month ($22.80 square foot per year) in 2017. An August 27, 2017 LoopNet search (www.LoopNet.com) for retail space in Morgan Hill returned five retail properties with space available ranging from $1.50 to $2.75 per square foot per month; median asking price was $2.03 per square foot per month. Recent projects and construction in Downtown are furnishing new retail spaces, as reflected in the rents of approximately $3.00 per square foot16 for new buildings. Downtown is experiencing growth in commercial, hotel, residential, and mixed-use projects. The current retail vacancy rate is 4.9%, which has been generally declining since 2013.
15 City of Morgan Hill, Economic Blueprint (April 7, 2017). 16 Ibid.

CITY OF MORGAN HILL DRAFT MARKET ANALYSIS | DECEMBER 2017 | 16
FIGURE 4-A RETAIL VACANCY AND NNN RENT PER SQUARE FOOT
Source: The Concord Group (CoStar, REIS) Note: NNN (triple net) rent includes property taxes, property insurance, and common area maintenance in addition to base rent.
Morgan Hill has almost 2.3 million square feet of retail space, and this total square footage has slightly decreased since 2008; 2017 square footage is approximately 40,000 square feet lower than 2013, representing a 1.7% reduction. However, Downtown Morgan Hill will soon have a net increase of 20,000 square feet of retail space with developments recently completed or underway. Also, approved entitlements for new retail space at two lifestyle shopping centers, Cochrane Commons and the Madrone Village Shopping Center, could increase overall retail square footage, although construction has not been initiated.
The only modest increase in rents with decreasing vacancies are indicative of a relatively stable retail market, which likely reflects several factors (e.g., existing retail space and environments, regional competition, changing retail preferences, and e-commerce growth). Increasing median income of Morgan Hill residents may improve opportunities for retail resulting from higher discretionary income locally; however, this may be abated by the Bay Area’s high cost of living, the City’s Residential Development Control System, and current retail trends (see Subsection 4.1.4 (Retail Trends), below).
$0.00$5.00$10.00$15.00$20.00$25.00$30.00$35.00$40.00
0
50,000
100,000
150,000
200,000
250,000
300,000
350,00020
06 Q
1
2006
Q4
2007
Q3
2008
Q2
2009
Q1
2009
Q4
2010
Q3
2011
Q2
2012
Q1
2012
Q4
2013
Q3
2014
Q2
2015
Q1
2015
Q4
2016
Q3
2017
Q2
Retai
l Ren
t per
Squa
re Fo
ot
Vaca
ncy i
n Squ
are F
eet
Quarter
Retail Vacancy vs. Average NNN Rent(2006-2017)
Vacant SF Direct Retail Rent per Square Foot

CITY OF MORGAN HILL DRAFT MARKET ANALYSIS | DECEMBER 2017 | 17
4.1.2 SALES TAX Sales tax is the largest revenue source for the City’s General Fund at 25% of revenues17. Between 2012 and 2016, sales tax revenues rose 16.3% and sales tax per capita increased 5.4%.
TABLE 4-1 SALES TAX PER CAPITA
Sales Tax per Capita (2012 - 2016) 2012 2013 2014 2015 2016 % Change 2012-2016 Sales Tax Revenue $6,617,777 $7,055,468 $7,102,245 $7,359,251 $7,694,571 16.3% Population 39,426 40,463 41,517 42,331 43,484 10.3% Sales Tax per Capita $167.85 $174.37 $171.07 $173.85 $176.95 5.4%
Source: MuniServices and Claritas, California Department of Finance
Between 2012 and 2016, with a net retail square footage decline of 1.3% and annualized sales tax revenue increases of more than 3%, sales tax per retail square foot increased 17.8%.
TABLE 4-2 SALES TAX PER RETAIL SQUARE FOOT
Sales Tax per Retail Square Foot (2012 - 2016) 2012 2013 2014 2015 2016 % Change 2012-2016 Sales Tax Revenue $6,617,777 $7,055,468 $7,102,245 $7,359,251 $7,694,571 16.3% Retail Sq. Ft. 2,340,907 2,332,657 2,329,907 2,319,717 2,310,268 -1.3% Sales Tax per Retail Sq. Ft. $2.83 $3.02 $3.05 $3.17 $3.33 17.8%
Source: MuniServices and Claritas, The Concord Group (CoStar, REIS)
Approximately 9% of Morgan Hill’s sales tax is realized from businesses in the Study Area. Over the last five years, the Study Area has experienced slightly higher growth in sales tax revenue than Morgan Hill overall.
TABLE 4-3 SALES TAX CITYWIDE AND STUDY AREA
Sales Tax Citywide and Study Area (2012 - 2016) Sales Tax Revenue 2012 2013 2014 2015 2016 % Change 2012-2016 Morgan Hill $6,617,777 $7,055,468 $7,102,245 $7,359,251 $7,694,571 16.3% Study Area $592,926 $627,312 $739,104 $744,858 $693,837 17.0% Study Area % of Citywide Tax Revenue
8.96% 8.89% 10.41% 10.12% 9.02% 0.6%
Source: MuniServices and Claritas, The Concord Group (CoStar, REIS)
17 Ibid.

CITY OF MORGAN HILL DRAFT MARKET ANALYSIS | DECEMBER 2017 | 18
4.1.3 RETAIL LEAKAGE Retail leakage quantitatively examines a community’s retail opportunities. It is a guide to indicate how well local retail establishments are meeting the needs of residents and to understand potential unmet demand and opportunities. Retail leakage means that residents are spending more for products than local businesses are providing or capturing.
Morgan Hill experiences sales tax leakage in all economic categories except Transportation (vehicle sales, service stations, and auto parts and repair). Net capture has been achieved in recent years, except 2014, because of such significant capture in the Transportation category. Since 2012, leakage has increased in all categories where leakage is experienced except for Construction (wholesale and retail of building materials).
TABLE 4-4 SALES TAX LEAKAGE
Sales Tax Leakage (2012 - 2016) Economic Category
2012 2013 2014 2015 2016 % Change 2012-2016
General Retail ($550,043) ($511,177) ($622,992) ($617,792) ($596,346) 8.4% Food Products ($172,100) ($153,959) ($240,294) ($243,326) ($212,488) 23.5% Transportation $1,234,060 $1,416,912 $1,381,968 $1,469,408 $1,419,536 15.0% Construction ($65,472) ($39,858) ($84,133) ($73,020) ($25,973) (60.3%) Business to Business
($44,752) ($178,203) ($400,933) ($456,249) ($301,318) 573.3%
Miscellaneous ($42,441) ($44,303) ($55,256) ($53,073) ($54,413) 28.2% TOTAL $359,252 $489,412 ($21,640) $25,948 $228,998 (36.3%)
Source: MuniServices and Claritas Notes: Red numbers represent sales leakage; black numbers represent sales capture or surplus.
Each economic category is comprised of numerous economic segments, some of which perform better or worse than the category overall. Figure 4-B identifies the 2016 sales tax capture or leakage experienced in the economic segments of consumer-driven economic categories: General Retail, Food Products, Transportation, and Construction.
Retail leakage data demonstrates “how well Morgan Hill is capturing potential sales tax based on its residents’ effective buying income (disposable income) compared to regional purchasing habits.” (MuniServices, 2017).

CITY OF MORGAN HILL DRAFT MARKET ANALYSIS | DECEMBER 2017 | 19
FIGURE 4-B SALES TAX LEAKAGE OR CAPTURE FOR ECONOMIC SEGEMENTS OF CONSUMER-DRIVEN ECONOMIC CATEGORIES (2016)
Source: MuniServices, LWC
All economic segments in General Retail experience leakage; however, ‘food markets’ in Food Products and ‘building materials – retail’ in Construction capture sales tax. ‘Auto sales – used’ is the only economic segment in Transportation with leakage. Morgan Hill’s largest sales tax leakage is found in restaurants, followed by apparel stores, indicating potential opportunities for upper end restaurants and boutiques.
4.1.4 RETAIL TRENDS Retail continues to be dynamic, adjusting to competition with online channels, often through new
store formats (e.g., smaller, urban footprints within a walkable mixed-use environment), the provision of more experience-based retail environments (in-store demonstrations and classes, performances, and other attractions), or convenience retail (including “click and collect” programs where customers purchase online and
“The change in appetite for grocery product is evident by the increased vacancy within centers…with major online retailers making large investments in their online grocery platforms, the fear is now real, and as a result, investors are shying away from grocery-anchored assets.” (JLL, 2017).
LEAKAGE CAPTURE

CITY OF MORGAN HILL DRAFT MARKET ANALYSIS | DECEMBER 2017 | 20
pick up in store)18. Experience-based retail environments reflect the notion of placemaking – creating quality places where people want to live, work, play, shop, learn, and visit19. High-end stores and “lifestyle towns” that focus on the customer experience continue to do well, and the trend of converting Class B malls to open-air centers with a mix of retail uses and amenities is expected20.
Furthermore, the aging of baby boomers has shifted millions of people out of prime consumption ages, and over the next 20 years, millennials will drive consumption. Current retail trends reflect the industry’s attempts to adapt to this market driver. Morgan Hill has seen the largest population gains for baby boomers (those 55 years old and older) and a 2.1% decline for millennials (those 20 to 34 years old) (see Section 3.3.1 and Appendix A).
Higher densities and walkable design can create foot traffic needed to support retail, and temporary uses, such as food trucks and pop-up shops, can generate foot traffic in the interim period until new construction or investment is viable. Mixing residential with retail can help to support retail (e.g., horizontal or vertical mixed-use); however, the current high cost of vertical mixed-use construction combined with the rents commanded in Morgan Hill is a significant obstacle21. A more viable option for most communities is to focus retail activity at the corners of intersections of major thoroughfares and place residential mid-block within easy walking or bicycling distance to the retail corners. Off-street parking requirements also limit the financial feasibility of new development22. Adaptable construction, which can more efficiently accommodate a variety of uses or be repurposed is another way to respond to the dynamic and evolving nature of retail.
4.2 OFFICE Office space in Morgan Hill is mainly available within industrial and research and development areas23.
4.2.1 OFFICE DATA The amount of vacant office space in Morgan Hill has declined over 80% since 2013; and accordingly, office rents have increased during the same time. Asking office rents rose from $1.66 per square foot in 2013 to a peak of $2.13 per square foot in late 2015/early 2016, then down to $2.05 per square foot in 2017. An August 27, 2017 LoopNet search (www.LoopNet.com) for office space in
18 Buxton, 2017 Real Estate Outlook Report (2017). 19 Land Policy Institute, Michigan State University, Placemaking as an Economic Development Tool (2015). 20 Cohn Reznick, LLP. Momentum 2017, Commercial Real Estate Outlook: Agility and Discipline in a Time of Uncertainty (2017). 21 Christine Firstenberg, Senior Vice President, JLL – Retail Brokerage, telephone correspondence (August 29, 2017). 22 Strategic Economics, Morgan Hill PDA Plan: Feasibility Study Initial Findings (October 4, 2016 – updated 11/16). 23 Ibid.

CITY OF MORGAN HILL DRAFT MARKET ANALYSIS | DECEMBER 2017 | 21
Morgan Hill returned 12 office properties with space available ranging from $1.15 to $3.67 per square foot per month; median asking price was $1.55 per square foot per month. The current office vacancy rate is 4.4%.
FIGURE 4-C OFFICE VACANCY AND ASKING RENT
Source: Colliers International
Office square footage in Morgan Hill has remained around 700,000 square feet since 2013, but is currently at a high of 757,379 square feet. The slight decline in asking rents over the last year and stable inventory indicate a low activity office market. Regionally, however, substantial construction of new office space is occurring in Silicon Valley with 5.48 million new square feet completed in 2016, reflecting higher office rents24. Office vacancy in Silicon Valley has been declining for the past six years, and the current vacancy rate is 12%25.
24 Joint Venture Silicon Valley, Institute for Regional Studies, 2017 Silicon Valley Index (2017). 25 Ibid.
$0.00
$0.50
$1.00
$1.50
$2.00
$2.50
0
50,000
100,000
150,000
200,000
250,000
2013
Q3
2013
Q4
2014
Q1
2014
Q2
2014
Q3
2014
Q4
2015
Q1
2015
Q2
2015
Q3
2015
Q4
2016
Q1
2016
Q2
2016
Q3
2016
Q4
2017
Q1
Rent
per S
quar
e Fee
t
Offic
e Vac
ancy
in Sq
uare
Feet
Quarter
Office Vacancy and Asking RentSquare Footage (2013-2017)
Vacancy in Square Feet Asking Rents in SF

CITY OF MORGAN HILL DRAFT MARKET ANALYSIS | DECEMBER 2017 | 22
4.2.2 OFFICE TRENDS General office trends include smaller square footage requirements per employee. This trend is being driven by the demand for more standardized, collaborative, and shared work spaces, as well as the increased prevalence for telecommuting26. As this type of office environment is financially efficient, the trend for less space on average for each employee is expected to continue.
Furthermore, suburban office parks have been somewhat trending out of favor, indicated by the number of offices relocating to more urban areas to attract younger talent. However, some secondary markets, particularly those with access to transit hubs, may see interest or growth in suburban office spaces because of limited land and cost associated with urban office development27. Bay Area companies with sizable hiring plans are preferring office sites near housing as well as Caltrain and BART stations28.
4.3 RESIDENTIAL
4.3.1 RESIDENTIAL DATA Home values are an indicator of a community’s economic health. Between 2011 and 2017, the median sales price for a home in Morgan Hill increased by 57.4%, which is lower than the increase experienced in the County, but slightly above the State. Morgan Hill’s median home price continues to increase but remains around 15.5% lower than the San Jose Metro area29.
TABLE 4-5 MEDIAN SINGLE-FAMILY HOME SALES PRICE CHANGE
Median Single-Family Home Sales Price Change (2011-2017)
2011 2012 2013 2014 2015 2016 2017
(Jan - Apr) Difference
(2011 -2017) % Change
(2011 - 2017) City of Morgan Hill
$534,308 $546,025 $646,767 $705,700 $759,208 $812,050 $840,875 $306,567 57.4% Santa Clara County
$575,358 $605,242 $715,917 $794,217 $898,775 $972,958 $1,004,000 $428,642 74.5% State of California
$314,650 $315,450 $369,108 $412,975 $439,367 $470,575 $493,200 $178,550 56.8% Source: Zillow; Median Home Value – Zillow Home Value Index; ZHVI Single-Family Homes Time Series and ZHVI Condo/Co-op Time Series ($). Median home sale prices are estimated by Zillow per Zillow Home Value Index Methodology, which involves modelling that results in minimal statistical error between estimated sales prices and actual sales prices.
26 Heschmeyer, Mark, CoStar News (2013). 27 Cohn Reznick, LLP. Momentum 2017, Commercial Real Estate Outlook: Agility and Discipline in a Time of Uncertainty (2017); Williams, Champaign (April 3, 2017). This is Where Office Occupiers are Focusing their Efforts in 2017. 28 Littman, Julie, Silicon Valley Office Rents Increase While Sublease Space Doubles, Bisnow Bay Area (August 30, 2017). 29 Zillow, Zillow Home Value Index, data through July 31, 2017.

CITY OF MORGAN HILL DRAFT MARKET ANALYSIS | DECEMBER 2017 | 23
Median home rental prices also increased during the same period, but at a slower rate (37.3%), which is again more sluggish than the County (42.7%), but faster than the State (26%).
The home ownership rate in Morgan Hill is over 70%, which is higher than both the County (57%) and the State (54%). The vacancy rate for Morgan Hill’s housing stock is extremely low, at 2.5%, which is 1.3% lower than the County and 5.7% lower than the State. However, new multi-family residential completions in the Bay Area, along with a slight slowdown in employment growth, is expected to raise vacancy rates and depress rents30.
FIGURE 4-D RESIDENTIAL VACANCY RATE BY JURISDICTION (2015)
Source: U.S. Census American Community Survey 5-Year Estimate, Table DP04
Increasing sales and rent prices coupled with very low vacancies indicate a tight housing market. Compared to higher demand housing markets in the Bay Area, Morgan Hill remains an option for homebuyers seeking more affordable prices. As the number of residential units in Silicon Valley is not keeping pace with the region’s rapidly growing population, housing is expected to be the most highly favored market sector in Morgan Hill31.
30 Littman, Julie, Bay Area Multifamily Markets may have Peaked. Time to Sell, Ten-X says, Bisnow Bay Area (August 8, 2017). 31 Joint Venture Silicon Valley, Institute for Regional Studies, 2017 Silicon Valley Index (2017).
8.2%
3.8%
2.5%
State of California Santa Clara County City of Morgan Hill
Residential Vacancy Rate by Jurisdiction(2015)

CITY OF MORGAN HILL DRAFT MARKET ANALYSIS | DECEMBER 2017 | 24
4.3.2 RESIDENTIAL TRENDS Baby boomers and millennials are the key demographic cohorts moving the residential market, which is being affected by their financial constraints, needs, and preferences. Trends show increasing demand for smaller units that are in walkable settings, but also an increase in multigenerational living. These cohorts often have preferences for environments that provide convenience, quality of life, physical activity, and social engagement. Renting has also rebounded and is at the highest levels since the 1960s, at over 36% nationally. Nonetheless, Morgan Hill demonstrates high home ownership rates since it has served as a more affordable Bay Area housing option. If walkable mixed-use environments do not mature and relatively affordable single-family homes remain available, Morgan Hill is less likely to attract some of these potential buyers.
The significant growth in the 65 and over population over the next 20 years will have a dramatic impact on housing needs as well as necessary services. Generally, these services include providing health care and assistance for those who have disabilities, from a mobility disability (e.g., difficulty walking, getting in and out of bed, climbing a flight of stairs) and cognitive impairment (e.g., dementia) to long-term care (e.g., home health aide, assisted living care, nursing, etc.). Existing or new residential units will need to reasonably accommodate the aging population, which may be through modifications to existing building and development standards.

CITY OF MORGAN HILL DRAFT MARKET ANALYSIS | DECEMBER 2017 | 25
5 COMMERCIAL CAPACITY ASSESSMENT A Commercial Capacity Assessment (Assessment) of the Study Area was conducted to evaluate a range of optimal amounts of commercial space in the Study Area to support future market demand. This Assessment does not include a criteria-driven analysis to forecast retail and office space separately based on the characteristics typically demanded by retail or office tenants (e.g., access/circulation, visibility, foot traffic, clustering of like businesses, etc.). The capacity methods employed for this Assessment were drawn from a range of options reviewed and authorized by the City. Five capacity methods were used:
1. Commercial Capacity Based on Existing Land Use Inventory 2. Commercial Square Footage per Capita 3. Commercial Square Footage per Job 4. Projected Residential Growth in Study Area 5. Retail Leakage
The following is a discussion of each capacity method’s results and a summary evaluating the results in aggregate. Calculation sheets for each method are contained in Appendix C.
5.1 COMMERCIAL CAPACITY BASED ON EXISTING LAND USE INVENTORY Using the Study Area’s existing land use inventory, this method calculates how much commercial space could be built on vacant or underutilized parcels in the Study Area based on development intensity or floor area ratio (FAR32). This method represents the net square footage increase. Two scenarios were evaluated:
• Maximum FAR Capacity (High) – Net development if future projects are built at 0.5 FAR for commercial parcels and 0.6 FAR for industrial parcels. This determines the maximum developable area within the Study Area.
• Stable FAR Capacity (Low) – Net development if future projects are built at the current median FAR for developed parcels in the Study Area (0.19 FAR). This may be considered a “floor” or baseline of anticipated development within the Study Area.
The outcome was a very wide range of commercial capacity: 597,058 – 1,551,150 square feet33. The high end of this range is the largest square footage result from all methods; however, this method
32 FAR is the ratio of building floor area on a lot divided by the total lot area. 33 For reference, existing buildings in the Study Area comprise approximately 1,195,257 square feet.
Method 1 - Commercial Capacity Based on Existing Land Use
Inventory
High: 1,551,150 s.f.
Low: 597,058 s.f.

CITY OF MORGAN HILL DRAFT MARKET ANALYSIS | DECEMBER 2017 | 26
does not reflect market conditions. The high scenario is strictly a calculation of remaining developable building volume in the Study Area.
5.2 COMMERCIAL SQUARE FOOTAGE PER CAPITA This method uses the ratio of commercial square foot per capita to forecast long-term commercial space needs of a growing community. Using the 2035 Residential Development Control System (RDCS) population cap of 58,200 people (Table 3-1, (Population)), 848,210 square feet of additional future commercial space would be appropriate citywide. Assuming the proportion of commercial space in the Study Area compared to citywide remains stable (around 25%), 215,755 net new square feet of future commercial space would be appropriate in the Study Area.
5.3 COMMERCIAL SQUARE FOOTAGE PER JOB Similar to the previous method, commercial capacity can be calculated based on the relationship of jobs to commercial space. This approach addresses the different daytime (worker) and nighttime (resident) populations in Morgan Hill. The calculations use the current ratio of commercial square foot per job to forecast future commercial square footage based on job projections (i.e., jobs located
in Morgan Hill). Using employment projections (Table 3-5), 1,785,130 of additional future commercial space would be appropriate citywide. Assuming the proportion of commercial space in the Study Area compared to citywide remains stable, 434,106 net new square feet of future commercial space would be appropriate in the Study Area.
5.4 PROJECTED RESIDENTIAL GROWTH IN STUDY AREA Focusing on residential instead of commercial, this method determines how much square footage is needed for future residential space if the vacant and underutilized parcels in the Study Area develop within the allowable General Plan density (7 to 24 units/acre). At 14 units per acre, 780 residential units are projected to be located the Study Area34. Considering a range of 800 to 2,500 gross square feet per unit, total residential square footage was then subtracted from the high and low FAR capacities calculated in the first method (Section 5.1).
If development continues at a similar intensity as currently exists, (Net Stable FAR), there would not be adequate building space to accommodate residential densities at 14 units per acre. A density of 7 units per acre (398 units) could be achieved at existing development intensity assuming 1,500 gross square feet per unit
34 This calculation does not reflect any particular dwelling unit size and could reflect strictly residential projects or mixed-use projects.
Method 2 - Commercial Square Footage per Capita
215,755 s.f.
Method 3 - Commercial Square Footage per Job
434,106 s.f.
Method 4 – Projected Residential Growth in Study Area
Net Maximum FAR (High): (399,050 s.f.) - 927,086 s.f.
Net Stable FAR (Low): (1,353,142 s.f.) - (27,006 s.f.)

CITY OF MORGAN HILL DRAFT MARKET ANALYSIS | DECEMBER 2017 | 27
and only new residential development in the Study Area (no new mixed-use or commercial). However, a mix of residential at 14 units per acre and commercial space could be accommodated under the high FAR scenario (Net Maximum FAR) if average gross square foot per unit remains below 2,000 square feet.
5.5 RETAIL LEAKAGE This method employs citywide sales capture and gap (leakage) data to determine retail square footage needed to eliminate sales leakage. Square footage associated with capture or leakage is calculated using the current citywide average for dollar of revenue per retail square foot ($333.06). The percent of citywide taxable sales occurring in the Study Area is applied to calculate the square footages in the Study Area.
As previously discussed in Subsection 4.1.3 (Retail Leakage), Morgan Hill experiences leakage in all economic categories except for Transportation, and the capture in Transportation is significant enough to result in net sales capture. While this results in a finding of excess retail square footage (over retailed by 15,895 square feet), it is appropriate to look at individual economic categories for potential opportunities. For example, in the Study Area, there are sales gaps in General Retail of 17,931 square feet and Food Products (e.g., restaurants) of 5,406 square feet.
5.6 SUMMARY OF RESULTS Table 5-1 shows the compiled Commercial Capacity Assessment results.
TABLE 5-1 COMMERCIAL CAPACITY ASSESSMENT RESULTS
Commercial Capacity Assessment Results (Sq. Ft.)
Method Low High Average
1 Capacity Based on Inventory 597,058 1,551,150 1,074,104
2 Commercial Sq. Ft. per Capita 215,755 215,755 215,755
3 Commercial Sq. Ft. per Job 434,106 434,106 434,106
4 Projected Residential Growth (1,353,142) 927,086 (213,028)
5 Retail Leakage (15,895) (15,895) (15,895)
Median 215,755 434,106 215,755
Average (24,423) 622,440 299,008 Source: LWC Note: Where a method produced a single result (i.e., not low and high), that single result is identified in the low, high, and average columns.
Method 5 – Retail Leakage
(15,895 s.f.)

CITY OF MORGAN HILL DRAFT MARKET ANALYSIS | DECEMBER 2017 | 28
Based on these results, a reasonable range for future commercial space35 in the Study Area appears to be 215,000 to 440,000 square feet, with the lower end considered most realistic because of the data inputs used in Method 2 (Commercial Sq. Ft. per Capita), such as the RDCS population cap, and market conditions. However, considering demographic and market trends discussed in Sections 3 and 4, even the low end of potential commercial market demand should be considered theoretical and may shift (e.g., lower retail demand from increasing volumes of online transactions, changing medical office demand from aging population, etc.).
Based on the capacity within the Study Area (Method 1) and the theoretical commercial market demand of 215,000 square feet, approximately 385,000 to 1,300,000 square feet could be available for non-commercial uses, such as residential. Assuming between 1,500 to 2,500 gross square feet per dwelling unit, this space could accommodate between 150 to 890 residential units. If Net Maximum FAR is realized in the Study Area, 14 dwelling units per acre (780 units at 1,600 gross square feet each) could be built and accommodate up to 300,000 square feet of commercial or other uses.
Many factors should be considered when forecasting what types of commercial uses may build or occupy this future space, and such an analysis would facilitate a refinement of the estimated square foot range. Market conditions and trends suggest that economic segments experiencing leakage and that are least susceptible to online retailers are good candidates (e.g., restaurants, furniture/appliance stores, health services, etc.). Analyzing criteria demanded by these types of tenants in relation to the Study Area would be informative. While smaller main spaces may be appropriate to house certain new retail tenants, supplemental space will likely be needed for distribution activities associated with e-commerce36. Subsequently, compatibility of mixing uses (retail, distribution, residential) should be examined during the development of zoning and land use standards for the Study Area. Land use policy directs Monterey Road to be revitalized into a mixed-use corridor that encourages walking and biking, and particular commercial uses may be less compatible with this vision (e.g., automobile or large equipment sales). Lastly, obstacles to new development such as inadequate utility infrastructure, costly off-site improvements (e.g., undergrounding overhead utilities), flood zone requirements, high construction costs, and lengthy permit processes affect the types of new commercial uses and businesses that establish.
35 Commercial space includes both retail and office uses, such as medical and professional offices (see definitions in Section 1.1.2. 36 Christine Firstenberg, Senior Vice President, JLL – Retail Brokerage, telephone correspondence (August 3, 2017).

CITY OF MORGAN HILL DRAFT MARKET ANALYSIS | DECEMBER 2017 | 29
6 CONCLUSION This Report will serve as a foundation for market-based zoning recommendations to effectively implement the General Plan’s vision for a revitalized mixed-use Monterey Road Corridor. Some preliminary zoning recommendations are offered below:
• To effectively respond to fluctuating market conditions, consider a zoning approach that provides some flexibility and regulates uses less rigidly.
• Focus commercial space in strategically located nodes or corridor segments to capture theoretical demand (Section 5) and on sites that can accommodate anticipated and desired tenants space requirements (e.g., certain retailers or office types). Additional analysis will be necessary to evaluate the short and long-term retail viability of specific sites or block segments along the Corridor as discussed in Section 1.1.3.
• Develop zoning standards that facilitate the development of mixed-use corridors (e.g., build-to lines, parking located behind buildings, parking alternatives or reduction options, building frontage standards, pedestrian connectivity requirements, public realm standards, floodplain design requirements, etc.). Plan for high quality public spaces, including flexibility to allow temporary public spaces, that are vital to connecting the corridor with surrounding neighborhoods.
• Allow “Missing Middle” housing types37 that may serve as workforce housing and continue to diversify the residential product mix in Morgan Hill.
• Encourage well-designed projects that provide additional density to support revitalization of the Study Area by reducing permit review requirements and calibrating development standards (e.g., parking rates, site area requirements per unit requirements, etc.).
• Allow temporary uses and events with streamlined permitting to animate the Study Area.
The outcome from this Report and any subsequent analysis will be the successful update of the City’s Zoning Map and Zoning Code to effectuate the Mixed Use Flex General Plan Land Use Designation and preserve adequate and appropriate spaces for future commercial uses.
37 Missing Middle is a range of multi-unit or clustered housing types compatible in scale with single-family homes that help to meet the growing demand for walkable urban living (e.g., bungalow courts, fourplexes, courtyard apartments, etc.) (missingmiddlehousing.com).

CITY OF MORGAN HILL DRAFT MARKET ANALYSIS | DECEMBER 2017 | 30
7 CITED LITERATURE Becker, Gary S. "A Theory of the Allocation of Time." The Economic Journal (1965): 493-517.
Brown, Barbara; Perkins, D. Douglas; and Brown, Graham. "Place Attachment in a Revitalizing Neighborhood: Individual and Block Levels of Analysis." Journal of Environmental Psychology 23.3 (2003): 259-271.
JLL Research. “A focus on value and risk shaping investor behavior.” Investment Outlook, United States, Retail, H1 2017.
Locay, Luis. "Economic Development and the Division of Production Between Households and Markets." Journal of Political Economy 98.5, Part 1 (1990): 965-982.
The Economist. “Sorry, we’re closed – The decline of established American retailing threatens jobs” (May 13, 2017).

APPENDIX A – MARKET ANALYSIS DATA

CITY OF MORGAN HILL DRAFT MARKET ANALYSIS, APPENDIX A | DECEMBER 2017 | 1
APPENDIX A
DEMOGRAPHIC AND SOCIO-ECONOMIC DATA TABLE 1 POPULATION
Population (2000-2035)
Area 2000 2010 2015 Growth Rate 2000-2015
2035 Growth Rate 2015-2035
Morgan Hill 33,556 37,882 42,331 26.2% 58,200 37.5% Santa Clara County 1,682,585 1,781,642 1,903,209 13.1% 2,337,470 22.8% California 33,871,648 37,253,956 38,915,880 14.9% 45,521,334 17.0% Source: U.S. Decennial Census, Summary File 1, Table DP-1; California Department of Finance, February 2017; City of Morgan Hill, Residential Development Control System
TABLE 2 HOUSEHOLDS
Households (2000-2035)
Morgan Hill 2000 2010 2015 Growth Rate 2000-2015
2035 Growth Rate 2015-2035
Number of Households 10,855 12,323 13,324 22.8% 18,082 35.7% Average Household Size 3.05 3.04 3.15 3.3% 3.09 -1.9%
Santa Clara County 2000 2010 2015 Growth Rate 2000-2010
2035 Growth Rate 2015-2035
Number of Households 565,863 604,145 623,120 10.1% 776,461 24.6% Average Household Size 2.92 2.90 3.00 2.7% 2.89 -3.7% Source: U.S. Decennial Census, Summary File 1, Table QT-P11; American Community Survey 5-year Estimate, Table S1101; ABAG Projections, 2013; California Department of Finance

CITY OF MORGAN HILL DRAFT MARKET ANALYSIS, APPENDIX A | DECEMBER 2017 | 2
TABLE 3 QUANTIFIED HOUSING OBJECTIVES
Morgan Hill Quantified Housing Objectives (2015-2023) Income Category Number % of Total
Extremely Low Income 75 2.59% Very Low Income 75 2.59% Low Income 70 2.41% Moderate Income 170 5.86%
Moderate Income and Below 390 13.45% Above Moderate Income 2,510 86.55%
Total 2,900 100.00% Source: City of Morgan Hill General Plan 2015-2023 Housing Element, Table 1-12
TABLE 4 MEDIAN HOUSEHOLD INCOME
Median Household Income (2000-2015)
Area 2000 2010 2015 % Change 2000-2015
Morgan Hill $81,958 $92,771 $96,051 17.2% Santa Clara County $74,335 $86,850 $96,310 29.6%
California $47,493 $60,883 $61,818 30.2% Source: U.S. Decennial Census, Summary File 3, Table DP-3; American Community Survey 5-year Estimate, Table DP03
TABLE 5 INCOME DISTRIBUTION BY HOSEHOLD
Income Distribution by Household (2015) Units %
Total Households 13,460 100.0% Less than $10,000 403 3.0% $10,000 to $14,999 435 3.2% $15,000 to $24,999 1,066 7.9% $25,000 to $34,999 789 5.9% $35,000 to $49,999 999 7.4% $50,000 to $74,999 1,653 12.3% $75,000 to $99,999 1,741 12.9% $100,000 to $149,999 2,509 19.6% $150,000 to $199,999 1,447 10.8% $200,000 or more 2,418 18.0% Source: U.S. Census American Community Survey 5-year Estimate, Table DP03

CITY OF MORGAN HILL DRAFT MARKET ANALYSIS, APPENDIX A | DECEMBER 2017 | 3
TABLE 6 POVERTY LEVEL
Poverty Level (2015) Age Morgan Hill Santa Clara County
Overall Estimate 9.80% 9.5% Under 18 years 11.90% 10.9% 18 to 34 years 12.80% 12.1% 35 to 64 years 7.50% 7.6%
65 years and over 8.50% 8.8% Source: U.S. Census American Community Survey 5-year Estimate: Table S1701
TABLE 7 MORGAN HILL AGE DISTRIBUTION
Morgan Hill Age Distribution (2000-2015)
Age Group 2000 2010 2015
Percent Change in Age Group (2000-2015)
Population % of Total
Population % of Total
Population % of Total
Population % of Total
Under 5 years 2,729 8.1% 2,794 7.4% 2,752 6.7% 0.8% -17.2% 5 to 9 years 2,984 8.9% 3,049 8.1% 2,909 7.1% -2.5% -20.0% 10 to 14 years 2,751 8.2% 3,043 8.0% 3,131 7.7% 13.8% -6.6% 15 to 19 years 2,643 7.9% 2,926 7.7% 3,158 7.7% 19.5% -1.9% 20 to 24 years 1,677 5.0% 1,935 5.1% 2,426 5.9% 44.6% 18.8% 25 to 34 years 4,530 13.5% 4,331 11.4% 4,366 10.7% -3.6% -20.9% 35 to 44 years 6,121 18.2% 5,669 15.0% 5,999 14.7% -2.0% -19.5% 45 to 54 years 4,958 14.8% 6,258 16.5% 6,405 15.7% 29.2% 6.1% 55 to 59 years 1,625 4.8% 2,370 6.3% 2,460 6.0% 51.4% 24.3% 60 to 64 years 1,030 3.1% 1,909 5.0% 2,735 6.7% 165.5% 118.0% 65 to 74 years 1,302 3.9% 2,146 5.7% 2,735 6.7% 110.1% 72.5% 75 to 84 years 927 2.8% 959 2.5% 1,153 2.8% 24.4% 2.1% 85 years and over 279 0.8% 493 1.3% 643 1.6% 130.5% 89.2% Total 33,556 33,556 37,882 37,882 40,872 40,872 21.8% 21.8% Source: U.S. Decennial Census Summary File 1, Table QT-P1; U.S. Census American Community Survey 5-year Estimate, Table QT-P1
TABLE 8 REGIONAL AND STATE COMPARISON OF AGE DISTRIBUTION
Regional and State Comparison of Age Distribution (2010)
Age Group Morgan Hill Santa Clara County California
Under 5 years 7.4% 7.2% 6.8% 5 to 9 years 8.0% 6.6% 6.7%
10 to 14 years 8.0% 6.5% 7.0% 15 to 19 years 7.7% 6.5% 7.6%

CITY OF MORGAN HILL DRAFT MARKET ANALYSIS, APPENDIX A | DECEMBER 2017 | 4
20 to 24 years 5.1% 6.5% 7.4% 25 to 29 years 5.5% 7.6% 7.4% 30 to 34 years 6.0% 7.8% 6.9% 35 to 39 years 7.1% 8.3% 6.9% 40 to 44 years 7.8% 7.8% 7.0% 45 to 49 years 8.7% 7.8% 7.2% 50 to 54 years 7.8% 6.8% 6.9% 55 to 59 years 6.3% 5.6% 5.9% 60 to 64 years 5.0% 4.4% 4.9% 65 to 69 years 3.4% 3.2% 3.5% 70 to 74 years 2.2% 2.5% 2.6% 75 to 79 years 1.4% 2.0% 2.1% 80 to 84 years 1.1% 1.6% 1.6% 85 and over 1.3% 1.4% 1.6%
Source: U.S. Decennial Census Summary File 1, Table QT-P1
TABLE 9 REGIONAL AND STATE COMPARISON OF MEDIAN AGE
Regional and State Comparison of Median Age (2015) Morgan Hill Santa Clara County California
Median Age 37.9 36.8 35.8 Source: U.S. Census American Community Survey 5-year Estimate, Table S0101
TABLE 10 REGIONAL AND STATE COMPARISON OF RACE DISTRIBUTION
Regional and State Comparison of Race Distribution (2015)
Ethnicity Morgan Hill Santa Clara
County California
White 67.8% 48.3% 61.8% Black or African American 3.0% 2.6% 5.9%
American Indian or Alaska Native 0.6% 0.5% 0.8% Asian 9.5% 33.8% 13.7%
Native Hawaiian and Other Pacific Islander 0.5% 0.4% 0.4% Other 12.1% 9.8% 13.0%
Two or More Races 6.6% 4.7% 4.5% Total 100.0% 100.0% 100.0%
Hispanic or Latino (of any race) 33.7% 26.6% 38.4%
Source: U.S. Census American Community Survey 5-year Estimate, Table B02001

CITY OF MORGAN HILL DRAFT MARKET ANALYSIS, APPENDIX A | DECEMBER 2017 | 5
TABLE 11 EDUCATIONAL ATTAINMENT
Educational Attainment (2010-2015)
Attainment Level
Morgan Hill Santa Clara County
2010 2015 % Change or Difference 2010-2015
2010 2015 % Change or Difference 2010-2015
Population 25 years and over 23,010 26,496 15.2% 1,161,850 1,268,629 9.2% Less than 9th grade 1,703 1,400 -17.8% 85,977 89,994 4.7%
% of Total Population 25 years and over 7.4% 5.3% -2.1% 7.4% 7.1% -0.3% 9th to 12th grade, no diploma 1,680 1,550 -7.7% 73,197 75,235 2.8%
% of Total Population 25 years and over 7.3% 5.8% -1.5% 6.3% 5.9% -0.4% High school graduate (includes equivalency)
3,659 4,537 24.0% 191,705 192,414 0.4%
% of Total Population 25 years and over 15.9% 17.1% 1.2% 16.50% 15.2% -1.3% Some college, no degree 5,039 6,219 23.4% 199,838 212,282 6.3%
% of Total Population 25 years and over 21.9% 23.5% 1.6% 17.20% 16.7% -0.5% Associates degree 2,140 2,558 19.5% 85,977 90,475 5.2%
% of Total Population 25 years and over 9.3% 9.7% 0.4% 7.40% 7.1% -0.3% Bachelor’s degree 5,614 6,199 10.4% 298,595 330,869 10.8%
% of Total Population 25 years and over 24.4% 23.4% -1.0% 25.70% 26.1% 0.4% Graduate or professional degree 3,175 4,033 27.0% 227,723 277,360 21.8%
% of Total Population 25 years and over 13.8% 15.2% 1.4% 19.60% 21.9% 2.3% Source: U.S. Census American Community Survey 5-year Estimate, Table S1501
TABLE 12 EMPLOYMENT PROJECTION
Employment Projection (2010-2035)
Area 2010 2035 Annualized Growth
Rate Growth Rate 2010-2035
Morgan Hill 13,135 21,549 2% 64.0% Santa Clara County 852,855 1,115,594 1% 31.8%
Source: U.S. Census American Community Survey 5-year Estimate, Table S2301; 2010 Census OnTheMap Area Profile Analysis for all Jobs, City of Morgan Hill & Santa Clara County Notes: (1) Morgan Hill projections calculated using historic annualized job growth rate of 2%, as 2040 ABAG/MTC projection shows employment gains unrealistically low at 300 jobs from 2010 to 2040. (2) Santa Clara County projections calculated using annualized growth rate of 1.08%, which represents the County’s historic job growth from 2003 to 2014.

CITY OF MORGAN HILL DRAFT MARKET ANALYSIS, APPENDIX A | DECEMBER 2017 | 6
TABLE 13 EMPLOYMENT INFLOW/OUTFLOW
Employment Inflow/Outflow (2014) Live and employed in
Morgan Hill Live in Morgan Hill, employed
elsewhere (Outflow) Live elsewhere, employed
in Morgan Hill (Inflow) Mean travel time to work (mins)
2,473 people 12.9%1 16,734 people 87.1%1 11,173 people 81.9%2 31.73 U.S. Census American Community Survey 5-year Estimate, Table S0801; 2014 Census OnTheMap Area Profile Analysis for all Jobs: City of Morgan Hill Notes: 1. Calculated with the total employed city population as a base. 2. Calculated with the total number of jobs in Morgan Hill serving as base. 3. Travel time to work only applies to those living in Morgan Hill (i.e., residents).
FIGURE 1 UNEMPLOYMENT TRENDS
Source: U.S. Census American Community Survey 5- year Estimate, 2011-2015 and 2006-2010, Table DP-03
TABLE 14 UNEMPLOYMENT TRENDS
Unemployment Trends (2010-2015)
Place, County, State Unemployment Rate
2010 2015 Morgan Hill 7.2% 8.6%
Santa Clara County 7.8% 7.7% California 9.0% 9.9%
Source: U.S. Census American Community Survey 5-year Estimate, Table DP-03
7.2%8.6%
7.8% 7.7%9.0%
9.9%
0.00%
2.00%
4.00%
6.00%
8.00%
10.00%
12.00%
2010 2015
Unemployment Rate (2010-2015)
Morgan Hill Santa Clara County California

CITY OF MORGAN HILL DRAFT MARKET ANALYSIS, APPENDIX A | DECEMBER 2017 | 7
TABLE 15 MORGAN HILL INDUSTRY BY OCCUPATION
Morgan Hill Industry by Occupation (2015)
Industry
Occupation
Total
Mgmt., Business, Science, & Arts
Service Sales & Office
Natural Resources,
Construction, & Maint.
Production, Trans., & Material Moving
Total civilian employed population (16 years and over)
19,512 42.9% 15.9% 24.9% 8.4% 7.9%
Educational services, and health care and social assistance
3,439 67.8% 20.9% 7.9% 0.1% 3.3%
Manufacturing 2,952 54.6% 2.8% 13.1% 6.0% 23.5% Professional, scientific, and management, and administrative and waste management services
2,724 68.9% 17.7% 13.0% 0.3% 0.0%
Retail trade 2,315 12.5% 2.2% 75.2% 3.7% 6.4% Construction 1,442 19.8% 0.0% 7.4% 69.9% 2.9% Arts, entertainment, and recreation, and accommodation and food services
1,394 11.8% 65.1% 22.1% 0.4% 0.5%
Other services, except public administration
1,372 43.0% 37.3% 9.2% 8.1% 2.4%
Finance and insurance, and real estate and rental and leasing
1,232 35.0% 5.0% 57.0% 2.5% 0.5%
Transportation and warehousing, and utilities
703 28.4% 0.0% 21.6% 13.4% 36.6%
Public administration 689 22.8% 38.2% 34.8% 0.0% 4.2% Wholesale trade 592 23.8% 2.0% 40.4% 2.0% 31.8% Information 524 50.6% 1.9% 38.0% 9.5% 0.0% Agriculture, forestry, fishing and hunting, and mining
134 25.4% 0.0% 19.4% 37.3% 17.9%
Source: U.S. Census American Community Survey 5-year Estimate, Table S2403 Note: Percentages rounded by Census in table C24050 -Industry by Occupation for The Civilian Employed Population 16 Years and Over.

CITY OF MORGAN HILL DRAFT MARKET ANALYSIS, APPENDIX A | DECEMBER 2017 | 8
TABLE 16 EMPLOYMENT BY INDUSTRY
Employment by Industry (2015)
Industry Morgan Hill Santa Clara County
Share of County
LQ1 (County) Total
Jobs % of Total
Total Jobs
% of Total
Civilian employed population 16 years and over
19,512 N/A 915,619 N/A 2.1% N/A
Educational services, and health care and social assistance
3,439 17.6% 169,496 18.5% 2.0% 0.95
Manufacturing 2,952 15.1% 169,787 18.5% 1.7% 0.82 Professional, scientific, and management, and administrative and waste management services
2,724 14.0% 173,964 19.0% 1.6% 0.73
Retail trade 2,315 11.9% 86,926 9.5% 2.7% 1.25 Construction 1,442 7.4% 47,111 5.2% 3.1% 1.44 Arts, entertainment, and recreation, and accommodation and food services
1,394 7.1% 72,686 7.9% 1.9% 0.90
Other services, except public administration 1,372 7.0% 38,809 4.2% 3.5% 1.66 Finance and insurance, and real estate and rental and leasing
1,232 6.3% 43,837 4.8% 2.8% 1.32
Transportation and warehousing, and utilities
703 3.6% 25,364 2.8% 2.8% 1.30
Public administration 689 3.5% 22,220 2.4% 3.1% 1.46 Wholesale trade 592 3.0% 20,172 2.2% 2.9% 1.38 Information 524 2.7% 39,872 4.4% 1.3% 0.62 Agriculture, forestry, fishing and hunting, and mining
134 0.7% 5,375 0.6% 2.5% 1.17
Source: U.S. Census American Community Survey 5-year Estimate, Table DP-03 Note: 1. LQ = 1.0 identifies average industry concentration; LQ > 2.0 identifies a strong industry cluster; LQ < 0.5 identifies a weak industry cluster.

CITY OF MORGAN HILL DRAFT MARKET ANALYSIS, APPENDIX A | DECEMBER 2017 | 9
TABLE 17 EMPLOYMENT BY LAND USE AND INDUSTRY CLUSTER
Employment by Land Use & Industry Cluster (2010-2015)
2010 2015 % Change
(2010- 2015) Office/R&D/Industrial
Miscellaneous Manufacturing 671 1,271 89% Building/Construction/Real Estate 662 961 45% Semiconductors 597 915 53% Transportation/Distribution 1,174 878 -25% Business Services 924 836 -10% Innovation Services 663 693 5% Industrial Supplies and Services 429 596 39% Bioscience 458 555 21% Corporate Offices 545 542 -1% Electronic Component Manufacturing 421 482 14% Financial Services 374 340 -9% Software 143 106 -26% Computer and Communications Hardware Manufacturing 10 64 540%
Retail Retail/Consumer Services 3,705 4,578 24%
Visitor Visitor (Tourism) 203 163 -20%
Other Civic (Government and Education) 2,212 1,977 -11% Healthcare 589 649 10% Other 479 117 -76%
Total Jobs 14,260 15,723 10% Sources: City of Morgan Hill Economic Blueprint, Figure 6 (CAA EDD, Quarterly Census of Employment Wages; City of Morgan Hill; Joint Venture Silicon Valley Industry Cluster Definitions)

CITY OF MORGAN HILL DRAFT MARKET ANALYSIS, APPENDIX A | DECEMBER 2017 | 10
TABLE 18 EMPLOYMENT BY OCCUPATION
Employment by Occupation (2015)
Occupation Morgan Hill Santa Clara County
Share of County
LQ (County) Total
Jobs % of Total
Total Jobs
% of Total
Civilian employed population 16 years and over 19,512 N/A 915,619 N/A 2.1% N/A Management, business, science, and arts 8,380 43.0% 462,714 50.5% 1.8% 0.85
Sales and office 4,854 24.9% 179,238 19.6% 2.7% 1.27 Service 3,099 15.9% 139,416 15.2% 2.2% 1.04
Natural resources, construction, and maintenance 1,636 8.4% 59,477 6.5% 2.8% 1.29 Production, transportation, and material moving 1,543 7.9% 74,774 8.2% 2.1% 0.97
Source: U.S. Census American Community Survey 5-year Estimate, Table DP-03
TABLE 19 INCOME BY OCCUPATION
Median Income by Occupation (2015) Occupation Morgan Hill Santa Clara County California
Management, business, science, and arts $80,180 $90,616 $62,541 Management, business, and financial $91,769 $95,667 $67,480 Computer, engineering, and science $107,232 $106,685 $82,288 Health diagnosing and treating practitioners and other technical occupations $86,875 $96,563 $67,327 Education, legal, community service, arts, and media $50,886 $48,979 $45,041
Service $21,092 $20,418 $18,708 Healthcare support $25,771 $30,874 $24,740 Protective service $80,493 $35,951 $51,429 Food preparation and serving $15,660 $16,815 $15,724 Building and grounds cleaning and maintenance $27,346 $21,928 $19,061 Personal care and service $13,581 $15,674 $15,070
Sales and office $37,267 $35,037 $30,125 Sales $36,837 $33,068 $26,947 Office and administrative support $40,096 $35,691 $31,110
Natural resources, construction, and maintenance $56,123 $35,954 $30,259 Farming, fishing, and forestry $22,049 $20,844 $16,730 Construction and extraction $51,382 $32,488 $31,645 Installation, maintenance, and repair $67,143 $45,142 $39,652
Production, transportation, and material moving $31,175 $31,376 $26,832 Production $36,768 $33,794 $27,501 Transportation $31,832 $34,082 $33,111 Material moving $13,158 $21,682 $20,357
Calculated Mean $45,167 $42,680 $35,693 Source: U.S. Census American Community Survey 5-year Estimate, Table S2411

CITY OF MORGAN HILL DRAFT MARKET ANALYSIS, APPENDIX A | DECEMBER 2017 | 11
TABLE 20 INDUSTRY TRENDS
Industry Trends (2010-2015) Industry City of Morgan Hill Santa Clara County
2010 2015 % Change 2010-2015
2010 2015 % Change 2010-2015
Civilian employed population 16 years and over
17,506 19,512 11.5% 843,854 915,619 8.5%
Transportation and warehousing, and utilities
375 703 87.5% 22,914 25,364 10.7%
Retail trade 1,254 2,315 84.6% 80,847 86,926 7.5% Other services, except public administration
1,061 1,372 29.3% 35,725 38,809 8.6%
Professional, scientific, and management, and administrative and waste management services
2,231 2,724 22.1% 149,441 173,964 16.4%
Finance and insurance, and real estate and retail and leasing
1,058 1,232 16.5% 45,318 43,837 -3.3%
Information 450 524 16.4% 34,058 39,872 17.1% Construction 1,286 1,442 12.1% 48,391 47,111 -2.7% Arts, entertainment, and recreation, and accommodations, and food services
1,313 1,394 6.2% 59,604 72,686 22.0%
Wholesale trade 587 592 0.9% 21,396 20,172 -5.7% Manufacturing 3,071 2,952 -3.9% 166,851 169,787 1.8% Educational services, and health care and social assistance
3,592 3,439 -4.3% 152,679 169,496 11.0%
Public administration 902 689 -23.6% 22,150 22,220 0.3% Agriculture, forestry, fishing and hunting, and mining
326 134 -58.9% 4,480 5,375 20.0%
Source: U.S. Census American Community Survey 5-year Estimate, Table S2403 Note: Census data for industry trends unavailable for the year 2000. Earliest information available is for 2007.
TABLE 21 MORGAN HILL OCCUPATIONAL TRENDS
City of Morgan Hill Occupational Trends (2000-2015) Occupation 2000 2010 2015 % Change 2000-2015
Service 1,799 2,975 3,099 72.3% Production, transportation, and material moving 1,290 1,192 1,543 19.1%
Sales and office 4,129 4,279 4,854 17.6% Management, business, science, and arts 7,245 7,560 8,380 15.7%
Natural resources, construction, and maintenance 1,601 1,500 1,636 2.2% Source: U.S. Decennial Census, Summary File 3, Table QT-P27; American Community Survey 5-year Estimate, Table S2411

CITY OF MORGAN HILL DRAFT MARKET ANALYSIS, APPENDIX A | DECEMBER 2017 | 12
TABLE 22 MORGAN HILL MAJOR EMPLOYERS
Morgan Hill Major Employers (Feb. 2017) Major Employers Jobs
Morgan Hill Unified School District 730 Anritsu Company 477 Specialized Bicycle Components 400 Paramit Corporation 320 Lusamerica Foods 270 NxEdge 265 Safeway Inc. 257 Mission Bell Mfg., Inc. 226 Del Monaco Specialty Foods, Inc. 165 Wal-Mart Supercenter 158 Young's Market Company 146 TenCate Advanced Composites USA 142 The Home Depot 138 Covenant Care MH: Pacific Hills Manor 135 Velodyne 133 The Ford Store 130 Target Store 123 Shoe Palace Corporation 122 Gryphon Financial Group 114 Andpak 114 Sakata Seed America 105 Infineon Technologies 84 Lin Engineering 83 Exelis Inc. 82 Nob Hill Foods 75 Johnson Lumber Co. 73 Airtronics Metal Products 71 In-N-Out Burger 68 Pinnacle Manufacturing Corp 66 Hillview Convalescent 65 Source: City of Morgan Hill, https://www.morgan-hill.ca.gov/1317/Largest-Employers

CITY OF MORGAN HILL DRAFT MARKET ANALYSIS, APPENDIX A | DECEMBER 2017 | 13
TABLE 23 CONSUMER EXPENDITURES
Consumer Expenditures - San Francisco MSA
Item 1999-2000 2009-2010 2014-2015 Percent Change
1990-2015 People 2.5 2.5 2.6 4.0% Children under 18 0.6 0.6 0.6 N/A Adults 65 and older 0.3 0.2 0.3 N/A Earners 1.4 1.4 1.4 N/A Vehicles 1.8 1.8 1.8 N/A Income before taxes $64,818 N/A $90,270 N/A $101,998 N/A 57.3% Food $7,442 11.5% $7,920 8.8% $8,612 8.4% 15.7%
Food at home $4,355 6.7% $4,214 4.7% $4,114 4.0% -5.5% Food away from home $3,086 4.8% $3,706 4.1% $4,498 4.4% 45.8%
Alcoholic beverages $781 1.2% $676 0.8% $1,005 1.0% 28.7% Housing $19,682 30.4% $26,268 29.1% $26,483 26.0% 34.6%
Shelter $12,963 20.0% $19,190 21.3% $18,724 18.4% 44.4% Owned dwellings $8,266 12.8% $11,194 12.4% $8,947 8.8% 8.2% Rented dwellings $3,963 6.1% $6,573 7.3% $8,743 8.6% 120.6% Other lodging $734 1.1% $1,423 1.6% $1,034 1.0% 40.9%
Utilities, fuels, and public services
$2,226 3.4% $3,207 3.6% $3,493 3.4% 56.9%
Household operations $1,477 2.3% $1,498 1.7% $2,171 2.1% 47.0% Housekeeping supplies $595 0.9% $611 0.7% $581 0.6% -2.4% Household furnishings and equipment
$2,421 3.7% $1,762 2.0% $1,514 1.5% -37.5%
Apparel and services $3,137 4.8% $2,230 2.5% $2,366 2.3% -24.6% Transportation $9,726 15.0% $8,509 9.4% $9,911 9.7% 1.9%
Vehicle purchases (net outlay)
$4,409 6.8% $2,457 2.7% $2,677 2.6% -39.9%
Gasoline and motor oil $1,424 2.2% $1,931 2.1% $2,219 2.2% 55.8% Other vehicle expenses $2,992 4.6% $3,058 3.4% $3,411 3.3% 14.0% Public and other transportation
$900 1.4% $1,062 1.2% $1,603 1.6% 78.1%
Healthcare $2,030 3.1% $3,461 3.8% $4,685 4.6% 130.8% Entertainment $2,290 3.5% $3,116 3.5% $3,318 3.3% 44.9% Personal care products and services
$692 1.1% $782 0.9% $845 0.8% 22.1%
Reading $230 0.4% $158 0.2% $147 0.1% -36.1% Education $967 1.5% $1,754 1.9% $1,806 1.7% 86.8%

CITY OF MORGAN HILL DRAFT MARKET ANALYSIS, APPENDIX A | DECEMBER 2017 | 14
Tobacco products and smoking supplies
$222 0.3% $153 0.1% $133 0.1% -40.1%
Miscellaneous $1,023 1.6% $1,077 1.2% $780 0.8% -23.8% Cash contributions $904 1.4% $2,020 2.2% $2,262 2.2% 150.2% Personal insurance and pensions
$5,915 9.1% $9,237 10.2% $9,079 8.9% 53.5%
Source: Bureau of Labor Statistics, Expenditures by Western Metropolitan Statistical Areas

CITY OF MORGAN HILL DRAFT MARKET ANALYSIS, APPENDIX A | DECEMBER 2017 | 15
MARKET DATA
RETAIL TABLE 24 MORGAN HILL RETAIL VACANCY (2008-2017)
TABLE 25 MORGAN HILL RETAIL INVENTORY (2008-2017)
Morgan Hill Retail Inventory (2008-2017)
Year Number of Buildings Total Square Footage 2008 232 2,296,752 2009 233 2,325,114 2010 233 2,329,188 2011 233 2,334,333 2012 233 2,340,907 2013 232 2,332,657 2014 232 2,329,907 2015 230 2,319,717 2016 228 2,310,268 2017 226 2,292,597
% Change -2.7% -0.2%
Source: The Concord Group (CoStar, REIS)
TABLE 26 MORGAN HILL NNN RETAIL RENT (2008-2017)
Morgan Hill NNN Retail Rent (2008-2017) 2008 2012 2017 % Change
Rent/SF/year $20.40 $22.24 $22.80 11.8%
Rent/SF/month $1.70 $1.85 $1.90 Source: The Concord Group (CoStar, REIS)
Morgan Hill Retail Vacancy (2008-2017) 2008 2012 2017 % Change
Vacant Square Footage
120,977 235,279 111,155 -8.1%
Source: Concord Group (CoStar, REIS)

CITY OF MORGAN HILL DRAFT MARKET ANALYSIS, APPENDIX A | DECEMBER 2017 | 16
FIGURE 2 RETAIL VACANCY AND NNN RENT PER SQUARE FOOT
Source: The Concord Group (CoStar, REIS)
FIGURE 3 RETAIL VACANCY PERCENT OF TOTAL SF
Source: The Concord Group (CoStar, REIS)
$0.00$5.00$10.00$15.00$20.00$25.00$30.00$35.00$40.00
050,000
100,000150,000200,000250,000300,000350,000
2006
Q1
2006
Q4
2007
Q3
2008
Q2
2009
Q1
2009
Q4
2010
Q3
2011
Q2
2012
Q1
2012
Q4
2013
Q3
2014
Q2
2015
Q1
2015
Q4
2016
Q3
2017
Q2
Retai
l Ren
t per
Squa
re Fo
ot
Vaca
ncy i
n Squ
are F
eet
Quarter
Retail Vacancy vs. Average NNN Rent(2006-2017)
Vacant SF Direct Retail Rent per Square Foot
0%2%4%6%8%
10%12%14%
2006
Q1
2006
Q3
2007
Q1
2007
Q3
2008
Q1
2008
Q3
2009
Q1
2009
Q3
2010
Q1
2010
Q3
2011
Q1
2011
Q3
2012
Q1
2012
Q3
2013
Q1
2013
Q3
2014
Q1
2014
Q3
2015
Q1
2015
Q3
2016
Q1
2016
Q3
2017
Q1
Perce
nt Va
cant
Quarter
Retail Vacancy RateSquare Footage (2006-2017)

CITY OF MORGAN HILL DRAFT MARKET ANALYSIS, APPENDIX A | DECEMBER 2017 | 17
TABLE 27 SALES TAX PER CAPITA
Sales Tax per Capita (2012 - 2016) 2012 2013 2014 2015 2016 % Change 2012-2016 Sales Tax Revenue $6,617,777 $7,055,468 $7,102,245 $7,359,251 $7,694,571 16.3% Population 39,426 40,463 41,517 42,331 43,484 10.3% Sales Tax per Capita $167.85 $174.37 $171.07 $173.85 $176.95 5.4%
Source: MuniServices and Claritas, California Department of Finance
TABLE 28 SALES TAX PER RETAIL SQUARE FOOT
Sales Tax per Retail Square Foot (2012 - 2016) 2012 2013 2014 2015 2016 % Change 2012-2016
Sales Tax Revenue $6,617,777 $7,055,468 $7,102,245 $7,359,251 $7,694,571 16.3% Retail Sq. Ft. 2,340,907 2,332,657 2,329,907 2,319,717 2,310,268 -1.3% Sales Tax per Retail Sq. Ft. $2.83 $3.02 $3.05 $3.17 $3.33 17.8% Source: MuniServices and Claritas, The Concord Group (CoStar, REIS)
TABLE 29 SALES TAX CITYWIDE AND STUDY AREA
Sales Tax Citywide and Study Area (2012 - 2016) Sales Tax Revenue 2012 2013 2014 2015 2016 % Change 2012-2016
Citywide $6,617,777 $7,055,468 $7,102,245 $7,359,251 $7,694,571 16.3% Study Area $592,926 $627,312 $739,104 $744,858 $693,837 17.0% Study Area % of Citywide Tax Revenue 8.96% 8.89% 10.41% 10.12% 9.02% 0.6% Source: MuniServices and Claritas, The Concord Group (CoStar, REIS)
TABLE 30 SALES TAX LEAKAGE
Sales Tax Leakage (2012 - 2016) Economic Category 2012 2013 2014 2015 2016 % Change 2012-2016 General Retail ($550,043) ($511,177) ($622,992) ($617,792) ($596,346) 8.4% Food Products ($172,100) ($153,959) ($240,294) ($243,326) ($212,488) 23.5% Transportation $1,234,060 $1,416,912 $1,381,968 $1,469,408 $1,419,536 15.0% Construction ($65,472) ($39,858) ($84,133) ($73,020) ($25,973) (60.3%) Business to Business ($44,752) ($178,203) ($400,933) ($456,249) ($301,318) 573.3% Miscellaneous ($42,441) ($44,303) ($55,256) ($53,073) ($54,413) 28.2% TOTAL $359,252 $489,412 ($21,640) $25,948 $228,998 (36.3%) Source: MuniServices and Claritas

CITY OF MORGAN HILL DRAFT MARKET ANALYSIS, APPENDIX A | DECEMBER 2017 | 18
OFFICE TABLE 31 MORGAN HILL OFFICE VACANCY (2013-2017)
Gross Office Vacancy (2013-2017) 2013 2014 2015 2016 2017 % Change
Vacant Square Footage 185,842 163,047 86,369 48,725 33,537 -82.0% Source: Colliers International
TABLE 32 MORGAN HILL OFFICE ASKING RENTS (2013-2017)
Morgan Hill Office Asking Rent (2013-2017) 2013 2014 2015 2016 2017 % Change
Rent/SF/month $1.66 $1.75 $1.97 $2.09 $2.05 23.5% Source: Colliers International
TABLE 33 MORGAN HILL OFFICE INVENTORY (2013-2017)
Gross Office Inventory (2013-2017) 2013 2014 2015 2016 2017 % Change
Total Square Footage 686,249 752,452 683,136 636,545 757,379 10.4% Source: Colliers International

CITY OF MORGAN HILL DRAFT MARKET ANALYSIS, APPENDIX A | DECEMBER 2017 | 19
FIGURE 4 OFFICE VACANCIES AND ASKING RENT
Source: Colliers International
FIGURE 5 OFFICE VACANCY PERCENT OF TOTAL SF
Source: Colliers International
$0.00
$0.50
$1.00
$1.50
$2.00
$2.50
0
50,000
100,000
150,000
200,000
250,000
2013
Q3
2013
Q4
2014
Q1
2014
Q2
2014
Q3
2014
Q4
2015
Q1
2015
Q2
2015
Q3
2015
Q4
2016
Q1
2016
Q2
2016
Q3
2016
Q4
2017
Q1
Rent
per S
quar
e Fee
t
Offic
e Vac
ancy
in Sq
uare
Feet
Quarter
Office Vacancy and Asking RentSquare Footage (2013-2017)
Vacancy in Square Feet Asking Rents in SF
0%
5%
10%
15%
20%
25%
30%
2013Q3
2013Q4
2014Q1
2014Q2
2014Q3
2014Q4
2015Q1
2015Q2
2015Q3
2015Q4
2016Q1
2016Q2
2016Q3
2016Q4
2017Q1
Perc
ent V
acan
t
Office % Vacant of Total Available(2013-2017)

CITY OF MORGAN HILL DRAFT MARKET ANALYSIS, APPENDIX A | DECEMBER 2017 | 20
RESIDENTIAL TABLE 35 MEDIAN HOME SALES PRICE CHANGE
Median Single-Family Home Sales Price Change (2011-2017)
2011 2012 2013 2014 2015 2016 2017
(Jan - Apr) Difference
(2011 -2017) % Change
(2011 - 2017) City of Morgan Hill
$534,308 $546,025 $646,767 $705,700 $759,208 $812,050 $840,875 $306,567 57.4% Santa Clara County
$575,358 $605,242 $715,917 $794,217 $898,775 $972,958 $1,004,000 $428,642 74.5% State of California
$314,650 $315,450 $369,108 $412,975 $439,367 $470,575 $493,200 $178,550 56.8% Source: Zillow; Median Home Value – Zillow Home Value Index; ZHVI Single-Family Homes Time Series and ZHVI Condo/Co-op Time Series ($). Median home sale prices are estimated by Zillow per Zillow Home Value Index Methodology, which involves modelling that results in minimal statistical error between estimated sales prices and actual sales prices.
TABLE 36 MEDIAN HOME RENTAL PRICE CHANGE
Median Home Rental Price Change (2011-2017)
2011 2012 2013 2014 2015 2016 2017 (Jan – Apr)
Difference (2011 - 2017)
% Change (2011 - 2017)
City of Morgan Hill $2,462 $2,490 $2,547 $2,740 $3,163 $3,361 $3,379 $917 37.3%
County of Santa Clara $2,434 $2,511 $2,636 $2,917 $3,342 $3,512 $3,474 $1,040 42.7%
State of California $1,911 $1,902 $1,951 $2,040 $2,222 $2,344 $2,408 $498 26.0%
Source: Zillow; Median Home Value – Zillow Home Value Index; ZHVI Single-Family Homes Time Series and ZHVI Condo/Co-op Time Series ($). Median home sale prices are estimated by Zillow per Zillow Home Value Index Methodology, which involves modelling that results in minimal statistical error between estimated sales prices and actual sales prices.
TABLE 37 OCCUPIED HOUSING UNITS BY TENURE
Occupied Housing Units By Tenure (2015)
City of Morgan Hill Santa Clara County State of California
Estimate % Estimate % Estimate % Total 13,460 N/A N/A 12,717,801 N/A N/A
Owner Occupied 9,544 70.9% 56.8% 6,909,176 54.3% 56.8% Renter Occupied 3,916 29.1% 43.2% 5,808,625 45.7% 43.2%
Source: U.S. Census American Community Survey 5-Year Estimate, Table DP04

CITY OF MORGAN HILL DRAFT MARKET ANALYSIS, APPENDIX A | DECEMBER 2017 | 21
TABLE 38 RESIDENTIAL VACANCY RATE BY JURISDICTION (2015)
Residential Vacancy Rate (2015) City of Morgan Hill Santa Clara County State of California
Occupied 13,460 621,463 12,717,801 Vacant 339 24,727 1,127,989 Total 13,799 646,190 13,845,790
Percent Vacant 2.5% 3.8% 8.2% Source: U.S. Census American Community Survey 5-Year Estimate, Table DP04
FIGURE 6 RESIDENTIAL VACANCY RATE BY JURISDICTION (2015)
Source: U.S. Census American Community Survey 5-Year Estimate, Table DP04
TABLE 39 VACANT HOUSING UNITS
Vacant Housing Units (2015)
City of Morgan Hill Santa Clara County State of California Estimate % Estimate % Estimate %
Total: 339 N/A 24,727 N/A 1,127,989 N/A For rent 43 12.7% 7,549 30.5% 248,662 22.0% Rented, not occupied 0 0.0% 2,460 10.0% 56,694 5.0% For sale only 143 42.2% 2,382 9.6% 100,608 8.9% Sold, not occupied 0 0.0% 1,496 6.1% 51,716 4.6% For seasonal, recreational, or occasional use
84 24.8% 3,460 14.0% 367,882 32.6%
For migrant workers 0 0.0% 0 0.0% 2,934 0.3% Other vacant 69 20.4% 7,380 29.9% 299,493 26.6% Source: U.S. Census American Community Survey 5-Year Estimate, Table B25004
8.1%
3.8%
2.5%
State of California Santa Clara County City of Morgan Hill
Residential Vacancy Rate by Jurisdiction(2015)

CITY OF MORGAN HILL DRAFT MARKET ANALYSIS, APPENDIX A | DECEMBER 2017 | 22
TABLE 40 MORGAN HILL HOUSING STOCK BY TYPE OF UNIT
Morgan Hill Housing Stock by Unit Type (2000-2015) Type of Unit 2010 % 2013 % 2015 % 1 unit, detached 7,874 61.5% 8,067 61.4% 8,684 62.9% 1 unit, attached 1,866 14.6% 1,873 14.3% 1,797 13.0% 2 to 4 units 794 6.2% 1,148 8.7% 1,167 8.5% 5+ units 1,039 8.1% 1,104 8.4% 1,272 9.2% Mobile homes, RV, Van, Etc. 1,222 9.6% 941 7.2% 879 6.4% Total 12,795 100.0% 13,133 100.0% 13,799 100.0% Source: U.S. Census American Community Survey 5-Year Estimate, Table DP04
TABLE 41 MORGAN HILL HOUSING STOCK BY AGE
City of Morgan Hill Age of Housing Stock by Year Built (2015) Year Structure Built Number of Units Percent
Built 2014 or later 92 0.7% Built 2010 to 2013 324 2.4% Built 2000 to 2009 2,042 14.8% Built 1990 to 1999 3,031 22.0% Built 1980 to 1989 3,014 21.8% Built 1970 to 1979 3,625 26.3% Built 1960 to 1969 713 5.2% Built 1950 to 1959 391 2.8% Built 1940 to 1949 291 2.1%
Built 1939 or earlier 276 2.0% Total 13,799 100.0%
Source: U.S. Census American Community Survey 5-Year Estimate, Table B25126

CITY OF MORGAN HILL DRAFT MARKET ANALYSIS, APPENDIX A | DECEMBER 2017 | 23
BUILDING PERMITS FIGURE 7 MORGAN HILL BUILDING PERMITS ISSUED
Source: City of Morgan Hill Permit Summary by Type; LWC
FIGURE 8 MORGAN HILL BUILDING PERMITS ISSUED - VALUATION
Source: City of Morgan Hill Permit Summary by Type; LWC
0
500
1,000
1,500
2,000
2,500
2012 2013 2014 2015 2016
Building Permits Issued(2012 - 2016)
Residential Permits Non-Residential Permits
$0
$20,000,000
$40,000,000
$60,000,000
$80,000,000
$100,000,000
$120,000,000
$140,000,000
$160,000,000
2012 2013 2014 2015 2016
Building Permit Issued Valuation(2012 - 2016)
Residential Permit Valuation Non-Residential Permit Valuation

CITY OF MORGAN HILL DRAFT MARKET ANALYSIS, APPENDIX A | DECEMBER 2017 | 24
TABLE 42 MORGAN HILL BUILDING PERMITS ISSUED AND VALUATIONS
Building Permits Issued & Valuation (2012-2016)
2012 2013 2014 2015 2016 Percent Change
(2012-2016) Residential Permits 1,005 1,684 1,697 1,921 1,687 67.9% Residential Permit Valuation $101,711,797 $102,202,155 $115,089,989 $146,292,407 $110,731,679 8.9% Non-Residential Permits 235 304 316 388 380 61.7% Non-Residential Permit Valuation
$13,830,273 $10,314,167 $127,788,457 $38,348,932 $29,851,433 115.8%
Source: City of Morgan Hill Permit Summary by Type; LWC

APPENDIX B – STUDY AREA INVENTORY
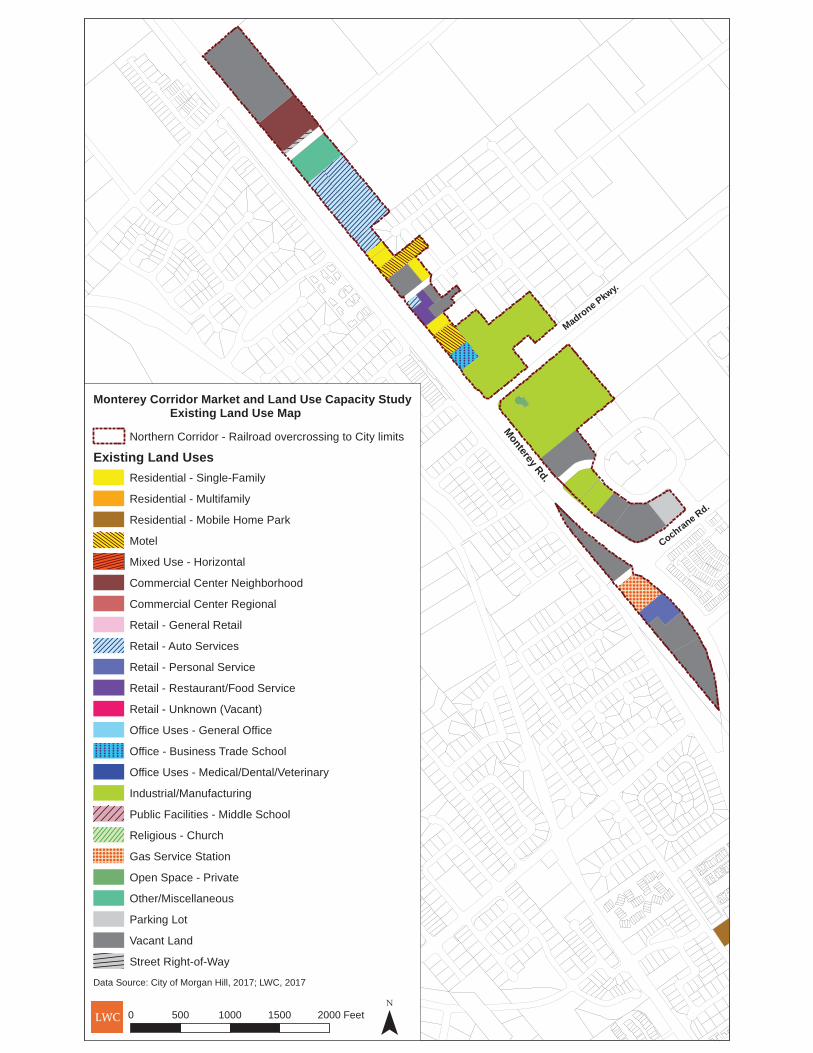
Monterey Corridor Market and Land Use Capacity Study Existing Land Use Map
Northern Corridor - Railroad overcrossing to City limits
Existing Land UsesResidential - Single-Family
Residential - Multifamily
Residential - Mobile Home Park
Motel
Mixed Use - Horizontal
Commercial Center Neighborhood
Commercial Center Regional
Retail - General Retail
Retail - Auto Services
Retail - Personal Service
Retail - Restaurant/Food Service
Retail - Unknown (Vacant)
Office Uses - General Office
Office - Business Trade School
Office Uses - Medical/Dental/Veterinary
Industrial/Manufacturing
Public Facilities - Middle School
Religious - Church
Gas Service Station
Open Space - Private
Other/Miscellaneous
Parking Lot
Vacant Land
Street Right-of-Way
Data Source: City of Morgan Hill, 2017; LWC, 2017
0 500 1000 1500 2000 Feet ¯
Cochrane Rd.
Madrone Pkwy.
Monterey Rd.
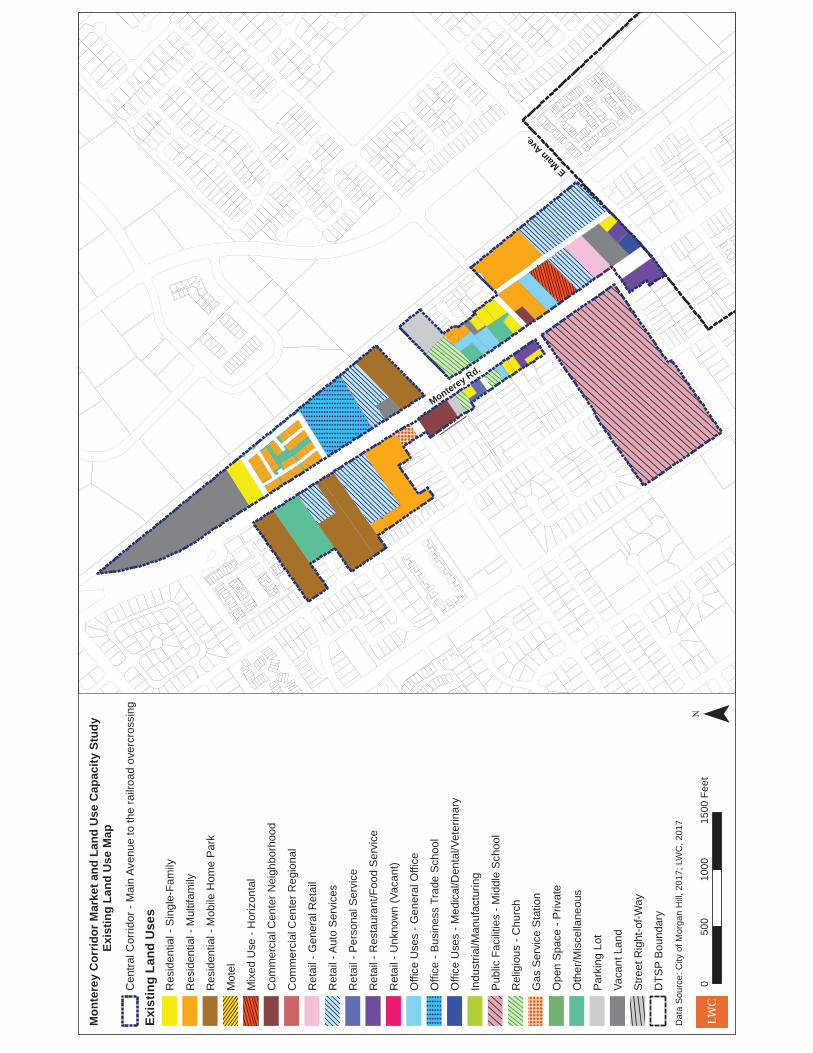
Mon
tere
y C
orrid
or M
arke
t and
Lan
d U
se C
apac
ity S
tudy
E
xist
ing
Land
Use
Map
Cen
tral C
orrid
or -
Mai
n Av
enue
to th
e ra
ilroa
d ov
ercr
ossi
ng
Exis
ting
Land
Use
sR
esid
entia
l - S
ingl
e-Fa
mily
Res
iden
tial -
Mul
tifam
ily
Res
iden
tial -
Mob
ile H
ome
Park
Mot
el
Mix
ed U
se -
Hor
izon
tal
Com
mer
cial
Cen
ter N
eigh
borh
ood
Com
mer
cial
Cen
ter R
egio
nal
Ret
ail -
Gen
eral
Ret
ail
Ret
ail -
Aut
o S
ervi
ces
Ret
ail -
Per
sona
l Ser
vice
Ret
ail -
Res
taur
ant/F
ood
Ser
vice
Ret
ail -
Unk
now
n (V
acan
t)
Offi
ce U
ses
- Gen
eral
Offi
ce
Offi
ce -
Busi
ness
Tra
de S
choo
l
Offi
ce U
ses
- Med
ical
/Den
tal/V
eter
inar
y
Indu
stria
l/Man
ufac
turin
g
Publ
ic F
acili
ties
- Mid
dle
Scho
ol
Rel
igio
us -
Chu
rch
Gas
Ser
vice
Sta
tion
Ope
n Sp
ace
- Priv
ate
Oth
er/M
isce
llane
ous
Park
ing
Lot
Vaca
nt L
and
Stre
et R
ight
-of-W
ay
DTS
P B
ound
ary
Dat
a S
ourc
e: C
ity o
f Mor
gan
Hill,
201
7; L
WC
, 201
7
¯
E Main
Ave.
Monterey Rd.
050
010
0015
00Fe
et

Monterey Corridor Market and Land Use Capacity Study Existing Land Use Map
Southern Corridor - Dunne Avenue to Butterfield Boulevard
Existing Land UsesResidential - Single-Family
Residential - Multifamily
Residential - Mobile Home Park
Motel
Mixed Use - Horizontal
Commercial Center Neighborhood
Commercial Center Regional
Retail - General Retail
Retail - Auto Services
Retail - Personal Service
Retail - Restaurant/Food Service
Retail - Unknown (Vacant)
Office Uses - General Office
Office - Business Trade School
Office Uses - Medical/Dental/Veterinary
Industrial/Manufacturing
Public Facilities - Middle School
Religious - Church
Gas Service Station
Open Space - Private
Other/Miscellaneous
Parking Lot
Vacant Land
Street Right-of-Way
DTSP Boundary
Data Source: City of Morgan Hill, 2017; LWC, 2017
¯Tennant Ave.
Wat
sonv
ille R
d.
E Dunne Ave.
Monterey Rd.
0 500 1000 1500 Feet

Southern Corridor
Central Corridor
Northern Corridor
Monterey Corridor Market and Land Use Capacity StudyUnderutilized Parcels Map
Northern Corridor - Railroad overcrossing to City limits
Central Corridor - Main Avenue to the railroad overcrossing
Southern Corridor - Dunne Avenue to Butterfield Boulevard
Vacant Parcels
Low Improvement/Land Value (Imp/Land Value Ratio < 1)
Using less than 20% of Floor Area Ratio (FAR)
Underutilization Combined (Low Improvement/Land Value & Usingless than 20% of FAR)
DTSP Boundary
Data Source: City of Morgan Hill, 2017; LWC, 2017
0 2000 4000 6000 Feet ¯

APPENDIX C – COMMERCIAL CAPACITY ASSESSMENT CALCULATION SHEETS

FIN
AL D
RAFT
Dec
embe
r 13
, 201
7
Mon
tere
y Co
rrid
or M
arke
t & L
and
Use
Cap
acity
Stu
dy
Prep
ared
by
Lisa
Wis
e Co
nsul
ting,
Inc.
COM
MER
CIA
L CA
PACI
TY A
NA
LYSI
S
SUM
MA
RY
Low
High
Aver
age
1 1Ca
pacit
y Bas
ed on
Inve
ntor
y59
7,058
1,5
51,15
0 1,0
74,10
4
22Co
mm
ercia
l Sq.
Ft. p
er Ca
pita
215,7
55
215,7
55
215,7
55
33Co
mm
ercia
l Sq.
Ft. p
er Jo
b43
4,106
43
4,106
43
4,106
44
Proje
cted
Resid
entia
l Gro
wth
(1,35
3,142
)92
7,086
(2
13,02
8)55
Retai
l Lea
kage
(15,8
95)
(15,8
95)
(15,8
95)
2215,7
55
434,1
06
215,7
55
((24,4
23)
622,4
40
299,0
08
Not
es1.
Whe
re a
met
hod
prod
uced
a s
ingl
e re
sult
(i.e.
, not
low
and
hig
h), t
hat s
ingl
e re
sult
is id
entif
ied
in th
e lo
w, h
igh,
and
ave
rage
col
umns
.
A Aver
age
City
of M
orga
n H
ill
Met
hod
Com
mer
cial C
apac
ity A
sses
smen
t Res
ults
(Sq.
Ft.)
MMed
ian
Page
1 o
f 10

FIN
AL D
RAFT
Dec
embe
r 13
, 201
7
Mon
tere
y Co
rrid
or M
arke
t & L
and
Use
Cap
acity
Stu
dy
Prep
ared
by
Lisa
Wis
e Co
nsul
ting,
Inc.
COM
MER
CIA
L CA
PACI
TY A
NA
LYSI
S
MET
HO
D 1
- CO
MM
ERCI
AL
CAPA
CITY
BA
SED
ON
EXI
STIN
G L
AN
D U
SE IN
VEN
TORY
Resu
lts
1,55
1,15
0
597,
058
Not
es1.
See
Net
Max
imum
FAR
and
Net
Sta
ble
FAR
tota
ls in
tabl
e be
low
.
Sour
ces:
City
of M
orga
n H
ill; L
WC
Ass
umpt
ions
Parc
els
with
bui
ldin
gs c
urre
ntly
occ
upyi
ng le
ss th
an 2
0% o
f the
max
imum
dev
elop
able
Flo
or A
rea
Ratio
(FAR
) will
red
evel
op.
Publ
ic in
stitu
tiona
l use
s (e
.g.,
scho
ols,
com
mun
ity c
ente
rs),
resi
dent
ial u
ses,
priv
ate
open
spa
ce, c
hurc
hes,
par
cels
ded
icat
ed to
pub
lic u
tiliti
es, a
nd h
isto
ric s
truc
ture
s w
ill n
ot r
edev
elop
and
are
not
incl
uded
.
Entit
led
proj
ects
will
dev
elop
as
entit
led.
Max
imum
FAR
cap
acity
is 0
.5 F
AR fo
r co
mm
erci
al/m
ixed
-use
par
cels
and
0.6
FAR
for
indu
stria
l par
cels
. FAR
ref
lect
s cu
rren
t dev
elop
men
t sta
ndar
ds. A
ret
ail (
non-
offic
e co
mm
erci
al) p
roje
ct w
ould
typi
cally
hav
e a
low
er F
AR, a
roun
d 0.
25, m
ostly
due
to in
crea
sed
park
ing.
Stab
le F
AR is
the
med
ian
FAR
for
Stud
y Ar
ea p
arce
ls th
at a
re n
ot v
acan
t (0.
19 F
AR).
APN
Add
ress
Exis
ting
Lan
d U
se
Busi
ness
Nam
e(s)
Parc
el
Acr
esPa
rcel
Sq
Ft.
Build
ing
Sq F
t.FA
R (B
uild
ing
Sq
Ft/P
arce
l Sq
Ft)
Max
imum
D
evel
opab
le F
AR
Uti
lizat
ion
- Pe
rcen
tage
of
Max
imum
Dev
elop
able
FA
R
Und
er C
apac
ity
(Y/N
: Usi
ng <
20%
of
allo
wed
FA
R pe
r G
P D
esig
nati
on)
Max
imum
FA
R Ca
paci
ty (S
q Ft
) N
et M
axim
um F
AR
(Sq
Ft)
Stab
le F
AR
Capa
city
(S
q Ft
)N
et S
tabl
e FA
R (S
q Ft
)G
ener
al P
lan
Des
igna
tion
Zoni
ng
7263
4018
520
COCH
RAN
E CL
Park
ing
Lot
1.18
5140
10
0.00
0.60
0%Ye
s30
,841
30,8
419,
766
9,76
6In
dust
rial
ML
7263
4017
480
COCH
RAN
E CL
Vaca
nt L
and
2.26
9844
60
0.00
0.60
0%Ye
s59
,068
59,0
6818
,705
18,7
05In
dust
rial
ML
7263
4016
440
COCH
RAN
E CL
Vaca
nt L
and
1.08
4704
50
0.00
0.60
0%Ye
s28
,227
28,2
278,
939
8,93
9In
dust
rial
ML
7263
4013
320
COCH
RAN
E CL
Vaca
nt L
and
2.1
9147
60
0.00
0.60
0%Ye
s54
,886
54,8
8617
,380
17,3
80In
dust
rial
ML
8170
2025
SAN
PED
RO A
VVa
cant
Lan
d1.
4261
855
00.
000.
500%
Yes
30,9
2830
,928
11,7
5211
,752
Mix
ed U
se F
lex
(7-2
4 du
/ac)
CL-R
7263
6007
ROSE
AV
Vaca
nt L
and
0.55
2395
80
0.00
0.50
0%Ye
s11
,979
11,9
794,
552
4,55
2M
ixed
Use
Fle
x (7
-24
du/a
c)/R
esid
entia
l Det
ache
d M
ediu
m (u
p to
7 d
u/ac
)CG
& R
-172
5010
18M
ON
TERE
Y RD
Vaca
nt L
and
5.83
2539
550
0.00
0.50
0%Ye
s12
6,97
812
6,97
848
,251
48,2
51M
ixed
Use
Fle
x (7
-24
du/a
c)PU
D76
4130
20M
ON
TERE
Y RD
Park
ing
Lot
0.01
436
00.
000.
500%
Yes
218
218
8383
Mix
ed U
se F
lex
(7-2
4 du
/ac)
CL-R
7641
0006
MO
NTE
REY
RDVa
cant
Lan
d0.
2510
890
00.
000.
500%
Yes
5,44
55,
445
2,06
92,
069
Com
mer
cial
CG72
6240
19M
ON
TERE
Y RD
Park
ing
Lot
1.04
4530
20
0.00
0.50
0%Ye
s22
,651
22,6
518,
607
8,60
7M
ixed
Use
Fle
x (7
-24
du/a
c)CL
-R81
7010
18M
ON
TERE
Y RD
Vaca
nt L
and
0.2
8712
00.
000.
500%
Yes
4,35
64,
356
1,65
51,
655
Mix
ed U
seCC
-R76
7180
46M
ON
TERE
Y RD
Vaca
nt L
and
1.1
4791
60
0.00
0.50
0%Ye
s23
,958
23,9
589,
104
9,10
4M
ixed
Use
Fle
x (7
-24
du/a
c)CL
-R76
7170
47CO
SMO
AV
Vaca
nt L
and
2.03
8842
70
0.00
0.50
0%Ye
s44
,214
44,2
1416
,801
16,8
01M
ixed
Use
Fle
x (7
-24
du/a
c)CL
-R
7262
3018
95 E
MAI
N A
VRe
tail
- Aut
o Se
rvic
esA
Tool
She
d Eq
uipm
ent R
enta
ls2.
5210
9771
3000
0.03
0.50
5%Ye
s54
,886
51,8
8620
,856
20,8
56M
ixed
Use
CC-R
7263
6010
30 P
EEBL
ES A
VVa
cant
Lan
d0.
2410
454
00.
000.
500%
Yes
5,22
75,
227
1,98
61,
986
Mix
ed U
se F
lex
(7-2
4 du
/ac)
R172
6410
6525
PEE
BLES
AV
Vaca
nt L
and
0.9
3920
40
0.00
0.50
0%Ye
s19
,602
19,6
027,
449
7,44
9M
ixed
Use
Fle
x (7
-24
du/a
c)CS
7250
1032
1950
0 M
ON
TERE
Y RD
Com
mer
cial
Cen
ter
Nei
ghbo
rhoo
d2.
5411
0642
5780
0.05
0.50
10%
Yes
55,3
2149
,541
21,0
2221
,022
Mix
ed U
se F
lex
(7-2
4 du
/ac)
CS72
6420
0319
400
MO
NTE
REY
RDRe
tail
- Aut
o Se
rvic
esN
A -
Scra
pyar
d0.
3113
504
625
0.05
0.50
9%Ye
s6,
752
6,12
72,
566
2,56
6M
ixed
Use
Fle
x (7
-24
du/a
c)CS
7264
2002
1938
0 M
ON
TERE
Y RD
Reta
il - A
uto
Serv
ices
Fam
ily R
V0.
7432
234
360
0.01
0.50
2%Ye
s16
,117
15,7
576,
124
6,12
4M
ixed
Use
Fle
x (7
-24
du/a
c)CS
7264
2001
1938
0 M
ON
TERE
Y RD
Reta
il - A
uto
Serv
ices
Fam
ily R
V3.
9317
1191
6000
0.04
0.50
7%Ye
s85
,596
79,5
9632
,526
32,5
26M
ixed
Use
Fle
x (7
-24
du/a
c)CS
7641
0008
1862
5 M
ON
TERE
Y RD
Vaca
nt L
and
1.25
5445
00
0.00
0.50
0%Ye
s27
,225
27,2
2510
,346
10,3
46Co
mm
erci
alCG
7641
0010
1860
5 M
ON
TERE
Y RD
Gas
Ser
vice
Sta
tion
1.29
5619
236
000.
060.
5013
%Ye
s28
,096
24,4
9610
,676
10,6
76Co
mm
erci
alPU
D76
4100
1518
565
MO
NTE
REY
RDVa
cant
Lan
d1.
669
696
00.
000.
500%
Yes
34,8
4834
,848
13,2
4213
,242
Com
mer
cial
PUD
7641
0013
1854
5 M
ON
TERE
Y RD
Vaca
nt L
and
2.22
9670
30
0.00
0.50
0%Ye
s48
,352
48,3
5218
,374
18,3
74Co
mm
erci
alPU
D72
6250
0618
110
MO
NTE
REY
RDVa
cant
Lan
d6.
6929
1416
00.
000.
500%
Yes
145,
708
145,
708
55,3
6955
,369
Mix
ed U
se F
lex
(7-2
4 du
/ac)
ML
7641
2006
1796
5 M
ON
TERE
Y RD
Reta
il - A
uto
Serv
ices
No
nam
e1.
5467
082
1056
0.02
0.50
3%Ye
s33
,541
32,4
8512
,746
12,7
46M
ixed
Use
Fle
x (7
-24
du/a
c)C-
G
7262
5002
1792
0 M
ON
TERE
Y RD
Reta
il - A
uto
Serv
ices
Pron
to A
uto
Repa
ir1.
5567
518
3516
0.05
0.50
10%
Yes
33,7
5930
,243
12,8
2812
,828
Mix
ed U
se F
lex
(7-2
4 du
/ac)
CL-R
7641
2020
1790
5 M
ON
TERE
Y RD
Gas
Ser
vice
Sta
tion
0.4
1742
412
450.
070.
5014
%Ye
s8,
712
7,46
73,
311
3,31
0Co
mm
erci
alC-
G76
4130
2217
845
MO
NTE
REY
RDPa
rkin
g Lo
t 0.
1982
760
0.00
0.50
0%Ye
s4,
138
4,13
81,
572
1,57
2M
ixed
Use
Fle
x (7
-24
du/a
c)CL
-R
7262
4049
1777
0 M
ON
TERE
Y RD
Off
ice
Use
s - G
ener
al O
ffic
e
1) P
rosp
ecto
rs P
rope
rty
Man
agem
ent
2) B
rade
ley
A Le
ach,
Acc
ount
ant
3) V
acan
t - u
p fo
r le
ase
0.72
3136
326
480.
080.
5017
%Ye
s15
,682
13,0
345,
959
5,95
9M
ixed
Use
Fle
x (7
-24
du/a
c)CL
-R w
ith P
D
Ove
rlay
7262
4009
1775
5 M
C LA
UG
HLI
N C
TVa
cant
Lan
d0.
1565
340
0.00
0.50
0%Ye
s3,
267
3,26
71,
241
1,24
1M
ixed
Use
Fle
x (7
-24
du/a
c)R-
272
6230
1217
680
MO
NTE
REY
RDO
ffic
e U
ses
- Gen
eral
Off
ice
Farm
ers
Insu
ranc
e0.
6829
621
2156
0.07
0.50
15%
Yes
14,8
1112
,655
5,62
85,
628
Mix
ed U
seCC
-R72
6230
0817
620
MO
NTE
REY
RDVa
cant
Lan
d1.
0143
996
00.
000.
500%
Yes
21,9
9821
,998
8,35
98,
359
Mix
ed U
seCC
-R76
7090
0916
995
MO
NTE
REY
RDG
as S
ervi
ce S
tatio
nG
olde
n Ea
gle
Gas
0.37
1611
710
720.
070.
5013
%Ye
s8,
059
6,98
73,
062
3,06
2M
ixed
Use
PUD
8170
1051
1694
0 M
ON
TERE
Y RD
Reta
il - A
uto
Serv
ices
Tow
n &
Cou
ntry
Car
Was
h0.
4820
909
912
0.04
0.50
9%Ye
s10
,455
9,54
33,
973
3,97
3M
ixed
Use
CC-R
7671
0002
1683
5 M
ON
TERE
Y RD
Reta
il - U
nkno
wn
(Vac
ant)
0.58
2526
515
340.
060.
5012
%Ye
s12
,633
11,0
994,
800
4,80
0M
ixed
Use
C-G
7671
0003
1682
5 M
ON
TERE
Y RD
Reta
il - G
ener
al R
etai
lSu
n Sh
ine
Bicy
cles
1.45
6316
219
600.
030.
506%
Yes
31,5
8129
,621
12,0
0112
,001
Mix
ed U
seC-
G
8170
1002
1672
0 M
ON
TERE
Y RD
Gas
Ser
vice
Sta
tion
0.48
2090
982
20.
040.
508%
Yes
10,4
559,
633
3,97
33,
973
Mix
ed U
se F
lex
(7-2
4 du
/ac)
CL-R
8170
2001
1668
5 CH
URC
H S
TRe
tail
- Gen
eral
Ret
ail
Sew
Bee
It Q
uilti
ng0.
939
204
2342
0.06
0.50
12%
Yes
19,6
0217
,260
7,44
97,
449
Mix
ed U
se F
lex
(7-2
4 du
/ac)
R-2
7671
7046
1659
5 M
ON
TERE
Y RD
Vaca
nt L
and
2.93
1276
310
0.00
0.50
0%Ye
s63
,816
63,8
1624
,250
24,2
50M
ixed
Use
Fle
x (7
-24
du/a
c)CL
-R
8170
2008
1648
5 CH
URC
H S
TIn
dust
rial
/Man
ufac
turi
ng0.
626
136
1800
0.07
0.50
14%
Yes
13,0
6811
,268
4,96
64,
966
Com
mer
cial
C-S
8170
2018
1638
0 M
ON
TERE
Y RD
Vaca
nt L
and
0.09
3920
00.
000.
500%
Yes
1,96
01,
960
745
745
Mix
ed U
se F
lex
(7-2
4 du
/ac)
CL-R
8170
2016
1634
0 M
ON
TERE
Y RD
Reta
il - G
ener
al R
etai
lSo
urce
wis
e0.
417
424
680
0.04
0.50
8%Ye
s8,
712
8,03
23,
311
3,31
1M
ixed
Use
Fle
x (7
-24
du/a
c)CL
-R
7671
8055
1629
5 M
ON
TERE
Y RD
Reta
il - P
erso
nal S
ervi
ce
1) M
athn
asiu
m2)
The
Dai
ly M
etho
d 3)
déj
à vu
Sal
on1.
5768
389
3800
0.06
0.50
11%
Yes
34,1
9530
,395
12,9
9412
,994
Mix
ed U
se F
lex
(7-2
4 du
/ac)
CL-R
8170
3010
1629
0 M
ON
TERE
Y RD
Reta
il - R
esta
uran
t/Fo
od S
ervi
ceLa
Cos
ta0.
4318
731
1150
0.06
0.50
12%
Yes
9,36
68,
216
3,55
93,
559
Mix
ed U
se F
lex
(7-2
4 du
/ac)
CL-R
7671
8020
1622
5 M
ON
TERE
Y RD
Reta
il - A
uto
Serv
ices
Mor
gan
Hil
Car
Was
h &
Gift
Sho
p1.
1349
223
2160
0.04
0.50
9%Ye
s24
,612
22,4
529,
352
9,35
2M
ixed
Use
Fle
x (7
-24
du/a
c)CL
-R
7671
8035
1616
5 M
ON
TERE
Y RD
Off
ice
Use
s - G
ener
al O
ffic
e
From
Yel
p:1)
Mic
roAr
tisty
2) C
alifo
rnia
Pre
nata
l Im
agin
g3)
Pur
e Sk
in &
Bod
y4)
All
Abou
t Sen
iors
Car
e5)
Dun
ne In
sura
nce
0.46
2003
80
0.00
0.50
0%Ye
s10
,019
10,0
193,
807
3,80
7M
ixed
Use
Fle
x (7
-24
du/a
c)CL
-R
7263
6059
1110
MO
NTE
REY
RDIn
dust
rial
/Man
ufac
turi
ngCa
lifor
nia
Tow
& S
alva
ge7.
5232
7571
00.
000.
500%
Yes
163,
786
163,
786
62,2
3862
,238
Resi
dent
ial A
ttac
hed
Low
(6-1
6 du
/ac)
/Mix
ed U
se
Flex
(7-2
4 du
/ac)
CG &
R-1
8170
3005
1619
0 M
ON
TERE
Y RD
Reta
il - A
uto
Serv
ices
Ente
rpri
se R
enta
l Car
0.36
1568
267
80.
040.
509%
Yes
7,84
17,
163
2,98
02,
980
Resi
dent
ial A
ttac
hed
Low
(6-1
6 du
/ac)
/ Mix
ed U
se
Flex
(7-2
4 du
/ac)
Cl-R
& R
-281
7360
33
Vaca
nt L
and
0.68
2962
10
0.00
0.50
0%Ye
s14
,811
14,8
115,
628
5,62
8M
ixed
Use
PUD
7675
4011
Va
cant
Lan
d0.
8838
333
00.
000.
500%
Yes
19,1
6719
,167
7,28
37,
283
Com
mer
cial
C-G
7675
4010
Va
cant
Lan
d1.
3157
064
00.
000.
500%
Yes
28,5
3228
,532
10,8
4210
,842
Com
mer
cial
C-G
TOTA
L:1,
600,
046
1,55
1,15
059
7,06
059
7,05
8
Net
Max
imum
FAR
Cap
acity
(Sq.
Ft.)
1
Net
Sta
ble
FAR
Capa
city
(Sq.
Ft.)
1
City
of M
orga
n H
ill
Page
2 o
f 10

FIN
AL D
RAFT
Dec
embe
r 13
, 201
7
City
of M
orga
n H
ill
Mon
tere
y Co
rrid
or M
arke
t & L
and
Use
Cap
acity
Stu
dy
Prep
ared
by
Lisa
Wis
e Co
nsul
ting,
Inc.
COM
MER
CIA
L CA
PACI
TY A
NA
LYSI
S
MET
HO
D 2
- CO
MM
ERCI
AL
SQU
ARE
FO
OTA
GE
PER
CAPI
TA
Com
mer
cial
Spa
ce T
ype 1
Com
mer
cial
Spa
ce (S
q. F
t.)
Per
Capi
ta (2
016)
Proj
ecte
d Po
pula
tion
Incr
ease
(2
016
to 2
035)
Proj
ecte
d Co
mm
erci
al S
pace
Gro
wth
Ci
tyw
ide
(Sq.
Ft.)
Proj
ecte
d Co
mm
erci
al S
pace
Gro
wth
in
the
Stud
y Ar
ea (S
q. F
t.)
Reta
il43
632,
788
160,
959
Off
ice
1521
5,42
254
,796
Tota
l58
848,
210
215,
755
Aver
age
Tota
l Ret
ail S
q. F
t. Ci
tyw
ide
(201
6)2,
310,
268
Aver
age
Tota
l Off
ice
Sq. F
t. Ci
tyw
ide
(201
6)63
6,54
5
Tota
l City
wid
e Co
mm
erci
al S
q. F
t. (2
016)
2,94
6,81
3
Tota
l Com
mer
cial
Sq.
Ft.
in th
e St
udy
Area
274
9,56
5
Perc
ent o
f City
wid
e Co
mm
erci
al S
q. F
t. Lo
cate
d in
the
Stud
y Ar
ea25
.44%
Nat
iona
l ave
rage
ret
ail S
q. F
t. pe
r ca
pita
343
Mor
gan
Hill
Pop
ulat
ion
(201
6)43
,484
Reta
il Sq
. Ft.
in M
orga
n H
ill b
ased
on
natio
nal a
vera
ge (2
016)
1,86
9,81
2
Tota
l City
wid
e Co
mm
erci
al S
q. F
t. ba
sed
on n
atio
nal a
vera
ge (2
016)
2,50
6,35
7
Resi
dent
ial D
evel
opm
ent C
ontr
ol S
yste
m 2
035
Popu
latio
n Ca
p58
,200
Not
es
1. "R
etai
l" an
d "o
ffic
e" a
re d
efin
ed in
the
Mon
tere
y Co
rrid
or M
arke
t Ana
lysi
s (D
ecem
ber
2017
).
2. S
ee to
tal B
uild
ing
Sq. F
t. in
tabl
e be
low
.
3. T
he n
atio
nal a
vera
ge is
app
roxi
mat
ely
46 s
q. ft
. of r
etai
l spa
ce p
er c
apita
, with
mos
t met
ropo
litan
are
as h
avin
g be
twee
n 40
to 5
5 sq
. ft.
per
capi
ta.
Sour
ces:
The
Con
cord
Gro
up (C
oSta
r, R
eis)
; City
of M
orga
n H
ill, C
ollie
rs In
tern
atio
nal;
Calif
orni
a D
epar
tmen
t of F
inan
ce; J
LL; L
WC
Ass
umpt
ions
Non
-com
mer
cial
par
cels
are
not
con
side
red
in th
e to
tal c
omm
erci
al b
uild
ing
squa
re fo
ot c
alcu
latio
n (i.
e., i
ndus
tria
l/man
ufac
turi
ng; o
pen
spac
e; s
tree
t rig
ht-o
f-way
s; p
resc
hool
s an
d m
iddl
e-sc
hool
s; p
ublic
util
ities
; chu
rche
s; r
esid
entia
l use
s).
The
prop
ortio
n of
exi
stin
g co
mm
erci
al s
quar
e fo
otag
e in
the
Stud
y Ar
ea to
city
wid
e co
mm
erci
al s
quar
e fo
otag
e w
ill r
emai
n st
able
.
Com
mer
cial
spa
ce p
er c
apita
will
rem
ain
stab
le.
2035
pop
ulat
ion
will
rea
ch th
e Re
side
ntia
l Dev
elop
men
t Con
trol
Sys
tem
cap
of 5
8,20
0.
APN
Addr
ess
Exist
ing
Land
Use
Bu
sines
s Nam
e(s)
Parc
el S
q Ft
.Bu
ildin
g Sq
Ft.
7672
3009
1558
5 M
ONTE
REY
RDOf
fice
Uses
- M
edica
l/Den
tal/V
eter
inar
yPa
mel
a St
uart
MD
3964
071
0076
7230
3015
335
MON
TERE
Y RD
Vaca
nt La
nd35
3272
076
7230
1615
335
MON
TERE
Y RD
Vaca
nt La
nd0
072
6340
1852
0 CO
CHRA
NE C
LPa
rkin
g Lo
t51
401
072
6340
1748
0 CO
CHRA
NE C
LVa
cant
Land
9844
60
7263
4016
440
COCH
RANE
CL
Vaca
nt La
nd47
045
072
6340
1332
0 CO
CHRA
NE C
LVa
cant
Land
9147
60
8170
2025
SAN
PEDR
O AV
Vaca
nt La
nd61
855
072
6360
07RO
SE A
VVa
cant
Land
2395
80
7250
1018
MON
TERE
Y RD
Vaca
nt La
nd25
3955
076
4130
20M
ONTE
REY
RDPa
rkin
g Lo
t 43
60
7641
0006
MON
TERE
Y RD
Vaca
nt La
nd10
890
072
6240
19M
ONTE
REY
RDPa
rkin
g Lo
t45
302
081
7010
18M
ONTE
REY
RDVa
cant
Land
8712
076
7180
46M
ONTE
REY
RDVa
cant
Land
4791
60
Resu
lts
14,7
16
Page
3 o
f 10

FIN
AL D
RAFT
Dec
embe
r 13
, 201
7
7671
8036
1616
5 M
ONTE
REY
RDCo
mm
ercia
l Cen
ter N
eigh
borh
ood
1) M
icroA
rtist
y2)
Cal
iforn
ia P
rena
tal I
mag
ing
3) P
ure
Skin
& B
ody
4) A
ll Ab
out S
enio
rs C
are
5) D
unne
Insu
ranc
e18
731
1039
072
6230
19E
MAI
N AV
Reta
il - A
uto
Serv
ices
00
7671
7047
COSM
O AV
Vaca
nt La
nd88
427
072
6230
1895
E M
AIN
AVRe
tail
- Aut
o Se
rvice
sA
Tool
She
d Eq
uipm
ent R
enta
ls10
9771
3000
7262
3006
35 E
MAI
N AV
Reta
il - R
esta
uran
t/Fo
od S
ervi
ceLa
Nin
a Pe
rdid
a10
890
1467
7263
6010
30 P
EEBL
ES A
VVa
cant
Land
1045
40
7264
1065
25 P
EEBL
ES A
VVa
cant
Land
3920
40
7250
1032
1950
0 M
ONTE
REY
RDCo
mm
ercia
l Cen
ter N
eigh
borh
ood
1106
4257
8072
6420
1019
490
MON
TERE
Y RD
Othe
r - C
onst
ruct
ion
Yard
& O
ffice
Irish
Com
mun
icat
ion
Co80
586
1800
472
6420
0319
400
MON
TERE
Y RD
Reta
il - A
uto
Serv
ices
NA -
Scr
apya
rd13
504
625
7264
2002
1938
0 M
ONTE
REY
RDRe
tail
- Aut
o Se
rvice
sFa
mily
RV
3223
436
072
6420
0119
380
MON
TERE
Y RD
Reta
il - A
uto
Serv
ices
Fam
ily R
V17
1191
6000
7264
1021
1928
0 M
ONTE
REY
RDRe
tail
- Aut
o Se
rvice
sSu
perio
r Aut
omot
ive
& R
adia
tor S
ervi
ces
2395
812
532
7264
1018
1924
0 M
ONTE
REY
RDM
otel
Budg
et In
n M
otel
4748
085
8772
6360
0919
190
MON
TERE
Y RD
Reta
il - A
uto
Serv
ices
Ponz
ini's
Com
mun
ity G
arag
e69
7030
8872
6360
0819
080
MON
TERE
Y RD
Reta
il - R
esta
uran
t/Fo
od S
ervi
ce1)
Bar
ber S
hop
1786
067
0072
6360
0319
010
MON
TERE
Y RD
Mot
elRa
ncho
Mot
el36
590
5118
7263
6002
1898
0 M
ONTE
REY
RDOf
fice
- Bus
ines
s Tra
de S
choo
lM
MS
Beha
vior
al D
ay P
rogr
am
2831
440
6076
4100
0818
625
MON
TERE
Y RD
Vaca
nt La
nd54
450
076
4100
1018
605
MON
TERE
Y RD
Gas S
ervi
ce S
tatio
n56
192
3600
7641
0014
1858
5 M
ONTE
REY
RDRe
tail
- Per
sona
l Ser
vice
1) A
rtist
ry sa
lon
2) B
lank
salo
n3)
Sta
rbuc
ks46
174
6740
7641
0015
1856
5 M
ONTE
REY
RDVa
cant
Land
6969
60
7641
0013
1854
5 M
ONTE
REY
RDVa
cant
Land
9670
30
7262
5006
1811
0 M
ONTE
REY
RDVa
cant
Land
2914
160
7641
2024
1802
5 M
ONTE
REY
RDOt
her -
Sto
rage
Stor
ageM
art
8973
449
397
7641
2003
1799
5 M
ONTE
REY
RDRe
tail
- Aut
o Se
rvice
sRo
cci's
Aut
o Bo
dy37
462
5330
7641
2006
1796
5 M
ONTE
REY
RDRe
tail
- Aut
o Se
rvice
sNo
nam
e67
082
1056
7262
5003
1796
0 M
ONTE
REY
RDOf
fice
- Bus
ines
s Tra
de S
choo
lM
orga
n Hi
ll Co
mm
unity
Adu
lt Sc
hool
1489
7515
1242
7641
2007
1794
5A M
ONTE
REY
RDRe
tail
- Aut
o Se
rvice
s1)
A-1
Muf
fler &
Bra
ke2)
Str
ong
on M
ower
s & S
mal
l Eng
ines
4486
774
7572
6250
0217
920
MON
TERE
Y RD
Reta
il - A
uto
Serv
ices
Pron
to A
uto
Repa
ir67
518
3516
7262
5001
1791
0 M
ONTE
REY
RDVa
cant
Land
1481
015
9276
4120
2017
905
MON
TERE
Y RD
Gas S
ervi
ce S
tatio
n17
424
1245
7641
3075
1786
5 M
ONTE
REY
RDCo
mm
ercia
l Cen
ter N
eigh
borh
ood
From
Goo
gle
and
Yelp
:1)
J &
R S
igns
& F
ashi
ons
2) S
uper
El G
rulle
nse
3) La
Sol
edad
Bak
ery
4) Jo
es B
arbe
r Sho
p5)
Sun
light
Land
rom
at6)
La C
hoza
Taq
ueria
3571
995
5076
4130
2217
845
MON
TERE
Y RD
Park
ing
Lot
8276
076
4130
4517
775
MON
TERE
Y RD
Offic
e Us
es -
Gene
ral O
ffice
Real
Est
ate
Solu
tions
5227
1379
7262
4049
1777
0 M
ONTE
REY
RDOf
fice
Uses
- Ge
nera
l Offi
ce
1) P
rosp
ecto
rs P
rope
rty
Man
agem
ent
2) B
rade
ley
A Le
ach,
Acc
ount
ant
3) V
acan
t - u
p fo
r lea
se31
363
2648
7262
4015
1776
0 M
ONTE
REY
RDOf
fice
Uses
- Ge
nera
l Offi
ce
1) V
acan
t - u
p fo
r lea
se2)
The
Pau
chon
Res
earc
h Fo
unda
tion
3) H
ealth
y Co
ncep
ts4)
Mou
se M
ania
Cut
s5)
Vac
ant -
up
for l
ease
6) B
eau
J. Ja
cob
Atto
rney
at L
aw14
810
6765
7262
4009
1775
5 M
C LA
UGHL
IN C
TVa
cant
Land
6534
076
4130
4817
735
MON
TERE
Y RD
Reta
il - R
esta
uran
t/Fo
od S
ervi
ceDa
ri De
lite
Driv
e-In
1524
624
56
7262
3014
1769
8 M
ONTE
REY
RDCo
mm
ercia
l Cen
ter N
eigh
borh
ood
1) D
onut
s N T
hing
s2)
Fam
ily H
air C
are
1306
824
5072
6230
1217
680
MON
TERE
Y RD
Offic
e Us
es -
Gene
ral O
ffice
Farm
ers I
nsur
ance
2962
121
56
7262
3011
1766
0 M
ONTE
REY
RDM
ixed
Use
- Hor
izont
al1)
Mel
ton
Accu
punc
ture
2) B
ody
Lab
4399
676
0472
6230
1017
650
MON
TERE
Y RD
Reta
il - A
uto
Serv
ices
NAPA
Aut
o Pa
rts
4399
684
0072
6230
0917
630
MON
TERE
Y RD
Reta
il - G
ener
al R
etai
lGo
odw
ill43
996
6250
7262
3008
1762
0 M
ONTE
REY
RDVa
cant
Land
4399
60
7641
6029
1760
5 M
ONTE
REY
RDRe
tail
- Res
taur
ant/
Food
Ser
vice
El T
oro
Brew
pub
2787
872
57
7262
3007
1760
0 M
ONTE
REY
RDOf
fice
Uses
- M
edica
l/Den
tal/V
eter
inar
y
1) R
icar
do P
erez
, MD,
APC
2) Jo
seph
R. F
errit
o, A
UD, A
ssoc
iate
s3)
Van
Keu
len
& V
an K
eule
n,14
810
5849
7262
4014
1772
0 M
ONTE
REY
RDFu
nera
l Hom
e/M
ortu
ary
Mor
tuar
y18
731
7658
7670
9019
1699
9 M
ONTE
REY
RDCo
mm
ercia
l Cen
ter R
egio
nal
1) V
aria
nt C
omics
& C
olle
ctib
les
2) B
orsh
ay H
air &
Bea
uty
3) B
linds
4 D
esig
n4)
Can
ine
Conc
epts
5) La
s Del
icias
Ice
Crea
m &
Bon
tani
tas
6) M
r. Sc
issor
s7)
Cha
ks P
lace
8) S
uzan
ne's
Hair
Salo
n &
Bou
tique
9) T
acos
Jalis
cienc
e H.
10) M
ain
Stre
et B
arbe
r Sho
p30
056
8720
7670
9009
1699
5 M
ONTE
REY
RDGa
s Ser
vice
Sta
tion
Gold
en E
agle
Gas
1611
710
72
Page
4 o
f 10

FIN
AL D
RAFT
Dec
embe
r 13
, 201
7
8170
1059
1699
0 M
ONTE
REY
RDCo
mm
ercia
l Cen
ter N
eigh
borh
ood
1) Ju
ng H
ee H
ong
Dent
ist2)
Mor
gan
Hill
Disc
ount
Cle
aner
s3)
Via
Mia
Pizz
a20
473
4696
7670
9018
1698
5 M
ONTE
REY
RDCo
mm
ercia
l Cen
ter R
egio
nal
1) A
K R
ahim
Inc
5706
413
470
7670
9017
1697
5 M
ONTE
REY
RDCo
mm
ercia
l Cen
ter R
egio
nal
Dolla
r Tre
e64
033
1830
0
7670
9016
1696
5 M
ONTE
REY
RDCo
mm
ercia
l Cen
ter R
egio
nal
1) P
ho M
orga
n Hi
ll2)
Gol
den
Chin
a Re
stau
rant
3) T
ailo
r's D
esig
n47
480
1092
076
7090
1516
959
MON
TERE
Y RD
Reta
il - G
ener
al R
etai
lCa
lifor
nia
Spor
ts C
ente
r27
007
5775
7670
9010
1695
5 M
ONTE
REY
RDCo
mm
ercia
l Cen
ter R
egio
nal
Ross
Dre
ss fo
r Les
s84
506
2320
081
7010
5116
940
MON
TERE
Y RD
Reta
il - A
uto
Serv
ices
Tow
n &
Cou
ntry
Car
Was
h20
909
912
8170
1050
1694
0 M
ONTE
REY
RDRe
tail
- Res
taur
ant/
Food
Ser
vice
Taco
Bel
l15
682
1580
7670
9011
1693
5 M
ONTE
REY
RDPa
rkin
g Lo
t69
7030
0076
7090
1216
905
MON
TERE
Y RD
Com
mer
cial C
ente
r Nei
ghbo
rhoo
d1)
Ted
dy B
ear L
aund
rom
at
9148
4376
8170
1060
1686
0 M
ONTE
REY
RDRe
tail
- Aut
o Se
rvice
s23
522
7350
7671
0001
1684
5 M
ONTE
REY
RDRe
tail
- Gen
eral
Ret
ail
Adva
nced
Whe
els
2134
435
5876
7100
0216
835
MON
TERE
Y RD
Reta
il - U
nkno
wn
(Vac
ant)
2526
515
3476
7100
0316
825
MON
TERE
Y RD
Reta
il - G
ener
al R
etai
lSu
n Sh
ine
Bicy
cles
6316
219
6076
7100
0416
815
MON
TERE
Y RD
Vaca
nt La
nd87
1290
076
7100
4416
795
MON
TERE
Y RD
Reta
il - G
ener
al R
etai
lVa
cant
- up
for l
ease
2613
658
2481
7010
0716
790
MON
TERE
Y RD
Vaca
nt La
nd52
2711
7681
7010
0616
780
MON
TERE
Y RD
Vaca
nt La
nd52
2793
681
7010
0516
770
MON
TERE
Y RD
Vaca
nt La
nd56
6310
1581
7010
0416
760
MON
TERE
Y RD
Reta
il - R
esta
uran
t/Fo
od S
ervi
ceTa
quer
ia12
632
1597
8170
1003
1674
0 M
ONTE
REY
STRe
tail
- Res
taur
ant/
Food
Ser
vice
Roun
d Ta
ble
Pizz
a12
197
1924
8170
1002
1672
0 M
ONTE
REY
RDGa
s Ser
vice
Sta
tion
2090
982
2
7671
7051
1671
5 M
ONTE
REY
RDCo
mm
ercia
l Cen
ter N
eigh
borh
ood
1) P
aul's
Liqu
or a
nd M
arke
t2)
Jesu
s Mex
ican
4051
154
0081
7020
0116
685
CHUR
CH S
TRe
tail
- Gen
eral
Ret
ail
Sew
Bee
It Q
uilti
ng39
204
2342
7671
7046
1659
5 M
ONTE
REY
RDVa
cant
Land
1276
310
8170
2009
1645
5 CH
URCH
ST
Reta
il - A
uto
Serv
ices
Japa
n/Eu
rope
/USA
Aut
o Se
rvice
& R
epai
r50
094
1069
8
8170
2037
1645
0 M
ONTE
REY
RDOf
fice
Uses
- Ge
nera
l Offi
ce
1) M
orga
n Hi
ll Fe
dera
tion
of T
each
ers
2) N
or C
al B
usin
ess &
Tax
Ser
vice
s3)
Wax
ing
at T
iffan
y's &
Spa
Ser
vice
s4)
Rum
our H
as it
Sal
on5)
NL H
air S
tudi
o6)
Hai
r Des
igns
By
Debo
rah
At P
erfe
ctio
ns S
alon
2003
853
96
8170
2036
1643
0 M
ONTE
REY
RDOf
fice
Uses
- Ge
nera
l Offi
ce
1) C
ox S
eife
rt T
otal
Con
stru
ctio
n M
anag
emen
t, In
c.2)
New
Hai
r Stu
dio
3) C
arlo
s Boo
kkee
ping
Ser
vice
s21
780
4712
7671
8032
1642
5 M
ONTE
REY
RDOf
fice
Uses
- M
edica
l/Den
tal/V
eter
inar
yCo
smo
Dent
al O
ffice
5009
485
26
7671
8002
1641
5 M
ONTE
REY
RDCo
mm
ercia
l Cen
ter N
eigh
borh
ood
1) M
etro
PCS
2) V
acan
t - u
p fo
r lea
se3)
Pan
ader
ia O
rtiz
1393
939
3381
7020
2016
410B
MON
TERE
Y RD
Reta
il - R
esta
uran
t/Fo
od S
ervi
ceLa
s Isa
bela
s23
958
2726
8170
2051
1639
0 M
ONTE
REY
STRe
tail
- Res
taur
ant/
Food
Ser
vice
Coun
try
Stor
e30
928
3500
8170
2018
1638
0 M
ONTE
REY
RDVa
cant
Land
3920
0
7671
8031
1637
5 M
ONTE
REY
RDCo
mm
ercia
l Cen
ter R
egio
nal
1) T
rilog
y Sa
lon
2) C
olle
ctiv
e St
reng
th &
Fitn
ess
3) A
ctiv
e M
ind
& B
ody
Vita
lity
Cent
er LL
C4)
Bod
y Ca
re M
essa
ge T
hera
py5)
The
Prin
t Sho
p6)
She
ar C
olor
& D
esig
n7)
Mor
gan
Hilll
TV
Serv
ice &
Rep
air
8) S
abai
Bea
uty
& W
elln
ess B
ody
& S
kin
Care
9) T
imel
ess B
arbe
rs10
) Kum
on
11) N
atur
al N
ails
by Li
sa12
) Com
mun
ity C
hiro
prac
tic13
) NV
Salo
n Se
rvice
s14
) Cal
iforn
ia D
etai
l Cen
ter
7100
321
500
8170
2017
1636
0 M
ONTE
REY
RDOf
fice
Uses
- M
edica
l/Den
tal/V
eter
inar
y
1) H
ealth
ther
apeu
tic M
essa
ge2)
Lerm
a Ch
iropr
actic
3) D
iscov
er C
hiro
prac
tic60
548
2137
581
7020
1616
340
MON
TERE
Y RD
Reta
il - G
ener
al R
etai
lSo
urce
wise
1742
468
081
7020
1516
330
MON
TERE
Y RD
Reta
il - P
erso
nal S
ervi
ceBe
auty
Sal
on14
810
1512
8170
2014
1631
0C M
ONTE
REY
RDM
otel
Para
dise
Mot
el33
977
3828
7671
8055
1629
5 M
ONTE
REY
RDRe
tail
- Per
sona
l Ser
vice
1) M
athn
asiu
m2)
The
Dai
ly M
etho
d 3)
déj
à vu
Sal
on68
389
3800
8170
3010
1629
0 M
ONTE
REY
RDRe
tail
- Res
taur
ant/
Food
Ser
vice
La C
osta
1873
111
5076
7180
1916
275
MON
TERE
Y RD
Com
mer
cial C
ente
r Nei
ghbo
rhoo
d1)
Mar
tin G
roup
Lend
ing
3964
016
190
8170
3009
1627
0 M
ONTE
REY
RDOf
fice
Uses
- M
edica
l/Den
tal/V
eter
inar
y1)
MPE
T M
edica
l Gro
up2)
Aw
elln
ess A
cupu
nctu
re14
375
3575
8170
3008
1625
0 M
ONTE
REY
RDM
otel
Mor
gan
Hill
Inn
1742
484
7681
7030
5016
230
MON
TERE
Y AV
Offic
e Us
es -
Gene
ral O
ffice
1350
447
1776
7180
2016
225
MON
TERE
Y RD
Reta
il - A
uto
Serv
ices
Mor
gan
Hil C
ar W
ash
& G
ift S
hop
4922
321
60
8170
3006
1621
0 M
ONTE
REY
RDM
otel
Holid
ay H
otel
3136
365
68
Page
5 o
f 10

FIN
AL D
RAFT
Dec
embe
r 13
, 201
7
7671
8027
1619
5 M
ONTE
REY
RDCo
mm
ercia
l Cen
ter N
eigh
borh
ood
1) V
acan
t - u
p fo
r lea
se2)
STO
RE IL
LEGI
BLE
VIA
GOOG
LE S
TREE
TVIE
W3)
PBN
I Bou
tique
4) A
ngel
ic N
ail S
pa5)
Fac
ial R
etre
at
6) E
xten
d Yo
ur Im
age
Salo
n45
738
9932
8170
3004
Va
cant
Land
00
7671
8039
1617
5 M
ONTE
REY
RDOf
fice
Uses
- Ge
nera
l Offi
ce
1) G
aupo
Bah
ia2)
Esq
uive
l Pro
pert
ies,
Inc.
3) V
alue
Bus
ines
s Pro
duct
s13
504
6006
7671
8035
1616
5 M
ONTE
REY
RDOf
fice
Uses
- Ge
nera
l Offi
ce
From
Yel
p:1)
Micr
oArt
isty
2) C
alifo
rnia
Pre
nata
l Im
agin
g3)
Pur
e Sk
in &
Bod
y4)
All
Abou
t Sen
iors
Car
e5)
Dun
ne In
sura
nce
2003
80
8170
3002
1616
0 M
ONTE
REY
RDOf
fice
Uses
- M
edica
l/Den
tal/V
eter
inar
ySa
nta
Ther
esa
Dent
al11
326
2580
8170
3054
1615
0 M
ONTE
REY
RDOf
fice
Uses
- M
edica
l/Den
tal/V
eter
inar
yM
orga
n Hi
ll An
imal
Hos
pita
l17
424
3296
8170
4044
1612
0 M
ONTE
REY
RDOf
fice
Uses
- M
edica
l/Den
tal/V
eter
inar
yDa
vid
Tran
DDS
, Tog
uyen
To
OD15
682
2458
8170
4045
1612
0 M
ONTE
REY
RDRe
tail
- Aut
o Se
rvice
sSo
uth
Coun
ty M
uffle
r13
504
2720
7671
8040
1610
5 M
ONTE
REY
RDCo
mm
ercia
l Cen
ter R
egio
nal
1) C
lean
ers
2) M
orga
n Hi
ll Go
ld &
Silv
er3)
Pek
ing
Rest
aura
nt C
hine
se F
ood
4) H
&R
Bloc
k5)
Pita
Pet
6) 4
-Eve
r Nai
ls7)
Litt
le C
aesa
rs8)
Bea
uty
Supp
ly9)
Maj
estic
Hai
r Sal
on10
) Kor
ean
BBQ
& D
UBU
7535
916
509
8170
4057
1606
0 M
ONTE
REY
RDCo
mm
ercia
l Cen
ter N
eigh
borh
ood
1) O
reile
y Au
to P
arts
2) S
alon
Cen
tric
4617
499
0076
7210
2716
025
MON
TERE
Y RD
Reta
il - A
uto
Serv
ices
Auto
Zon
e31
363
7000
8170
4058
1600
0 M
ONTE
REY
RDCo
mm
ercia
l Cen
ter N
eigh
borh
ood
1) R
ite A
id2)
GNC
9234
716
600
7641
3025
15 E
L TOR
O AV
Reta
il - P
erso
nal S
ervi
ceSa
lon
Invi
dia
7841
2509
7670
9008
Va
cant
Land
00
8170
1001
Va
cant
Land
00
8170
3005
1619
0 M
ONTE
REY
RDRe
tail
- Aut
o Se
rvice
sEn
terp
rise
Rent
al C
ar15
682
678
7671
7040
NARe
tail
- Gen
eral
Ret
ail
26,8
8642
0076
7170
39NA
Com
mer
cial C
ente
r Nei
ghbo
rhoo
dM
r. Ho
ngs C
hine
se R
esta
uran
t29
,307
3,37
081
7360
33
Vaca
nt La
nd29
621
076
7540
11
Vaca
nt La
nd38
333
076
7540
10
Vaca
nt La
nd57
064
076
7180
54
Vaca
nt La
nd0
081
7030
03NA
Vaca
nt La
nd0
0TO
TAL:
749,
565
Page
6 o
f 10

FINA
L DRA
FTDe
cem
ber 1
3, 2
017
City
of M
orga
n H
ill
Mon
tere
y Co
rrid
or M
arke
t & L
and
Use
Cap
acity
Stu
dy
Prep
ared
by
Lisa
Wis
e Co
nsul
ting,
Inc.
COM
MER
CIAL
CAP
ACIT
Y AN
ALYS
IS
MET
HO
D 3
- CO
MM
ERCI
AL S
QU
ARE
FOO
TAG
E PE
R JO
B
Com
mer
cial
Spa
ce (S
q. F
t.) P
er
Job
(201
4) 1
Proj
ecte
d Jo
b In
crea
se
(201
4 to
203
5)Pr
ojec
ted
Com
mer
cial
Spa
ce G
row
th
City
wid
e (S
q. F
t.)Pr
ojec
ted
Com
mer
cial
Spa
ce G
row
th in
th
e St
udy
Area
(Sq.
Ft.)
225.
887,
903
1,78
5,13
043
4,10
6
Aver
age
Tota
l Ret
ail S
q. F
t. Ci
tyw
ide
(201
4)2,
329,
907
Aver
age
Tota
l Off
ice
Sq. F
t. Ci
tyw
ide
(201
4)75
2,45
2
Tota
l City
wid
e Co
mm
erci
al S
q. F
t. (2
014)
3,08
2,35
9
Tota
l Com
mer
cial
Sq.
Ft.
in th
e St
udy
Area
274
9,56
5
Perc
ent o
f City
wid
e Co
mm
erci
al S
q. F
t. Lo
cate
d in
the
Stud
y Ar
ea24
.32%
Mor
gan
Hill
Num
ber
of Jo
bs (2
014)
13,6
46
Mor
gan
Hill
Em
ploy
men
t Pro
ject
ion
(203
5)21
,549
Not
es1.
201
4 em
ploy
men
t dat
a w
as u
sed
from
Cen
sus
On
The
Map
; mor
e re
cent
yea
rs (2
015
and
2016
) are
not
yet
ava
ilabl
e.
2. S
ee to
tal B
uild
ing
Sq. F
t. fr
om M
etho
d 2
- Com
mer
cial
Squ
are
Foot
age
Per
Capi
ta.
Sour
ces:
The
Con
cord
Gro
up (C
oSta
r, Re
is);
City
of M
orga
n H
ill, C
ollie
rs In
tern
atio
nal;
Cens
us O
n Th
e M
ap; L
WC
Assu
mpt
ions
The
prop
ortio
n of
exi
stin
g co
mm
erci
al s
quar
e fo
otag
e in
the
Stud
y Ar
ea to
city
wid
e co
mm
erci
al s
quar
e fo
otag
e w
ill r
emai
n st
able
.
Com
mer
cial
spa
ce p
er jo
b w
ill r
emai
n st
able
.
The
num
ber
of M
orga
n H
ill jo
bs w
ill fo
llow
the
hist
oric
ann
ualiz
ed g
row
th r
ate
of 2
%.
Resu
lts
Page
7 o
f 10

FIN
AL D
RAFT
Dec
embe
r 13
, 201
7
Mon
tere
y Co
rrid
or M
arke
t & L
and
Use
Cap
acity
Stu
dy
Prep
ared
by
Lisa
Wis
e Co
nsul
ting,
Inc.
COM
MER
CIA
L CA
PACI
TY A
NA
LYSI
S
MET
HO
D 4
- PR
OJE
CTED
RES
IDEN
TIA
L G
ROW
TH IN
STU
DY
ARE
A
Proj
ecte
d N
umbe
r
of R
esid
entia
l Uni
ts 1
Aver
age
Gro
ss S
q. F
t. pe
r Re
side
ntia
l Uni
tTo
tal R
esid
entia
l Sq.
Ft.
Net
Max
imum
FAR
Ca
paci
ty L
ess
Tota
l Res
iden
tial
Sq. F
t.
Net
Sta
ble
FAR
Capa
city
Les
s To
tal R
esid
entia
l Sq
. Ft.
800
624,
064
927,
086
-27,
006
1,00
078
0,08
077
1,07
0-1
83,0
221,
200
936,
096
615,
054
-339
,038
1,40
01,
092,
112
459,
038
-495
,054
1,50
01,
170,
120
381,
030
-573
,062
1,60
01,
248,
128
303,
022
-651
,070
1,80
01,
404,
144
147,
006
-807
,086
2,00
01,
560,
160
-9,0
10-9
63,1
022,
200
1,71
6,17
6-1
65,0
26-1
,119
,118
2,40
01,
872,
192
-321
,042
-1,2
75,1
342,
500
1,95
0,20
0-3
99,0
50-1
,353
,142
14 1,55
1,15
059
7,05
8
Not
es
1. S
ee T
otal
Par
cel A
cres
in ta
ble
belo
w.
2. T
he M
ixed
Use
Fle
x D
esig
natio
n is
allo
wed
a d
ensi
ty o
f 7 to
24
units
per
acr
e.
3. N
et a
nd M
axim
um F
AR C
apac
ity c
alcu
late
d in
Met
hod
1 - C
apac
ity B
ased
on
Exis
ting
Land
Use
Inve
ntor
y.
Sour
ces:
City
of M
orga
n H
ill; L
WC
Ass
umpt
ions
Parc
els
with
a C
omm
erci
al o
r In
dust
rial G
ener
al P
lan
Land
Use
Des
igna
tion
will
not
dev
elop
with
res
iden
tial.
Resi
dent
ial u
ses
will
dev
elop
at 1
4 un
its p
er a
cre,
as
assu
med
in th
e 20
40 G
ener
al P
lan
EIR.
Resi
dent
ial u
nit s
izes
are
incl
usiv
e of
gar
ages
and
com
mon
are
a.
APN
Add
ress
Exis
ting
Lan
d U
se
Busi
ness
Nam
e(s)
Parc
el A
cres
Gen
eral
Pla
n D
esig
nati
onZo
ning
8170
2025
SAN
PED
RO A
VVa
cant
Lan
d1.
42M
ixed
Use
Fle
x (7
-24
du/a
c)CL
-R
7263
6007
ROSE
AV
Vaca
nt L
and
0.55
Mix
ed U
se F
lex
(7-2
4 du
/ac)
/Res
iden
tial D
etac
hed
Med
ium
(up
to 7
du/
ac)
CG &
R-1
7250
1018
MO
NTE
REY
RDVa
cant
Lan
d5.
83M
ixed
Use
Fle
x (7
-24
du/a
c)PU
D76
4130
20M
ON
TERE
Y RD
Park
ing
Lot
0.01
Mix
ed U
se F
lex
(7-2
4 du
/ac)
CL-R
City
of M
orga
n H
ill
Net
Max
imum
FAR
Cap
acity
(sq.
ft) 3
Net
Sta
ble
FAR
Capa
city
(sq.
ft) 3
Uni
ts p
er A
cre
2
780
Resu
lts
Page
8 o
f 10

FIN
AL D
RAFT
Dec
embe
r 13
, 201
7
7262
4019
MO
NTE
REY
RDPa
rkin
g Lo
t1.
04M
ixed
Use
Fle
x (7
-24
du/a
c)CL
-R81
7010
18M
ON
TERE
Y RD
Vaca
nt L
and
0.2
Mix
ed U
seCC
-R76
7180
46M
ON
TERE
Y RD
Vaca
nt L
and
1.1
Mix
ed U
se F
lex
(7-2
4 du
/ac)
CL-R
7671
7047
COSM
O A
VVa
cant
Lan
d2.
03M
ixed
Use
Fle
x (7
-24
du/a
c)CL
-R
7262
3018
95 E
MAI
N A
VRe
tail
- Aut
o Se
rvic
esA
Tool
She
d Eq
uipm
ent R
enta
ls2.
52M
ixed
Use
CC-R
7263
6010
30 P
EEBL
ES A
VVa
cant
Lan
d0.
24M
ixed
Use
Fle
x (7
-24
du/a
c)R1
7264
1065
25 P
EEBL
ES A
VVa
cant
Lan
d0.
9M
ixed
Use
Fle
x (7
-24
du/a
c)CS
7250
1032
1950
0 M
ON
TERE
Y RD
Com
mer
cial
Cen
ter
Nei
ghbo
rhoo
d2.
54M
ixed
Use
Fle
x (7
-24
du/a
c)CS
7264
2003
1940
0 M
ON
TERE
Y RD
Reta
il - A
uto
Serv
ices
NA
- Sc
rapy
ard
0.31
Mix
ed U
se F
lex
(7-2
4 du
/ac)
CS
7264
2002
1938
0 M
ON
TERE
Y RD
Reta
il - A
uto
Serv
ices
Fam
ily R
V0.
74M
ixed
Use
Fle
x (7
-24
du/a
c)CS
7264
2001
1938
0 M
ON
TERE
Y RD
Reta
il - A
uto
Serv
ices
Fam
ily R
V3.
93M
ixed
Use
Fle
x (7
-24
du/a
c)CS
7262
5006
1811
0 M
ON
TERE
Y RD
Vaca
nt L
and
6.69
Mix
ed U
se F
lex
(7-2
4 du
/ac)
ML
7641
2006
1796
5 M
ON
TERE
Y RD
Reta
il - A
uto
Serv
ices
No
nam
e1.
54M
ixed
Use
Fle
x (7
-24
du/a
c)C-
G
7262
5002
1792
0 M
ON
TERE
Y RD
Reta
il - A
uto
Serv
ices
Pron
to A
uto
Repa
ir1.
55M
ixed
Use
Fle
x (7
-24
du/a
c)CL
-R76
4130
2217
845
MO
NTE
REY
RDPa
rkin
g Lo
t 0.
19M
ixed
Use
Fle
x (7
-24
du/a
c)CL
-R
7262
4049
1777
0 M
ON
TERE
Y RD
Off
ice
Use
s - G
ener
al O
ffic
e
1) P
rosp
ecto
rs P
rope
rty
Man
agem
ent
2) B
rade
ley
A Le
ach,
Acc
ount
ant
3) V
acan
t - u
p fo
r le
ase
0.72
Mix
ed U
se F
lex
(7-2
4 du
/ac)
CL-R
with
PD
O
verla
y72
6240
0917
755
MC
LAU
GH
LIN
CT
Vaca
nt L
and
0.15
Mix
ed U
se F
lex
(7-2
4 du
/ac)
R-2
7262
3012
1768
0 M
ON
TERE
Y RD
Off
ice
Use
s - G
ener
al O
ffic
eFa
rmer
s In
sura
nce
0.68
Mix
ed U
seCC
-R72
6230
0817
620
MO
NTE
REY
RDVa
cant
Lan
d1.
01M
ixed
Use
CC-R
7670
9009
1699
5 M
ON
TERE
Y RD
Gas
Ser
vice
Sta
tion
Gol
den
Eagl
e G
as0.
37M
ixed
Use
PUD
8170
1051
1694
0 M
ON
TERE
Y RD
Reta
il - A
uto
Serv
ices
Tow
n &
Cou
ntry
Car
Was
h0.
48M
ixed
Use
CC-R
7671
0002
1683
5 M
ON
TERE
Y RD
Reta
il - U
nkno
wn
(Vac
ant)
0.58
Mix
ed U
seC-
G76
7100
0316
825
MO
NTE
REY
RDRe
tail
- Gen
eral
Ret
ail
Sun
Shin
e Bi
cycl
es1.
45M
ixed
Use
C-G
8170
1002
1672
0 M
ON
TERE
Y RD
Gas
Ser
vice
Sta
tion
0.48
Mix
ed U
se F
lex
(7-2
4 du
/ac)
CL-R
8170
2001
1668
5 CH
URC
H S
TRe
tail
- Gen
eral
Ret
ail
Sew
Bee
It Q
uilti
ng0.
9M
ixed
Use
Fle
x (7
-24
du/a
c)R-
276
7170
4616
595
MO
NTE
REY
RDVa
cant
Lan
d2.
93M
ixed
Use
Fle
x (7
-24
du/a
c)CL
-R
8170
2018
1638
0 M
ON
TERE
Y RD
Vaca
nt L
and
0.09
Mix
ed U
se F
lex
(7-2
4 du
/ac)
CL-R
8170
2016
1634
0 M
ON
TERE
Y RD
Reta
il - G
ener
al R
etai
lSo
urce
wis
e0.
4M
ixed
Use
Fle
x (7
-24
du/a
c)CL
-R
7671
8055
1629
5 M
ON
TERE
Y RD
Reta
il - P
erso
nal S
ervi
ce
1) M
athn
asiu
m2)
The
Dai
ly M
etho
d 3)
déj
à vu
Sal
on1.
57M
ixed
Use
Fle
x (7
-24
du/a
c)CL
-R81
7030
1016
290
MO
NTE
REY
RDRe
tail
- Res
taur
ant/
Food
Ser
vice
La C
osta
0.43
Mix
ed U
se F
lex
(7-2
4 du
/ac)
CL-R
7671
8020
1622
5 M
ON
TERE
Y RD
Reta
il - A
uto
Serv
ices
Mor
gan
Hil
Car
Was
h &
Gift
Sho
p1.
13M
ixed
Use
Fle
x (7
-24
du/a
c)CL
-R
7671
8035
1616
5 M
ON
TERE
Y RD
Off
ice
Use
s - G
ener
al O
ffic
e
From
Yel
p:1)
Mic
roAr
tisty
2) C
alifo
rnia
Pre
nata
l Im
agin
g3)
Pur
e Sk
in &
Bod
y4)
All
Abou
t Sen
iors
Car
e5)
Dun
ne In
sura
nce
0.46
Mix
ed U
se F
lex
(7-2
4 du
/ac)
CL-R
7263
6059
1110
MO
NTE
REY
RDIn
dust
rial/M
anuf
actu
ring
Calif
orni
a To
w &
Sal
vage
7.52
Resi
dent
ial A
ttac
hed
Low
(6-1
6 du
/ac)
/Mix
ed U
se
Flex
(7-2
4 du
/ac)
CG &
R-1
8170
3005
1619
0 M
ON
TERE
Y RD
Reta
il - A
uto
Serv
ices
Ente
rpris
e Re
ntal
Car
0.36
Resi
dent
ial A
ttac
hed
Low
(6-1
6 du
/ac)
/ Mix
ed U
se
Flex
(7-2
4 du
/ac)
Cl-R
& R
-281
7360
33
Vaca
nt L
and
0.68
Mix
ed U
sePU
DTO
TAL:
55.7
2
Page
9 o
f 10

FIN
AL D
RAFT
Dec
embe
r 13,
201
7
Mon
tere
y Co
rrid
or M
arke
t & L
and
Use
Cap
acity
Stu
dy
Prep
ared
by
Lisa
Wis
e Co
nsul
ting,
Inc.
COM
MER
CIA
L CA
PACI
TY A
NA
LYSI
S
MET
HO
D 5
- RE
TAIL
LEA
KAG
E
Resu
lts
Econ
omic
Cat
egor
y 1
Taxa
ble
Sale
s Ca
ptur
e/(G
ap) C
ityw
ide
Squa
re F
oota
ge
Capt
ure/
(Gap
) City
wid
e 2
Perc
ent o
f City
wid
e Ta
xabl
e Sa
les
Real
ized
in S
tudy
Are
a 3
Squa
re F
oota
ge C
aptu
re/(
Gap
) in
Stud
y Ar
ea
Gen
eral
Ret
ail
($59
,634
,590
)(1
79,0
51)
10.0
1%(1
7,93
1)Fo
od P
rodu
cts
($21
,248
,778
)(6
3,79
9)8.
47%
(5,4
06)
Tran
spor
tatio
n$1
41,9
53,5
70
426,
211
11.4
2%48
,688
Cons
truc
tion
($2,
597,
291)
(7,7
98)
1.18
%(9
2)Bu
sine
ss to
Bus
ines
s($
30,1
31,8
15)
(90,
470)
6.68
%(6
,040
)M
isce
llane
ous
($5,
441,
274)
(16,
337)
20.3
5%(3
,324
)TO
TAL
$22,
899,
822
68,7
56--
15,8
95Ta
xabl
e Sa
les
- City
wid
e (2
016)
$769
,457
,061
Tota
l City
wid
e Re
tail
Sq. F
t. (2
016)
2,31
0,26
8D
olla
r of
Rev
enue
per
Sq.
Ft.
of R
etai
l (20
16)
$333
.06
Not
es
Ass
umpt
ions
Per
capi
ta s
ales
are
com
para
ble
to th
e re
gion
(e.g
., So
uth
San
Jose
, Gilr
oy, e
tc.);
leak
age
data
pro
vide
d by
Mun
iSer
vice
s.
Dol
lar
of r
even
ue p
er s
quar
e fo
ot is
con
stan
t acr
oss
all e
cono
mic
cat
egor
ies
(e.g
. Tra
nspo
rtat
ion,
Foo
d Pr
oduc
ts, e
tc.).
City
of M
orga
n H
ill
1. C
ateg
orie
s id
entif
ied
in M
uniS
ervi
ces'
Tax
able
Sal
es C
aptu
re &
Gap
Ana
lysi
s Re
port
.
2. C
alcu
late
d us
ing
2016
Dol
lar
of R
even
ue p
er S
q. F
t. of
Ret
ail.
Sour
ces:
Mun
iSer
vice
s an
d Cl
arita
s; T
he C
onco
rd G
roup
(CoS
tar,
Rei
s); C
ity o
f Mor
gan
Hill
; LW
C
3. S
quar
e Fo
otag
e Ca
ptur
e/(G
ap) b
y ec
onom
ic c
ateg
ory
in S
tudy
Are
a is
cal
cula
ted
usin
g pe
rcen
tage
s ba
sed
on r
ealiz
ed ta
xabl
e sa
les,
and
it a
ssum
es th
e pr
opor
tion
of s
quar
e fo
otag
e lo
st to
leak
age
in e
cono
mic
ca
tego
ries
is r
elat
ed to
obs
erve
d ca
tego
ry p
erfo
rman
ce a
nd is
not
com
para
ble
to th
e To
tal S
quar
e Fo
otag
e Ca
ptur
e/(G
ap) C
ityw
ide.
Page
10
of 1
0