MONTANA - National Agricultural Statistics Service€¦ · Donna Copps Tom Erdie Jean Faulstich...
80
MONTANA 2012 Agricultural Statistics 2010-2011 County Estimates
-
Upload
vuongkhuong -
Category
Documents
-
view
219 -
download
4
Transcript of MONTANA - National Agricultural Statistics Service€¦ · Donna Copps Tom Erdie Jean Faulstich...

MONTANA 2012 Agricultural Statistics
2010-2011 County Estimates
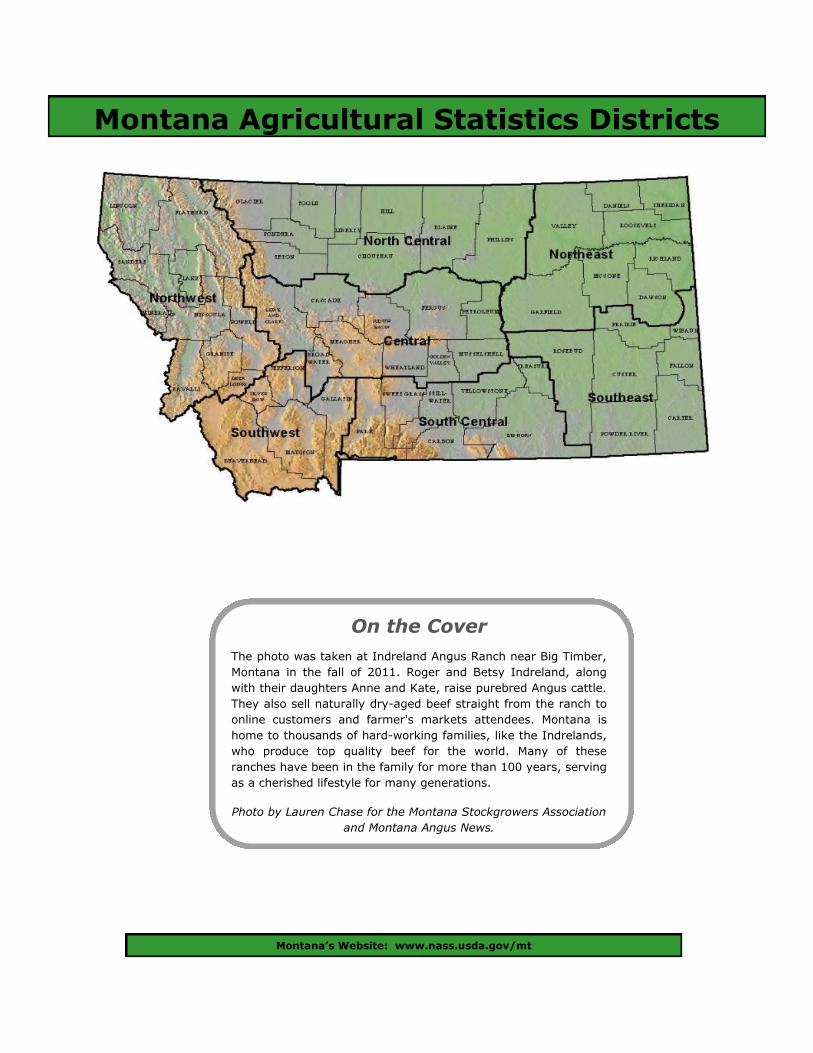
Montana Agricultural Statistics Districts
Montana’s Website: www.nass.usda.gov/mt
On the Cover
The photo was taken at Indreland Angus Ranch near Big Timber,
Montana in the fall of 2011. Roger and Betsy Indreland, along
with their daughters Anne and Kate, raise purebred Angus cattle.
They also sell naturally dry-aged beef straight from the ranch to
online customers and farmer's markets attendees. Montana is
home to thousands of hard-working families, like the Indrelands,
who produce top quality beef for the world. Many of these
ranches have been in the family for more than 100 years, serving
as a cherished lifestyle for many generations.
Photo by Lauren Chase for the Montana Stockgrowers Association
and Montana Angus News.

MONTANA AGRICULTURAL STATISTICS
Issn: 1095-7278 Volume XLIX October 2012
State of Montana
Brian Schweitzer, Governor
Issued Cooperatively by
Montana Department of Agriculture
Ron de Yong, Director 303 N. Roberts, Room 317
Helena, MT 59620
U.S. Department of Agriculture
National Agricultural Statistics Service Dr. Cynthia Clark, Administrator
Washington, D.C. 20250
Complied by
USDA, NASS, MONTANA FIELD OFFICE Steve Anderson, Director
Eric Sommer, Deputy Director 10 West 15th Street, Suite 3100
Helena, MT 59626-3100
(406) 441-1240 or 1-800-835-2612
E-mail: [email protected]
Website: www.nass.usda.gov/mt
Administrative Section
Annette Ronningen Loretta Johnson
Estimates Section
Christel Pachl Carmen Pennington
Kira Knoles Alyssa Peck - Student Intern
IT Section
Ron Schumacher Pam Stoneking
List Frame Section
Thomas Chard II Julia Evans-Meeks
Survey Section
Jodie Sprague Michael Johnson
Carol Stefely
2012 Montana Agricultural Statistics Foreword 1
National Association of Departments of Agriculture (NASDA)
Montana Data Collection Center
Field Staff by Area
Southeast Montana
Carmen Bertsch - Supervisor Laurie Castro Todd Friez Edward Gasper Teresa Heitz Karen Hovermale Gary Schaff
Central and Northeast Montana
Eileen Damone - Supervisor Janice Anderson Sandy Baden Dorothy Campbell Myrna Cummings Vicki Ehlert Terri Linn Jeannie Miner Robert Prongua Barbara Wacker Lynda Waters Mitch Walter
Northwest and North Central Montana
Lana Hilton - Supervisor Chance Barker Lynda Barker Larry Bates Lorraine Hanson Janice Hawley Glenda Johnson Timothy Pegar Tara Rowland Rhonda Van Hoy Valerie Wadman
Southwest Montana
Lisa Peterson - Supervisor Judy Carlson Connie Evenson Tom Erdie Charles Ruzicka James Wieferich
Foreword 2 2012 Montana Agricultural Statistics
Jeff Bradshaw - Supervisor Pauletta Alber Jennifer Beausoleil
Judy Chapman Penney Clarke Mary Cole Michaelanne Fagnan Joan George Lori Glassgo Kimberly Hamlin
Aleasha Horn Lorena James Michele Keiffer Miriam Ortiz Linda Leonti Redona Linda Reyant
Eric Romero Kimberly Sides Branden Songer Sarah Songer Jennaya Spence Dori Wetherelt
Ann Buraas - Supervisor Brandie Bushnell Hoyt Tamara Hankel
Mary Kulawik Sandy LaSalle Laura Peppenger Nina Pullman Carla Sappenfield
Andy Knoles - Supervisor Wayne Budt Polly Burnham
Jack Ferriter Gerrit Nicolai Misti Sandon Virginia Seil Kinsley Wilson
Jeanine McCarthy - Supervisor Jo Benefield Londa Burns
Amy Holodnick Connie Jester Cassandra Jilderda
Nancy Lightner Karen Mays Marchita Mays Stefani McPhee
Chris Mock Dawn Piazzi Sandra Page Sandee Riemann Barbara Sauter Wendy Stewart
Wesley Stewart Heather VanDrunen Wendy Vick Pietr Zwolle
Abbie Pence - Supervisor Pat Chevallier Jean Clark
Donna Copps Tom Erdie Jean Faulstich Patti Knapper Wilda Komora
Marty Masiak Lon Mitchell
Kim Pouliot Ken Stephens Ruth Straley
Vicki Samoray - Supervisor Stephanie Miller
Coaches
Vicki Hewitt
Jeanette Hume
Patti O’Dell
Jody Pace
Nathan Stroman
Cheryl Brandt - Supervisor Sam Allen Cynthia Amundson Jamie Beverly Carmen Brusda Jim Brusda Brenda Clark Jamie Cole Stacie Good Mary Goyins Gynn Gregor Lynn Israell Cindy Maxwell Rebecca Morgan Whitney Morgan Kimberly Pekar Barbara Rennick Devon Rule Corie Sobrepena Ramona Townsend

FOREWORD 4 Comments from the Governor 5 Message from the Director - MT Dept. of Agriculture 5 Notes from the Director - Mt Ag Statistics GENERAL 6 Montana Department of Agriculture 8 Montana Crop, Livestock and Weather Digest 9 Climatological Data 10 Montana Facts and Figures 11 Number of Farms, Land in Farms, and Average Size 12 Census of Agriculture, Number of Farms 13 Census of Agriculture, Number of Farms by County ECONOMIC 14 Montana Selected Industries Comparison 15 Value Added to the US Economy by the Ag Sector 16 Farm Income and Expenses by County 17 Cash Rent Dollars by County 19 Farm Real Estate Values
19 Cash Receipts from Sale of Principal Products and Government Payments 20 Cash Receipts from Marketings by Commodities 22 Prices Received for Selected Commodities 23 Marketing Year Average Prices Received 23 Marketing of Major Commodities RANK 24 Montana Record Highs and Lows by Commodity 26 Montana’s Rank in the Nation’s Agriculture 27 Winter Wheat and Spring Wheat Production Maps 28 Durum Wheat and Barley Production Maps 29 Alfalfa and Other Hay Production Maps 30 Cattle & Calves, Sheep & Lambs Inventory Maps STATE CROPS 31 Crops Summary 31 Usual Planting and Harvesting Dates - Acreage, Production, and Value - 32 All Wheat and Winter Wheat 32 Durum Wheat 33 Other Spring Wheat 33 All Barley 33 Oats 34 Corn 34 Potatoes 34 Sugar Beets 35 Dry Beans (All, Pinto, and Garbanzo) 35 Lentils 36 Dry Peas (All and Austrian Winter Peas) 36 Canola 36 Camelina 36 Mustard Seed 37 Flaxseed 37 Safflower 37 Sweet Cherries 37 Leaf Cutter Bees 38 Alfalfa Seed 38 Hay (All, Alfalfa, and Other) 39 Grain Movement 40 Wheat Utilization 41 All Wheat, All Barley, and Oats Stocks 41 All Barley Varieties, Historic
42 All Wheat Varieties, Historic 43 Winter Wheat and Spring Wheat Varieties 45 Durum Wheat and Barley Varieties 47 Barley Purchased for Malt
COUNTY CROPS - Planted, Harvested, Yield, and Production - 48 Winter Wheat 52 Spring Wheat 55 Durum Wheat 56 All Barley 58 Oats 59 Corn 60 Dry Beans (All, Pinto, Other, and Garbanzo) 61 Dry Peas (All and Austrian Winter Peas) 62 Lentils 62 Canola 62 Flaxseed 63 Mustard Seed 63 Safflower 63 Potatoes 63 Sugar Beets 64 Hay (Alfalfa and Other) STATE LIVESTOCK - Cattle and Calves -
66 Inventory by Class, Cattle on Feed, and Value 66 Calf Crop and Disposition 66 Private Grazing Fee Rates 66 Production and Income 67 Dairy Products Marketed, Income, and Value - Sheep, Lambs, and Goats - 67 Milk, Meat, and Other Goats 67 All Sheep Inventory by Class and Value 67 Lamb Crop and Disposition 67 Wool Production and Value 68 Death Loss and Percent of Total Inventory Lost 68 Death Loss by Cause and Value of Loss 69 Percent of Loss by Cause - Hogs and Pigs - 70 Inventory by Class and Value 70 Annual Farrowings and Disposition 70 Production and Income - Chickens, Eggs, and Honey - 71 Chicken Inventory, Value, Production, and Income 71 Eggs Production and Value 71 Honey Inventory, Production, Stocks, and Value - Commercial Livestock Slaughter - 72 Commercial Red Meat Production 72 Monthly Slaughter by Class COUNTY LIVESTOCK - County Inventory by Head - 73 All Cattle and Calves 73 Beef Cows and Heifers 74 Milk Cows and Heifers 75 All Sheep and Lambs 76 Hogs and Pigs
2012 Montana Agricultural Statistics Foreword 3
TABLE OF CONTENTS

COMMENTS FROM
OUR GOVERNOR
Montana farmers and ranchers usually cope with a certain amount of volatility in weather, commodity prices and other inputs, but 2011 had a bit of everything. Floods, drought, crop pest outbreaks and price volatility made it a challenging year, but in the end for many, a prosperous one. Delays in spring planting due to floods reduced Montana's 2011 production of staples such as spring wheat and durum, while high prices for hay helped push the value of Montana production to more than $3 billion for a
second consecutive year. Montana farmers led the nation in pea and lentil production in 2011, and also increased production of other rotation crops such as chickpeas, canola and flax. Acreage reports for 2012 show continued growth in rotation crops. This increased diversity serves as a hedge against weather and market volatility and demonstrates the innovation and resilience so necessary for today’s agricultural producers.
The 2012 crop year has brought its own challenges. Global economic issues, fertilizer prices and a return to drought conditions and damaging fires in much of southern Montana threaten farm and ranch balance sheets. Montana’s producers will meet these myriad challenges and continue to drive Montana’s successful economic engine. I’m very grateful for the enormous contributions our agriculture producers make to the state and to their communities. The longstanding traditions of hard work, optimism, determination that exemplify Montana’s
agricultural industry are an integral part of our state’s history and key to Montana’s future.
Sincerely,
Brian Schweitzer, Governor
Foreword 4 2012 Montana Agricultural Statistics

MESSAGE FROM
THE DIRECTOR
A combination of early flooding and drought later in the 2011 growing season hampered what promised to be an excellent year for Montana farmers and ranchers, but it was a good year overall with excellent prices for hay and grain. Montana surpassed North Dakota as the leading pea and lentil producer in 2011, and the state's reputation in grain and pulse crops attracted several new buyers
to set up shop in our borders. Competition is good when it comes to markets for Montana's high quality staples such as wheat, barley, hay and livestock. Markets for some Montana products increased with little fanfare. During the past two years, Montana livestock producers have sold more than $20 million in live cattle, embryos and semen to a burgeoning market in Russia, with more exports predicted during the coming year. The Montana Department of Agriculture is working hard to increase exports and domestic sales of value-added products. Visit a local farmers market to see some of the new products your neighbors are creating to help grow Montana's agricultural economy.
Updates to this annual Montana Agricultural Statistics bulletin, produced in cooperation with the National Agricultural Statistics Service, are available electronically at www.nass.usda.gov/mt.
Sincerely,
Ron de Yong, Director, Montana Department of Agriculture
NOTES FROM
THE DIRECTOR
I proudly introduce the 49th edition of the Montana Agricultural Statistics Bulletin. Montana is a state of extremes. Whether faced with excessive moisture and flooding in 2011 or fire and drought conditions in 2012, a compilation of production results is necessary to tell the story of Montana’s farmers and ranchers. This publication tells this story to legislators, agribusinesses, academics, reporters, and producers who all follow the basic premise that more information is better than less, especially when
making decisions with an economic impact.
This era in which we operate dictates that the safeguarding of public funds remain a priority. Working cooperatively with allows the National Agricultural Statistics Service (NASS) the ability to achieve the goal of providing timely, accurate, and useful statistics in service to U.S. agriculture. To that end, NASS partners with Montana Department of Agriculture, Montana Wheat and Barley Committee, Montana Woolgrowers Association, and the Montana Alfalfa Seed Committee, among others. This year, I am pleased to announce that NASS has opened a data lab on the Montana State University campus in Bozeman. This data lab will provide better access to data by researchers while continuing to safeguard the confidentiality of our agricultural producers. Finally, the biggest cooperator which NASS has in the state of Montana is our agricultural producers. Compiling the collective voice of farmers and ranchers is a
privilege which I do not take lightly.
The 2012 Census of Agriculture is coming! At the end of 2012, nearly 40,000 agricultural operations and potential agricultural operations with the state of Montana will be mailed a questionnaire. If you are an agricultural operator, please watch for it and do your part in telling the story of Montana agriculture through your participation.
Steve Anderson, Director, USDA, NASS, Montana Field Office
2012 Montana Agricultural Statistics Foreword 5
General 6 2012 Montana Agricultural Statistics
Department Mission
"To protect producers and consumers and to
enhance and develop agriculture and allied
industries."
Director Ron de Yong, (406) 444-3144
Central Services Administrator: Libbi H. Lovshin
Attorney: Cort Jensen
Public Information Officer: Ron Zellar
Growth Through Agriculture grants and loans during FY 2012 totaled more than $400,000 to 47 businesses and
individuals for value-added agriculture projects. Food and Agriculture Development Centers assisted 93 clients with
food and farm-derived energy projects.
Marketing assistance during FY 2012 included more than 90 one-on-one company consultations; about
$675,000 in trade show sales; and 23 promotions in out of state trade shows. Marketing staff conducted five over-
seas trade missions and hosted three delegations, resulting in more than $25 million in embryo, semen, and live
animal sales.
Rural Development finance programs have a combined loan portfolio of more than $3.5 million.
State Hail Insurance protected 1.8 million acres in 2012, an increase from the previous year's record 1.5 million
acres when wet weather prevented planting in some areas.
State Grain Laboratory completed nearly 34,000 tests for grade, protein, germination, baking qualities, vomi-
toxin and other characteristics on wheat, barley and 20 other commodities, including more than 3,000 inspections
on peas, beans and lentils. The Great Falls facility, with a branch office in Plentywood, is the only federally licensed
grain lab in Montana.
Wheat & Barley Committee annually hosts an average of 13 foreign trade delegations and 63 visitors from
seven nations that have an interest in purchasing Montana grains. The Committee represents producers on trans-
portation issues, research, and market development.
Department Programs & Background
Montana Department of Agriculture operates some 30 programs, many funded entirely through user fees. These
include regulatory programs that protect producers, consumers and the environment, as well as development and
marketing programs to foster growth in Montana agriculture. The Director's Office also serves as an advocate for
Montana agriculture in national and international forums and works to make the department's programs accessible
to the public.
Agricultural Development Division
Deputy Director/Administrator: Joel A. Clairmont, (406) 444-2402
Ag Marketing & Business Development Bureau Rural Development Bureau - Marketing and Business Assistance - Agricultural Finance - Grants and Loans - Agricultural Statistics - Agriculture Curriculum Development - Commodity Check-Off Programs
- State Hail Insurance Wheat & Barley Bureau, Great Falls State Grain Laboratory, Great Falls - Producer funded research and marketing - Federally licensed grain inspection - Hosts foreign buyers and delegations

2012 Montana Agricultural Statistics General 7
Agricultural Sciences Division
Administrator: Greg Ames, (406) 444-2944
The Department:
Licenses about 500 pesticide dealers and registers about 11,300 pesticide products.
Licenses about 4,700 private and 2,000 commercial and government pesticide applicators.
Certifies 74 commercial honeybee operations and registers 5,200 apiary locations.
Issues 1,000 plant health and export certificates, enabling products to be shipped to other states and
countries.
Licenses 1,000 nurseries to assure quality products.
Issues 3,100 inspection certificates on 280 million pounds of potatoes shipped for seed.
Analytical Laboratory, operated jointly with MSU at Bozeman, reports about 125,500 individual test results an-nually on 3,200 feed, fertilizer, soil, plant tissue and water quality samples.
Pesticide Disposal program assists homeowners, businesses and producers in disposing of unwanted and unus-able pesticides - a total of 400,000 pounds since 1994.
Fertilizer program registered more than 3,300 fertilizer and soil amending products and licensed 220 in-state and 250 out-of-state businesses. Reports indicate 700,000 tons of fertilizer were distributed in Montana during 2011.
Organic program annually inspects and certifies 107 farms and ranches and 47 food handlers as compliant with USDA organic standards. Organic certification allows access to local, national and international value-added mar-kets for organic food products.
Noxious Weed Trust Fund annually distributes more than $2 million in grants for weed management, research and education from automobile license weed management fund, federal grants and interest received on Noxious Weed Trust Fund principal.
Board, Councils and Committees
The department receives advice from, and has attached to it, the following:
Analytical Laboratory Bureau, Bozeman - Export Certification - Tests feed, pesticides, fertilizer, water - Noxious Weeds & Invasive Pests
- Nurseries & Pest Quarantines Commodity Services Bureau - Cooperative Ag Pest Survey
- Anhydrous Ammonia - Feed/Fertilizer Technical Services Bureau - Grain Warehouses & Auditing - Applicator Certification & Licensing - Organic Certification - Pesticide Compliance & Enforcement - Produce/Seed/Seed Potatoes - Pesticides in Water - Pesticide Product Registrations Pest Management Bureau - Vertebrate Pests
- Apiary/Alfalfa Leaf Cutter Bees - Weed Seed Free Forage
- Agriculture Development Council - Noxious Weed Seed Free Forage Advisory Council
- Alfalfa Seed Committee - Noxious Weed Summit Advisory Council
- Cherry Advisory Committee - Organic Commodity Advisory Council
- Hail Insurance Board - Potato Advisory Committee
- Mint Committee - Potato Advisory Committee
- Noxious Weed Management Advisory - Pulse Crop Advisory Committee
Council - Wheat & Barley Committee
General 8 2012 Montana Agricultural Statistics
January: Montana had above normal temperatures during January, with above average precipitation in many areas. Choteau reached the monthly high temperature of 57 de-
grees. Valentine and Wisdom tied for the monthly low of minus 32 degrees. West Glacier had the most monthly accu-mulated moisture at 5.87 inches. At month’s end, winter wheat crop conditions were 73 percent good to excellent, well ahead of last year’s 34 percent. Ninety-six percent of livestock received supplemental feed. Calving and lambing had just begun.
February: Montana received ample snowfall during Febru-ary, the third consecutive month of above normal precipita-tion. Average temperatures were well below normal for most of the state. Harlem had the monthly low of minus 44 de-grees. Winter wheat had good snow cover and crop condi-tions were 71 percent good to excellent at month's end. Nearly all livestock received supplemental feeding. Despite sub-zero temperatures and high winds, calving and lambing
were on pace with last year, at 15 percent and 9 percent complete, respectively.
March: Many areas in Montana had below average precipi-
tation during March, while other parts of the state received above normal moisture. Temperatures were below normal for the month. Topsoil and subsoil moisture conditions were 97 percent and 91 percent adequate to surplus, respectively, at month’s end. Winter wheat crop conditions were 64 per-cent good to excellent. Calving was 44 percent complete and lambing was 31 percent complete. Most livestock received supplemental feeding at the end of the month.
April: Wet, cool conditions prevailed for much of the month. Flooding was reported in some areas. Topsoil and subsoil moisture conditions were 100 percent and 98 percent adequate to surplus, respectively, at month’s end. Spring planting was well behind average. Winter wheat crop condi-tions continued to be good to excellent. Calving and lambing
were approaching completion by the end of the month. Live-stock movement to summer ranges had just begun.
May: Wet, cool weather continued for most of May, the sev-
enth consecutive month of above normal precipitation. Flooding was widespread and fields were saturated. Spring wheat & durum planting was at a historically slow pace. At month’s end, winter wheat crop conditions were 71 percent good to excellent. Livestock movement to summer ranges was well underway, but behind the five-year average. Range and pasture feed conditions were 80 percent good to excel-lent.
June: Rain fell across the state during the first half of June. Wet fields hindered spring planting and small grain develop-ment was well behind the five-year average. Warm summer temperatures arrived in Montana the last half of the month, along with drier weather. Winter wheat crop conditions re-mained good to excellent. The first cutting of hay had just begun at month’s end. Range and pasture feed conditions
continued to be good to excellent. Nearly all cattle and sheep were moved to summer pastures.
July: Temperatures were slightly above normal in most areas during July. Fort Benton and Hardin both reached 103 degrees mid-month. Precipitation was limited. The hot, drier
weather helped small grain development considerably, but progress remained behind the five-year average. Farmers began harvesting winter wheat at month’s end. The first cutting of alfalfa and other hay was nearing completion. Range and pasture feed conditions were 80 percent good and excellent.
August: Hot, dry weather prevailed during the month. Win-ter wheat harvest was nearly wrapped up by month’s end, ahead of last year and the five-year average. Harvest of other small grains was well underway. The second cutting of alfalfa and other hay was in full swing. At month’s end, range and pasture feed conditions were above the five-year average. The movement of livestock from summer pastures had just begun.
September: Temperatures were above normal for the month and precipitation was much below normal in most areas. Topsoil and subsoil moisture conditions were below last year and the five-year average. Small grains harvest
was wrapping up by month’s end. The second cutting of all hay was nearly complete. Winter wheat planting was well underway. The movement of livestock from summer pas-tures continued. Range and pasture feed conditions re-mained above the five-year average at month’s end.
October: Montana had unseasonably mild temperatures during October, with above normal rainfall in most areas. Farmers finished small grains harvest by mid-month. Sugar beet harvest was 94 percent complete at month’s end, com-pared to last year’s 89 percent and the five-year average of 79 percent. Winter wheat seeding was nearly complete. Range and pasture feed conditions were 40 percent good and excellent. Supplemental feeding of livestock was mini-mal. Livestock movement from summer pastures continued
at a steady pace.
November: Temperatures were near normal during the month, with highs mostly in the upper 50’s and lower 60’s.
Albion reached 69 degrees, while West Yellowstone had the low for the month at minus 16 degrees. Precipitation was generally below average. At month’s end, winter wheat crop conditions were 37 percent good to excellent, compared to last year’s 74 percent good to excellent. Most livestock were moved from summer ranges. Thirty-five percent of cattle and forty percent of sheep received supplemental feed at the end of the month.
December: Montana was dry and windy during December. Temperatures were above normal, with highs in the upper 40’s and mid 50’s. Some areas in the central and eastern parts of the state reached 60 degrees. West Yellowstone had the low for the month at minus 32 degrees. Due to a lack of snow cover, winter wheat crop conditions were 30 percent good to excellent at month’s end, compared to 72 percent
good to excellent last December. Seventy-two percent of cattle and 69 percent of sheep received supplemental feed at the end of the month.
Crop, Livestock, and Weather Digest, 2011

2012 Montana Agricultural Statistics General 9
Climatological Data Annual and Growing Season Precipitation and Frost-Free Days, 2010-2011
STATIONS COUNTY
PRECIPITATION in Inches FROST FREE DAYS 1/
Annual April – September Growing Season
2010 2011 Normal
2/ 2010 2011 Normal
2/ 2010 2011
Average 3/
Big Sandy Big Timber Bigfork 13 S Billings AP R Bozeman 6 W Broadus Butte AP R Chester Chinook Circle
Chouteau Sweet Grass Lake Yellowstone Gallatin Powder River Silver Bow Liberty Blaine McCone
16.76 16.35 28.18 18.75 17.89 17.54 15.37 19.22 17.25 22.40
-- --
16.08 19.54 8.47
19.10 11.83 12.30 4.32
--
13.82
16.11
21.87
14.77
16.45
13.59
12.78
10.58
13.06
13.28
13.91
11.88
18.96
13.37
13.32
15.32
12.20
14.44
14.15
17.73
-- --
7.97 15.58 7.23
15.15 9.26 6.38 3.78
--
10.54
11.25
12.47
9.58
11.39
9.49
9.03
8.20
10.00
10.06
152
142
159
163
88
152
82
145
128
128
141 139 177 183 133 139 79
126 138 122
97 126 152 150 101 119 73
108 119 120
Columbus Conrad Culbertson Cut Bank AP R Dillon WMCE Ekalaka Fairfield Flatwillow 4 ENE Forsyth Fort Benton
Stillwater Pondera Roosevelt Glaciers Beaverhead Carter Teton Petroleum Rosebud Chouteau
16.10 16.73 20.53 7.22
-- 20.07 13.95 16.39 16.48 16.85
15.86 11.19 8.65 6.17 8.73
25.90 16.25 21.67 17.13 16.13
15.67
12.06
13.58
12.51
11.65
17.25
12.50
13.30
14.08
13.69
10.90
13.55
16.22
6.99
--
16.72
11.03
12.61
12.96
12.03
11.44 8.16 8.01 4.42 6.97
20.48 12.14 16.64 13.18 12.47
10.56
9.12
10.90
10.07
8.78
12.39
9.85
9.84
9.97
10.04
107
153
131
87
139
133
98
142
158
154
99 113 122
-- -- --
167 108 139 133
125 93
117 113 103 123 133 118 134 131
Glasgow AP R Glendive Great Falls AP R Hardin Harlowton Havre AP Helena AP R Hysham 25 SSE
Valley Dawson Cascade Big Horn Wheatland Hill Lewis & Clark Treasure
18.06 19.13 19.38 17.02 14.83 14.81 12.97 5.23
22.95 19.52 16.40 15.86 8.14
12.24 13.28
--
11.23
13.62
14.89
12.07
14.08
11.46
11.32
14.37
15.05
16.18
13.60
12.63
12.65
11.47
9.54
3.26
18.20 15.46 10.96 12.48 7.10 9.14
10.34 --
8.68
10.42
10.50
8.08
10.73
8.35
8.19
9.63
130
133
119
156
--
146
144
158
162 --
141 174 98
141 160 94
133 144 120 133 111 125 121 135
Joliet Jordan Kalispell Glacier AP Kremlin Lewistown AP R Livingston AP R Malta 7 E Medicine Lake 3 SE Miles City AP R Missoula AP R
Carbon Garfield Flathead Hill Fergus Park Phillips Sheridan Custer Missoula
13.25 18.29 20.61 17.72 21.95 15.38 15.20 20.37 17.78 16.11
19.02 --
14.33 13.86 22.10 13.50
-- --
18.93 14.85
15.77
12.90
17.21
12.24
17.85
15.73
12.88
12.99
13.49
13.82
9.36
14.64
12.70
13.87
17.70
12.14
13.01
15.37
16.33
10.30
14.24 --
6.64 10.54 16.62 10.11
-- --
16.47 6.54
10.24
9.59
9.42
9.49
12.60
11.26
9.93
10.43
9.97
8.09
106
131
122
--
135
107
136
--
161
144
98 139
-- --
124 91
161 130 164 157
120 122 91 --
116 105 122 125 143 117
Opheim 12 SSE Plentywood Plevna Roundup Saint Ignatius Savage Scobey 4 NW Sidney Stanford Sunburst 8E
Valley Sheridan Fallon Musselshell Lake Richland Daniels Richland Judith Basin Toole
14.23 20.30 18.61 16.66 19.95 19.84 15.85 21.59 21.98 19.74
-- --
18.69 17.60
-- -- --
18.97 --
16.10
11.94
13.15
14.69
13.25
16.54
13.96
12.48
14.31
17.13
13.05
13.20
14.35
14.95
13.09
12.19
15.11
14.53
16.46
17.62
16.48
-- --
14.16 13.37
-- -- --
14.88 --
8.66
9.89
10.39
10.67
9.99
10.34
10.89
10.22
10.84
12.69
10.06
98
--
133
142
--
161
98
161
110
111
95 --
129 130
-- 122 122 135 125 97
110 116 114 131 131 126 108 125 109 115
Terry 21 NNW Thompson Falls PH Townsend Valier Vida 6 NE Virginia City Wibaux 2 E Wilsall 8 ENE Wisdom
Prairie Sanders Broadwater Pondera McCone Madison Wibaux Park Beaverhead
17.54 20.52 12.42 14.63 21.36 20.31 19.38 24.15 17.24
-- 20.60 8.52
10.06 -- --
22.81 -- --
13.67
23.07
10.67
12.22
13.88
15.82
14.01
20.96
11.90
15.32
10.70
10.24
12.70
18.32
14.35
17.02
18.37
11.26
-- 7.56 6.44 7.46
-- --
19.21 -- --
10.44
9.59
8.20
9.91
10.46
10.85
11.17
14.40
7.85
133
155
109
111
130
80
118
86
18
96 166 92
134 134 121
-- 90 4
126 133 120 117 119 85
113 95 18
1/ The number of days between the last frost (32 degrees) in spring and first frost (32 degrees) after June 30. 2/ Normal for period 1971-2000. 3/ Average frost-
free days for the period 1991-2000. -- Not available. SOURCE: National Climatic Data Center, NOAA, Asheville, North Carolina.
General 10 2012 Montana Agricultural Statistics
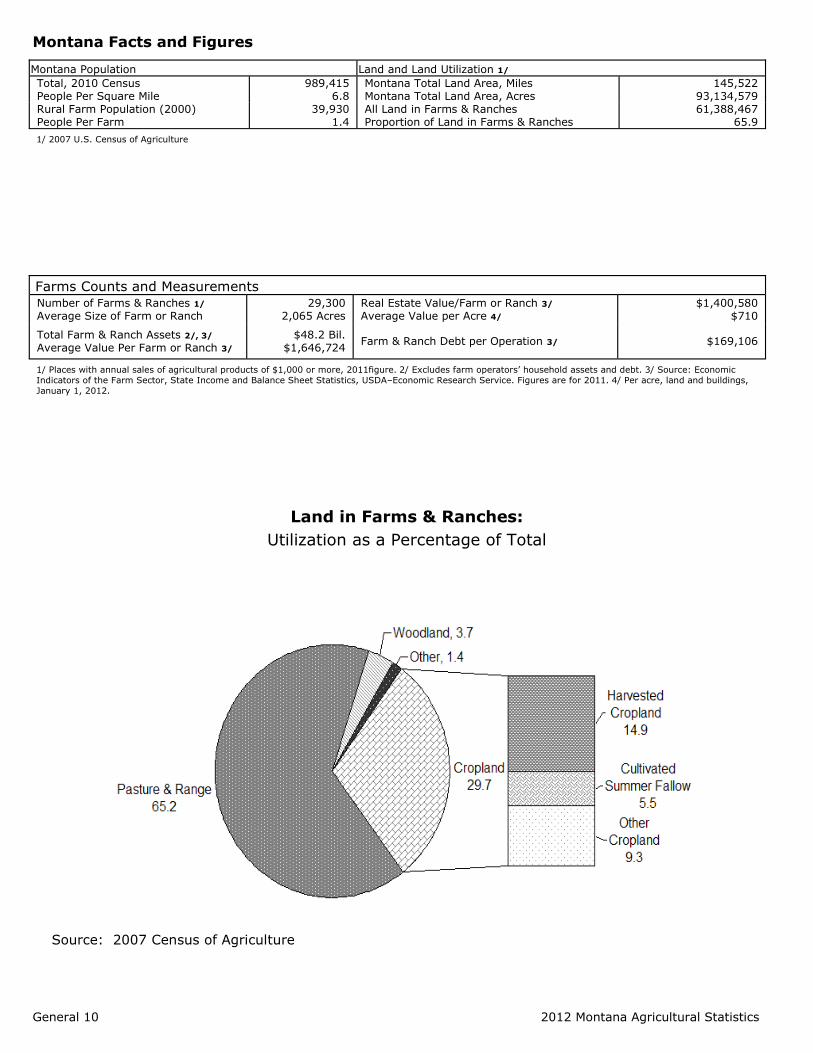
Montana Facts and Figures
Land in Farms & Ranches:
Utilization as a Percentage of Total
Source: 2007 Census of Agriculture
Farms Counts and Measurements Number of Farms & Ranches 1/ Average Size of Farm or Ranch
29,300 2,065 Acres
Real Estate Value/Farm or Ranch 3/ Average Value per Acre 4/
$1,400,580 $710
Total Farm & Ranch Assets 2/, 3/ Average Value Per Farm or Ranch 3/
$48.2 Bil. $1,646,724
Farm & Ranch Debt per Operation 3/ $169,106
1/ Places with annual sales of agricultural products of $1,000 or more, 2011figure. 2/ Excludes farm operators’ household assets and debt. 3/ Source: Economic
Indicators of the Farm Sector, State Income and Balance Sheet Statistics, USDA–Economic Research Service. Figures are for 2011. 4/ Per acre, land and buildings,
January 1, 2012.
Montana Population Land and Land Utilization 1/
Total, 2010 Census
People Per Square Mile 989,415
6.8 Montana Total Land Area, Miles Montana Total Land Area, Acres
145,522 93,134,579
Rural Farm Population (2000) People Per Farm
39,930 1.4
All Land in Farms & Ranches Proportion of Land in Farms & Ranches
61,388,467 65.9
1/ 2007 U.S. Census of Agriculture
2012 Montana Agricultural Statistics General 11
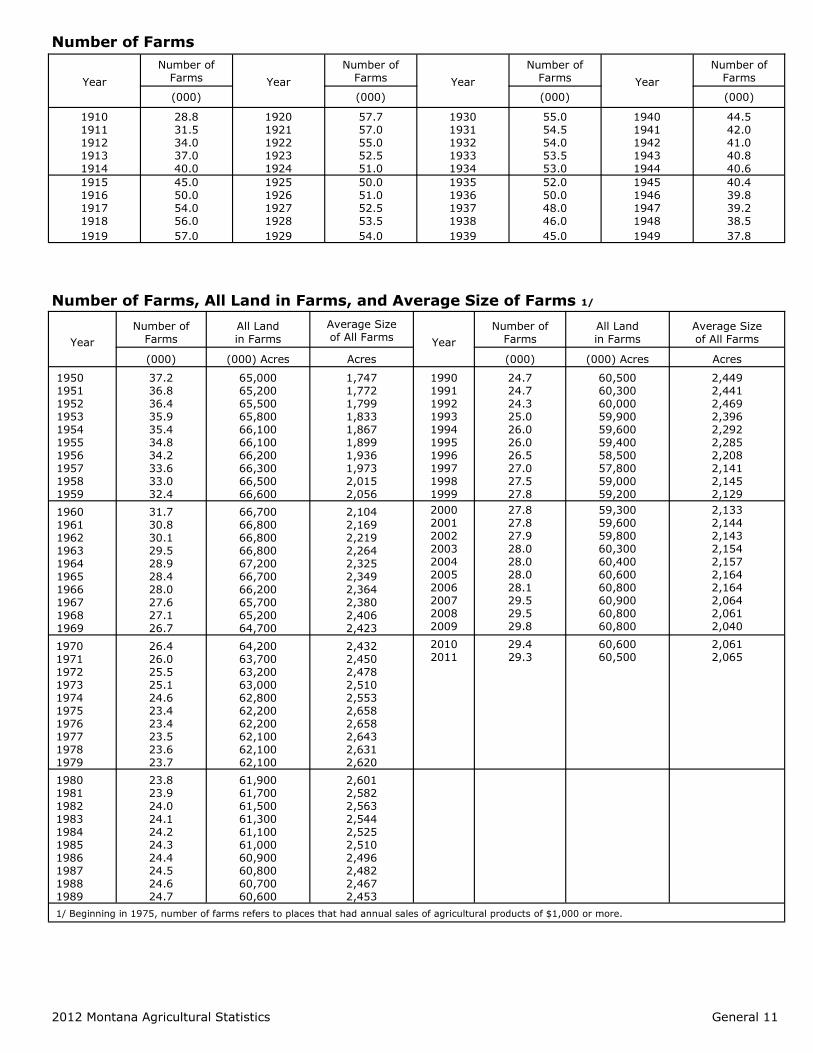
Number of Farms
Number of Farms, All Land in Farms, and Average Size of Farms 1/
Year
Number of Farms
All Land
in Farms
Average Size
of All Farms Year
Number of Farms
All Land
in Farms Average Size
of All Farms
(000) (000) Acres Acres (000) (000) Acres Acres
1950
1951
1952
1953
1954
1955
1956
1957
1958
1959
37.2
36.8
36.4
35.9
35.4
34.8
34.2
33.6
33.0
32.4
65,000
65,200
65,500
65,800
66,100
66,100
66,200
66,300
66,500
66,600
1,747
1,772
1,799
1,833
1,867
1,899
1,936
1,973
2,015
2,056
1990
1991
1992
1993
1994
1995
1996
1997
1998
1999
24.7
24.7
24.3
25.0
26.0
26.0
26.5
27.0
27.5
27.8
60,500
60,300
60,000
59,900
59,600
59,400
58,500
57,800
59,000
59,200
2,449
2,441
2,469
2,396
2,292
2,285
2,208
2,141
2,145
2,129
1960
1961
1962
1963
1964
1965
1966
1967
1968
1969
31.7
30.8
30.1
29.5
28.9
28.4
28.0
27.6
27.1
26.7
66,700
66,800
66,800
66,800
67,200
66,700
66,200
65,700
65,200
64,700
2,104
2,169
2,219
2,264
2,325
2,349
2,364
2,380
2,406
2,423
2000
2001
2002
2003
2004
2005
2006
2007
2008
2009
27.8
27.8
27.9
28.0
28.0
28.0
28.1
29.5
29.5
29.8
59,300
59,600
59,800
60,300
60,400
60,600
60,800
60,900
60,800
60,800
2,133
2,144
2,143
2,154
2,157
2,164
2,164
2,064
2,061
2,040
1970
1971
1972
1973
1974
1975
1976
1977
1978
1979
26.4
26.0
25.5
25.1
24.6
23.4
23.4
23.5
23.6
23.7
64,200
63,700
63,200
63,000
62,800
62,200
62,200
62,100
62,100
62,100
2,432
2,450
2,478
2,510
2,553
2,658
2,658
2,643
2,631
2,620
2010
2011
29.4
29.3
60,600
60,500
2,061
2,065
1980
1981
1982
1983
1984
1985
1986
1987
1988
1989
23.8
23.9
24.0
24.1
24.2
24.3
24.4
24.5
24.6
24.7
61,900
61,700
61,500
61,300
61,100
61,000
60,900
60,800
60,700
60,600
2,601
2,582
2,563
2,544
2,525
2,510
2,496
2,482
2,467
2,453
1/ Beginning in 1975, number of farms refers to places that had annual sales of agricultural products of $1,000 or more.
Year
Number of Farms Year
Number of Farms Year
Number of Farms Year
Number of Farms
(000) (000) (000) (000)
1910
1911
1912
1913
1914
28.8
31.5
34.0
37.0
40.0
1920
1921
1922
1923
1924
57.7
57.0
55.0
52.5
51.0
1930
1931
1932
1933
1934
55.0
54.5
54.0
53.5
53.0
1940
1941
1942
1943
1944
44.5
42.0
41.0
40.8
40.6
1915
1916
1917
1918
1919
45.0
50.0
54.0
56.0
57.0
1925
1926
1927
1928
1929
50.0
51.0
52.5
53.5
54.0
1935
1936
1937
1938
1939
52.0
50.0
48.0
46.0
45.0
1945
1946
1947
1948
1949
40.4
39.8
39.2
38.5
37.8
General 12 2012 Montana Agricultural Statistics
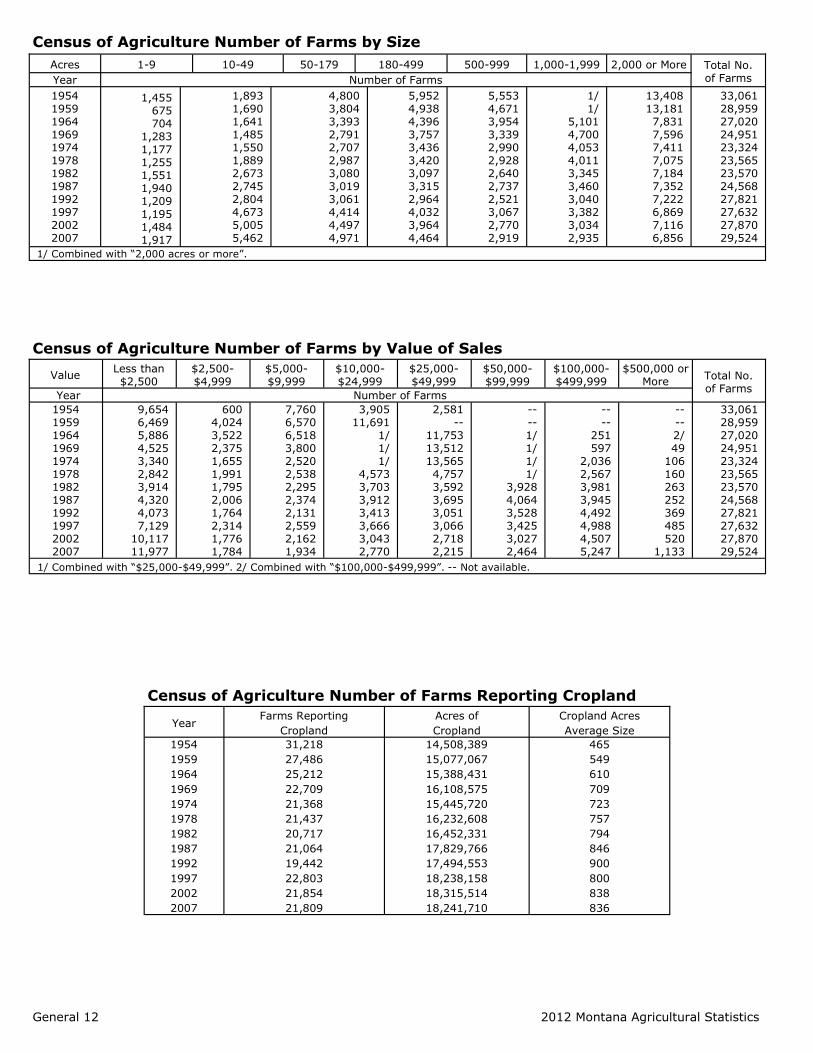
Census of Agriculture Number of Farms by Size
Census of Agriculture Number of Farms by Value of Sales
Census of Agriculture Number of Farms Reporting Cropland
Year Farms Reporting
Cropland
Acres of Cropland
Cropland Acres Average Size
1954 1959 1964 1969 1974 1978 1982 1987 1992 1997 2002 2007
31,218 27,486 25,212 22,709 21,368 21,437 20,717 21,064 19,442 22,803 21,854 21,809
14,508,389 15,077,067 15,388,431 16,108,575 15,445,720 16,232,608 16,452,331 17,829,766 17,494,553 18,238,158 18,315,514 18,241,710
465 549 610 709 723 757 794 846 900 800 838 836
Value Less than $2,500
$2,500-$4,999
$5,000-$9,999
$10,000-$24,999
$25,000-$49,999
$50,000-$99,999
$100,000-$499,999
$500,000 or More
Total No. of Farms
Year Number of Farms
1954 1959 1964 1969 1974 1978 1982 1987 1992 1997 2002 2007
9,654 6,469 5,886 4,525 3,340 2,842 3,914 4,320 4,073 7,129
10,117 11,977
600 4,024 3,522 2,375 1,655 1,991 1,795 2,006 1,764 2,314 1,776 1,784
7,760 6,570 6,518 3,800 2,520 2,538 2,295 2,374 2,131 2,559 2,162 1,934
3,905 11,691
1/ 1/ 1/
4,573 3,703 3,912 3,413 3,666 3,043 2,770
2,581 --
11,753 13,512 13,565 4,757 3,592 3,695 3,051 3,066 2,718 2,215
-- -- 1/ 1/ 1/ 1/
3,928 4,064 3,528 3,425 3,027 2,464
-- --
251 597
2,036 2,567 3,981 3,945 4,492 4,988 4,507 5,247
-- -- 2/ 49
106 160 263 252 369 485 520
1,133
33,061 28,959 27,020 24,951 23,324 23,565 23,570 24,568 27,821 27,632 27,870 29,524
1/ Combined with “$25,000-$49,999”. 2/ Combined with “$100,000-$499,999”. -- Not available.
Acres 1-9 10-49 50-179 180-499 500-999 1,000-1,999 2,000 or More Total No. of Farms Year Number of Farms
1954 1959 1964 1969 1974 1978 1982 1987 1992 1997 2002 2007
1,455 675 704
1,283 1,177 1,255 1,551 1,940 1,209 1,195 1,484 1,917
1,893 1,690 1,641 1,485 1,550 1,889 2,673 2,745 2,804 4,673 5,005 5,462
4,800 3,804 3,393 2,791 2,707 2,987 3,080 3,019 3,061 4,414 4,497 4,971
5,952 4,938 4,396 3,757 3,436 3,420 3,097 3,315 2,964 4,032 3,964 4,464
5,553 4,671 3,954 3,339 2,990 2,928 2,640 2,737 2,521 3,067 2,770 2,919
1/ 1/
5,101 4,700 4,053 4,011 3,345 3,460 3,040 3,382 3,034 2,935
13,408 13,181 7,831 7,596 7,411 7,075 7,184 7,352 7,222 6,869 7,116 6,856
33,061 28,959 27,020 24,951 23,324 23,565 23,570 24,568 27,821 27,632 27,870 29,524
1/ Combined with “2,000 acres or more”.
2012 Montana Agricultural Statistics General 13
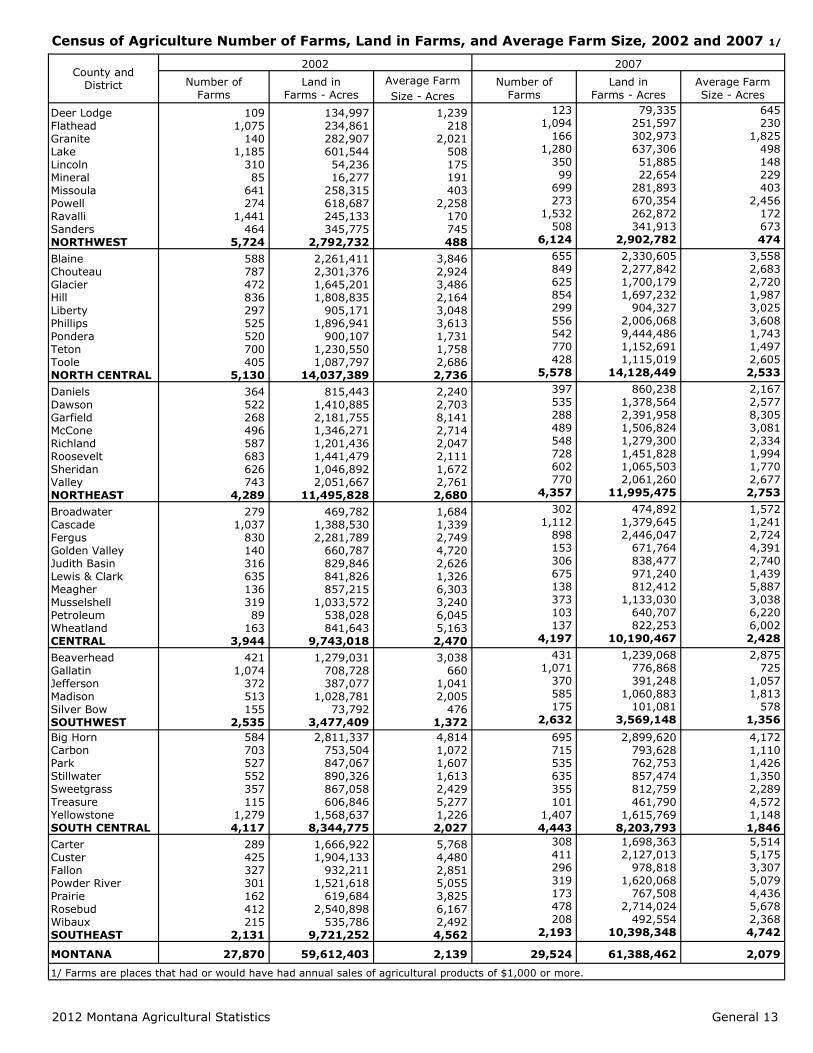
Census of Agriculture Number of Farms, Land in Farms, and Average Farm Size, 2002 and 2007 1/
County and District
2002 2007
Number of Farms
Land in Farms - Acres
Average Farm
Size - Acres
Number of Farms
Land in Farms - Acres
Average Farm Size - Acres
Deer Lodge Flathead Granite Lake Lincoln Mineral Missoula Powell Ravalli Sanders NORTHWEST
109 1,075
140 1,185
310 85
641 274
1,441 464
5,724
134,997 234,861 282,907 601,544 54,236 16,277
258,315 618,687 245,133 345,775
2,792,732
1,239 218
2,021 508 175 191 403
2,258 170 745 488
123 1,094
166 1,280
350 99
699 273
1,532 508
6,124
79,335 251,597 302,973 637,306 51,885 22,654
281,893 670,354 262,872 341,913
2,902,782
645 230
1,825 498 148 229 403
2,456 172 673 474
Blaine Chouteau Glacier Hill Liberty Phillips Pondera Teton Toole NORTH CENTRAL
588 787 472 836 297 525 520 700 405
5,130
2,261,411 2,301,376 1,645,201 1,808,835
905,171 1,896,941
900,107 1,230,550 1,087,797
14,037,389
3,846 2,924 3,486 2,164 3,048 3,613 1,731 1,758 2,686 2,736
655 849 625 854 299 556 542 770 428
5,578
2,330,605 2,277,842 1,700,179 1,697,232
904,327 2,006,068 9,444,486 1,152,691 1,115,019
14,128,449
3,558 2,683 2,720 1,987 3,025 3,608 1,743 1,497 2,605 2,533
Daniels Dawson Garfield McCone Richland Roosevelt Sheridan Valley NORTHEAST
364 522 268 496 587 683 626 743
4,289
815,443 1,410,885 2,181,755 1,346,271 1,201,436 1,441,479 1,046,892 2,051,667
11,495,828
2,240 2,703 8,141 2,714 2,047 2,111 1,672 2,761 2,680
397 535 288 489 548 728 602 770
4,357
860,238 1,378,564 2,391,958 1,506,824 1,279,300 1,451,828 1,065,503 2,061,260
11,995,475
2,167 2,577 8,305 3,081 2,334 1,994 1,770 2,677 2,753
Broadwater Cascade Fergus Golden Valley Judith Basin Lewis & Clark Meagher Musselshell Petroleum Wheatland CENTRAL
279 1,037
830 140 316 635 136 319 89
163 3,944
469,782 1,388,530 2,281,789
660,787 829,846 841,826 857,215
1,033,572 538,028 841,643
9,743,018
1,684 1,339 2,749 4,720 2,626 1,326 6,303 3,240 6,045 5,163 2,470
302 1,112
898 153 306 675 138 373 103 137
4,197
474,892 1,379,645 2,446,047
671,764 838,477 971,240 812,412
1,133,030 640,707 822,253
10,190,467
1,572 1,241 2,724 4,391 2,740 1,439 5,887 3,038 6,220 6,002 2,428
Beaverhead Gallatin Jefferson Madison Silver Bow SOUTHWEST
421 1,074
372 513 155
2,535
1,279,031 708,728 387,077
1,028,781 73,792
3,477,409
3,038 660
1,041 2,005
476 1,372
431 1,071
370 585 175
2,632
1,239,068 776,868 391,248
1,060,883 101,081
3,569,148
2,875 725
1,057 1,813
578 1,356
Big Horn Carbon Park Stillwater Sweetgrass Treasure Yellowstone SOUTH CENTRAL
584 703 527 552 357 115
1,279 4,117
2,811,337 753,504 847,067 890,326 867,058 606,846
1,568,637 8,344,775
4,814 1,072 1,607 1,613 2,429 5,277 1,226 2,027
695 715 535 635 355 101
1,407 4,443
2,899,620 793,628 762,753 857,474 812,759 461,790
1,615,769 8,203,793
4,172 1,110 1,426 1,350 2,289 4,572 1,148 1,846
Carter Custer Fallon Powder River Prairie Rosebud Wibaux SOUTHEAST
289 425 327 301 162 412 215
2,131
1,666,922 1,904,133
932,211 1,521,618
619,684 2,540,898
535,786 9,721,252
5,768 4,480 2,851 5,055 3,825 6,167 2,492 4,562
308 411 296 319 173 478 208
2,193
1,698,363 2,127,013
978,818 1,620,068
767,508 2,714,024
492,554 10,398,348
5,514 5,175 3,307 5,079 4,436 5,678 2,368 4,742
MONTANA 27,870 59,612,403 2,139 29,524 61,388,462 2,079
1/ Farms are places that had or would have had annual sales of agricultural products of $1,000 or more.
Economic 14 2012 Montana Agricultural Statistics
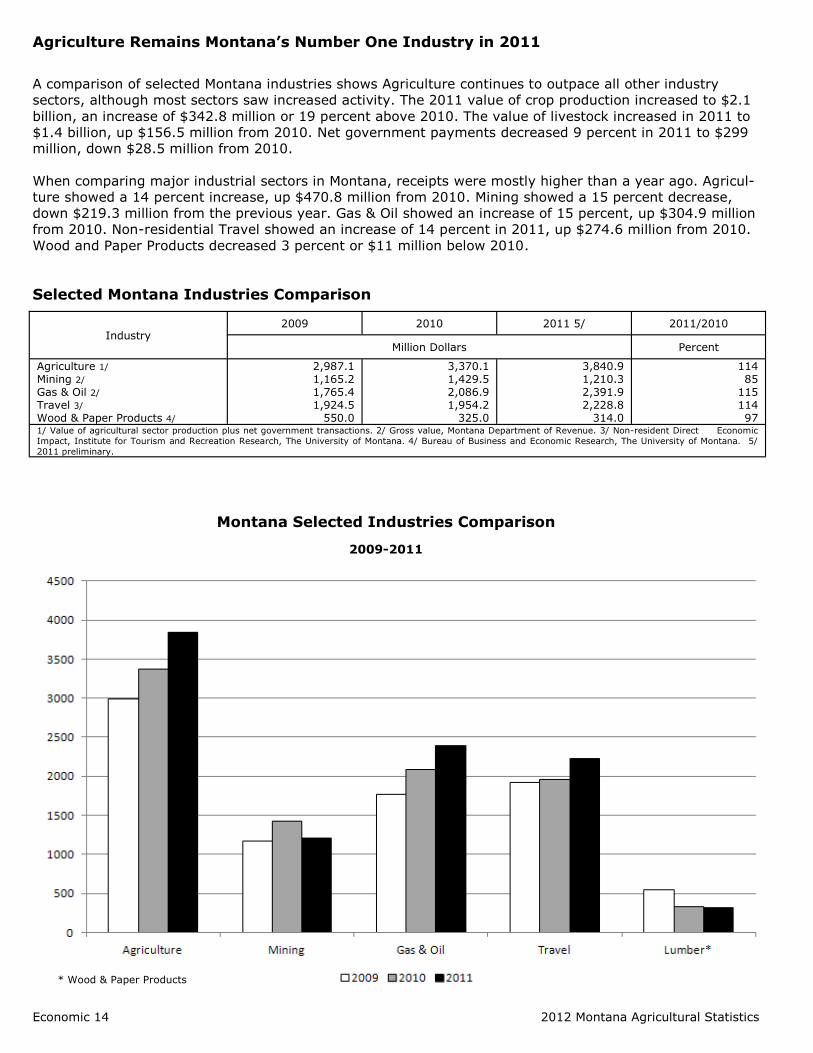
Agriculture Remains Montana’s Number One Industry in 2011
A comparison of selected Montana industries shows Agriculture continues to outpace all other industry
sectors, although most sectors saw increased activity. The 2011 value of crop production increased to $2.1
billion, an increase of $342.8 million or 19 percent above 2010. The value of livestock increased in 2011 to
$1.4 billion, up $156.5 million from 2010. Net government payments decreased 9 percent in 2011 to $299
million, down $28.5 million from 2010.
When comparing major industrial sectors in Montana, receipts were mostly higher than a year ago. Agricul-
ture showed a 14 percent increase, up $470.8 million from 2010. Mining showed a 15 percent decrease,
down $219.3 million from the previous year. Gas & Oil showed an increase of 15 percent, up $304.9 million
from 2010. Non-residential Travel showed an increase of 14 percent in 2011, up $274.6 million from 2010.
Wood and Paper Products decreased 3 percent or $11 million below 2010.
Selected Montana Industries Comparison
Industry 2009 2010 2011 5/ 2011/2010
Million Dollars Percent
Agriculture 1/
Mining 2/
Gas & Oil 2/
Travel 3/
Wood & Paper Products 4/
2,987.1
1,165.2
1,765.4
1,924.5
550.0
3,370.1
1,429.5
2,086.9
1,954.2
325.0
3,840.9 1,210.3 2,391.9 2,228.8
314.0
114 85
115 114 97
1/ Value of agricultural sector production plus net government transactions. 2/ Gross value, Montana Department of Revenue. 3/ Non-resident Direct Economic
Impact, Institute for Tourism and Recreation Research, The University of Montana. 4/ Bureau of Business and Economic Research, The University of Montana. 5/
2011 preliminary.
Montana Selected Industries Comparison
2009-2011
* Wood & Paper Products
2012 Montana Agricultural Statistics Economic 15
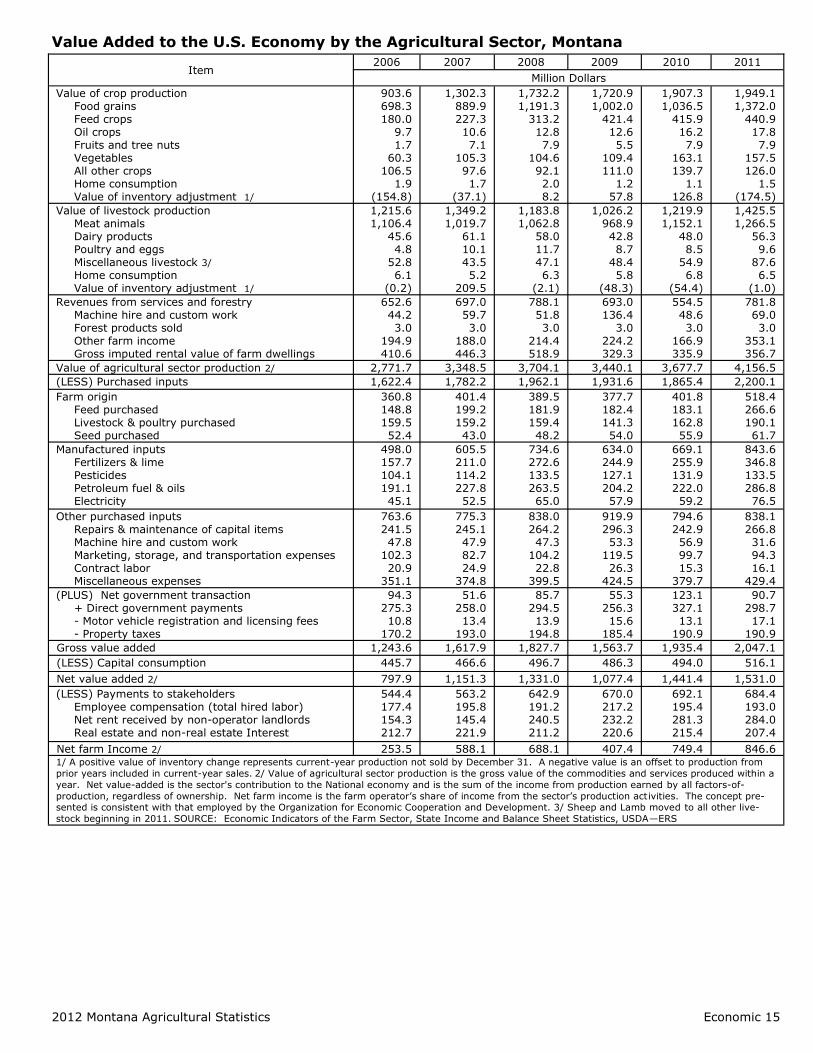
Value Added to the U.S. Economy by the Agricultural Sector, Montana
Item 2006 2007 2008 2009 2010 2011
Million Dollars
Value of crop production Food grains Feed crops Oil crops Fruits and tree nuts Vegetables All other crops Home consumption Value of inventory adjustment 1/
903.6 698.3 180.0
9.7 1.7
60.3 106.5
1.9 (154.8)
1,302.3 889.9 227.3 10.6 7.1
105.3 97.6 1.7
(37.1)
1,732.2 1,191.3
313.2 12.8 7.9
104.6 92.1 2.0 8.2
1,720.9 1,002.0
421.4 12.6 5.5
109.4 111.0
1.2 57.8
1,907.3 1,036.5
415.9 16.2 7.9
163.1 139.7
1.1 126.8
1,949.1 1,372.0
440.9 17.8 7.9
157.5 126.0
1.5 (174.5)
Value of livestock production Meat animals Dairy products Poultry and eggs Miscellaneous livestock 3/
Home consumption Value of inventory adjustment 1/
1,215.6 1,106.4
45.6 4.8
52.8 6.1
(0.2)
1,349.2 1,019.7
61.1 10.1 43.5 5.2
209.5
1,183.8 1,062.8
58.0 11.7 47.1 6.3
(2.1)
1,026.2 968.9 42.8 8.7
48.4 5.8
(48.3)
1,219.9 1,152.1
48.0 8.5
54.9 6.8
(54.4)
1,425.5 1,266.5
56.3 9.6
87.6 6.5
(1.0)
Revenues from services and forestry Machine hire and custom work Forest products sold Other farm income Gross imputed rental value of farm dwellings
652.6 44.2 3.0
194.9 410.6
697.0 59.7 3.0
188.0 446.3
788.1 51.8 3.0
214.4 518.9
693.0 136.4
3.0 224.2 329.3
554.5 48.6 3.0
166.9 335.9
781.8 69.0 3.0
353.1 356.7
Value of agricultural sector production 2/ 2,771.7 3,348.5 3,704.1 3,440.1 3,677.7 4,156.5
(LESS) Purchased inputs 1,622.4 1,782.2 1,962.1 1,931.6 1,865.4 2,200.1
Farm origin Feed purchased Livestock & poultry purchased Seed purchased
360.8 148.8 159.5 52.4
401.4 199.2 159.2 43.0
389.5 181.9 159.4 48.2
377.7 182.4 141.3 54.0
401.8 183.1 162.8 55.9
518.4 266.6 190.1 61.7
Manufactured inputs Fertilizers & lime Pesticides Petroleum fuel & oils Electricity
498.0 157.7 104.1 191.1 45.1
605.5 211.0 114.2 227.8 52.5
734.6 272.6 133.5 263.5 65.0
634.0 244.9 127.1 204.2 57.9
669.1 255.9 131.9 222.0 59.2
843.6 346.8 133.5 286.8 76.5
Other purchased inputs Repairs & maintenance of capital items Machine hire and custom work Marketing, storage, and transportation expenses Contract labor Miscellaneous expenses
763.6 241.5 47.8
102.3 20.9
351.1
775.3 245.1 47.9 82.7 24.9
374.8
838.0 264.2 47.3
104.2 22.8
399.5
919.9 296.3 53.3
119.5 26.3
424.5
794.6 242.9 56.9 99.7 15.3
379.7
838.1 266.8 31.6 94.3 16.1
429.4
(PLUS) Net government transaction + Direct government payments - Motor vehicle registration and licensing fees - Property taxes
94.3 275.3 10.8
170.2
51.6 258.0 13.4
193.0
85.7 294.5 13.9
194.8
55.3 256.3 15.6
185.4
123.1 327.1 13.1
190.9
90.7 298.7 17.1
190.9
Gross value added 1,243.6 1,617.9 1,827.7 1,563.7 1,935.4 2,047.1
(LESS) Capital consumption 445.7 466.6 496.7 486.3 494.0 516.1
Net value added 2/ 797.9 1,151.3 1,331.0 1,077.4 1,441.4 1,531.0
(LESS) Payments to stakeholders Employee compensation (total hired labor) Net rent received by non-operator landlords Real estate and non-real estate Interest
544.4 177.4 154.3 212.7
563.2 195.8 145.4 221.9
642.9 191.2 240.5 211.2
670.0 217.2 232.2 220.6
692.1 195.4 281.3 215.4
684.4 193.0 284.0 207.4
Net farm Income 2/ 253.5 588.1 688.1 407.4 749.4 846.6 1/ A positive value of inventory change represents current-year production not sold by December 31. A negative value is an offset to production from
prior years included in current-year sales. 2/ Value of agricultural sector production is the gross value of the commodities and services produced within a
year. Net value-added is the sector's contribution to the National economy and is the sum of the income from production earned by all factors-of-
production, regardless of ownership. Net farm income is the farm operator’s share of income from the sector’s production act ivities. The concept pre-sented is consistent with that employed by the Organization for Economic Cooperation and Development. 3/ Sheep and Lamb moved to all other live-
stock beginning in 2011. SOURCE: Economic Indicators of the Farm Sector, State Income and Balance Sheet Statistics, USDA—ERS
Economic 16 2012 Montana Agricultural Statistics
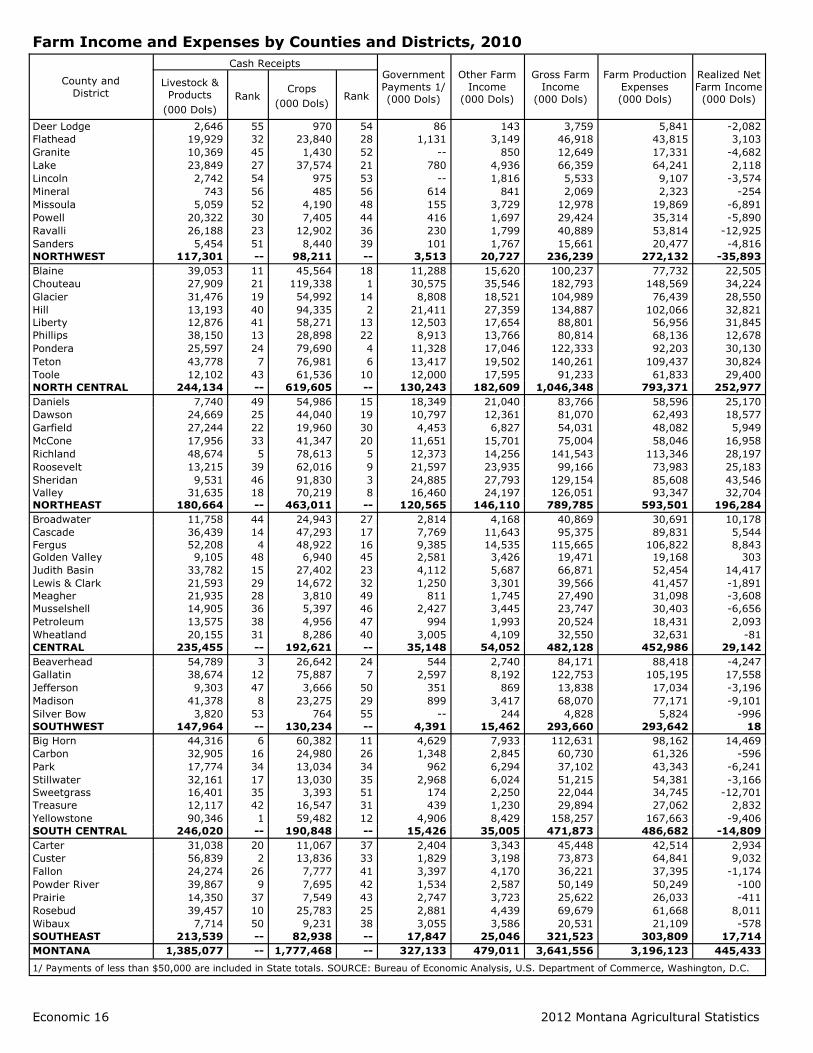
Farm Income and Expenses by Counties and Districts, 2010
County and
District
Cash Receipts Government
Payments 1/
(000 Dols)
Other Farm
Income
(000 Dols)
Gross Farm
Income
(000 Dols)
Farm Production
Expenses
(000 Dols)
Realized Net
Farm Income
(000 Dols)
Livestock &
Products
(000 Dols)
Rank Crops
(000 Dols) Rank
Deer Lodge 2,646 55 970 54 86 143 3,759 5,841 -2,082
Flathead 19,929 32 23,840 28 1,131 3,149 46,918 43,815 3,103
Granite 10,369 45 1,430 52 -- 850 12,649 17,331 -4,682
Lake 23,849 27 37,574 21 780 4,936 66,359 64,241 2,118
Lincoln 2,742 54 975 53 -- 1,816 5,533 9,107 -3,574
Mineral 743 56 485 56 614 841 2,069 2,323 -254
Missoula 5,059 52 4,190 48 155 3,729 12,978 19,869 -6,891
Powell 20,322 30 7,405 44 416 1,697 29,424 35,314 -5,890
Ravalli 26,188 23 12,902 36 230 1,799 40,889 53,814 -12,925
Sanders 5,454 51 8,440 39 101 1,767 15,661 20,477 -4,816
NORTHWEST 117,301 -- 98,211 -- 3,513 20,727 236,239 272,132 -35,893
Blaine 39,053 11 45,564 18 11,288 15,620 100,237 77,732 22,505
Chouteau 27,909 21 119,338 1 30,575 35,546 182,793 148,569 34,224
Glacier 31,476 19 54,992 14 8,808 18,521 104,989 76,439 28,550
Hill 13,193 40 94,335 2 21,411 27,359 134,887 102,066 32,821
Liberty 12,876 41 58,271 13 12,503 17,654 88,801 56,956 31,845
Phillips 38,150 13 28,898 22 8,913 13,766 80,814 68,136 12,678
Pondera 25,597 24 79,690 4 11,328 17,046 122,333 92,203 30,130
Teton 43,778 7 76,981 6 13,417 19,502 140,261 109,437 30,824
Toole 12,102 43 61,536 10 12,000 17,595 91,233 61,833 29,400
NORTH CENTRAL 244,134 -- 619,605 -- 130,243 182,609 1,046,348 793,371 252,977
Daniels 7,740 49 54,986 15 18,349 21,040 83,766 58,596 25,170
Dawson 24,669 25 44,040 19 10,797 12,361 81,070 62,493 18,577
Garfield 27,244 22 19,960 30 4,453 6,827 54,031 48,082 5,949
McCone 17,956 33 41,347 20 11,651 15,701 75,004 58,046 16,958
Richland 48,674 5 78,613 5 12,373 14,256 141,543 113,346 28,197
Roosevelt 13,215 39 62,016 9 21,597 23,935 99,166 73,983 25,183
Sheridan 9,531 46 91,830 3 24,885 27,793 129,154 85,608 43,546
Valley 31,635 18 70,219 8 16,460 24,197 126,051 93,347 32,704
NORTHEAST 180,664 -- 463,011 -- 120,565 146,110 789,785 593,501 196,284
Broadwater 11,758 44 24,943 27 2,814 4,168 40,869 30,691 10,178
Cascade 36,439 14 47,293 17 7,769 11,643 95,375 89,831 5,544
Fergus 52,208 4 48,922 16 9,385 14,535 115,665 106,822 8,843
Golden Valley 9,105 48 6,940 45 2,581 3,426 19,471 19,168 303
Judith Basin 33,782 15 27,402 23 4,112 5,687 66,871 52,454 14,417
Lewis & Clark 21,593 29 14,672 32 1,250 3,301 39,566 41,457 -1,891
Meagher 21,935 28 3,810 49 811 1,745 27,490 31,098 -3,608
Musselshell 14,905 36 5,397 46 2,427 3,445 23,747 30,403 -6,656
Petroleum 13,575 38 4,956 47 994 1,993 20,524 18,431 2,093
Wheatland 20,155 31 8,286 40 3,005 4,109 32,550 32,631 -81
CENTRAL 235,455 -- 192,621 -- 35,148 54,052 482,128 452,986 29,142
Beaverhead 54,789 3 26,642 24 544 2,740 84,171 88,418 -4,247
Gallatin 38,674 12 75,887 7 2,597 8,192 122,753 105,195 17,558
Jefferson 9,303 47 3,666 50 351 869 13,838 17,034 -3,196
Madison 41,378 8 23,275 29 899 3,417 68,070 77,171 -9,101
Silver Bow 3,820 53 764 55 -- 244 4,828 5,824 -996
SOUTHWEST 147,964 -- 130,234 -- 4,391 15,462 293,660 293,642 18
Big Horn 44,316 6 60,382 11 4,629 7,933 112,631 98,162 14,469
Carbon 32,905 16 24,980 26 1,348 2,845 60,730 61,326 -596
Park 17,774 34 13,034 34 962 6,294 37,102 43,343 -6,241
Stillwater 32,161 17 13,030 35 2,968 6,024 51,215 54,381 -3,166
Sweetgrass 16,401 35 3,393 51 174 2,250 22,044 34,745 -12,701
Treasure 12,117 42 16,547 31 439 1,230 29,894 27,062 2,832
Yellowstone 90,346 1 59,482 12 4,906 8,429 158,257 167,663 -9,406
SOUTH CENTRAL 246,020 -- 190,848 -- 15,426 35,005 471,873 486,682 -14,809
Carter 31,038 20 11,067 37 2,404 3,343 45,448 42,514 2,934
Custer 56,839 2 13,836 33 1,829 3,198 73,873 64,841 9,032
Fallon 24,274 26 7,777 41 3,397 4,170 36,221 37,395 -1,174
Powder River 39,867 9 7,695 42 1,534 2,587 50,149 50,249 -100
Prairie 14,350 37 7,549 43 2,747 3,723 25,622 26,033 -411
Rosebud 39,457 10 25,783 25 2,881 4,439 69,679 61,668 8,011
Wibaux 7,714 50 9,231 38 3,055 3,586 20,531 21,109 -578
SOUTHEAST 213,539 -- 82,938 -- 17,847 25,046 321,523 303,809 17,714
MONTANA 1,385,077 -- 1,777,468 -- 327,133 479,011 3,641,556 3,196,123 445,433
1/ Payments of less than $50,000 are included in State totals. SOURCE: Bureau of Economic Analysis, U.S. Department of Commerce, Washington, D.C.

2012 Montana Agricultural Statistics Economic 17
Cash Rent Dollars per Acre by Counties and Districts, Montana, 2009-2010
County and District
IRRIGATED NON-IRRIGATED PASTURE
2009 2010 2009 2010 2009 2010
Dollars per Acre Dollars per Acre Dollars per Acre
Deer Lodge -- -- -- -- -- --
Flathead 64.00 64.00 30.50 -- 8.40 3.30
Granite -- -- -- -- -- --
Lake 78.00 73.00 -- -- 10.00 19.00
Lincoln -- -- -- -- -- 3.70
Mineral -- -- -- -- -- --
Missoula -- 25.50 -- -- 16.50 18.00
Powell -- 55.50 -- -- -- --
Ravalli 62.50 62.00 -- -- 24.00 18.00
Sanders 20.00 -- -- -- 8.40 4.00 Other 42.50 58.00 22.00 -- 5.50 8.00 NORTHWEST 63.00 63.00 24.50 -- 9.30 9.80
Blaine 26.00 46.00 21.50 20.50 4.70 5.30
Chouteau -- -- 34.50 37.00 6.40 7.80
Glacier 21.00 21.00 18.50 19.00 3.40 3.40
Hill -- -- 21.50 19.00 -- 5.10
Liberty -- -- 15.00 18.00 5.20 6.00
Phillips -- 45.50 18.50 18.00 2.80 4.30
Pondera 43.00 63.00 33.50 37.50 6.60 4.00
Teton 77.00 77.00 33.50 31.00 -- 6.50
Toole -- -- 17.50 22.00 2.70 2.20 Other 28.00 60.50 -- -- 3.20 -- NORTH CENTRAL 40.50 60.00 23.50 25.00 3.60 5.10
Daniels -- -- 20.50 21.00 4.20 4.80
Dawson 122.00 122.00 16.50 18.00 4.20 5.30
Garfield -- -- 17.00 15.00 5.40 --
McCone -- -- 19.50 19.50 4.20 --
Richland 125.00 145.00 18.00 18.00 4.10 4.20
Roosevelt -- -- 19.00 20.50 3.80 4.00
Sheridan -- -- 27.00 24.50 4.60 5.10
Valley 39.50 39.50 19.00 20.50 3.60 5.90
Other 27.00 31.00 -- -- -- 4.40 NORTHEAST 86.00 117.00 21.00 20.50 4.60 4.60
Broadwater 78.50 98.50 -- -- -- 3.60
Cascade 65.00 85.00 17.50 25.50 7.20 5.50
Fergus -- -- 22.00 23.00 9.20 7.00
Golden Valley -- -- 15.50 -- 2.20 --
Judith Basin -- -- 26.00 26.50 10.00 8.40
Lewis & Clark -- 50.50 -- -- -- --
Meagher -- -- -- -- 6.90 5.10
Musselshell -- -- 20.00 19.00 6.80 3.50
Petroleum -- -- -- -- 3.80 3.20
Wheatland -- -- 11.50 -- 7.90 4.60
Other 56.00 70.50 17.50 16.00 4.30 2.70 CENTRAL 63.00 85.00 21.50 23.50 6.70 5.00
Beaverhead 80.00 -- -- -- 8.00 9.00
Gallatin 98.00 118.00 -- -- 7.40 15.50
Jefferson -- -- -- -- 3.60 3.40
Madison 54.00 -- -- -- -- --
Silver Bow -- -- -- -- -- --
Other 81.00 73.50 20.00 -- 5.60 7.00
SOUTHWEST 77.00 89.50 20.00 -- 5.60 8.60
Big Horn 79.50 -- 23.00 18.00 3.80 4.00
Carbon 78.00 90.00 18.50 -- 6.70 5.70
Park -- -- -- -- -- --
Stillwater 70.50 70.00 18.50 17.50 5.50 5.20
Sweetgrass -- -- -- -- -- --
Treasure 129.00 134.00 -- -- -- 4.40
Yellowstone -- 92.50 -- -- 4.50 3.10
Other 75.00 81.00 16.00 16.00 3.90 4.60 SOUTH CENTRAL 94.50 101.00 18.50 17.50 4.20 4.20
Carter -- -- -- 17.50 5.30 5.70
Custer -- 77.50 -- -- 3.80 4.60
Fallon -- -- 13.00 13.00 6.90 6.20
Powder River -- -- -- 15.50 3.30 3.10
Prairie -- -- -- 16.50 2.90 3.80
Rosebud 66.00 80.00 -- -- 2.40 3.10
Wibaux -- -- 22.00 16.50 4.90 6.00 Other 78.00 79.50 12.00 17.00 -- -- SOUTHEAST 71.50 79.50 15.00 15.50 3.60 4.30
OTHER DISTRICTS -- -- -- 24.00 -- --
MONTANA 69.00 85.00 21.50 22.00 4.70 4.80
-- Counties that are combined into “other” counties/districts to avoid disclosure of individual information.
Economic 18 2012 Montana Agricultural Statistics
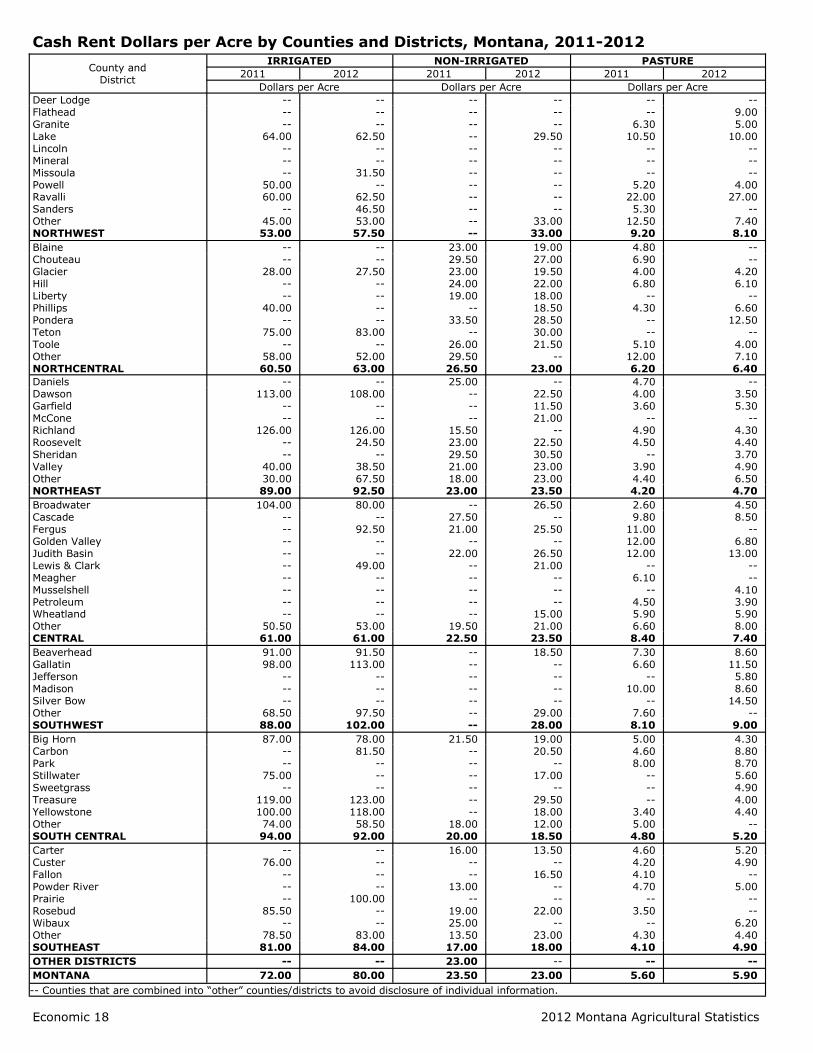
Cash Rent Dollars per Acre by Counties and Districts, Montana, 2011-2012
County and District
IRRIGATED NON-IRRIGATED PASTURE
2011 2012 2011 2012 2011 2012
Dollars per Acre Dollars per Acre Dollars per Acre
Deer Lodge -- -- -- -- -- -- Flathead -- -- -- -- -- 9.00 Granite -- -- -- -- 6.30 5.00 Lake 64.00 62.50 -- 29.50 10.50 10.00 Lincoln -- -- -- -- -- -- Mineral -- -- -- -- -- -- Missoula -- 31.50 -- -- -- -- Powell 50.00 -- -- -- 5.20 4.00 Ravalli 60.00 62.50 -- -- 22.00 27.00 Sanders -- 46.50 -- -- 5.30 -- Other 45.00 53.00 -- 33.00 12.50 7.40 NORTHWEST 53.00 57.50 -- 33.00 9.20 8.10
Blaine -- -- 23.00 19.00 4.80 -- Chouteau -- -- 29.50 27.00 6.90 -- Glacier 28.00 27.50 23.00 19.50 4.00 4.20 Hill -- -- 24.00 22.00 6.80 6.10 Liberty -- -- 19.00 18.00 -- -- Phillips 40.00 -- -- 18.50 4.30 6.60 Pondera -- -- 33.50 28.50 -- 12.50 Teton 75.00 83.00 -- 30.00 -- -- Toole -- -- 26.00 21.50 5.10 4.00 Other 58.00 52.00 29.50 -- 12.00 7.10 NORTHCENTRAL 60.50 63.00 26.50 23.00 6.20 6.40
Daniels -- -- 25.00 -- 4.70 -- Dawson 113.00 108.00 -- 22.50 4.00 3.50 Garfield -- -- -- 11.50 3.60 5.30 McCone -- -- -- 21.00 -- -- Richland 126.00 126.00 15.50 -- 4.90 4.30 Roosevelt -- 24.50 23.00 22.50 4.50 4.40 Sheridan -- -- 29.50 30.50 -- 3.70 Valley 40.00 38.50 21.00 23.00 3.90 4.90 Other 30.00 67.50 18.00 23.00 4.40 6.50 NORTHEAST 89.00 92.50 23.00 23.50 4.20 4.70
Broadwater 104.00 80.00 -- 26.50 2.60 4.50 Cascade -- -- 27.50 -- 9.80 8.50 Fergus -- 92.50 21.00 25.50 11.00 -- Golden Valley -- -- -- -- 12.00 6.80 Judith Basin -- -- 22.00 26.50 12.00 13.00 Lewis & Clark -- 49.00 -- 21.00 -- -- Meagher -- -- -- -- 6.10 -- Musselshell -- -- -- -- -- 4.10 Petroleum -- -- -- -- 4.50 3.90 Wheatland -- -- -- 15.00 5.90 5.90 Other 50.50 53.00 19.50 21.00 6.60 8.00 CENTRAL 61.00 61.00 22.50 23.50 8.40 7.40
Beaverhead 91.00 91.50 -- 18.50 7.30 8.60 Gallatin 98.00 113.00 -- -- 6.60 11.50 Jefferson -- -- -- -- -- 5.80 Madison -- -- -- -- 10.00 8.60 Silver Bow -- -- -- -- -- 14.50 Other 68.50 97.50 -- 29.00 7.60 -- SOUTHWEST 88.00 102.00 -- 28.00 8.10 9.00
Big Horn 87.00 78.00 21.50 19.00 5.00 4.30 Carbon -- 81.50 -- 20.50 4.60 8.80 Park -- -- -- -- 8.00 8.70 Stillwater 75.00 -- -- 17.00 -- 5.60 Sweetgrass -- -- -- -- -- 4.90 Treasure 119.00 123.00 -- 29.50 -- 4.00 Yellowstone 100.00 118.00 -- 18.00 3.40 4.40 Other 74.00 58.50 18.00 12.00 5.00 -- SOUTH CENTRAL 94.00 92.00 20.00 18.50 4.80 5.20
Carter -- -- 16.00 13.50 4.60 5.20 Custer 76.00 -- -- -- 4.20 4.90 Fallon -- -- -- 16.50 4.10 -- Powder River -- -- 13.00 -- 4.70 5.00 Prairie -- 100.00 -- -- -- -- Rosebud 85.50 -- 19.00 22.00 3.50 -- Wibaux -- -- 25.00 -- -- 6.20 Other 78.50 83.00 13.50 23.00 4.30 4.40 SOUTHEAST 81.00 84.00 17.00 18.00 4.10 4.90
OTHER DISTRICTS -- -- 23.00 -- -- --
MONTANA 72.00 80.00 23.50 23.00 5.60 5.90
-- Counties that are combined into “other” counties/districts to avoid disclosure of individual information.
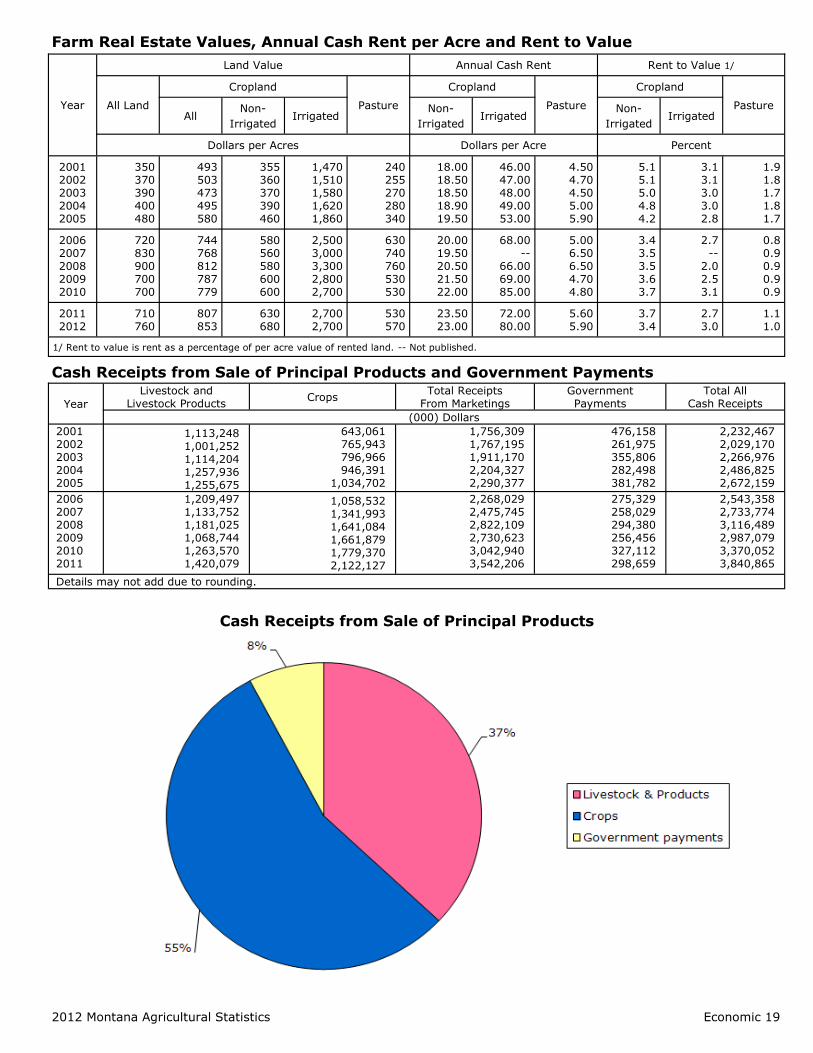
Farm Real Estate Values, Annual Cash Rent per Acre and Rent to Value
Cash Receipts from Sale of Principal Products and Government Payments
2012 Montana Agricultural Statistics Economic 19
Cash Receipts from Sale of Principal Products
Year
Livestock and
Livestock Products Crops
Total Receipts
From Marketings Government Payments
Total All Cash Receipts
(000) Dollars
2001
2002
2003
2004
2005
1,113,248
1,001,252
1,114,204
1,257,936
1,255,675
643,061
765,943
796,966
946,391
1,034,702
1,756,309
1,767,195
1,911,170
2,204,327
2,290,377
476,158
261,975
355,806
282,498
381,782
2,232,467
2,029,170
2,266,976
2,486,825
2,672,159
2006
2007
2008
2009
2010 2011
1,209,497
1,133,752
1,181,025
1,068,744
1,263,570 1,420,079
1,058,532
1,341,993
1,641,084
1,661,879
1,779,370 2,122,127
2,268,029
2,475,745
2,822,109
2,730,623
3,042,940 3,542,206
275,329
258,029
294,380
256,456
327,112 298,659
2,543,358
2,733,774
3,116,489
2,987,079
3,370,052 3,840,865
Details may not add due to rounding.
Year
Land Value Annual Cash Rent Rent to Value 1/
All Land
Cropland
Pasture
Cropland
Pasture
Cropland
Pasture All
Non-
Irrigated Irrigated
Non-
Irrigated Irrigated
Non-
Irrigated Irrigated
Dollars per Acres Dollars per Acre Percent
2001 2002 2003 2004 2005
350 370 390 400 480
493 503 473 495 580
355 360 370 390 460
1,470 1,510 1,580 1,620 1,860
240 255 270 280 340
18.00 18.50 18.50 18.90 19.50
46.00 47.00 48.00 49.00 53.00
4.50 4.70 4.50 5.00 5.90
5.1 5.1 5.0 4.8 4.2
3.1 3.1 3.0 3.0 2.8
1.9 1.8 1.7 1.8 1.7
2006 2007 2008 2009 2010
720 830 900 700 700
744 768 812 787 779
580 560 580 600 600
2,500 3,000 3,300 2,800 2,700
630 740 760 530 530
20.00 19.50 20.50 21.50 22.00
68.00 --
66.00 69.00 85.00
5.00 6.50 6.50 4.70 4.80
3.4 3.5 3.5 3.6 3.7
2.7 --
2.0 2.5 3.1
0.8 0.9 0.9 0.9 0.9
2011 2012
710 760
807 853
630 680
2,700 2,700
530 570
23.50 23.00
72.00 80.00
5.60 5.90
3.7 3.4
2.7 3.0
1.1 1.0
1/ Rent to value is rent as a percentage of per acre value of rented land. -- Not published.
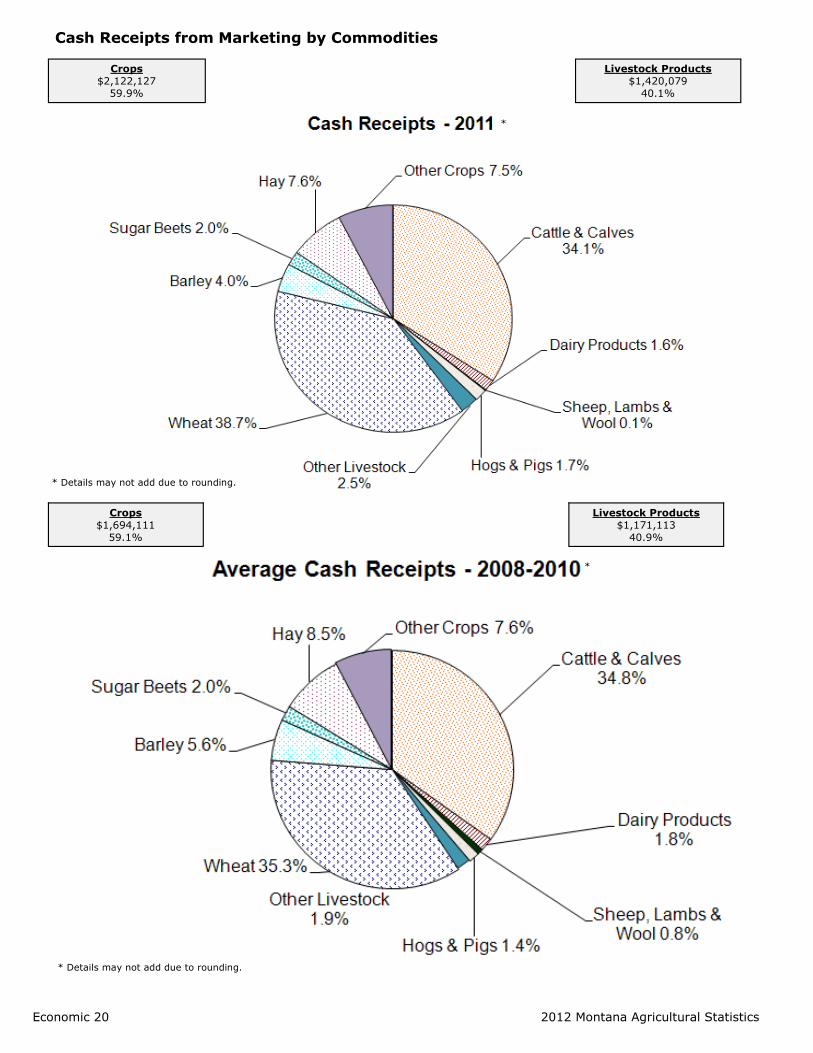
Economic 20 2012 Montana Agricultural Statistics
Crops
$1,694,111
59.1%
Livestock Products
$1,171,113
40.9%
Cash Receipts from Marketing by Commodities
Crops
$2,122,127
59.9%
Livestock Products
$1,420,079
40.1%
* Details may not add due to rounding.
*
*
* Details may not add due to rounding.

Cash Receipts From Marketing by Commodities
2012 Montana Agricultural Statistics Economic 21
Item 2008 2009 2010 2011
(000) Dols Percent (000) Dols Percent (000) Dols Percent (000) Dols Percent
Livestock and Products
Cattle and calves Dairy products Sheep and lambs Wool Hogs and pigs Chicken eggs Honey All other livestock 1/ Total Livestock and Products
1,003,050
57,950
17,692
3,010
42,834
9,567
12,851
29,690
1,181,025
35.5
2.1
0.6
0.1
1.5
0.3
0.5
1.1
41.8
912,972
42,778
19,400
2,365
36,502
6,890
14,921
29,626
1,068,744
33.4 1.6 0.7 0.1 1.3 0.3 0.5 1.1
39.1
1,084,644
47,996
20,700
3,200
46,771
6,619
18,356
31,453
1,263,570
35.6 1.6 0.7 0.1 1.5 0.2 0.6 1.0
41.5
1,207,605 56,317
-- 4,440
58,889 7,569
21,878 59,020
1,420,079
34.1 1.6
-- 0.1 1.7 0.2 0.6 1.7
40.1
Crops
Wheat Barley Sugar beets Hay Potatoes, fall Oil crops Oats Dry Peas Lentils Corn Cherries, Sweet All other crops 2/ Total Crops
994,512 163,679 41,808
239,918 30,502 12,958 3,029
36,807 21,219 18,976 3,958
58,970 1,641,084
35.2 5.8 1.5 8.5 1.1 0.5 0.1 1.3 0.8 0.7 0.1 2.1
58.2
1,002,033 147,830 53,453
257,790 30,852 12,618 1,085
25,431 43,547 14,681 1,567
70,817 1,661,879
36.7 5.4 2.0 9.4 1.1 0.5 0.1 0.9 1.6 0.5 0.1 2.6
60.9
1,036,524
167,394
80,256
230,219
33,248
16,200
2,691
37,798
80,280
15,557
4,026
75,048
1,779,370
34.1 5.5 2.6 7.6 1.1 0.5 0.1 1.2 2.6 0.5 0.1 2.5
58.5
1,372,012 143,093 71,168
270,704 38,494 17,814 2,891
39,299 67,653 24,215 4,068
71,909 2,122,127
38.7 4.0 2.0 7.6 1.1 0.5 0.1 1.1 1.9 0.7 0.1 2.0
59.9
All Commodities 3/ 2,822,109 100.0 2,730,623 100.0 3,042,940 100.0 3,542,206 100.0
1/ All other livestock includes horses/mules, poultry and products including chickens, turkeys & turkey eggs, bees, beeswax, rabbits, and mink. 2/ All
other field crops include fruits, vegetables, seeds, and greenhouse and nursery products. 3/ Details may not add to total because of rounding.
Economic 22 2012 Montana Agricultural Statistics
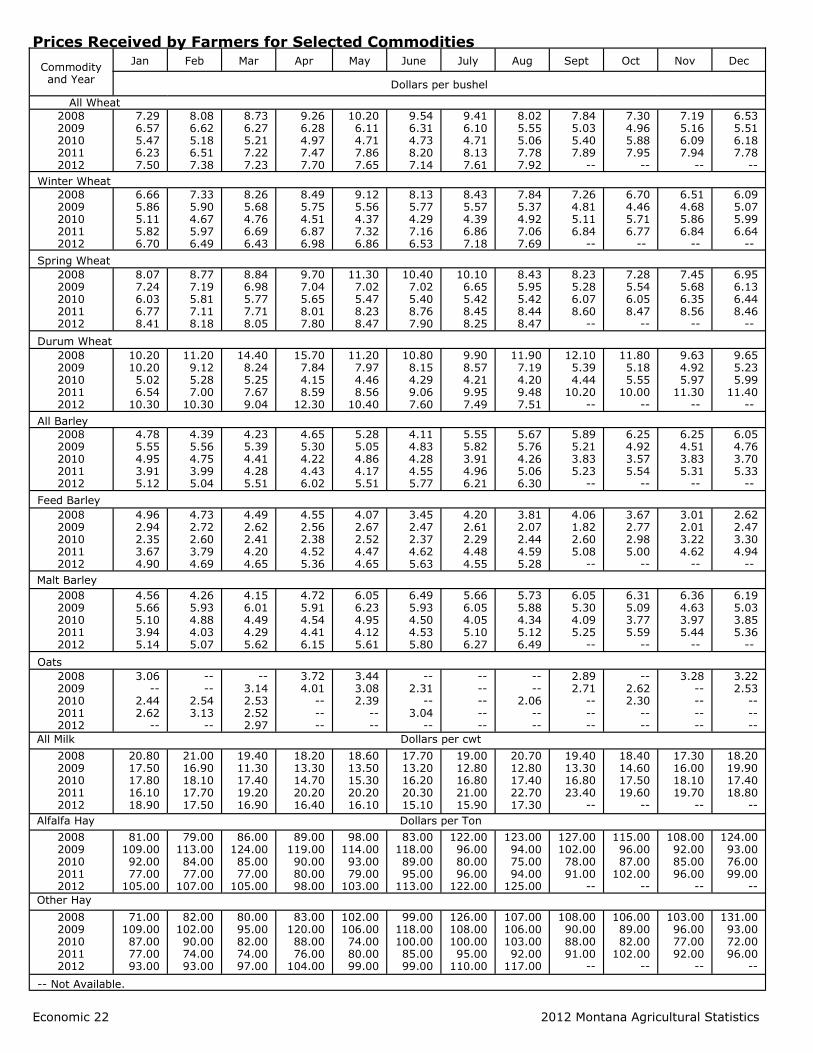
Prices Received by Farmers for Selected Commodities
Commodity and Year
Jan Feb Mar Apr May June July Aug Sept Oct Nov Dec
Dollars per bushel
All Wheat
2008 2009 2010 2011 2012
7.29 6.57 5.47 6.23 7.50
8.08 6.62 5.18 6.51 7.38
8.73 6.27 5.21 7.22 7.23
9.26 6.28 4.97 7.47 7.70
10.20 6.11 4.71 7.86 7.65
9.54 6.31 4.73 8.20 7.14
9.41 6.10 4.71 8.13 7.61
8.02 5.55 5.06 7.78 7.92
7.84 5.03 5.40 7.89
--
7.30 4.96 5.88 7.95
--
7.19 5.16 6.09
7.94 --
6.53 5.51 6.18
7.78 --
Winter Wheat
2008 2009 2010 2011 2012
6.66
5.86
5.11
5.82 6.70
7.33
5.90
4.67
5.97 6.49
8.26
5.68
4.76
6.69
6.43
8.49
5.75
4.51
6.87
6.98
9.12
5.56
4.37
7.32
6.86
8.13
5.77
4.29
7.16
6.53
8.43
5.57
4.39
6.86
7.18
7.84
5.37
4.92
7.06
7.69
7.26
4.81
5.11
6.84
--
6.70
4.46
5.71
6.77
--
6.51
4.68
5.86
6.84
--
6.09
5.07
5.99
6.64 --
Spring Wheat
2008 2009 2010 2011 2012
8.07 7.24 6.03 6.77 8.41
8.77 7.19 5.81 7.11 8.18
8.84 6.98 5.77 7.71 8.05
9.70 7.04 5.65 8.01 7.80
11.30 7.02 5.47 8.23 8.47
10.40 7.02 5.40 8.76 7.90
10.10 6.65 5.42 8.45 8.25
8.43 5.95 5.42 8.44 8.47
8.23 5.28 6.07 8.60
--
7.28 5.54 6.05 8.47
--
7.45 5.68 6.35 8.56
--
6.95 6.13 6.44 8.46
--
Durum Wheat
2008 2009 2010 2011 2012
10.20 10.20 5.02 6.54
10.30
11.20 9.12 5.28 7.00
10.30
14.40 8.24 5.25 7.67 9.04
15.70 7.84 4.15 8.59
12.30
11.20 7.97 4.46 8.56
10.40
10.80 8.15 4.29 9.06 7.60
9.90 8.57 4.21 9.95 7.49
11.90 7.19 4.20 9.48 7.51
12.10 5.39 4.44
10.20 --
11.80 5.18 5.55
10.00 --
9.63 4.92 5.97
11.30 --
9.65 5.23 5.99
11.40 --
All Barley
2008 2009 2010 2011 2012
4.78 5.55 4.95 3.91 5.12
4.39 5.56 4.75 3.99 5.04
4.23 5.39 4.41 4.28 5.51
4.65 5.30 4.22 4.43 6.02
5.28 5.05 4.86 4.17 5.51
4.11 4.83 4.28 4.55 5.77
5.55 5.82 3.91 4.96 6.21
5.67 5.76 4.26 5.06 6.30
5.89 5.21 3.83
5.23 --
6.25 4.92 3.57
5.54 --
6.25 4.51 3.83 5.31
--
6.05 4.76 3.70 5.33
--
Feed Barley
2008 2009 2010 2011 2012
4.96 2.94 2.35 3.67 4.90
4.73 2.72 2.60 3.79 4.69
4.49 2.62 2.41 4.20 4.65
4.55 2.56 2.38 4.52 5.36
4.07 2.67 2.52 4.47 4.65
3.45 2.47 2.37 4.62 5.63
4.20 2.61 2.29 4.48 4.55
3.81 2.07 2.44 4.59 5.28
4.06 1.82 2.60 5.08
--
3.67 2.77 2.98
5.00 --
3.01 2.01 3.22 4.62
--
2.62 2.47 3.30 4.94
--
Malt Barley
2008 2009 2010 2011 2012
4.56 5.66 5.10 3.94 5.14
4.26 5.93 4.88 4.03 5.07
4.15 6.01 4.49 4.29 5.62
4.72 5.91 4.54 4.41 6.15
6.05 6.23 4.95 4.12 5.61
6.49 5.93 4.50 4.53 5.80
5.66 6.05 4.05 5.10 6.27
5.73 5.88 4.34 5.12 6.49
6.05 5.30 4.09 5.25
--
6.31 5.09 3.77 5.59
--
6.36 4.63 3.97 5.44
--
6.19 5.03 3.85 5.36
--
Oats
2008 2009 2010 2011 2012
3.06 --
2.44 2.62
--
-- --
2.54 3.13
--
-- 3.14 2.53 2.52 2.97
3.72 4.01
-- -- --
3.44 3.08 2.39
-- --
-- 2.31
-- 3.04
--
-- -- -- -- --
-- --
2.06 -- --
2.89 2.71
-- -- --
-- 2.62 2.30
-- --
3.28 -- -- -- --
3.22 2.53
-- -- --
All Milk Dollars per cwt
2008 2009 2010 2011 2012
20.80 17.50 17.80 16.10 18.90
21.00 16.90 18.10 17.70 17.50
19.40 11.30 17.40 19.20 16.90
18.20 13.30 14.70 20.20 16.40
18.60 13.50 15.30 20.20 16.10
17.70 13.20 16.20 20.30 15.10
19.00 12.80 16.80 21.00 15.90
20.70 12.80 17.40 22.70 17.30
19.40 13.30 16.80 23.40
--
18.40 14.60 17.50 19.60
--
17.30 16.00 18.10 19.70
--
18.20 19.90 17.40 18.80
--
Alfalfa Hay Dollars per Ton
2008 2009 2010 2011 2012
81.00 109.00 92.00 77.00
105.00
79.00 113.00 84.00 77.00
107.00
86.00 124.00 85.00 77.00
105.00
89.00 119.00 90.00 80.00 98.00
98.00 114.00 93.00 79.00
103.00
83.00 118.00 89.00 95.00
113.00
122.00 96.00 80.00 96.00
122.00
123.00 94.00 75.00 94.00
125.00
127.00 102.00 78.00 91.00
--
115.00 96.00 87.00
102.00 --
108.00 92.00 85.00 96.00
--
124.00 93.00 76.00 99.00
--
Other Hay
2008 2009 2010 2011 2012
71.00 109.00 87.00 77.00 93.00
82.00 102.00 90.00 74.00 93.00
80.00 95.00 82.00 74.00 97.00
83.00 120.00 88.00 76.00
104.00
102.00 106.00 74.00 80.00 99.00
99.00 118.00 100.00 85.00 99.00
126.00 108.00 100.00 95.00
110.00
107.00 106.00 103.00 92.00
117.00
108.00 90.00 88.00 91.00
--
106.00 89.00 82.00
102.00 --
103.00 96.00 77.00 92.00
--
131.00 93.00 72.00 96.00
--
-- Not Available.

Marketing Year Average of Prices Received for Selected Commodities
2012 Montana Agricultural Statistics Economic 23
Marketing of Major Montana Crops Estimated Percent of Monthly Farm Sales
Commodity 1/ Unit 2003 2004 2005 2006 2007 2008 2009 2010 2011
Dollars
All Wheat Winter Wheat Spring Wheat Durum Wheat All Barley Malt Barley Feed Barley Oats Corn for Grain Sugar Beets Potatoes, Fall Dry Beans Sweet Cherries All Hay Alfalfa Hay Other Hay
Bu Bu Bu Bu Bu Bu Bu Bu Bu Ton Cwt Cwt Ton Ton Ton Ton
3.73 3.56 3.78 4.07 2.93 3.37 2.09 1.70 2.65
43.00 7.70
18.20 1,710.00
73.50 75.00 68.50
3.61 3.41 3.69 3.86 2.85 3.20 1.65 1.70 2.42
40.80 7.55
28.70 2,010.00
76.00 77.00 70.00
3.63 3.51 3.80 3.45 2.92 3.12 1.65 1.63 2.54
45.30 9.20
18.60 3,530.00
71.00 71.00 68.00
4.54 4.49 4.58 4.61 3.00 3.12 2.45 2.22 3.93
41.60 9.00
20.50 1,850.00
78.00 78.00 81.00
7.14 6.69 7.49 9.26 4.14 4.03 4.40 2.76 4.76
39.10 9.85
25.00 1,630.00
78.50 79.00 78.00
6.84 6.31 7.36 9.69 5.78 5.97 3.14 3.07 3.80
50.80 11.60 33.50
2,730.00 116.00 117.00 111.00
5.18 4.79 5.72 5.15 4.86 5.02 2.39 2.54 4.23
53.40 10.60 28.60
1,490.00 95.50 96.00 96.00
6.29 5.81 6.87 6.22 4.08 4.16 3.58 2.66 6.00
64.00 11.50 27.00
1,960.00 80.00 79.00 83.00
7.68 6.74 8.36
10.30 5.27 5.34 4.82 3.04 6.40
-- 12.40 34.00
2,470.00 98.00 98.00 94.00
Beef Cattle Steers & Heifers Beef Cows Calves Sheep Lambs Hogs, All Milk, All Wool Honey
Cwt Cwt Cwt Cwt Cwt Cwt Cwt Cwt Lb Lb
82.20 90.40 45.60
106.00 34.80
103.00 39.70 12.40 1.03 1.44
91.00 106.00 51.40
125.00 39.50
112.00 52.30 15.60 1.17 1.08
104.00 114.00 55.10
138.00 43.30
124.00 53.10 15.30 0.98 0.88
93.80 112.00 47.70
131.00 25.70
102.00 47.90 13.10 0.91 0.96
89.80 103.00 47.70
123.00 23.90
101.00 47.90 18.70 1.30 0.99
87.50 100.00 47.70
109.00 19.00
101.00 47.10 19.00 1.40 1.37
77.70 94.50 43.40
108.00 31.10
101.00 40.90 14.60 1.10 1.46
90.10 107.00 54.90
128.00 49.00
136.00 52.00 16.90 1.60 1.58
2/ 2/ 2/ 2/ 2/ 2/ 2/
19.90 2.40 1.64
1/ Marketing year average prices received by farmers are based on monthly prices weighted by monthly marketings during specific periods. These peri-
ods, by commodity, are as follows: July-June for wheat, oats, and barley; June-May for hay; October-September for corn; January-December for beef
cattle, steers and heifers, cows, calves, sheep, lambs, milk, and wool. Annual prices are computed for the following commodities with marketing year as follows: December-November for hogs, chickens, and eggs; July-July for potatoes; production year for sugar beets; September-August for dry beans; and
January-December for honey. Prices do not include allowance for CCC loans outstanding, purchases by the government or deficiency payments. 2/No
longer published. -- Not available.
Marketing Year July Aug Sept Oct Nov Dec Jan Feb Mar Apr May June
Percent
All Wheat
2006-2007 2007-2008 2008-2009 2009-2010 2010-2011 2011-2012
9 6 2 4 7 8
10 17 9 4 9
11
7 8
10 14 12 11
8 9 6 9 8 6
7 9 7
10 7 8
12 12 11 9 9
11
12 13 11 11 11 10
10 8 8 8
10 8
10 8 9
11 10 10
6 5
10 9 7 5
5 3 7 5 6 6
6 2
10 6 4 6
All Barley
2006-2007 2007-2008 2008-2009 2009-2010 2010-2011 2011-2012
8 6 4 4 8 6
14 18 20 10 18 25
6 13 13 10 7
10
8 14 17 5 5 9
8 11 6 8 8 8
16 12 7 8 5 5
12 7
15 12 9 7
9 9 9
10 9
10
11 6 5
10 10 7
3 2 2 6 9 5
2 1 1 8 7 3
3 1 1 9 5 5
Oats
2006-2007 2007-2008 2008-2009 2009-2010 2010-2011 2011-2012
5 2
11 -- --
12
7 29 -- 2
10 --
4 17 8 3 5 7
11 13 14 3 5 5
8 -- 5 2
10 15
7 4
27 12 6 3
11 10 --
12 23 10
2 -- -- 7
25 7
6 --
11 26 6
17
18 19 8
19 1
10
10 6 6
12 3
12
11 --
10 2 6 2
Marketing Year June July Aug Sept Oct Nov Dec Jan Feb Mar Apr May
All Hay
2006-2007 2007-2008 2008-2009 2009-2010 2010-2011 2011-2012
3 3 6 6 4 5
11 11 15 15 8
14
9 9
14 14 9
12
7 8
14 14 11 13
9 10 10 10 8 9
12 12 8 8
13 9
14 12 10 10 13 11
12 13 8 8
10 9
10 10 7 7 9 8
7 6 4 4 8 5
4 4 3 3 4 3
2 2 1 1 3 2
-- Data not published.
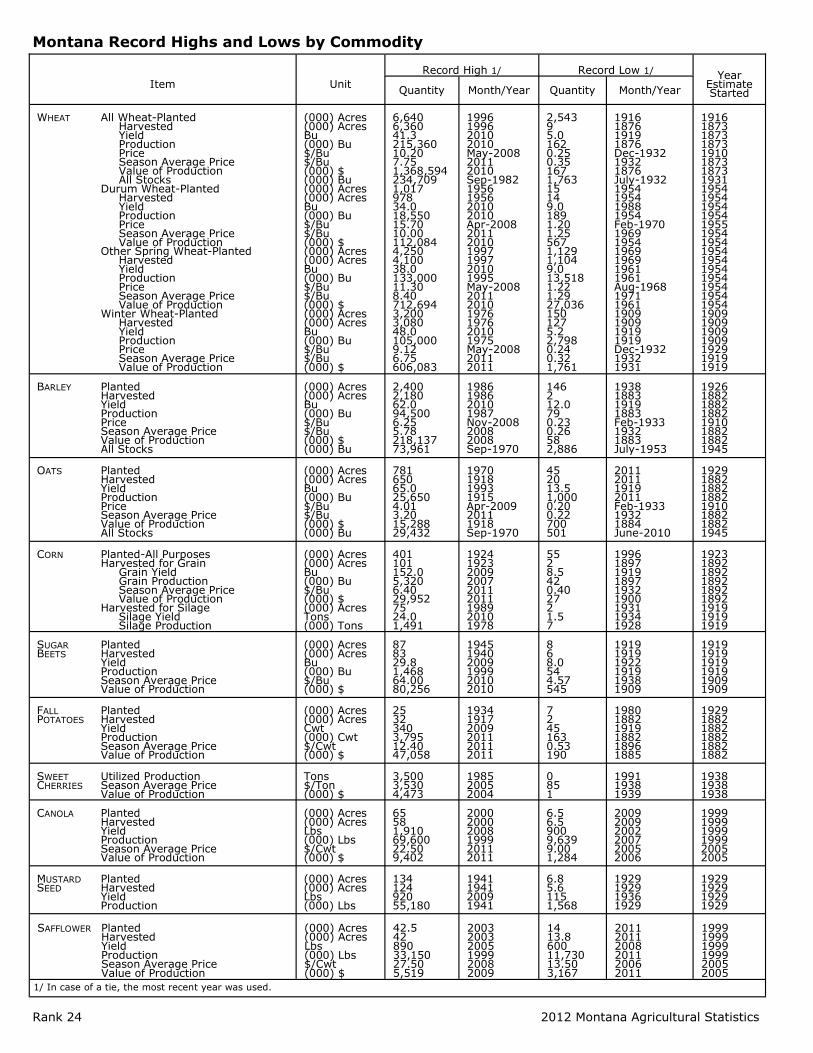
Montana Record Highs and Lows by Commodity
Rank 24 2012 Montana Agricultural Statistics
Item
Unit
Record High 1/
Record Low 1/
Year Estimate Started Quantity Month/Year Quantity Month/Year
WHEAT All Wheat-Planted
Harvested Yield Production Price Season Average Price Value of Production All Stocks
Durum Wheat-Planted Harvested Yield Production Price Season Average Price Value of Production
Other Spring Wheat-Planted Harvested Yield Production Price Season Average Price Value of Production
Winter Wheat-Planted Harvested Yield Production Price Season Average Price Value of Production
(000) Acres (000) Acres Bu (000) Bu $/Bu $/Bu (000) $ (000) Bu (000) Acres (000) Acres Bu (000) Bu $/Bu $/Bu (000) $ (000) Acres (000) Acres Bu (000) Bu $/Bu $/Bu (000) $ (000) Acres (000) Acres Bu (000) Bu $/Bu $/Bu (000) $
6,640 6,360 41.3 215,360 10.20 7.75 1,368,594 234,709 1,017 978 34.0 18,550 15.70 10.00 112,084 4,250 4,100 38.0 133,000 11.30 8.40 712,694 3,200 3,080 48.0 105,000 9.12 6.75 606,083
1996 1996 2010 2010 May-2008 2011 2010 Sep-1982 1956 1956 2010 2010 Apr-2008 2011 2010 1997 1997 2010 1995 May-2008 2011 2010 1976 1976 2010 1975 May-2008 2011 2011
2,543 9 5.0 162 0.25 0.35 167 1,763 15 14 9.0 189 1.20 1.25 567 1,129 1,104 9.0 13,518 1.22 1.29 27,036 150 127 5.2 2,798 0.24 0.32 1,761
1916 1876 1919 1876 Dec-1932 1932 1876 July-1932 1954 1954 1988 1954 Feb-1970 1969 1954 1969 1969 1961 1961 Aug-1968 1971 1961 1909 1909 1919 1919 Dec-1932 1932 1931
1916 1873 1873 1873 1910 1873 1873 1931 1954 1954 1954 1954 1955 1954 1954 1954 1954 1954 1954 1954 1954 1954 1909 1909 1909 1909 1929 1919 1919
BARLEY Planted
Harvested Yield Production Price Season Average Price Value of Production All Stocks
(000) Acres (000) Acres Bu (000) Bu $/Bu $/Bu (000) $ (000) Bu
2,400 2,180 62.0 94,500 6.25 5.78 218,137 73,961
1986 1986 2010 1987 Nov-2008 2008 2008 Sep-1970
146 2 12.0 79 0.23 0.26 58 2,886
1938 1883 1919 1883 Feb-1933 1932 1883 July-1953
1926 1882 1882 1882 1910 1882 1882 1945
OATS Planted
Harvested Yield Production Price Season Average Price Value of Production All Stocks
(000) Acres (000) Acres Bu (000) Bu $/Bu $/Bu (000) $ (000) Bu
781 650 65.0 25,650 4.01 3.20 15,288 29,432
1970 1918 1993 1915 Apr-2009 2011 1918 Sep-1970
45 20 13.5 1,000 0.20 0.22 700 501
2011 2011 1919 2011 Feb-1933 1932 1884 June-2010
1929 1882 1882 1882 1910 1882 1882 1945
CORN Planted-All Purposes
Harvested for Grain Grain Yield Grain Production
Season Average Price Value of Production Harvested for Silage
Silage Yield Silage Production
(000) Acres (000) Acres Bu (000) Bu $/Bu (000) $ (000) Acres Tons (000) Tons
401 101 152.0 5,320 6.40 29,952 75 24.0 1,491
1924 1923 2009 2007 2011 2011 1989 2010 1978
55 2 8.5 42 0.40 27 2 1.5 7
1996 1897 1919 1897 1932 1900 1931 1934 1928
1923 1892 1892 1892 1892 1892 1919 1919 1919
SUGAR Planted BEETS Harvested
Yield Production Season Average Price Value of Production
(000) Acres (000) Acres Bu (000) Bu $/Bu (000) $
87 83 29.8 1,468 64.00 80,256
1945 1940 2009 1999 2010 2010
8 6 8.0 54 4.57 545
1919 1919 1922 1919 1938 1909
1919 1919 1919 1919 1909 1909
FALL Planted POTATOES Harvested
Yield Production Season Average Price Value of Production
(000) Acres (000) Acres Cwt (000) Cwt $/Cwt (000) $
25 32 340 3,795 12.40 47,058
1934 1917 2009 2011 2011 2011
7 2 45 163 0.53 190
1980 1882 1919 1882 1896 1885
1929 1882 1882 1882 1882 1882
SWEET Utilized Production CHERRIES Season Average Price
Value of Production
Tons $/Ton (000) $
3,500 3,530 4,473
1985 2005 2004
0 85 1
1991 1938 1939
1938 1938 1938
CANOLA Planted
Harvested Yield Production Season Average Price Value of Production
(000) Acres (000) Acres Lbs (000) Lbs $/Cwt (000) $
65 58 1,910 69,600 22.50 9,402
2000 2000 2008 1999 2011 2011
6.5 6.5 900 9,639 9.00 1,284
2009 2009 2002 2007 2005 2006
1999 1999 1999 1999 2005 2005
MUSTARD Planted SEED Harvested
Yield Production
(000) Acres (000) Acres Lbs (000) Lbs
134 124 920 55,180
1941 1941 2009 1941
6.8 5.6 115 1,568
1929 1929 1936 1929
1929 1929 1929 1929
SAFFLOWER Planted
Harvested Yield Production Season Average Price Value of Production
(000) Acres (000) Acres Lbs (000) Lbs $/Cwt (000) $
42.5 42 890 33,150 27.50 5,519
2003 2003 2005 1999 2008 2009
14 13.8 600 11,730 13.50 3,167
2011 2011 2008 2011 2006 2011
1999 1999 1999 1999 2005 2005
1/ In case of a tie, the most recent year was used.
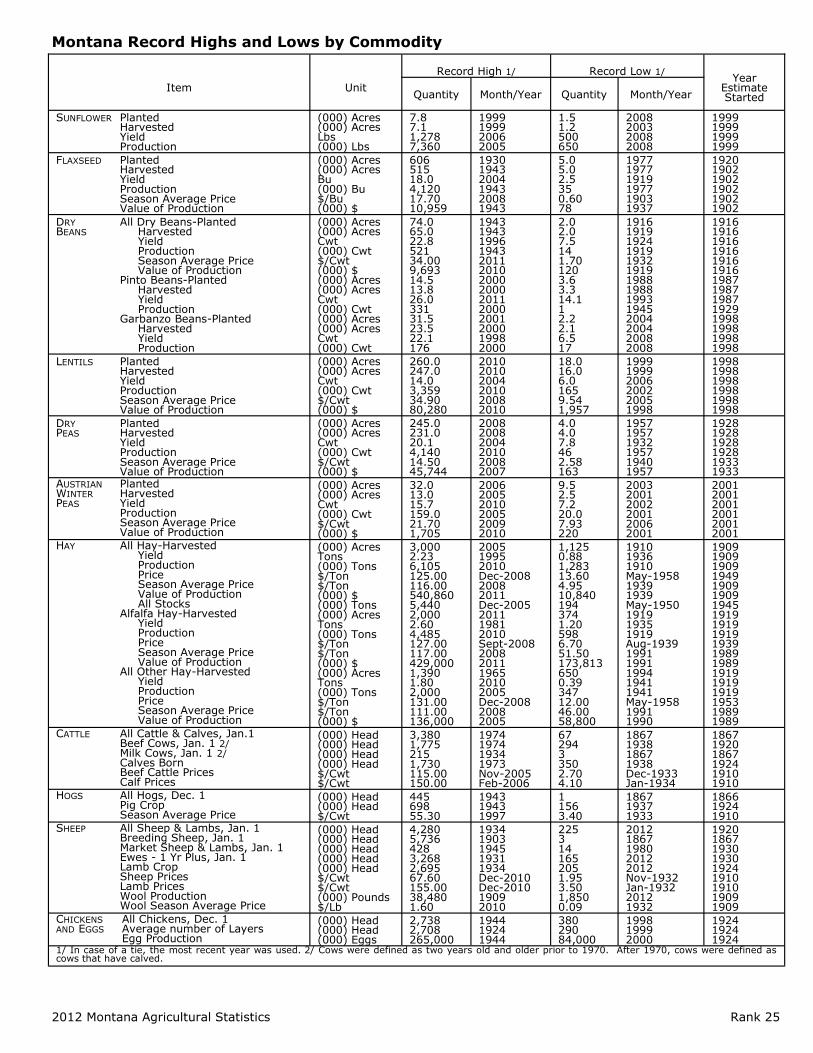
2012 Montana Agricultural Statistics Rank 25
Item
Unit
Record High 1/
Record Low 1/
Year Estimate Started
Quantity
Month/Year
Quantity
Month/Year
SUNFLOWER Planted Harvested Yield Production
(000) Acres (000) Acres Lbs (000) Lbs
7.8 7.1 1,278 7,360
1999 1999 2006 2005
1.5 1.2 500 650
2008 2003 2008 2008
1999 1999 1999 1999
FLAXSEED Planted Harvested Yield Production Season Average Price Value of Production
(000) Acres (000) Acres Bu (000) Bu $/Bu (000) $
606 515 18.0 4,120 17.70 10,959
1930 1943 2004 1943 2008 1943
5.0 5.0 2.5 35 0.60 78
1977 1977 1919 1977 1903 1937
1920 1902 1902 1902 1902 1902
DRY All Dry Beans-Planted BEANS Harvested
Yield Production Season Average Price Value of Production
Pinto Beans-Planted Harvested Yield Production
Garbanzo Beans-Planted Harvested Yield Production
(000) Acres (000) Acres Cwt (000) Cwt $/Cwt (000) $ (000) Acres (000) Acres Cwt (000) Cwt (000) Acres (000) Acres Cwt (000) Cwt
74.0 65.0 22.8 521 34.00 9,693 14.5 13.8 26.0 331 31.5 23.5 22.1 176
1943 1943 1996 1943 2011 2010 2000 2000 2011 2000 2001 2000 1998 2000
2.0 2.0 7.5 14 1.70 120 3.6 3.3 14.1 1 2.2 2.1 6.5 17
1916 1919 1924 1919 1932 1919 1988 1988 1993 1945 2004 2004 2008 2008
1916 1916 1916 1916 1916 1916 1987 1987 1987 1929 1998 1998 1998 1998
LENTILS Planted Harvested
Yield Production Season Average Price Value of Production
(000) Acres (000) Acres Cwt (000) Cwt $/Cwt (000) $
260.0 247.0 14.0 3,359 34.90 80,280
2010 2010 2004 2010 2008 2010
18.0 16.0 6.0 165 9.54 1,957
1999 1999 2006 2002 2005 1998
1998 1998 1998 1998 1998 1998
DRY Planted PEAS Harvested
Yield Production Season Average Price Value of Production
(000) Acres (000) Acres Cwt (000) Cwt $/Cwt (000) $
245.0 231.0 20.1 4,140 14.50 45,744
2008 2008 2004 2010 2008 2007
4.0 4.0 7.8 46 2.58 163
1957 1957 1932 1957 1940 1957
1928 1928 1928 1928 1933 1933
AUSTRIAN Planted WINTER Harvested PEAS Yield
Production Season Average Price Value of Production
(000) Acres (000) Acres Cwt (000) Cwt $/Cwt (000) $
32.0 13.0 15.7 159.0 21.70 1,705
2006 2005 2010 2005 2009 2010
9.5 2.5 7.2 20.0 7.93 220
2003 2001 2002 2001 2006 2001
2001 2001 2001 2001 2001 2001
HAY All Hay-Harvested Yield Production Price Season Average Price Value of Production All Stocks
Alfalfa Hay-Harvested Yield Production Price Season Average Price Value of Production
All Other Hay-Harvested Yield Production Price Season Average Price Value of Production
(000) Acres Tons (000) Tons $/Ton $/Ton (000) $ (000) Tons (000) Acres Tons (000) Tons $/Ton $/Ton (000) $ (000) Acres Tons (000) Tons $/Ton $/Ton (000) $
3,000 2.23 6,105 125.00 116.00 540,860 5,440 2,000 2.60 4,485 127.00 117.00 429,000 1,390 1.80 2,000 131.00 111.00 136,000
2005 1995 2010 Dec-2008 2008 2011 Dec-2005 2011 1981 2010 Sept-2008 2008 2011 1965 2010 2005 Dec-2008 2008 2005
1,125 0.88 1,283 13.60 4.95 10,840 194 374 1.20 598 6.70 51.50 173,813 650 0.39 347 12.00 46.00 58,800
1910 1936 1910 May-1958 1939 1939 May-1950 1919 1935 1919 Aug-1939 1991 1991 1994 1941 1941 May-1958 1991 1990
1909 1909 1909 1949 1909 1909 1945 1919 1919 1919 1939 1989 1989 1919 1919 1919 1953 1989 1989
CATTLE All Cattle & Calves, Jan.1 Beef Cows, Jan. 1 2/ Milk Cows, Jan. 1 2/ Calves Born Beef Cattle Prices Calf Prices
(000) Head (000) Head (000) Head (000) Head $/Cwt $/Cwt
3,380 1,775 215 1,730 115.00 150.00
1974 1974 1934 1973 Nov-2005 Feb-2006
67 294 3 350 2.70 4.10
1867 1938 1867 1938 Dec-1933 Jan-1934
1867 1920 1867 1924 1910 1910
HOGS All Hogs, Dec. 1 Pig Crop Season Average Price
(000) Head (000) Head $/Cwt
445 698 55.30
1943 1943 1997
1 156 3.40
1867 1937 1933
1866 1924 1910
SHEEP All Sheep & Lambs, Jan. 1 Breeding Sheep, Jan. 1 Market Sheep & Lambs, Jan. 1 Ewes - 1 Yr Plus, Jan. 1 Lamb Crop Sheep Prices Lamb Prices Wool Production Wool Season Average Price
(000) Head (000) Head (000) Head (000) Head (000) Head $/Cwt $/Cwt (000) Pounds $/Lb
4,280 5,736 428 3,268 2,695 67.60 155.00 38,480 1.60
1934 1903 1945 1931 1934 Dec-2010 Dec-2010 1909 2010
225 3 14 165 205 1.95 3.50 1,850 0.09
2012 1867 1980 2012 2012 Nov-1932 Jan-1932 2012 1932
1920 1867 1930 1930 1924 1910 1910 1909 1909
CHICKENS All Chickens, Dec. 1 AND EGGS Average number of Layers
Egg Production
(000) Head (000) Head (000) Eggs
2,738 2,708 265,000
1944 1924 1944
380 290 84,000
1998 1999 2000
1924 1924 1924
1/ In case of a tie, the most recent year was used. 2/ Cows were defined as two years old and older prior to 1970. After 1970, cows were defined as cows that have calved.
Montana Record Highs and Lows by Commodity

Rank 26 2012 Montana Agricultural Statistics
ITEM TOTAL UNIT PERIOD OR DATE RANK % U.S. Total
Number of farms and ranches
Land in farms and ranches
Average Farm Size
29,300
60,500,000
2,065
farms/ranches
acres
acres
2011
2011
2011
30
2
2
1.3
6.6
N/A
INCOME FROM CASH RECEIPTS, EXCLUDING GOVERNMENT PAYMENTS
Total
Crops
Livestock
3,046,592
1,782,485
1,267,107
thousand dollars
thousand dollars
thousand dollars
2010
2010
2010
32
28
32
1.0
1.0
0.9
LIVESTOCK INVENTORY
All Cattle and Calves
All Cows
Beef Cows
Milk Cows
Cattle on Feed
All Sheep and Lambs
Breeding Sheep
Meat and Other Goats
Milk Goats
Hogs and Pigs
Chickens
2,500,000
1,470,000
1,456,000
14,000
32,000
225,000
210,000
6,900
2,500
180,000
545,000
head
head
head
head
head
head
head
head
head
head
head
Jan. 1, 2012
Jan. 1, 2012
Jan. 1, 2012
Jan. 1, 2012
Jan. 1, 2012
Jan. 1, 2012
Jan. 1, 2012
Jan. 1, 2012
Jan. 1, 2012
Dec. 1, 2011
Dec. 1, 2011
11
9
6
39
23
8
6
39
32
23
32
2.8
3.8
4.9
0.2
0.2
4.2
5.3
0.3
0.7
0.3
0.1
LIVESTOCK PRODUCTION
Calf Crop
Lamb Crop
Pig Crop
Wool Production
Egg Production
Honey Production
1,470,000
205,000
437,000
1,850,000
119,000,000
13,340,000
head
head
head
pounds
eggs
pounds
2011
2011
2011
2011
2011
2011
7
7
24
8
35
4
4.2
5.8
0.4
6.3
0.1
9.0
CROP PRODUCTION
All Wheat
Winter Wheat
Durum Wheat
Other Spring Wheat
Barley
Oats
All Hay
Alfalfa Hay
Other Hay
All Dry Beans
Pinto Beans
Garbanzo Beans
Lentils
Dry Edible Peas
Austrian Winter Peas
Fall Potatoes
Sugar Beets
Flaxseed
Safflower
Canola
Corn for Grain
Corn for Silage
174,970,000
89,790,000
10,780,000
74,400,000
31,000,000
1,000,000
5,590,000
4,400,000
1,190,000
270,000
130,000
119,000
2,717,000
2,655,000
72,000
3,795,000
1,109,000
208,000
11,730,000
41,785,000
4,680,000
798,000
bushels
bushels
bushels
bushels
bushels
bushels
tons
tons
tons
cwt
cwt
cwt
cwt
cwt
cwt
cwt
tons
bushels
pounds
pounds
bushels
tons
2011
2011
2011
2011
2011
2011
2011
2011
2011
2011
2011
2011
2011
2011
2011
2011
2011
2011
2011
2011
2011
2011
3
3
3
2
2
19
5
3
25
11
9
4
1
1
2
13
6
2
3
3
39
28
8.8
6.0
21.4
16.3
19.9
1.9
4.3
6.7
1.8
1.4
2.2
5.6
57.4
47.2
40.0
1.0
4.1
7.5
6.9
2.7
1/
0.7
1/ Less than one-tenth of one percent.
Montana’s Rank in the Nation’s Agriculture
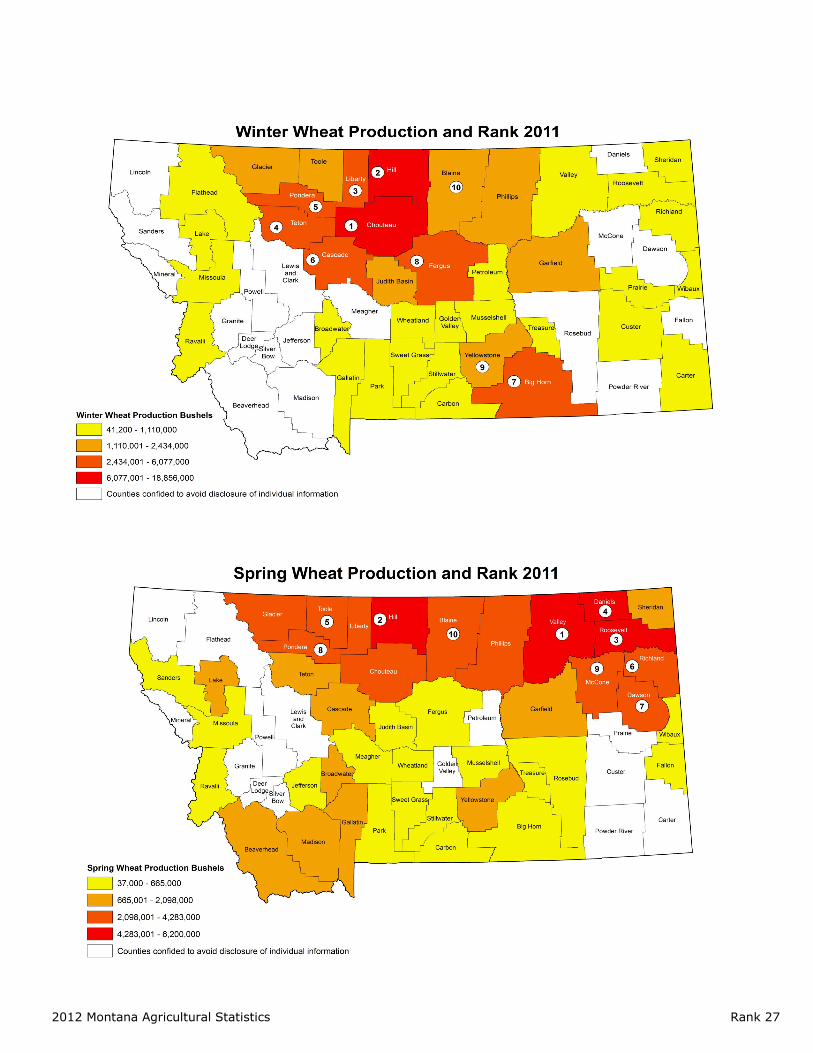
2012 Montana Agricultural Statistics Rank 27

Rank 28 2012 Montana Agricultural Statistics
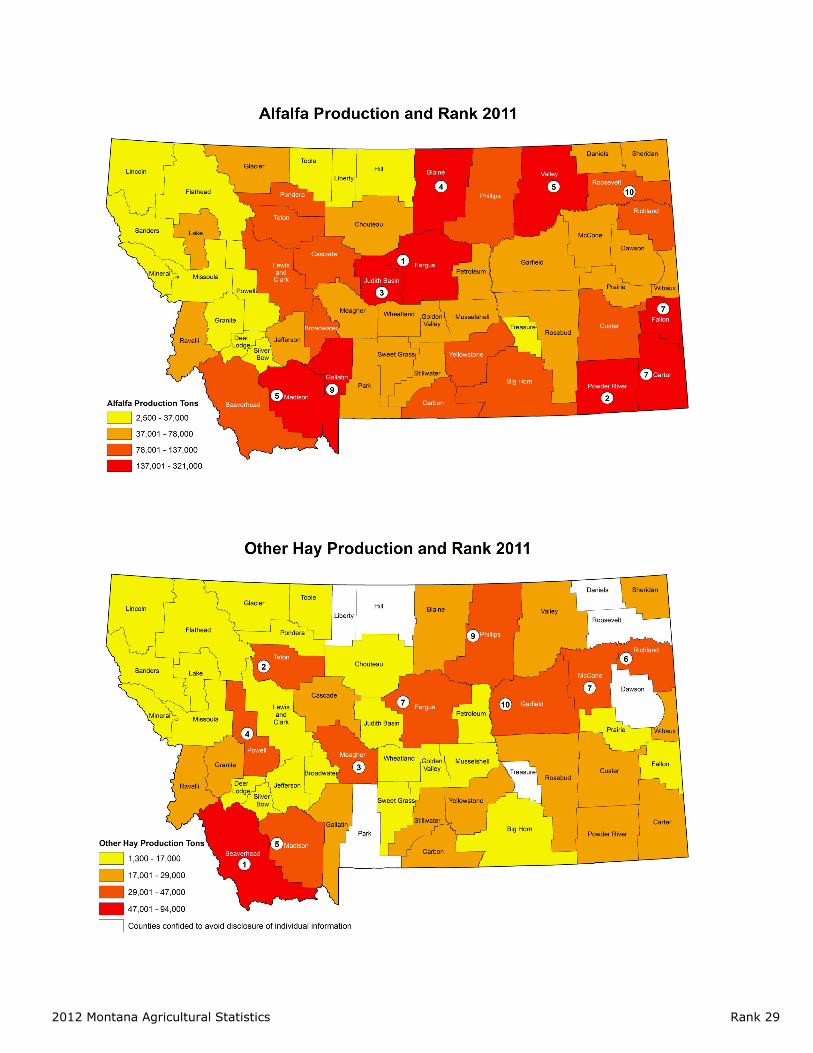
2012 Montana Agricultural Statistics Rank 29
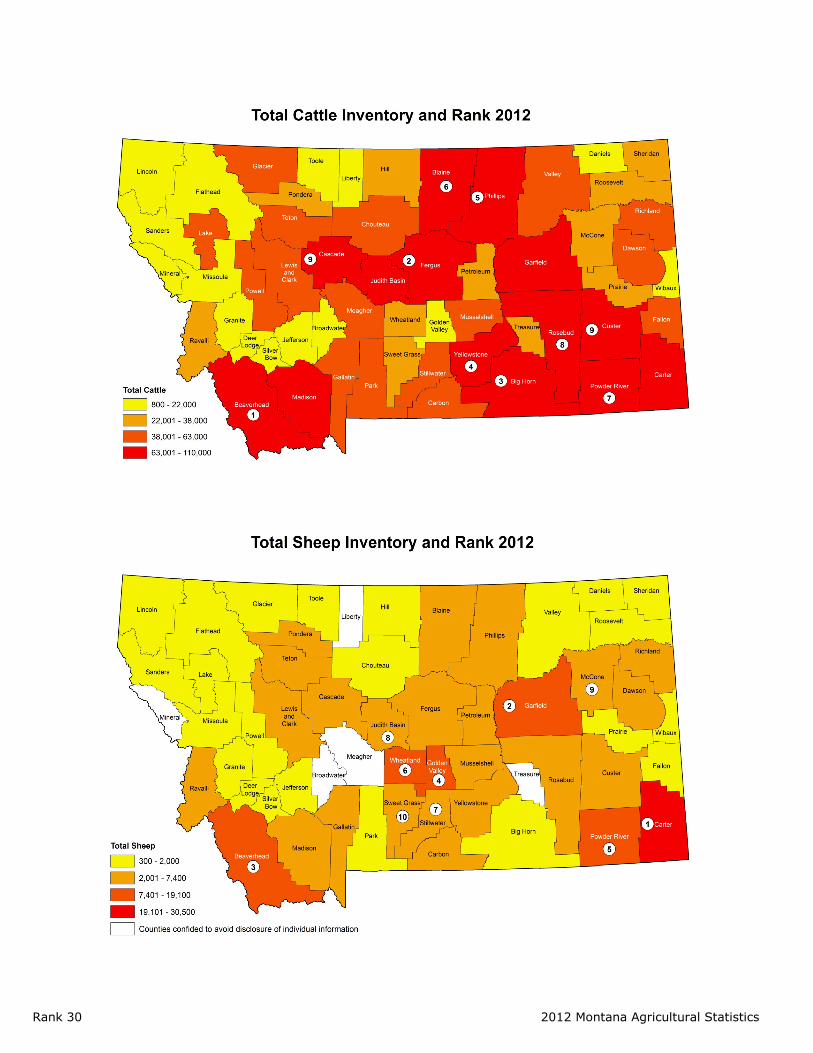
Rank 30 2012 Montana Agricultural Statistics
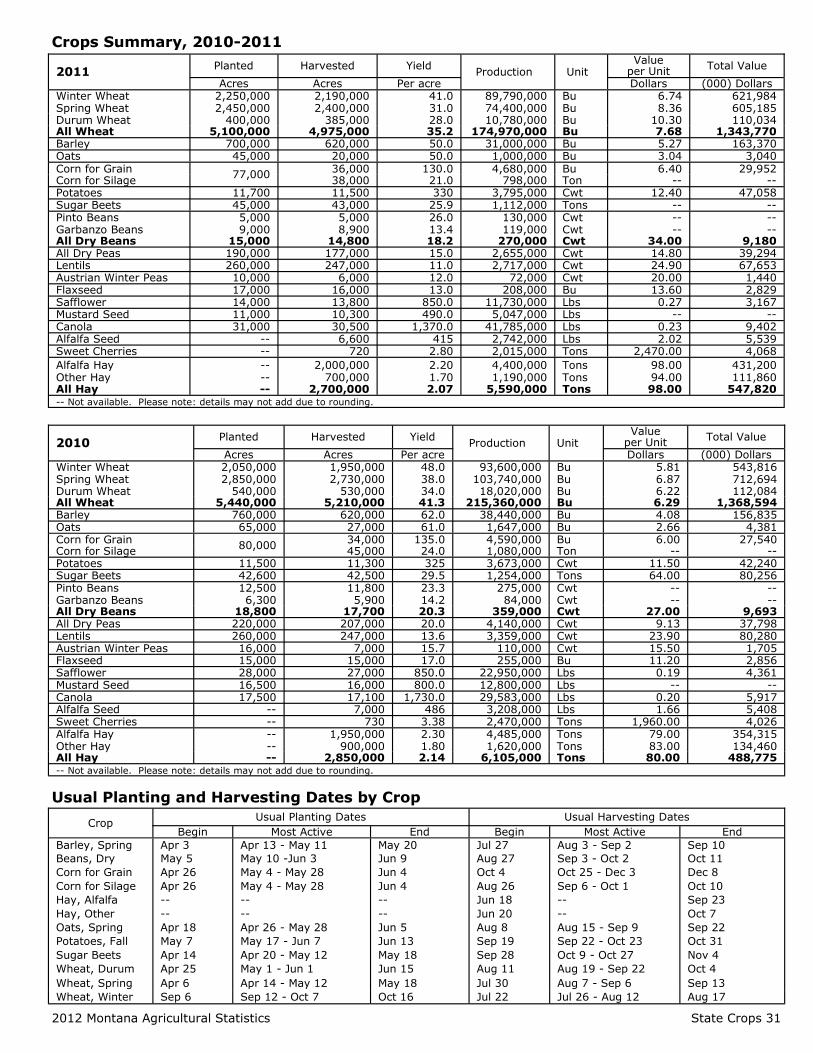
2012 Montana Agricultural Statistics State Crops 31
Crops Summary, 2010-2011
2011 Planted Harvested Yield Production
Value per Unit Total Value
Unit Acres Acres Per acre Dollars (000) Dollars
Winter Wheat 2,250,000 2,190,000 41.0 89,790,000 Bu 6.74 621,984 Spring Wheat 2,450,000 2,400,000 31.0 74,400,000 Bu 8.36 605,185 Durum Wheat 400,000 385,000 28.0 10,780,000 Bu 10.30 110,034 All Wheat 5,100,000 4,975,000 35.2 174,970,000 Bu 7.68 1,343,770 Barley 700,000 620,000 50.0 31,000,000 Bu 5.27 163,370 Oats 45,000 20,000 50.0 1,000,000 Bu 3.04 3,040 Corn for Grain
77,000 36,000 130.0 4,680,000 Bu 6.40 29,952 Corn for Silage 38,000 21.0 798,000 Ton -- -- Potatoes 11,700 11,500 330 3,795,000 Cwt 12.40 47,058 Sugar Beets 45,000 43,000 25.9 1,112,000 Tons -- -- Pinto Beans 5,000 5,000 26.0 130,000 Cwt -- -- Garbanzo Beans 9,000 8,900 13.4 119,000 Cwt -- -- All Dry Beans 15,000 14,800 18.2 270,000 Cwt 34.00 9,180 All Dry Peas 190,000 177,000 15.0 2,655,000 Cwt 14.80 39,294 Lentils 260,000 247,000 11.0 2,717,000 Cwt 24.90 67,653 Austrian Winter Peas 10,000 6,000 12.0 72,000 Cwt 20.00 1,440 Flaxseed 17,000 16,000 13.0 208,000 Bu 13.60 2,829 Safflower 14,000 13,800 850.0 11,730,000 Lbs 0.27 3,167 Mustard Seed 11,000 10,300 490.0 5,047,000 Lbs -- -- Canola 31,000 30,500 1,370.0 41,785,000 Lbs 0.23 9,402 Alfalfa Seed -- 6,600 415 2,742,000 Lbs 2.02 5,539 Sweet Cherries -- 720 2.80 2,015,000 Tons 2,470.00 4,068 Alfalfa Hay -- 2,000,000 2.20 4,400,000 Tons 98.00 431,200 Other Hay -- 700,000 1.70 1,190,000 Tons 94.00 111,860 All Hay -- 2,700,000 2.07 5,590,000 Tons 98.00 547,820 -- Not available. Please note: details may not add due to rounding.
2010 Planted Harvested Yield Production
Value per Unit Total Value
Unit Acres Acres Per acre Dollars (000) Dollars
Winter Wheat 2,050,000 1,950,000 48.0 93,600,000 Bu 5.81 543,816 Spring Wheat 2,850,000 2,730,000 38.0 103,740,000 Bu 6.87 712,694 Durum Wheat 540,000 530,000 34.0 18,020,000 Bu 6.22 112,084 All Wheat 5,440,000 5,210,000 41.3 215,360,000 Bu 6.29 1,368,594 Barley 760,000 620,000 62.0 38,440,000 Bu 4.08 156,835 Oats 65,000 27,000 61.0 1,647,000 Bu 2.66 4,381 Corn for Grain
80,000 34,000 135.0 4,590,000 Bu 6.00 27,540 Corn for Silage 45,000 24.0 1,080,000 Ton -- -- Potatoes 11,500 11,300 325 3,673,000 Cwt 11.50 42,240 Sugar Beets 42,600 42,500 29.5 1,254,000 Tons 64.00 80,256 Pinto Beans 12,500 11,800 23.3 275,000 Cwt -- -- Garbanzo Beans 6,300 5,900 14.2 84,000 Cwt -- -- All Dry Beans 18,800 17,700 20.3 359,000 Cwt 27.00 9,693 All Dry Peas 220,000 207,000 20.0 4,140,000 Cwt 9.13 37,798 Lentils 260,000 247,000 13.6 3,359,000 Cwt 23.90 80,280 Austrian Winter Peas 16,000 7,000 15.7 110,000 Cwt 15.50 1,705 Flaxseed 15,000 15,000 17.0 255,000 Bu 11.20 2,856 Safflower 28,000 27,000 850.0 22,950,000 Lbs 0.19 4,361 Mustard Seed 16,500 16,000 800.0 12,800,000 Lbs -- -- Canola 17,500 17,100 1,730.0 29,583,000 Lbs 0.20 5,917 Alfalfa Seed -- 7,000 486 3,208,000 Lbs 1.66 5,408 Sweet Cherries -- 730 3.38 2,470,000 Tons 1,960.00 4,026 Alfalfa Hay -- 1,950,000 2.30 4,485,000 Tons 79.00 354,315 Other Hay -- 900,000 1.80 1,620,000 Tons 83.00 134,460 All Hay -- 2,850,000 2.14 6,105,000 Tons 80.00 488,775 -- Not available. Please note: details may not add due to rounding.
Usual Planting and Harvesting Dates by Crop
Crop Usual Planting Dates Usual Harvesting Dates
Begin Most Active End Begin Most Active End
Barley, Spring Apr 3 Apr 13 - May 11 May 20 Jul 27 Aug 3 - Sep 2 Sep 10
Beans, Dry May 5 May 10 -Jun 3 Jun 9 Aug 27 Sep 3 - Oct 2 Oct 11
Corn for Grain Apr 26 May 4 - May 28 Jun 4 Oct 4 Oct 25 - Dec 3 Dec 8
Corn for Silage Apr 26 May 4 - May 28 Jun 4 Aug 26 Sep 6 - Oct 1 Oct 10
Hay, Alfalfa -- -- -- Jun 18 -- Sep 23
Hay, Other -- -- -- Jun 20 -- Oct 7
Oats, Spring Apr 18 Apr 26 - May 28 Jun 5 Aug 8 Aug 15 - Sep 9 Sep 22
Potatoes, Fall May 7 May 17 - Jun 7 Jun 13 Sep 19 Sep 22 - Oct 23 Oct 31
Sugar Beets Apr 14 Apr 20 - May 12 May 18 Sep 28 Oct 9 - Oct 27 Nov 4
Wheat, Durum Apr 25 May 1 - Jun 1 Jun 15 Aug 11 Aug 19 - Sep 22 Oct 4
Wheat, Spring Apr 6 Apr 14 - May 12 May 18 Jul 30 Aug 7 - Sep 6 Sep 13
Wheat, Winter Sep 6 Sep 12 - Oct 7 Oct 16 Jul 22 Jul 26 - Aug 12 Aug 17
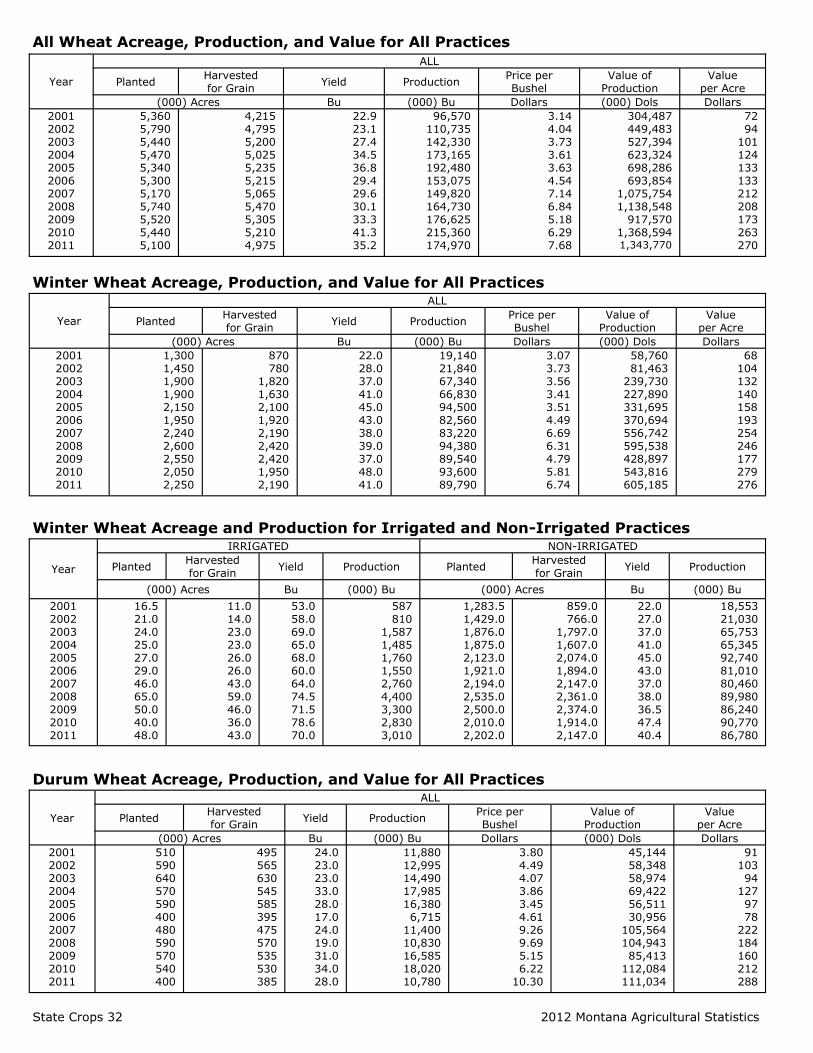
State Crops 32 2012 Montana Agricultural Statistics
All Wheat Acreage, Production, and Value for All Practices
Year
ALL
Planted Harvested for Grain
Yield Production Price per Bushel
Value of Production
Value per Acre
(000) Acres Bu (000) Bu Dollars (000) Dols Dollars
2001 2002 2003 2004 2005 2006 2007 2008 2009 2010 2011
5,360 5,790 5,440 5,470 5,340 5,300 5,170 5,740 5,520 5,440 5,100
4,215 4,795 5,200 5,025 5,235 5,215 5,065 5,470 5,305 5,210 4,975
22.9 23.1 27.4 34.5 36.8 29.4 29.6 30.1 33.3 41.3 35.2
96,570 110,735 142,330 173,165 192,480 153,075 149,820 164,730 176,625 215,360 174,970
3.14 4.04 3.73 3.61 3.63 4.54 7.14 6.84 5.18 6.29 7.68
304,487 449,483 527,394 623,324 698,286 693,854
1,075,754 1,138,548
917,570 1,368,594 1,343,770
72 94
101 124 133 133 212 208 173 263 270
Winter Wheat Acreage, Production, and Value for All Practices
Year
ALL
Planted Harvested for Grain
Yield Production Price per Bushel
Value of Production
Value per Acre
(000) Acres Bu (000) Bu Dollars (000) Dols Dollars
2001 2002 2003 2004 2005 2006 2007 2008 2009 2010 2011
1,300 1,450 1,900 1,900 2,150 1,950 2,240 2,600 2,550 2,050 2,250
870 780
1,820 1,630 2,100 1,920 2,190 2,420 2,420 1,950 2,190
22.0 28.0 37.0 41.0 45.0 43.0 38.0 39.0 37.0 48.0 41.0
19,140 21,840 67,340 66,830 94,500 82,560 83,220 94,380 89,540 93,600 89,790
3.07 3.73 3.56 3.41 3.51 4.49 6.69 6.31 4.79 5.81 6.74
58,760 81,463
239,730 227,890 331,695 370,694 556,742 595,538 428,897 543,816 605,185
68 104 132 140 158 193 254 246 177 279 276
Winter Wheat Acreage and Production for Irrigated and Non-Irrigated Practices
Year
IRRIGATED NON-IRRIGATED
Planted Harvested for Grain
Yield Production Planted Harvested for Grain
Yield Production
(000) Acres Bu (000) Bu (000) Acres Bu (000) Bu
2001 2002 2003 2004 2005 2006 2007 2008 2009 2010 2011
16.5 21.0 24.0 25.0 27.0 29.0 46.0 65.0 50.0 40.0 48.0
11.0 14.0 23.0 23.0 26.0 26.0 43.0 59.0 46.0 36.0 43.0
53.0 58.0 69.0 65.0 68.0 60.0 64.0 74.5 71.5 78.6 70.0
587 810
1,587 1,485 1,760 1,550 2,760 4,400 3,300 2,830 3,010
1,283.5 1,429.0 1,876.0 1,875.0 2,123.0 1,921.0 2,194.0 2,535.0 2,500.0 2,010.0 2,202.0
859.0 766.0
1,797.0 1,607.0 2,074.0 1,894.0 2,147.0 2,361.0 2,374.0 1,914.0 2,147.0
22.0 27.0 37.0 41.0 45.0 43.0 37.0 38.0 36.5 47.4 40.4
18,553 21,030 65,753 65,345 92,740 81,010 80,460 89,980 86,240 90,770 86,780
Durum Wheat Acreage, Production, and Value for All Practices
Year
ALL
Planted Harvested for Grain
Yield Production Price per Bushel
Value of Production
Value per Acre
(000) Acres Bu (000) Bu Dollars (000) Dols Dollars
2001 2002 2003 2004 2005 2006 2007 2008 2009 2010 2011
510 590 640 570 590 400 480 590 570 540 400
495 565 630 545 585 395 475 570 535 530 385
24.0 23.0 23.0 33.0 28.0 17.0 24.0 19.0 31.0 34.0 28.0
11,880 12,995 14,490 17,985 16,380 6,715
11,400 10,830 16,585 18,020 10,780
3.80 4.49 4.07 3.86 3.45 4.61 9.26 9.69 5.15 6.22
10.30
45,144 58,348 58,974 69,422 56,511 30,956
105,564 104,943 85,413
112,084 111,034
91 103 94
127 97 78
222 184 160 212 288
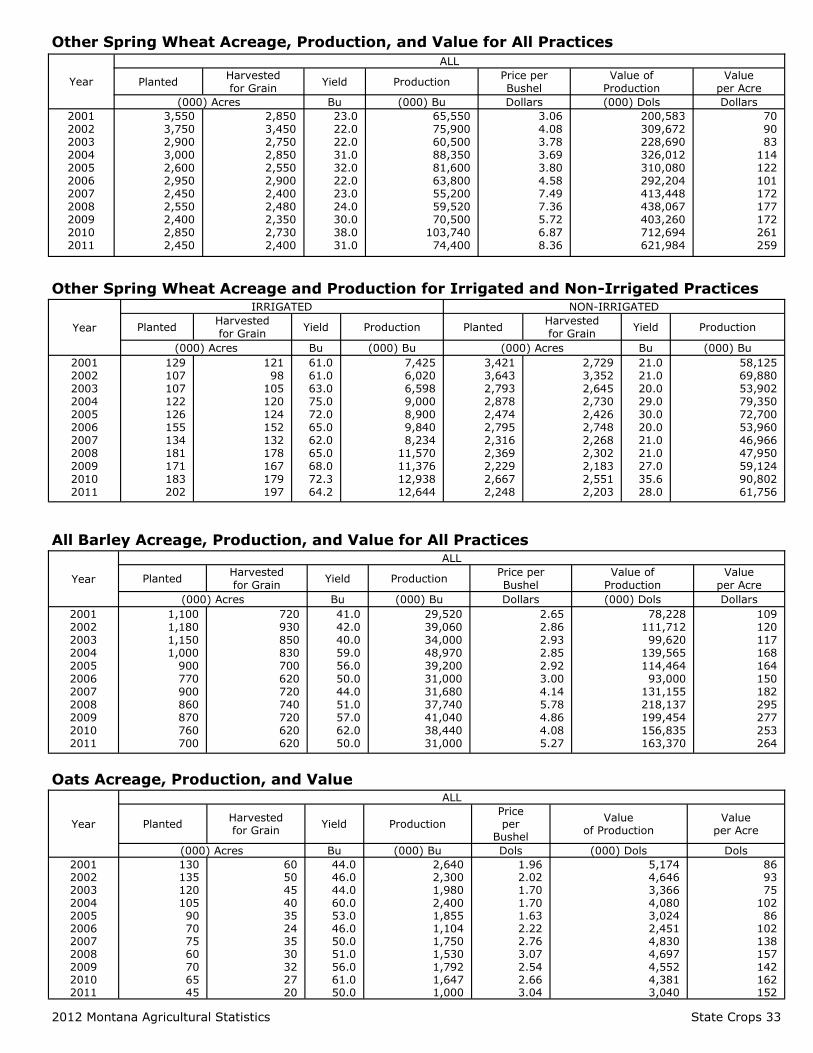
2012 Montana Agricultural Statistics State Crops 33
Other Spring Wheat Acreage, Production, and Value for All Practices
Year
ALL
Planted Harvested for Grain
Yield Production Price per Bushel
Value of Production
Value per Acre
(000) Acres Bu (000) Bu Dollars (000) Dols Dollars
2001 2002 2003 2004 2005 2006 2007 2008 2009 2010 2011
3,550 3,750 2,900 3,000 2,600 2,950 2,450 2,550 2,400 2,850 2,450
2,850 3,450 2,750 2,850 2,550 2,900 2,400 2,480 2,350 2,730 2,400
23.0 22.0 22.0 31.0 32.0 22.0 23.0 24.0 30.0 38.0 31.0
65,550 75,900 60,500 88,350 81,600 63,800 55,200 59,520 70,500
103,740 74,400
3.06 4.08 3.78 3.69 3.80 4.58 7.49 7.36 5.72 6.87 8.36
200,583 309,672 228,690 326,012 310,080 292,204 413,448 438,067 403,260 712,694 621,984
70 90 83
114 122 101 172 177 172 261 259
Other Spring Wheat Acreage and Production for Irrigated and Non-Irrigated Practices
Year
IRRIGATED NON-IRRIGATED
Planted Harvested for Grain
Yield Production Planted Harvested for Grain
Yield Production
(000) Acres Bu (000) Bu (000) Acres Bu (000) Bu
2001 2002 2003 2004 2005 2006 2007 2008 2009 2010 2011
129 107 107 122 126 155 134 181 171 183 202
121 98
105 120 124 152 132 178 167 179 197
61.0 61.0 63.0 75.0 72.0 65.0 62.0 65.0 68.0 72.3 64.2
7,425 6,020 6,598 9,000 8,900 9,840 8,234
11,570 11,376 12,938 12,644
3,421 3,643 2,793 2,878 2,474 2,795 2,316 2,369 2,229 2,667 2,248
2,729 3,352 2,645 2,730 2,426 2,748 2,268 2,302 2,183 2,551 2,203
21.0 21.0 20.0 29.0 30.0 20.0 21.0 21.0 27.0 35.6 28.0
58,125 69,880 53,902 79,350 72,700 53,960 46,966 47,950 59,124 90,802 61,756
All Barley Acreage, Production, and Value for All Practices
Year
ALL
Planted Harvested for Grain
Yield Production Price per Bushel
Value of Production
Value per Acre
(000) Acres Bu (000) Bu Dollars (000) Dols Dollars
2001 2002 2003 2004 2005 2006 2007 2008 2009 2010 2011
1,100 1,180 1,150 1,000
900 770 900 860 870 760 700
720 930 850 830 700 620 720 740 720 620 620
41.0 42.0 40.0 59.0 56.0 50.0 44.0 51.0 57.0 62.0 50.0
29,520 39,060 34,000 48,970 39,200 31,000 31,680 37,740 41,040 38,440 31,000
2.65 2.86 2.93 2.85 2.92 3.00 4.14 5.78 4.86 4.08 5.27
78,228 111,712 99,620
139,565 114,464 93,000
131,155 218,137 199,454 156,835 163,370
109 120 117 168 164 150 182 295 277 253 264
Oats Acreage, Production, and Value
Year
ALL
Planted Harvested for Grain
Yield Production
Price per
Bushel
Value of Production
Value per Acre
(000) Acres Bu (000) Bu Dols (000) Dols Dols
2001
2002
2003
2004
2005
2006
2007
2008
2009
2010 2011
130
135
120
105
90
70
75
60
70
65 45
60
50
45
40
35
24
35
30
32
27 20
44.0
46.0
44.0
60.0
53.0
46.0
50.0
51.0
56.0
61.0 50.0
2,640
2,300
1,980
2,400
1,855
1,104
1,750
1,530
1,792
1,647 1,000
1.96
2.02
1.70
1.70
1.63
2.22
2.76
3.07
2.54
2.66 3.04
5,174
4,646
3,366
4,080
3,024
2,451
4,830
4,697
4,552
4,381 3,040
86
93
75
102
86
102
138
157
142
162 152
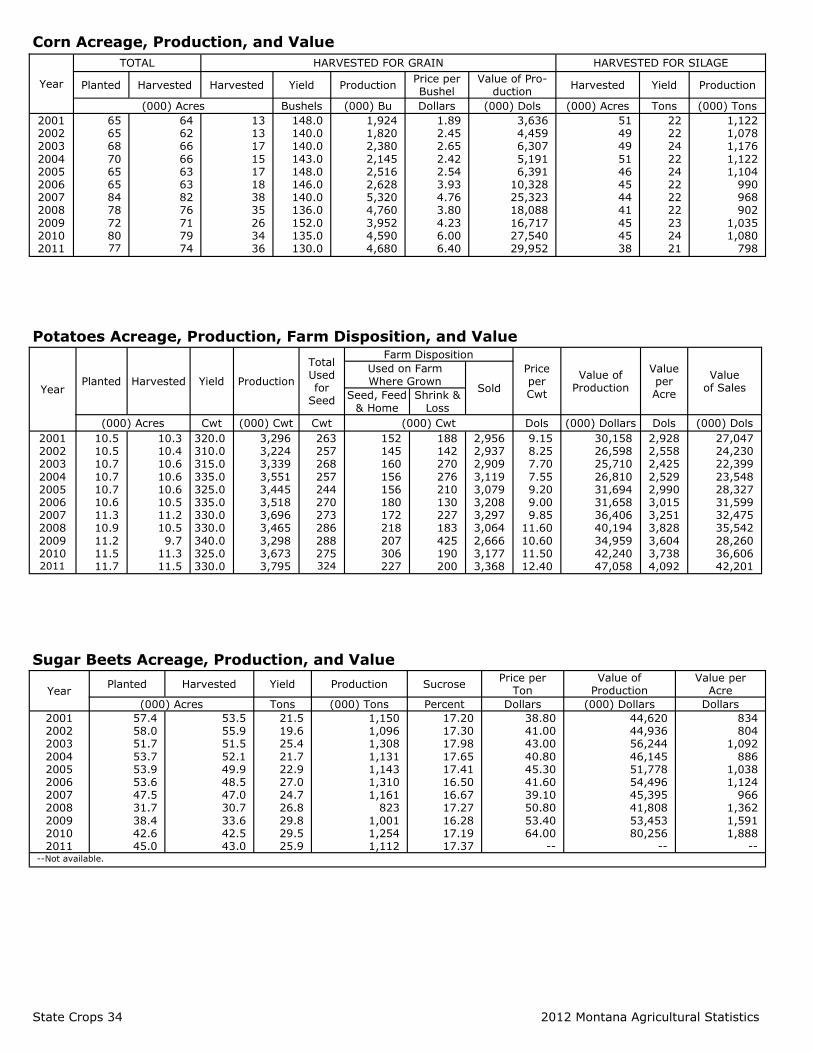
State Crops 34 2012 Montana Agricultural Statistics
Corn Acreage, Production, and Value
Year
TOTAL HARVESTED FOR GRAIN HARVESTED FOR SILAGE
Planted Harvested Harvested Yield Production Price per Bushel
Value of Pro-duction
Harvested Yield Production
(000) Acres Bushels (000) Bu Dollars (000) Dols (000) Acres Tons (000) Tons
2001 2002 2003 2004 2005 2006 2007 2008 2009 2010 2011
65 65 68 70 65 65 84 78 72 80 77
64 62 66 66 63 63 82 76 71 79 74
13 13 17 15 17 18 38 35 26 34 36
148.0 140.0 140.0 143.0 148.0 146.0 140.0 136.0 152.0 135.0 130.0
1,924 1,820 2,380 2,145 2,516 2,628 5,320 4,760 3,952 4,590 4,680
1.89 2.45 2.65 2.42 2.54 3.93 4.76 3.80 4.23 6.00 6.40
3,636 4,459 6,307 5,191 6,391
10,328 25,323 18,088 16,717 27,540 29,952
51 49 49 51 46 45 44 41 45 45 38
22 22 24 22 24 22 22 22 23 24 21
1,122 1,078 1,176 1,122 1,104
990 968 902
1,035 1,080
798
Potatoes Acreage, Production, Farm Disposition, and Value
Year Planted Harvested Yield Production
Total Used for
Seed
Farm Disposition Price per Cwt
Value of Production
Value per Acre
Value of Sales
Used on Farm Where Grown
Sold Seed, Feed
& Home
Shrink & Loss
(000) Acres Cwt (000) Cwt Cwt (000) Cwt Dols (000) Dollars Dols (000) Dols
2001 2002 2003 2004 2005 2006 2007 2008 2009 2010 2011
10.5 10.5 10.7 10.7 10.7 10.6 11.3 10.9 11.2 11.5 11.7
10.3 10.4 10.6 10.6 10.6 10.5 11.2 10.5 9.7
11.3 11.5
320.0 310.0 315.0 335.0 325.0 335.0 330.0 330.0 340.0 325.0 330.0
3,296 3,224 3,339 3,551 3,445 3,518 3,696 3,465 3,298 3,673 3,795
263 257 268 257 244 270 273 286 288 275 324
152 145 160 156 156 180 172 218 207 306 227
188 142 270 276 210 130 227 183 425 190 200
2,956 2,937 2,909 3,119 3,079 3,208 3,297 3,064 2,666 3,177 3,368
9.15 8.25 7.70 7.55 9.20 9.00 9.85
11.60 10.60 11.50 12.40
30,158 26,598 25,710 26,810 31,694 31,658 36,406 40,194 34,959 42,240 47,058
2,928 2,558 2,425 2,529 2,990 3,015 3,251 3,828 3,604 3,738 4,092
27,047 24,230 22,399 23,548 28,327 31,599 32,475 35,542 28,260 36,606 42,201
Sugar Beets Acreage, Production, and Value
Year Planted Harvested Yield Production Sucrose
Price per Ton
Value of Production
Value per Acre
(000) Acres Tons (000) Tons Percent Dollars (000) Dollars Dollars
2001 2002 2003 2004 2005 2006 2007 2008 2009 2010 2011
57.4 58.0 51.7 53.7 53.9 53.6 47.5 31.7 38.4 42.6 45.0
53.5 55.9 51.5 52.1 49.9 48.5 47.0 30.7 33.6 42.5 43.0
21.5 19.6 25.4 21.7 22.9 27.0 24.7 26.8 29.8 29.5 25.9
1,150 1,096 1,308 1,131 1,143 1,310 1,161
823 1,001 1,254 1,112
17.20 17.30 17.98 17.65 17.41 16.50 16.67 17.27 16.28 17.19 17.37
38.80 41.00 43.00 40.80 45.30 41.60 39.10 50.80 53.40 64.00
--
44,620 44,936 56,244 46,145 51,778 54,496 45,395 41,808 53,453 80,256
--
834 804
1,092 886
1,038 1,124
966 1,362 1,591 1,888
-- --Not available.

2012 Montana Agricultural Statistics State Crops 35
All Dry Beans Acreage, Production, and Value
Year Planted Harvested Yield Production
Price per Cwt
Value of Production
Value per Acre
(000) Acres Pounds (000) Cwt Dollars (000) Dols Dollars
2001
2002
2003
2004
2005
2006
2007
2008
2009
2010 2011
43.5
26.9
13.0
13.0
18.0
19.5
18.3
11.2
11.9
18.8 15.0
28.5
23.0
12.8
12.7
14.1
18.6
16.6
9.8
11.5
17.7 14.8
1,320
1,600
1,820
2,240
2,000
1,640
1,670
1,950
2,100
2,030 1,820
376
367
233
285
282
305
278
191
242
359 270
17.30
15.20
18.20
28.70
18.60
20.50
25.00
33.50
28.60
27.00 34.00
6,505
5,578
4,241
8,180
5,245
6,253
6,950
6,399
6,921
9,693 9,180
228
243
331
644
372
336
419
653
602
548 620
1/ Small garbanzo beans (chickpeas) are less than 20/64 in. and large are over 20/64 in. -- Not available.
Pinto Beans Acreage and Production
Year Planted Harvested Yield Production
(000) Acres Pounds (000) Cwt 2001 2002 2003 2004 2005 2006 2007 2008 2009 2010 2011
11.5 13.5 9.7
10.8 12.0 10.7 8.5 8.6 9.6
12.5 5.0
10.0 12.9 9.7
10.6 10.0 10.5 8.4 7.2 9.2
11.8 5.0
2,000 2,250 2,150 2,380 2,390 2,230 2,280 2,420 2,440 2,330 2,600
200 290 209 252 239 234 192 174 224 275 130
Garbanzo Beans Acreage and Production 1/
Year
Planted Harvested Yield Production
Small Large Total Small Large Total Small Large Total Small Large Total
(000) Acres (000) Acres Pounds (000) Cwt
2001 2002 2003 2004 2005 2006 2007 2008 2009 2010 2011
-- --
2.1 0.9 1.4 2.4 1.6 0.9 1.9
-- --
-- --
1.1 1.3 4.6 6.4 8.2 1.7 0.4
-- --
31.5 12.7 3.2 2.2 6.0 8.8 9.8 2.6 2.3 6.3 9.0
-- --
2.0 0.8 1.3 1.9 1.5 0.9 1.9
-- --
-- --
1.0 1.3 2.8 6.2 6.7 1.7 0.4
-- --
18.0 9.6 3.0 2.1 4.1 8.1 8.2 2.6 2.3 5.9 8.9
-- --
9.0 17.5 11.5 8.0 9.6
13.5 8.6
-- --
-- --
400 1,460 1,000
900 1,080
320 600
-- --
950 760 730
1,570 1,050
880 1,050
650 780
1,420 1,340
-- --
18 14 15 15 14 12 16 -- --
-- -- 4
19 28 56 72 5 2 -- --
171 73 22 33 43 71 86 17 18 84
119
1/ Small garbanzo beans (chickpeas) are less than 20/64 in. and large are over 20/64 in. -- Not available.
Lentils Acreage, Production, and Value
Year Planted Harvested Yield Production Price per Cwt Value of Production
Value per Acre
(000) Acres Pounds (000) Cwt Dollars (000) Dollars Dollars 2001 2002 2003 2004 2005 2006 2007 2008 2009 2010 2011
22.0 25.0 30.0 78.0
150.0 142.0 87.0 83.0
122.0 260.0 260.0
20.0 22.0 26.0 72.0
146.0 134.0 85.0 79.0
116.0 247.0 247.0
1,100 750
1,050 1,400 1,280
600 1,150
770 1,380 1,360 1,100
220 165 273
1,008 1,869
804 978 608
1,601 3,359 2,717
11.00 13.80 15.40 15.10 9.54
10.80 21.80 34.90 27.20 23.90 23.70
2,420 2,277 4,204
15,221 17,830 8,683
21,320 21,219 43,547 80,280 64,393
121 104 162 211 122 65
251 269 375 325 261

State Crops 36 2012 Montana Agricultural Statistics
All Dry Peas Acreage, Production, and Value
Year Planted Harvested Yield Production
Price per Cwt
Value of Production Value per
Acre (000) Acres Pounds (000) Cwt Dollars (000) Dollars Dollars
2001 2002 2003 2004 2005 2006 2007 2008 2009 2010 2011
26.0 32.0 33.0 68.0
135.0 210.0 235.0 245.0 240.0 220.0 190.0
16.5 27.0 31.0 63.0
122.0 191.0 217.0 231.0 226.0 207.0 177.0
1,510 800
1,450 2,010 1,800 1,080 1,700 1,080 1,330 2,000 1,500
249 216 450
1,266 2,196 2,063 3,689 2,495 3,006 4,140 2,655
4.90 7.20 8.10 5.91 4.80 6.64
12.40 14.50 8.46 9.13
14.80
1,220 1,555 3,645 7,482
10,541 13,698 45,744 36,178 25,431 37,798 39,294
74 58
118 119 86 72
211 157 113 183 222
Austrian Winter Peas Acreage, Production, and Value
Year Planted Harvested Yield Production
Price per Cwt
Value of Production Value per
Acre
(000) Acres Pounds (000) Cwt Dollars (000) Dollars Dollars 2001 9.9 2.5 790 20.0 11.00 220 88 2002 2003 2004 2005 2006 2007 2008 2009 2010 2011
9.5 9.5
14.0 25.0 32.0 20.0 10.0 10.0 16.0 10.0
3.5 7.0
11.0 13.0 12.0 4.0 3.0 6.0 7.0 6.0
720 800 900
1,220 920 910 960 930
1,570 1,200
25.0 56.0 99.0
159.0 110.0 36.0 29.0 56.0
110.0 72.0
10.00 10.40 10.10 8.67 7.93
13.20 21.70 21.70 15.50 20.00
250 582
1,000 1,379
872 475 629
1,211 1,705 1,440
71 83 91
106 73
119 210 202 244 240
Canola Acreage, Production, and Value
Year Planted Harvested Yield Production
Price per Cwt
Value of Production Value per Acre
(000) Acres Pounds (000) Pounds Dollars (000) Dollars Dollars 2001 2002 2003 2004 2005 2006 2007 2008 2009 2010 2011
58.0 37.5 28.0 15.0 17.0 10.0 8.5 7.5 6.5
17.5 31.0
49.5 34.5 27.0 15.0 16.5 9.8 8.1 7.4 6.5
17.1 30.5
910.0 900.0 940.0
1,590.0 1,290.0 1,120.0 1,190.0 1,910.0 1,660.0 1,730.0 1,370.0
45,045 31,050 25,380 23,850 21,285 10,976 9,639
14,134 10,790 29,583 41,785
-- -- -- --
9.00 11.70 19.50 16.50 13.50 20.00 22.50
-- -- -- --
1,916 1,284 1,880 2,332 1,457 5,917 9,402
-- -- -- --
116 131 232 315 224 346 308
-- Not available.
Camelina Acreage and Production
Year Planted Harvested Yield Production
(000) Acres Pounds (000)
Pounds 2007 2008 2009 2010 2011
22.5 12.2 20.8 9.9 2.5
20.4 9.1
19.5 9.4 2.4
598.0 569.0 615.0
1,010.0 750.0
12,197.0 5,181.5
11,998.0 9,465.0 1,800.0
Mustard Seed Acreage, Production, and Value
Planted Harvested Yield Production Year
(000) Acres Pounds (000) Pounds
2001 2002 2003 2004 2005 2006 2007 2008 2009 2010 2011
11.0 27.0 20.5 11.5 11.5 7.0
16.0 28.0 18.0 16.5 11.0
10.0 25.0 20.2 11.4 10.8 6.9
14.2 24.4 17.7 16.0 10.3
850.0 480.0 610.0 700.0 580.0 570.0 450.0 410.0 920.0 800.0 490.0
8,500 12,000 12,322 7,980 6,264 3,933 6,390
10,004 16,284 12,800 5,047

2012 Montana Agricultural Statistics State Crops 37
Flaxseed Acreage, Production, and Value
Safflower Acreage, Production, and Value
Year Planted Harvested Yield Production
Price per Cwt
Value of Production Value
per Acre (000) Acres Pounds (000) Pounds Dollars (000) Dollars Dollars
2001 2002 2003 2004 2005 2006 2007 2008 2009 2010 2011
31.0 39.0 42.5 33.5 30.0 39.0 39.0 29.0 31.0 28.0 14.0
28.0 36.0 42.0 31.0 29.0 37.0 37.5 28.0 30.5 27.0 13.8
800.0 750.0 770.0 680.0 890.0 750.0 850.0 600.0 770.0 850.0 850.0
22,400 27,000 32,340 21,080 25,810 27,750 31,875 16,800 23,485 22,950 11,730
-- -- -- --
14.00 13.50 16.50 27.50 19.00 19.00 27.00
-- -- -- --
3,613 3,746 5,259 4,620 4,462 4,361 3,167
-- -- -- --
125 101 140 165 146 162 229
-- Not available.
Sweet Cherries Production and Value
Year Bearing
Yield per Acre
Total Production
Utilized Production
Average Price per Ton
Value of Production
Acres Tons Dollars (000) Dollars 2001 2002 2003 2004 2005 2006 2007 2008 2009 2010 2011
-- -- -- --
740 750 720 710 710 730 720
-- -- -- --
1.66 3.20 3.39 2.20 3.37 3.38 2.80
2,300 2,350 2,060 2,360 1,230 2,400 2,440 1,560 2,390 2,470 2,015
1,850 2,220 1,850 2,220 1,180
580 2,180 1,450 1,055 2,050 1,650
1,130 1,840 1,710 2,010 3,530 1,850 1,630 2,730 1,490 1,960 2,470
2,082 4,082 3,163 4,473 4,165 1,071 3,561 3,958 1,567 4,026 4,068
-- Not available.
Leaf Cutter Bees Utilized for Alfalfa Seed Production
Year
TOTAL ACRES HARVESTED
IRRIGATED ACRES NON-IRRIGATED ACRES
Quantity Utilized Acreage Utilized Average Quantity
Used Acreage Utilized
Average Quantity Used
Gallons per Acre Percent Gallons per Acre Percent Gallons per Acre 2001 2002 2003 2004 2005 2006 2007 2008 2009 2010 2011
2.1 3.1 3.8 3.8 3.2 3.0 3.2 3.2 3.5 3.3 3.3
84 72 39 33 44 45 66 85
100 97 74
3.1 3.3 4.2 4.2 3.3 3.0 3.2 3.2 3.4 3.4 3.5
21 12 12 11 24 -- -- -- -- -- --
2.7 2.5 1.1
-- -- -- -- -- -- -- --
-- Not available.
Year Planted Harvested Yield Production
Price per
Bushel Value of Production Value per Acre
Bushels (000) Bushels Dollars (000) Dollars Dollars (000) Acres
2001 2002 2003 2004 2005 2006 2007 2008 2009 2010 2011
14.0 17.0 17.0 20.0 55.0 35.0 21.0 9.0
11.0 15.0 17.0
12.0 15.0 17.0 19.0 54.0 33.0 20.0 8.0
10.0 15.0 16.0
15 13 13 18 17 9 9 9
16 17 13
180 195 221 342 918 297 180 72
160 255 208
4.35 6.15 5.80 7.94 6.20 6.13
13.00 17.70 7.80
11.20 13.60
783 1,199 1,282 2,715 5,692 1,821 2,340 1,274 1,248 2,856 2,829
65 80 75
143 105 55
117 159 125 190 177

State Crops 38 2012 Montana Agricultural Statistics
Alfalfa Seed Acreage, Production, and Value
Year
ALL IRRIGATED NON- IRRIGATED
Harvested Yield Production Price per Pound
Value of Production
Harvested Yield Harvested Yield
(000) Acres
Pounds (000) Pounds Dollars (000) Dollars (000) Acres Pounds (000) Acres Pounds
2001 2002 2003 2004 2005 2006 2007 2008 2009 2010 2011
9.0 6.7 6.2 5.8 6.1
10.7 12.2 8.9 7.1 7.0 6.6
367 296 335 382 413 399 360 383 459 465 415
3,300 1,980 2,075 2,214 2,519 4,270 4,392 3,407 3,261 3,258 2,742
1.27 1.15 1.01 0.99 1.13 1.13 1.34 1.95 1.94 1.66 2.02
4,191 2,277 2,096 2,192 2,846 4,825 5,885 6,644 6,326 5,408 5,539
6.7 5.0 4.1 3.9 5.1 6.5 7.0 6.1 5.9 6.6 4.9
477 370 460 532 450 518 533 507 499 486 496
2.3 1.7 2.1 1.9 1.0 4.2 5.2 2.8 1.2 0.4 1.7
44 78 90 73
224 215 127 112 262 125 183
All Hay Harvested Acreage, Yield, Production, and Value
Year Harvested Yield Production
Price per Ton
Value of Production
Value per Acre
(000) Acres Tons (000) Tons Dollars (000) Dollars Dollars
2001 2002 2003 2004 2005 2006 2007 2008 2009 2010 2011
2,650 2,600 2,450 2,500 3,000 2,260 2,600 2,400 2,500 2,850 2,700
1.88 1.75 1.89 1.90 1.95 1.91 1.96 1.70 1.91 2.14 2.07
4,990 4,540 4,635 4,760 5,850 4,320 5,090 4,080 4,770 6,105 5,590
94.00 82.50 73.50 76.00 71.00 78.00 78.50
116.00 95.50 80.00 98.00
464,050 369,730 339,338 355,740 409,350 340,155 400,760 471,120 457,920 488,775 547,820
175 142 139 142 136 151 154 196 183 172 203
Alfalfa Hay Harvested Acreage, Yield, Production, and Value
Year New Seedings Harvested Yield Production
Price per Ton
Value of Production
Value per Acre
(000) Acres (000) Acres Tons (000) Tons Dollars (000) Dollars Dollars
2001 2002 2003 2004 2005 2006 2007 2008 2009 2010 2011
120
120
120
105
135
125
135
85
100
125 80
1,600
1,500
1,600
1,400
1,750
1,550
1,700
1,600
1,700
1,950 2,000
2.2
2.0
2.1
2.3
2.2
2.1
2.2
1.9
2.1
2.3 2.2
3,520
3,000
3,360
3,220
3,850
3,255
3,740
3,040
3,570
4,485 4,400
95.50
85.00
75.00
77.00
71.00
78.00
79.00
117.00
96.00
79.00 98.00
336,160
255,000
252,000
247,940
273,350
253,890
295,460
355,680
342,720
354,315 431,200
210
170
158
177
156
164
174
222
202
182 216
All Other Hay Harvested Acreage, Yield, Production, and Value 1/
Year Harvested Yield Production
Price per Ton
Value of Production
Value per Acre
(000) Acres Tons (000) Tons Dollars (000) Dollars Dollars
2001 2002 2003 2004 2005 2006 2007 2008 2009 2010 2011
1,050 1,100
850 1,100 1,250
710 900 800 800 900 700
1.4 1.4 1.5 1.4 1.6 1.5 1.5 1.3 1.5 1.8 1.7
1,470 1,540 1,275 1,540 2,000 1,065 1,350 1,040 1,200 1,620 1,190
87.00 74.50 68.50 70.00 68.00 81.00 78.00
111.00 96.00 83.00 94.00
127,890 114,730 87,338
107,800 136,000 86,265
105,300 115,440 115,200 134,460 111,860
122 104 103 98
109 122 117 144 144 149 160
1/ All other hay includes wild, clover-timothy, grain hay, other hay and hay on CRP land.
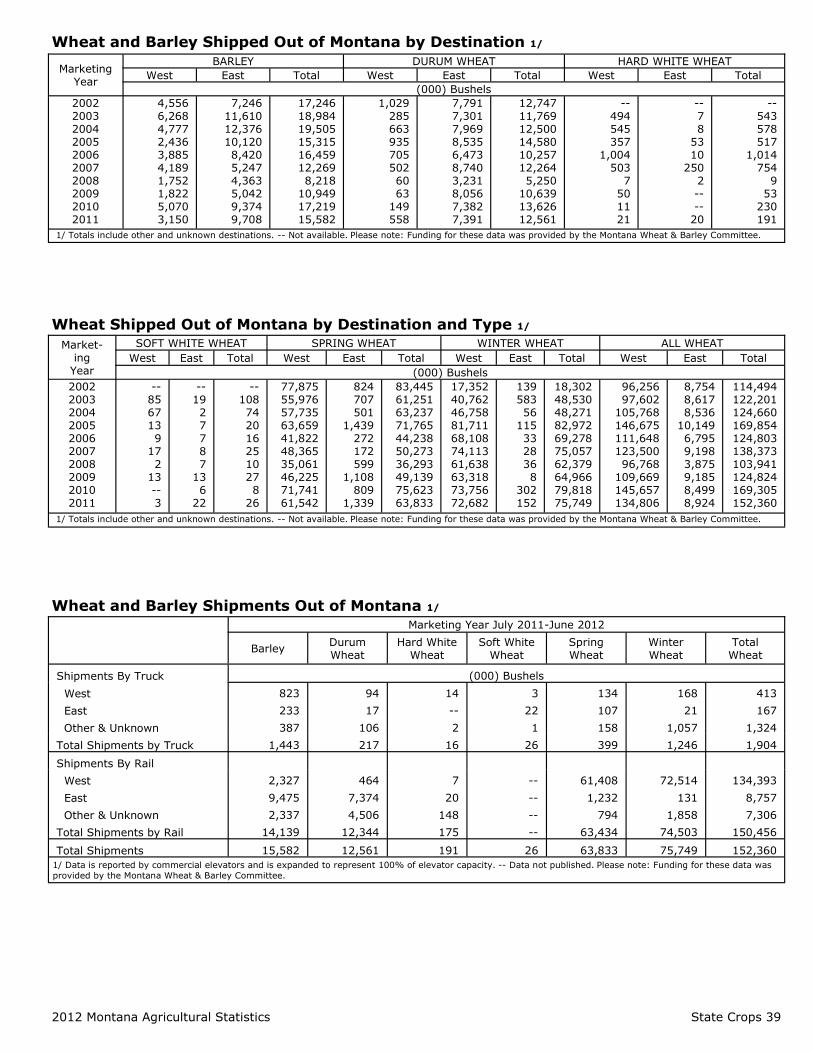
2012 Montana Agricultural Statistics State Crops 39
Wheat and Barley Shipped Out of Montana by Destination 1/
Marketing Year
BARLEY DURUM WHEAT HARD WHITE WHEAT West East Total West East Total West East Total
(000) Bushels 2002 2003 2004 2005 2006 2007 2008 2009 2010 2011
4,556 6,268 4,777 2,436 3,885 4,189 1,752 1,822 5,070 3,150
7,246 11,610 12,376 10,120 8,420 5,247 4,363 5,042 9,374 9,708
17,246 18,984 19,505 15,315 16,459 12,269 8,218
10,949 17,219 15,582
1,029 285 663 935 705 502 60 63
149 558
7,791 7,301 7,969 8,535 6,473 8,740 3,231 8,056 7,382 7,391
12,747 11,769 12,500 14,580 10,257 12,264 5,250
10,639 13,626 12,561
-- 494 545 357
1,004 503
7 50 11 21
-- 7 8
53 10
250 2 -- --
20
-- 543 578 517
1,014 754
9 53
230 191
1/ Totals include other and unknown destinations. -- Not available. Please note: Funding for these data was provided by the Montana Wheat & Barley Committee.
Wheat Shipped Out of Montana by Destination and Type 1/
Market-ing
Year
SOFT WHITE WHEAT SPRING WHEAT WINTER WHEAT ALL WHEAT
West East Total West East Total West East Total West East Total
(000) Bushels
2002 2003 2004 2005 2006 2007 2008 2009 2010 2011
-- 85 67 13 9
17 2
13 -- 3
-- 19 2 7 7 8 7
13 6
22
-- 108 74 20 16 25 10 27 8
26
77,875 55,976 57,735 63,659 41,822 48,365 35,061 46,225 71,741 61,542
824 707 501
1,439 272 172 599
1,108 809
1,339
83,445 61,251 63,237 71,765 44,238 50,273 36,293 49,139 75,623 63,833
17,352 40,762 46,758 81,711 68,108 74,113 61,638 63,318 73,756 72,682
139 583 56
115 33 28 36 8
302 152
18,302 48,530 48,271 82,972 69,278 75,057 62,379 64,966 79,818 75,749
96,256 97,602
105,768 146,675 111,648 123,500 96,768
109,669 145,657 134,806
8,754 8,617 8,536
10,149 6,795 9,198 3,875 9,185 8,499 8,924
114,494 122,201 124,660 169,854 124,803 138,373 103,941 124,824 169,305 152,360
1/ Totals include other and unknown destinations. -- Not available. Please note: Funding for these data was provided by the Montana Wheat & Barley Committee.
Wheat and Barley Shipments Out of Montana 1/
Marketing Year July 2011-June 2012
Barley Durum Wheat
Hard White Wheat
Soft White Wheat
Spring Wheat
Winter Wheat
Total Wheat
Shipments By Truck (000) Bushels
West 823 94 14 3 134 168 413
East 233 17 -- 22 107 21 167
Other & Unknown 387 106 2 1 158 1,057 1,324
Total Shipments by Truck 1,443 217 16 26 399 1,246 1,904
Shipments By Rail
West 2,327 464 7 -- 61,408 72,514 134,393
East 9,475 7,374 20 -- 1,232 131 8,757
Other & Unknown 2,337 4,506 148 -- 794 1,858 7,306
Total Shipments by Rail 14,139 12,344 175 -- 63,434 74,503 150,456
Total Shipments 15,582 12,561 191 26 63,833 75,749 152,360
1/ Data is reported by commercial elevators and is expanded to represent 100% of elevator capacity. -- Data not published. Please note: Funding for these data was
provided by the Montana Wheat & Barley Committee.
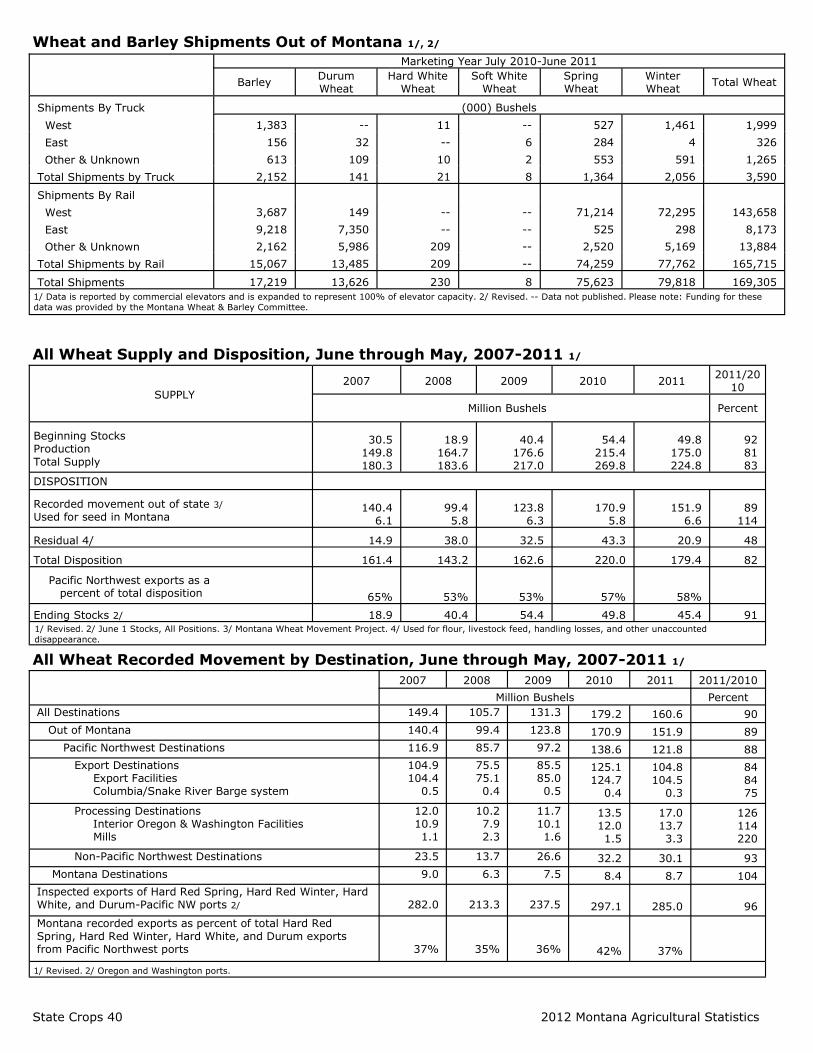
State Crops 40 2012 Montana Agricultural Statistics
Wheat and Barley Shipments Out of Montana 1/, 2/
Marketing Year July 2010-June 2011
Barley Durum Wheat
Hard White Wheat
Soft White Wheat
Spring Wheat
Winter Wheat
Total Wheat
Shipments By Truck (000) Bushels
West 1,383 -- 11 -- 527 1,461 1,999
East 156 32 -- 6 284 4 326
Other & Unknown 613 109 10 2 553 591 1,265
Total Shipments by Truck 2,152 141 21 8 1,364 2,056 3,590
Shipments By Rail
West 3,687 149 -- -- 71,214 72,295 143,658
East 9,218 7,350 -- -- 525 298 8,173
Other & Unknown 2,162 5,986 209 -- 2,520 5,169 13,884
Total Shipments by Rail 15,067 13,485 209 -- 74,259 77,762 165,715
Total Shipments 17,219 13,626 230 8 75,623 79,818 169,305
1/ Data is reported by commercial elevators and is expanded to represent 100% of elevator capacity. 2/ Revised. -- Data not published. Please note: Funding for these
data was provided by the Montana Wheat & Barley Committee.
All Wheat Supply and Disposition, June through May, 2007-2011 1/
SUPPLY
2007 2008 2009 2010 2011 2011/20
10
Million Bushels Percent
Beginning Stocks Production
Total Supply
30.5 149.8 180.3
18.9 164.7 183.6
40.4 176.6 217.0
54.4 215.4 269.8
49.8 175.0 224.8
92 81 83
DISPOSITION
Recorded movement out of state 3/ Used for seed in Montana
140.4 6.1
99.4 5.8
123.8 6.3
170.9 5.8
151.9 6.6
89 114
Residual 4/ 14.9 38.0 32.5 43.3 20.9 48
Total Disposition 161.4 143.2 162.6 220.0 179.4 82
Pacific Northwest exports as a percent of total disposition 65% 53% 53% 57% 58%
Ending Stocks 2/ 18.9 40.4 54.4 49.8 45.4 91
1/ Revised. 2/ June 1 Stocks, All Positions. 3/ Montana Wheat Movement Project. 4/ Used for flour, livestock feed, handling losses, and other unaccounted
disappearance.
All Wheat Recorded Movement by Destination, June through May, 2007-2011 1/
2007 2008 2009 2010 2011 2011/2010
Million Bushels Percent
All Destinations 149.4 105.7 131.3 179.2 160.6 90
Out of Montana 140.4 99.4 123.8 170.9 151.9 89
Pacific Northwest Destinations 116.9 85.7 97.2 138.6 121.8 88
Export Destinations Export Facilities Columbia/Snake River Barge system
104.9 104.4
0.5
75.5 75.1 0.4
85.5 85.0 0.5
125.1 124.7
0.4
104.8 104.5
0.3
84 84 75
Processing Destinations Interior Oregon & Washington Facilities Mills
12.0 10.9 1.1
10.2 7.9 2.3
11.7 10.1 1.6
13.5 12.0 1.5
17.0 13.7 3.3
126 114 220
Non-Pacific Northwest Destinations 23.5 13.7 26.6 32.2 30.1 93
Montana Destinations 9.0 6.3 7.5 8.4 8.7 104
Inspected exports of Hard Red Spring, Hard Red Winter, Hard White, and Durum-Pacific NW ports 2/
282.0
213.3
237.5
297.1
285.0
96
Montana recorded exports as percent of total Hard Red Spring, Hard Red Winter, Hard White, and Durum exports from Pacific Northwest ports
37%
35%
36%
42%
37%
1/ Revised. 2/ Oregon and Washington ports.
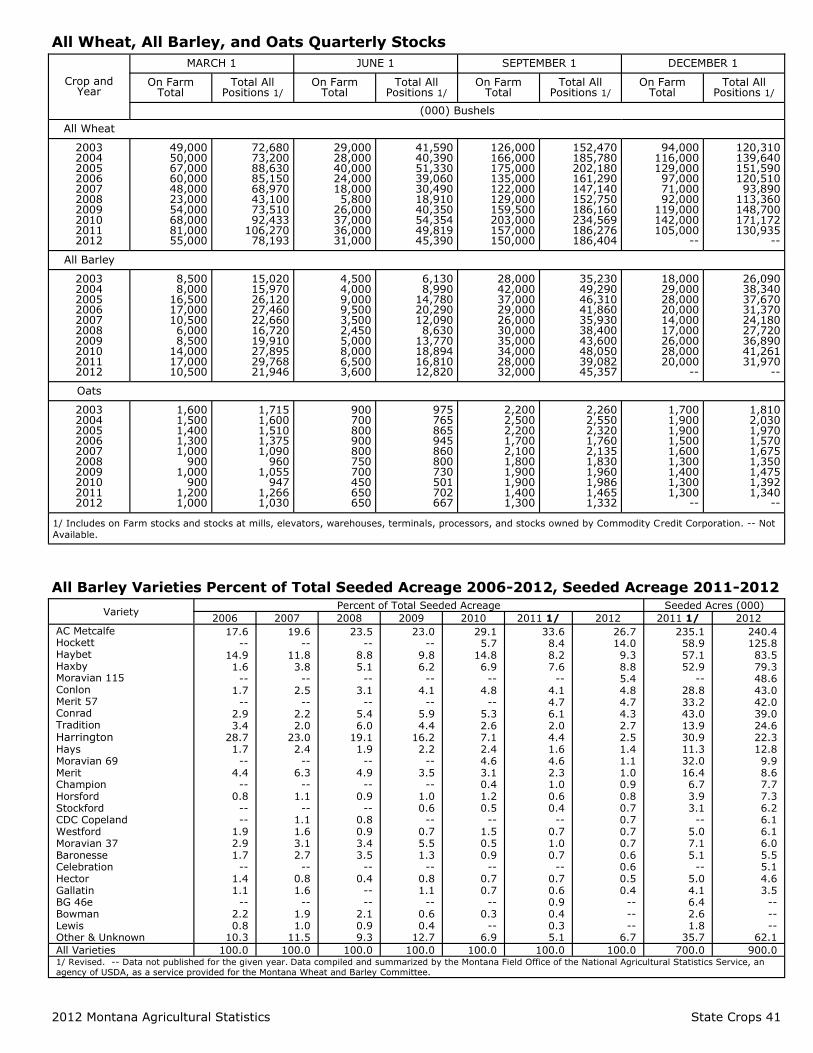
2012 Montana Agricultural Statistics State Crops 41
All Wheat, All Barley, and Oats Quarterly Stocks
All Barley Varieties Percent of Total Seeded Acreage 2006-2012, Seeded Acreage 2011-2012
Variety Percent of Total Seeded Acreage Seeded Acres (000)
2006 2007 2008 2009 2010 2011 1/ 2012 2011 1/ 2012
AC Metcalfe Hockett Haybet Haxby Moravian 115 Conlon Merit 57 Conrad Tradition
Harrington Hays Moravian 69 Merit Champion Horsford Stockford CDC Copeland Westford Moravian 37 Baronesse Celebration Hector Gallatin BG 46e Bowman Lewis Other & Unknown
17.6 --
14.9 1.6
-- 1.7
-- 2.9 3.4
28.7 1.7
-- 4.4
-- 0.8
-- --
1.9 2.9 1.7
-- 1.4 1.1
-- 2.2 0.8
10.3
19.6 --
11.8 3.8
-- 2.5
-- 2.2 2.0
23.0 2.4
-- 6.3
-- 1.1
-- 1.1 1.6 3.1 2.7
-- 0.8 1.6
-- 1.9 1.0
11.5
23.5 --
8.8 5.1
-- 3.1
-- 5.4 6.0
19.1 1.9
-- 4.9
-- 0.9
-- 0.8 0.9 3.4 3.5
-- 0.4
-- --
2.1 0.9 9.3
23.0 --
9.8 6.2
-- 4.1
-- 5.9 4.4
16.2 2.2
-- 3.5
-- 1.0 0.6
-- 0.7 5.5 1.3
-- 0.8 1.1
-- 0.6 0.4
12.7
29.1 5.7
14.8 6.9
-- 4.8
-- 5.3 2.6 7.1 2.4 4.6 3.1 0.4 1.2 0.5
-- 1.5 0.5 0.9
-- 0.7 0.7
-- 0.3
-- 6.9
33.6 8.4 8.2 7.6
-- 4.1 4.7 6.1 2.0 4.4 1.6 4.6 2.3 1.0 0.6 0.4
-- 0.7 1.0 0.7
-- 0.7 0.6 0.9 0.4 0.3 5.1
26.7 14.0 9.3 8.8 5.4 4.8 4.7 4.3 2.7 2.5 1.4 1.1 1.0 0.9 0.8 0.7 0.7 0.7 0.7 0.6 0.6 0.5 0.4
-- -- --
6.7
235.1 58.9 57.1 52.9
-- 28.8 33.2 43.0 13.9 30.9 11.3 32.0 16.4 6.7 3.9 3.1
-- 5.0 7.1 5.1
-- 5.0 4.1 6.4 2.6 1.8
35.7
240.4 125.8 83.5 79.3 48.6 43.0 42.0 39.0 24.6 22.3 12.8 9.9 8.6 7.7 7.3 6.2 6.1 6.1 6.0 5.5 5.1 4.6 3.5
-- -- --
62.1
All Varieties 100.0 100.0 100.0 100.0 100.0 100.0 100.0 700.0 900.0 1/ Revised. -- Data not published for the given year. Data compiled and summarized by the Montana Field Office of the National Agricultural Statistics Service, an agency of USDA, as a service provided for the Montana Wheat and Barley Committee.
Crop and Year
MARCH 1 JUNE 1 SEPTEMBER 1 DECEMBER 1
On Farm Total
Total All Positions 1/
On Farm Total
Total All Positions 1/
On Farm Total
Total All Positions 1/
On Farm Total
Total All Positions 1/
(000) Bushels
All Wheat
2003 2004 2005 2006 2007 2008 2009 2010 2011 2012
49,000 50,000 67,000 60,000 48,000 23,000 54,000 68,000 81,000 55,000
72,680 73,200 88,630 85,150 68,970 43,100 73,510 92,433
106,270 78,193
29,000 28,000 40,000 24,000 18,000 5,800
26,000 37,000 36,000 31,000
41,590 40,390 51,330 39,060 30,490 18,910 40,350 54,354 49,819 45,390
126,000 166,000 175,000 135,000 122,000 129,000 159,500 203,000 157,000 150,000
152,470 185,780 202,180 161,290 147,140 152,750 186,160 234,569 186,276 186,404
94,000 116,000 129,000 97,000 71,000 92,000
119,000 142,000 105,000
--
120,310 139,640 151,590 120,510 93,890
113,360 148,700 171,172 130,935
--
All Barley
2003 2004 2005 2006 2007 2008 2009 2010 2011 2012
8,500 8,000
16,500 17,000 10,500 6,000 8,500
14,000 17,000 10,500
15,020 15,970 26,120 27,460 22,660 16,720 19,910 27,895 29,768 21,946
4,500 4,000 9,000 9,500 3,500 2,450 5,000 8,000 6,500 3,600
6,130 8,990
14,780 20,290 12,090 8,630
13,770 18,894 16,810 12,820
28,000 42,000 37,000 29,000 26,000 30,000 35,000 34,000 28,000 32,000
35,230 49,290 46,310 41,860 35,930 38,400 43,600 48,050 39,082 45,357
18,000 29,000 28,000 20,000 14,000 17,000 26,000 28,000 20,000
--
26,090 38,340 37,670 31,370 24,180 27,720 36,890 41,261 31,970
--
Oats
2003 2004 2005 2006 2007 2008 2009 2010 2011 2012
1,600 1,500 1,400 1,300 1,000
900 1,000
900 1,200 1,000
1,715 1,600 1,510 1,375 1,090
960 1,055
947 1,266 1,030
900 700 800 900 800 750 700 450 650 650
975 765 865 945 860 800 730 501 702 667
2,200 2,500 2,200 1,700 2,100 1,800 1,900 1,900 1,400 1,300
2,260 2,550 2,320 1,760 2,135 1,830 1,960 1,986 1,465 1,332
1,700 1,900 1,900 1,500 1,600 1,300 1,400 1,300 1,300
--
1,810 2,030 1,970 1,570 1,675 1,350 1,475 1,392 1,340
--
1/ Includes on Farm stocks and stocks at mills, elevators, warehouses, terminals, processors, and stocks owned by Commodity Credit Corporation. -- Not
Available.
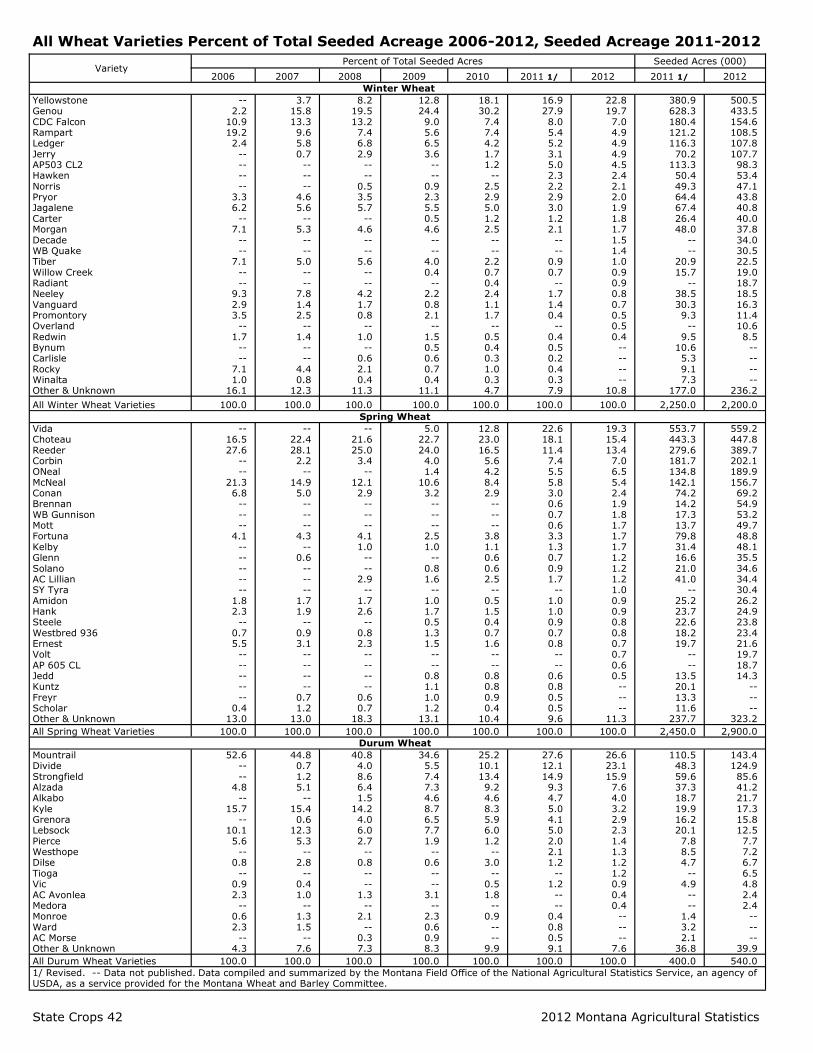
State Crops 42 2012 Montana Agricultural Statistics
All Wheat Varieties Percent of Total Seeded Acreage 2006-2012, Seeded Acreage 2011-2012
Variety Percent of Total Seeded Acres Seeded Acres (000)
2006 2007 2008 2009 2010 2011 1/ 2012 2011 1/ 2012
Winter Wheat
Yellowstone Genou CDC Falcon Rampart Ledger Jerry AP503 CL2 Hawken Norris Pryor Jagalene Carter Morgan Decade WB Quake Tiber Willow Creek Radiant Neeley Vanguard Promontory Overland Redwin Bynum Carlisle Rocky Winalta Other & Unknown
-- 2.2
10.9 19.2 2.4
-- -- -- --
3.3 6.2
-- 7.1
-- --
7.1 -- --
9.3 2.9 3.5
-- 1.7
-- --
7.1 1.0
16.1
3.7 15.8 13.3 9.6 5.8 0.7
-- -- --
4.6 5.6
-- 5.3
-- --
5.0 -- --
7.8 1.4 2.5
-- 1.4
-- --
4.4 0.8
12.3
8.2 19.5 13.2 7.4 6.8 2.9
-- --
0.5 3.5 5.7
-- 4.6
-- --
5.6 -- --
4.2 1.7 0.8
-- 1.0
-- 0.6 2.1 0.4
11.3
12.8 24.4 9.0 5.6 6.5 3.6
-- --
0.9 2.3 5.5 0.5 4.6
-- --
4.0 0.4
-- 2.2 0.8 2.1
-- 1.5 0.5 0.6 0.7 0.4
11.1
18.1 30.2 7.4 7.4 4.2 1.7 1.2
-- 2.5 2.9 5.0 1.2 2.5
-- --
2.2 0.7 0.4 2.4 1.1 1.7
-- 0.5 0.4 0.3 1.0 0.3 4.7
16.9 27.9 8.0 5.4 5.2 3.1 5.0 2.3 2.2 2.9 3.0 1.2 2.1
-- --
0.9 0.7
-- 1.7 1.4 0.4
-- 0.4 0.5 0.2 0.4 0.3 7.9
22.8 19.7 7.0 4.9 4.9 4.9 4.5 2.4 2.1 2.0 1.9 1.8 1.7 1.5 1.4 1.0 0.9 0.9 0.8 0.7 0.5 0.5 0.4
-- -- -- --
10.8
380.9 628.3 180.4 121.2 116.3 70.2
113.3 50.4 49.3 64.4 67.4 26.4 48.0
-- --
20.9 15.7
-- 38.5 30.3 9.3
-- 9.5
10.6 5.3 9.1 7.3
177.0
500.5 433.5 154.6 108.5 107.8 107.7 98.3 53.4 47.1 43.8 40.8 40.0 37.8 34.0 30.5 22.5 19.0 18.7 18.5 16.3 11.4 10.6 8.5
-- -- -- --
236.2
All Winter Wheat Varieties 100.0 100.0 100.0 100.0 100.0 100.0 100.0 2,250.0 2,200.0
Spring Wheat
Vida Choteau Reeder Corbin ONeal McNeal Conan Brennan WB Gunnison Mott Fortuna Kelby Glenn Solano AC Lillian SY Tyra Amidon Hank Steele Westbred 936 Ernest Volt AP 605 CL Jedd Kuntz Freyr Scholar Other & Unknown
-- 16.5 27.6
-- --
21.3 6.8
-- -- --
4.1 -- -- -- -- --
1.8 2.3
-- 0.7 5.5
-- -- -- -- --
0.4 13.0
-- 22.4 28.1 2.2
-- 14.9 5.0
-- -- --
4.3 --
0.6 -- -- --
1.7 1.9
-- 0.9 3.1
-- -- -- --
0.7 1.2
13.0
-- 21.6 25.0 3.4
-- 12.1 2.9
-- -- --
4.1 1.0
-- --
2.9 --
1.7 2.6
-- 0.8 2.3
-- -- -- --
0.6 0.7
18.3
5.0 22.7 24.0 4.0 1.4
10.6 3.2
-- -- --
2.5 1.0
-- 0.8 1.6
-- 1.0 1.7 0.5 1.3 1.5
-- --
0.8 1.1 1.0 1.2
13.1
12.8 23.0 16.5 5.6 4.2 8.4 2.9
-- -- --
3.8 1.1 0.6 0.6 2.5
-- 0.5 1.5 0.4 0.7 1.6
-- --
0.8 0.8 0.9 0.4
10.4
22.6 18.1 11.4 7.4 5.5 5.8 3.0 0.6 0.7 0.6 3.3 1.3 0.7 0.9 1.7
-- 1.0 1.0 0.9 0.7 0.8
-- --
0.6 0.8 0.5 0.5 9.6
19.3 15.4 13.4 7.0 6.5 5.4 2.4 1.9 1.8 1.7 1.7 1.7 1.2 1.2 1.2 1.0 0.9 0.9 0.8 0.8 0.7 0.7 0.6 0.5
-- -- --
11.3
553.7 443.3 279.6 181.7 134.8 142.1 74.2 14.2 17.3 13.7 79.8 31.4 16.6 21.0 41.0
-- 25.2 23.7 22.6 18.2 19.7
-- --
13.5 20.1 13.3 11.6
237.7
559.2 447.8 389.7 202.1 189.9 156.7 69.2 54.9 53.2 49.7 48.8 48.1 35.5 34.6 34.4 30.4 26.2 24.9 23.8 23.4 21.6 19.7 18.7 14.3
-- -- --
323.2
All Spring Wheat Varieties 100.0 100.0 100.0 100.0 100.0 100.0 100.0 2,450.0 2,900.0
Durum Wheat
Mountrail Divide Strongfield Alzada Alkabo Kyle Grenora Lebsock Pierce Westhope Dilse Tioga Vic AC Avonlea Medora Monroe Ward AC Morse Other & Unknown
52.6 -- --
4.8 --
15.7 --
10.1 5.6
-- 0.8
-- 0.9 2.3
-- 0.6 2.3
-- 4.3
44.8 0.7 1.2 5.1
-- 15.4 0.6
12.3 5.3
-- 2.8
-- 0.4 1.0
-- 1.3 1.5
-- 7.6
40.8 4.0 8.6 6.4 1.5
14.2 4.0 6.0 2.7
-- 0.8
-- --
1.3 --
2.1 --
0.3 7.3
34.6 5.5 7.4 7.3 4.6 8.7 6.5 7.7 1.9
-- 0.6
-- --
3.1 --
2.3 0.6 0.9 8.3
25.2 10.1 13.4 9.2 4.6 8.3 5.9 6.0 1.2
-- 3.0
-- 0.5 1.8
-- 0.9
-- --
9.9
27.6 12.1 14.9 9.3 4.7 5.0 4.1 5.0 2.0 2.1 1.2
-- 1.2
-- --
0.4 0.8 0.5 9.1
26.6 23.1 15.9 7.6 4.0 3.2 2.9 2.3 1.4 1.3 1.2 1.2 0.9 0.4 0.4
-- -- --
7.6
110.5 48.3 59.6 37.3 18.7 19.9 16.2 20.1 7.8 8.5 4.7
-- 4.9
-- --
1.4 3.2 2.1
36.8
143.4 124.9 85.6 41.2 21.7 17.3 15.8 12.5 7.7 7.2 6.7 6.5 4.8 2.4 2.4
-- -- --
39.9
All Durum Wheat Varieties 100.0 100.0 100.0 100.0 100.0 100.0 100.0 400.0 540.0
1/ Revised. -- Data not published. Data compiled and summarized by the Montana Field Office of the National Agricultural Statistics Service, an agency of USDA, as a service provided for the Montana Wheat and Barley Committee.

2012 Montana Agricultural Statistics State Crops 43
Winter Wheat Varieties Seeded Acreage and Percent of Total Seeded by Districts, 2012
Variety Northwest North Central Northeast Central Southwest South Central Southeast State Total
(000) % (000) % (000) % (000) % (000) % (000) % (000) % (000) %
Yellowstone 2.6 17.4 222.0 18.3 46.3 22.8 138.2 32.9 10.5 38.9 60.8 30.4 20.1 16.5 500.5 22.8
Genou -- -- 378.5 31.2 1.8 0.9 39.1 9.3 2.7 10.1 10.4 5.2 1.0 0.8 433.5 19.7
CDC Falcon -- -- 104.3 8.6 5.5 2.7 41.6 9.9 1.2 4.3 1.6 0.8 0.4 0.3 154.6 7.0
Rampart -- -- 104.3 8.6 -- -- 3.8 0.9 -- -- -- -- 0.4 0.3 108.5 4.9
Ledger -- -- 88.5 7.3 -- -- 14.3 3.4 -- -- -- -- 5.0 4.1 107.8 4.9
Jerry -- -- 2.4 0.2 61.3 30.2 8.8 2.1 -- -- 0.2 0.1 35.0 28.7 107.7 4.9
AP503 CL2 0.4 2.9 20.6 1.7 1.4 0.7 43.3 10.3 2.0 7.3 29.6 14.8 1.0 0.8 98.3 4.5
Hawken -- -- 26.7 2.2 4.9 2.4 17.6 4.2 -- -- 3.8 1.9 0.4 0.3 53.4 2.4
Norris -- -- 34.0 2.8 -- -- 5.5 1.3 0.4 1.5 6.8 3.4 0.4 0.3 47.1 2.1
Pryor -- -- 23.0 1.9 -- -- 13.9 3.3 0.8 2.9 4.6 2.3 1.5 1.2 43.8 2.0
Jagalene 0.5 3.6 7.3 0.6 2.6 1.3 18.5 4.4 -- -- 8.0 4.0 3.9 3.2 40.8 1.9
Carter -- -- 40.0 3.3 -- -- -- -- -- -- -- -- -- -- 40.0 1.8
Morgan -- -- 30.3 2.5 7.5 3.7 -- -- -- -- -- -- -- -- 37.8 1.7
Decade 0.1 0.5 7.3 0.6 19.5 9.6 4.2 1.0 -- -- 0.8 0.4 2.1 1.7 34.0 1.5
WB Quake -- -- 19.4 1.6 -- -- 5.5 1.3 3.2 11.7 2.4 1.2 -- -- 30.5 1.4
Tiber -- -- -- -- 3.0 1.5 3.4 0.8 0.7 2.5 8.6 4.3 6.8 5.6 22.5 1.0
Willow Creek 0.1 0.8 1.2 0.1 4.5 2.2 7.1 1.7 -- -- 3.0 1.5 3.1 2.5 19.0 0.9
Radiant -- -- 14.6 1.2 3.0 1.5 -- -- -- -- -- -- 1.1 0.9 18.7 0.9
Neeley -- -- 2.4 0.2 0.8 0.4 14.7 3.5 0.4 1.4 0.2 0.1 -- -- 18.5 0.8
Vanguard -- -- 8.5 0.7 -- -- 5.0 1.2 -- -- 2.8 1.4 -- -- 16.3 0.7
Promontory 0.6 3.9 -- -- -- -- 1.7 0.4 -- -- 8.6 4.3 0.5 0.4 11.4 0.5
Overland -- -- -- -- 4.7 2.3 -- -- -- -- -- -- 5.9 4.8 10.6 0.5
Redwin -- -- 2.4 0.2 -- -- -- -- 0.4 1.4 -- -- 5.7 4.7 8.5 0.4
Other &
Unknown 10.7 70.9 75.3 6.2 36.2 17.8 33.8 8.1 4.7 18.0 47.8 23.9 27.7 22.9 236.2 10.8
All Varieties 15.0 100.0 1,213.0 100.0 203.0 100.0 420.0 100.0 27.0 100.0 200.0 100.0 122.0 100.0 2,200.0 100.0
-- Data not published. Data compiled and summarized by the Montana Field Office of the National Agricultural Statistics Service, an agency of USDA, as a
service provided for the Montana Wheat and Barley Committee.
Winter Wheat Varieties Seeded Acreage and Percent of Total Seeded by Districts, 2011 1/
Variety Northwest North Central Northeast Central Southwest South Central Southeast State Total
(000) % (000) % (000) % (000) % (000) % (000) % (000) % (000) %
Genou -- -- 560.7 43.1 2.4 1.6 44.8 10.4 3.7 14.7 15.4 7.1 1.3 1.2 628.3 27.9
Yellowstone 0.4 3.1 147.0 11.3 64.0 42.2 75.4 17.5 8.0 32.1 45.7 21.1 40.4 36.1 380.9 16.9
CDC Falcon 0.4 3.2 119.7 9.2 4.4 2.9 46.5 10.8 2.7 10.9 6.5 3.0 0.2 0.2 180.4 8.0
Rampart -- -- 114.5 8.8 -- -- 4.3 1.0 -- -- 2.4 1.1 -- -- 121.2 5.4
Ledger -- -- 89.8 6.9 -- -- 24.6 5.7 -- -- 1.9 0.9 -- -- 116.3 5.2
AP503 CL2 0.5 3.8 14.3 1.1 0.2 0.1 34.9 8.1 1.5 5.8 59.8 27.6 2.1 1.9 113.3 5.0
Jerry 0.5 3.6 6.5 0.5 36.0 23.7 15.5 3.6 -- -- -- -- 11.7 10.5 70.2 3.1
Jagalene 0.9 6.8 9.1 0.7 -- -- 37.9 8.8 -- -- 12.1 5.6 7.4 6.6 67.4 3.0
Pryor -- -- 23.4 1.8 -- -- 27.6 6.4 1.8 7.2 5.6 2.6 6.0 5.4 64.4 2.9
Hawken -- -- 9.1 0.7 2.1 1.4 38.4 8.9 -- -- -- -- 0.8 0.7 50.4 2.3
Norris 0.2 1.9 36.4 2.8 -- -- 2.2 0.5 1.0 3.8 9.5 4.4 -- -- 49.3 2.2
Morgan -- -- 36.4 2.8 11.2 7.4 -- -- -- -- 0.4 0.2 -- -- 48.0 2.1
Neeley -- -- 7.8 0.6 0.3 0.2 18.1 4.2 1.3 5.0 8.9 4.1 2.1 1.9 38.5 1.7
Vanguard -- -- 15.6 1.2 -- -- 14.7 3.4 -- -- -- -- -- -- 30.3 1.4
Carter -- -- 26.0 2.0 -- -- 0.4 0.1 -- -- -- -- -- -- 26.4 1.2
Tiber -- -- 3.9 0.3 2.1 1.4 -- -- 0.5 1.8 9.3 4.3 5.1 4.6 20.9 0.9
Willow Creek 0.4 3.2 2.6 0.2 5.0 3.3 6.0 1.4 -- -- 0.9 0.4 0.8 0.7 15.7 0.7
Bynum -- -- 9.1 0.7 -- -- 0.4 0.1 -- -- 1.1 0.5 -- -- 10.6 0.5
Redwin -- -- -- -- 2.4 1.6 2.6 0.6 -- -- 2.6 1.2 1.9 1.7 9.5 0.4
Promontory 1.5 11.6 -- -- -- -- 2.2 0.5 -- -- 5.6 2.6 -- -- 9.3 0.4
Rocky -- -- 9.1 0.7 -- -- -- -- -- -- -- -- -- -- 9.1 0.4
Winalta -- -- 2.6 0.2 2.0 1.3 -- -- -- -- -- -- 2.7 2.4 7.3 0.3
Carlisle 0.1 0.8 5.2 0.4 -- -- -- -- -- -- -- -- -- -- 5.3 0.2
Other &
Unknown 8.1 62.0 52.2 4.0 19.6 12.9 34.5 8.0 4.5 18.7 28.8 13.3 29.3 26.1 177.0 7.9
All Varieties 13.0 100.0 1,301.0 100.0 151.7 100.0 431.0 100.0 25.0 100.0 216.5 100.0 111.8 100.0 2,250.0 100.0
1/ Revised. -- Data not published. Data compiled and summarized by the Montana Field Office of the National Agricultural Statistics Service, an agency of USDA, as a service provided for the Montana Wheat and Barley Committee.

State Crops 44 2012 Montana Agricultural Statistics
Spring Wheat Varieties Seeded Acreage and Percent of Total Seeded by Districts, 2012
Variety Northwest North Central Northeast Central Southwest South Central Southeast State Total
(000) % (000) % (000) % (000) % (000) % (000) % (000) % (000) %
Vida 0.2 0.5 183.3 17.0 332.0 25.0 26.9 13.6 1.1 1.9 4.1 6.1 11.6 8.5 559.2 19.3 Choteau -- -- 247.9 23.0 155.4 11.7 30.3 15.3 3.6 6.0 4.8 7.1 5.8 4.3 447.8 15.4 Reeder -- -- 9.7 0.9 340.0 25.6 9.3 4.7 -- -- 5.0 7.4 25.7 18.9 389.7 13.4 Corbin -- -- 198.4 18.4 2.7 0.2 1.0 0.5 -- -- -- -- -- -- 202.1 7.0 ONeal -- -- 120.7 11.2 27.9 2.1 39.2 19.8 0.5 0.9 1.6 2.3 -- -- 189.9 6.5 McNeal -- -- 37.7 3.5 89.0 6.7 11.1 5.6 -- -- 4.6 6.7 14.3 10.5 156.7 5.4 Conan -- -- 66.8 6.2 1.3 0.1 0.4 0.2 -- -- -- -- 0.7 0.5 69.2 2.4 Brennan 0.8 2.5 1.1 0.1 43.8 3.3 5.7 2.9 1.7 2.8 0.3 0.4 1.5 1.1 54.9 1.9 WB Gunnison -- -- 48.5 4.5 -- -- 4.4 2.2 -- -- -- -- 0.3 0.2 53.2 1.8 Mott -- -- 5.4 0.5 37.2 2.8 -- -- -- -- -- -- 7.1 5.2 49.7 1.7 Fortuna -- -- 29.1 2.7 -- -- 14.9 7.5 0.2 0.3 4.6 6.8 -- -- 48.8 1.7 Kelby 1.4 4.3 -- -- 35.9 2.7 6.9 3.5 0.3 0.5 1.4 2.0 2.2 1.6 48.1 1.7 Glenn -- -- -- -- 29.2 2.2 3.0 1.5 -- -- -- -- 3.3 2.4 35.5 1.2 Solano 13.2 41.3 -- -- 2.7 0.2 5.1 2.6 5.7 9.5 6.7 9.8 1.2 0.9 34.6 1.2 AC Lillian -- -- 5.4 0.5 27.9 2.1 -- -- -- -- 1.1 1.6 -- -- 34.4 1.2 SY Tyra -- -- 21.6 2.0 1.3 0.1 3.2 1.6 -- -- 2.7 4.0 1.6 1.2 30.4 1.0 Amidon -- -- 2.2 0.2 23.9 1.8 -- -- -- -- 0.1 0.2 -- -- 26.2 0.9 Hank 2.7 8.4 1.1 0.1 1.3 0.1 10.9 5.5 1.7 2.9 4.5 6.6 2.7 2.0 24.9 0.9 Steele 0.2 0.5 1.1 0.1 8.0 0.6 0.4 0.2 -- -- -- -- 14.1 10.4 23.8 0.8 Westbred 936 -- -- 9.7 0.9 1.3 0.1 4.2 2.1 3.1 5.2 5.1 7.5 -- -- 23.4 0.8 Ernest -- -- 17.2 1.6 2.7 0.2 0.2 0.1 -- -- -- -- 1.5 1.1 21.6 0.7 Volt 0.4 1.1 6.5 0.6 8.0 0.6 3.0 1.5 0.2 0.4 1.3 1.9 0.3 0.2 19.7 0.7 AP 605 CL 0.1 0.2 5.4 0.5 9.3 0.7 1.6 0.8 0.7 1.1 1.6 2.4 -- -- 18.7 0.6 Jedd -- -- 9.7 0.9 1.3 0.1 2.4 1.2 0.5 0.9 0.1 0.2 0.3 0.2 14.3 0.5 Other & Unknown 13.0 41.2 49.5 4.6 145.9 11.0 13.9 7.1 40.7 67.6 18.4 27.0 41.8 30.8 323.2 11.3
All Varieties 32.0 100.0 1,078.0 100.0 1,328.0 100.0 198.0 100.0 60.0 100.0 68.0 100.0 136.0 100.0 2,900.0 100.0
-- Data not published. Data compiled and summarized by the Montana Field Office of the National Agricultural Statistics Service, an agency of USDA, as a
service provided for the Montana Wheat and Barley Committee.
Spring Wheat Varieties Seeded Acreage and Percent of Total Seeded by Districts, 2011 1/
Variety Northwest North Central Northeast Central Southwest South Central Southeast State Total
(000) % (000) % (000) % (000) % (000) % (000) % (000) % (000) %
Vida 0.4 1.1 191.6 19.9 322.8 29.7 26.4 16.5 0.8 1.3 5.1 7.7 6.6 8.1 553.7 22.6
Choteau 0.1 0.3 253.3 26.3 142.4 13.1 18.9 11.8 7.1 12.0 8.3 12.5 13.2 16.1 443.3 18.1
Reeder 0.3 0.9 1.9 0.2 252.2 23.2 11.8 7.4 -- -- 4.7 7.1 8.7 10.6 279.6 11.4
Corbin -- -- 175.3 18.2 4.3 0.4 1.4 0.9 -- -- 0.7 1.1 -- -- 181.7 7.4
McNeal -- -- 23.1 2.4 100.0 9.2 12.2 7.6 1.7 2.9 2.6 4.0 2.5 3.1 142.1 5.8
ONeal 0.2 0.7 89.6 9.3 13.0 1.2 28.0 17.5 0.7 1.2 1.5 2.3 1.8 2.2 134.8 5.5
Fortuna -- -- 57.8 6.0 -- -- 17.8 11.1 -- -- 4.2 6.3 -- -- 79.8 3.3
Conan -- -- 67.4 7.0 6.5 0.6 -- -- -- -- 0.3 0.5 -- -- 74.2 3.0
AC Lillian -- -- 9.6 1.0 30.4 2.8 -- -- -- -- 1.0 1.5 -- -- 41.0 1.7
Kelby 3.6 10.8 -- -- 18.5 1.7 4.2 2.6 0.6 1.1 1.1 1.7 3.4 4.1 31.4 1.3
Amidon -- -- -- -- 25.0 2.3 -- -- -- -- -- -- 0.2 0.3 25.2 1.0
Hank 2.3 7.0 -- -- 6.5 0.6 9.1 5.7 3.1 5.2 2.7 4.1 -- -- 23.7 1.0
Steele -- -- -- -- 4.3 0.4 0.2 0.1 -- -- -- -- 18.1 22.1 22.6 0.9
Solano 9.8 29.7 -- -- -- -- 0.2 0.1 2.0 3.4 6.8 10.3 2.2 2.7 21.0 0.9
Kuntz 2.0 6.0 2.9 0.3 6.5 0.6 5.1 3.2 3.6 6.1 -- -- -- -- 20.1 0.8
Ernest -- -- 15.4 1.6 4.3 0.4 -- -- -- -- -- -- -- -- 19.7 0.8
Westbred 936 0.2 0.5 3.9 0.4 -- -- 4.5 2.8 9.1 15.5 0.5 0.7 -- -- 18.2 0.7
WB Gunnison -- -- 17.3 1.8 -- -- -- -- -- -- -- -- -- -- 17.3 0.7
Glenn -- -- -- -- 15.2 1.4 -- -- 1.4 2.3 -- -- -- -- 16.6 0.7
Brennan 0.3 0.8 -- -- 12.0 1.1 0.2 0.1 0.8 1.3 0.9 1.4 -- -- 14.2 0.6
Mott 1.0 3.0 2.9 0.3 9.8 0.9 -- -- -- -- -- -- -- -- 13.7 0.6
Jedd 0.2 0.6 5.8 0.6 -- -- 3.5 2.2 -- -- 4.0 6.0 -- -- 13.5 0.6
Freyr -- -- 1.9 0.2 6.5 0.6 -- -- 1.4 2.4 3.0 4.6 0.5 0.6 13.3 0.5
Scholar -- -- -- -- 10.9 1.0 0.5 0.3 -- -- -- -- 0.2 0.3 11.6 0.5 Other & Unknown 12.6 38.6 43.3 4.5 95.9 8.8 16.0 10.1 26.7 45.3 18.6 28.2 24.6 29.8 237.7 9.6
All Varieties 33.0 100.0 963.0 100.0 1,087.0 100.0 160.0 100.0 59.0 100.0 66.0 100.0 82.0 100.0 2,450.0 100.0
1/ Revised. -- Data not published. Data compiled and summarized by the Montana Field Office of the National Agricultural Statistics Service, an agency of
USDA, as a service provided for the Montana Wheat and Barley Committee.
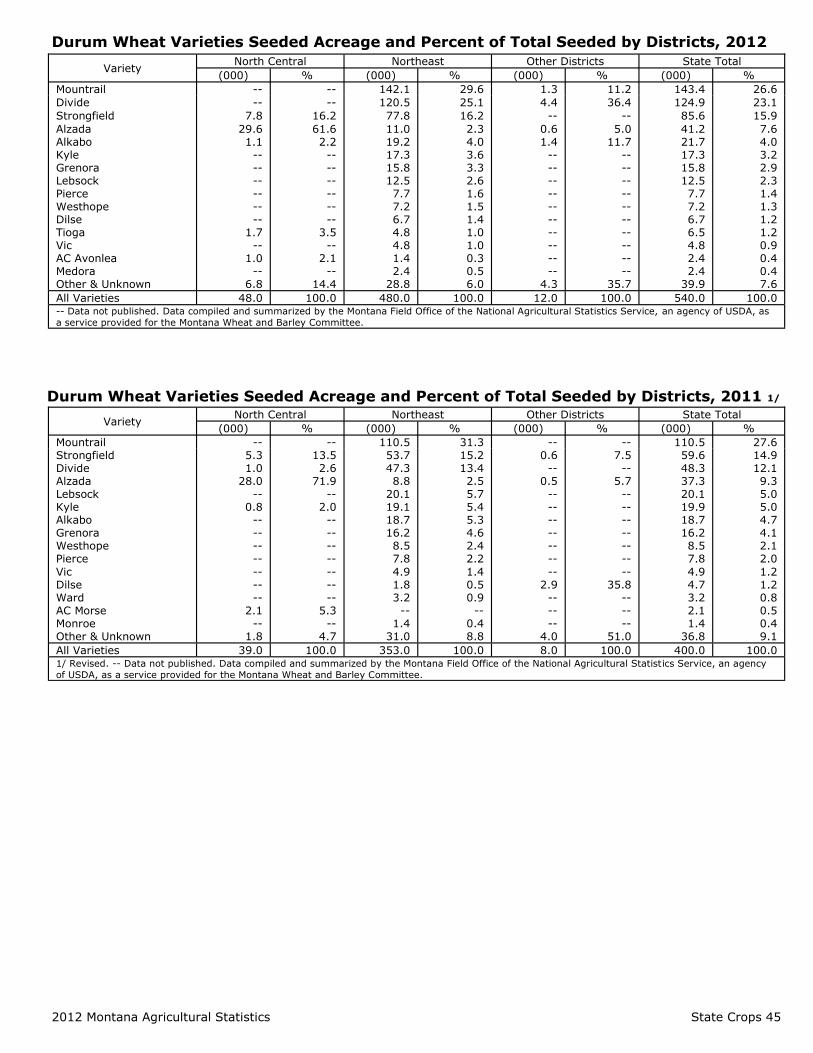
2012 Montana Agricultural Statistics State Crops 45
Durum Wheat Varieties Seeded Acreage and Percent of Total Seeded by Districts, 2012
Variety North Central Northeast Other Districts State Total
(000) % (000) % (000) % (000) %
Mountrail -- -- 142.1 29.6 1.3 11.2 143.4 26.6
Divide -- -- 120.5 25.1 4.4 36.4 124.9 23.1
Strongfield 7.8 16.2 77.8 16.2 -- -- 85.6 15.9
Alzada 29.6 61.6 11.0 2.3 0.6 5.0 41.2 7.6 Alkabo 1.1 2.2 19.2 4.0 1.4 11.7 21.7 4.0 Kyle -- -- 17.3 3.6 -- -- 17.3 3.2 Grenora -- -- 15.8 3.3 -- -- 15.8 2.9 Lebsock -- -- 12.5 2.6 -- -- 12.5 2.3 Pierce -- -- 7.7 1.6 -- -- 7.7 1.4 Westhope -- -- 7.2 1.5 -- -- 7.2 1.3 Dilse -- -- 6.7 1.4 -- -- 6.7 1.2 Tioga 1.7 3.5 4.8 1.0 -- -- 6.5 1.2 Vic -- -- 4.8 1.0 -- -- 4.8 0.9 AC Avonlea 1.0 2.1 1.4 0.3 -- -- 2.4 0.4 Medora -- -- 2.4 0.5 -- -- 2.4 0.4 Other & Unknown 6.8 14.4 28.8 6.0 4.3 35.7 39.9 7.6
All Varieties 48.0 100.0 480.0 100.0 12.0 100.0 540.0 100.0 -- Data not published. Data compiled and summarized by the Montana Field Office of the National Agricultural Statistics Service, an agency of USDA, as
a service provided for the Montana Wheat and Barley Committee.
Durum Wheat Varieties Seeded Acreage and Percent of Total Seeded by Districts, 2011 1/
Variety North Central Northeast Other Districts State Total
(000) % (000) % (000) % (000) %
Mountrail -- -- 110.5 31.3 -- -- 110.5 27.6 Strongfield 5.3 13.5 53.7 15.2 0.6 7.5 59.6 14.9 Divide 1.0 2.6 47.3 13.4 -- -- 48.3 12.1 Alzada 28.0 71.9 8.8 2.5 0.5 5.7 37.3 9.3 Lebsock -- -- 20.1 5.7 -- -- 20.1 5.0 Kyle 0.8 2.0 19.1 5.4 -- -- 19.9 5.0 Alkabo -- -- 18.7 5.3 -- -- 18.7 4.7 Grenora -- -- 16.2 4.6 -- -- 16.2 4.1 Westhope -- -- 8.5 2.4 -- -- 8.5 2.1 Pierce -- -- 7.8 2.2 -- -- 7.8 2.0
Vic -- -- 4.9 1.4 -- -- 4.9 1.2 Dilse -- -- 1.8 0.5 2.9 35.8 4.7 1.2 Ward -- -- 3.2 0.9 -- -- 3.2 0.8 AC Morse 2.1 5.3 -- -- -- -- 2.1 0.5 Monroe -- -- 1.4 0.4 -- -- 1.4 0.4 Other & Unknown 1.8 4.7 31.0 8.8 4.0 51.0 36.8 9.1
All Varieties 39.0 100.0 353.0 100.0 8.0 100.0 400.0 100.0 1/ Revised. -- Data not published. Data compiled and summarized by the Montana Field Office of the National Agricultural Statistics Service, an agency
of USDA, as a service provided for the Montana Wheat and Barley Committee.
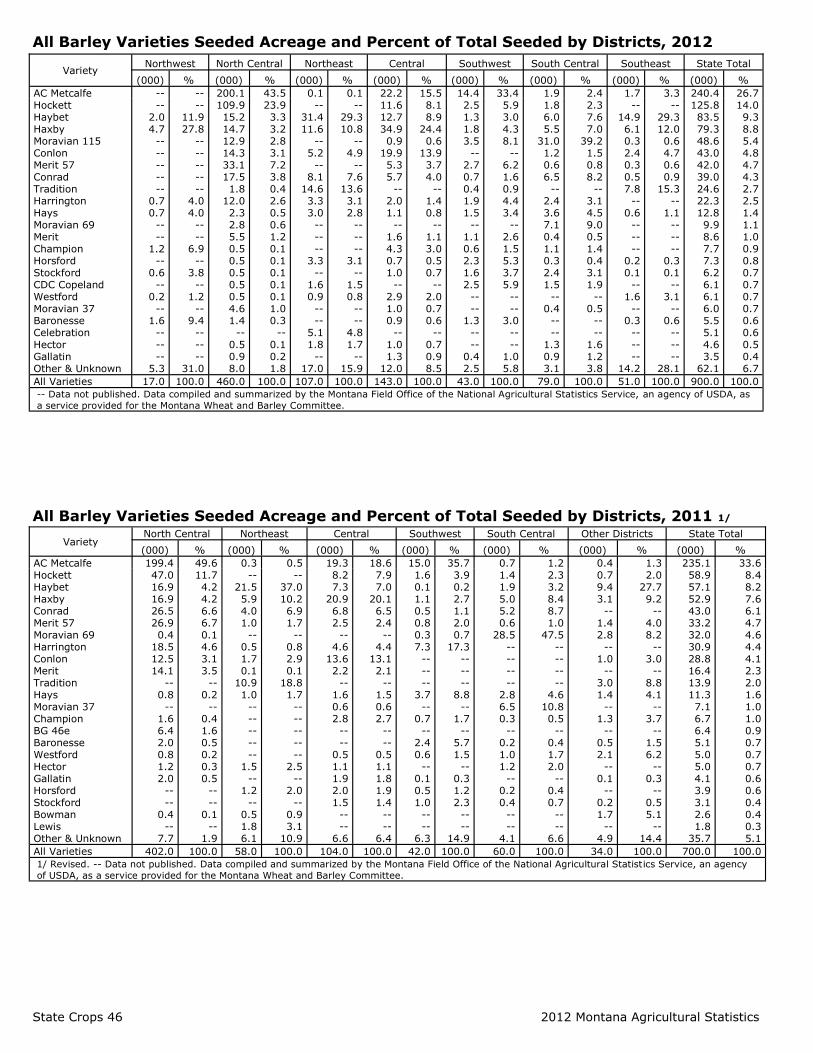
State Crops 46 2012 Montana Agricultural Statistics
All Barley Varieties Seeded Acreage and Percent of Total Seeded by Districts, 2012
Variety Northwest North Central Northeast Central Southwest South Central Southeast State Total
(000) % (000) % (000) % (000) % (000) % (000) % (000) % (000) %
AC Metcalfe -- -- 200.1 43.5 0.1 0.1 22.2 15.5 14.4 33.4 1.9 2.4 1.7 3.3 240.4 26.7 Hockett -- -- 109.9 23.9 -- -- 11.6 8.1 2.5 5.9 1.8 2.3 -- -- 125.8 14.0 Haybet 2.0 11.9 15.2 3.3 31.4 29.3 12.7 8.9 1.3 3.0 6.0 7.6 14.9 29.3 83.5 9.3 Haxby 4.7 27.8 14.7 3.2 11.6 10.8 34.9 24.4 1.8 4.3 5.5 7.0 6.1 12.0 79.3 8.8 Moravian 115 -- -- 12.9 2.8 -- -- 0.9 0.6 3.5 8.1 31.0 39.2 0.3 0.6 48.6 5.4 Conlon -- -- 14.3 3.1 5.2 4.9 19.9 13.9 -- -- 1.2 1.5 2.4 4.7 43.0 4.8 Merit 57 -- -- 33.1 7.2 -- -- 5.3 3.7 2.7 6.2 0.6 0.8 0.3 0.6 42.0 4.7 Conrad -- -- 17.5 3.8 8.1 7.6 5.7 4.0 0.7 1.6 6.5 8.2 0.5 0.9 39.0 4.3 Tradition -- -- 1.8 0.4 14.6 13.6 -- -- 0.4 0.9 -- -- 7.8 15.3 24.6 2.7 Harrington 0.7 4.0 12.0 2.6 3.3 3.1 2.0 1.4 1.9 4.4 2.4 3.1 -- -- 22.3 2.5 Hays 0.7 4.0 2.3 0.5 3.0 2.8 1.1 0.8 1.5 3.4 3.6 4.5 0.6 1.1 12.8 1.4 Moravian 69 -- -- 2.8 0.6 -- -- -- -- -- -- 7.1 9.0 -- -- 9.9 1.1 Merit -- -- 5.5 1.2 -- -- 1.6 1.1 1.1 2.6 0.4 0.5 -- -- 8.6 1.0 Champion 1.2 6.9 0.5 0.1 -- -- 4.3 3.0 0.6 1.5 1.1 1.4 -- -- 7.7 0.9 Horsford -- -- 0.5 0.1 3.3 3.1 0.7 0.5 2.3 5.3 0.3 0.4 0.2 0.3 7.3 0.8 Stockford 0.6 3.8 0.5 0.1 -- -- 1.0 0.7 1.6 3.7 2.4 3.1 0.1 0.1 6.2 0.7 CDC Copeland -- -- 0.5 0.1 1.6 1.5 -- -- 2.5 5.9 1.5 1.9 -- -- 6.1 0.7 Westford 0.2 1.2 0.5 0.1 0.9 0.8 2.9 2.0 -- -- -- -- 1.6 3.1 6.1 0.7 Moravian 37 -- -- 4.6 1.0 -- -- 1.0 0.7 -- -- 0.4 0.5 -- -- 6.0 0.7 Baronesse 1.6 9.4 1.4 0.3 -- -- 0.9 0.6 1.3 3.0 -- -- 0.3 0.6 5.5 0.6 Celebration -- -- -- -- 5.1 4.8 -- -- -- -- -- -- -- -- 5.1 0.6 Hector -- -- 0.5 0.1 1.8 1.7 1.0 0.7 -- -- 1.3 1.6 -- -- 4.6 0.5 Gallatin -- -- 0.9 0.2 -- -- 1.3 0.9 0.4 1.0 0.9 1.2 -- -- 3.5 0.4 Other & Unknown 5.3 31.0 8.0 1.8 17.0 15.9 12.0 8.5 2.5 5.8 3.1 3.8 14.2 28.1 62.1 6.7
All Varieties 17.0 100.0 460.0 100.0 107.0 100.0 143.0 100.0 43.0 100.0 79.0 100.0 51.0 100.0 900.0 100.0
-- Data not published. Data compiled and summarized by the Montana Field Office of the National Agricultural Statistics Service, an agency of USDA, as
a service provided for the Montana Wheat and Barley Committee.
All Barley Varieties Seeded Acreage and Percent of Total Seeded by Districts, 2011 1/
Variety North Central Northeast Central Southwest South Central Other Districts State Total
(000) % (000) % (000) % (000) % (000) % (000) % (000) %
AC Metcalfe 199.4 49.6 0.3 0.5 19.3 18.6 15.0 35.7 0.7 1.2 0.4 1.3 235.1 33.6 Hockett 47.0 11.7 -- -- 8.2 7.9 1.6 3.9 1.4 2.3 0.7 2.0 58.9 8.4 Haybet 16.9 4.2 21.5 37.0 7.3 7.0 0.1 0.2 1.9 3.2 9.4 27.7 57.1 8.2 Haxby 16.9 4.2 5.9 10.2 20.9 20.1 1.1 2.7 5.0 8.4 3.1 9.2 52.9 7.6 Conrad 26.5 6.6 4.0 6.9 6.8 6.5 0.5 1.1 5.2 8.7 -- -- 43.0 6.1 Merit 57 26.9 6.7 1.0 1.7 2.5 2.4 0.8 2.0 0.6 1.0 1.4 4.0 33.2 4.7 Moravian 69 0.4 0.1 -- -- -- -- 0.3 0.7 28.5 47.5 2.8 8.2 32.0 4.6 Harrington 18.5 4.6 0.5 0.8 4.6 4.4 7.3 17.3 -- -- -- -- 30.9 4.4 Conlon 12.5 3.1 1.7 2.9 13.6 13.1 -- -- -- -- 1.0 3.0 28.8 4.1 Merit 14.1 3.5 0.1 0.1 2.2 2.1 -- -- -- -- -- -- 16.4 2.3 Tradition -- -- 10.9 18.8 -- -- -- -- -- -- 3.0 8.8 13.9 2.0 Hays 0.8 0.2 1.0 1.7 1.6 1.5 3.7 8.8 2.8 4.6 1.4 4.1 11.3 1.6 Moravian 37 -- -- -- -- 0.6 0.6 -- -- 6.5 10.8 -- -- 7.1 1.0 Champion 1.6 0.4 -- -- 2.8 2.7 0.7 1.7 0.3 0.5 1.3 3.7 6.7 1.0 BG 46e 6.4 1.6 -- -- -- -- -- -- -- -- -- -- 6.4 0.9 Baronesse 2.0 0.5 -- -- -- -- 2.4 5.7 0.2 0.4 0.5 1.5 5.1 0.7 Westford 0.8 0.2 -- -- 0.5 0.5 0.6 1.5 1.0 1.7 2.1 6.2 5.0 0.7 Hector 1.2 0.3 1.5 2.5 1.1 1.1 -- -- 1.2 2.0 -- -- 5.0 0.7 Gallatin 2.0 0.5 -- -- 1.9 1.8 0.1 0.3 -- -- 0.1 0.3 4.1 0.6 Horsford -- -- 1.2 2.0 2.0 1.9 0.5 1.2 0.2 0.4 -- -- 3.9 0.6 Stockford -- -- -- -- 1.5 1.4 1.0 2.3 0.4 0.7 0.2 0.5 3.1 0.4 Bowman 0.4 0.1 0.5 0.9 -- -- -- -- -- -- 1.7 5.1 2.6 0.4 Lewis -- -- 1.8 3.1 -- -- -- -- -- -- -- -- 1.8 0.3 Other & Unknown 7.7 1.9 6.1 10.9 6.6 6.4 6.3 14.9 4.1 6.6 4.9 14.4 35.7 5.1
All Varieties 402.0 100.0 58.0 100.0 104.0 100.0 42.0 100.0 60.0 100.0 34.0 100.0 700.0 100.0
1/ Revised. -- Data not published. Data compiled and summarized by the Montana Field Office of the National Agricultural Statistics Service, an agency
of USDA, as a service provided for the Montana Wheat and Barley Committee.

2012 Montana Agricultural Statistics State Crops 47
Barley Purchased to Produce Malt, by Districts, 2010-2011 Crops
Variety Crop Year
Northwest North Central Northeast Central
(000) Bu
% Protein
% Plump
(000) Bu
% Protein
% Plump
(000) Bu
% Protein
% Plump
(000) Bu
% Protein
% Plump
AC Metcalfe 2010 30 11.2 92 7,355 11.7 89 701 12.1 89
2011 5,972 11.4 89 1,624 11.9 88
Hockett 2010 2,170 11.1 92 63 12.1 94 2011 2,008 11.7 91 871 12.0 87
Conrad 2010 2,184 11.8 94 9 12.0 98 250 11.5 96 2011 1,868 12.0 93 200 12.1 95 264 12.4 96
Moravian 69 2010 2011
Merit 57 2010 690 10.5 90 9 12.1 95 17 10.4 91 2011 1,288 10.9 90 30 12.6 91 124 10.9 91
Tradition 2010 1,453 12.3 89 2011 1,300 12.6 91
Merit 2010 978 10.4 92 242 10.6 94 2011 910 10.7 91 332 11.3 90
Harrington 2010 1,093 11.6 91 11 12.6 89 21 10.6 94
2011 500 11.9 87 11 11.7 90 4 12.4 95
Moravian 115 2010
2011 334 11.4 93
Celebration 2010 263 12.9 86
2011 210 13.1 88
Other 2010 16 10.6 96 102 12.2 87 2011 38 12.7 70
Total 2010 30 11.2 92 14,486 11.5 91 1,847 12.4 89 1,294 11.6 92 2011 12,880 11.4 90 1,789 12.6 91 3,219 11.9 88
Variety Crop Year
Southwest South Central Southeast State
(000) Bu
% Protein
% Plump
(000) Bu
% Protein
% Plump
(000) Bu
% Protein
% Plump
(000) Bu
% Protein
% Plump
AC Metcalfe 2010 263 11.8 94 3 11.5 94 8,352 11.7 89
2011 1,267 11.9 90 250 12.4 90 9,113 11.6 89
Hockett 2010 12 12.8 92 55 10.7 91 2,300 11.2 92 2011 223 11.2 92 36 11.6 91 3,138 11.7 90
Conrad 2010 77 12.8 94 566 11.2 92 3,086 11.7 93
2011 85 12.8 94 400 12.8 85 30 12.5 88 2,847 12.2 92
Moravian 69 2010 277 11.1 87 3,433 10.4 91 3,710 10.5 90 2011 2,721 11.2 82 2,721 11.2 82
Merit 57 2010 716 10.5 90 2011 27 11.9 85 55 12.1 85 1,524 11.0 90
Tradition 2010 171 12.0 91 1,624 12.3 89 2011 125 12.2 91 1,425 12.6 91
Merit 2010 99 10.8 90 1,319 10.5 92 2011 1,242 10.9 91
Harrington 2010 107 11.6 93 1,232 11.6 92
2011 326 11.4 91 841 11.7 88
Moravian 115 2010 87 10.5 95 87 10.5 95 2011 416 11.9 88 750 11.6 90
Celebration 2010 263 12.9 86
2011 21 13.4 83 231 13.1 88
Other 2010 118 12.0 88 2011 38 12.7 70
Total 2010 736 11.6 91 4,243 10.5 91 171 12.0 91 22,807 11.4 91
2011 1,901 11.8 90 3,850 11.6 84 231 12.3 89 23,870 11.6 89 Please note: Funding for these data was provided by the Montana Wheat & Barley Committee.
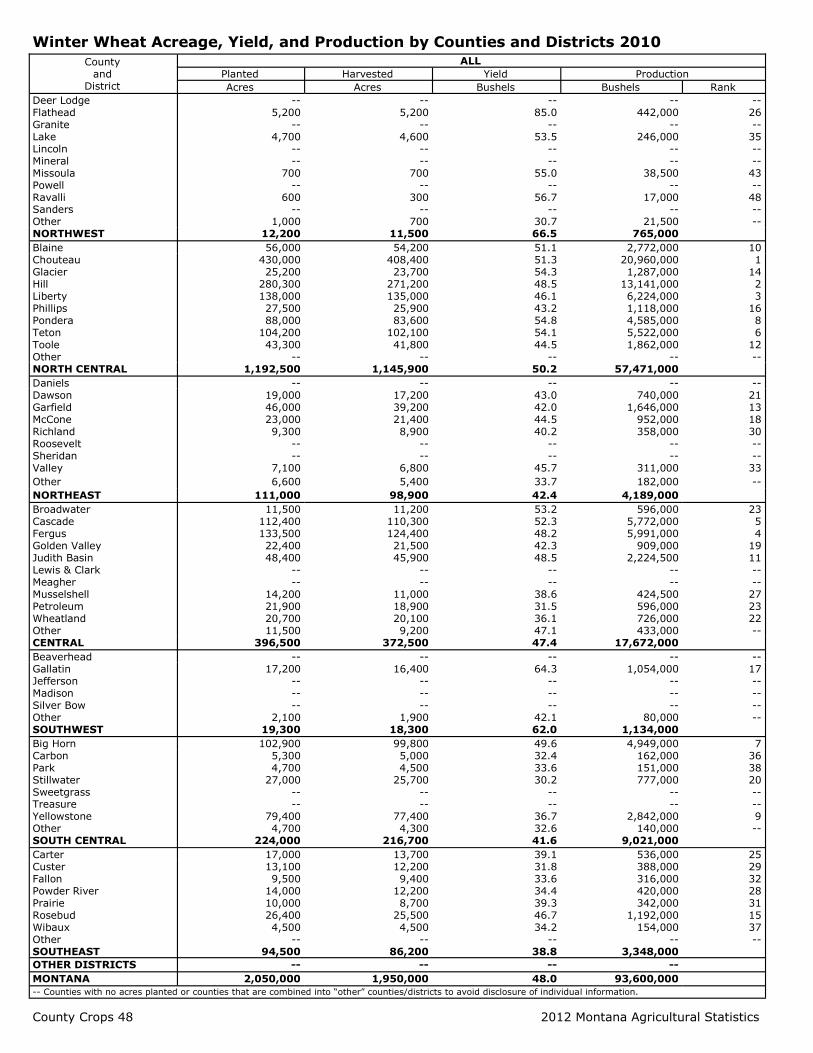
County Crops 48 2012 Montana Agricultural Statistics
Winter Wheat Acreage, Yield, and Production by Counties and Districts 2010
County and
District
ALL
Planted Harvested Yield Production
Acres Acres Bushels Bushels Rank
Deer Lodge -- -- -- -- -- Flathead 5,200 5,200 85.0 442,000 26 Granite -- -- -- -- -- Lake 4,700 4,600 53.5 246,000 35 Lincoln -- -- -- -- -- Mineral -- -- -- -- -- Missoula 700 700 55.0 38,500 43 Powell -- -- -- -- -- Ravalli 600 300 56.7 17,000 48 Sanders -- -- -- -- -- Other 1,000 700 30.7 21,500 -- NORTHWEST 12,200 11,500 66.5 765,000
Blaine 56,000 54,200 51.1 2,772,000 10 Chouteau 430,000 408,400 51.3 20,960,000 1 Glacier 25,200 23,700 54.3 1,287,000 14 Hill 280,300 271,200 48.5 13,141,000 2 Liberty 138,000 135,000 46.1 6,224,000 3 Phillips 27,500 25,900 43.2 1,118,000 16 Pondera 88,000 83,600 54.8 4,585,000 8 Teton 104,200 102,100 54.1 5,522,000 6 Toole 43,300 41,800 44.5 1,862,000 12 Other -- -- -- -- -- NORTH CENTRAL 1,192,500 1,145,900 50.2 57,471,000
Daniels -- -- -- -- -- Dawson 19,000 17,200 43.0 740,000 21 Garfield 46,000 39,200 42.0 1,646,000 13 McCone 23,000 21,400 44.5 952,000 18 Richland 9,300 8,900 40.2 358,000 30 Roosevelt -- -- -- -- -- Sheridan -- -- -- -- -- Valley 7,100 6,800 45.7 311,000 33
Other 6,600 5,400 33.7 182,000 --
NORTHEAST 111,000 98,900 42.4 4,189,000
Broadwater 11,500 11,200 53.2 596,000 23 Cascade 112,400 110,300 52.3 5,772,000 5 Fergus 133,500 124,400 48.2 5,991,000 4 Golden Valley 22,400 21,500 42.3 909,000 19 Judith Basin 48,400 45,900 48.5 2,224,500 11 Lewis & Clark -- -- -- -- -- Meagher -- -- -- -- -- Musselshell 14,200 11,000 38.6 424,500 27 Petroleum 21,900 18,900 31.5 596,000 23 Wheatland 20,700 20,100 36.1 726,000 22 Other 11,500 9,200 47.1 433,000 -- CENTRAL 396,500 372,500 47.4 17,672,000
Beaverhead -- -- -- -- -- Gallatin 17,200 16,400 64.3 1,054,000 17 Jefferson -- -- -- -- -- Madison -- -- -- -- -- Silver Bow -- -- -- -- -- Other 2,100 1,900 42.1 80,000 -- SOUTHWEST 19,300 18,300 62.0 1,134,000
Big Horn 102,900 99,800 49.6 4,949,000 7 Carbon 5,300 5,000 32.4 162,000 36 Park 4,700 4,500 33.6 151,000 38 Stillwater 27,000 25,700 30.2 777,000 20 Sweetgrass -- -- -- -- -- Treasure -- -- -- -- -- Yellowstone 79,400 77,400 36.7 2,842,000 9 Other 4,700 4,300 32.6 140,000 -- SOUTH CENTRAL 224,000 216,700 41.6 9,021,000
Carter 17,000 13,700 39.1 536,000 25 Custer 13,100 12,200 31.8 388,000 29 Fallon 9,500 9,400 33.6 316,000 32 Powder River 14,000 12,200 34.4 420,000 28 Prairie 10,000 8,700 39.3 342,000 31 Rosebud 26,400 25,500 46.7 1,192,000 15 Wibaux 4,500 4,500 34.2 154,000 37 Other -- -- -- -- -- SOUTHEAST 94,500 86,200 38.8 3,348,000
OTHER DISTRICTS -- -- -- --
MONTANA 2,050,000 1,950,000 48.0 93,600,000
-- Counties with no acres planted or counties that are combined into “other” counties/districts to avoid disclosure of individual information.
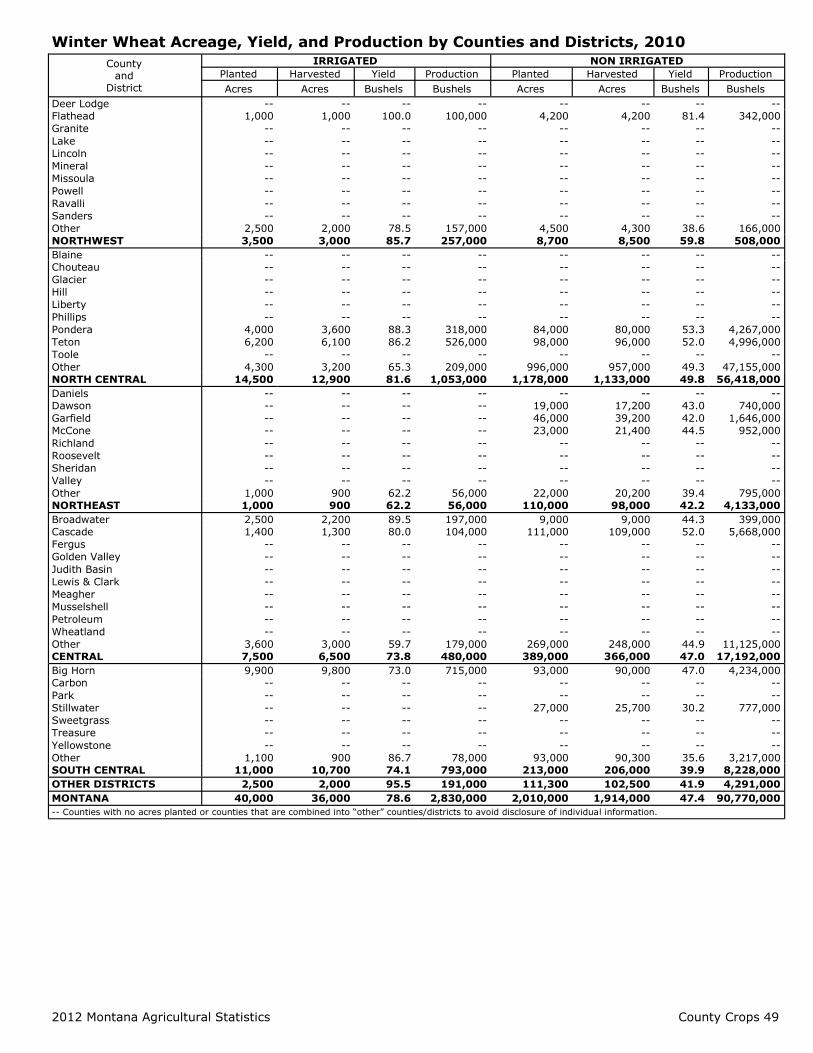
2012 Montana Agricultural Statistics County Crops 49
Winter Wheat Acreage, Yield, and Production by Counties and Districts, 2010
County and
District
IRRIGATED NON IRRIGATED
Planted Harvested Yield Production Planted Harvested Yield Production
Acres Acres Bushels Bushels Acres Acres Bushels Bushels
Deer Lodge -- -- -- -- -- -- -- --
Flathead 1,000 1,000 100.0 100,000 4,200 4,200 81.4 342,000
Granite -- -- -- -- -- -- -- --
Lake -- -- -- -- -- -- -- --
Lincoln -- -- -- -- -- -- -- --
Mineral -- -- -- -- -- -- -- --
Missoula -- -- -- -- -- -- -- --
Powell -- -- -- -- -- -- -- --
Ravalli -- -- -- -- -- -- -- --
Sanders -- -- -- -- -- -- -- --
Other 2,500 2,000 78.5 157,000 4,500 4,300 38.6 166,000
NORTHWEST 3,500 3,000 85.7 257,000 8,700 8,500 59.8 508,000
Blaine -- -- -- -- -- -- -- --
Chouteau -- -- -- -- -- -- -- --
Glacier -- -- -- -- -- -- -- --
Hill -- -- -- -- -- -- -- --
Liberty -- -- -- -- -- -- -- --
Phillips -- -- -- -- -- -- -- --
Pondera 4,000 3,600 88.3 318,000 84,000 80,000 53.3 4,267,000
Teton 6,200 6,100 86.2 526,000 98,000 96,000 52.0 4,996,000
Toole -- -- -- -- -- -- -- --
Other 4,300 3,200 65.3 209,000 996,000 957,000 49.3 47,155,000
NORTH CENTRAL 14,500 12,900 81.6 1,053,000 1,178,000 1,133,000 49.8 56,418,000
Daniels -- -- -- -- -- -- -- --
Dawson -- -- -- -- 19,000 17,200 43.0 740,000
Garfield -- -- -- -- 46,000 39,200 42.0 1,646,000
McCone -- -- -- -- 23,000 21,400 44.5 952,000
Richland -- -- -- -- -- -- -- --
Roosevelt -- -- -- -- -- -- -- --
Sheridan -- -- -- -- -- -- -- --
Valley -- -- -- -- -- -- -- --
Other 1,000 900 62.2 56,000 22,000 20,200 39.4 795,000
NORTHEAST 1,000 900 62.2 56,000 110,000 98,000 42.2 4,133,000
Broadwater 2,500 2,200 89.5 197,000 9,000 9,000 44.3 399,000
Cascade 1,400 1,300 80.0 104,000 111,000 109,000 52.0 5,668,000
Fergus -- -- -- -- -- -- -- --
Golden Valley -- -- -- -- -- -- -- --
Judith Basin -- -- -- -- -- -- -- --
Lewis & Clark -- -- -- -- -- -- -- --
Meagher -- -- -- -- -- -- -- --
Musselshell -- -- -- -- -- -- -- --
Petroleum -- -- -- -- -- -- -- --
Wheatland -- -- -- -- -- -- -- --
Other 3,600 3,000 59.7 179,000 269,000 248,000 44.9 11,125,000
CENTRAL 7,500 6,500 73.8 480,000 389,000 366,000 47.0 17,192,000
Big Horn 9,900 9,800 73.0 715,000 93,000 90,000 47.0 4,234,000
Carbon -- -- -- -- -- -- -- --
Park -- -- -- -- -- -- -- --
Stillwater -- -- -- -- 27,000 25,700 30.2 777,000
Sweetgrass -- -- -- -- -- -- -- --
Treasure -- -- -- -- -- -- -- --
Yellowstone -- -- -- -- -- -- -- --
Other 1,100 900 86.7 78,000 93,000 90,300 35.6 3,217,000
SOUTH CENTRAL 11,000 10,700 74.1 793,000 213,000 206,000 39.9 8,228,000
OTHER DISTRICTS 2,500 2,000 95.5 191,000 111,300 102,500 41.9 4,291,000
MONTANA 40,000 36,000 78.6 2,830,000 2,010,000 1,914,000 47.4 90,770,000
-- Counties with no acres planted or counties that are combined into “other” counties/districts to avoid disclosure of individual information.
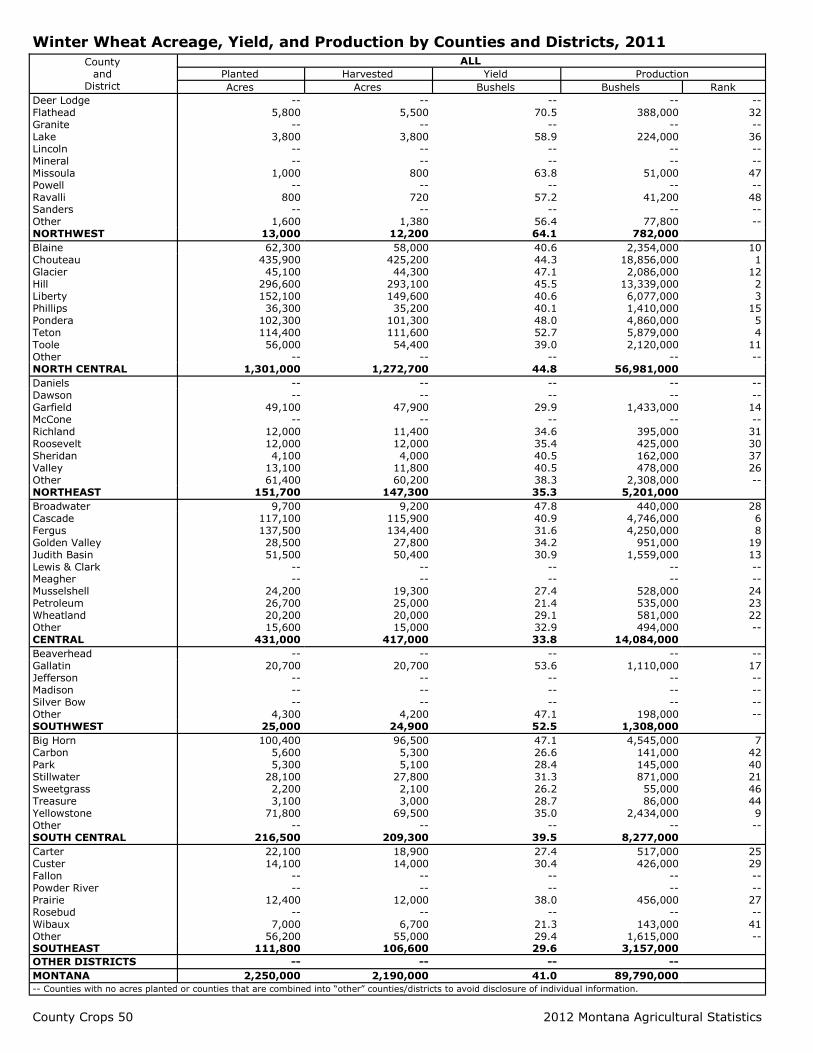
County Crops 50 2012 Montana Agricultural Statistics
Winter Wheat Acreage, Yield, and Production by Counties and Districts, 2011
County and
District
ALL
Planted Harvested Yield Production
Acres Acres Bushels Bushels Rank
Deer Lodge -- -- -- -- -- Flathead 5,800 5,500 70.5 388,000 32 Granite -- -- -- -- -- Lake 3,800 3,800 58.9 224,000 36 Lincoln -- -- -- -- -- Mineral -- -- -- -- -- Missoula 1,000 800 63.8 51,000 47 Powell -- -- -- -- -- Ravalli 800 720 57.2 41,200 48 Sanders -- -- -- -- -- Other 1,600 1,380 56.4 77,800 -- NORTHWEST 13,000 12,200 64.1 782,000
Blaine 62,300 58,000 40.6 2,354,000 10 Chouteau 435,900 425,200 44.3 18,856,000 1 Glacier 45,100 44,300 47.1 2,086,000 12 Hill 296,600 293,100 45.5 13,339,000 2 Liberty 152,100 149,600 40.6 6,077,000 3 Phillips 36,300 35,200 40.1 1,410,000 15 Pondera 102,300 101,300 48.0 4,860,000 5 Teton 114,400 111,600 52.7 5,879,000 4 Toole 56,000 54,400 39.0 2,120,000 11 Other -- -- -- -- -- NORTH CENTRAL 1,301,000 1,272,700 44.8 56,981,000
Daniels -- -- -- -- -- Dawson -- -- -- -- -- Garfield 49,100 47,900 29.9 1,433,000 14 McCone -- -- -- -- -- Richland 12,000 11,400 34.6 395,000 31 Roosevelt 12,000 12,000 35.4 425,000 30 Sheridan 4,100 4,000 40.5 162,000 37 Valley 13,100 11,800 40.5 478,000 26 Other 61,400 60,200 38.3 2,308,000 -- NORTHEAST 151,700 147,300 35.3 5,201,000
Broadwater 9,700 9,200 47.8 440,000 28 Cascade 117,100 115,900 40.9 4,746,000 6 Fergus 137,500 134,400 31.6 4,250,000 8 Golden Valley 28,500 27,800 34.2 951,000 19 Judith Basin 51,500 50,400 30.9 1,559,000 13 Lewis & Clark -- -- -- -- -- Meagher -- -- -- -- -- Musselshell 24,200 19,300 27.4 528,000 24 Petroleum 26,700 25,000 21.4 535,000 23 Wheatland 20,200 20,000 29.1 581,000 22 Other 15,600 15,000 32.9 494,000 -- CENTRAL 431,000 417,000 33.8 14,084,000
Beaverhead -- -- -- -- -- Gallatin 20,700 20,700 53.6 1,110,000 17 Jefferson -- -- -- -- -- Madison -- -- -- -- -- Silver Bow -- -- -- -- -- Other 4,300 4,200 47.1 198,000 -- SOUTHWEST 25,000 24,900 52.5 1,308,000
Big Horn 100,400 96,500 47.1 4,545,000 7 Carbon 5,600 5,300 26.6 141,000 42 Park 5,300 5,100 28.4 145,000 40 Stillwater 28,100 27,800 31.3 871,000 21 Sweetgrass 2,200 2,100 26.2 55,000 46 Treasure 3,100 3,000 28.7 86,000 44 Yellowstone 71,800 69,500 35.0 2,434,000 9 Other -- -- -- -- -- SOUTH CENTRAL 216,500 209,300 39.5 8,277,000
Carter 22,100 18,900 27.4 517,000 25 Custer 14,100 14,000 30.4 426,000 29 Fallon -- -- -- -- -- Powder River -- -- -- -- -- Prairie 12,400 12,000 38.0 456,000 27 Rosebud -- -- -- -- -- Wibaux 7,000 6,700 21.3 143,000 41 Other 56,200 55,000 29.4 1,615,000 -- SOUTHEAST 111,800 106,600 29.6 3,157,000
OTHER DISTRICTS -- -- -- --
MONTANA 2,250,000 2,190,000 41.0 89,790,000
-- Counties with no acres planted or counties that are combined into “other” counties/districts to avoid disclosure of individual information.
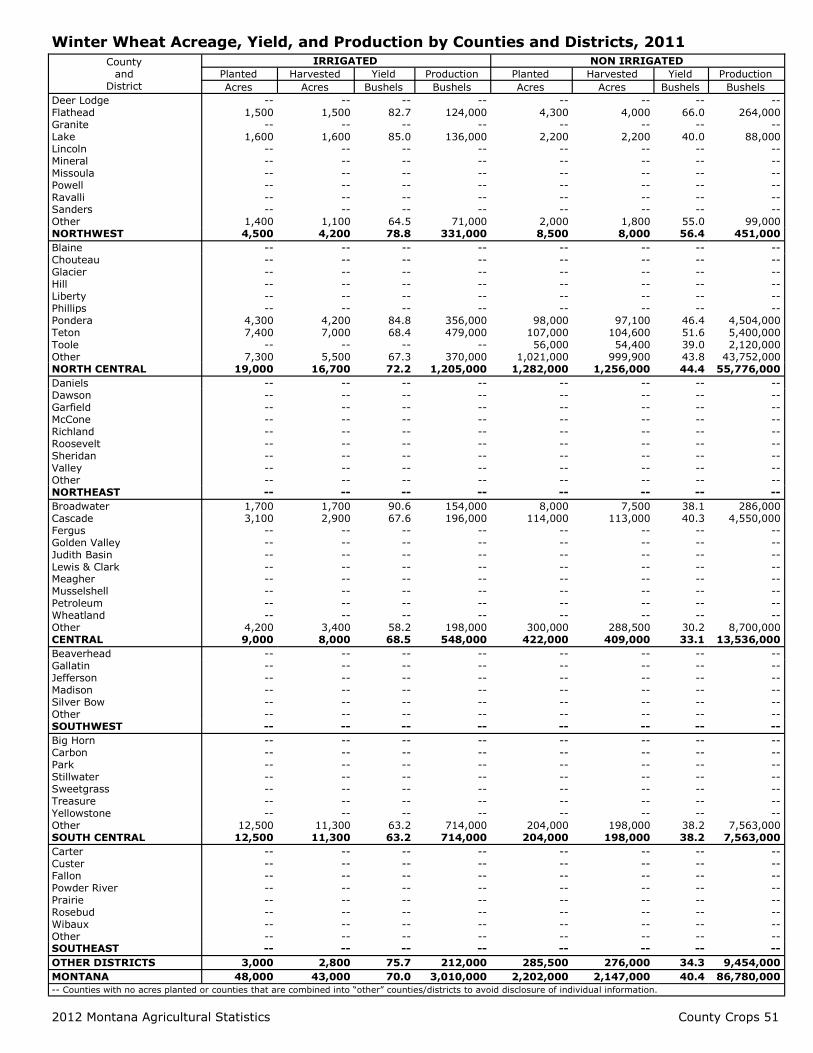
2012 Montana Agricultural Statistics County Crops 51
Winter Wheat Acreage, Yield, and Production by Counties and Districts, 2011
County and
District
IRRIGATED NON IRRIGATED
Planted Harvested Yield Production Planted Harvested Yield Production
Acres Acres Bushels Bushels Acres Acres Bushels Bushels
Deer Lodge -- -- -- -- -- -- -- -- Flathead 1,500 1,500 82.7 124,000 4,300 4,000 66.0 264,000 Granite -- -- -- -- -- -- -- -- Lake 1,600 1,600 85.0 136,000 2,200 2,200 40.0 88,000 Lincoln -- -- -- -- -- -- -- -- Mineral -- -- -- -- -- -- -- -- Missoula -- -- -- -- -- -- -- -- Powell -- -- -- -- -- -- -- -- Ravalli -- -- -- -- -- -- -- -- Sanders -- -- -- -- -- -- -- -- Other 1,400 1,100 64.5 71,000 2,000 1,800 55.0 99,000 NORTHWEST 4,500 4,200 78.8 331,000 8,500 8,000 56.4 451,000
Blaine -- -- -- -- -- -- -- -- Chouteau -- -- -- -- -- -- -- -- Glacier -- -- -- -- -- -- -- -- Hill -- -- -- -- -- -- -- -- Liberty -- -- -- -- -- -- -- -- Phillips -- -- -- -- -- -- -- -- Pondera 4,300 4,200 84.8 356,000 98,000 97,100 46.4 4,504,000 Teton 7,400 7,000 68.4 479,000 107,000 104,600 51.6 5,400,000 Toole -- -- -- -- 56,000 54,400 39.0 2,120,000 Other 7,300 5,500 67.3 370,000 1,021,000 999,900 43.8 43,752,000 NORTH CENTRAL 19,000 16,700 72.2 1,205,000 1,282,000 1,256,000 44.4 55,776,000
Daniels -- -- -- -- -- -- -- -- Dawson -- -- -- -- -- -- -- -- Garfield -- -- -- -- -- -- -- -- McCone -- -- -- -- -- -- -- -- Richland -- -- -- -- -- -- -- -- Roosevelt -- -- -- -- -- -- -- -- Sheridan -- -- -- -- -- -- -- -- Valley -- -- -- -- -- -- -- -- Other -- -- -- -- -- -- -- -- NORTHEAST -- -- -- -- -- -- -- --
Broadwater 1,700 1,700 90.6 154,000 8,000 7,500 38.1 286,000 Cascade 3,100 2,900 67.6 196,000 114,000 113,000 40.3 4,550,000 Fergus -- -- -- -- -- -- -- -- Golden Valley -- -- -- -- -- -- -- -- Judith Basin -- -- -- -- -- -- -- -- Lewis & Clark -- -- -- -- -- -- -- -- Meagher -- -- -- -- -- -- -- -- Musselshell -- -- -- -- -- -- -- -- Petroleum -- -- -- -- -- -- -- -- Wheatland -- -- -- -- -- -- -- -- Other 4,200 3,400 58.2 198,000 300,000 288,500 30.2 8,700,000 CENTRAL 9,000 8,000 68.5 548,000 422,000 409,000 33.1 13,536,000
Beaverhead -- -- -- -- -- -- -- -- Gallatin -- -- -- -- -- -- -- -- Jefferson -- -- -- -- -- -- -- -- Madison -- -- -- -- -- -- -- -- Silver Bow -- -- -- -- -- -- -- -- Other -- -- -- -- -- -- -- -- SOUTHWEST -- -- -- -- -- -- -- --
Big Horn -- -- -- -- -- -- -- -- Carbon -- -- -- -- -- -- -- -- Park -- -- -- -- -- -- -- -- Stillwater -- -- -- -- -- -- -- -- Sweetgrass -- -- -- -- -- -- -- -- Treasure -- -- -- -- -- -- -- -- Yellowstone -- -- -- -- -- -- -- -- Other 12,500 11,300 63.2 714,000 204,000 198,000 38.2 7,563,000 SOUTH CENTRAL 12,500 11,300 63.2 714,000 204,000 198,000 38.2 7,563,000
Carter -- -- -- -- -- -- -- -- Custer -- -- -- -- -- -- -- -- Fallon -- -- -- -- -- -- -- -- Powder River -- -- -- -- -- -- -- -- Prairie -- -- -- -- -- -- -- -- Rosebud -- -- -- -- -- -- -- -- Wibaux -- -- -- -- -- -- -- -- Other -- -- -- -- -- -- -- -- SOUTHEAST -- -- -- -- -- -- -- --
OTHER DISTRICTS 3,000 2,800 75.7 212,000 285,500 276,000 34.3 9,454,000
MONTANA 48,000 43,000 70.0 3,010,000 2,202,000 2,147,000 40.4 86,780,000
-- Counties with no acres planted or counties that are combined into “other” counties/districts to avoid disclosure of individual information.
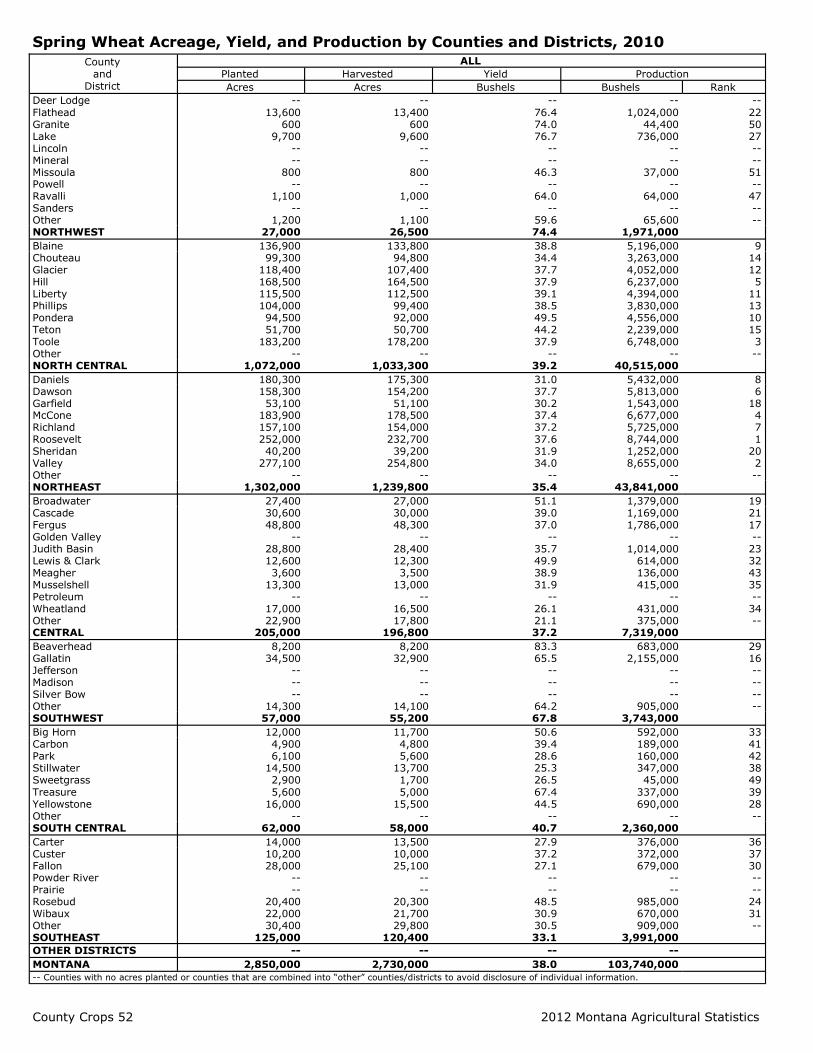
County Crops 52 2012 Montana Agricultural Statistics
Spring Wheat Acreage, Yield, and Production by Counties and Districts, 2010
County and
District
ALL
Planted Harvested Yield Production
Acres Acres Bushels Bushels Rank
Deer Lodge -- -- -- -- -- Flathead 13,600 13,400 76.4 1,024,000 22 Granite 600 600 74.0 44,400 50 Lake 9,700 9,600 76.7 736,000 27 Lincoln -- -- -- -- -- Mineral -- -- -- -- -- Missoula 800 800 46.3 37,000 51 Powell -- -- -- -- -- Ravalli 1,100 1,000 64.0 64,000 47 Sanders -- -- -- -- -- Other 1,200 1,100 59.6 65,600 -- NORTHWEST 27,000 26,500 74.4 1,971,000
Blaine 136,900 133,800 38.8 5,196,000 9 Chouteau 99,300 94,800 34.4 3,263,000 14 Glacier 118,400 107,400 37.7 4,052,000 12 Hill 168,500 164,500 37.9 6,237,000 5 Liberty 115,500 112,500 39.1 4,394,000 11 Phillips 104,000 99,400 38.5 3,830,000 13 Pondera 94,500 92,000 49.5 4,556,000 10 Teton 51,700 50,700 44.2 2,239,000 15 Toole 183,200 178,200 37.9 6,748,000 3 Other -- -- -- -- -- NORTH CENTRAL 1,072,000 1,033,300 39.2 40,515,000
Daniels 180,300 175,300 31.0 5,432,000 8 Dawson 158,300 154,200 37.7 5,813,000 6 Garfield 53,100 51,100 30.2 1,543,000 18 McCone 183,900 178,500 37.4 6,677,000 4 Richland 157,100 154,000 37.2 5,725,000 7 Roosevelt 252,000 232,700 37.6 8,744,000 1 Sheridan 40,200 39,200 31.9 1,252,000 20 Valley 277,100 254,800 34.0 8,655,000 2 Other -- -- -- -- -- NORTHEAST 1,302,000 1,239,800 35.4 43,841,000
Broadwater 27,400 27,000 51.1 1,379,000 19 Cascade 30,600 30,000 39.0 1,169,000 21 Fergus 48,800 48,300 37.0 1,786,000 17 Golden Valley -- -- -- -- -- Judith Basin 28,800 28,400 35.7 1,014,000 23 Lewis & Clark 12,600 12,300 49.9 614,000 32 Meagher 3,600 3,500 38.9 136,000 43 Musselshell 13,300 13,000 31.9 415,000 35 Petroleum -- -- -- -- -- Wheatland 17,000 16,500 26.1 431,000 34 Other 22,900 17,800 21.1 375,000 -- CENTRAL 205,000 196,800 37.2 7,319,000
Beaverhead 8,200 8,200 83.3 683,000 29 Gallatin 34,500 32,900 65.5 2,155,000 16 Jefferson -- -- -- -- -- Madison -- -- -- -- -- Silver Bow -- -- -- -- -- Other 14,300 14,100 64.2 905,000 -- SOUTHWEST 57,000 55,200 67.8 3,743,000
Big Horn 12,000 11,700 50.6 592,000 33 Carbon 4,900 4,800 39.4 189,000 41 Park 6,100 5,600 28.6 160,000 42 Stillwater 14,500 13,700 25.3 347,000 38 Sweetgrass 2,900 1,700 26.5 45,000 49 Treasure 5,600 5,000 67.4 337,000 39 Yellowstone 16,000 15,500 44.5 690,000 28 Other -- -- -- -- -- SOUTH CENTRAL 62,000 58,000 40.7 2,360,000
Carter 14,000 13,500 27.9 376,000 36 Custer 10,200 10,000 37.2 372,000 37 Fallon 28,000 25,100 27.1 679,000 30 Powder River -- -- -- -- -- Prairie -- -- -- -- -- Rosebud 20,400 20,300 48.5 985,000 24 Wibaux 22,000 21,700 30.9 670,000 31 Other 30,400 29,800 30.5 909,000 -- SOUTHEAST 125,000 120,400 33.1 3,991,000
OTHER DISTRICTS -- -- -- --
MONTANA 2,850,000 2,730,000 38.0 103,740,000
-- Counties with no acres planted or counties that are combined into “other” counties/districts to avoid disclosure of individual information.
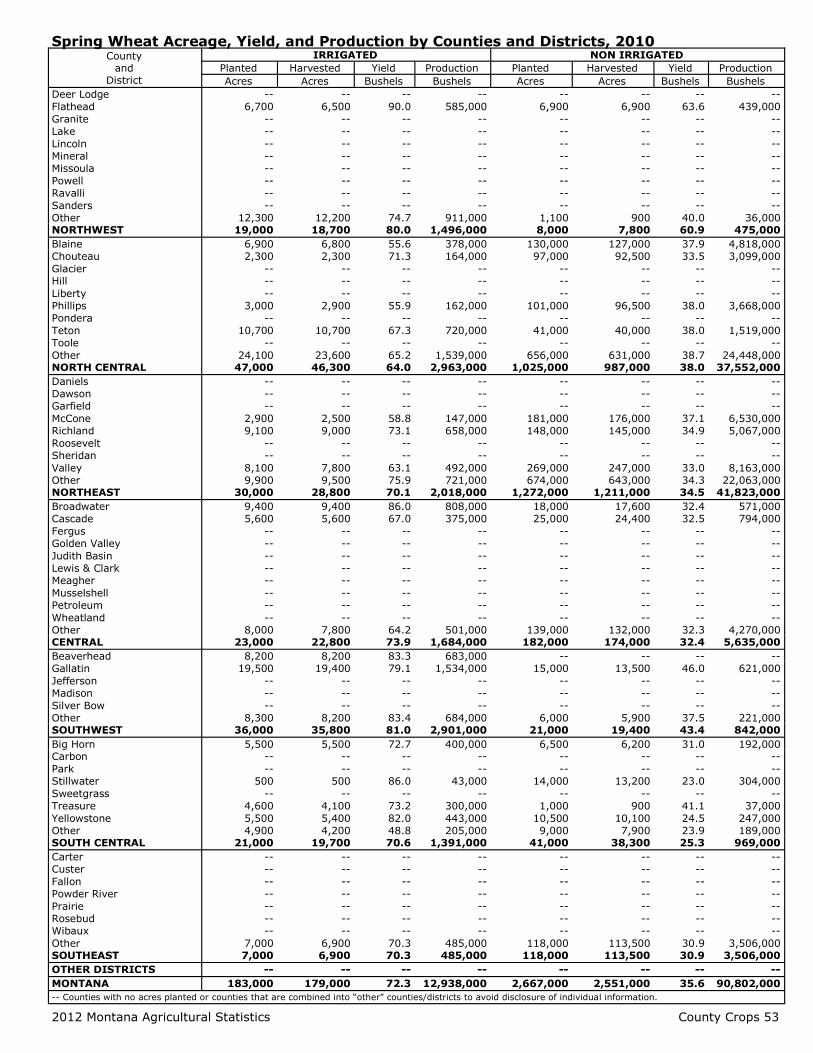
2012 Montana Agricultural Statistics County Crops 53
Spring Wheat Acreage, Yield, and Production by Counties and Districts, 2010 County
and District
IRRIGATED NON IRRIGATED
Planted Harvested Yield Production Planted Harvested Yield Production
Acres Acres Bushels Bushels Acres Acres Bushels Bushels
Deer Lodge -- -- -- -- -- -- -- --
Flathead 6,700 6,500 90.0 585,000 6,900 6,900 63.6 439,000
Granite -- -- -- -- -- -- -- --
Lake -- -- -- -- -- -- -- --
Lincoln -- -- -- -- -- -- -- --
Mineral -- -- -- -- -- -- -- --
Missoula -- -- -- -- -- -- -- --
Powell -- -- -- -- -- -- -- --
Ravalli -- -- -- -- -- -- -- --
Sanders -- -- -- -- -- -- -- --
Other 12,300 12,200 74.7 911,000 1,100 900 40.0 36,000 NORTHWEST 19,000 18,700 80.0 1,496,000 8,000 7,800 60.9 475,000
Blaine 6,900 6,800 55.6 378,000 130,000 127,000 37.9 4,818,000
Chouteau 2,300 2,300 71.3 164,000 97,000 92,500 33.5 3,099,000
Glacier -- -- -- -- -- -- -- --
Hill -- -- -- -- -- -- -- --
Liberty -- -- -- -- -- -- -- --
Phillips 3,000 2,900 55.9 162,000 101,000 96,500 38.0 3,668,000
Pondera -- -- -- -- -- -- -- --
Teton 10,700 10,700 67.3 720,000 41,000 40,000 38.0 1,519,000
Toole -- -- -- -- -- -- -- --
Other 24,100 23,600 65.2 1,539,000 656,000 631,000 38.7 24,448,000 NORTH CENTRAL 47,000 46,300 64.0 2,963,000 1,025,000 987,000 38.0 37,552,000
Daniels -- -- -- -- -- -- -- --
Dawson -- -- -- -- -- -- -- --
Garfield -- -- -- -- -- -- -- --
McCone 2,900 2,500 58.8 147,000 181,000 176,000 37.1 6,530,000
Richland 9,100 9,000 73.1 658,000 148,000 145,000 34.9 5,067,000
Roosevelt -- -- -- -- -- -- -- --
Sheridan -- -- -- -- -- -- -- --
Valley 8,100 7,800 63.1 492,000 269,000 247,000 33.0 8,163,000
Other 9,900 9,500 75.9 721,000 674,000 643,000 34.3 22,063,000 NORTHEAST 30,000 28,800 70.1 2,018,000 1,272,000 1,211,000 34.5 41,823,000
Broadwater 9,400 9,400 86.0 808,000 18,000 17,600 32.4 571,000
Cascade 5,600 5,600 67.0 375,000 25,000 24,400 32.5 794,000
Fergus -- -- -- -- -- -- -- --
Golden Valley -- -- -- -- -- -- -- --
Judith Basin -- -- -- -- -- -- -- --
Lewis & Clark -- -- -- -- -- -- -- --
Meagher -- -- -- -- -- -- -- --
Musselshell -- -- -- -- -- -- -- --
Petroleum -- -- -- -- -- -- -- --
Wheatland -- -- -- -- -- -- -- --
Other 8,000 7,800 64.2 501,000 139,000 132,000 32.3 4,270,000 CENTRAL 23,000 22,800 73.9 1,684,000 182,000 174,000 32.4 5,635,000
Beaverhead 8,200 8,200 83.3 683,000 -- -- -- --
Gallatin 19,500 19,400 79.1 1,534,000 15,000 13,500 46.0 621,000
Jefferson -- -- -- -- -- -- -- --
Madison -- -- -- -- -- -- -- --
Silver Bow -- -- -- -- -- -- -- --
Other 8,300 8,200 83.4 684,000 6,000 5,900 37.5 221,000 SOUTHWEST 36,000 35,800 81.0 2,901,000 21,000 19,400 43.4 842,000
Big Horn 5,500 5,500 72.7 400,000 6,500 6,200 31.0 192,000 Carbon -- -- -- -- -- -- -- --
Park -- -- -- -- -- -- -- --
Stillwater 500 500 86.0 43,000 14,000 13,200 23.0 304,000
Sweetgrass -- -- -- -- -- -- -- --
Treasure 4,600 4,100 73.2 300,000 1,000 900 41.1 37,000
Yellowstone 5,500 5,400 82.0 443,000 10,500 10,100 24.5 247,000
Other 4,900 4,200 48.8 205,000 9,000 7,900 23.9 189,000 SOUTH CENTRAL 21,000 19,700 70.6 1,391,000 41,000 38,300 25.3 969,000
Carter -- -- -- -- -- -- -- --
Custer -- -- -- -- -- -- -- --
Fallon -- -- -- -- -- -- -- --
Powder River -- -- -- -- -- -- -- --
Prairie -- -- -- -- -- -- -- --
Rosebud -- -- -- -- -- -- -- --
Wibaux -- -- -- -- -- -- -- --
Other 7,000 6,900 70.3 485,000 118,000 113,500 30.9 3,506,000 SOUTHEAST 7,000 6,900 70.3 485,000 118,000 113,500 30.9 3,506,000
OTHER DISTRICTS -- -- -- -- -- -- -- --
MONTANA 183,000 179,000 72.3 12,938,000 2,667,000 2,551,000 35.6 90,802,000
-- Counties with no acres planted or counties that are combined into “other” counties/districts to avoid disclosure of individual information.
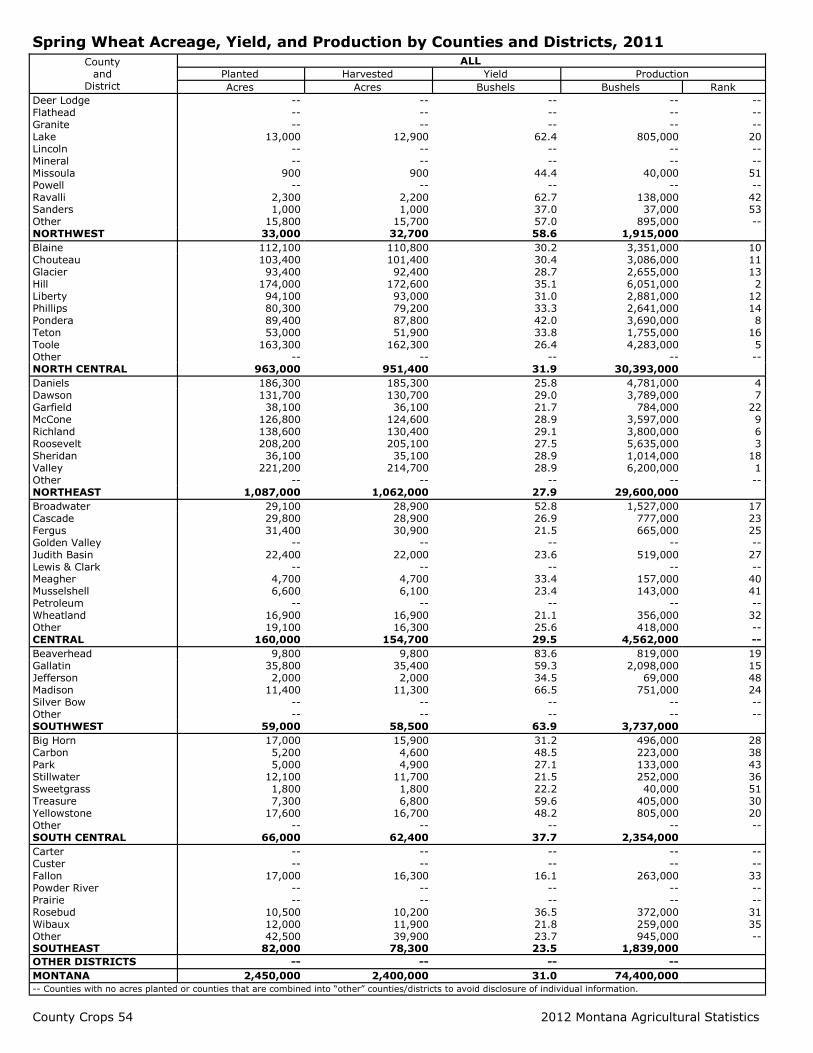
County Crops 54 2012 Montana Agricultural Statistics
Spring Wheat Acreage, Yield, and Production by Counties and Districts, 2011
County and
District
ALL
Planted Harvested Yield Production
Acres Acres Bushels Bushels Rank
Deer Lodge -- -- -- -- -- Flathead -- -- -- -- -- Granite -- -- -- -- -- Lake 13,000 12,900 62.4 805,000 20 Lincoln -- -- -- -- -- Mineral -- -- -- -- -- Missoula 900 900 44.4 40,000 51 Powell -- -- -- -- -- Ravalli 2,300 2,200 62.7 138,000 42 Sanders 1,000 1,000 37.0 37,000 53 Other 15,800 15,700 57.0 895,000 -- NORTHWEST 33,000 32,700 58.6 1,915,000
Blaine 112,100 110,800 30.2 3,351,000 10 Chouteau 103,400 101,400 30.4 3,086,000 11 Glacier 93,400 92,400 28.7 2,655,000 13 Hill 174,000 172,600 35.1 6,051,000 2 Liberty 94,100 93,000 31.0 2,881,000 12 Phillips 80,300 79,200 33.3 2,641,000 14 Pondera 89,400 87,800 42.0 3,690,000 8 Teton 53,000 51,900 33.8 1,755,000 16 Toole 163,300 162,300 26.4 4,283,000 5 Other -- -- -- -- -- NORTH CENTRAL 963,000 951,400 31.9 30,393,000
Daniels 186,300 185,300 25.8 4,781,000 4 Dawson 131,700 130,700 29.0 3,789,000 7 Garfield 38,100 36,100 21.7 784,000 22 McCone 126,800 124,600 28.9 3,597,000 9 Richland 138,600 130,400 29.1 3,800,000 6 Roosevelt 208,200 205,100 27.5 5,635,000 3 Sheridan 36,100 35,100 28.9 1,014,000 18 Valley 221,200 214,700 28.9 6,200,000 1 Other -- -- -- -- -- NORTHEAST 1,087,000 1,062,000 27.9 29,600,000
Broadwater 29,100 28,900 52.8 1,527,000 17 Cascade 29,800 28,900 26.9 777,000 23 Fergus 31,400 30,900 21.5 665,000 25 Golden Valley -- -- -- -- -- Judith Basin 22,400 22,000 23.6 519,000 27 Lewis & Clark -- -- -- -- -- Meagher 4,700 4,700 33.4 157,000 40 Musselshell 6,600 6,100 23.4 143,000 41 Petroleum -- -- -- -- -- Wheatland 16,900 16,900 21.1 356,000 32 Other 19,100 16,300 25.6 418,000 -- CENTRAL 160,000 154,700 29.5 4,562,000 --
Beaverhead 9,800 9,800 83.6 819,000 19 Gallatin 35,800 35,400 59.3 2,098,000 15 Jefferson 2,000 2,000 34.5 69,000 48 Madison 11,400 11,300 66.5 751,000 24 Silver Bow -- -- -- -- -- Other -- -- -- -- -- SOUTHWEST 59,000 58,500 63.9 3,737,000
Big Horn 17,000 15,900 31.2 496,000 28 Carbon 5,200 4,600 48.5 223,000 38 Park 5,000 4,900 27.1 133,000 43 Stillwater 12,100 11,700 21.5 252,000 36 Sweetgrass 1,800 1,800 22.2 40,000 51 Treasure 7,300 6,800 59.6 405,000 30 Yellowstone 17,600 16,700 48.2 805,000 20 Other -- -- -- -- -- SOUTH CENTRAL 66,000 62,400 37.7 2,354,000
Carter -- -- -- -- -- Custer -- -- -- -- -- Fallon 17,000 16,300 16.1 263,000 33 Powder River -- -- -- -- -- Prairie -- -- -- -- -- Rosebud 10,500 10,200 36.5 372,000 31 Wibaux 12,000 11,900 21.8 259,000 35 Other 42,500 39,900 23.7 945,000 -- SOUTHEAST 82,000 78,300 23.5 1,839,000
OTHER DISTRICTS -- -- -- --
MONTANA 2,450,000 2,400,000 31.0 74,400,000
-- Counties with no acres planted or counties that are combined into “other” counties/districts to avoid disclosure of individual information.

2012 Montana Agricultural Statistics County Crops 55
Spring Wheat Acreage, Yield, and Production by Counties and Districts, 2011
County and
District
IRRIGATED NON IRRIGATED
Planted Harvested Yield Production Planted Harvested Yield Production
Acres Acres Bushels Bushels Acres Acres Bushels Bushels
Other 23,000 22,800 65.8 1,500,000 10,000 9,900 41.9 415,000 NORTHWEST 23,000 22,800 65.8 1,500,000 10,000 9,900 41.9 415,000
Blaine 6,100 5,800 57.1 331,000 106,000 105,000 28.8 3,020,000
Other 44,900 43,600 65.2 2,844,000 806,000 797,000 30.4 24,198,000
NORTH CENTRAL 51,000 49,400 64.3 3,175,000 912,000 902,000 30.2 27,218,000
Broadwater 13,100 13,100 71.6 938,000 16,000 15,800 37.3 589,000
Cascade 5,800 5,700 50.0 285,000 24,000 23,200 21.2 492,000
Wheatland 900 900 25.6 23,000 16,000 16,000 20.8 333,000
Other 6,200 6,000 61.7 370,000 78,000 74,000 20.7 1,532,000
CENTRAL 26,000 25,700 62.9 1,616,000 134,000 129,000 22.8 2,946,000
Gallatin 22,000 21,800 74.3 1,620,000 13,800 13,600 35.1 478,000
Other 19,000 18,900 80.7 1,526,000 4,200 4,200 26.9 113,000
SOUTHWEST 41,000 40,700 77.3 3,146,000 18,000 17,800 33.2 591,000
Park 2,100 2,100 38.1 80,000 2,900 2,800 18.9 53,000
Stillwater 1,100 1,000 79.0 79,000 11,000 10,700 16.2 173,000
Yellowstone 7,100 6,900 84.8 585,000 10,500 9,800 22.4 220,000
Other 15,700 14,600 58.9 860,000 15,600 14,500 21.0 304,000
SOUTH CENTRAL 26,000 24,600 65.2 1,604,000 40,000 37,800 19.8 750,000
OTHER DISTRICTS 35,000 33,800 47.4 1,603,000 1,134,000 1,106,500 27.0 29,836,000
MONTANA 202,000 197,000 64.2 12,644,000 2,248,000 2,203,000 28.0 61,756,000
-- Counties with no acres planted or counties that are combined into “other” counties/districts to avoid disclosure of individual information.
Durum Wheat Acreage, Yield, and Production by Counties and Districts, 2010 County
and District
ALL
Planted Harvested Yield Production
Acres Acres Bushels Bushels Rank
Daniels 101,000 101,000 28.5 2,880,000 2
Richland 10,000 10,000 36.8 368,000 8
Roosevelt 74,000 69,000 32.3 2,226,000 3
Sheridan 248,000 247,000 33.7 8,312,000 1
Valley 17,000 16,800 37.3 626,000 4
Other 10,000 8,200 35.4 290,000 -- NORTHEAST 460,000 452,000 32.5 14,702,000
Other 5,000 5,000 52.8 264,000 -- CENTRAL 5,000 5,000 52.8 264,000
OTHER DISTRICTS 75,000 73,000 41.8 3,054,000
MONTANA 540,000 530,000 34.0 18,020,000
-- Counties with no acres planted or counties that are combined into “other” counties/districts to avoid disclosure of individual information.
Durum Wheat Acreage, Yield, and Production by Counties and Districts, 2011 County
and District
ALL
Planted Harvested Yield Production
Acres Acres Bushels Bushels Rank
Blaine 1,800 1,800 26.1 47,000 18 Hill 6,300 6,100 38.7 236,000 6 Pondera 9,800 9,700 46.8 454,000 5 Teton 2,200 2,200 50.0 110,000 12 Toole 5,600 5,500 37.5 206,000 7 Other 13,300 13,200 32.2 425,000 -- NORTH CENTRAL 39,000 38,500 38.4 1,478,000
Daniels 70,000 67,500 25.9 1,751,000 2 Sheridan 200,000 191,000 27.5 5,246,000 1 Valley 15,300 14,800 32.0 473,000 4 Other 67,700 65,700 25.2 1,656,000 -- NORTHEAST 353,000 339,000 26.9 9,126,000
Other 2,000 1,600 37.5 60,000 -- CENTRAL 2,000 1,600 37.5 60,000
Other 6,000 5,900 19.7 116,000 -- SOUTHEAST 6,000 5,900 19.7 116,000
MONTANA 400,000 385,000 28.0 10,780,000
-- Counties with no acres planted or counties that are combined into “other” counties/districts to avoid disclosure of individual information.
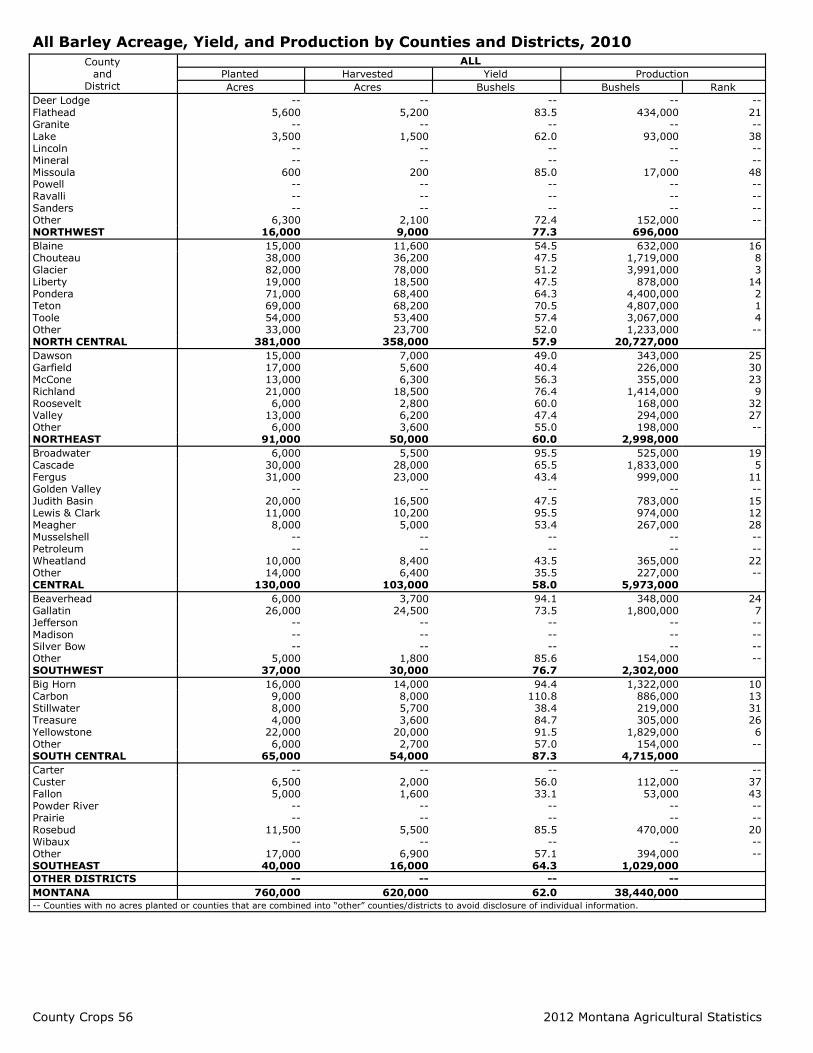
County Crops 56 2012 Montana Agricultural Statistics
All Barley Acreage, Yield, and Production by Counties and Districts, 2010
County and
District
ALL
Planted Harvested Yield Production
Acres Acres Bushels Bushels Rank
Deer Lodge -- -- -- -- -- Flathead 5,600 5,200 83.5 434,000 21 Granite -- -- -- -- -- Lake 3,500 1,500 62.0 93,000 38 Lincoln -- -- -- -- -- Mineral -- -- -- -- -- Missoula 600 200 85.0 17,000 48 Powell -- -- -- -- -- Ravalli -- -- -- -- -- Sanders -- -- -- -- -- Other 6,300 2,100 72.4 152,000 -- NORTHWEST 16,000 9,000 77.3 696,000
Blaine 15,000 11,600 54.5 632,000 16 Chouteau 38,000 36,200 47.5 1,719,000 8 Glacier 82,000 78,000 51.2 3,991,000 3 Liberty 19,000 18,500 47.5 878,000 14 Pondera 71,000 68,400 64.3 4,400,000 2 Teton 69,000 68,200 70.5 4,807,000 1 Toole 54,000 53,400 57.4 3,067,000 4 Other 33,000 23,700 52.0 1,233,000 -- NORTH CENTRAL 381,000 358,000 57.9 20,727,000
Dawson 15,000 7,000 49.0 343,000 25 Garfield 17,000 5,600 40.4 226,000 30 McCone 13,000 6,300 56.3 355,000 23 Richland 21,000 18,500 76.4 1,414,000 9 Roosevelt 6,000 2,800 60.0 168,000 32 Valley 13,000 6,200 47.4 294,000 27 Other 6,000 3,600 55.0 198,000 -- NORTHEAST 91,000 50,000 60.0 2,998,000
Broadwater 6,000 5,500 95.5 525,000 19 Cascade 30,000 28,000 65.5 1,833,000 5 Fergus 31,000 23,000 43.4 999,000 11 Golden Valley -- -- -- -- -- Judith Basin 20,000 16,500 47.5 783,000 15 Lewis & Clark 11,000 10,200 95.5 974,000 12 Meagher 8,000 5,000 53.4 267,000 28 Musselshell -- -- -- -- -- Petroleum -- -- -- -- -- Wheatland 10,000 8,400 43.5 365,000 22 Other 14,000 6,400 35.5 227,000 -- CENTRAL 130,000 103,000 58.0 5,973,000
Beaverhead 6,000 3,700 94.1 348,000 24 Gallatin 26,000 24,500 73.5 1,800,000 7 Jefferson -- -- -- -- -- Madison -- -- -- -- -- Silver Bow -- -- -- -- -- Other 5,000 1,800 85.6 154,000 -- SOUTHWEST 37,000 30,000 76.7 2,302,000
Big Horn 16,000 14,000 94.4 1,322,000 10 Carbon 9,000 8,000 110.8 886,000 13 Stillwater 8,000 5,700 38.4 219,000 31 Treasure 4,000 3,600 84.7 305,000 26 Yellowstone 22,000 20,000 91.5 1,829,000 6 Other 6,000 2,700 57.0 154,000 -- SOUTH CENTRAL 65,000 54,000 87.3 4,715,000
Carter -- -- -- -- -- Custer 6,500 2,000 56.0 112,000 37 Fallon 5,000 1,600 33.1 53,000 43 Powder River -- -- -- -- -- Prairie -- -- -- -- -- Rosebud 11,500 5,500 85.5 470,000 20 Wibaux -- -- -- -- -- Other 17,000 6,900 57.1 394,000 -- SOUTHEAST 40,000 16,000 64.3 1,029,000
OTHER DISTRICTS -- -- -- --
MONTANA 760,000 620,000 62.0 38,440,000
-- Counties with no acres planted or counties that are combined into “other” counties/districts to avoid disclosure of individual information.

2012 Montana Agricultural Statistics County Crops 57
All Barley Acreage, Yield, and Production by Counties and Districts, 2011
County and
District
ALL
Planted Harvested Yield Production
Acres Acres Bushels Bushels Rank
Blaine 14,000 13,000 38.0 494,000 16 Chouteau 30,000 28,000 38.8 1,087,000 8 Glacier 85,000 84,000 38.9 3,268,000 4 Hill 13,000 12,000 41.9 503,000 15 Liberty 18,000 17,000 41.9 713,000 11 Phillips 15,000 9,000 37.6 338,000 21 Pondera 75,000 74,000 54.7 4,050,000 2 Teton 80,000 79,000 64.0 5,056,000 1 Toole 72,000 71,000 47.1 3,345,000 3 NORTH CENTRAL 402,000 387,000 48.7 18,854,000
Dawson 8,700 4,500 41.6 187,000 28 Valley 5,700 2,500 25.6 64,000 37 Other 43,600 29,000 43.5 1,262,000 -- NORTHEAST 58,000 36,000 42.0 1,513,000
Broadwater 5,000 4,100 76.8 315,000 22 Cascade 30,000 29,000 42.3 1,227,000 6 Fergus 21,000 15,000 29.9 449,000 18 Judith Basin 13,000 12,000 26.3 315,000 22 Lewis & Clark 8,100 7,900 65.8 520,000 14 Meagher 8,500 8,000 55.0 440,000 13 Wheatland 9,200 8,600 28.8 248,000 25 Other 9,200 5,400 21.9 118,000 -- CENTRAL 104,000 90,000 40.4 3,632,000
Beaverhead 7,000 4,600 94.3 434,000 19 Gallatin 28,000 27,500 63.3 1,740,000 5 Madison 5,600 2,200 90.9 200,000 26 Other 1,400 700 71.4 50,000 -- SOUTHWEST 42,000 35,000 69.3 2,424,000
Big Horn 13,000 10,000 62.1 621,000 12 Carbon 10,000 9,000 82.4 742,000 9 Park 4,000 3,000 60.3 181,000 29 Stillwater 7,000 4,000 35.8 143,000 31 Sweetgrass 3,000 1,000 57.0 57,000 41 Treasure 4,000 3,000 86.7 260,000 24 Yellowstone 19,000 18,000 60.9 1,096,000 7 SOUTH CENTRAL 60,000 48,000 64.6 3,100,000
OTHER DISTRICTS 34,000 24,000 61.5 1,477,000
MONTANA 700,000 620,000 50.0 31,000,000
-- Counties with no acres planted or counties that are combined into “other” counties/districts to avoid disclosure of individual information.
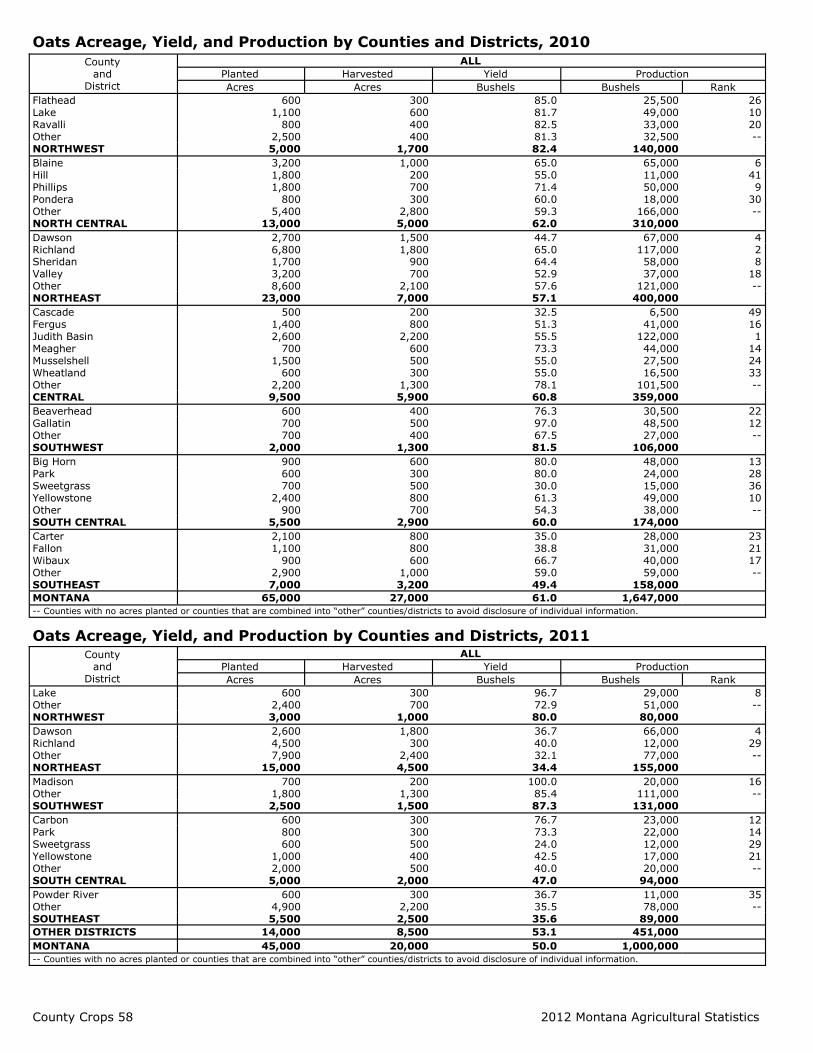
County Crops 58 2012 Montana Agricultural Statistics
Oats Acreage, Yield, and Production by Counties and Districts, 2010
County and
District
ALL
Planted Harvested Yield Production
Acres Acres Bushels Bushels Rank
Flathead 600 300 85.0 25,500 26 Lake 1,100 600 81.7 49,000 10 Ravalli 800 400 82.5 33,000 20 Other 2,500 400 81.3 32,500 -- NORTHWEST 5,000 1,700 82.4 140,000
Blaine 3,200 1,000 65.0 65,000 6 Hill 1,800 200 55.0 11,000 41 Phillips 1,800 700 71.4 50,000 9 Pondera 800 300 60.0 18,000 30 Other 5,400 2,800 59.3 166,000 -- NORTH CENTRAL 13,000 5,000 62.0 310,000
Dawson 2,700 1,500 44.7 67,000 4 Richland 6,800 1,800 65.0 117,000 2 Sheridan 1,700 900 64.4 58,000 8 Valley 3,200 700 52.9 37,000 18 Other 8,600 2,100 57.6 121,000 -- NORTHEAST 23,000 7,000 57.1 400,000
Cascade 500 200 32.5 6,500 49 Fergus 1,400 800 51.3 41,000 16 Judith Basin 2,600 2,200 55.5 122,000 1 Meagher 700 600 73.3 44,000 14 Musselshell 1,500 500 55.0 27,500 24 Wheatland 600 300 55.0 16,500 33 Other 2,200 1,300 78.1 101,500 -- CENTRAL 9,500 5,900 60.8 359,000
Beaverhead 600 400 76.3 30,500 22 Gallatin 700 500 97.0 48,500 12 Other 700 400 67.5 27,000 -- SOUTHWEST 2,000 1,300 81.5 106,000
Big Horn 900 600 80.0 48,000 13 Park 600 300 80.0 24,000 28 Sweetgrass 700 500 30.0 15,000 36 Yellowstone 2,400 800 61.3 49,000 10 Other 900 700 54.3 38,000 -- SOUTH CENTRAL 5,500 2,900 60.0 174,000
Carter 2,100 800 35.0 28,000 23 Fallon 1,100 800 38.8 31,000 21 Wibaux 900 600 66.7 40,000 17 Other 2,900 1,000 59.0 59,000 -- SOUTHEAST 7,000 3,200 49.4 158,000
MONTANA 65,000 27,000 61.0 1,647,000
-- Counties with no acres planted or counties that are combined into “other” counties/districts to avoid disclosure of individual information.
Oats Acreage, Yield, and Production by Counties and Districts, 2011 County
and District
ALL
Planted Harvested Yield Production
Acres Acres Bushels Bushels Rank
Lake 600 300 96.7 29,000 8 Other 2,400 700 72.9 51,000 -- NORTHWEST 3,000 1,000 80.0 80,000
Dawson 2,600 1,800 36.7 66,000 4 Richland 4,500 300 40.0 12,000 29 Other 7,900 2,400 32.1 77,000 -- NORTHEAST 15,000 4,500 34.4 155,000
Madison 700 200 100.0 20,000 16 Other 1,800 1,300 85.4 111,000 -- SOUTHWEST 2,500 1,500 87.3 131,000
Carbon 600 300 76.7 23,000 12 Park 800 300 73.3 22,000 14 Sweetgrass 600 500 24.0 12,000 29 Yellowstone 1,000 400 42.5 17,000 21 Other 2,000 500 40.0 20,000 -- SOUTH CENTRAL 5,000 2,000 47.0 94,000
Powder River 600 300 36.7 11,000 35 Other 4,900 2,200 35.5 78,000 -- SOUTHEAST 5,500 2,500 35.6 89,000
OTHER DISTRICTS 14,000 8,500 53.1 451,000
MONTANA 45,000 20,000 50.0 1,000,000
-- Counties with no acres planted or counties that are combined into “other” counties/districts to avoid disclosure of individual information.
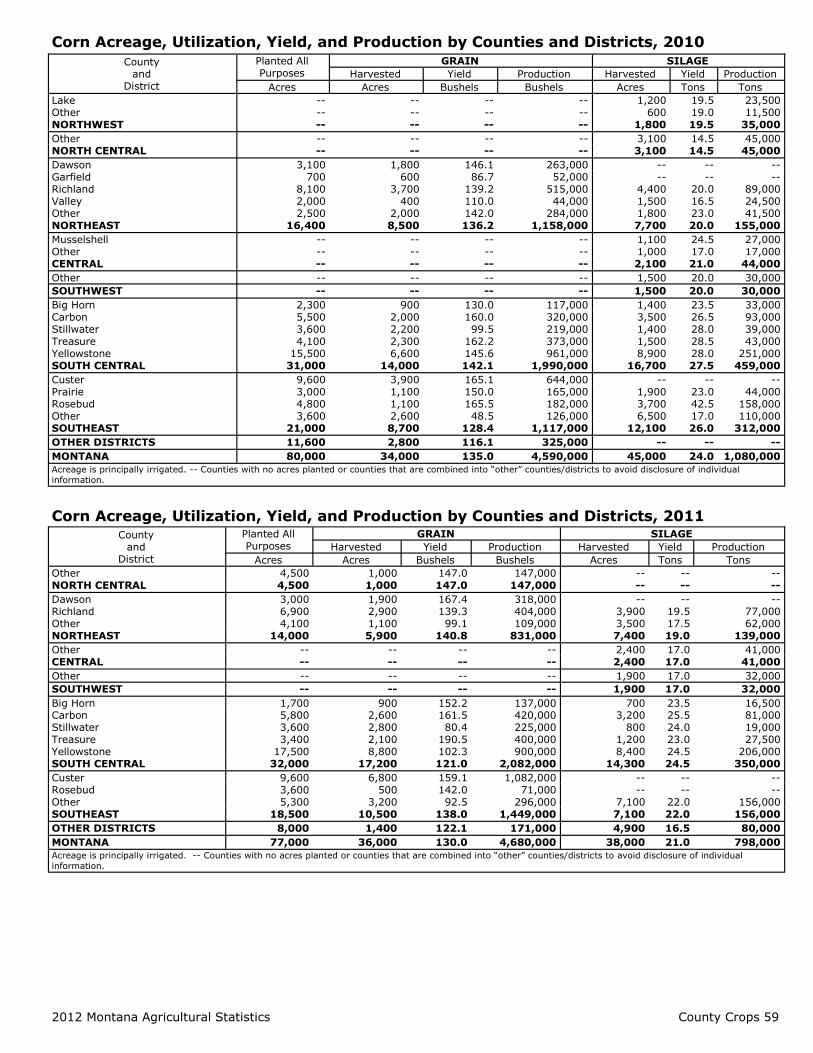
2012 Montana Agricultural Statistics County Crops 59
Corn Acreage, Utilization, Yield, and Production by Counties and Districts, 2010
County and
District
Planted All Purposes
GRAIN SILAGE
Harvested Yield Production Harvested Yield Production
Acres Acres Bushels Bushels Acres Tons Tons
Lake -- -- -- -- 1,200 19.5 23,500 Other -- -- -- -- 600 19.0 11,500 NORTHWEST -- -- -- -- 1,800 19.5 35,000
Other -- -- -- -- 3,100 14.5 45,000 NORTH CENTRAL -- -- -- -- 3,100 14.5 45,000
Dawson 3,100 1,800 146.1 263,000 -- -- -- Garfield 700 600 86.7 52,000 -- -- -- Richland 8,100 3,700 139.2 515,000 4,400 20.0 89,000 Valley 2,000 400 110.0 44,000 1,500 16.5 24,500 Other 2,500 2,000 142.0 284,000 1,800 23.0 41,500 NORTHEAST 16,400 8,500 136.2 1,158,000 7,700 20.0 155,000
Musselshell -- -- -- -- 1,100 24.5 27,000 Other -- -- -- -- 1,000 17.0 17,000 CENTRAL -- -- -- -- 2,100 21.0 44,000
Other -- -- -- -- 1,500 20.0 30,000
SOUTHWEST -- -- -- -- 1,500 20.0 30,000
Big Horn 2,300 900 130.0 117,000 1,400 23.5 33,000 Carbon 5,500 2,000 160.0 320,000 3,500 26.5 93,000 Stillwater 3,600 2,200 99.5 219,000 1,400 28.0 39,000 Treasure 4,100 2,300 162.2 373,000 1,500 28.5 43,000 Yellowstone 15,500 6,600 145.6 961,000 8,900 28.0 251,000 SOUTH CENTRAL 31,000 14,000 142.1 1,990,000 16,700 27.5 459,000
Custer 9,600 3,900 165.1 644,000 -- -- -- Prairie 3,000 1,100 150.0 165,000 1,900 23.0 44,000 Rosebud 4,800 1,100 165.5 182,000 3,700 42.5 158,000 Other 3,600 2,600 48.5 126,000 6,500 17.0 110,000 SOUTHEAST 21,000 8,700 128.4 1,117,000 12,100 26.0 312,000
OTHER DISTRICTS 11,600 2,800 116.1 325,000 -- -- --
MONTANA 80,000 34,000 135.0 4,590,000 45,000 24.0 1,080,000
Acreage is principally irrigated. -- Counties with no acres planted or counties that are combined into “other” counties/districts to avoid disclosure of individual
information.
Corn Acreage, Utilization, Yield, and Production by Counties and Districts, 2011 County
and District
Planted All Purposes
GRAIN SILAGE
Harvested Yield Production Harvested Yield Production
Acres Acres Bushels Bushels Acres Tons Tons
Other 4,500 1,000 147.0 147,000 -- -- -- NORTH CENTRAL 4,500 1,000 147.0 147,000 -- -- --
Dawson 3,000 1,900 167.4 318,000 -- -- -- Richland 6,900 2,900 139.3 404,000 3,900 19.5 77,000 Other 4,100 1,100 99.1 109,000 3,500 17.5 62,000 NORTHEAST 14,000 5,900 140.8 831,000 7,400 19.0 139,000
Other -- -- -- -- 2,400 17.0 41,000 CENTRAL -- -- -- -- 2,400 17.0 41,000
Other -- -- -- -- 1,900 17.0 32,000
SOUTHWEST -- -- -- -- 1,900 17.0 32,000
Big Horn 1,700 900 152.2 137,000 700 23.5 16,500 Carbon 5,800 2,600 161.5 420,000 3,200 25.5 81,000 Stillwater 3,600 2,800 80.4 225,000 800 24.0 19,000 Treasure 3,400 2,100 190.5 400,000 1,200 23.0 27,500 Yellowstone 17,500 8,800 102.3 900,000 8,400 24.5 206,000 SOUTH CENTRAL 32,000 17,200 121.0 2,082,000 14,300 24.5 350,000
Custer 9,600 6,800 159.1 1,082,000 -- -- -- Rosebud 3,600 500 142.0 71,000 -- -- -- Other 5,300 3,200 92.5 296,000 7,100 22.0 156,000 SOUTHEAST 18,500 10,500 138.0 1,449,000 7,100 22.0 156,000
OTHER DISTRICTS 8,000 1,400 122.1 171,000 4,900 16.5 80,000
MONTANA 77,000 36,000 130.0 4,680,000 38,000 21.0 798,000
Acreage is principally irrigated. -- Counties with no acres planted or counties that are combined into “other” counties/districts to avoid disclosure of individual
information.
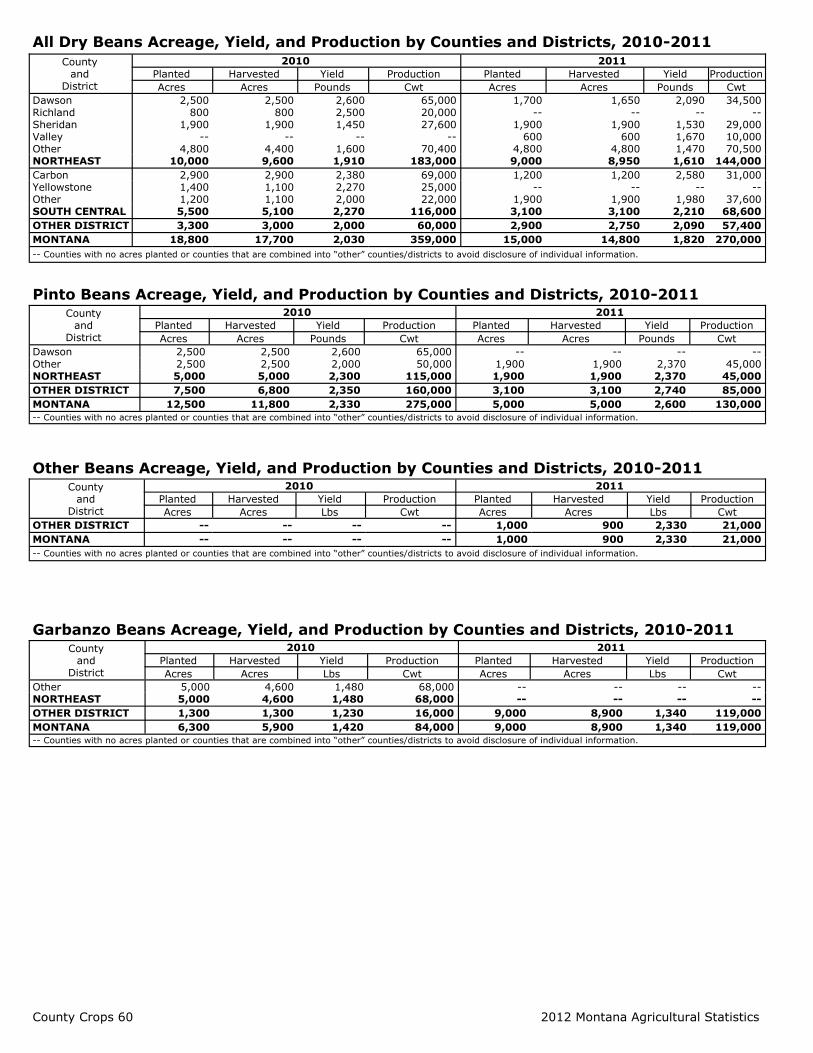
County Crops 60 2012 Montana Agricultural Statistics
All Dry Beans Acreage, Yield, and Production by Counties and Districts, 2010-2011
County and
District
2010 2011
Planted Harvested Yield Production Planted Harvested Yield Production
Acres Acres Pounds Cwt Acres Acres Pounds Cwt
Dawson 2,500 2,500 2,600 65,000 1,700 1,650 2,090 34,500 Richland 800 800 2,500 20,000 -- -- -- -- Sheridan 1,900 1,900 1,450 27,600 1,900 1,900 1,530 29,000 Valley -- -- -- -- 600 600 1,670 10,000 Other 4,800 4,400 1,600 70,400 4,800 4,800 1,470 70,500 NORTHEAST 10,000 9,600 1,910 183,000 9,000 8,950 1,610 144,000
Carbon 2,900 2,900 2,380 69,000 1,200 1,200 2,580 31,000 Yellowstone 1,400 1,100 2,270 25,000 -- -- -- -- Other 1,200 1,100 2,000 22,000 1,900 1,900 1,980 37,600 SOUTH CENTRAL 5,500 5,100 2,270 116,000 3,100 3,100 2,210 68,600
OTHER DISTRICT 3,300 3,000 2,000 60,000 2,900 2,750 2,090 57,400
MONTANA 18,800 17,700 2,030 359,000 15,000 14,800 1,820 270,000
-- Counties with no acres planted or counties that are combined into “other” counties/districts to avoid disclosure of individual information.
Pinto Beans Acreage, Yield, and Production by Counties and Districts, 2010-2011 County
and District
2010 2011
Planted Harvested Yield Production Planted Harvested Yield Production
Acres Acres Pounds Cwt Acres Acres Pounds Cwt
Dawson 2,500 2,500 2,600 65,000 -- -- -- --
Other 2,500 2,500 2,000 50,000 1,900 1,900 2,370 45,000 NORTHEAST 5,000 5,000 2,300 115,000 1,900 1,900 2,370 45,000
OTHER DISTRICT 7,500 6,800 2,350 160,000 3,100 3,100 2,740 85,000
MONTANA 12,500 11,800 2,330 275,000 5,000 5,000 2,600 130,000
-- Counties with no acres planted or counties that are combined into “other” counties/districts to avoid disclosure of individual information.
Other Beans Acreage, Yield, and Production by Counties and Districts, 2010-2011 County
and District
2010 2011
Planted Harvested Yield Production Planted Harvested Yield Production
Acres Acres Lbs Cwt Acres Acres Lbs Cwt
OTHER DISTRICT -- -- -- -- 1,000 900 2,330 21,000
MONTANA -- -- -- -- 1,000 900 2,330 21,000
-- Counties with no acres planted or counties that are combined into “other” counties/districts to avoid disclosure of individual information.
Garbanzo Beans Acreage, Yield, and Production by Counties and Districts, 2010-2011 County
and District
2010 2011
Planted Harvested Yield Production Planted Harvested Yield Production
Acres Acres Lbs Cwt Acres Acres Lbs Cwt
Other 5,000 4,600 1,480 68,000 -- -- -- -- NORTHEAST 5,000 4,600 1,480 68,000 -- -- -- --
OTHER DISTRICT 1,300 1,300 1,230 16,000 9,000 8,900 1,340 119,000
MONTANA 6,300 5,900 1,420 84,000 9,000 8,900 1,340 119,000
-- Counties with no acres planted or counties that are combined into “other” counties/districts to avoid disclosure of individual information.
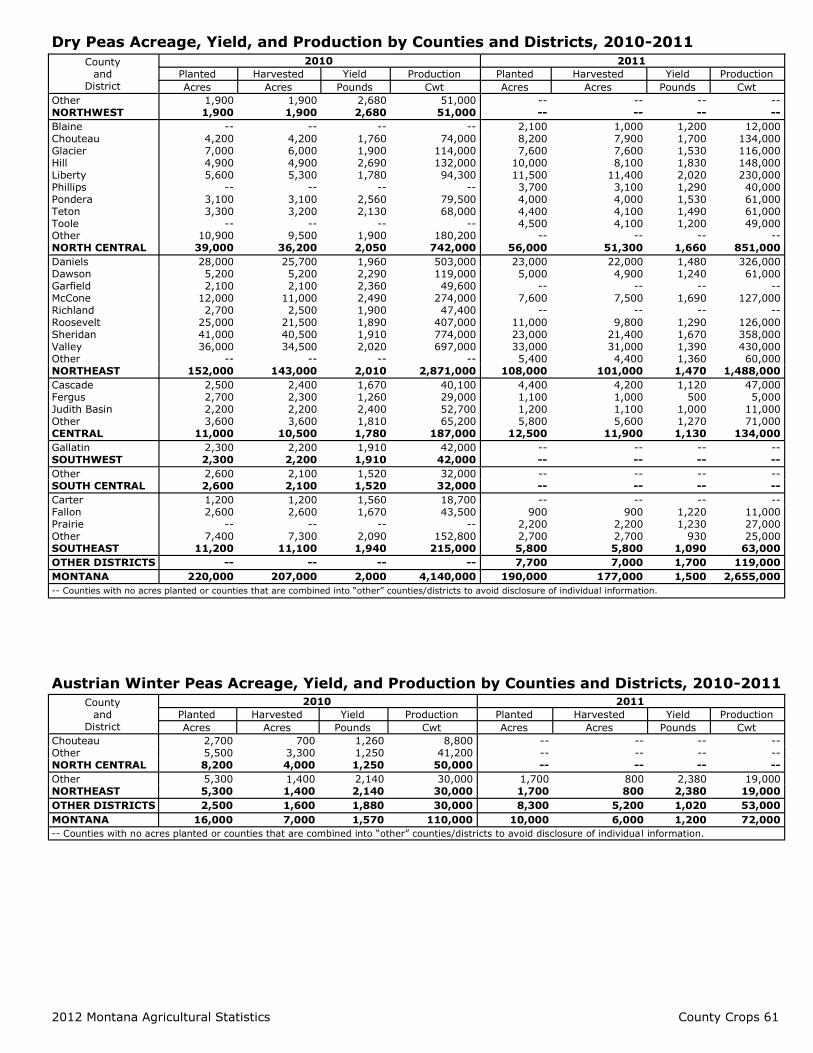
2012 Montana Agricultural Statistics County Crops 61
Dry Peas Acreage, Yield, and Production by Counties and Districts, 2010-2011
County and
District
2010 2011
Planted Harvested Yield Production Planted Harvested Yield Production
Acres Acres Pounds Cwt Acres Acres Pounds Cwt
Other 1,900 1,900 2,680 51,000 -- -- -- -- NORTHWEST 1,900 1,900 2,680 51,000 -- -- -- --
Blaine -- -- -- -- 2,100 1,000 1,200 12,000 Chouteau 4,200 4,200 1,760 74,000 8,200 7,900 1,700 134,000 Glacier 7,000 6,000 1,900 114,000 7,600 7,600 1,530 116,000 Hill 4,900 4,900 2,690 132,000 10,000 8,100 1,830 148,000 Liberty 5,600 5,300 1,780 94,300 11,500 11,400 2,020 230,000 Phillips -- -- -- -- 3,700 3,100 1,290 40,000 Pondera 3,100 3,100 2,560 79,500 4,000 4,000 1,530 61,000 Teton 3,300 3,200 2,130 68,000 4,400 4,100 1,490 61,000 Toole -- -- -- -- 4,500 4,100 1,200 49,000 Other 10,900 9,500 1,900 180,200 -- -- -- -- NORTH CENTRAL 39,000 36,200 2,050 742,000 56,000 51,300 1,660 851,000
Daniels 28,000 25,700 1,960 503,000 23,000 22,000 1,480 326,000 Dawson 5,200 5,200 2,290 119,000 5,000 4,900 1,240 61,000 Garfield 2,100 2,100 2,360 49,600 -- -- -- -- McCone 12,000 11,000 2,490 274,000 7,600 7,500 1,690 127,000 Richland 2,700 2,500 1,900 47,400 -- -- -- -- Roosevelt 25,000 21,500 1,890 407,000 11,000 9,800 1,290 126,000 Sheridan 41,000 40,500 1,910 774,000 23,000 21,400 1,670 358,000 Valley 36,000 34,500 2,020 697,000 33,000 31,000 1,390 430,000 Other -- -- -- -- 5,400 4,400 1,360 60,000 NORTHEAST 152,000 143,000 2,010 2,871,000 108,000 101,000 1,470 1,488,000
Cascade 2,500 2,400 1,670 40,100 4,400 4,200 1,120 47,000 Fergus 2,700 2,300 1,260 29,000 1,100 1,000 500 5,000 Judith Basin 2,200 2,200 2,400 52,700 1,200 1,100 1,000 11,000 Other 3,600 3,600 1,810 65,200 5,800 5,600 1,270 71,000 CENTRAL 11,000 10,500 1,780 187,000 12,500 11,900 1,130 134,000
Gallatin 2,300 2,200 1,910 42,000 -- -- -- -- SOUTHWEST 2,300 2,200 1,910 42,000 -- -- -- --
Other 2,600 2,100 1,520 32,000 -- -- -- -- SOUTH CENTRAL 2,600 2,100 1,520 32,000 -- -- -- --
Carter 1,200 1,200 1,560 18,700 -- -- -- -- Fallon 2,600 2,600 1,670 43,500 900 900 1,220 11,000 Prairie -- -- -- -- 2,200 2,200 1,230 27,000 Other 7,400 7,300 2,090 152,800 2,700 2,700 930 25,000 SOUTHEAST 11,200 11,100 1,940 215,000 5,800 5,800 1,090 63,000
OTHER DISTRICTS -- -- -- -- 7,700 7,000 1,700 119,000
MONTANA 220,000 207,000 2,000 4,140,000 190,000 177,000 1,500 2,655,000
-- Counties with no acres planted or counties that are combined into “other” counties/districts to avoid disclosure of individual information.
Austrian Winter Peas Acreage, Yield, and Production by Counties and Districts, 2010-2011
County and
District
2010 2011
Planted Harvested Yield Production Planted Harvested Yield Production
Acres Acres Pounds Cwt Acres Acres Pounds Cwt
Chouteau 2,700 700 1,260 8,800 -- -- -- -- Other 5,500 3,300 1,250 41,200 -- -- -- -- NORTH CENTRAL 8,200 4,000 1,250 50,000 -- -- -- --
Other 5,300 1,400 2,140 30,000 1,700 800 2,380 19,000 NORTHEAST 5,300 1,400 2,140 30,000 1,700 800 2,380 19,000
OTHER DISTRICTS 2,500 1,600 1,880 30,000 8,300 5,200 1,020 53,000
MONTANA 16,000 7,000 1,570 110,000 10,000 6,000 1,200 72,000
-- Counties with no acres planted or counties that are combined into “other” counties/districts to avoid disclosure of individua l information.

County Crops 62 2012 Montana Agricultural Statistics
Lentils Acreage, Yield, and Production by Counties and Districts, 2010-2011
County and
District
2010 2011
Planted Harvested Yield Production Planted Harvested Yield Production
Acres Acres Pounds Cwt Acres Acres Pounds Cwt
Glacier -- -- -- -- 10,600 10,600 1,330 141,000 Hill 3,900 3,400 1,560 53,100 8,300 8,100 910 74,000 Liberty 5,100 5,100 1,520 77,600 8,500 8,500 940 80,000 Phillips 4,300 4,100 820 33,700 2,700 2,700 1,260 34,000 Pondera 3,900 3,100 1,240 38,500 4,100 4,100 950 39,000 Teton 3,100 3,000 1,150 34,500 4,300 4,200 1,120 47,000 Toole 3,800 3,800 1,720 65,500 5,900 5,900 1,270 75,000 Other 10,800 10,300 1,480 152,100 6,600 6,600 730 48,000 NORTH CENTRAL 34,900 32,800 1,390 455,000 51,000 50,700 1,060 538,000
Daniels 29,000 28,300 1,270 360,000 35,300 34,500 1,240 429,000 Dawson 5,200 5,200 1,630 85,000 6,000 5,800 1,410 82,000 McCone 8,500 8,100 1,690 137,000 4,500 3,900 1,640 64,000 Roosevelt 26,000 23,400 1,250 292,000 28,000 27,200 810 220,000 Sheridan 113,000 112,000 1,400 1,565,000 88,400 84,700 1,200 1,020,000 Valley 21,000 15,800 1,330 210,000 15,400 13,700 930 127,000 Other 5,300 5,200 1,130 59,000 5,400 3,200 1,220 39,000 NORTHEAST 208,000 198,000 1,370 2,708,000 183,000 173,000 1,150 1,981,000
Cascade 1,000 1,000 950 9,500 2,000 1,900 580 11,000 Fergus 2,300 1,700 820 14,000 2,600 2,500 880 22,000 Other 1,000 900 1,060 9,500 4,900 4,700 870 41,000 CENTRAL 4,300 3,600 920 33,000 9,500 9,100 810 74,000
Carter -- -- -- -- 1,700 1,500 600 9,000 Wibaux 3,500 3,400 1,810 61,600 -- -- -- -- Other 5,000 5,000 1,390 69,400 6,800 6,100 970 59,000 SOUTHEAST 8,500 8,400 1,560 131,000 8,500 7,600 890 68,000
OTHER DISTRICTS 4,300 4,200 760 32,000 8,000 6,600 850 56,000
MONTANA 260,000 247,000 1,360 3,359,000 260,000 247,000 1,100 2,717,000
-- Counties with no acres planted or counties that are combined into “other” counties/districts to avoid disclosure of individual information.
Flaxseed Acreage, Yield, and Production by Counties and Districts, 2010-2011 County
and District
2010 2011
Planted Harvested Yield Production Planted Harvested Yield Production
Acres Acres Bushels Bushels Acres Acres Bushels Bushels
Other 1,300 1,300 20.8 27,000 -- -- -- -- NORTH CENTRAL 1,300 1,300 20.8 27,000 -- -- -- --
Other 12,000 12,000 16.9 203,000 -- -- -- -- NORTHEAST 12,000 12,000 16.9 203,000 -- -- -- --
OTHER DISTRICTS 1,700 1,700 14.7 25,000 17,000 16,000 13.0 208,000
MONTANA 15,000 15,000 17.0 255,000 17,000 16,000 13.0 208,000
-- Counties with no acres planted or counties that are combined into “other” counties/districts to avoid disclosure of individual information.
Canola Acreage, Yield, and Production by Counties and Districts, 2010-2011 County
and District
2010 2011
Planted Harvested Yield Production Planted Harvested Yield Production
Acres Acres Pounds Pounds Acres Acres Pounds Pounds
Flathead 1,600 1,600 2,090 3,351,000 4,900 4,800 1,860 8,945,000 NORTHWEST 1,600 1,600 2,090 3,351,000 4,900 4,800 1,860 8,945,000
Glacier 3,500 3,500 1,390 4,882,000 11,000 10,900 1,080 11,782,000 Pondera 2,900 2,900 2,630 7,641,000 4,700 4,600 1,930 8,855,000 Teton -- -- -- -- 800 800 2,730 2,180,000 Toole 1,500 1,500 1,600 2,393,000 2,500 2,500 1,210 3,030,000 Other 1,800 1,800 1,980 3,566,000 1,600 1,600 970 1,552,000 NORTH CENTRAL 9,700 9,700 1,910 18,482,000 20,600 20,400 1,340 27,399,000
Other 3,800 3,700 1,310 4,854,000 -- -- -- -- NORTHEAST 3,800 3,700 1,310 4,854,000 -- -- -- --
OTHER DISTRICTS 2,400 2,400 1,420 3,415,000 5,500 5,300 1,030 5,441,000
MONTANA 17,500 17,100 1,730 29,583,000 31,000 30,500 1,370 41,785,000
-- Counties with no acres planted or counties that are combined into “other” counties/districts to avoid disclosure of individual information.
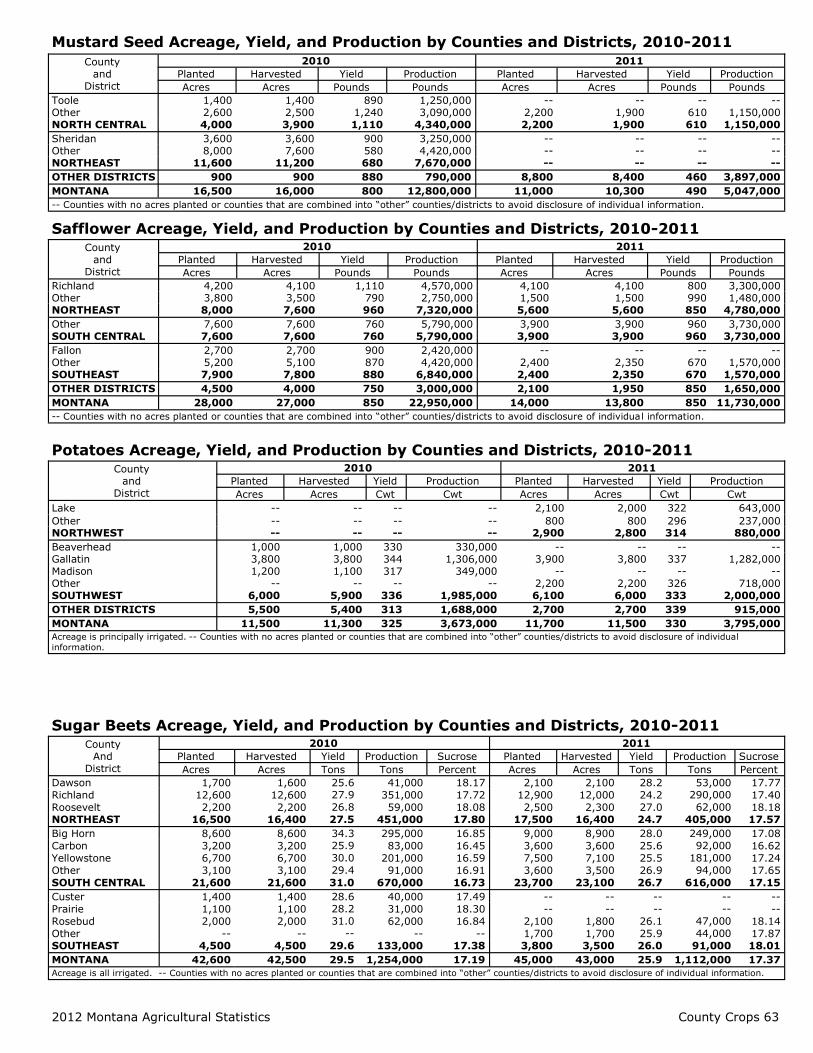
2012 Montana Agricultural Statistics County Crops 63
Mustard Seed Acreage, Yield, and Production by Counties and Districts, 2010-2011
County and
District
2010 2011
Planted Harvested Yield Production Planted Harvested Yield Production
Acres Acres Pounds Pounds Acres Acres Pounds Pounds
Toole 1,400 1,400 890 1,250,000 -- -- -- -- Other 2,600 2,500 1,240 3,090,000 2,200 1,900 610 1,150,000 NORTH CENTRAL 4,000 3,900 1,110 4,340,000 2,200 1,900 610 1,150,000
Sheridan 3,600 3,600 900 3,250,000 -- -- -- -- Other 8,000 7,600 580 4,420,000 -- -- -- -- NORTHEAST 11,600 11,200 680 7,670,000 -- -- -- --
OTHER DISTRICTS 900 900 880 790,000 8,800 8,400 460 3,897,000
MONTANA 16,500 16,000 800 12,800,000 11,000 10,300 490 5,047,000
-- Counties with no acres planted or counties that are combined into “other” counties/districts to avoid disclosure of individua l information.
Safflower Acreage, Yield, and Production by Counties and Districts, 2010-2011 County
and District
2010 2011
Planted Harvested Yield Production Planted Harvested Yield Production
Acres Acres Pounds Pounds Acres Acres Pounds Pounds
Richland 4,200 4,100 1,110 4,570,000 4,100 4,100 800 3,300,000 Other 3,800 3,500 790 2,750,000 1,500 1,500 990 1,480,000 NORTHEAST 8,000 7,600 960 7,320,000 5,600 5,600 850 4,780,000
Other 7,600 7,600 760 5,790,000 3,900 3,900 960 3,730,000 SOUTH CENTRAL 7,600 7,600 760 5,790,000 3,900 3,900 960 3,730,000
Fallon 2,700 2,700 900 2,420,000 -- -- -- -- Other 5,200 5,100 870 4,420,000 2,400 2,350 670 1,570,000 SOUTHEAST 7,900 7,800 880 6,840,000 2,400 2,350 670 1,570,000
OTHER DISTRICTS 4,500 4,000 750 3,000,000 2,100 1,950 850 1,650,000
MONTANA 28,000 27,000 850 22,950,000 14,000 13,800 850 11,730,000
-- Counties with no acres planted or counties that are combined into “other” counties/districts to avoid disclosure of individua l information.
Potatoes Acreage, Yield, and Production by Counties and Districts, 2010-2011 County
and
District
2010 2011
Planted Harvested Yield Production Planted Harvested Yield Production
Acres Acres Cwt Cwt Acres Acres Cwt Cwt
Lake -- -- -- -- 2,100 2,000 322 643,000
Other -- -- -- -- 800 800 296 237,000 NORTHWEST -- -- -- -- 2,900 2,800 314 880,000
Beaverhead 1,000 1,000 330 330,000 -- -- -- -- Gallatin 3,800 3,800 344 1,306,000 3,900 3,800 337 1,282,000 Madison 1,200 1,100 317 349,000 -- -- -- -- Other -- -- -- -- 2,200 2,200 326 718,000 SOUTHWEST 6,000 5,900 336 1,985,000 6,100 6,000 333 2,000,000
OTHER DISTRICTS 5,500 5,400 313 1,688,000 2,700 2,700 339 915,000
MONTANA 11,500 11,300 325 3,673,000 11,700 11,500 330 3,795,000
Acreage is principally irrigated. -- Counties with no acres planted or counties that are combined into “other” counties/districts to avoid disclosure of individual
information.
Sugar Beets Acreage, Yield, and Production by Counties and Districts, 2010-2011 County
And District
2010 2011
Planted Harvested Yield Production Sucrose Planted Harvested Yield Production Sucrose
Acres Acres Tons Tons Percent Acres Acres Tons Tons Percent
Dawson 1,700 1,600 25.6 41,000 18.17 2,100 2,100 28.2 53,000 17.77
Richland 12,600 12,600 27.9 351,000 17.72 12,900 12,000 24.2 290,000 17.40
Roosevelt 2,200 2,200 26.8 59,000 18.08 2,500 2,300 27.0 62,000 18.18 NORTHEAST 16,500 16,400 27.5 451,000 17.80 17,500 16,400 24.7 405,000 17.57
Big Horn 8,600 8,600 34.3 295,000 16.85 9,000 8,900 28.0 249,000 17.08
Carbon 3,200 3,200 25.9 83,000 16.45 3,600 3,600 25.6 92,000 16.62
Yellowstone 6,700 6,700 30.0 201,000 16.59 7,500 7,100 25.5 181,000 17.24
Other 3,100 3,100 29.4 91,000 16.91 3,600 3,500 26.9 94,000 17.65
SOUTH CENTRAL 21,600 21,600 31.0 670,000 16.73 23,700 23,100 26.7 616,000 17.15
Custer 1,400 1,400 28.6 40,000 17.49 -- -- -- -- --
Prairie 1,100 1,100 28.2 31,000 18.30 -- -- -- -- --
Rosebud 2,000 2,000 31.0 62,000 16.84 2,100 1,800 26.1 47,000 18.14
Other -- -- -- -- -- 1,700 1,700 25.9 44,000 17.87 SOUTHEAST 4,500 4,500 29.6 133,000 17.38 3,800 3,500 26.0 91,000 18.01
MONTANA 42,600 42,500 29.5 1,254,000 17.19 45,000 43,000 25.9 1,112,000 17.37
Acreage is all irrigated. -- Counties with no acres planted or counties that are combined into “other” counties/districts to avoid disclosure of individual information.
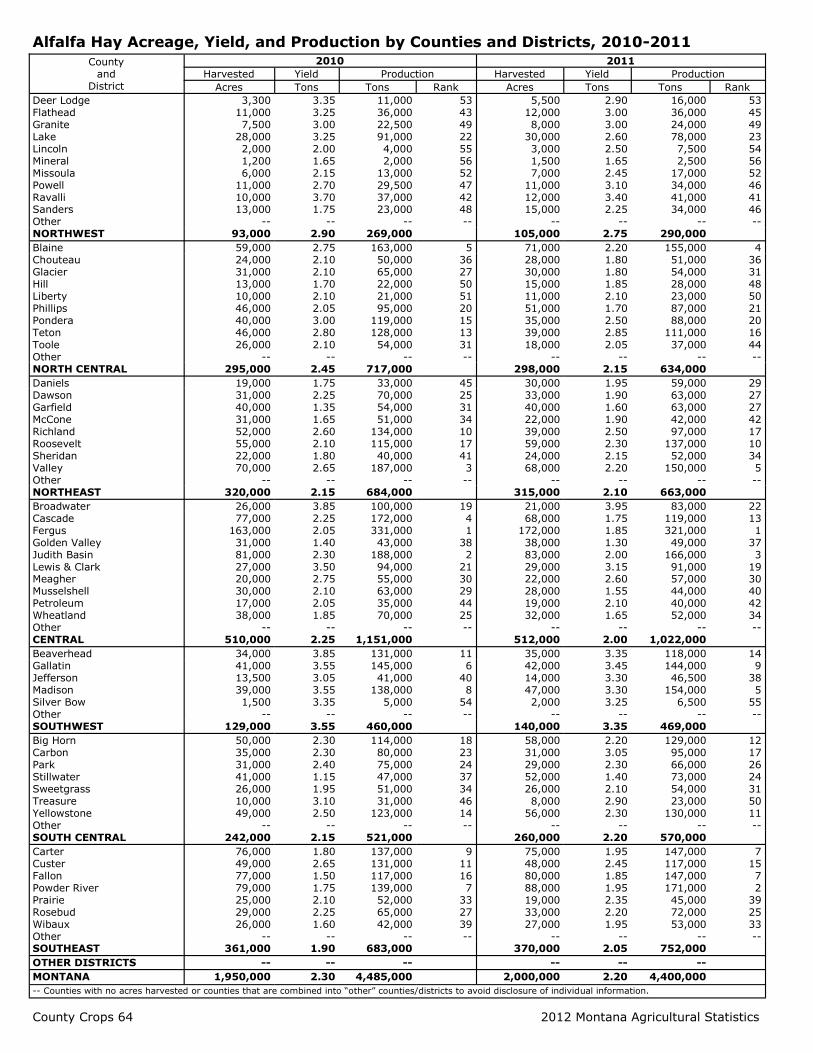
County Crops 64 2012 Montana Agricultural Statistics
Alfalfa Hay Acreage, Yield, and Production by Counties and Districts, 2010-2011
County and
District
2010 2011
Harvested Yield Production Harvested Yield Production
Acres Tons Tons Rank Acres Tons Tons Rank
Deer Lodge 3,300 3.35 11,000 53 5,500 2.90 16,000 53 Flathead 11,000 3.25 36,000 43 12,000 3.00 36,000 45 Granite 7,500 3.00 22,500 49 8,000 3.00 24,000 49 Lake 28,000 3.25 91,000 22 30,000 2.60 78,000 23 Lincoln 2,000 2.00 4,000 55 3,000 2.50 7,500 54 Mineral 1,200 1.65 2,000 56 1,500 1.65 2,500 56 Missoula 6,000 2.15 13,000 52 7,000 2.45 17,000 52 Powell 11,000 2.70 29,500 47 11,000 3.10 34,000 46 Ravalli 10,000 3.70 37,000 42 12,000 3.40 41,000 41 Sanders 13,000 1.75 23,000 48 15,000 2.25 34,000 46 Other -- -- -- -- -- -- -- -- NORTHWEST 93,000 2.90 269,000 105,000 2.75 290,000
Blaine 59,000 2.75 163,000 5 71,000 2.20 155,000 4 Chouteau 24,000 2.10 50,000 36 28,000 1.80 51,000 36 Glacier 31,000 2.10 65,000 27 30,000 1.80 54,000 31 Hill 13,000 1.70 22,000 50 15,000 1.85 28,000 48 Liberty 10,000 2.10 21,000 51 11,000 2.10 23,000 50 Phillips 46,000 2.05 95,000 20 51,000 1.70 87,000 21 Pondera 40,000 3.00 119,000 15 35,000 2.50 88,000 20 Teton 46,000 2.80 128,000 13 39,000 2.85 111,000 16 Toole 26,000 2.10 54,000 31 18,000 2.05 37,000 44 Other -- -- -- -- -- -- -- -- NORTH CENTRAL 295,000 2.45 717,000 298,000 2.15 634,000
Daniels 19,000 1.75 33,000 45 30,000 1.95 59,000 29 Dawson 31,000 2.25 70,000 25 33,000 1.90 63,000 27 Garfield 40,000 1.35 54,000 31 40,000 1.60 63,000 27 McCone 31,000 1.65 51,000 34 22,000 1.90 42,000 42 Richland 52,000 2.60 134,000 10 39,000 2.50 97,000 17 Roosevelt 55,000 2.10 115,000 17 59,000 2.30 137,000 10 Sheridan 22,000 1.80 40,000 41 24,000 2.15 52,000 34 Valley 70,000 2.65 187,000 3 68,000 2.20 150,000 5 Other -- -- -- -- -- -- -- -- NORTHEAST 320,000 2.15 684,000 315,000 2.10 663,000
Broadwater 26,000 3.85 100,000 19 21,000 3.95 83,000 22 Cascade 77,000 2.25 172,000 4 68,000 1.75 119,000 13 Fergus 163,000 2.05 331,000 1 172,000 1.85 321,000 1 Golden Valley 31,000 1.40 43,000 38 38,000 1.30 49,000 37 Judith Basin 81,000 2.30 188,000 2 83,000 2.00 166,000 3 Lewis & Clark 27,000 3.50 94,000 21 29,000 3.15 91,000 19 Meagher 20,000 2.75 55,000 30 22,000 2.60 57,000 30 Musselshell 30,000 2.10 63,000 29 28,000 1.55 44,000 40 Petroleum 17,000 2.05 35,000 44 19,000 2.10 40,000 42 Wheatland 38,000 1.85 70,000 25 32,000 1.65 52,000 34 Other -- -- -- -- -- -- -- -- CENTRAL 510,000 2.25 1,151,000 512,000 2.00 1,022,000
Beaverhead 34,000 3.85 131,000 11 35,000 3.35 118,000 14 Gallatin 41,000 3.55 145,000 6 42,000 3.45 144,000 9 Jefferson 13,500 3.05 41,000 40 14,000 3.30 46,500 38 Madison 39,000 3.55 138,000 8 47,000 3.30 154,000 5 Silver Bow 1,500 3.35 5,000 54 2,000 3.25 6,500 55 Other -- -- -- -- -- -- -- -- SOUTHWEST 129,000 3.55 460,000 140,000 3.35 469,000
Big Horn 50,000 2.30 114,000 18 58,000 2.20 129,000 12 Carbon 35,000 2.30 80,000 23 31,000 3.05 95,000 17 Park 31,000 2.40 75,000 24 29,000 2.30 66,000 26 Stillwater 41,000 1.15 47,000 37 52,000 1.40 73,000 24 Sweetgrass 26,000 1.95 51,000 34 26,000 2.10 54,000 31 Treasure 10,000 3.10 31,000 46 8,000 2.90 23,000 50 Yellowstone 49,000 2.50 123,000 14 56,000 2.30 130,000 11 Other -- -- -- -- -- -- -- -- SOUTH CENTRAL 242,000 2.15 521,000 260,000 2.20 570,000
Carter 76,000 1.80 137,000 9 75,000 1.95 147,000 7 Custer 49,000 2.65 131,000 11 48,000 2.45 117,000 15 Fallon 77,000 1.50 117,000 16 80,000 1.85 147,000 7 Powder River 79,000 1.75 139,000 7 88,000 1.95 171,000 2 Prairie 25,000 2.10 52,000 33 19,000 2.35 45,000 39 Rosebud 29,000 2.25 65,000 27 33,000 2.20 72,000 25 Wibaux 26,000 1.60 42,000 39 27,000 1.95 53,000 33 Other -- -- -- -- -- -- -- -- SOUTHEAST 361,000 1.90 683,000 370,000 2.05 752,000
OTHER DISTRICTS -- -- -- -- -- --
MONTANA 1,950,000 2.30 4,485,000 2,000,000 2.20 4,400,000
-- Counties with no acres harvested or counties that are combined into “other” counties/districts to avoid disclosure of individual information.
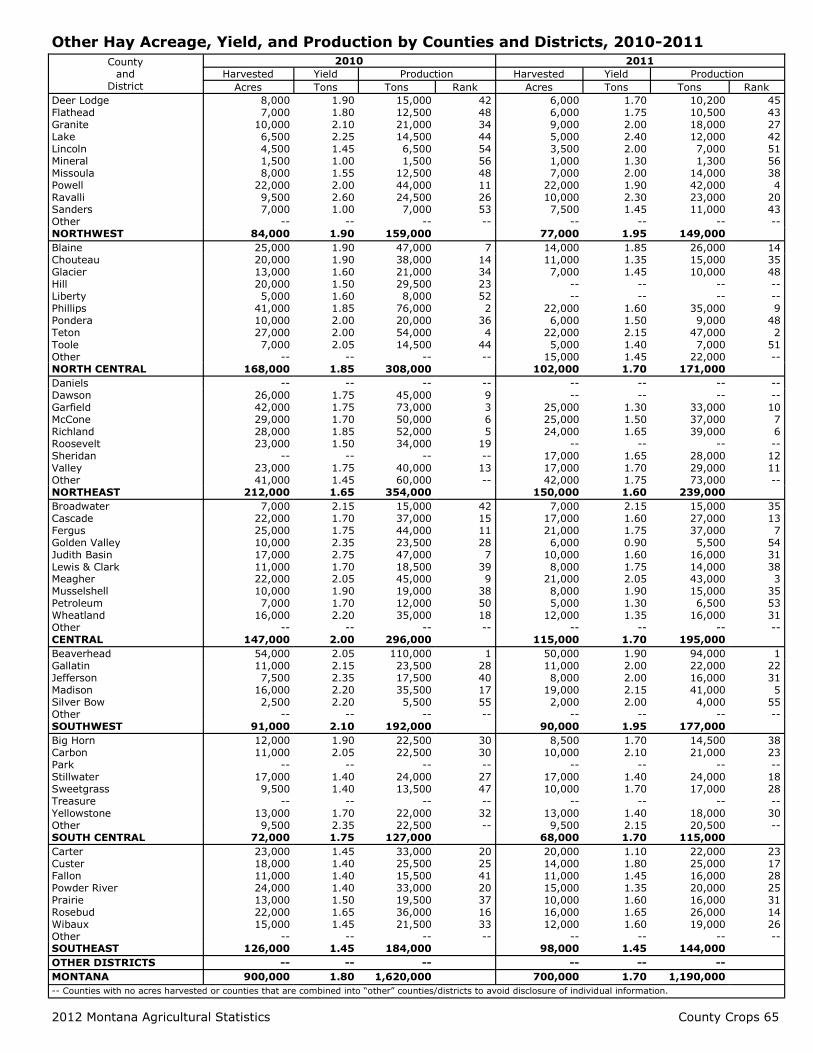
2012 Montana Agricultural Statistics County Crops 65
Other Hay Acreage, Yield, and Production by Counties and Districts, 2010-2011
County and
District
2010 2011
Harvested Yield Production Harvested Yield Production
Acres Tons Tons Rank Acres Tons Tons Rank
Deer Lodge 8,000 1.90 15,000 42 6,000 1.70 10,200 45 Flathead 7,000 1.80 12,500 48 6,000 1.75 10,500 43 Granite 10,000 2.10 21,000 34 9,000 2.00 18,000 27 Lake 6,500 2.25 14,500 44 5,000 2.40 12,000 42 Lincoln 4,500 1.45 6,500 54 3,500 2.00 7,000 51 Mineral 1,500 1.00 1,500 56 1,000 1.30 1,300 56 Missoula 8,000 1.55 12,500 48 7,000 2.00 14,000 38 Powell 22,000 2.00 44,000 11 22,000 1.90 42,000 4 Ravalli 9,500 2.60 24,500 26 10,000 2.30 23,000 20 Sanders 7,000 1.00 7,000 53 7,500 1.45 11,000 43 Other -- -- -- -- -- -- -- -- NORTHWEST 84,000 1.90 159,000 77,000 1.95 149,000
Blaine 25,000 1.90 47,000 7 14,000 1.85 26,000 14 Chouteau 20,000 1.90 38,000 14 11,000 1.35 15,000 35 Glacier 13,000 1.60 21,000 34 7,000 1.45 10,000 48 Hill 20,000 1.50 29,500 23 -- -- -- -- Liberty 5,000 1.60 8,000 52 -- -- -- -- Phillips 41,000 1.85 76,000 2 22,000 1.60 35,000 9 Pondera 10,000 2.00 20,000 36 6,000 1.50 9,000 48 Teton 27,000 2.00 54,000 4 22,000 2.15 47,000 2 Toole 7,000 2.05 14,500 44 5,000 1.40 7,000 51 Other -- -- -- -- 15,000 1.45 22,000 -- NORTH CENTRAL 168,000 1.85 308,000 102,000 1.70 171,000
Daniels -- -- -- -- -- -- -- -- Dawson 26,000 1.75 45,000 9 -- -- -- -- Garfield 42,000 1.75 73,000 3 25,000 1.30 33,000 10 McCone 29,000 1.70 50,000 6 25,000 1.50 37,000 7 Richland 28,000 1.85 52,000 5 24,000 1.65 39,000 6 Roosevelt 23,000 1.50 34,000 19 -- -- -- -- Sheridan -- -- -- -- 17,000 1.65 28,000 12 Valley 23,000 1.75 40,000 13 17,000 1.70 29,000 11 Other 41,000 1.45 60,000 -- 42,000 1.75 73,000 -- NORTHEAST 212,000 1.65 354,000 150,000 1.60 239,000
Broadwater 7,000 2.15 15,000 42 7,000 2.15 15,000 35 Cascade 22,000 1.70 37,000 15 17,000 1.60 27,000 13 Fergus 25,000 1.75 44,000 11 21,000 1.75 37,000 7 Golden Valley 10,000 2.35 23,500 28 6,000 0.90 5,500 54 Judith Basin 17,000 2.75 47,000 7 10,000 1.60 16,000 31 Lewis & Clark 11,000 1.70 18,500 39 8,000 1.75 14,000 38 Meagher 22,000 2.05 45,000 9 21,000 2.05 43,000 3 Musselshell 10,000 1.90 19,000 38 8,000 1.90 15,000 35 Petroleum 7,000 1.70 12,000 50 5,000 1.30 6,500 53 Wheatland 16,000 2.20 35,000 18 12,000 1.35 16,000 31 Other -- -- -- -- -- -- -- -- CENTRAL 147,000 2.00 296,000 115,000 1.70 195,000
Beaverhead 54,000 2.05 110,000 1 50,000 1.90 94,000 1 Gallatin 11,000 2.15 23,500 28 11,000 2.00 22,000 22 Jefferson 7,500 2.35 17,500 40 8,000 2.00 16,000 31 Madison 16,000 2.20 35,500 17 19,000 2.15 41,000 5 Silver Bow 2,500 2.20 5,500 55 2,000 2.00 4,000 55 Other -- -- -- -- -- -- -- -- SOUTHWEST 91,000 2.10 192,000 90,000 1.95 177,000
Big Horn 12,000 1.90 22,500 30 8,500 1.70 14,500 38 Carbon 11,000 2.05 22,500 30 10,000 2.10 21,000 23 Park -- -- -- -- -- -- -- -- Stillwater 17,000 1.40 24,000 27 17,000 1.40 24,000 18 Sweetgrass 9,500 1.40 13,500 47 10,000 1.70 17,000 28 Treasure -- -- -- -- -- -- -- -- Yellowstone 13,000 1.70 22,000 32 13,000 1.40 18,000 30 Other 9,500 2.35 22,500 -- 9,500 2.15 20,500 -- SOUTH CENTRAL 72,000 1.75 127,000 68,000 1.70 115,000
Carter 23,000 1.45 33,000 20 20,000 1.10 22,000 23 Custer 18,000 1.40 25,500 25 14,000 1.80 25,000 17 Fallon 11,000 1.40 15,500 41 11,000 1.45 16,000 28 Powder River 24,000 1.40 33,000 20 15,000 1.35 20,000 25 Prairie 13,000 1.50 19,500 37 10,000 1.60 16,000 31 Rosebud 22,000 1.65 36,000 16 16,000 1.65 26,000 14 Wibaux 15,000 1.45 21,500 33 12,000 1.60 19,000 26 Other -- -- -- -- -- -- -- -- SOUTHEAST 126,000 1.45 184,000 98,000 1.45 144,000
OTHER DISTRICTS -- -- -- -- -- --
MONTANA 900,000 1.80 1,620,000 700,000 1.70 1,190,000
-- Counties with no acres harvested or counties that are combined into “other” counties/districts to avoid disclosure of individual information.
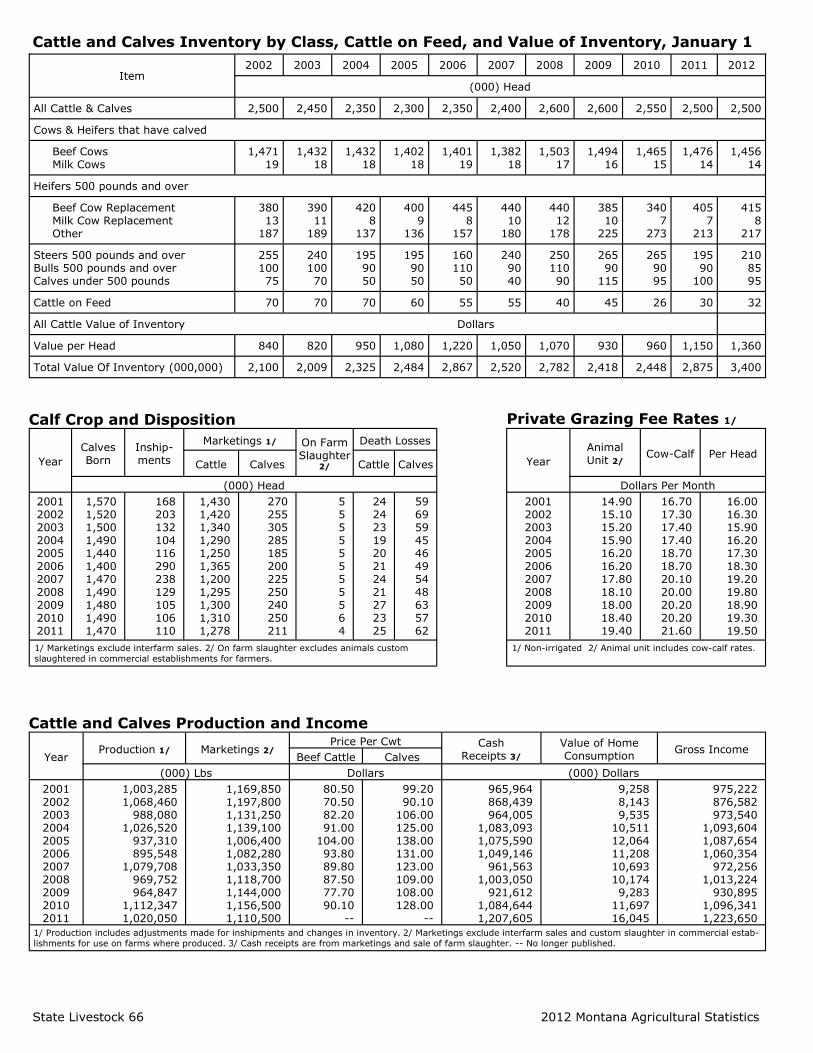
State Livestock 66 2012 Montana Agricultural Statistics
Cattle and Calves Inventory by Class, Cattle on Feed, and Value of Inventory, January 1
Item 2003 2004 2005 2006 2007 2008 2009 2010 2011 2012 2002
(000) Head
All Cattle & Calves 2,450 2,350 2,300 2,350 2,400 2,600 2,600 2,550 2,500 2,500 2,500
Cows & Heifers that have calved
Beef Cows Milk Cows
1,432 18
1,432 18
1,402 18
1,401 19
1,382 18
1,503 17
1,494 16
1,465 15
1,476 14
1,456 14
1,471 19
Heifers 500 pounds and over
Beef Cow Replacement Milk Cow Replacement Other
390 11
189
420 8
137
400 9
136
445 8
157
440 10
180
440 12
178
385 10
225
340 7
273
405 7
213
415 8
217
380 13
187
Steers 500 pounds and over Bulls 500 pounds and over Calves under 500 pounds
240 100 70
195 90 50
195 90 50
160 110 50
240 90 40
250 110 90
265 90
115
265 90 95
195 90
100
210 85 95
255 100 75
Cattle on Feed 70 70 60 55 55 40 45 26 30 32 70
All Cattle Value of Inventory Dollars
Value per Head 820 950 1,080 1,220 1,050 1,070 930 960 1,150 1,360 840
Total Value Of Inventory (000,000) 2,009 2,325 2,484 2,867 2,520 2,782 2,418 2,448 2,875 3,400 2,100
Calf Crop and Disposition
Private Grazing Fee Rates 1/
Year
Calves Born
Inship-ments
Marketings 1/ On Farm Slaughter
2/
Death Losses
Year
Animal Unit 2/
Cow-Calf Per Head Cattle Calves Cattle Calves
(000) Head Dollars Per Month
2001 2002 2003 2004 2005 2006 2007 2008 2009 2010 2011
1,570 1,520 1,500 1,490 1,440 1,400 1,470 1,490 1,480 1,490 1,470
168 203 132 104 116 290 238 129 105 106 110
1,430 1,420 1,340 1,290 1,250 1,365 1,200 1,295 1,300 1,310 1,278
270 255 305 285 185 200 225 250 240 250 211
5 5 5 5 5 5 5 5 5 6 4
24 24 23 19 20 21 24 21 27 23 25
59 69 59 45 46 49 54 48 63 57 62
2001 2002 2003 2004 2005 2006 2007 2008 2009 2010 2011
14.90 15.10 15.20 15.90 16.20 16.20 17.80 18.10 18.00 18.40 19.40
16.70 17.30 17.40 17.40 18.70 18.70 20.10 20.00 20.20 20.20 21.60
16.00 16.30 15.90 16.20 17.30 18.30 19.20 19.80 18.90 19.30 19.50
1/ Marketings exclude interfarm sales. 2/ On farm slaughter excludes animals custom
slaughtered in commercial establishments for farmers.
1/ Non-irrigated 2/ Animal unit includes cow-calf rates.
Cattle and Calves Production and Income
Year Production 1/ Marketings 2/
Price Per Cwt Cash Receipts 3/
Value of Home Consumption
Gross Income Beef Cattle Calves
(000) Lbs Dollars (000) Dollars
2001 2002 2003 2004 2005 2006 2007 2008 2009 2010 2011
1,003,285
1,068,460
988,080
1,026,520
937,310
895,548
1,079,708
969,752
964,847
1,112,347 1,020,050
1,169,850
1,197,800
1,131,250
1,139,100
1,006,400
1,082,280
1,033,350
1,118,700
1,144,000
1,156,500 1,110,500
80.50
70.50
82.20
91.00
104.00
93.80
89.80
87.50
77.70
90.10 --
99.20
90.10
106.00
125.00
138.00
131.00
123.00
109.00
108.00
128.00 --
965,964
868,439
964,005
1,083,093
1,075,590
1,049,146
961,563
1,003,050
921,612
1,084,644 1,207,605
9,258
8,143
9,535
10,511
12,064
11,208
10,693
10,174
9,283
11,697 16,045
975,222
876,582
973,540
1,093,604
1,087,654
1,060,354
972,256
1,013,224
930,895
1,096,341 1,223,650
1/ Production includes adjustments made for inshipments and changes in inventory. 2/ Marketings exclude interfarm sales and custom slaughter in commercial estab-
lishments for use on farms where produced. 3/ Cash receipts are from marketings and sale of farm slaughter. -- No longer published.
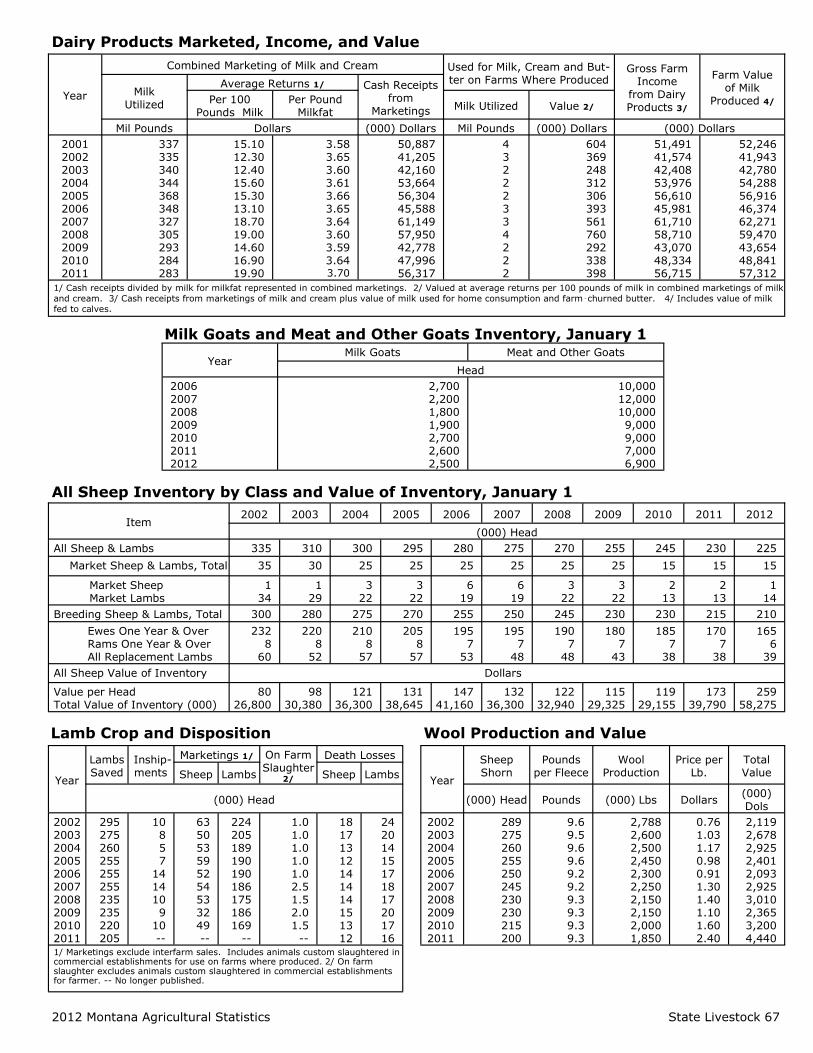
Dairy Products Marketed, Income, and Value
Year
Combined Marketing of Milk and Cream Used for Milk, Cream and But-ter on Farms Where Produced
Gross Farm Income
from Dairy Products 3/
Farm Value of Milk
Produced 4/ Milk
Utilized
Average Returns 1/ Cash Receipts from
Marketings Per 100
Pounds Milk
Per Pound Milkfat
Milk Utilized Value 2/
Mil Pounds Dollars (000) Dollars Mil Pounds (000) Dollars (000) Dollars
2001 2002 2003 2004 2005 2006 2007 2008 2009 2010 2011
337 335 340 344 368 348 327 305 293 284 283
15.10 12.30 12.40 15.60 15.30 13.10 18.70 19.00 14.60 16.90 19.90
3.58 3.65 3.60 3.61 3.66 3.65 3.64 3.60 3.59 3.64 3.70
50,887 41,205 42,160 53,664 56,304 45,588 61,149 57,950 42,778 47,996 56,317
4 3 2 2 2 3 3 4 2 2 2
604 369 248 312 306 393 561 760 292 338 398
51,491 41,574 42,408 53,976 56,610 45,981 61,710 58,710 43,070 48,334 56,715
52,246 41,943 42,780 54,288 56,916 46,374 62,271 59,470 43,654 48,841 57,312
1/ Cash receipts divided by milk for milkfat represented in combined marketings. 2/ Valued at average returns per 100 pounds of milk in combined marketings of milk
and cream. 3/ Cash receipts from marketings of milk and cream plus value of milk used for home consumption and farm‑churned butter. 4/ Includes value of milk
fed to calves.
Milk Goats and Meat and Other Goats Inventory, January 1
Year Milk Goats Meat and Other Goats Head
2006 2007 2008 2009 2010 2011 2012
2,700 2,200 1,800 1,900 2,700 2,600 2,500
10,000 12,000 10,000 9,000 9,000 7,000 6,900
All Sheep Inventory by Class and Value of Inventory, January 1
Item 2003 2004 2005 2006 2007 2008 2009 2010 2011 2012 2002
(000) Head
All Sheep & Lambs 310 300 295 280 275 270 255 245 230 225 335
Market Sheep & Lambs, Total 30 25 25 25 25 25 25 15 15 15 35
Market Sheep Market Lambs
1
29 3
22 3
22 6
19 6
19 3
22 3
22 2
13 2
13 1
14 1
34
Breeding Sheep & Lambs, Total 280 275 270 255 250 245 230 230 215 210 300
Ewes One Year & Over Rams One Year & Over All Replacement Lambs
220
8
52
210
8
57
205
8
57
195
7
53
195
7
48
190
7
48
180
7
43
185
7
38
170
7
38
165 6
39
232 8
60
All Sheep Value of Inventory Dollars
Value per Head Total Value of Inventory (000)
98
30,380 121
36,300 131
38,645 147
41,160 132
36,300 122
32,940 115
29,325 119
29,155 173
39,790 259
58,275 80
26,800
Lamb Crop and Disposition
Wool Production and Value
Year
Lambs Saved
Inship-ments
Marketings 1/ On Farm Slaughter
2/
Death Losses
Year
Sheep Shorn
Pounds per Fleece
Wool Production
Price per Lb.
Total Value Sheep Lambs Sheep Lambs
(000) Head (000) Head Pounds (000) Lbs Dollars (000) Dols
2002
2003
2004
2005
2006
2007
2008
2009
2010 2011
295
275
260
255
255
255
235
235
220 205
10
8
5
7
14
14
10
9
10 --
63
50
53
59
52
54
53
32
49 --
224
205
189
190
190
186
175
186
169 --
1.0
1.0
1.0
1.0
1.0
2.5
1.5
2.0
1.5 --
18
17
13
12
14
14
14
15
13 12
24
20
14
15
17
18
17
20
17 16
2002 2003 2004 2005 2006 2007 2008 2009 2010 2011
289 275 260 255 250 245 230 230 215 200
9.6 9.5 9.6 9.6 9.2 9.2 9.3 9.3 9.3 9.3
2,788 2,600 2,500 2,450 2,300 2,250 2,150 2,150 2,000 1,850
0.76 1.03 1.17 0.98 0.91 1.30 1.40 1.10 1.60 2.40
2,119 2,678 2,925 2,401 2,093 2,925 3,010 2,365 3,200 4,440
1/ Marketings exclude interfarm sales. Includes animals custom slaughtered in commercial establishments for use on farms where produced. 2/ On farm slaughter excludes animals custom slaughtered in commercial establishments for farmer. -- No longer published.
2012 Montana Agricultural Statistics State Livestock 67
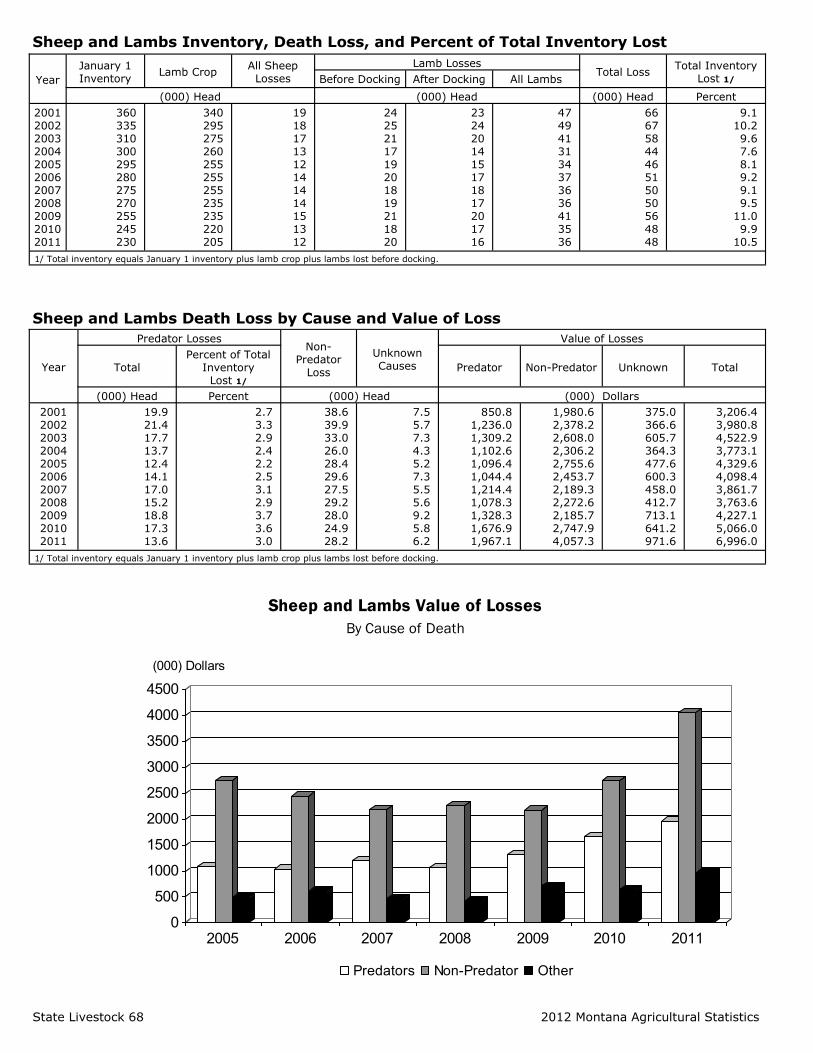
State Livestock 68 2012 Montana Agricultural Statistics
Sheep and Lambs Inventory, Death Loss, and Percent of Total Inventory Lost
Year
January 1 Inventory
Lamb Crop All Sheep Losses
Lamb Losses Total Loss
Total Inventory Lost 1/ Before Docking After Docking All Lambs
(000) Head (000) Head (000) Head Percent
2001 2002 2003 2004 2005 2006 2007 2008 2009 2010 2011
360
335
310
300
295
280
275
270
255
245 230
340
295
275
260
255
255
255
235
235
220 205
19
18
17
13
12
14
14
14
15
13 12
24
25
21
17
19
20
18
19
21
18 20
23
24
20
14
15
17
18
17
20
17 16
47
49
41
31
34
37
36
36
41
35 36
66
67
58
44
46
51
50
50
56
48 48
9.1
10.2
9.6
7.6
8.1
9.2
9.1
9.5
11.0
9.9 10.5
1/ Total inventory equals January 1 inventory plus lamb crop plus lambs lost before docking.
Sheep and Lambs Death Loss by Cause and Value of Loss
Year
Predator Losses Non-
Predator Loss
Unknown Causes
Value of Losses
Total Percent of Total
Inventory Lost 1/
Predator Non-Predator Unknown Total
(000) Head Percent (000) Head (000) Dollars
2001
2002
2003
2004
2005
2006
2007
2008
2009
2010 2011
19.9
21.4
17.7
13.7
12.4
14.1
17.0
15.2
18.8
17.3 13.6
2.7
3.3
2.9
2.4
2.2
2.5
3.1
2.9
3.7
3.6 3.0
38.6
39.9
33.0
26.0
28.4
29.6
27.5
29.2
28.0
24.9 28.2
7.5
5.7
7.3
4.3
5.2
7.3
5.5
5.6
9.2
5.8 6.2
850.8
1,236.0
1,309.2
1,102.6
1,096.4
1,044.4
1,214.4
1,078.3
1,328.3
1,676.9 1,967.1
1,980.6
2,378.2
2,608.0
2,306.2
2,755.6
2,453.7
2,189.3
2,272.6
2,185.7
2,747.9 4,057.3
375.0
366.6
605.7
364.3
477.6
600.3
458.0
412.7
713.1
641.2 971.6
3,206.4
3,980.8
4,522.9
3,773.1
4,329.6
4,098.4
3,861.7
3,763.6
4,227.1
5,066.0 6,996.0
1/ Total inventory equals January 1 inventory plus lamb crop plus lambs lost before docking.
0
500
1000
1500
2000
2500
3000
3500
4000
4500
(000) Dollars
2005 2006 2007 2008 2009 2010 2011
Sheep and Lambs Value of Losses
By Cause of Death
Predators Non-Predator Other

2012 Montana Agricultural Statistics State Livestock 69
Sheep and Lambs Death Loss by Cause and Value of Loss
Cause of Loss
SHEEP LOSS LAMB LOSS TOTAL LOSS
Number of Head Value in Dollars
(000) 1/ Number of Head
Value in Dollars (000) 2/
Number of Head Value in Dollars (000)
2010 2011 2010 2011 2010 2011 2010 2011 2010 2011 2010 2011
Predators
Bear
Bobcat
Coyote
Dog
Eagle
Fox
Mountain Lion
Wolf
Other Animals
Unknown Predators
Total Predators
300
--
1,800
300
--
--
200
200
--
200
3,000
400
--
2,500
--
100
-- 100
100
--
100
3,300
51.0
--
306.0
51.0
--
-- 34.0
34.0
--
34.0
510.0
103.6
--
647.5
--
25.9
-- 25.9
25.9
--
25.9
854.7
600
--
9,900
600
800
1,300 300
400
--
400
14,300
300
--
7,300
300
900
700 200
100
200
300
10,300
49.0
--
807.8
49.0
65.3
106.1 24.5
32.6
--
32.6
1,166.9
32.4
--
788.4
32.4
97.2
75.6 21.6
10.8
21.6
32.4
1,112.4
900
--
11,700
900
800
1,300 500
600
--
600
17,300
700
--
9,800
300
1,000
700 300
200
200
400
13,600
100.0
--
1,113.8
100.0
65.3
106.1 58.5
66.6
--
66.6
1,676.9
136.0
--
1,435.9
32.4
123.1
75.6 47.5
36.7
21.6
58.3
1,967.1
Non-Predators
Total Diseases
Lambing Complications
Old Age
On Back
Poison
Theft Weather Conditions
Other
Total Non-Predators
1,400
1,200
2,900
400
400
200 1,200
400
8,100
1,300
900
2,100
300
300
100 1,300
400
6,700
238.0
204.0
493.0
68.0
68.0
34.0
204.0
68.0
1,377.0
336.7
233.1
543.9
77.7
77.7
25.9 336.7
103.6
1,735.3
3,400
4,300
--
--
300
300 7,400
1,100
16,800
3,800
3,600
--
100
300
300 11,800
1,600
21,500
277.4
350.9
--
--
24.5
24.5 603.8
89.8
1,370.9
410.4
388.8
--
10.8
32.4
32.4 1,274.4
172.8
2,322.0
4,800
5,500
2,900
400
700
500 8,600
1,500
24,900
5,100
4,500
2,100
400
600
400 13,100
2,000
28,200
515.4
554.9
493.0
68.0
92.5
58.5 807.8
157.8
2,747.9
747.1
621.9
543.9
88.5
110.1
58.3 1,611.1
276.4
4,057.3
Unknown Causes 1,900 2,000 323.0 518.0 3,900 4,200 318.2 453.6 5,800 6,200 641.2 971.6
Total Loss 13,000 12,000 2,210.0 3,108.0 35,000 36,000 2,856.0 3,888.0 48,000 48,000 5,066.0 6,996.0
1/ Using average reported value for Ewes 1+. 2/ Lamb values equal to market year average price received for lambs multiplied by an average weight of
60 pounds per lamb. -- Denotes less than 100 head.
Sheep and Lambs Percent of Loss by Cause Cause of Loss 2001 2002 2003 2004 2005 2006 2007 2008 2009 2010 2011
Predators
Bear
Bobcat
Coyote
Dog
Eagle
Fox
Mountain Lion
Wolf
Other Animals
Unknown Predators
Total Predators 1/
1
--
22
2
2
1
1
--
--
2
30
1
--
21
1
2
2
1
1
--
2
31
1
--
20
2
2
2
1
1
--
2
30
2
--
21
2
2
2
1
1
--
1
31
1
--
19
1
2
2
--
1
--
1
27
1
--
20
1
2
1
1
1
--
1
28
1
--
23
2
2
2
1
1
--
2
34
2
--
20
1
2
3
1
1
--
1
30
1
--
26
1
1
2
1
1
--
1
34
2
--
25
2
2
3
1
1
--
1
36
2
--
20
1
2
2 1
--
--
1
28
Non-Predators
Digestive
Internal Parasites
Respiratory
Metabolic
Other Diseases
2/
2/
2/
2/
2/
2/
2/
2/
2/
2/
2/
2/
2/
2/
2/
7
2/
10
2
3
2/
2/
2/
2/
2/
2/
2/
2/
2/
2/
2/
2/
2/
2/
2/
2/
2/
2/
2/
2/
1
1
4
1
3
2/
2/
2/
2/
2/
2/
2/ 2/
2/
2/
Total Diseases 16 12 14 22 17 13 16 11 10 10 11
Lambing Complications
Old Age
On Back
Poison
Theft
Weather Conditions
Other
Total Non-Predators 1/
11
8
1
2
1
13
7
58
12
4
1
2
1
20
7
60
15
6
2
2
3
11
5
57
11
8
1
2
--
12
3
59
13
7
2
3
1
15
5
62
13
6
1
3
1
18
3
58
13
6
1
2
1
14
2
55
11
7
1
2
1
23
3
58
8
5
1
1
--
24
2
50
11
6
1
1
1
18
3
51
9
4
1
1
1
27
4
59
Unknown Causes 12 9 13 10 11 14 11 11 16 12 13
Total Loss 1/ 100 100 100 100 100 100 100 100 100 100 100
1/ Totals may not add due to rounding. 2/ Not available. -- Denotes less than 1 percent.
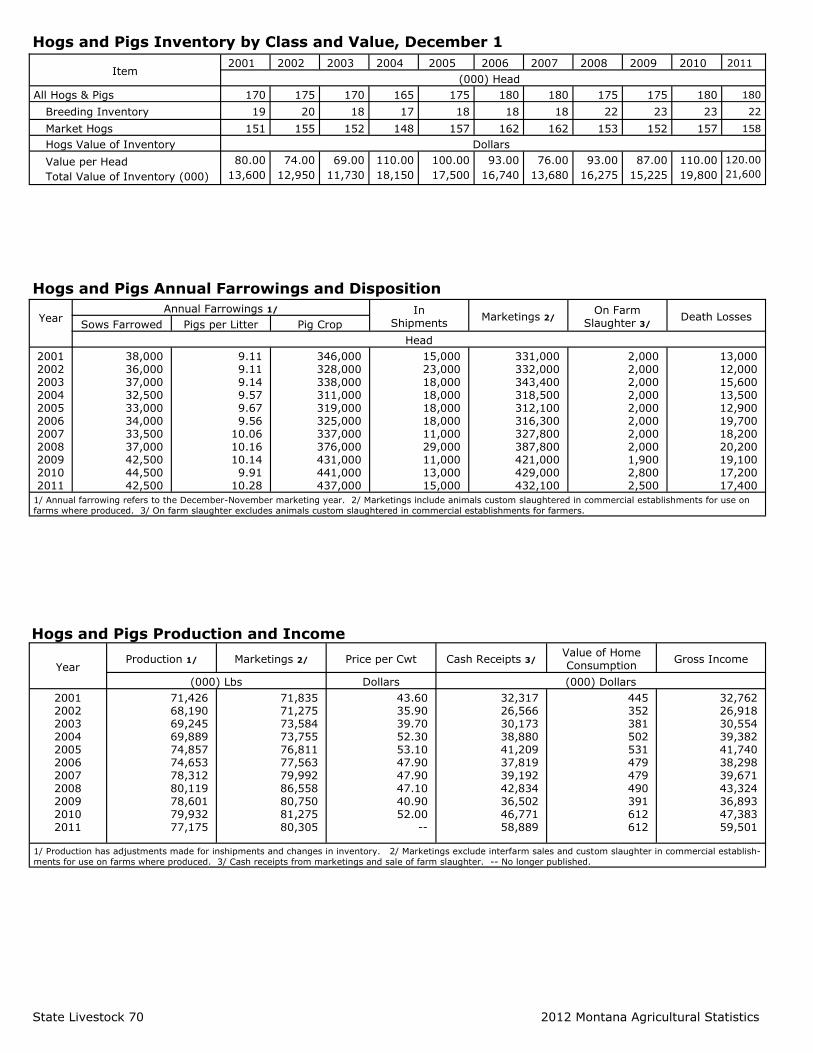
State Livestock 70 2012 Montana Agricultural Statistics
Hogs and Pigs Inventory by Class and Value, December 1
Item 2001 2002 2003 2004 2005 2006 2007 2008 2009 2010 2011
(000) Head
All Hogs & Pigs 170 175 170 165 175 180 180 175 175 180 180
Breeding Inventory 19 20 18 17 18 18 18 22 23 23 22
Market Hogs 151 155 152 148 157 162 162 153 152 157 158
Hogs Value of Inventory Dollars
Value per Head Total Value of Inventory (000)
80.00 13,600
74.00 12,950
69.00 11,730
110.00 18,150
100.00 17,500
93.00 16,740
76.00 13,680
93.00 16,275
87.00 15,225
110.00 19,800
120.00
21,600
Hogs and Pigs Annual Farrowings and Disposition
Year
Annual Farrowings 1/ In Shipments
Marketings 2/ On Farm
Slaughter 3/ Death Losses
Sows Farrowed Pigs per Litter Pig Crop
Head
2001 2002 2003 2004 2005 2006 2007 2008 2009 2010 2011
38,000
36,000
37,000
32,500
33,000
34,000
33,500
37,000
42,500
44,500 42,500
9.11
9.11
9.14
9.57
9.67
9.56
10.06
10.16
10.14
9.91 10.28
346,000
328,000
338,000
311,000
319,000
325,000
337,000
376,000
431,000
441,000 437,000
15,000
23,000
18,000
18,000
18,000
18,000
11,000
29,000
11,000
13,000 15,000
331,000
332,000
343,400
318,500
312,100
316,300
327,800
387,800
421,000
429,000 432,100
2,000
2,000
2,000
2,000
2,000
2,000
2,000
2,000
1,900
2,800 2,500
13,000
12,000
15,600
13,500
12,900
19,700
18,200
20,200
19,100
17,200 17,400
1/ Annual farrowing refers to the December-November marketing year. 2/ Marketings include animals custom slaughtered in commercial establishments for use on
farms where produced. 3/ On farm slaughter excludes animals custom slaughtered in commercial establishments for farmers.
Hogs and Pigs Production and Income
Year Production 1/ Marketings 2/ Price per Cwt Cash Receipts 3/
Value of Home Consumption
Gross Income
(000) Lbs Dollars (000) Dollars
2001 2002 2003 2004 2005 2006 2007 2008 2009 2010 2011
71,426 68,190 69,245 69,889 74,857 74,653 78,312 80,119 78,601 79,932 77,175
71,835 71,275 73,584 73,755 76,811 77,563 79,992 86,558 80,750 81,275 80,305
43.60 35.90 39.70 52.30 53.10 47.90 47.90 47.10 40.90 52.00
--
32,317 26,566 30,173 38,880 41,209 37,819 39,192 42,834 36,502 46,771 58,889
445 352 381 502 531 479 479 490 391 612 612
32,762 26,918 30,554 39,382 41,740 38,298 39,671 43,324 36,893 47,383 59,501
1/ Production has adjustments made for inshipments and changes in inventory. 2/ Marketings exclude interfarm sales and custom slaughter in commercial establish-
ments for use on farms where produced. 3/ Cash receipts from marketings and sale of farm slaughter. -- No longer published.

2012 Montana Agricultural Statistics State Livestock 71
Chickens Inventory, Value, Production, and Income, December 1
Year All Chickens Number Sold Number Lost Value per Bird Total Value
Production Sold
Price per Pound Cash Receipts
(000) Head (000) Head (000) Head Dollars (000) Dollars (000) Pounds Cents (000) Dollars
2001 2002 2003 2004 2005 2006 2007 2008 2009 2010 2011
480 480 491 486 486 496 491 510 540 535 545
109 115 132 133 130 105 108 108 108 37 88
35 37
132 132 50 74 72 72 72 90
186
3.00 3.10 3.10 3.30 2.60 3.30 4.10 3.80 4.10 4.80 4.00
1,440 1,488 1,522 1,604 1,264 1,637 2,013 1,938 2,214 2,568 2,180
392 414 436 479 429 326 400 410 410 118 282
1.0 1.0 1.0 0.6 0.6 0.6 0.6 0.1 0.1 1/ 1/
4 4 4 3 3 2 2 -- -- -- --
1/ No longer published. -- Less than $1,000.
Eggs Production and Value
Year 1/ Layers 2/ Eggs per Layer Egg Production Price per Dozen
Value of Production
(000) Birds Number Millions Cents (000) Dollars
2001 2002 2003 2004 2005 2006 2007 2008 2009 2010 2011
321 341 355 355 350 341 355 350 351 375 375
296 305 301 302 303 305 301 324 305 317 317
95 104 107 107 106 104 107 115 107 119 119
41.0 46.0 65.0 65.7 37.4 46.5 90.4 99.8 77.3
-- --
3,246 3,987 5,796 5,862 3,300 4,031 8,059 9,567 6,890 6,619 7,569
1/ Data related to the 12 month period beginning with December 1 of the previous year through November of the
current year. 2/ Average number of layers on hand during the year. -- No longer published.
Honey Inventory, Yield, Production, Stocks, and Value
Year
Bee
Colonies Yield per
Colony Production
Producer Held
Stocks Dec. 15 Price per Pound
Value of Production
(000) Pounds (000) Pounds (000) Pounds Dollars (000) Dollars
2001
2002
2003
2004
2005
2006
2007
2008
2009
2010 2011
136
134
145
140
130
132
135
134
146
157 145
102
63
66
77
67
79
68
70
70
74 92
13,872
8,442
9,570
10,780
8,710
10,428
9,180
9,380
10,220
11,618 13,340
4,578
1,097
1,914
3,773
3,136
1,981
2,203
4,596
3,577
2,905 3,202
0.67
1.38
1.44
1.08
0.88
0.95
0.99
1.37
1.46
1.58 1.64
9,294
11,650
13,781
11,642
7,491
9,907
9,088
12,851
14,921
18,356 21,878

State Livestock 72 2012 Montana Agricultural Statistics
Commercial Red Meat Production by Month 1/, 2/
Year Jan Feb Mar Apr May June July Aug Sept Oct Nov Dec Total
Million Pounds
2002 2003 2004 2005 2006 2007 2008 2009 2010 2011 2012
1.6 1.4 1.2 1.2 1.3 1.5 1.0 1.0 1.0 0.8 0.8
1.4 1.2 1.2 1.2 1.2 1.5 1.0 0.9 0.9 0.8 0.7
1.3 1.1 1.2 1.1 1.1 1.3 0.9 0.9 0.9 0.8 0.7
1.2 1.3 1.1 1.3 1.0 1.0 1.8 1.7 1.6 1.6 1.6
1.1 1.2 1.0 1.3 1.1 1.1 1.7 1.6 1.5 1.5 1.5
1.2 1.3 1.1 1.4 1.2 1.2 1.7 1.7 1.7 1.7 1.7
1.4 1.6 1.5 1.6 1.0 1.2 1.3 1.3 1.4 1.0 1.2
1.6 1.7 1.7 1.8 1.2 1.3 1.3 1.3 1.7 1.2 1.4
1.4 1.5 1.4 1.7 1.0 1.2 1.2 1.3 1.4 1.1
--
1.6 1.4 1.4 1.6 2.0 1.7 1.6 2.2 1.8 1.8
--
1.4 1.1 1.3 1.5 1.9 1.5 1.5 2.1 1.7 1.8
--
1.7 1.2 1.4 1.6 2.1 1.6 1.6 2.3 1.7 1.8
--
16.8 16.0 15.5 17.4 16.2 16.2 16.6 18.4 17.5 16.1
--
1/ Includes slaughter in federally inspected and other slaughter plants but excludes animals slaughtered on farms. 2/ Yearly totals are based on unrounded data and
may not equal sum of parts. -- Not Available
Monthly Slaughter by Class 1/, 2/ Cattle and Calves
Year Jan Feb Mar Apr May June July Aug Sept Oct Nov Dec Total
(000) Head
2002 2003 2004 2005 2006 2007 2008 2009 2010 2011 2012
2.0
1.6
1.4
1.4
1.6
1.9
1.2
1.3
1.2
1.0 1.0
1.7
1.4
1.5
1.5
1.5
1.8
1.2
1.2
1.2
0.9 0.9
1.6
1.4
1.5
1.4
1.4
1.5
1.1
1.1
1.1
0.9 0.8
1.5
1.5
1.3
1.5
1.2
1.3
2.4
2.2
2.0
2.1 2.1
1.4
1.5
1.2
1.6
1.4
1.3
2.1
2.1
2.0
2.0 2.0
1.5
1.6
1.4
1.7
1.4
1.4
2.1
2.2
2.1
2.2 2.2
1.7
1.9
1.7
1.8
1.0
1.4
1.4
1.5
1.6
1.2 1.4
1.8
1.9
1.9
2.0
1.3
1.5
1.4
1.4
1.9
1.3 1.5
1.6
1.8
1.6
1.9
1.1
1.4
1.4
1.4
1.7
1.3 --
1.9
1.7
1.7
2.0
2.5
2.1
2.0
2.8
2.2 2.4
--
1.7
1.3
1.6
1.9
2.4
1.9
1.9
2.7
2.1 2.2
--
2.0
1.4
1.7
2.0
2.5
2.0
2.1
2.9
2.2 2.3
--
20.2
19.0
18.6
20.7
19.4
19.4
20.4
22.8
21.6 19.8
--
Sheep and Lambs
Year Jan Feb Mar Apr May June July Aug Sept Oct Nov Dec Total
(000) Head
2002 2003 2004 2005 2006 2007 2008 2009 2010 2011 2012
0.3 0.2 0.3 0.2 0.2 0.3 0.3 0.2 0.2 0.2 0.2
0.3 0.2 0.3 0.2 0.2 0.3 0.2 0.2 0.2 0.1 0.2
0.2 0.2 0.2 0.3 0.2 0.3 0.3 0.2 0.2 0.2 0.2
0.2 0.3 0.1 0.2 0.2 0.1 0.3 0.3 0.2 0.2 0.2
0.1 0.2 0.1 0.1 0.2 0.1 0.3 0.3 0.3 0.3 0.2
0.1 0.2 0.1 0.1 0.2 0.2 0.3 0.3 0.3 0.3 0.3
0.4 0.4 0.3 0.3 0.2 0.2 0.3 0.3 0.3 0.2 0.3
0.5 0.5 0.5 0.5 0.4 0.4 0.4 0.4 0.4 0.4 0.3
0.5 0.4 0.6 0.5 0.5 0.4 0.5 0.4 0.4 0.4 --
0.5 0.4 0.5 0.5 0.6 0.5 0.5 0.6 0.5 0.6
--
0.3 0.3 0.3 0.4 0.4 0.4 0.4 0.5 0.4 0.5
--
0.4 0.3 0.4 0.3 0.4 0.4 0.4 0.5 0.4 0.4
--
3.8 3.6 3.7 3.6 3.6 3.5 4.3 4.2 4.0 3.7 --
Hogs and Pigs
Year Jan Feb Mar Apr May June July Aug Sept Oct Nov Dec Total
(000) Head
2002 2003 2004 2005 2006 2007 2008 2009 2010 2011 2012
1.3 1.1 1.2 1.0 1.1 1.1 0.8 0.7 0.7 0.7 0.7
1.1 1.1 1.2 0.9 1.1 1.1 0.8 0.7 0.7 0.7 0.7
1.0 1.0 1.1 1.0 1.1 1.0 0.7 0.6 0.7 0.7 0.7
0.9 1.0 0.8 1.0 1.0 0.8 1.2 1.0 1.0 1.1 1.0
0.9 0.9 0.8 0.9 1.0 0.8 1.1 1.1 1.0 1.1 1.0
1.0 0.9 0.9 1.1 1.1 0.9 1.3 1.2 1.1 1.2 1.2
1.5 1.7 1.6 1.5 1.3 1.4 1.5 1.3 1.4 1.2 1.3
1.8 2.1 2.1 2.1 1.4 1.6 1.5 1.5 1.6 1.5 1.4
1.5 1.7 1.6 1.6 1.1 1.3 1.2 1.2 1.3 1.2
--
1.3 1.1 1.0 1.3 1.7 1.2 1.1 1.3 1.2 1.2 --
1.3 1.2 1.1 1.2 1.6 1.3 1.1 1.3 1.3 1.3 --
1.4 1.3 1.2 1.2 1.7 1.3 1.2 1.4 1.4 1.4 --
15.0 15.1 14.6 14.9 15.2 13.8 13.4 13.3 13.5 13.3
--
1/ Includes slaughter in federally inspected and other slaughter plants, but excludes animals slaughtered on farms. 2/ Yearly totals are based on unrounded data and
may not equal sum of parts. --Not Available
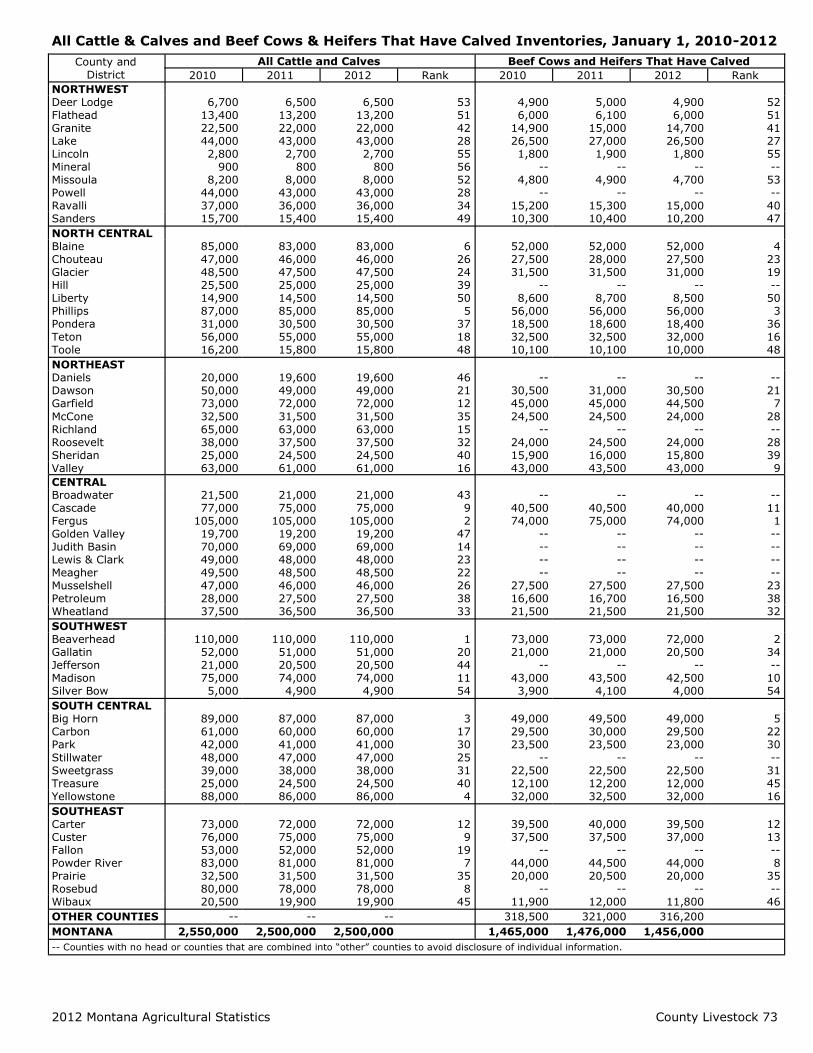
2012 Montana Agricultural Statistics County Livestock 73
All Cattle & Calves and Beef Cows & Heifers That Have Calved Inventories, January 1, 2010-2012
County and District
All Cattle and Calves Beef Cows and Heifers That Have Calved
2010 2011 2012 Rank 2010 2011 2012 Rank
NORTHWEST Deer Lodge 6,700 6,500 6,500 53 4,900 5,000 4,900 52 Flathead 13,400 13,200 13,200 51 6,000 6,100 6,000 51 Granite 22,500 22,000 22,000 42 14,900 15,000 14,700 41 Lake 44,000 43,000 43,000 28 26,500 27,000 26,500 27 Lincoln 2,800 2,700 2,700 55 1,800 1,900 1,800 55 Mineral 900 800 800 56 -- -- -- -- Missoula 8,200 8,000 8,000 52 4,800 4,900 4,700 53 Powell 44,000 43,000 43,000 28 -- -- -- -- Ravalli 37,000 36,000 36,000 34 15,200 15,300 15,000 40 Sanders 15,700 15,400 15,400 49 10,300 10,400 10,200 47
NORTH CENTRAL Blaine 85,000 83,000 83,000 6 52,000 52,000 52,000 4 Chouteau 47,000 46,000 46,000 26 27,500 28,000 27,500 23 Glacier 48,500 47,500 47,500 24 31,500 31,500 31,000 19 Hill 25,500 25,000 25,000 39 -- -- -- -- Liberty 14,900 14,500 14,500 50 8,600 8,700 8,500 50 Phillips 87,000 85,000 85,000 5 56,000 56,000 56,000 3 Pondera 31,000 30,500 30,500 37 18,500 18,600 18,400 36 Teton 56,000 55,000 55,000 18 32,500 32,500 32,000 16 Toole 16,200 15,800 15,800 48 10,100 10,100 10,000 48
NORTHEAST Daniels 20,000 19,600 19,600 46 -- -- -- -- Dawson 50,000 49,000 49,000 21 30,500 31,000 30,500 21 Garfield 73,000 72,000 72,000 12 45,000 45,000 44,500 7
McCone 32,500 31,500 31,500 35 24,500 24,500 24,000 28 Richland 65,000 63,000 63,000 15 -- -- -- -- Roosevelt 38,000 37,500 37,500 32 24,000 24,500 24,000 28 Sheridan 25,000 24,500 24,500 40 15,900 16,000 15,800 39 Valley 63,000 61,000 61,000 16 43,000 43,500 43,000 9
CENTRAL Broadwater 21,500 21,000 21,000 43 -- -- -- -- Cascade 77,000 75,000 75,000 9 40,500 40,500 40,000 11 Fergus 105,000 105,000 105,000 2 74,000 75,000 74,000 1 Golden Valley 19,700 19,200 19,200 47 -- -- -- -- Judith Basin 70,000 69,000 69,000 14 -- -- -- -- Lewis & Clark 49,000 48,000 48,000 23 -- -- -- -- Meagher 49,500 48,500 48,500 22 -- -- -- -- Musselshell 47,000 46,000 46,000 26 27,500 27,500 27,500 23 Petroleum 28,000 27,500 27,500 38 16,600 16,700 16,500 38 Wheatland 37,500 36,500 36,500 33 21,500 21,500 21,500 32
SOUTHWEST Beaverhead 110,000 110,000 110,000 1 73,000 73,000 72,000 2 Gallatin 52,000 51,000 51,000 20 21,000 21,000 20,500 34 Jefferson 21,000 20,500 20,500 44 -- -- -- -- Madison 75,000 74,000 74,000 11 43,000 43,500 42,500 10 Silver Bow 5,000 4,900 4,900 54 3,900 4,100 4,000 54
SOUTH CENTRAL Big Horn 89,000 87,000 87,000 3 49,000 49,500 49,000 5 Carbon 61,000 60,000 60,000 17 29,500 30,000 29,500 22 Park 42,000 41,000 41,000 30 23,500 23,500 23,000 30
Stillwater 48,000 47,000 47,000 25 -- -- -- -- Sweetgrass 39,000 38,000 38,000 31 22,500 22,500 22,500 31 Treasure 25,000 24,500 24,500 40 12,100 12,200 12,000 45 Yellowstone 88,000 86,000 86,000 4 32,000 32,500 32,000 16
SOUTHEAST Carter 73,000 72,000 72,000 12 39,500 40,000 39,500 12 Custer 76,000 75,000 75,000 9 37,500 37,500 37,000 13 Fallon 53,000 52,000 52,000 19 -- -- -- -- Powder River 83,000 81,000 81,000 7 44,000 44,500 44,000 8 Prairie 32,500 31,500 31,500 35 20,000 20,500 20,000 35 Rosebud 80,000 78,000 78,000 8 -- -- -- -- Wibaux 20,500 19,900 19,900 45 11,900 12,000 11,800 46
OTHER COUNTIES -- -- -- 318,500 321,000 316,200
MONTANA 2,550,000 2,500,000 2,500,000 1,465,000 1,476,000 1,456,000
-- Counties with no head or counties that are combined into “other” counties to avoid disclosure of individual information.
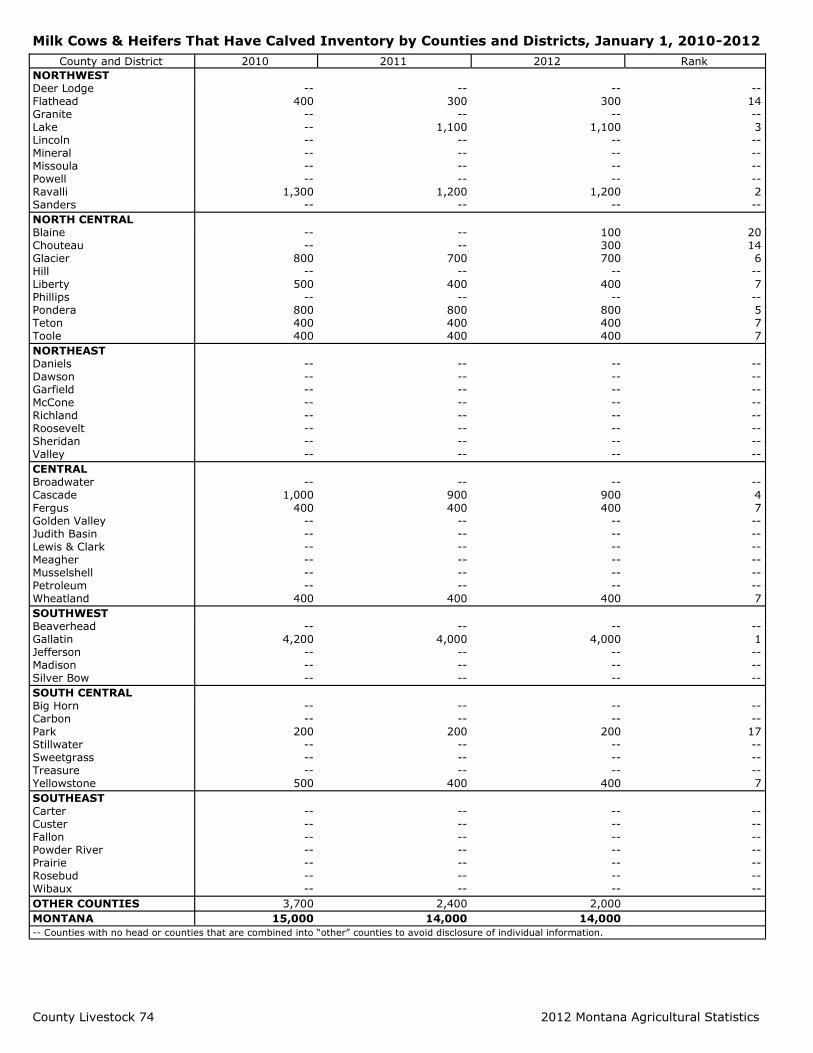
County Livestock 74 2012 Montana Agricultural Statistics
Milk Cows & Heifers That Have Calved Inventory by Counties and Districts, January 1, 2010-2012
County and District 2010 2011 2012 Rank
NORTHWEST Deer Lodge -- -- -- -- Flathead 400 300 300 14 Granite -- -- -- -- Lake -- 1,100 1,100 3 Lincoln -- -- -- -- Mineral -- -- -- -- Missoula -- -- -- -- Powell -- -- -- -- Ravalli 1,300 1,200 1,200 2 Sanders -- -- -- --
NORTH CENTRAL Blaine -- -- 100 20 Chouteau -- -- 300 14 Glacier 800 700 700 6 Hill -- -- -- -- Liberty 500 400 400 7 Phillips -- -- -- -- Pondera 800 800 800 5 Teton 400 400 400 7 Toole 400 400 400 7
NORTHEAST Daniels -- -- -- -- Dawson -- -- -- -- Garfield -- -- -- -- McCone -- -- -- -- Richland -- -- -- -- Roosevelt -- -- -- -- Sheridan -- -- -- -- Valley -- -- -- --
CENTRAL Broadwater -- -- -- -- Cascade 1,000 900 900 4
Fergus 400 400 400 7 Golden Valley -- -- -- -- Judith Basin -- -- -- -- Lewis & Clark -- -- -- -- Meagher -- -- -- -- Musselshell -- -- -- -- Petroleum -- -- -- -- Wheatland 400 400 400 7
SOUTHWEST Beaverhead -- -- -- -- Gallatin 4,200 4,000 4,000 1 Jefferson -- -- -- -- Madison -- -- -- -- Silver Bow -- -- -- --
SOUTH CENTRAL Big Horn -- -- -- -- Carbon -- -- -- -- Park 200 200 200 17 Stillwater -- -- -- -- Sweetgrass -- -- -- -- Treasure -- -- -- -- Yellowstone 500 400 400 7
SOUTHEAST Carter -- -- -- -- Custer -- -- -- -- Fallon -- -- -- -- Powder River -- -- -- -- Prairie -- -- -- -- Rosebud -- -- -- -- Wibaux -- -- -- --
OTHER COUNTIES 3,700 2,400 2,000
MONTANA 15,000 14,000 14,000
-- Counties with no head or counties that are combined into “other” counties to avoid disclosure of individual information.
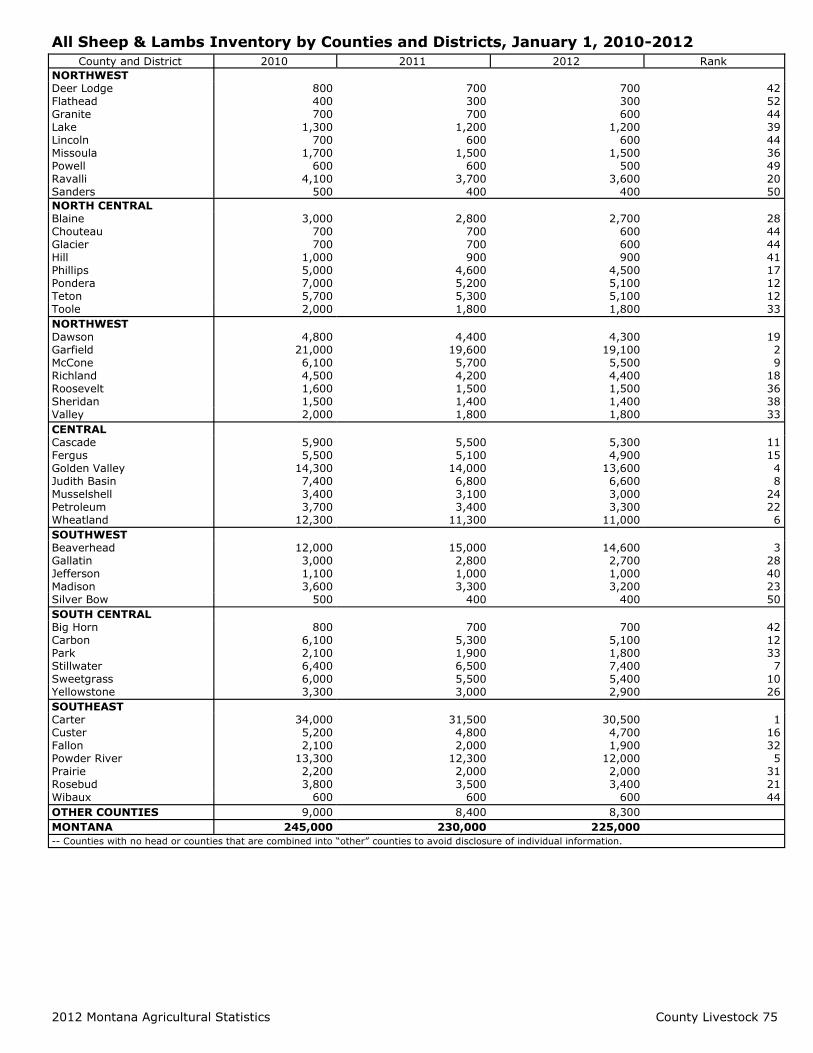
2012 Montana Agricultural Statistics County Livestock 75
All Sheep & Lambs Inventory by Counties and Districts, January 1, 2010-2012
County and District 2010 2011 2012 Rank
NORTHWEST Deer Lodge 800 700 700 42 Flathead 400 300 300 52 Granite 700 700 600 44 Lake 1,300 1,200 1,200 39 Lincoln 700 600 600 44 Missoula 1,700 1,500 1,500 36 Powell 600 600 500 49 Ravalli 4,100 3,700 3,600 20 Sanders 500 400 400 50
NORTH CENTRAL Blaine 3,000 2,800 2,700 28 Chouteau 700 700 600 44 Glacier 700 700 600 44 Hill 1,000 900 900 41 Phillips 5,000 4,600 4,500 17 Pondera 7,000 5,200 5,100 12 Teton 5,700 5,300 5,100 12 Toole 2,000 1,800 1,800 33
NORTHWEST Dawson 4,800 4,400 4,300 19 Garfield 21,000 19,600 19,100 2 McCone 6,100 5,700 5,500 9 Richland 4,500 4,200 4,400 18 Roosevelt 1,600 1,500 1,500 36 Sheridan 1,500 1,400 1,400 38 Valley 2,000 1,800 1,800 33
CENTRAL Cascade 5,900 5,500 5,300 11 Fergus 5,500 5,100 4,900 15 Golden Valley 14,300 14,000 13,600 4 Judith Basin 7,400 6,800 6,600 8 Musselshell 3,400 3,100 3,000 24 Petroleum 3,700 3,400 3,300 22 Wheatland 12,300 11,300 11,000 6
SOUTHWEST Beaverhead 12,000 15,000 14,600 3 Gallatin 3,000 2,800 2,700 28 Jefferson 1,100 1,000 1,000 40 Madison 3,600 3,300 3,200 23 Silver Bow 500 400 400 50
SOUTH CENTRAL Big Horn 800 700 700 42 Carbon 6,100 5,300 5,100 12 Park 2,100 1,900 1,800 33 Stillwater 6,400 6,500 7,400 7 Sweetgrass 6,000 5,500 5,400 10 Yellowstone 3,300 3,000 2,900 26
SOUTHEAST Carter 34,000 31,500 30,500 1 Custer 5,200 4,800 4,700 16 Fallon 2,100 2,000 1,900 32 Powder River 13,300 12,300 12,000 5 Prairie 2,200 2,000 2,000 31 Rosebud 3,800 3,500 3,400 21 Wibaux 600 600 600 44
OTHER COUNTIES 9,000 8,400 8,300
MONTANA 245,000 230,000 225,000
-- Counties with no head or counties that are combined into “other” counties to avoid disclosure of individual information.
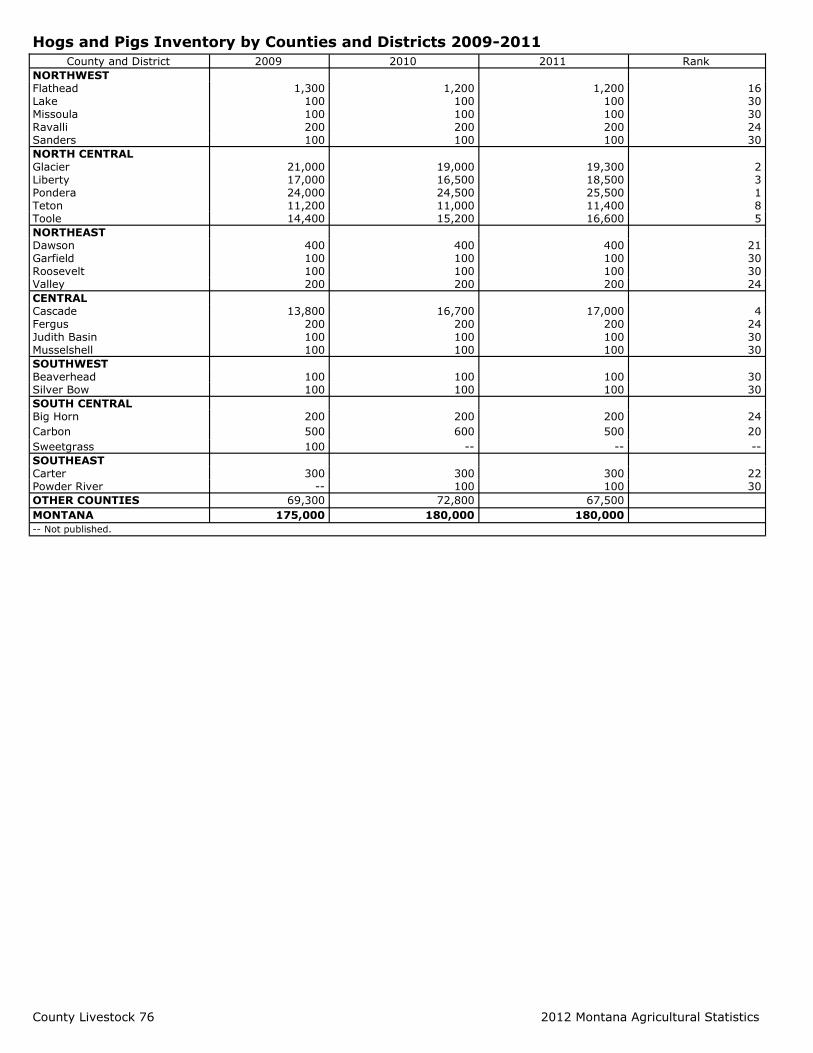
County Livestock 76 2012 Montana Agricultural Statistics
Hogs and Pigs Inventory by Counties and Districts 2009-2011
County and District 2009 2010 2011 Rank
NORTHWEST Flathead 1,300 1,200 1,200 16 Lake 100 100 100 30 Missoula 100 100 100 30 Ravalli 200 200 200 24 Sanders 100 100 100 30
NORTH CENTRAL Glacier 21,000 19,000 19,300 2 Liberty 17,000 16,500 18,500 3 Pondera 24,000 24,500 25,500 1 Teton 11,200 11,000 11,400 8 Toole 14,400 15,200 16,600 5
NORTHEAST Dawson 400 400 400 21 Garfield 100 100 100 30 Roosevelt 100 100 100 30 Valley 200 200 200 24
CENTRAL Cascade 13,800 16,700 17,000 4 Fergus 200 200 200 24 Judith Basin 100 100 100 30 Musselshell 100 100 100 30
SOUTHWEST Beaverhead 100 100 100 30 Silver Bow 100 100 100 30
SOUTH CENTRAL Big Horn 200 200 200 24
Carbon 500 600 500 20
Sweetgrass 100 -- -- --
SOUTHEAST Carter 300 300 300 22 Powder River -- 100 100 30
OTHER COUNTIES 69,300 72,800 67,500
MONTANA 175,000 180,000 180,000
-- Not published.
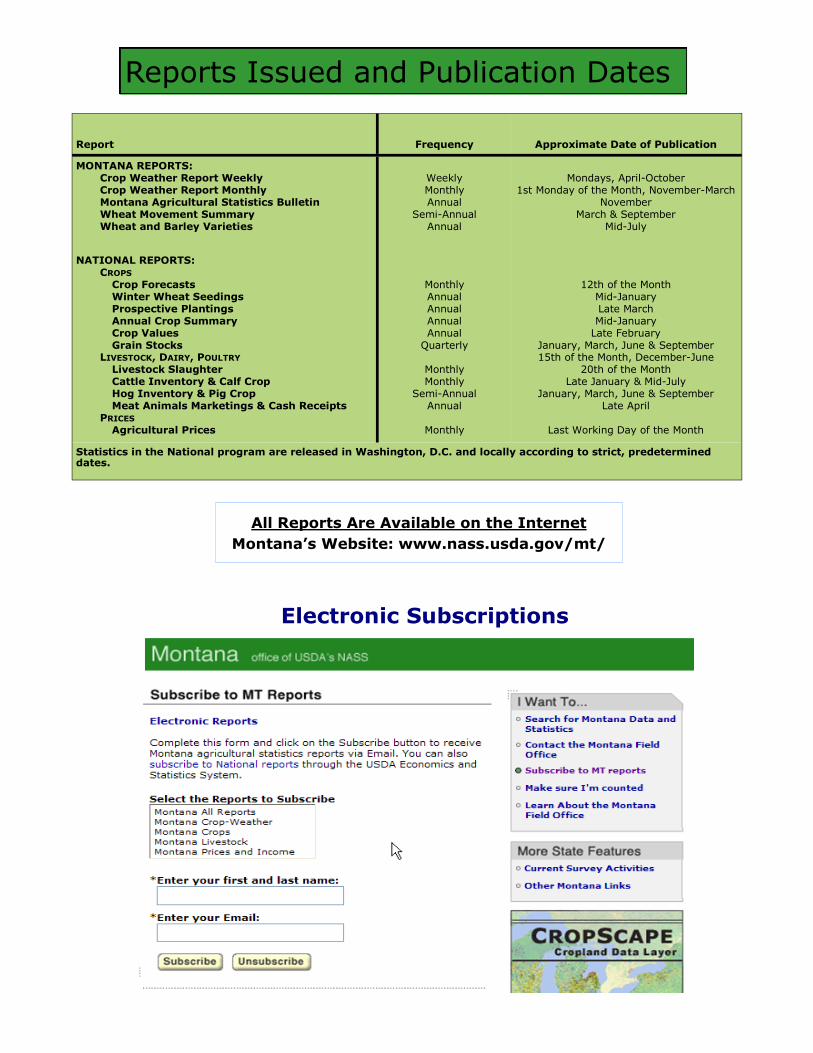
Reports Issued and Publication Dates
Report Frequency Approximate Date of Publication
MONTANA REPORTS: Crop Weather Report Weekly Crop Weather Report Monthly Montana Agricultural Statistics Bulletin Wheat Movement Summary Wheat and Barley Varieties
Weekly Monthly Annual
Semi-Annual Annual
Mondays, April-October
1st Monday of the Month, November-March November
March & September Mid-July
NATIONAL REPORTS: CROPS Crop Forecasts Winter Wheat Seedings Prospective Plantings Annual Crop Summary Crop Values Grain Stocks LIVESTOCK, DAIRY, POULTRY Livestock Slaughter Cattle Inventory & Calf Crop Hog Inventory & Pig Crop Meat Animals Marketings & Cash Receipts PRICES Agricultural Prices
Monthly Annual Annual Annual Annual
Quarterly
Monthly Monthly
Semi-Annual Annual
Monthly
12th of the Month Mid-January Late March Mid-January
Late February January, March, June & September 15th of the Month, December-June
20th of the Month Late January & Mid-July
January, March, June & September Late April
Last Working Day of the Month
Statistics in the National program are released in Washington, D.C. and locally according to strict, predetermined dates.
Electronic Subscriptions
All Reports Are Available on the Internet
Montana’s Website: www.nass.usda.gov/mt/
USDA-NASS
10 West 15th Street, Suite 3100 Helena, MT 59626-3100 (800) 835-2612 [email protected] www.nass.usda.gov/mt/
MONTANA FIELD OFFICE
FACT FINDERS FOR AGRICULTURE
PRSRT STD POSTAGE & FEES PAID
USDA PERMIT NO. G-38
Mail to:
303 N. Roberts, Room 317 Helena, MT 59620 (406)444-3144 [email protected] www.agr.mt.gov